Embed Size (px)
Citation preview

'~'
J •
I ; .. ' I ,,'. I ." I
I '
t
l ft
MANAGED BY I MARTIN MARIETTA ENERGY SYSTEMS, INC'I" FOR THE UNITED STATES ' DEPARTMENT OF ENERGY
r
('o.01io, 037. otf5':3,
-r.. '!,
fr,~.
MAY 161980
, , :. ~', /.: - :..;...~ ... " , .
" ..
Tritium·-An Analysis of Key Environmental and Dosimetric Questions
,I. E. Till H. R. Meyer E. L. Etnier E. S. Bomar R. D. Gentry G. G. Killough P. S. Rohwer V. J. Tennery C. C. Travis
ORF65776
! ;
"j
--_._-_._-----Printed in the UniH'd Stfltes of Ameri<.a. AVJifable from
the D'~pi1rtmdnt of Enorgy Tcchl'icil.! lniolfl'wt;on Cemer
I P.O. Box 62, Oak Ridge, Tennessee 37830
t _____ . ___ T ____ ~~~~.~~~ __ ~\O ~ __ :.~~~:.~J!;Cf'~~ A01 ________ _
ThiS report \'las prepared as an .]';COU(,t o( w0d~ sponsored by an agoncy of tTle United States Governno}:mL NeilhS)( t"el.) nit;)o. :~tati:nGovernmeflt nor any agency thereat, nor any of tOl;m 43'mp!0yees, mElr.;OS any -NJ.(f<\oty. ~)Xpre5S or implied, or assumes any legal liability or ms~Cn$lbil;1.y for the accuracy, completeness. 0(
usefulncss of any information, apparatus. />foduct, or process d isc!osed, or rop18sents that itsuse would no! infringE: privately owned rights. Reference i1erein to any specific commercin\ product, pror;ess, or serite£] "Y ~rado nam~, tr<ld9marJe manufacturer, or otherwise, dOf." not n~G(lssadlv con")titute or imply il!,;
endQrSQmp.nt. fC!commer'ldatlon, or tW;)fing by the U0i~ed St.'Oltes Governri)i}ot 0f any agen(.y thereof. The: "(')oNS and O;)lnjO"IS of :wtoor::; G,,{P'I':'!:sorJ herein do not f!8Gt1SSJ.:lfHy $b!C 01 reflect tho:')!;:! of the UnileoStatesGol.{<.:rntmH~ll)( any flgem:'f . thereQf. t l ______ ._. _______ . _________ . _________________ .. _. _______ -1
'1
;1
"

,
'.
"
*
ORNL/TM-699D Dist. Categories UC-79b, -79c
Contract No. W-7405-eng-26
Health and Safety Research Division
TRITIUM - AN ANALYSIS OF KEY ENVIRONMENTAL AND DOSIMETRIC QUESTIONS
J. E. Ti 11 * H. R. Meyerv9'. E. L. Etniero, E. S. Bomart " R. D. Gentry" G. G. Killougho! P. S. Rohwer ~.' V. J. Tenneryt;. C. C. Travisc/
Radiological Assessments Corporation, Rt. 2, Box 122, Neeses, SC 29107
tMetals and Ceramics Division
Date Published: May 19BO
OAK RIDGE NATIONAL LABORATORY Oak Ridge, Tennessee 37830
operated by UNION CARBIDE CORPORATION
for the DEPARTI~ENT OF ENERGY

. "
LIST OF FIGURES
LIST OF TABLES
ACKN0\1LEDGEMENTS
ABSTRACT .....
INTRODUCTION (John E. Till)
Table of Contents
1. PRODUCTION AND RELEASE OF TRITIUM TO THE ENVIRONMENT (John E.
vii
ix
xi
xiii
1
Till, Elizabeth L. Etnier and E. S. Bomar). 3
1.1 Production of Tritium in Nature.
1.2 Production of Tritium by Man ..
1.2.1 Production and release.of tritium from nuclear explosives .
1.2.2 Tritium in commercial products .
1.2.3 Tritium in the nuclear fission power industry . . . . . . . . . . . . . .
1.2.4 Revised ternary fission yield data for fast reactor fuels . . . . . . . . . . . . . . .
2. A REVIEW OF METHODOLOGIES FOR ESTIMATING THE DOSE FROM ENVIRONMENTALLY RELEASED TRITIUM (John E. TiZl and Elizabeth L.
3
4
4
5
8
12
Etnier) . . . . . . . . . . . . . . 13
2.1 Specific Activity Methodology ....
2.2 Methodology of the National Council on Radiation Protection and Measurements
2.3 Nethodology of AIRDOS-EPA ..... .
2.4 Methodology of the U.S. Nuclear Regulatory Com-mission ................... .
2.5 Recommendations for Calculating the Dose from Chronic
14
16
19
23
Exposures to Trit rum in the Envi ronment . . . . . . . 26
iii
iv
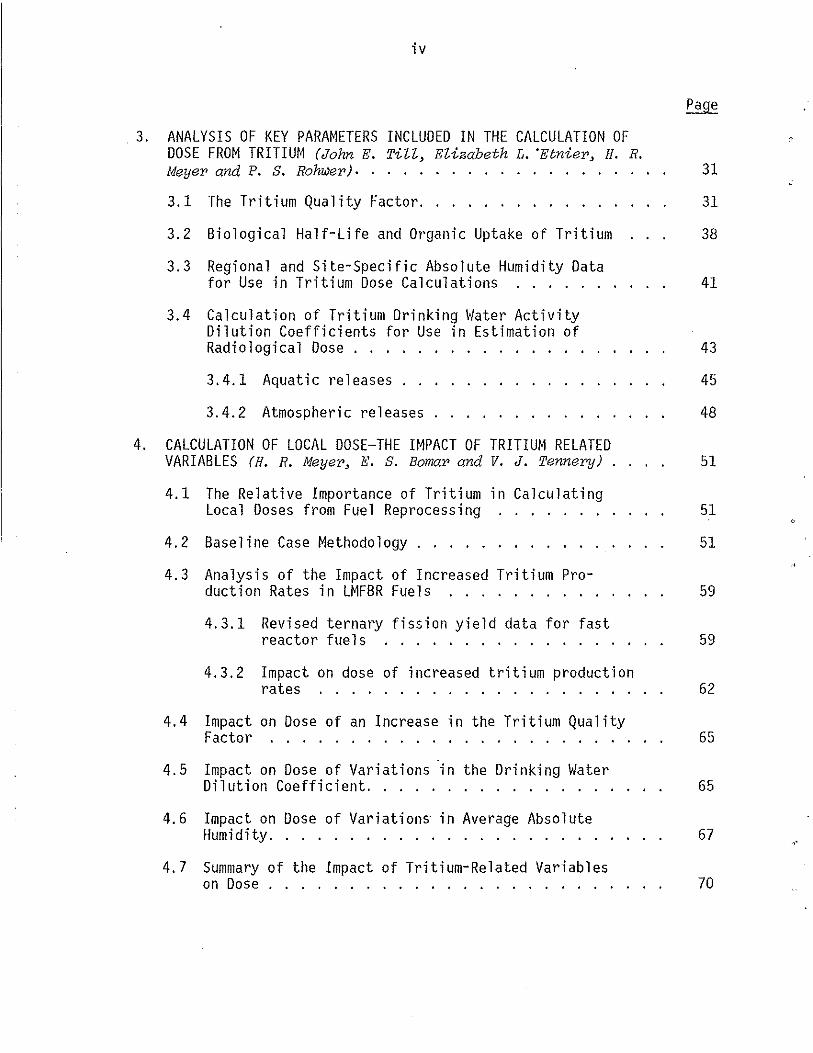
3. ANALYSIS OF KEY PARAMETERS INCLUDED IN THE CALCULATION OF DOSE FROM TRITIUM (John E. TiZZ, EZizabeth L. 'Etnier, H. R. Meyer and P. S. Rohwer). 31
3.1 The Tritium Quality Factor.
3.2 Biological Half-Life and Organic Uptake of Tritium
3.3 Regional and Site-Specific Absolute Humidity Data for Use in Tritium Dose Calculations
3.4 Calculation of Tritium Orinking Water Activity Dilution Coefficients for Use in Estimation of Radiological Dose
3.4.1 Aquatic releases
3.4.2 Atmospheric releases
4. CALCULATION OF LOCAL DOSE-THE IMPACT OF TRITIUM RELATED VARIABLES (H. R. Meyer, E. S. Bomar and V. J. Tennery)
4.1 The Relative Importance of Tritium in Calculating Local Doses from Fuel Reprocessing
4.2 Baseline Case Methodology.
4.3 Analysis of the Impact of Increased Tritium Production Rates in LMFBR Fuels
4.3.1 Revised ternary fission yield data for fast reactor fuels
4.3.2 Impact on dose of increased tritium production
31
38
41
43
45
48
51
51
51
59
59
rates 62
4.4 Impact on Dose of an Increase in the Tritium Quality Factor 65
4.5 Impact on Dose of Variations in the Drinking Water Dilution Coefficient. 65
4.6 Impact on Dose of Variations' in Average Absolute Humidity.
4.7 Summary of the Impact of Tritium-Related Variables on Dose .
67
70
"

v
5. CALCULATION OF THE GLOBAL DOSE (G. G. Killough, John E. Till, Elizabeth L. Etnier, C. C. Travis, R. D. Gentry and H. R. Meyer) ..
5.1 Scenarios for the Release of Tritium to the Environ-
71
ment by Man . 71
5.1.1 Consumer products
5.1.2 World nuclear power industry
5.2 Global Tritium Modeling.
5.2.1 Bases of global models
5.2.2 Reasonabl~ concentration bounds
5.3 Global Component of Tritium Dose to the World Population
6. CONCLUSIONS
71
73
88
88
90
95
103


,
List of Figures
1.1 Tritium in the biosphere as a result of nuclear weapons testing ............ .
3.1 Absolute humidity by geographical region.
5.1 Scenario projecting the growth of nuclear energy world-wide .................. .
5.2 Scenario projecting fuel reprocessing worldwide ....
5.3 Scenario M (minimal): the nuclear industry. factor = 1. . . . . .
Tritium released to the atmosphere by The reprocessing plant confinement
5.4 Scenario A (advanced): Tritium released to the atmosphere by the nuclea)' industry. The reprocessing plant confinement
7
44
76
77
82
facto)' = 100. . . . . . . . . . . . . . . . .. ..... 83
5.5 Scenario I (intermediate): Tritium released to the atmosphere by the nuc I ear indus try. The reprocess i ng plant confi ne-ment factor increases in steps to simulate improvements in tritium control technology. . . . . . . .. .... 84
5.6 Release of tritium from nuclear reactors to the aquatic envi ronment . . . . . . . . . . . . . . 87
5.7 Model of tritium concentration in the Northern Hemisphere troposphere and ocean surface as a function of latitude. 92
vii

,
List of Tables
1.1 Estimated annual tritium yields from nuclear weapons tests in the atmosphere. . . . . . . . . . . . .
2.1 Contributions to total water intake of reference man
2.2 Summary of the annual dose from chronic exposure to 1 pCi/m3 (37 mBq/m3) of tritium in air, calculated using
6
17
four methodo 1 ogi es . . . . . . . . . . . . . . . 27
3.1 RBE values for tritium from selected animal and cell studi es . . . . . . . . . . . . . . . . . . . .. 34
3.2 Contribution of organically bound tritium to total body dose . . . . . . . . . . . . . . . . . . . . . . . . . . 39
3.3 Dilution coefficients for prolonged tritium release into lakes (years/m3) . . . . . . . . . . . . . . . . . . . . 47
4.1 Radionuclide l'elease rates for a hypothetical LMFBR fuel reprocessing facility. . .. .......... 53
4.2 Selected parameters input to the AIRDOS-EPA computer code ....................... . 56
4.3 Baseline case: 50-year dose commitment to maximally exposed individual (no tritium confinement). . . . . 57
4.4 Baseline case: Percent contributions to 50-year dose commitment to maximally exposed individual (no tritium confinement) . . . . . . . . . . . . . . . . . . 58
4.5 Tritium yield from fast neutron ternary fission
4.6 Tritium source terms for reprocessing spent (U, Pu)C and (Th, U)C fuels using ternary fission yields in the ENDF/BIV
60
1 i brary and those reported by Buzzelli et a l. ..... 61
4.7 The radiological impact of increased tritium production rates: 50-year dose commitment to a maximally exposed individual (no tritium confinement). . . . . . . . . . . 63
4.8 The impact on dose of increased tritium production rates: percent contribution to dose to a maximally exposed individual (no tritium confinement). . . . . . . . . . .. 64
ix

x
4.9 The impact on dose of an increase in the tritium quality factor: 50-year dose commitment to a maximally exposed individual (no tritium confinement) . . . . . . . . . . . 66
4.10 The impact on dose of variations in the atmosphere/drinking water dilution coefficient (ADDC): 50-year dose commitment to a maximally exposed individual (no tritium confinement). 68
4.11 The impact of variations in average absolute humidity: 50-year dose commitment to a maximally exposed individual (no tritium confinement). . . . . . . . . . . . . . . 69
5.1 Quantity of tritium used in the watch industry (MCi), 1976 to 1979. . . . . . . . . . . . . . . . . . . . .
5.2 Quantity of tritium released from the incineration of tritium back-lighted watches
5.3 Fuel reprocessing by reactor type
5.4 Source terms for tritium releases to the atmosphere by the
72
74
78
world .nuclear power industry. . . . . . . . . . . . 79
5.5 Source terms for tritium released in liquid effluents of nuclear reactors. . . . . . . . . . 86
5.6 Global dose estimates using several recent models 94
5.7 Reservoir model of the global hydrological cycle applied to the transport of tritium. . . . . 98
5.8 World population history and scenario. . . . . . . . . . 100
5.9 Global component of collective dose commitment (man-rem) to the world population from man-made and natural sources of triti urn. . . . . . . . . . . . . . . . . . . . . . . . 101
"

ACKN0I1LEDGEMENTS
The authors wish to acknowledge the assistance of George Sherwood
(DOE), and Keith Eckerman, Laura McDowell-Boyer, A. R. Olsen, D. E.
Dunning, Jr., and F. o. Hoffman (ORNL), for their critical review and
helpful suggestions regarding the content of this document.
We also thank A. G. Croff who arranged for ORIGEN computer runs to
provi de spent fue 1 compos i t ions for ca 1 cul at i on of source terms, and
J. W. Elwood who assisted in the documentation of this report.
xi

r
['
"

ABSTRACT
Tritium continues to be a major constituent of radioactivity
re 1 eased to the envi ronment by nuclear reactol'S and proposed nuc 1 ear
fuel reprocessing plants. The purpose of this study is to summarize new
theoret i ca 1 and experi menta 1 data that may affect the assessment of
envi ronmenta 1 re 1 eases of tri t i um, and to analyze the s i gni fi cance of
this information in terms of the dose to man.
Calculated doses resulting from tritium releases to the environment
are 1 i near ly dependent upon the qual i ty factor chosen for tri t i um beta
radiation. A value of 1.0 is currently being used as the quality factor
for tritium betas and is based upon a recommendation by the Inter
national Commission on Radiological Protection (ICRP) in 1969. Based
upon our study of data pub 1 i shed since the ICRP recommendation, it is
concluded that a reevaluation of the tritium quality factor by the ICRP
is needed and that a value of 1. 7 would seem to be more justifiable.
Several methodologies exist for evaluating exposures to man from
tritium released to the environment. An analysis of four widely
accepted methodologies indicates that they vary considerably in complex
i ty yet the increased comp 1 exi ty does not necessari ly mean a more accu
rate estimate of dose. A new model is proposed, based primari ly upon
the approach recommended by the National Counci 1 on Radiation Pl'otection
and Measurements, that maintains both simplicity and the ability to in
corporate available site-specific data.
Severa 1 key parameters i nfl uence uncertai nti es inca 1 culated dose
from environmental tritium. Employing a "typical" LMFBR reprocessing
facil ity source term, a "base case" dose commitment to total body (for a
maximally exposed individual) was calculated to be 4.0 x 10⁻² mSv, with
3.2 x 10⁻² mSv of the dose due to intake of tritium. These results were
used as the basis for examination of the following key variables: (1)
use of U. S. regional (as opposed to U. S. average) absolute humidity
va 1 ues whi ch vary the tri t i um dose to total body over a range of 1. 6 x
10-2 to 6.3 X 10- 2 mSv; (2) choice of a site-specific drinking water
xiii
xiv
dilution coefficient which for tritium may increase total-body dose by
as much as 80%, under certain severe conditions; and (3) recent indica
tions that rates of tritium production by ternary fission in fast reac
tor fuels may be an order of magnitude greater than previously esti
mated, which results in parallel increases in predicted dose. The
i nfl uence of these vari ab 1 es, and the potential for s i gnifi cant tritium
population doses due to world-wide implementation of nuclear fuel
cycles, suggests the need for careful evaluation of tritium control
technologies.
The study analyzes models which exist for evaluating the buildup of
global releases of tritium from man-made sources. Our scenarios for the
release of man-made tritium to the environment and prediction of collec
tive dose commitment to future generations suggest that the dose from
nuc'lear weapons testing vlill be less than that from nuclear energy even
though the weapons source term is greater than that for any of our
energy scenarios.

•
INTRODUCTION
John E. TiU
Tritium continues to be a radionuclide of major interest in the
evaluation of the radiological impact associated ~Iith nuclear facil i
ties. Thi s interest has i ntens i fi ed recently for a number of reasons:
(1) recognition of the significant contribution made by tritium to the
total dose received by individuals living near certain nuclear plants;
(2) the need for evaluation of the impact of potentially increased
tritium releases from advanced fission energy systems; (3) the need for
intercomparison of several complex methodologies for evaluating the dose
fl'om tritium released to the environment; (4) recent data suggesting
that the biological effects from protracted low-level exposure to triti
um have previously been underestimated; and (5) the potential for in
creases in the global release rate of tritium, with concurrent evalua
tion of potential health effects to present and future generations. The
purpose of this study is to summarize new theoretical and experimental
data that may affect the assessment of environmental releases of triti
um, and to analyze the significance of this recent information in terms
of the dose to man.
The report is di vi ded into fi ve chapters. Chapter 1 revi ews the
major sources of tri t i um enteri ng the envi ronment, then focuses more
specifi ca lly on the potential for tri t i um re 1 eases from current and
anticipated nuclear reactor fuel cycle sources. These data are utilized
in later chapters as the basis for radiological dose calculations.
Chapter 2 reviews four major methodologies available for the estimation
of radiological dose from tritium in the environment and provides recom
mendat ions regardi ng choi ce of an appropri ate mode 1. Chapter 3 di s
cusses the uncertainties associated with four parameters that have the
potent i a 1 for si gnifi cant ly modifyi ng doses cal cul ated for envi ronmen
tally dispersed tritium. Chapter 4 quantitatively compares the impact
of changes in the value of these parameters, using a set of radionuclide
re 1 ease rates typi fyi ng a modern des i gn breeder reactor fuel reproces
sing faci 1 ity, but, for purposes of compari son, excl udi ng the use of
1

2
trit i um confi nement technology. Chapter 5 develops in detail the tri t ium release rates associated with a global nuclear fuel cycle including a mix of power reactor types, then intercompares global tritium models and implements a specific model to estimate world population doses from global tritium releases.
The report summari zes current i nformat ion regardi ng the impact of chronic exposure to tritium in the environment and provides both local and global perspectives on the need for containment of tritium at nuclear fuel reprocessing facilities.

1. PRODUCTION AND RELEASE OF TRITIUM TO THE ENVIRONMENT
John E. Till, Elizabeth L. Etnier and E. S. Bomar
1.1 Production of Tritium in Nature
Tri t i urn is produced through natural processes i nvo 1 vi ng i nterac
tions between cosmic rays and gases of the upper atmosphere. This rate
may be enhanced through increased particle accretion which occurs during
peak periods of solar flare activity. Literature concerning these
sources is reviewed by Nir et al. (1966) and by Jacobs (1968). Nir et
al. (1966) estimate the tritium production rate of 0.19 ± 0.09 triton*1 cm2 -sect due to cosmic rays, yet they calculate a material balance pro
duction rate of 0.5 triton/cm2 -sec overall. This discrepancy in natural
tritium production is attributed to solar accretion. Flamm et al.
(1962) estimate this latter phenomenon could account for an additional
0.4 triton/cm2 -sec.
The natural production rate of tritium found by Nir et al. (1966)
falls within the range of reported values cited by Jacobs (1968) of 0.12
to 2.0 triton/cm2-sec with a most probable value between 0.5 to 1.0
triton/cm2 -sec. These most probable va 1 ues yi e 1 d an annual production
rate of 4 to 8 MCi (0.15 to 0.30 EBq) and a steady-state tritium inven
tory of 70 to 140 MCi (2.6 to 5.2 EBq).
The Nat i ona 1 Council on Radi at i on Protection and Measurements in
NCRP 62 (1979a) considers the above estimates and recommends the use of
4 MCi/year (0.15 EBq/year) as an annual production rate and 70 MCi (2.6
ESq) as the natural level of the tritium world inventory. Assuming a
mean surface area for the earth of 5.096 x 10⁸ km2 , a production rate of
0.52 triton/cm2-sec gives an annual production of 4 MCi (0.15 EBq).
" Triton = an atom of tritium.
tPer square centimeter of the earth's surface at sea level.
3
4
1.2 Production of Tritium by Man
1.2.1 Production and release of tritium from nuclear explosives
Tri t i um is produced in nuc lear exp los i ves by the i nteracti on of
fast neutrons with constituents of air. Relatively small amounts of
tritium are created in fission weapons; however, greater quantities are
produced in thel'monuc lear devi ces. The energetic interaction between
deuterium and tritium, typical of the reaction taking place in a fis
sion-fusion bomb, is represented by the following reaction
3H + 2H --->, 24He + In + 17.6 MeV. 1 1 (1.1)
This reaction proceeds much more rapidly than other thermonuclear reac
tions and most of the tritium present initially is consumed in the ex
plosion. The unreacted tritium, however, is released to the atmosphere
following detonation (Glasstone and Dolan, 1977). Tritium is also pro
duced by the interaction of high energy neutrons with nitrogen nuclei in
the atmosphere and by 2H(n,y)3H, and 6Li(n,a)3H reactions with lithium
deuteride in thermonuclear devices. Following formation of tritium in a
nuclear weapon, it readily interchanges with H20, forming tritiated
watel', 3HOH, and enters the normal hydrologic cycle.
The most important man-made sources of tritium in the atmosphere to
date have been nuc lear detonations. Production from thi s source was
calculated from a recent compilation by Carter and Moghissi (1977) of
estimated energy yields from nuclear devices detonated since 1945.
These yields were summarized for 14C by Killough and Till (1978), who
listed all i ndi vi dua 1 detonations that have been announced by the six
nations that have carried out nuclear tests (United States, United King
dom, USSR, France, China, and India). The detonations for each country
are listed in chrono 1 ogi ca 1 order, and each detonation is categori zed
according to whether it occurred at high altitude (above 10 km), in the
lower atmosphere (below 10 km), underground, or underwater. The yields
are often gi ven as ranges, upper limits, or lower 1 i mi ts (e. g., 20 to
200, <20, and >20 MT). To estimate tritium releases to the atmosphere

5
from these data, we used the midpoint of each range, or the single num
ber shown in an inequality of either sense. ,11here no yield is shown for
an event, a value of zero was assumed. On ly detonations in theatmo
sphere were considered, thus we ignore the venting that has occurred in
some underground tests.
As noted earlier, the production of tritium varies significantly
between fi ss i on and fus i on nuc 1 ear detonations. In fus i on weapons, the
expected yield is estimated to be approximately 6.7 x 10⁶ Ci (250 PBq)
per megaton equivalent of TNT (Leipunsky, 1957). Fission devices yield
about 7.0 x 10² Ci (26 TBq) per megaton equivalent of TNT (Miskel,
1973) .
Carter and Moghissi do not distinguish between fission and fusion
exp los ions in thei r pub 1 i shed data; however, the authors do note the
year in which the first thermonuclear detonation occurred for each of
the six countries. For our calculations, it was assumed that all deto
nations were of the thermonuclear type for a given country after the
first fusion device was tested. The release rate of tritium produced by
nuclear explosions is summarized in Table 1.1. Our data indicate that
the cumulative release to the atmosphere by nuclear weapons between 1945
and 1975 is approximately 1900 MCi (70 EBq).
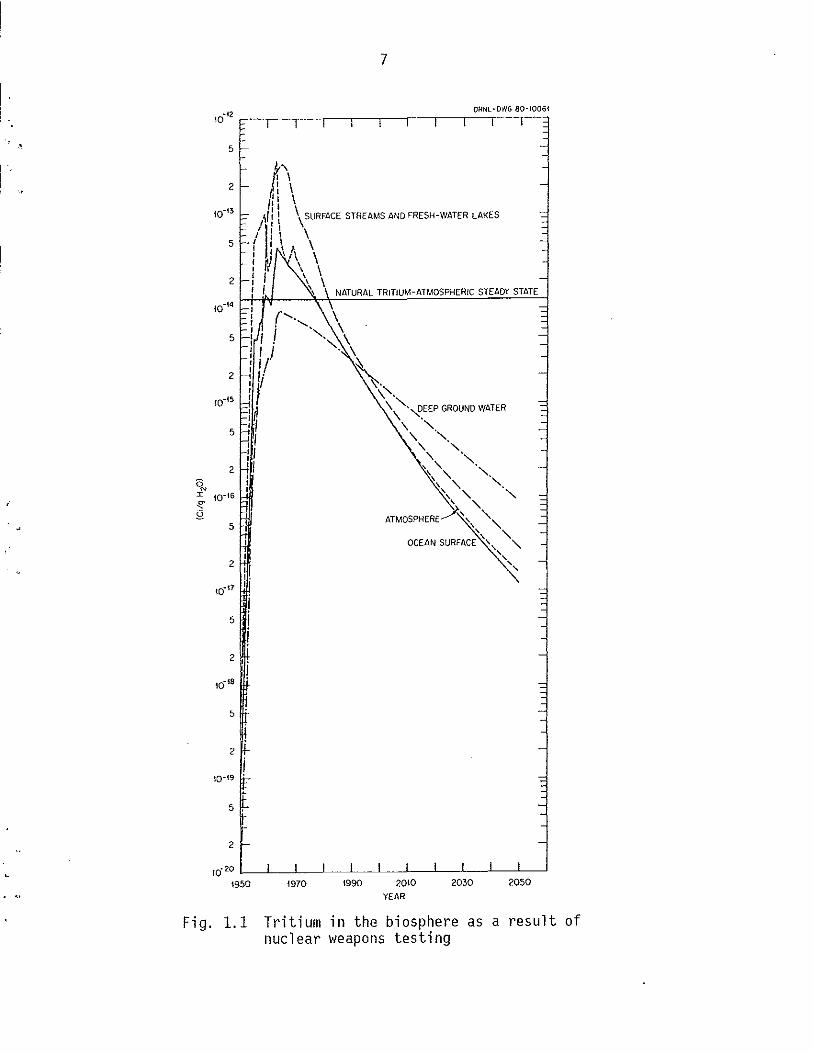
Figure 1.1 illustrates the buildup and removal of tritium in the
bi osphere as a result of nucl ear weapons testing and natural decay.
Equi 1 i bri urn concentrations from naturally produced tri t i urn are i ndi
cated. These data were calculated using a multi compartment model that
is di scussed inSect ion 5.0 of thi s report. Concentration 1 eve 1 s for
the atmosphere, ocean surface, deep ground water, and fresh-water
streams and lakes are shown with highest values occurring in the mid-
1950's to mid-1960's and decreasing thereafter.
1. 2.2 Tri t i urn in commerci a 1 products
Triti urn has been used in the producti on of 1 umi nous devi ces for
about 20 years. During most of this time it was applied as a tritiated
paint onto the faces and hands of timepieces, compasses, dials, etc.

6
Table 1.1 Estimated annual tritium yields tests in the atmosphere a
from nuclear weapons
Tritium released Tritium released Year (Cn b Year (Cn b
1945 4.0 x 10³ 1960 7.1 x 10²
1946 1. 4 x 10² 1961 4.9 x 10⁸
1947 0 1962 7.1 x 10⁸
1948 7.4 x 10² 1963 0
1949 0 1964 1. 4 x 10²
1950 0 1965 1. 4 x 10³
1951 1.1x 10³ 1966 4.7 x 10³
1952 7.1 x 10⁷ 1967 2.0 x 10⁷
1953 1. 8 x 10⁶ 1968 3.9 x 10⁷
1954 LOx 108 1969 2.0 x 10⁷
1955 7.8 x 10⁶ 1970 3.6 x 10⁷
1956 9.3 x 10⁷ 1971 5.2 x 10⁶
1957 6.4 x 10⁷ 1972 8.7 x 10 5
1958 2.1 x 10⁸ 1973 1. 7 x 10 7
1959 0 1974 3.9 x 10⁶
aComputed from detonation data compil ed by Carter and Moghi ss i (1977) and summarized by Killough and Till (1978) for weapons testing by the United States, United Kingdom, USSR, France, China, and India. It is assumed that a one megaton fusion burst in the atmosphere releases 6.7 MCi (.25 EBq) of tritium and a one megaton fission burst in the atmosphere releases 7.0 x 10² Ci (26 TBq) of tritium.
b1 Ci = 37 GBq.
,
ON X
~ g
1O~12
5
2
lO~t3
5
2
iO~'4
5
2
10~'5
5
2
lO~t6
5
2
10-17
5
2
10- 18
5
2
10- 19
5
2
10. 20
7
ORNL-OWG 60-10061
{:" I \
d \ (I I I~'!: \ SURFACE STREAMS AND FRESH-WATER LAKES
! I' \ \ I I I \ I I \ I, t I \ 1\ \ : II \ \ : " \ \ 1 ~ NATURAL TRITIUM-ATMOSPHERIC STEADY STATE
I {' \ ' '-, : i -"", \ I I , ',,\\ ' , I i 1/ ~ I'; \\-' I J ,'. oJ \\"'-.",EEP GROUND WATER
:Ii \\ "" I' \ , I' \ " 1/ ' \, ,
I ~" , I :\." ". '" , , ,
ATMOSPHERE~:\', "" " ,
OCEAN SURFACE "",~
1/ I. I
1950 1970 1990 2010
YEAR
2030 2050
Fig. 1.1 Tritium in the biosphere as a result of nuclear weapons testing

8
More recently, elemental tritium has been used in the manufactul'e of products with self-luminous light sources. Liquid crystal display (LCD) watches may utili ze se If-l umi nous, background 1 i ght sources contai ni ng tri t i urn gas. Thi s gas is enc 1 osed in sealed boros il i cate gl ass tubes coated i nterna lly with an i norgani c phosphor. Beta part i c 1 es emitted during radioactive decay of the enclosed tritium activate the phosphor, producing light. While watches containing tritium paint have an average activity of 2 mCi (74 MBq) (McDowell-Boyer and O'Donnell, 1978a), timepieces 1 ighted with tritium in glass tubes can contain as much as 200 mCi (7.4 GBq) of tritium.
In the period 1969 to 1975, 0.13 MCi (4.8 PBq) of tritium was used in timepieces in the United States (McDowell-Boyer and O'Donnell, 1978a), whereas in 1978 alone, 0.4 MCi (15 PBq) were di stri buted in the United States for use in back-lit watches. For this reason, the distribution of tritium in the latter devices has made the major contribution to the global inventory from commercial products and will be the primary product of concern for estimates made later in this study.
1.2.3. Tritium in the nuclear fission power industry
The production of tritium in various reactor systems was recently revi ewed by the NCRP (1979a). Because of the hi gh mobil ity of tritium in mechani ca 1 systems, and the potential contri but i on of tri t i urn to dose, it is of interest to cons i der the mechani sms of escape of tri t i urn from a fuel element. An understanding of these mechanisms is critical to the calculation of tritium release rates predicted for nuclear facilities.
Hydrogen in all of its isotopic forms is potentially very mobile, but its degree of mobil i ty depends on the medi urn in whi ch it is found and the temperature of the medium. These two factors, therefore, determine the rate at which tritium generated in fuel elements (from ternary fission or neutron activation of an impurity) moves through the fuel and its cladding into reactor coolant. Information has been obtained on the fraction of tritium retained in fuel elements, and its distribution in
, ,
9
different types of fue 1 elements, from di sso 1 ut ion experi ments us i ng
irradiated fuels.
Goode and Vaughen (1970) examined the behavior of tritium in light
water reactor (LWR), high temperature gas-cooled reactor (HTGR), and
fast breeder reactor (FBR) fuel samples during head-end and fuel disso
lution reprocessing operations. Intact rods or capsules were available
for some of the fuel forms, but others were segments or sma 11 pi eces of
i rradi ated fueL The tri t i um re 1 eased duri ng i ni t i a 1 sheari ng of intact
rods was generally somewhat less than 1% of the theoretical rod content.
The amount of tritium retained in a series of stainless-steel-clad
fuel samples irradiated in water-cooled or liquid-metal-cooled reactors
showed a strong dependence on fuel c 1 addi ng temperature hi story. Most
fuel samples contained oxide fuels, but two rods contained carbide fuel.
A stainless-steel-clad pressurized water reactor (PWR) fuel rod irradi
ated at a linear heat rating of about 10 kw/m and a cladding temperature
of approximately 105°C retained 99.8% of tritium calculated to have been
generated during irradiation. There was, however, a pronounced drop in
the fraction of tritium retained by FBR-type stainless-steel-clad fuel
rods i rradi ated at 1 i near heat ratings in the range of 30 to 92 kw/m
under cooling conditions resulting in cladding temperatures of 500 to
llOOoC. Under these condi t ions, the triti um retai ned in the fuel rods
varied from 0.001 to 3.7% of that generated with one exception, where a
linear heat rating of about 33 kw/m and a cladding temperature of 10000 C
resulted in retention of approximately 50% of the calculated tritium
content. Carbide fuel irradiated at a linear heat rating of 92 kw/m
retained <1% of the calculated tritium generated.
Wozadlo et a 1. (1972) measured retention of <1% of the tritium
produced in stainless-steel-clad mixed oxide (uranium and plutonium
oxide) fuel irradiated in EBR-II (a fast-neutron experimental reactor)
at average linear heat ratings of 36 to 46 kw/m, which produced cladding
temperatures of 538 to 593°C. A somewhat larger retention was reported
by Ebersole et a1. (1971) for stainless-steel-clad driver fuel samples
in the EBR- I 1. About 70 to 75% of the tri t i um was transferred to the
primary sodium in these latter samples.

10
In 1 i qui d sodi um coo 1 ed reactors, most of the tri t i um released to the primary coolant will be.recovered from cold traps as sodium tritide. Sma 11 er amounts wi 11 di ffuse through the i ntermedi ate heat exchanger into the secondary coolant where cold trapping will also be employed. Some tritium will appear in the reactor cover gas and will have to be considered in handling that gas.
Goode and Cox (1970) found, on dissolving irradiated blanket rods from the Shippingport PWR, that essentially all of the tritium calculated to have been generated during irradiation was retained in the fuel element. Seven percent of the tritium I'las found in the Zircaloy-2 clad" ding and 93% in the U0 2 fuel. The cladding temperature was calculated to be 259°C for ali near heat rating of 16 k\1/m. At thi s temperature,
movement of tritium through the c 1 addi ng is effectively stopped by the zirconium oxide films inside and outside of the cladding and the formation of second phase platelets of zirconium hydride within the cladding.
Gainey (1976) has reviewed the behavior of tritium in HTGRs. The reference fuel for thi s reactor is in the form of mi crospheres of UC2 ,
about 350 ~m in diameter, coated with pyrolytic carbon, silicon carbide, and pyrolytic carbon in three layers. The principal sources of tritium in the HTGR are ternary fi ss i on and act i vat i on of 3He by the reaction 3He(n,p)3H. Reactions with 6li, which occurs as an impurity in the fuel and in core graphite, also form tritium by the reaction 6li(n,a)3H.
Boron-l0, used in the control rods or as a "burnab 1 e poi son," is converted to tritium by the reactions 10B(n,a)7li followed by 7li(n,na)3H, and 10B(n,2a)3H.
Of the tritium generated in an HTGR, it is estimated that 62% will result from ternary fission and the balance from the several activation reactions mentioned above. Intact coatings on the fuel particles effectively retain tritium, but about 0.5% of that generated will be released to the coo 1 ant from the fue 1 due to coat i ng fa i 1 ure. Graph i te and B4 C are descri bed as "extreme ly retentive toward tri t i um under reactor conditions" (Gainey, 1976); however, some portion of the tritium formed from 6Li impurity or lOB neutron absorber wi 11 be transferred to the
11
coo 1 ant, from whi ch a fraction wi 11 eventually be re 1 eased to the envi
ronment after diffus i ng through the heat exchanger tubes. f·lethods to
reduce the permeation rate of tritium through the heat exchanger tubes,
involving the formation of oxide "blocking" films, are being studied.
Heavy-water-moderated reactors (HWR) represent a speci a 1 case in
that the quantity of tritium produced from neutron activation of deute
rium, by the reaction 2H(n,y)3H, is much greater than that resulting
from fissioning of the fuel. Kouts and Long (1973) estimated that 40
times as much tritium would be produced in the HWR moderator as in the
fuel. Special provisions for containment of the costly heavy water and
its tritium content must be provided (Lewis and Foster, 1970).
Observations by various experimenters show that the amount of
tritium retained in the fuel during irradiation in LWRs, FBRs, and HTGRs
cannot be preci se ly predi cted at present. Neverthe 1 ess, most of the
generated tri t i um is released to the coolant in FBRs; a much smaller
release to coolant in LWRs and HTGRs is indicated. The practical conse
quence of thi s vari at ion is that the pri nci pa 1 burden for contro 1 of
tri t i um releases from LWR and HTGR fuels wi 11 be on the reprocess i ng
plant, and for FBRs, on the reactor cooling system design. In the past,
100% retention of tri t i um in fue 1 has been assumed i 11 studi es of the
environmental impact of reprocessing LWR fuels (USEROA, 1976a; Finney et
al., 1977) and in the environmental survey of the uranium fuel cycle
(USAEC, 1974a). A 10% retention factor in fue 1 was used in preparation
of the environmental statement for the LMFBR program (USAEC, 1974b) and
is currently used by the NCRP to forecast global tritium releases from
LMFBR fuel reprocessi ng (NCRP, 1979a). We therefore also assume a 10%
trit i um retention value in the ana lyses of U~FBR reprocess i ng impacts
presented in Chaps. 4 and 5 of this report.
In fuel reprocessing, the tritium content of any irradiated oxide
fue 1 is transferred on di sso 1 ut ion in HN0 3 to the aqueous stream by
exchange wi th the hydrogen content of the aci d so 1 ut i on. In the past,
most of this tritium was assumed to be exhausted to the atmosphere as
tritiated water after recovery of the HN03 for reuse in the reprocessing
plant. Si nce uncontrolled release of tritium to the atmosphere wi 11
12
probably not be permitted by evolving environmental protection regulat ions, (e. g., USEPA, 1977) modifi ed reprocess i ng fl ow sheets are bei ng cons i dered. A predi sso 1 ut ion oxi dat i on treatment of LI-IR, FBR, and HTGR fuels offers prospects for removing and recovering tritium for permanent storage (Goode and Vaughen, 1970; Finney et al., 1977). Other tritium confinement methods may become feasible in the future.
The LMFBR tritium source terms presented in this review are based on the ternary fission process alone. Any contribution to the tritium content of the spent fuel resulting from 6Li impurity has not been considered. Kabele (1974) has estimated that tritium derived from an unidentified level of lithium impurity in fuel irradiated in the fast flux test facility (FFTF) would equal about 50% of that from ternary fission. Kabele also estimated the tritium generated due to the B4 C content of the FFTF control rods would be about 7.4 times that resulting from ternary fission. Experimental observations show that between 20 and 80% of this tritium would be retained in the control rod. Tritium released to the sodium coolant from fuel elements and control rods would be recovered at the reactor by use of cold traps in which Na 3 H would precipitate. The tritium content of the control rods would be permanently retained after removal from the reactor by the stainless steel cladding of these rods.
Chapter 5 of this report details nuclear fuel cycle tritium production estimates and impacts.
1.2.4 Revised ternary fission yield data for fast reactor fuels
Data published by Buzzelli et al. (1976) and Buzzelli and Langer (1977) indicate, on a preliminary basis, that tritium in LMFBR fuels may be produced at levels higher than those previously anticipated. These tentative data and their implications are considered in detail in Chap. 4 of this report.

2. A REVIEW OF METHODOLOGIES FOR ESTIMATING THE DOSE FROM ENVIRONr~ENTALLY RELEASED TRITIUM
John E. Till and Elizabeth L. Etnier
The two primary chemical forms of tritium released to the environ
ment from man-made sources are tr~.tiated water vapor (3HOH) and tritium
hydrogen gas (3HH). Mason and Ostlund (1979) point out that the two
chemi ca 1 forms may have different sources, di stri but ions, and envi ron
menta 1 sinks wi th the gas proceedi ng toward convers i on to tri ti ated
water vapor with an environmental half-time of 4.8 years. Small amounts
of tritium also exist as tritium gas eH3H) and as tritiated methane
(3HCH3) .
Radiological assessments generally assume that tritium is released
from nuclear facilities as tritiated water vapor. Experimental data at
the Savannah Ri ver Laboratory (Murphy and Pendergast, 1979) i ndi cate,
however, that although tritium released by reactors is primarily in the
form of water vapor, re 1 eases from reprocess i ng nucl ear fuel average
approximately 40% tritium-hydrogen gas (3HH) or tritium gas (3H3H), and
60% tritiated water vapor (3HOH). The effect of the chemical form of
release upon the ultimate radiological dose to man is of interest due to
the reduced biological impact of tritiated gases, and particularly
because of possible releases of tritiated gases from fusion power reac
tors; additional research in the area is needed.
Numerous methodologies have been proposed to calculate the dose to
man from tri t i urn re 1 eased to the envi ronment. The fo 11 owi ng sections
discuss four of these methodologies and include sample calculations of
dose for each under chronic exposure conditions of 1 pCi/m3 (37 mBq/m3 )
of tritium in the atmosphere . •
During review of Sects. 2.1-2.4, the
reader should be aware that certain terms (e.g.,
defi ned cons i stent ly for a 11 four me tho do 1 ogi es.
Cw and Cf ) are not
Ingest i on rates as
we 11 as dose convers i on factors also vary for the di fferent methodo 1-
ogi es. Defi ni t ions of terms are, of course, cons i stent withi n each of
the four sections.
13

14
2.1 Specific Activity Methodology
Following analyses for tritium in deer, Evans (1969) suggested that long-term exposure to tritium results in significant incorporation of tritium in organic molecules in body tissues, in addition to mixing of 3HOH (tritiated water) in body water. Based on his experimental data, Evans calculated an upper 1 imit of the dose that man could receive from chronic exposure to tritium assuming body hydrogen is uniformly labeled. A reference man of 70 kg contains 7 kg of hydrogen, approximately 4.8 kg in body water and 2.2 kg in organic molecules (ICRP, 1975). If it is assumed that the tritium concentration in body water is 1 !lCil~ (37
kBq/Q), and that organic molecules are labeled to the same extent (i.e., exhibit the same 3H to IH ratio as body water), this concentration results in a body burden of
1 !lCi 1 Q H20 18 kg H20 7 kg IH -- x x x = 63 !lCi (2.3 MBq). (2.1) Q H20 kg H20 2 kg IH reference man
Assumi ng aqua 1 ity factor of 1. 0 for beta part i c 1 es of tri t i urn, thi 5
body burden results in an annual dose rate of
63 !lCi 3.7 x 10⁴ dis 3.2 x 10⁷ sec 0.006 MeV ----x x x x 7 X 10⁴ g sec - !lCi year dis
1.6 X 10⁻⁶ ergs 103 millirem·g ------ x = 102 mi 11 i rem/year (l. 02 mSv/yeal').
MeV 100 ergs
(2.2)
Evans reported further that his data indicated the labeling fraction in organic molecules to be between 0.62 and 1.0 in deer tissue, depending on the specific organ being considered, with a weighted average fraction of O. 85-l. 0 extrapo 1 ated to the reference man. [A 1 abe 1 i ng fraction of l. 0 indicates that the 3H to IH ratios are equal when comparing body water and organi c (bound) components.] Assumi ng that tritium in body water is uniformly distributed, and assuming a labeling fraction of 0.85

. "
15
for organically bound hydrogen in the body, one calculates a body burden of
[4.8 kg + (0.85)(2.2 kg)]
7.0 kg x 63 ~Ci = 60 ~Ci (2.2 MBq), (2.3)
which results in an annual dose of
60 ~Ci
63 ~Ci x 102 millirem = 97 millirem (0.97 mSv). (2.4)
This annual dose of 97 millirem (0.97 mSv) resulting from chronic exposure to a concentration of 1 ~Ci/Q (37 kBq/Q) in the body water can be used to evaluate the dose resulting from long-term exposures in the environment. Assuming an atmospheric concentration of tritium of 1 pCi/m3 (37 mBq/m3), a moisture content of 6 g H2 0 (in air)/m3, and that the concentration of tritium in man is in equilibrium with that in the atmosphere, the fo 11 owi ng annual dose is cal cul ated us i ng the data published by Evans:
1 pCi -- x--- x
97 mill irem
~Ci/Q x
103 g H2 0/Q
106 pCi/~Ci
= 1.6 X 10⁻² millirem (1.6 x 10⁻⁷ Sv). (2.5)
The "specific activity" approach described here would be applicable to evaluating chronic exposures to tritium. This methodology represents an upper limit to the dose, since it assumes a maximum possible body burden of tritium. It is not recommended for evaluating exposures from acute releases to the environment (e. g., accidental releases), or in assessing doses near the point of release where the tritium concentrat ions in water, food, and air may vary cons i del'ab ly as a function of time.

16
2.2 Methodology of the National Council on Radiation Protection and Measurements
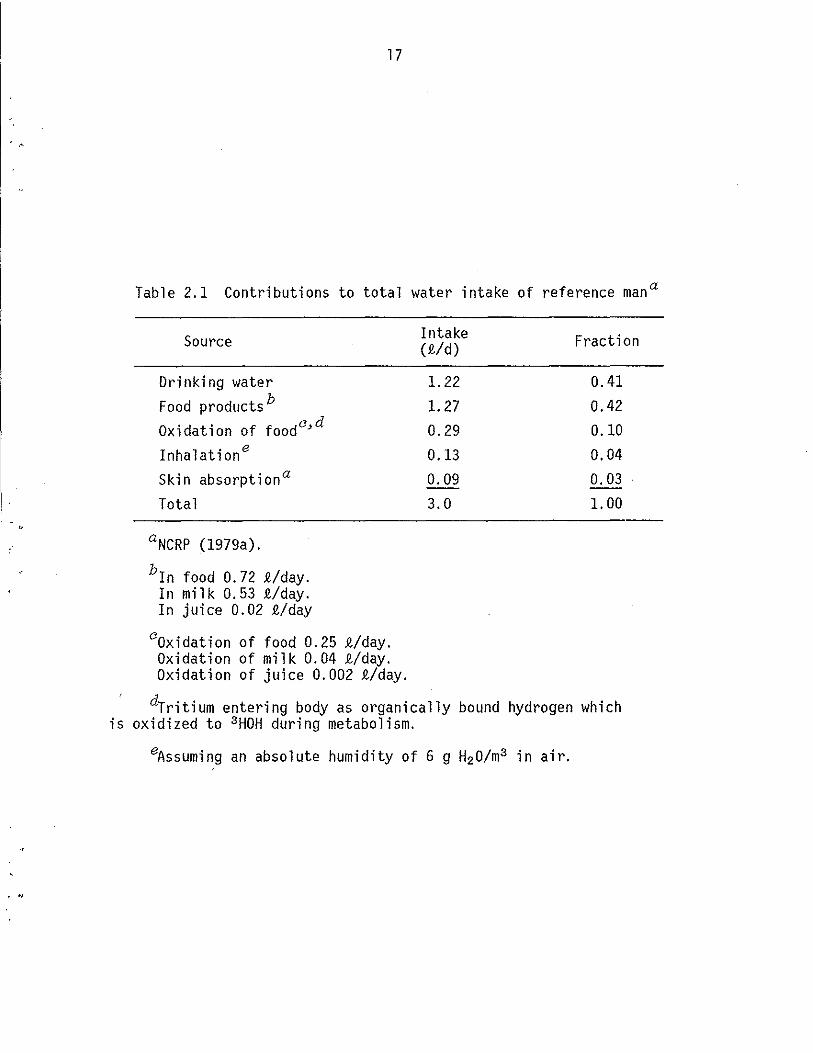
The National Council on Radiation Protection and Measurements (NCRP, 1979a) proposes a methodology for cal cul at i ng the dose from tritium when the concentration of tritium is known in the water, food products, and air to which the individual is exposed. This technique for calculating the dose applies to an equilibrium situation only and is not recommended to evaluate exposures resulting from pul se re 1 eases of tritium. The NCRP methodology assumes that the dose from tritium via the various pathways of exposure depends upon the relative contributions to total water intake as listed in Table 2.1. The annual dose per unit concentration for 3.0 Q/day water intake is described by the following expression:
1 0= [1.22 Cw + 1.27 Cf1 + 0.29 Cf2 + 0.22 Ca] 3.0 x DRF, (2.6)
where*
o = annual dose (millirem), Cw = concentration of tritium in drinking water (pCi/Q),
Cn = concentration of tritium in water in food (pCi/Q), Cf2 = concentration of tritium oxidized to water upon metabolism
of food (pCi!Q), Ca = concentration of tritium in atmospheric water (pCi/Q), and
DRF = dose rate factor (millir~m/year) pCl/Q .
The dose rate factor (DRF) used by the NCRP is 95 x 10-6 millirem·Q (pCi·year)-l, [2.6 x 10⁻⁸ Sv·Q (Bq·year)-l] assuming a quality factor of 1.0. This value is based upon a three compartment model of hydrogen in the body, published by Bennett (1973). The model assumes a water balance of 3.0 Qlday and retention half-time components of 9, 30, and 450 days for triti urn in the body. The value for DRF reported here is defined as the committed dose per integrated intake or the equilibrium
*1 rem = 10 mSV; 1 pCi = 37 mBq.
,.
17
Table 2.1 Contributions to total water intake of reference mana
Source
Drinking water Food products b
Oxidation of foodc>d
Inhalation e
Skin absorption a
Total
a NCRP (1979a).
bIn food 0.72 Q/day. In milk 0.53 Q/day. In juice 0.02 Q/day
cOxidation of food 0.25 Q/day. Oxidation of milk 0.04 Q/day. Oxidation of juice 0.002 Q/day.
Intake (.e./d)
1. 22 1. 27 0.29 0.13
0.09 3.0
Fraction
0.41 0.42 0.10 0.04 0.03 1. 00
dTritium entering body as organically bound hydrogen which is oxidized to 3HOH during metabolism.
eAssuming an absolute humidity of 6 g H2 0/m3 in air.
18
dose rate in millirem per year (~Sv/year) per constant intake concentration (pCi/Q, mBq/Q). According to Bennett (1973), 84% of the dose is due to tritium in body water and 16% is due to organically bound tritium.
In order to calculate the dose from a chronic exposure to 1 pCi/m3
(37 mBq/m3) of tritium in the atmosphere using the methodology proposed by the NCRP, several assumptions are needed. First, it is assumed that the absolute humidity is 6 g H20/m3 (the same as that used in NCRP Report No. 62). The second assumption is that the concentrations of tritium in drinking water, food, and air are equal, and as given by
Im~Ci x 6 9m~20 = 1.7 x 10⁻¹ pCi/g H20.
= 1. 7 X 10⁻¹ pCi/mQ H20 (6.3 mBq/mQ H20).
Then, from Eq. (2.6), the dose is given by
[(1.22 + 1.27 + 0.29 + 0.22) (1.7 x 10⁻¹ pCi/mQ H20)] x 3~0
(2.7)
x 103 mQ x 95 x 10-6 millir:m/year = 1.6 x 10⁻² millirem/year Q pCl/Q (1.6 x 10⁻⁷ Sv/year). (2.8)
This result is identical to the value calculated using the specific act i vi ty approach proposed by Evans. A primary reason that the two doses are i dent i ca 1 is that in thi s example we have assumed that ,the activity concentration of tritium in the water content of air is equal to that in drinking water and foodstuffs. This assumption is not always va 1 i d for chroni c exposure condi ti ons. One example occurs when the source of drinking water is relatively uncontaminated, and thus the concentration of tritium in water, Cw' is significantly less than that in air, Ca (Sect. 4.5). Another example is the case in which food products are grown away from the point of release of the tritium but are consumed at a site of higher tritium air concentration. As an example, we use the NCRP methodology and assume 1 pCi/m3 (37 mBq/m3 ) of tritium in air and 6 g H20/m3 absolute humi dity, but we adjust the concentration in
, "
"
19
drinking water to 1% of that in air, and the concentration in all food products to 50% of that in air.
Then, from Eq. (2.6), and adjusting the concentration factors [Eq. (2.7)] as above:
[1.22(1.7 x 10⁻³ ) + 1.27(8.5 x 10⁻² ) + 0.29(8.5 x 10⁻² ) +
0.22(1.7 x 10⁻¹ )] x 103 1 x 95 X 10-6 millirem/year x 3.0 pCi/£
= 5.5 X 10⁻³ millirem/year (5.5 x 10⁻⁸ Sv/year). (2.9)
The effect of incorporating simulated site-specific data is to reduce the dose to approximately one-third in this example. The NCRP model, therefore, would be applicable to chronic exposure conditions in which differences exist in the concentration of tritium in water, food, and air, but where time-averaged concentrations remain constant.
2.3 Methodology of AIRDOS-EPA
Moore et al. (1979) proposed a comprehensive computerized methodology (AIRDOS-EPA) that is capable of estimating the dose from environmentally released tritium and other radionuclides. Their code includes an atmospheric dispersion model that predicts concentrations of tritium at distances up to 50 miles (80 km) from the point of release. Tritium is assumed to move with water through the environment. Doses from ingestion of food and drinking water at a particular location are assumed proportional to the concentration of tritium in air at that location. The AIRDOS-EPA model is a further refinement over the NCRP method previously described, since it explicitly allows one to account for food products grown both at the site and elsewhere, where tritium concentrations may be different.
The dose from ingestion of tritium is given by:
(2.10)

20
where*
Ding = total dose from ingestion
Cf = dose rate factor for food
Cw = dose rate factor for water
of tritium (rem/year)
(rem/year) pCi/cm3
(rem/year) pCi/cm3
x = ground level concentration of tritium in air at an environmental location (pCi/cm3).
The ingestion dose from food (Cfx) is artificially broken down into ingestion doses from vegetables (D v)' meat (Db) and milk (Dc)' weighted according to the fraction of water entering the body from each of these food products. The equations used in the code to cal cul ate Cfx are:
(2.11)
where*
and
Dv = 0.505 Cf(fv1X + f v2Xv)'
Db = 0.185 Cf(fb1x + fb2Xb)'
Dc = 0.310 Cf(fc1X + fc2Xc)'
Dv' Db' and ° = tritium food ingestion dose from vegetables, c meat, and milk, respectively (rem/year),
X = average ground-level concentration of tritium v in air over the assessment area weighted by
quantities of vegetables produced as a function of location (pCi/cm3 )
Xb = same as above, except applied to meat,
Xc = same as above, except applied to milk,
f 1 = fraction of vegetable intake which is pro-v duced at the i ndi vidua l' s 1 ocat i on,
*1 rem = 10 mSv; 1 pCi = 37 mBq.
21
fV2 = fraction of vegetable intake whose source represents an average produced over the assessment area,
fbI' fb2 , fc1' fc2 = same as above, except for meat and milk, respectively; and
0.505, 0.185, 0.310 = fraction of water entering the body in vegetable, meat, and milk, respectively.
The value of Cf is derived from: (1) the tritium total-body dose conversion factor for ingestion, 8.3 x 10⁻⁵ rem/~Ci (2.2 x 10⁻¹¹ Sv/Bq), published by Killough et al. (1978); (2) an average absolute humidity of 8 g H20/m3 ; and (3) a consumption rate of water in food products of 1638 g/day.
The dose conversion factor for ingestion is calculated assuming a 350-g daily intake of hydrogen and assuming that under conditions of chronic exposure the specific activity in the body is equal to that in the daily intake of food and water. A quality factor of 1.0 is assumed for the tritium beta particles. The resulting value of Cf is
6.18 (rem/year)/(pCi/cm3 ) or 1.67 (Sv/year)/(Bq/cm3 ).
In order for the absolute humidity to be consistent throughout our analysis, the Cf was recalculated assuming an absolute humidity of 6 g H2 0/m3 , resulting in a value of
8.24 (rem/year)/pCi/cm3 ) or 2.23 (Sv/year)/(Bq/cm3 ).
The value of Cw as reported in AIRDDS-EPA for an assumed daily drinking water intake of 1512 g is
5.70 (rem/year)/(pCi/cm3 ) or 1.54 (Sv/year)/(Bq/cm3 ).
This value is increased to 7.60 (rem/year)/(pCi/cm3 ) or 2.05 (Sv/year)/ (Bq/cm3 ) for an absolute humidity of 6 gH20/m3 .

22
The AIRDOS-EPA code accounts for tritium doses via inhalation and skin absorption by using a separate dose conversion factor, also pub-1 ished by Ki llough et al. (1978). Complete absorption is assumed for inhaled tritium, and skin absorption is accounted for by adding 50% to the inhalation dose conversion factor. The dose conversion factor for inhalation is 1.3 x 10⁻⁴ rem/~Ci (3.4 x 10⁻¹¹ Sv/Bq) inhaled.
The dose from exposure to 1 pCi/m3 (10-6 pCi/cm3 , 37 nBq/cm3) of tritium in the atmosphere was calculated with the AIRDOS-EPA methodology to allow comparison with the methods of Evans (1969) and the NCRP (1979a) described earlier. The dose was estimated assuming an absolute humidity of 6 g H20/m3 and assuming that all food products are grown at the point of interest. The total dose from ingestion is
Ding = CfX + CwX (2.12)
= (8.24 + 7.60) rem/year 10-6 pCi/cm3 x pCi/cm3
= 1.6 X 10⁻⁵ rem/year, or
= 1.6 X 10⁻² millirem/year (1.6 x 10⁻⁷ Sv/year).
The dose from inhalation and skin absorption, Dinh , is given by
_ 1.3 X 10⁻¹⁰ rem 10-6 pCi Dinh - pCi x cm3
8.76 X 10³ h year
= 1.1 X 10⁻⁶ rem/year
X 9.6 X 105 cm3
h x
= 1.1 x 10⁻³ millirem/year (1.1 x 10⁻⁸ Sv/year). (2.13)
Therefore, the annual dose when chronically exposed to 1 pCi/m3 (37 mBq/ m3 ) in the atmosphere is'
D = 1.6 X 10⁻² millirem + 1.1 x 10⁻³ millirem (2.14)
= 1.7 X 10⁻² millirem (1.7 x 10⁻⁷ Sv).

.,
.,
. "
23
To provide a comparison between AIRDOS-EPA and the NCRP methodology using the previous example where the concentration in air is 1 pCi/m3
(10-6 pCi/cm3), the concentration in food is 50% of that in air, and the concentration in drinking water is 1% of that in air, the following parameter values are assumed:
f vI' fbI' and fc1 = 0,
fv2 ' fb2 , and fc2 = 1, and
Xv' Xb' and Xc = 0.5 pCi/m3 = 5 x 10⁻⁷ pCi/cm3 (190 ~Bq/cm3).
The dose from ingestion is given by
= 4.2 X 10⁻³ millirem/year (4.2 x 10⁻⁸ Sv/year). (2.15)
Since the dose from inhalation and skin absorption is not changed, the total dose rate is
D = 4.2 X 10⁻³ millirem/year + 1.1 x 10⁻³ millirem/year
= 5.3 X 10⁻³ millirem/year (5.3 x 10⁻⁸ Sv/year). (2.16)
The effect of including simulated site-specific data (see discussion on p. 21) is a reduction in the dose by a factor of ~3.
2.4 Methodology of the U.S. Nuclear Regulatory Commission
Methodology proposed by the U.S. Nuclear Regulatory Commission (1977) for calculating the concentration of tritium in food products is based upon a mode 1 pub 1 i shed by Anspaugh et a 1. (1972) whi ch assumes that the concentrati on in vegetation is one-half that in surroundi ng air. The concentration in vegetation is given by the following equation

24
C~(r,e) = 3.17 x 10⁷ QT[x/Q(r,e) (0.75)(0.5/H)], (2.17)
where
c~(r,e) = concentration of tritium in vegetation grown at location (r,e), (pCi/kg),
3.17 x 107 = unit conversion factor (p~~ • ~ . r:~r), [x/Q( e)] = atmospheric di~Btrsion factor at distance rand
r, direction e, (~),
QT = annual release rate of tritium (Ci/year),
H = absolute humidity of the atmosphere at location (r,e), (g/m3 ),
0.5 = ratio of tritium concentration in plant water to tritium concentration in atmospheric water (dimensionless);
0.75 = fraction of total plant mass that is water (dimensionless).
The concentration of tritium in milk and meat depends upon the tritium concentration in vegetation ingested by cattle, and is given by the following expression
where
(2.18)
c~,B(r,e) = concentration of tritium in milk (Ci/Q), or in meat (Ci/kg),
C~(r,e) = concentration of tritium in vegetation (Ci/kg),
Fm B = average fraction of the animal's daily intake , of tritium that appears in each liter of milk
(1.0 x 10⁻² day/Q), or in each kg of meat (1.2 x 10⁻² day/kg); and
QF = amount of feed consumed by a cow (kg/day).
,<

. '.
25
The ingestion dose is then given by
(2.19)
where
DCF = dose conversion factor (millirem/pCi ingested);
U = ingestion rate of vegetables, milk and beef, v,m,B respectively;
f = fraction of ingested produce grown locally, here g assumed = 1.
It is important to understand that the methodology proposed here
assumes that the maximum concentration of tritium in plants is one-half
of that in the atmosphere. Thi s assumption is made because a s i gnifi
cant portion of the water in plants is taken up from the soil water, in
whi ch the tri t i um act i vi ty concentration is assumed to be lower than in
air.
The Regul atory Gui de 1. 109 methodo logy does not provi de gui dance
for assumptions regardi ng the tri t i um concentration in dri nki ng water
when only atmospheric concentrations are known. (The lack of guidance
regarding this pathway may be assumed to indicate that it is anticipated
that contami nati on of dri nki ng water vlith atmospheri c tri t i um contri
butes less than 10% of the total tritium dose at LWR sites.) The dose
to total body from tritium in drinking water may be calculated from a
measured or assumed concentration in water us i ng a dose convers i on
factor for ingestion of tritium, and a consumption rate of 370 9../year
for adults.
Dose convers i on factors in the Regul atory Gui de were deri ved by
Hoenes and Soldat (1977) and are listed in units of millirem per pico
curie ingested or inhaled. A breathing rate of 8000 m3/year is recom
mended. The i nha 1 ati on dose convers i on factor accounts for absorption
through the skin by increasing the factor calculated from inhalation
alone by 50%. This is identical to the approach taken by Killough et
al. (1978), discussed earlier. The dose conversion factors published by

26
Hoenes and Soldat assumed a quality factor for tritium beta particles of
1. 7. In order to provi de a consi stent compari son of the NRC me tho do logy
with the methodologies previously discussed, the dose conversion factors
have been reca 1 cul ated for aqua 1 i ty factor of 1. 0 resul t i ng in values
of 6.2 x 10 -8 mi 11 i rem/pCi (1. 7 x 10 -11 Sv/Bq) and 9.4 x 10⁻⁸ mi 11 i rem/
pCi (2.5 x 10⁻¹¹ Sv/Bq) for ingestion and inhalation, respectively.
Assumi ng an atmospheri c concentration of tri t i urn of 1 pCi /m3 (37
mBq/m3 ), an absolute humidity of 6 g H2 0/m3 , and that the activity con
centration of tritium in drinking water is the same as that in air, an
annual dose of 5.9 x 10⁻³ millirem (5.9 x 10⁻⁸ Sv) may be calculated
using NRC methodology for a one-year chronic triti urn exposure to the
average i ndi vi dua 1. Thi s total dose is broken down as follows: 1. 2 x
10-3 mil1irem (1.2 x 10⁻⁸ Sv) from ingestion of contaminated foods;
3.9 x 10 -3 mi 11 i rem (3.9 x 10 -8 Sv) from ingestion of contami nated
water; and 7.6 x 10⁻⁴ millirem (7.6 x 10⁻⁹ Sv) from skin absorption and
inhalation.
If it is assumed that all of the ingested food products are grown
at a different site where the atmospheric concentration is 50% of that
at the point of interest, and the concentration in drinking water is I%
of the atmospheri c concentration, the NRC methodology yi e 1 ds a dose of
1. 4 x 10⁻³ mi 11 i rem (1. 4 x 10 -8 Sv). I ncorporati ng these assumpti ons
thus reduces the dose by a factor of ~4.
2.5 Recommendations for Calculating the Dose from Chronic Exposures to Tritium in the Environment
Table 2.2 summarizes the dose from 1 pCi/m3 (37 mBq/m3 ) of tritium
calculated using each of the preceding methodologies, with and without
s imul ated s ite-specifi c parameters. Each of the methodo 1 ogi es revi ewed
is applicable to chronic exposure conditions only and is not recommended
for estimating the dose following an acute release of tritium to the
envi ronment. The primary advantage of the methodo 1 ogi es of Evans (1969)
and the NCRP (1979a) is simplicity. The NCRP method, however, allows
one to account for variations in the concentration of tritium in water

. "
27
Table 2.2 Summary of the annual dose from chronic exposure to 1 pCi/m3 (37 mBq/m3) of tritium in air, calculated using
four methodologiesa
Methodology
Evans, 1969
NCRP, 1979
AIRDOS-EPA, 1979
USNRC, 1977
No sbte-specific data (millirem)d
1. 6 X 10⁻²
1.6 X 10⁻²
1. 7 X 10⁻²
5.9 X 10⁻³
Including certain site-specific dataC
emi 11 i rem)
e
4.8 X 10⁻³
5.3 X 10⁻³
1.4 X 10⁻³
aCalculations are made for 6 g H2 0/m3 and a quality factor of 1.0 for tritium betas.
bAssuming that all food products are grown at point of interest and that the specific activity of tritium in drinking water equals that in the atmosphere.
cAssumi ng that all food products are grown at another 1 ocat ion where the air concentration of tritium is 50% of that at the point where the dose is calculated, and the concentration in drinking water is 1% of that where the dose is calculated.
at millirem = 10 ~Sv. erhe methodology proposed by Evans does not provide for the inclu
sion of site-specific data.

28
taken into the body while the Evans procedure does not. ogies of AIRDOS-EPA (Moore et al., 1979) and the USNRC
The methodol(1977) permi t
incorporation of site-specific data such as the fraction of food products harvested from a location other than the point of interest. It is obvi ous from our cal cul at ions that consi derati on of data descri bi ng reduced tritium concentrations in drinking water and food products may si gnifi cant ly reduce the cal cul ated dose. Therefore, these features available in the AIRDOS-EPA and NRC methods are important. The primary disadvantage to these two methodologies is complexity.
Our analysis of the four methodologies leads to the conclusion that the model recommended by the NCRP provides the best combination of simplicity and relative accuracy for calculating the dose from chronic exposures to tritium. Acute environmental exposures should be evaluated on a case by case basis using analytical measurements of tritium in the atmosphere, water, and food products.
Two minor modifications to the NCRP methodology would maintain its simplicity and would allow for incorporation of the dose from food products grown elsewhere. First, because current data concerning oxidized vs non-oxidized tritium components in food products are prel iminary (Sect. 3.2), we combine these components into a single value of 1. 56 (Table 2.1). Second, the concentration of tritium in food products is broken into two parts: (1) that fraction grown at the point where the dose is being calculated, and (2) that fraction grown at another location where the air concentration is different than at the point of interest. The model is described by the following equation, a modification of Eq. (2.6):
0== [1.22 Cw + 1.56(I: CfnOn) + 0.22 CaJ
n==1,2,3,
which simplifies to
1 3.0 x DRF,
o == [0.41 Cw + 0.52 (I:Cfn on )+ 0.07 CaJ DRF ,
n==1,2,3, ...
(2.20)
. ,
where*
29
0= annual dose (millirem),
C = concentration of tritium in drinking water (pCi/Q), w
C = concentration of tritium in water of food products grown fn at location n (pCi/Q),
o = fraction of food products grown at location n (dimensionn less),
C = concentration of tritium in air (pCi/Q), a DRF = dose rate factor (95 x 10-6 millirem/year)
pCi/Q '
If the concentrations of tritium in food products and in drinking water are not known, it is recommended that the concentration in food be assumed to be 50% of that in airt at location "n," and that the concentration in drinking water be 1% of that in air at location "n." This "modified" NCRP model incorporates the simplicity of the specific activity and NCRP approaches and allows use of site-specific information on tritium concentrations in food products grown both locally and remotely. Use of such a model is recommended for estimating dose from chronic exposure to 3HOH in the environment.
* 1 millirem = 10 ~Sv, 1 pCi = 37 mBq.
tAl though this value has been widely accepted in the assessment of tritium released to the atmosphere, it is emphasized that the 50% value is based upon the model pub 1 i shed by Anspaugh et a 1. (1972). More recent contradictory information published by Murphy and Pendergast (1979) indicates that the concentration of tritium in vegetation may be nearly equal to that in air under chronic exposure conditions. Therefore, because of the importance of the value assumed in the calculation of dose, additional research to determine the concentration of tritium in food products relative to that in air is badly needed.

,.
3. ANALYSIS OF KEY PARAMETERS INCLUDED IN THE CALCULATION OF DOSE FROM TRITIUM .
John E. TiZZ, EZizabeth L. Etnier, H. R. Meyer and P. S. Rohwer
This chapter considers four key parameters used in the calculation of the dose from tritium: (1) the quality factor for tritium betas, (2) the biological half-life and the effect of organic binding of tritium, (3) the absolute humidity, and (4) the concentration of tritium in drinking water. The value assumed for each of these parameters could significantly modify the calculated value of dose resulting from environmental exposures.
3.1 The Tritium Quality Factor
The concept of dose equivalent (DE) was introduced by the International Commission on Radiological Protection (ICRP, 1966) and the International Commission on Radiation Units and Measurements (ICRU, 1962) in order to defi ne a uniform scale of damage from exposure to different types and energies of radiation. The unit of the dose equiva-1 ent is the rem*, whi ch is cal cul ated us i ng the fo 11 owi ng express ion:
where
DE = D x Q x (RDF) 1 x (RDFh . . .
DE = dose equivalent in rem,
D = absorbed dose in rads,
Q = quality factor (dimensionless),
(RDF)l, (RDF)2 ... = radionuclide distribution factors.
(3.1)
The term quality factor (Q) has been accepted for use in the calculation of dose and has been related to linear energy transfer (LET) on a common scale for all ionizing radiation. A distribution factor (RDF) may be
*1 rem = 10 mSv.
31

32
used to express the modification of biological effectiveness due to nonuniform distribution of internally deposited isotopes. Since tritium is essentially uniformly 'deposited in body tissue, its distribution factor is assumed to be 1. Some disagreement still exists, however, as to the best value of Q for tritium betas.
In ICRP Publication 9 (1966), the Commission recommended a value of 1.7 be used as the Q for ~-, ~+ and e- radiation with maximum energies ::,0.03 MeV. An amendment to ICRP Pub 1 i cat ion 9, in Apri 1 1969 (ICRP,
- + -1969), reduced Q to 1.0 for all ~ , ~ , e , y, and x rays. It was con-cl uded that a value of uni ty is appropri ate wi thi n the degree of precision required for the purposes of radiological protection. The decisi on to reduce the qual i ty factor from 1. 7 to 1. 0 was also based upon the lack of scientific evidence to support the higher value as well as the vari abil ity in radi 0 1 ogi ca 1 end poi nts and reference radi at i on reported in the 1 i terature'.
The ICRP decision in 1969 followed a review of the experimental literature by Vennart (1968). He concluded that in view of experimental evi dence on the quality factor of ~ part i cl es from tri t i ated water a value different from unity could hardly be justified. Vennart also based his conclusion on the fact that since the ICRP in Publication 8 (1966) recommended expressing risk per unit dose only in terms of orders of magnitude, those factors included in the calculation of dose should be rounded to whole numbers. A later review of the literature by Rohwer (1976) stated that most of the information on tritium exposure supported the value of 1.0, although he pointed out that this was an area needing further study and evaluation.
Variability still exists in experimental end points and reference radi at ion,' reported in the 1 iterature, whi ch are used to determi ne the quality factor for ~- radiation. Cumming et al. (1979) demonstrated that total radiation dose from a single injection of tritiated water can be greatly influenced by minor changes in experimental conditions. Improvements continue to be made, however, in eva 1 uat i ng exposures to tritium at very low dose rates and in choosing physiological and biochemical end points leading to a significant increase in the sensitivity of the tests.
33
The potential genetic consequences of chronic, low-level exposure to tritium may be of particular importance for environmental releases from the nuclear industry. Carsten and Commerford (1976) studied mice exposed to 3 I-lCi/ml dri nki ng water. Second gene rat ion females were sacrificed in late pregnancy to determine mutation frequency. Analysis of their results showed a significant reduction in the number of viable embryos resulting from mating between animals exposed to tritium but showed no effect on breedi ng efficiency. The authors noted that no di rect para 11 eli sm exi sts between man and the data deduced from mi ce; however, the significant effect seen in their study suggests that further investigation at lower tritium concentrations is necessary.
Another study by Dobson et a 1. (1977) a I so suggests that genetic effects produced from i nterna lly depos i ted tritium may warrant renewed consideration. In their experiment, female germ cells in both mouse and monkey were shown to be .extremely sensitive to destruction by low-level, chronic tritium exposure. Their results appear to be inconsistent with previous reports which conclude that oocytes in both monkey and man are relatively radiol'esistant, with X-ray doses lethal to 50% of the population (LD50 's) of up to 5000 rads (50 Gy) (administered in single, acute doses at various times during development). Dobson and his colleagues suggest that the greater sensitivity they observed resulted from chronic exposure to tritium in body water that acted on cells passing through highly vulnerable periods of early development. The exposure conditions established in their experiments are likely to be more representative of I ow-l eve I envi ronmenta I exposures from tri t i urn (such as releases .by nuc I ear facil it i es) than those descri bed by most investigators; therefore, the results of their study must be given serious consideration in the design of further bioeffects research involving tritium, and in current radiological assessment methodologies.
Table 3.1 summarizes selected experiments reported since the review published by Vennart (1968). The table includes only animal and mamma-lian studies in which (RBE)* are calculated.
values for relative biological effectiveness Additional experiments have been reported using
*See footnote a, Table 3.1.

Table 3.1 RBE a values for tritium from selected animal and cell studies b
Description of experiment
Irradiated mouse testes using internally distributed tritium from injected tritiated thymidine and tritiated water. Used inability of spermatogonia to divide twice as damage criteria. Irradiated aqueous solutions of ribonuclease using tritiated water. Measured residual enzymatic activity and observed survival. Exposed rats internally to tritiated water. Damage criteria were change in weight of spleen, thymus, adrenals, and liver, as well as biochemical indices. Exposed rats internally to tritiated water. Damage criteria were survival rates, peripheral blood response and thymic and splenic weight changes. Exposed two mammalian cell lines to tritiated water and tritiated thymidine. Measured cell survival. Exposed weanling mice to tritiated water and observed survival of primary oocytes. Exposed developing mice from conception to 14 days after birth. Observed primary oocyte survival. Exposed mice to tritiated water, observed gene mutations transmitted.
Reference radiation Reported RBE Reference
200 kVp X rays 1.3 - 2.4 Lambert (1969)
so Co y rays 0.94 ± 0.11 Richold et a1. (1971)
137CS Y rays 1.4 - 2.2 Moskalev et a1. (1972)
137CS Y rays 1.4 - 1.9 Moskalev et a1. (1973)
so Co y rays 1. 7 - 1.9 Bedford et a1. (1975)
sOCo y rays 1.1 - 1. 7 Dobson et a 1. (1975)
sOCo y rays 1.6 - 3.0 Dobson and Kwan (1976) (with varied rate)
.soCo y rays 2.2 Russe 11 et a 1. (1979)
aRelative biological effectiveness (RBE) is a factor expressing the relative effectiveness of radiations that have different linear energy transfer (LET) values, in producing a given biological effect. The unit is limited to use in radiobiology but is similar to the value of quality factor used in the calculation of dose.
bStudies published since the literature review by Vennart (1968).
,
w -l»

35
plants or in which radiosensitivity of organisms is studied but where no RBE is calculated. These experiments have been omitted from the table.
Lambert (1969) irradiated mouse testes using internally distributed tritium from injected 3HTdR and 3HOH. The criteria for damage was the inability of spermatogonia to divide twice and produce resting spermatocytes. The reference radi at i on was 200 kVp X rays, deli vered at an exponentially decreasing dose rate over a 72-hour period. The RBE of tri t i urn as tritiated thymi di ne or tri t i ated water re 1 at i ve to 200 kVp X rays was in the range of 1.3-2.4. Lambert poi nted out that a di rect extrapolation of his results to man is not possible; however, this study is particularly important because of its use of a very low dose rate (and total dose), and high sensitivity of the endpoint used as damage criteria.
Richold et al. (1971) reported an RBE of 0.94 ± 0.11 following irradi ati on of aqueous sol uti ons of ri bonucl ease with 3HOH under anoxi c and aerobic conditions. The reference radiation was sOCo y. Of the studies listed in Table 3.1, this is the only case in which an RBE value of less than 1.0 is reported. However, a relatively high dose rate (100
rads/hr, 1 Gy/hr) was used. It has been shown that exposures to tritium under chronic conditions at low dose rates (comparable to "routine re-1 ease" exposures) potentially produce more harmful effects than acute, high-level exposures (Dobson et al., 1975), and this "dose rate effect" may have affected the outcome of the studies by Richold et al.
In an animal study, Moskalev et al. (1973) exposed rats to tritium oxide injected intraperitoneally. The calculated dose rate from tritium varied from 27.5 to 1.38 rads/hr (0.28 to 0..014 Gy/hr) and the reference radiation used was 137CS y rays. This experiment used several indices for RBE determination including quantitative composition of peripheral blood, change in weight of the spleen, thymus, adrenals, and liver, as well as numerous biochemical indices. The total cumulative dose was 340
rads (3.4 Gy). Calculated values for RBE ranged from 1.4 to 2.17 dependi ng upon the index evaluated. Moskal ev et a 1. (1973) reported another study in which rats were again exposed to 3HOH and 137CS y rays. The criteria for damage were survival rate, peripheral blood response
36
and thymic and splenic weight response. Although higher dose rates were used in thi s study than the previ ous study, it was conc 1 uded that the RBE for tritium oxide was in the range of 1.45-1.93.
Bedford et a 1. (1975) exposed two mammal ian ce 11 1 i nes to 3HOH and tritiated thymidine and used sOCo y rays as a reference radiation. The criterion for damage was cell survival. To prevent cell division during exposures, irradiations were carried out with cells held in the frozen , state or, in one case, at 5°C. For cells irradiated at 5°C, the effi-ciency of cell killing by beta particles from tritiated water or tritiated thymidine was not appreciably different, but both were more efficient than gamma radiation. For a dose rate of 20 rad/hr (0.2 Gy/hr), the relative biological effectiveness of tritium beta particles compared to sOCo y rays was estimated to be between 1.7-1.9.
Wean 1 i ng mi ce were exposed to 3HOH by Oobson et a 1. (1975) at low dose rates (approximately 5.2 rads/day, 0.052 Gy/day), Surviving primary oocytes were counted mi croscopi ca 11y in ovari es and compared to controls. Other weanlings were exposed to sOCo y rays at 5.9 rads/day (0.059 Gy/day). It was concluded that since the exposure was protracted, more effective microdistribution of tritium atoms may have occurred resulting in an RBE of 1.1-1.7. The investigators emphasized the significance of their results showing that 3HOH becomes more damaging compared to gamma rays as the low-level exposure is protracted over longer periods of time. This finding is particularly important relative to exposures from tritium found in the environment, These data were verified in another study by Dobson and Kwan (1976). Again, developing mice were used and survival of primary oocytes was observed. The dose rate was varied to as low as 0.44 rads/day (0.0044 Gy/day) for both 3HOH and the reference sOCo y rays. At effective gamma-ray doses of about 40 rads (0.4 Gy), the RBE was cal cul ated to be 1. 6. However, wi th lower dose rates (giving effective total doses of only a few rads), the RBE for tritium rises to approximately 3. These studies by Dobson et al. (1975) and Dobson and Kwan (1976) are very important si nce they used extremely sensitive criteria for damage and observed noticeable effects at exceptionally low dose rates and total dose.
37
Of particular importance is the recent study by Russell et al.
(1979) in which transmitted gene mutations induced by tritium were
observed in mice. Male mice were injected with tritiated water to give a dose rate of 0.8 rad/min (0.008 Gy/min). A specific-locus-mutation
test was used to determine biological damage. This procedure is consid
erably more sensitive than earlier methods reported for determining RBE.
Russell et al. point out that various uncertainties are involved in
arri vi ng at a preci se value for RBE; however, they recommend that for
the purpose of risk estimation, it seems more prudent to use the RBE
value of 2 as the best point estimate computed from their data.
In general, the values of relative biological effectiveness for
tritium lie in the range 1.0 to 2.4 with more values nearer 2.0 than
1.0. The data summarized in Table 3.1 seem to indicate that, as experi
mental procedures are progressively refined and become more sensitive, a
quality factor between 1.0 and 2.0 could certainly be supported by pub
lished data and a return to the original value of 1.7 would be more in
line with the current "conservative" approach to assessment· of dose.
In summary, recent experimental data on the RBE for tri t i um and
potent i a 1, long-term, geneti c effects from chroni c, 1 ow-l eve 1 exposures
lead us to conclude that we may be underestimating the radiological sig
nificance of internally deposited tritium. A quality factor between 1.0
and 2.0 can certainly be justified for tritium beta particles, with an
optimum value probably closer to 2.0 than 1.0. In view of this conclu
sion, it seems reasonable to suggest use of the quality factor value of
1. 7 originally recommended by the ICRP, particularly for purposes of
environmental assessment of routine tritium releases.
The NCRP (l979b) has recently revi ewed the tri t i um qual i ty factor
issue, concluding that " ... there is ample evidence to ascribe to the
tritium beta an RBE of 1 provided the reference radiation is in the order
of 60-80 kVp x-rays" (ita 1 i cs ours). Because the reference radi at ion
utilized for determinations of quality factor for tritium is ordinarily
220-250 kVp y rays, or 60CO rays, it appears that some ambiguity exists
within the statements leading to the NCRP recommendation. Given the
need for a conservative approach toward dose cal cul ati ons for chroni c,

38
low-level exposures, use of the 1.7 Q value during continued analysis of the question appears to be a prudent decision.
3.2 Biological Half-Life and Organic Uptake of Tritium
The uptake of tritium into organic tissues as bound hydrogen, and the resulting increase in the body burden during low-level exposures to trit i ated water, are important in the eva 1 uat i on of envi ronmenta 1 releases of tritium. Young et al. (1975), Strand and Thompson (1976), Rohwer (1976), and the NCRP (1979 a and b) represent some of the more recent revi ews pub 1 i shed on the subject. Rohwer (1976) summari zes excretion data and finds three elimination components; 8.7 days for body water, 34 days for exchangeable tritium in organic materials, and 300-600 days for nonexchangeable tritium in organic materials. He concludes that dose estimates that include only the body water tritium contribution could be increased by perhaps 20% to include the 'dose contribution due to organically bound tritium. Table 3.2 lists reported values for percent contribution of organically bound tritium to total body dose.
Several papers have been omitted from the above reviews, and these will be discussed briefly. No new research has appeared in the literature to disprove the above conclusions.
Istomina and Moskalev (1972) studied the kinetics of tritium accumUlation in adult rats and determined the cumulative tissue dose received by animals with chronic 3HOH intake. They found that with chronic intake of varying activities, an equilibrium was established for intake, accumulation, and elimination of 3HOH within the organism by day 20. After administration ceased, 98.6-99% of the 3HOH was eliminated with a half-life of 3-4.3 days and the remainder eliminated with Tl/2 = 19-28 days. The authors conclude that the change in tritium 1 eve 1 in the aqueous phase of the rat organi sm, withi n the range of doses studied, is unrelated to the level of administered activity and is descri bed by a multi component exponent i a 1 decay function. Ana lysi s of killed rats indicated that there had been slower accumulation of tritium in the dried tissue residues than in the extracted aqueous phase, as
.,

39
Table 3.2 Contribution of organically bound tritium to total body dose
Dose (%) Type of Organism Reference exposure exposed
16 Acute Human Bennett (1972)
6.7 Chronic Mice Hatch & Mazrimas (1972)
2 Chronic Clam Harri son & Koranda (1971)
8 Acute Rat Lambert & Clifton (1967)
5-10 Acute Rat Thompson (1954)
9 Chronic Rat Thompson & Ballou (1954)
28 Acute Human Sanders & Reinig (1968)
1-2 Chronic Human Pi nson et a l. (1952)
2 Chronic Human Bush (1972)
1.6 Chronic Human Snyder (1968)
10 Theoretic Human Croach (1973)
30 Chronic Deer Evans (1969)
2 Acute Human Balonov et al. (1974)
7.5-38 Chronic Rat Istomina & Moskalev (1972)

40
well as slower elimination as discussed above. At apparent equilibrium, during chronic exposure, the quantity of tritium in the residue phase constituted 9% of the total activity in the organism. During 64 days of administration, 92.5% of the integrated dose was delivered by tritium in the aqueous phase and 7.5% by tritium in the residue phase. After stopping administration, 62% of the cumulative tissue dose was from the aqueous phase and 38% from the dried residue phase.
Balonov et al. (1974) studied the transport kinetics of body fluids in man after acute intravenous injection, inhalation, and ingestion of 3HOH. The injection procedure duration was reported as 10 s. The excretion of incorporated tritium following ingestion was followed for 300 days, with the basic component of excretion (T1/2 ~ 12 days) appearing as well as a second component of about 39-76 days. A four-compartment mathemat i ca 1 model is suggested for 3HOH metabo 1 ism. Thei r dose estimates show that a 2% increase in the whole-body dose is due to the organic tritium pool, and that 5-30% of the total dose to soft tissues is accounted for by radiation from organic tritium.
The transfer and incorporation of tritium in mammals as studied for the Internati ona 1 Atomi c Energy Agency (IAEA) Research Programme on the Behavi or of Tri t i urn in the Envi ronment is summari zed by Van den Hoek (1979). Uptake in organic constituents following administration of 3HOH was studied. In cows' milk the ratio of specific activities for organic milk components vs milk water was found to be 0.30 for casein and 0.60
for lactose. Calves fed tritiated milk powder for 28 days were compared with calves fed water containing 3HOH, and a much higher incorporation of tritium into organs and tissues was found for those calves fed organi ca lly bound tritium. On the average, 15 times more tritium was i ncorpo rated and this represented 4.1% of the ingested tritium. These data on uptake of organically bound tritium in foods reported by Van den Hoek are of a preliminary nature but indicate a need for further investigations.
Bogen et al. (1979) report a continuation of their study on tritium di stri but ion inman and hi s envi ronment. They confi rm that the ratios of activity concentrations of tritium in bound vs loose tissue fractions decrease as the trophi cleve 1 s are ascended. Tri t i urn was found to be
•

- .
41
distributed homogeneously within the organs of each individual studied. The concentration in body water of animals and humans was similar to the concentrations found in environmental water sources. The "bound" tritium values were the same for each organ within an animal, but the tritium concentrat ions were found to be hi gher than in the "loose" fraction. The ratio of "loose" to "bound" tritium activity concentrations in food was found to be about 4, and Bogen estimates that about 60% of the dietary intake of tritium is from the "loose" fraction. The "loose" to "bound" fraction in human tissues was found to be about 2.
It should be pointed out that these data do not prove an enrichment or accumulation of tritium in man. As discussed in NCRP Report No. 62 (1979a), the longer bi 0 1 ogi ca 1 ha If-l ife for the organi c constituent, combi ned wi th the recent reducti ons in envi ronmenta 1 concentrations of weapons-related tritium (resulting in rapidly reduced concentrations in free body water), can temporarily produce what appears to be an enrichment in the organi c trit i urn component inman and other organi sms.
It appears from the range of values reported for the total body dose contribution from organically bound tritium that the 20% increase in dose recommended by Rohwer (1976) is a reasonable estimate. The NCRP (1979a) also suggests multi p lyi ng the dose to body water by a factor of 1.2 to account for "combined" tritium in tissue, and this approach is followed in the methodology we are proposing. This estimate is based on a dose model which assumes a biological half-life of 9, 30, and 450 days for tritium in the body (Bennett, 1973), representing the "body water," and two "organic" compartments, respectively.
3.3 Regional and Site-Specific Absolute Humidity Data for Use in Tritium Dose Calculations
As mentioned in Chap. 2, absolute humidity is a key parameter in the calculation of dose from environmental releases of tritium. Due to di lut i on of released tri t i urn by ai rborne water vapor, dose is found to be inversely proportional to absolute humidity. The comparison of methodologies presented in that chapter assumed a value of 6 g H20/m3 ;
42
however, actual values may vary cons i derab ly dependi ng upon the geographical region in which dose is being evaluated. Because of the wide variability of absolute humidity within the United States, it is helpful to take a closer look at regional absolute humidity data from which appropriate values for performing radiological assessments may be estimated.
Abso 1 ute humi dity was estimated for 218 poi nts across the United States, usi ng i nformat i on from the 1977 Annual Summary of U. S. Cl i matological Data (NOAA, 1977). These data points are tabulated elsewhere (Etnier, 1980). Most climatological data are in the form of relative humidity, which we convert to absolute humidity for use in dose calculations.
The relative humidity (HR) is the ratio of the actual to saturation water vapor pressure at a gi ven temperature, (i. e., HR :: P /P s), The absolute humidity (Ha) is the actual vapor content expressed in grams per cubic meter, [i.e., Ha :: (n/v)m, where (n/v) is the moles of water per unit volume and m is the molecular weight of water (18 g H2 0/mole)].
where
From the ideal gas law, we find:
P !!:: ~ V RT'
Pa:: actual water vapor pressure in atmospheres,
(3.2)
R:: gas constant in atmospheres·m3 /mole·degree K (8.2057 x 10- 5 ),
T :: absolute temperature in degrees K.
Therefore, we can calculate absolute humidity (Ha) in grams per cubic meter in terms of HR as:
where
Ps :: the saturation water vapor pressure at temperature T.
"
43
Calculated absolute humidity data for the continental United States were arbitrarily grouped in the following ranges (g/m3): 3.0-5.5, 5.6-7.5, 7.6-9.5, 9.6-11.5, 1l.6-16.5. Data points were plotted on a U.S. map, and topography and major river systems were utilized to help delineate areas falling within the various ranges. Figure 3.1 shows the areas in which the selected ranges fall. The mean value for each range is listed on the figure.
The U. S. Nuclear Regulatory Commission Guide 1.109 (USNRC, 1977) current ly recommends usi ng a default value based on growi ng season of 8 g H20/m3 in lieu of site-specific data for absolute humidity, while the National Council on Radiation Protection and Measurements (NCRP, 1979a) uses a value of 6 g H2 0/m3, which is a reported Northern Hemisphere mid-latitude mean value (NOAA, 1976). The range of values for the United States is 3.0-16.5 g/m3; use of the NRC default value of 8 g H2 0/m3, for example, would thus yield dose estimates which are within a factor of 3 of the extremes of individual site-specific data.
The data presented in Fig. 3.1 allow choice of a regional estimate of absolute humidity when appropriate for use in tritium dose calculat ions. Section 4.3.5 of thi s report presents data i ndi cat i ng the re 1 ative impact of variations in absolute humidity values upon doses estimated for a typical nuclear facility.
3.4 Calculation of Tritium Drinking Water Activity Dilution Coefficients for Use in Estimation of Radiological Dose
In certai n speci fi c cases, choi ce of a di 1 ut ion coeffi ci ent for trit i um enteri ng a dri nki ng water supply can s i gnifi cant ly i nfl uence total calculated doses for a fuel cycle facility. While a default value for the activity dilution coefficient is often used in dose calculations, application of a more site-specific factor is appropriate when data are available. It is not difficult to calculate an activity dilution coefficient for tritium entering a lake at a given rate.

· MEAN ABSOLUTE HUMIDITY (g/m3)
~ 4.7 6.6
:~iMtl~f*}&'(,~~ 8 .4 ~ 10.6 :;:::i:~":." 13 . 8
RANGE OF VALUES (g/m3 )
3.0 - 5.5 5.6 - 7.5 7.6 - 9.5 9.6 - 11.5
11.6 - 16.5
ORNL-OWG 79-f23f6R
Fig. 3.1 Absolute humidity by geographical region
,
.,. .,.

45
3.4.1 Aquatic releases
Peterson et al. (1969) describe a chain lake model to be used in calculating tritium dilution in lakes when the tritium input rate is known. The time variation of tritium concentration [C(t)] is described by the expression
where*
R = tritium input to lake in Ci/year,
v = lake volume (m3 ),
A = Ar + Ae,
Ar = tritium decay constant (0.056/year),
Ae = q/v = physical removal constant (year-i),
q = rate of water flow through lake (m3 /year) (outflow plus evaporation),
and complete mixing of the lake is assumed.
(3.1)
Equation (3.1) may be used to calculate tritium concentrations for a variety of conditions, representing a range of lake sizes and charge/ di scharge rates. For our purposes, tri t i um concentrations are cal culated for three input periods: 1, 5, and 20 years. The range of lake volumes chosen includes small reservoirs (1000 m x 1000 m x 10 m; 107 m3 ) to large lakes [(4 x 10⁵ m) x (4 x 10⁵ m) x 30 m; 5 x 10¹² m3 ].
The phys i ca lremova 1 constant, Ae, is determi ned both by rate of water outflow per year and the rate of evaporation assumed for a given site. We chose a range of water outfl ow of 0 to 5 1 ake volumes per year (Peterson et al., 1969) as representative of the majority of lakes. Based on U. S. Department of Commerce data (1968), we chose a range of lake evaporation coefficients for the United States as 0.1 to 2 m/year, resulting in ranges of evaporative loss rates of from 1 x 10⁵ to 2 X 106
*1 Ci = 37 gBq.

46
m3/year (small lakes), to. 1.6 x 10¹⁰ to. 3.2 X 10¹¹ m3/year (large lakes). The value af Ae therefare ranges fram
[(0 + 1 x 10⁵ ) + 1 X 10⁷ ] year-1 = 10-2/year, to.
[(5 x 10⁷ + 2 x 10⁶ ) + 1 X 10⁷ ] year-1 = 5.2/year far small lakes, and fram
[(0 + 1.6 x lOla) + 5 x 10¹² ] year-1 = 3.2 x 10⁻³/year, to.
[(5 x 10¹² + 3.2 X 10¹¹) + 5 X 10¹² ] year-1 = 1.06/year far large lakes.
Far aur purpases, Ae' s rangi ng fram O.Ollyear to. "'10/year suffi ce to. appraximate the range af physical remava1 canstants far all lake sizes.
Table 3.3 lists activity di1utian caefficients far the abave canditians. The tabulated A values equal Ae + Ar . To. calculate tritium activity in drinking water, multiply the apprapriate activity di1utian caefficient by a tritium input rate, in Cilyear. Table 3.3 indicates that, even far a relatively small lake (107 m3) with no. autf1o.w and a law evaparatian rate (A = 6.6 x 10⁻²/year), and far a lang duratian af tritium release (t = 20 years), the di1utian caefficient is faund to. be quite small ("'10- 6 year/m3). Far large lakes and less restrictive canditians, factars to. 10-13 are calculated. It is recammended that, when applicable, site-specific water-supply data be utilized, in canjunctian with caefficients such as thase listed in Table 3.3, to. estimate di1utian af tritium entering drinking water supplies via liquid releases fram nuclear facilities.
As discussed in Chap. 2 af this repart, a cade such as AIRDOS-EPA (Maare et a1., 1979) estimates the dase due to. tritium in drinking water as being prapartiana1 to. the tata1 tritium activity taken into. the bady via this made. Thus, the dase is prapartiana1 to. the cancentratian af tritium in drinking water, multiplied by the quantity af water ingested per unit time. Killaugh et al. (1978) recammend use af a tata1 bady dase canversian factar (DCF) far tritium ingestian af 8.3 x 10-s rem/~Ci (2.2 x 10⁻¹¹ Sv/Bq). If the tritium input rate to. a drinking water reservair af knawn size is available, Table 3.3 and the abave DCF can be

.,
Table 3.3. Dilution coefficients for prolonged tritium release into lakes (year/mS)
Lake Volume (mS): 107 108 109 1010 1011 1012
ACyear-1 )a t(year)b
6.6 E-2e 1 9. 68E-8 9.68E-9 9.68E-10 9.68E-ll 9. 68E-12 9. 68E-13
6.6 E-2 5 4.26E-7 4.26E-8 4.26E-9 4. 26E-10 4. 26E-ll 4.26E-12
6.6 E-2 20 1.11E-6 1.11E-7 1.11E-8 1.11E-9 1.11E-10 1. 11E-ll
0.156 1 9.26E-8 9.26E-9 9. 26E-10 9. 26E-ll 9.26E-12 9.26E-13
0.156 5 3.47E-7 3.47E-8 3.47E-9 3.47E-10 3. 47E-ll 3.47E-12 0.156 20 6. 13E-7 6. 13E-8 6. 13E-9 6. 13E-10 6. 13E-ll 6. 13E-12
0.056 1 6. 18E-8 6.18E-9 6. 18E-10 6. 18E-ll 6. 18E-12 6. 18E-13 -I'> ....,
0.056 5 9.42E-8 9.42E-9 9.42E-10 9.42E-ll 9.42E-12 9.42E-13
0.056 20 9.47E-8 9.47E-9 9.47E-10 9.47E-ll 9.47E-12 9.47E-13
5.06 1 1. 97E-8 1. 97E-9 1. 97E-10 1. 97E-ll 1. 97E-12 1. 97E-13
5.06 5 1. 98E-8 1. 98E-9 1. 98E-10 1. 98E-10 1. 98E-12 1. 98E-13
5.06 20 1. 98E-8 1. 98E-9 1. 98E-10 1. 98E-ll 1. 98E-12 1. 98E-13
10.06 1 9.94E-9 9. 94E-10 9. 94E-ll 9. 94E-12 9.94E-13 9.94E-14
10.06 5 9.94E-9 9.94E-10 9.94E-ll 9.94E-12 9.94E-13 9.94E-14
10.06 20 9.94E-9 9.94E-10 9.94E-11 9. 94E-12 9. 94E-13 9. 94E-14
a . ~ = (SH decay constant) + (lake water physlcal removal constant).
bt = duration of sH release.
eRead as 6.6 x 10⁻² .

48
employed to calculate dose. If such information is not available, or if a generi c study emp 1 oyi ng hypothet i ca 1 facil it i es and popul at ions is i nvo 1 ved, another approach to the problem of esti mati ng dose due to intake of drinking water may be necessary.
3.4.2 Atmospheric releases
When calculating dose to the maximally exposed individual, a number of conservative, or dose-maximizing, assumptions may be made to compensate for uncertainties in data and modeling. With respect to dose from tritium in drinking water, it might be conservatively assumed that the maximally exposed individual drinks water in which the ratio of tritium to hydrogen is the same as that for atmospheric moisture. Dose is then simply proportional to the concentration of tritium in atmospheric moisture (as estimated via a plume dispersion/depletion model) and to the quantity of drinking water ingested by an individual. The assumption of equal activity concentrations impl ies that; (1) the contents of the dri nki ng water reservoi r come entirely from 1 oca 1 atmospheri c moi sture as rain, and (2) this rain is at activity equilibrium with tritium in the atmospheric "plume" from the nearby tritium-releasing facility under study. Under such assumptions, the atmosphere/drinking water tritium dilution coefficient (ADDC - tritium activity concentration in atmospheric moisture + the tritium activity concentration in rainwater) would equal one. However, assumptions leading to an ADDC of one are unnecessarily conservative. A maximally exposed individual residing in, and deri vi ng sustenance from, an area typi ca lly 1000 - 2000 m from a tritium-releasing facility (Tennery et al., 1976; Tennery et al., 1978), will dri nk water not only from the contami nated plume, but also from noncontaminated clouds above the plume, and imported from uncontaminated sources. Estimates as to the di 1 ut i on of "plume" tri t i um due to washout by uncontaminated rainwater may be made using data from the Savannah River Laboratory, a facility regularly releasing significant quantities of 3HOH to the atmosphere.
Tadmor (1973) reports measured maximum concentrations of tritium in the atmosphere and in rainwater at the perimeter of the Savannah River
-,
49
Laboratory (SRL) as 6.8 x 10⁻⁹ and 1.8 x 10- 4 uCi/cm3 , respectively. The mai n SRL releases are assumed to occur at the center of the site, about 10 km from the perimeter. Using a mean absolute humidity value of 10.7 g/m3 for the SRL area (extracted from Fig. 3.1), the tritium concentration in atmospheric moisture for the SRL air concentration reported by Tadmor is:
~Ci cm3 1 m3 10-4 ~Ci 6.8 x 10⁻⁹ cruz x 1 X 10⁶ ~ x 10.7 g = 6.4 x g
(2.4 X 10⁻² kBq),
and the ratio of tritium concentration in atmospheri c moi sture to that in rainwater is
(6.4 X 10⁻⁴ ~Ci)/1.8 X 10-4 ~Ci x 1 cm3= 3 5 g ~ g .,
which we have defined as the AD DC (above).
Ashley et al. (1979) report equations describing average annual 3HOH concentrations in atmospheric and rainwater, based on observations at 31 monitoring stations at distances from 3 to 40 km from a "median" central release point on the SRL site (actual releases occur from at least seven locations on site). While a (statistically unverified) trend toward increased dilution with distance from the source is noted, the average ADDC calculated from the Ashley et al. report is 2.2 (range 1.7-2.8 for the 1975-77 results reported).
Section 4.5 of this report describes the impact of the ADDC on the estimated total-body dose to a maximally exposed individual, under a specific set of conditions. For ADDC's of up to approximately 35, ingestion of tritium via the drinking water pathway can contribute significantly to dose. It is clear that the choice of a tritium dilution coeffi ci ent value for a speci fi c envi ronmenta 1 assessment represents a potentially significant contribution to the error associated with overall estimated dose.

. "
, "
"
4. CALCULATION OF LOCAL DOSE - THE IMPACT OF TRITIUM-RELATED VARIABLES
H. R. Meyer, E. S. Bomar and V. J. Tennery
4.1 The Relative Importance of Tritium in Calculating Local Doses from Fuel Reprocessing
A portion of the Fast Reactor Safety Program has involved engineering and environmental analysis of routine releases of radionuc1ides from nuclear fuel cycle facilities. This research has been performed by members of ORNL's Health and Safety Research, Metals and Ceramics, and Chemi ca 1 Technology Di vi s ions. fwo studi es of the envi ronmenta 1 radi 0-
1 ogi ca 1 impact of reprocess i ng advanced fuels have been performed to date (Tennery et a1., 1976; Tennery et a1., 1978), using methodologies described in Sect. 4.2. In both cases, tritium contributed the majority of estimated dose to total body and most individual organs for the maximally exposed individual, with the assumption that no containment of tritium was employed at the reprocessing plants. In addition, tritium is consistently found to contribute a significant part of the dose from reprocessing of light water reactor fuel (Finney et a1., 1977) and high temperature gas-cooled reactor fuel (Davis et a1., 1976). Kaye and Till (1978) have pointed out the need for renewed consideration of tritium in nonpro1iferative fuel cycles. The importance of tritium with respect to radiological dose calculations is one of the driving forces behind the preparation of this document.
4.2 Baseline Case Methodology
This section considers the impact of tritium releases from a nuclear facility, focusing on doses to a hypothetical maximally exposed individual, and analyzing the effect of variations in several key parameters whi ch i nf1 uence cal cu1 ated radi 01 ogi ca 1 doses. In order to consider the impact of tritium releases for a representative situation, we have performed a number of calculations using the AIRDOS-EPA methodology (Moore et al., 1979) to estimate the environmental transport and uptake by man of a typical spectrum of radionuc1ides released from a hypothetical nuclear fuel reprocessing facility. A detailed discussion of the
51
52
methods involved in such a design effort, detailed estimates of the air
borne release rates (or source term) of the vari ous radi onuc I i des han
dled at the facility, and calculations of consequent environmental dis
persion and dose to man, are available in Tennery et al. (1978). A sum
mary of these procedures is presented here.
An analytical model for calculating repl'ocessing facility radio
logical impact requires several types of information: (1) reactor core
descript i on and fuel I oadi ng masses, i sotopi c compos i t i on of the fuel
charge, core neutronics, and fuel management data, including spent fuel
mass charged to the reprocessing plant; (2) spent fuel isotopic composi
tion; (3) flow sheets identifying the quantities of various isotopes
re I eased to the envi ronment duri ng reprocess i ng; and (4) meteorology,
population, and animal and food crop data for the facility's location.
Reactor fuel loading data were estimated for a 1200 MW(e) LMFBR
design reported by Combustion Engineering (Caspersson et a1., 1978).
The ORIGEN computer code (Bell, 1973) was used to calculate isotopic
distributions for spent fuel recycled to near equil ibrium. Spent fuel
was assumed to be stored for one year prior to reprocessing. The reac
tor plant was assumed to generate 1200 MW(e) for 511 full-power days,
operating 70% of the time, resulting in an annual core and blanket re
fueling fraction of 0.5. The radial blanket annual refueling fraction
was 0.2.
Conceptual flow diagrams were developed to estimate airborne radio
active releases during routine operation of the reprocessing facility
handling spent fuel from such reactors. Several guidelines were assumed
for the model facility: (1) the spent fuel had generated 50 GW(e)-years
of electricity at a burnup of 25,500 MW(thermal)'d/MT heavy metal and a
thermal/electric conversion efficiency of 35.5%; (2) feed to the repro
cessing plant was a blended mixture of the core and axial and radial
blankets; (3) radi onuc I ide confi nement factors (quantity of a radi onu
clide released to the atmosphere divided by the quantity of that isotope
processed) shown in Table 4.1 were identical to those used in earlier
studi es, i ncl udi ng an assumption of no confi nement of tritium at the
p I ant (Tennery et a 1., 1976; Tennery et a 1., 1978); (4) spent fuel
,.
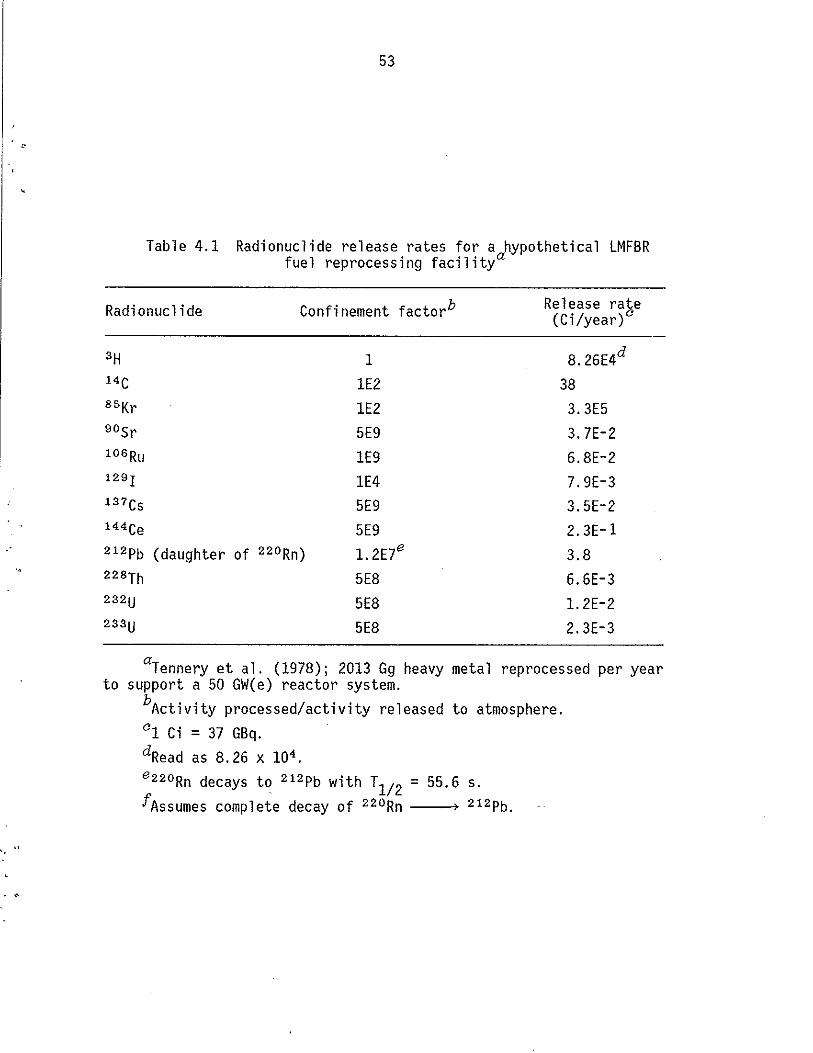
I ' ,
',.
53
Table 4,1 Radionuclide release rates for a hypothetical LMFBR fuel reprocessing facilitya
Radionuclide Confinement factor b
3H 1 14C 1E2 85Kr 1E2 90S r 5E9 106Ru 1E9 129r 1E4 137CS 5E9 144Ce 5E9 212Pb (daughter of 220Rn) 1. 2E7e
228Th 5E8 232U 5E8 233U 5E8
Release rate (Ci/year)o
8. 26E4d
38 3.3E5 3.7E-2 6.8E-2 7.9E-3 3.5E-2 2.3E-1 3.8 6.6E-3 1. 2E-2 2.3E-3
aTennery et al. (1978); 2013 Gg heavy metal reprocessed per year to support a 50 GW(e) reactor system.
bActivity processed/activity released to atmosphere. °1 Ci = 37 GBq. dRead as 8.26 x 10⁴. e220Rn decays to 212Pb with T1/2 = 55.6 s. fAssumes complete decay of 220Rn ) 212Pb.

54
contained 10% of the total tritium generated at the reactors (NCRP, 1979a); (5) 0.69% of the fuel cladding (stainless steel) was dissolved , during reprocessing; and (6) the fuel's nitrogen impurity (principal source of 14C) was 300 ppm. Based on these assumptions, release rates for the 12 radionuclides contributing significantly to dose were calcu-lated and are listed in Table 4.1. These radionuclides are assumed to be released on a routine basis from a 100-m stack.
The radiological impact to man resulting from operation of the model reprocessing plant is assessed by calculating the dose, in millirems*, to a maximally exposed individual residing 1 km from the facility. Radionuc1ides released to the atmosphere reach man through one or more pathways (air, soil, or water), with varying degrees of transfer by food, animals, and crops. Pathways of human exposure include inhalation, ingestion, immersion in air, land surface contamination (exposure to y or ~ emitters depositing on land surfaces), and submersion in water (swimming). Ultimately, energy is deposited in human tissue by decay of the radionuclides, via internal (a, y, ~) or external (y, ~) exposure.
Radiological impact is routinely assessed as the 50-year dose commitment resulting from one year's operation of a facility. For certain radionuc1ides which are retained for long periods in bone, (e.g., 232U, 233U) dose from one year's exposure wi 11 continue to accrue, at a declining rate, for the lifetime of an individual (Till et al., in press). For many radionuc1ides, including tritium, essentially all of the 50-year dose commitment wi 11 accrue duri ng the fi rst year after exposure. Dose commitments are calculated using implementations of various metabo li c models as di scussed in Moore et a 1. (1979), Ki 11 ough et a l. (1978), Dunning et a1. (1979), and Kocher (1979).
Utilizing the radionuclide source term and dose estimation methodologies described above, it is possible to determine the sensitivity of the estimated dose to vari ati on of several key parameters related to trit i um production and envi ronmenta 1 transport. The parameters to be analyzed in detail in the remainder of this section are: (1) the
*1 mil1irem = 10 ~Sv.
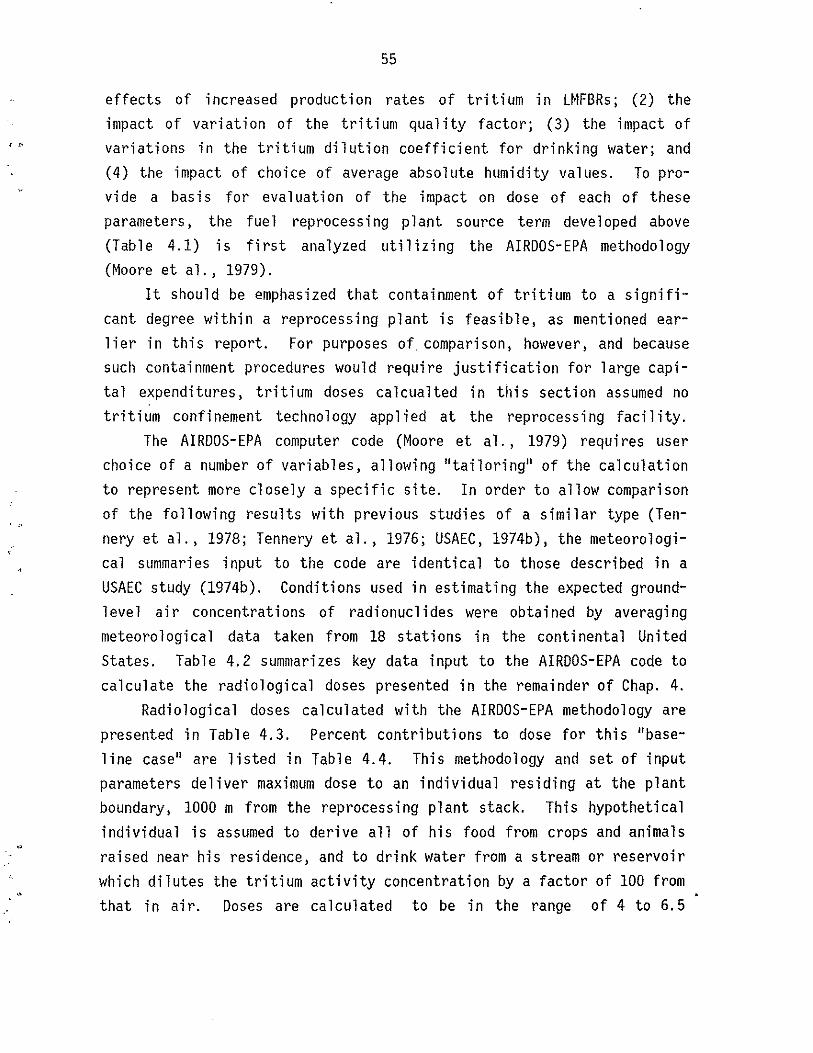
I '"
, "
55
effects of increased production rates of tri t i urn in LMFBRs; (2) the
impact of variation of the tritium quality factor; (3) the impact of
vari at ions in the tri t i urn di 1 ut ion coeffi ci ent for dri nki ng water; and
(4) the impact of choice of average absolute humidity values. To pro
vi de a bas is for eva 1 uat i on of the impact on dose of each of these
parameters, the fue 1 reprocess i ng plant source term deve loped above
(Table 4.1) is first analyzed utilizing the AIRDDS-EPA methodology
(Moore et al., 1979).
It should be emphasized that containment of tritium to a signifi
cant degree within a reprocessing plant is feasible, as mentioned ear
l i er in thi s report. For purposes of compari son, however, and because
such containment procedures would require justification for large capi
tal expenditures, tritium doses calcualted in this section assumed no
tri t i urn confi nement technology app 1 i ed at the reprocess i ng facil i ty.
The AIRDDS-EPA computer code (Moore et al., 1979) requires user
choice of a number of variables, allowing "tailoring" of the calculation
to represent more closely a specific site. In order to allow comparison
of the following results with previous studies of a similar type (Ten
nery et al., 1978; Tennery et al., 1976; USAEC, 1974b), the meteorologi
ca 1 summari es input to the code are i dent i ca 1 to those descri bed ina
USAEC study (1974b). Conditions used in estimating the expected ground
level air concentrations of radionucl ides were obtained by averaging
meteoro 1 ogi ca 1 data taken from 18 stations in the conti nenta 1 United
States. Table 4.2 summarizes key data input to the AIRDOS-EPA code to
calculate the radiological doses presented in the remainder of Chap. 4.
Radi 0 1 ogi ca 1 doses cal cul ated wi th the AIRDOS-EPA methodology are
presented in Table 4.3. Percent contributions to dose for this "base
line case" are listed in Table 4.4. This methodology and set of input
parameters deliver maximum dose to an individual residing at the plant
boundary, 1000 m from the reprocess i ng plant stack. Thi s hypothet i ca 1
individual is assumed to derive all of his food from crops and animals
raised near his residence, and to drink water from a stream or reservoir
which dilutes the tritium activity concentration by a factor of 100 from
that in air. Doses are calculated to be in the range of 4 to 6.5

56
Table 4.2 Selected parameters input to the AIRDOS-EPA computer codea
Parameter
Average air temperature Rai nfa 11 rate Stack hei ght b
Effluent velocityc Tritium deposition velocityC Tritium scavenging coefficient
a Moore et al. (1979).
Value
286. 10 K
0.762 m/y 100 m 20 m/s
1. a x 10-3 m/s 1.6 x 10- 5/s
bHeight of reprocessing plant stack discharging process air to atmosphere.
cCoefficients influencing rate of removal of tritium from an airborne plume as it moves downwind.
"

"
; ~
57
Table 4.3 Baseline case: 50-year dose commitment a to maximally exposed individual (no tritium confinement)
Dose (mi 11 i reml) Radionuclide
Total body Bone Lungs Thyroid G1 tract
3H-foodo 2.7 2.7 2.7 2.7 2.7 3H-waterO 0.02 0.02 0.02 0.02 0.02 3H-inhalationo 0.44 0.34 0.44 0.43 0.47 3H-subtotal 3.16 3.06 3.16 3.15 3.19
14C 0.24 0.38 0.10 0.11 0.18 85Kr 0.02 0.03 0.04 0.02 0.02 90Sr 0.10 0.90 0.00 0.01 0.08 106Ru 0.02 0.02 0.02 0.02 0.23 129 1 0.00 0.00 0.00 1.2 0.00 137CS 0.20 0.27 0.17 0.19 0.13 144Ce 0.01 0.01 0.03 0.00 0.66 220Rnd 0.03 0.05 0.20 0.02 0.02 228Th 0.03 0.52 0.10 0.00 0.02 232U 0.06 0.83 0.23 0.01 0.02 208Tle 0.15 0.17 0.14 0.17 0.13 212Bi e 0.03 0.03 0.02 0.02 0.02 216 po e 0.01 0.23 0.00 0.00 0.10 224Rae 0.00 0.01 0.00 0.00 0.00 233U 0.00 0.00 0.03 0.00 0.00
Total 4.03 6.49 4.23 4.89 4.77
aFrom one year's operation of l'eprocess i ng facil i ty; 2013 Gg heavy metal/year throughput.
hI millirem = 10 mSv. °Dose from 3H exposure modes: food intake, drinking water (dilution
coefficient = 100), inhalation. d Dose from 220Rn daughters.
eBuilt-up on ground surfaces from decay of parent nuclides.
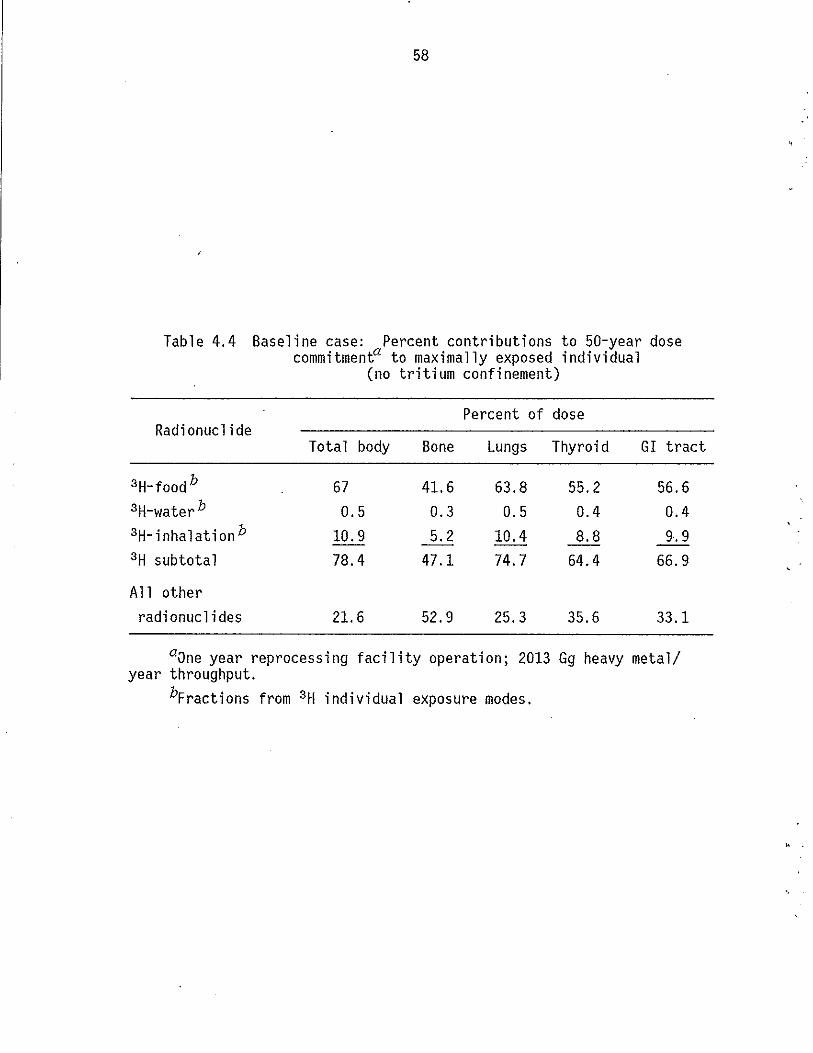
58
Table 4.4 Baseline case: Percent contributions to 50-year dose commitmenta to maximally exposed individual
Radionuclide
3H-food b
3H-water b
3H- i nha 1 at ion b
3H subtotal
All other radionuclides
(no tritium confinement)
Percent of dose
Total body Bone Lungs Thyroi d
67 41. 6 63.8 55.2 0.5 0.3 0.5 0.4
10.9 5.2 10.4 8.8 78.4 47.1 74.7 64.4
21. 6 52.9 25.3 35.6
GI tract
56.6 0.4 9.9
66.9
33.1
aOne year reprocessing facility operation; 2013 Gg heavy metal/ year throughput.
bFractions from 3H individual exposure modes.
. .

..
59
millirem (40 to 65 ~Sv), with 47 to 78% of the total radiological dose to a specific organ due to intake of tritium.
4.3 Analysis of the Impact of Potentially Increased Tritium Production Rates in LMFBR Fuels
4.3.1 Revised ternary fission yield data for fast reactor fuels
One reason for renewed emphasi s on tri t i um is the important data pub 1 i shed by Buzzelli et a 1. (1976), i nvo 1 vi ng provi si ona 1 experimental va 1 ues for the ternary fast fi ss i on yi e 1 din the EBR- II reactor of the fert i 1 e isotopes 232U and 238U, i ndi cat i ng increased tri t i um yi e 1 ds. Prior to these data, no fast fission tritium yields for these species had been determi ned experimentally. Addi tiona 11y, Buzzell i and Langer (1977) reported new information on the tritium yield from fast fission of 233U, 235U, and 239PU. Assessments of tritium production, transport, and release from fast breeder reactors have until recently been based on estimates of yield, because of lack of experimental data concerning ternary fast fission tritium yield of the two primary fissile materials, 23SU and 239PU. We have summarized the most recent findings of Buzzelli and Langer in Table 4.5. The yield for tritium from ternary fission of 233U, 238U, and 239Th in a fast spectrum is much higher than the values listed for the ENDF/BIV (1974) library which have been used in previous radiological assessments investigating advanced uranium-plutonium fast breeder reactor fuels (Tennery et al., 1976; Tennery et al., 1978). Buzze 11 i and Langer (1977) emphas i ze the pre 1 imi nary nature of thei r observations and the need for further studies. Additional EBR-II samp 1 es wi 11 be analyzed under the Oak Ri dge Nati ona 1 Laboratory (ORNL) Fast Reactor Safety Program.
The significance of these relatively high, ternary-fast-fissionyi e 1 d values can be evaluated in terms of the amount of tritium that could ultimately be released to the environment. Table 4.6 lists estimated source terms for tritium released to the atmosphere during repro~ cessing of spent (U, Pu) carbide and (Th, U) carbide fuels using fission yields from the ENDF/BIV (1974) library and the experimental values
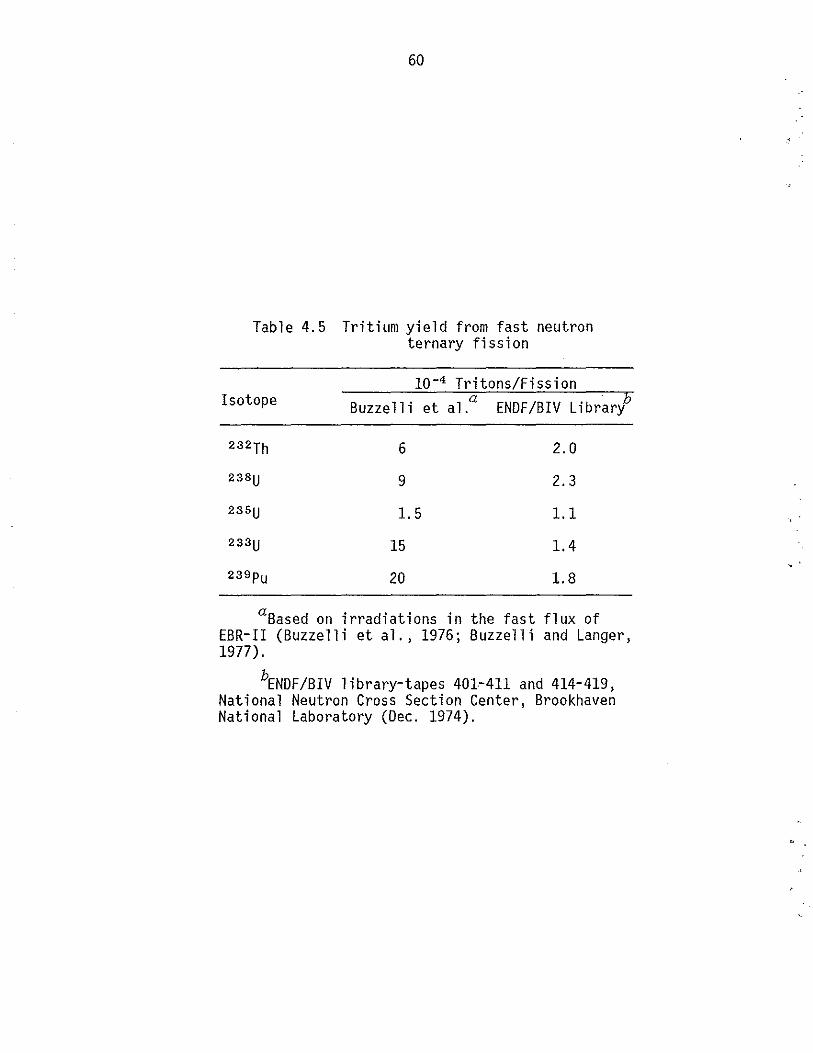
60
Table 4.5 Tritium yield from fast neutron ternary fission
10-4 Tritons/Fission Isotope Buzzelli et al.
a . b ENDF/BIV Library
232Th 6 2.0
238U 9 2.3
235U 1.5 1.1
233U 15 1.4
239pU 20 1.8
aBased on irradiations in the fast flux of EBR-II (Buzzelli et al., 1976; Buzzelli and Langer, 1977).
bENDF/BIV 1 ibrary-tapes 401-411 and 414-419, National Neutron Cross Section Center, Brookhaven National Laboratory (Dec. 1974).
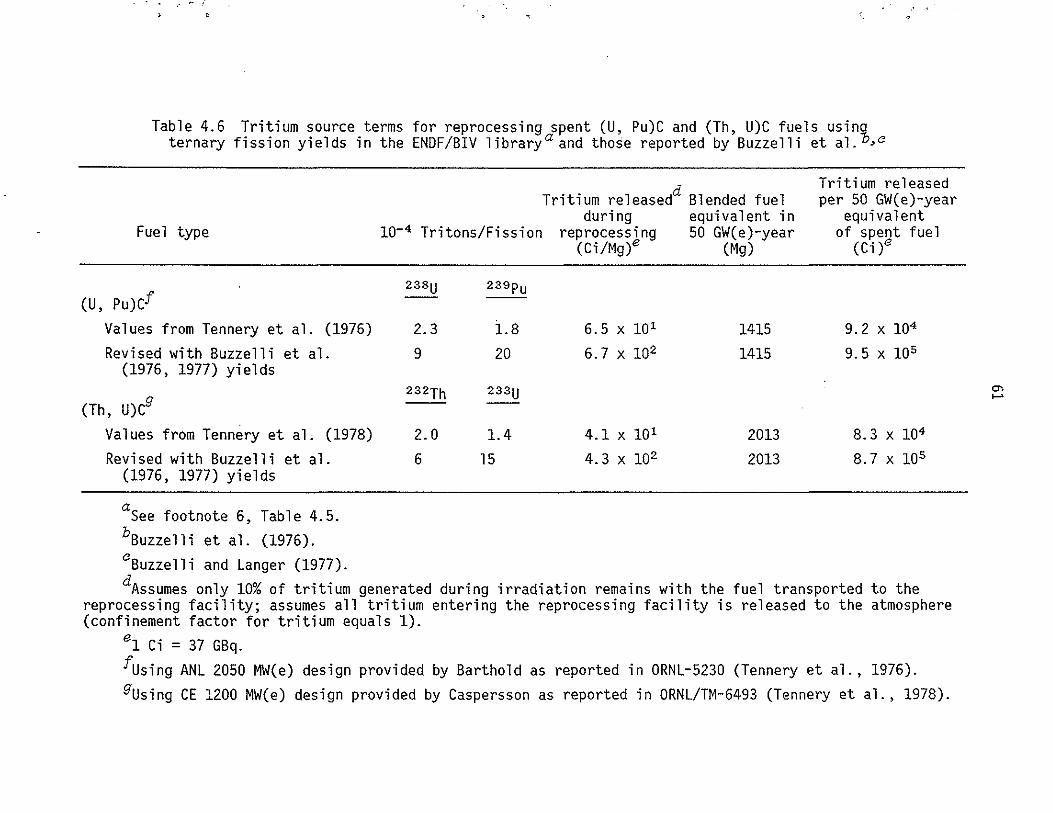
Table 4.6 Tritium source terms for reprocessing spent (U, Pu)C and (Th, U)C fuels usin% ternary fission yields in the ENDF/BIV librarya and those reported by Buzzelli et al. ,C
Fuel type
(U, Pu)Cf Values from Tennery et al. (1976) Revised with Buzzelli et al.
(1976, 1977) yields
(Th, U)Cg
Values from Tennery et al. (1978) Revised with Buzzelli et al.
(1976, 1977) yields
a See footnote 6, Table 4.5. bBuzzelli et al. (1976). cBuzzelli and Langer (1977).
10-4 Tritons/Fission
238U 239pu --
2.3 1.8 9 20
232Th 233U
2.0 1.4 6 15
Tritium releasedd Blended fuel Tritium released per 50 GW(e)-year
during equivalent in equivalent reprocessing 50 GW(e)-year of spent fuel
(Ci/Mg)e (Mg) (Ci)e
6.5 x 10 1 1415 9.2 x 10⁴
6.7 X 10² 1415 9.5 x 10⁵
4.1 x 101 2013 8.3 x 10⁴
4.3 x 10² 2013 8.7 x 10⁵
dAssumes only 10% of tritium generated during irradiation remains with the fuel transported to the reprocessing facility; assumes all tritium entering the reprocessing facility is released to the atmosphere (confinement factor for tritium equals 1).
e1 Ci = 37 GBq.
fusing ANL 2050 MW(e) design provided by Barthold as reported in ORNL-5230 (Tennery et al., 1976). gUsing CE 1200 MW(e) design provided by Caspersson as reported in ORNL/TM-6493 (Tennery et al., 1978).
0-.....
62
reported by Buzzell i et al. (1976), and Buzzell i and Langer (1977). These data i ndi cate an increase in the production rate of tri t i urn of approximately one order of magnitude.
4.3.2 Impact on dose of increased tritium production rates
All else being equal, increased production rates as discussed above woul d be di rect ly refl ected in increased tri t i urn release rates at an LMFBR-fuel reprocessing facility, resulting in increased estimated radi 0 1 ogi ca 1 doses to exposed i ndi vi dua 1 s. Whil e verifi cat i on of the initial results of Buzzelli et al. is necessary prior to final evaluation of the consequences of such increased tritium production rates, it is of interest to provide initial estimates for planning purposes. To allow comparison to the data presented in Tables 4.3 and 4.4, the reprocessing facility radionuclide source term listed in Table 4.1 is again used as input to the AIRDOS-EPA code, holding all input variables constant with the exception of the tritium source term component. A range of tritium release rates, from 1.6 x 10⁵ Ci/year (5.9 x 10⁶ GBq/year) to 8.7 X 10⁵ Ci/year (3.2 x 10⁷ GBq/year) from the Buzzelli and Langer (1977) data was chosen for these calculations. Table 4.7 lists estimated doses to a maximally exposed individual from exposure to routine releases of a nuclear fuel reprocessing plant as described earl ier in this chapter. Table 4.8 lists percent contribution of tritium to total dose for the reprocessing plant releases as a function of increasing tritium release rates. Baseline case data are also included in Table 4.8 to facilitate comparison of the effects of the four tritium release rates (baseline source term plus the three new source term values) cons i dered.
It is apparent from this analysis that potential increased production of tritium in fast breeder reactors leads to parallel increases in reprocessing facility dose estimates. If a federal radiation protection standard such as the EPA's 40 CFR 190 (USEPA, 1977) were applied to the LMFBR fuel cycl e (thi s standard app 1 i es on ly to 1 i ght water reactor systems), Case III (Table 4.7) doses would exceed the 25 millirem (250

63
Table 4.7 The radiological impact of increased tritium production rates: 50-year dose commitmenta to a maximally exposed individual
(no tritium confinement)
, Radionuclide Dose (mi 11 i remb)
Total body Bone Lungs Thyroi d GI tract
CASE I 3H re 1 ease rate: 1.6 x 10⁵ Ci~earO
3H-food 5.21 5.21 5.21 5.21 5.21 3H-waterd 0.05 0.05 0.05 0.05 0.05 3H-inhalationd 0.85 0.67 0.85 0.84 0.90
3H Subtotal 6.11 5.93 6.11 6.10 6.16 All other
radionuclides .90 3.46 1.1Ci 1.77 1. 61 Total 7.01 9.39 7.21 7.87 7.77
CASE II 3H release rate: 4.0 x 10⁵ Ci/yearO
3H-food 13.04 13.04 13.04 13.04 13.04 3H-water 0.12 0.12 0.12 0.12 0.12 3H-inhalation 2.12 1. 67 2.12 2.10 2.25
3H Subtotal 15.28 14.83 15.28 15.26 15.41 All other
radi onuc 1 ides 0.89 3.45 1. 09 1. 76 1.61 -- -- --Total 16.05 18.28 16.37 17.02 17.02
CASE III 3H release rate: 8.7 x 10⁵ Ci/yearO
3H-food 28.35 28.35 28.35 28.35 28.35 3H-water 0.26 0.26 0.26 0.26 0.26 3H-inhalation 4.61 3.63 4.61 4.57 4.90
3H Subtotal 33.22 32.24 33.22 33.18 33.51 All other
radionuclides 0.90 3.46 1.10 1. 76 1. 61 -- -- --Total 34.12 35.70 34.32 34.94 35.12
aFrom one year's operation of reprocessing facility. b1 millirem = 10 mSv. °1 Ci = 37 GBq. dDose from tritium exposure modes: food ingestion, drinking water
intake, inhalation.

64
Table 4.8 The impact on dose of increased tritium production rates: percent contribution to dosea to a maximally
exposed individual (no tritium confinement)
Radionuclide Percent of dose Total body Bone Lungs Thyroid GI tract
CASE I 3H release rate: b 1.6 x 10⁵ Ci/year
3H A 11 other radionuclides
CASE II
•
3H release rate: b 4.0 x 10⁵ Ci/year
3H All other radionuclides
CASE III
3H release rate: b 8.7 x 10⁵ Ci/year
3H
All other radionuclides
BASELINE CASE (FROM TABLE 4.1)
3H re 1 ease rate: 8.26 x 10⁴ Ci/year b
3H All other radionuclides
87 63
13 27
95 81
5 19
97 90
3 10
78 47
22 53
a From one year's facility operation. b1 Ci :: 37 GBq.
85 78 79
15 22 21
93 90 91
7 10 9
97 96 95
3 4 5
75 64 67
25 36 33

,.
,.
65
!1Sv) 1 i mi t for tota 1 body, bone, 1 ungs, and GI tract [under thi s standard, the allowable dose to thyroid is 75 millirem (750 !1Sv)], implying the need to utili ze tri t i urn confi nement technology to ensure comp 1 i ance.
4.4 Impact on Dose of an Increase in the Tritium Quality Factor
Sect ion 3.1 of thi s report analyzes recent data pertai ni ng to the relative biological effectiveness of tritium beta particles, with respect to reference 250 kVp x-radiation. While currently available data do not allow us to make a firm recommendation regarding choice of tritium quality factor, it appears that a conservative approach to calculation of radiological dose implies the use of a quality factor of 1.7, as opposed to the currently recommended value of 1.0 (NCRP, 1979b). Given this possibility, it is of interest to analyze the impact on estimated dose of such a modification. For purposes of comparison, the data presented in Tables 4.3 and 4.4 ("baseline" data), developed from the fuel reprocessing plant radionuclide source term listed in Table 4.1, are modifi ed to refl ect the increased dose commi tments associ ated with the higher quality factor value. Table 4.9 presents incl'eased dose commitments to a maximally exposed individual under such modified conditions. These increases range from 33 to 55%, indicating that the impact of such a modification is significant with respect to compliance with regulatory standards.
4.5 Impact on Dose of Variations in the Drinking Water Dilution Coefficient
Section 3.4 of this report presents data defining a rartge of tritium dil ut ion coeffi ci ents in dri nki ng water. These coeffi ci ents can be appl ied on a site-specific basis to estimate dose from drinking water contami nated by tri t i urn released i ni t i ally to the atmosphere or to streams and rivers flowing into reservoirs and lakes. In this section, we use the AIRDOS-EPA methodology to analyze the impact on radiological dose of vari at ions in the atmosphere/dri nki ng water tritium dil ut ion coefficient (ADDC = tritium activity concentration in atmospheric

66
<
Table 4.9. The impact on dose of an increase in the tritium quality factor: 50-year dose commitment to a maximally exposed
individual a (no tritium confinement)
Radionuclide Dose (mill i rem b)
Total body Bone Lungs Thyroid GI tract
Q = 1. 70
3H-food d 4.6 4.6 4.6 4.6 4.6 3H-water d 0.03 0.03 0.03 0.03 0.03 3H- i nha 1 at ion d 0.75 0.58 0.75 0.73 0.80
3H Subtotal 5.38 5.21 5.38 5.36 5.43 All other radionuclides 0.90 3.45 1. 08 1.77 1. 61
Tritium contri-bution total dose 86% 60% 83% 75% 77%
Q = 1 0
3H-food d 2.7 2.7 2.7 2.7 2.7 3H-water d 0.02 0.02 0.02 0.02 0.02 3H-inhalation d 0.44 0.34 0.44 0.43 0.47
3H Subtotal 3.16 3.06 3.16 3.15 3.19 All other
radionuclides 0.90 3.45 1. 08 1.77 1. 61 Tritium contri-bution total dose 78% 47% 75% 64% 67%
Total dose increase due to 3H ~uality factor increase 55% 33% 52% 45% 47%
a From one year's reprocessing facility operation (Baseline case -see Table 4.4).
b 1 mi 11 i rem = 10 mSv. ,
o Q = quality factor. dDoses from tritium exposure modes.
"
.'
67
moisture.;. tritium activity concentration in rainwater), over a range
between 1 (no dilution, i.e., tritium in drinking water at the same
activity concentration as in the atmosphere) and 100. As in previous
analyses in this chapter, data from Tables 4.1, 4.3, and 4.4 form the
basis for the comparisons.
Table 4.10 presents data for four dilution coefficients: 1, 10, 35
and 100. A factor of 100 is commonly used as a "defaul t value" in
AIRDOS-EPA computer code cal cul at ions; the "basel i ne" dose estimates
(Tables 4.3 and 4.4) incorporate this dilution coefficient, and are
listed as "Case IV" in Table 4.10. For the specific conditions of
methodo logy and radi onuc 1 i de source term used in these cal cul at ions,
choice of a tritium dilution factor larger than approximately 35 results
in no significant change in estimated dose. At the level of dilution
(100) commonly used in AIRDOS-EPA analyses, the contribution to dose of
tritium in drinking water is small, of the order of 0.5%. Only in cir
cumstances in which site-specific conditions indicate use of a dilution
coefficient of less than 35 will the drinking water pathway contribute
greatly to dose, under the conditions stated.
4.6 Impact on Dose of Variations in Average Absolute Humidity
Data presented in Sect. 3.3 indicate that average absolute humidity
values over the United States range from 3-16.5 g/m3, A default value
of 8 g/m3 (based on average growing season absolute humidity values) is
often used in radiological dose calculations to estimate dose resulting
from routine operations of nuclear facilities (Moore et al., 1979;
USNRC, 1977). Using the methodologies discussed in this section, and
the reprocessing plant data from Table 4.1, we estimate the impact on
dose of the use of absolute humi dity values other than 8 g/m3. Table
4.11 lists dose commitments, to a maximally exposed individual, for
absolute humidity values of 4, 8, and 16 g/m3 • The dose estimates using
8 g/m3 are taken from Table 4.3. Variation of absolute humidity over
the given range results in variations in estimated total dose of up to
78%. It is apparent from these data that choice of site-specific
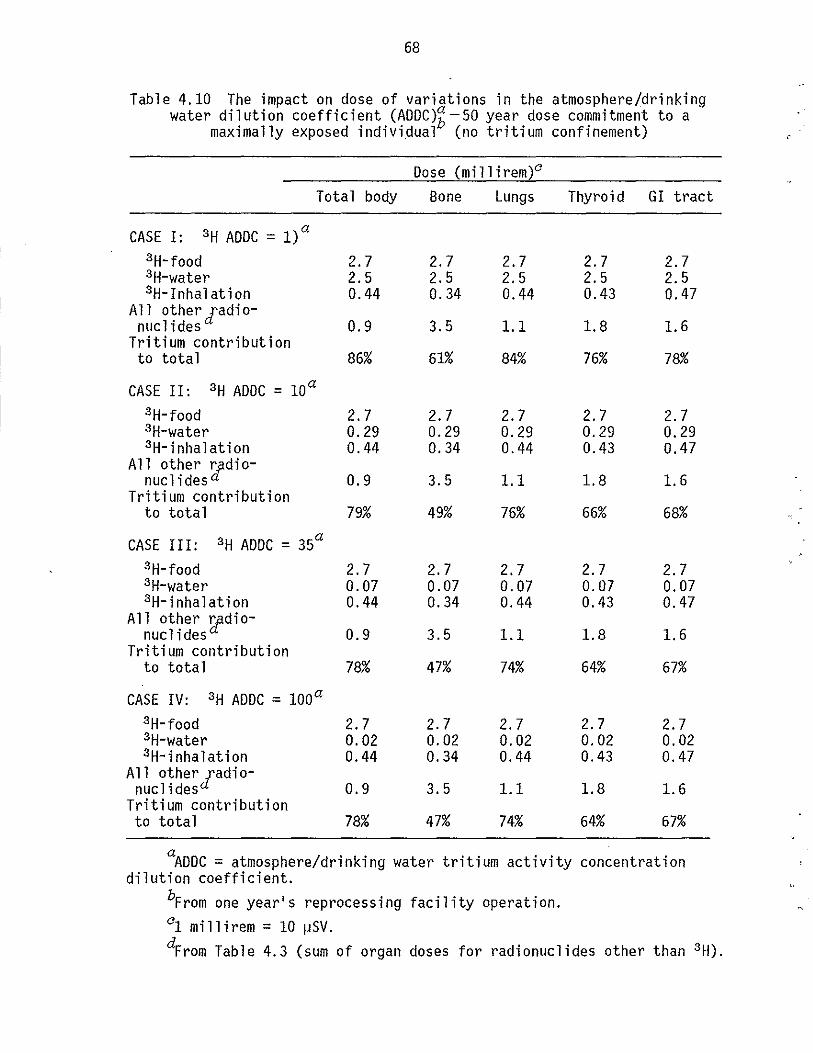
68
Table 4.10 The impact on dose of variations in the atmosphere/drinking water di 1 uti on coeffi ci ent (AOOC)b - so year dose commi tment to a
maximally exposed individual (no tritium confinement)
Total body
CASE I: 3H AOOC = l)a 3H-food 3H-water 3H-Inha1ation
A 11 other Jadi 0-nuclides
Tritium contribution to total
CASE II: 3H AOOC = lOa 3H-food 3H-water 3H-inha1ation
All other r<ldionuc1 ides d
Tritium contribution to total
CASE III: 3H AOOC = 3Sa
3H-food 3H-water 3H-inha1ation
A 11 other l'fdi 0-nuclides
Tritium contribution to total
CASE IV: 3H AOOC = 100a
3H-food 3H-water 3H-inha1ation
A 11 other fadi 0-
nuc1 idesd Tritium contribution to total
2.7 2.S 0.44
0.9
86%
2.7 0.29 0.44
0.9
79%
2.7 0.07 0.44
0.9
78%
2.7 0.02 0.44
0.9
78%
Dose (mi11irem)0 Bone
2.7 2.S 0.34
3.5
61%
2.7 0.29 0.34
3.5
49%
2.7 0.07 0.34
3.5
47%
2.7 0.02 0.34
3.5
47%
Lungs
2.7 2.5 0.44
1.1
84%
2.7 0.29 0.44
1.1
76%
2.7 0.07 0.44
1.1
74%
2.7 0.02 0.44
1.1
74%
Thyroid GI tract
2.7 2.S 0.43
1.8
76%
2.7 0.29 0.43
1.8
66%
2.7 0.07 0.43
1.8
64%
2.7 0.02 0.43
1.8
64%
2.7 2.5 0.47
1.6
78%
2.7 0.29 0.47
1.6
68%
2.7 0.07 0.47
1.6
67%
2.7 0.02 0.47
1.6
67%
aAOOC = atmosphere/drinking water tritium activity concentration dilution coefficient.
bFrom one year's reprocessing facility operation. 01 mi11irem = 10 ~SV.
dFrom Table 4.3 (sum of organ doses for radionuc1ides other than 3H).

69
Table 4.11 The impact of variations in average absolute humidity: 50-year dose commitment to a maximally exposed individual a
, , (no tritium confinement)
Dose (mi 11 i rem) b
Total body Bone Lungs Thyroi d GI tract
Absolute humidity 4 91m3
3H-food 5.4 5.4 5.4 5.4 5.4 3H-water 0.04 0.04 0.04 0.04 0.04 3H-inhalation 0.88 0.68 0.88 0.86 0.96
3H Subtotal 6.32 6.12 6.32 6.30 6.38 A 11 other radi 0-
nuclidesc 0.9 3.45 1. 08 1.77 1. 61 3H contribution to total dose 88% 64% 85% 78% 80%
Absolute humidity 8 91m3
3H-food 2.7 2.7 2.7 2.7 2.7 3H-water 0.02 0.02 0.02 0.02 0.02 3H-inhalation 0.44 0.34 0.44 0.43 0.47
3H Subtotal 3.16 3.06 3.16 3.15 3.19 A 11 other radi 0-
nucl i des c 0.9 3.45 1. 08 1.77 1. 61 3H contribution to total dose 78% 47% 74% 64% 67%
Absolute humidity 16 g/m3
3H-food 1. 35 1. 35 1. 35 1. 35 1. 35 3H-water 0.01 0.01 0.01 0.01 0.01 3H-inhalation 0.22 0.17 0.22 0.22 0.23
3H Subtotal 1. 58 1. 53 1.58 1.58 1. 59 All other radio-nucl i desc 0.9 3.45 1. 08 1.77 1. 61
3H contribution to total dose 64% 31% 59% 47% 50%
aFrom one year's facility operation. b1 millirem = 10 ~Sv. cFrom Table 4.3.

70
average absolute humidity data can have a significant impact on estimated dose commitments.
4.7 Summary of the Impact of Tritium-Related Variables on Dose
Data presented in this chapter indicate the relative importance of several key parameters which should be considered during the estimation of dose for a facility releasing large quantities of tritium. It is important to recognize that the variables discussed individually in the section could interact in a mUltiplicative fashion. The possibility of encountering such cases, with associated high estimated tritium doses, emphasizes the need for careful choice of data or default values utilized in a particular radiological dose assessment. Many of the observations made in this chapter will apply with similar force to a light water reactor fuel cycle involving fuel reprocessing.
. .

,
.. ,
5. CALCULATION OF THE GLOBAL DOSE
G. G. Killough, John E. Till, Elizabeth L. Etnier, C. C. Travis, R. D. Gentry and H. R. Meyer
5.1 Scenarios for the Release of Tritium to the Environment by Man
5.1.1 Consumer products
Limited data exist on the historical use of tritium in consumer
products (Sect. 1.2.2). For this report, data regarding the distribu
tion of light sources using tritium in sealed glass tubes in the United
States for the peri od 1976 to 1979 were taken from USNRC 1 i cens i ng
files; estimates for the U. S. luminous compound industry were derived
from the same fi 1 es. Krejci and Zeller (1979) estimated Swi ss use of
tritium in the watch industry. Taylor and Webb (1978) made an estimate
for the quantity of tritium used in luminous watches in the United King
dom (U.K.), although no estimates for back-lit watches are available.
Making certain licensing assumptions, Wehner (1979) estimated tritium
use rates in the Federal Republic of Germany (FRG) for self-luminous
wristwatches. Table 5.1 summarizes the above estimates.
The lifetime of a consumer product may be divided into 5 stages:
product ion, di stri but ion, use, repai r, and di sposa 1. Assumi ng reason
ab 1 e controls, 1 itt 1 e tri t i um is released to the atmosphere duri ng nor
mal production, distribution and use (McDowell-Boyer and O'Donnell,
1978b). The critical stage when considering global releases appears to
be di sposa 1.
In order to estimate a global source term, several assumptions have
been made regardi ng the use and di sposa 1 of wri stwatches contai ni ng
tritium. First of all, it is assumed that production rates of back-lit
watches will remain constant from 1980 through 2020. Second, we assume
that the average lifetime of a watch is 5 years. Finally, it is assumed
that the ultimate disposal of all watches will be by burial in landfills
or by incineration. Products buried in landfills are assumed to contain
the enclosed tritium for its effective lifetime; however, incineration
71
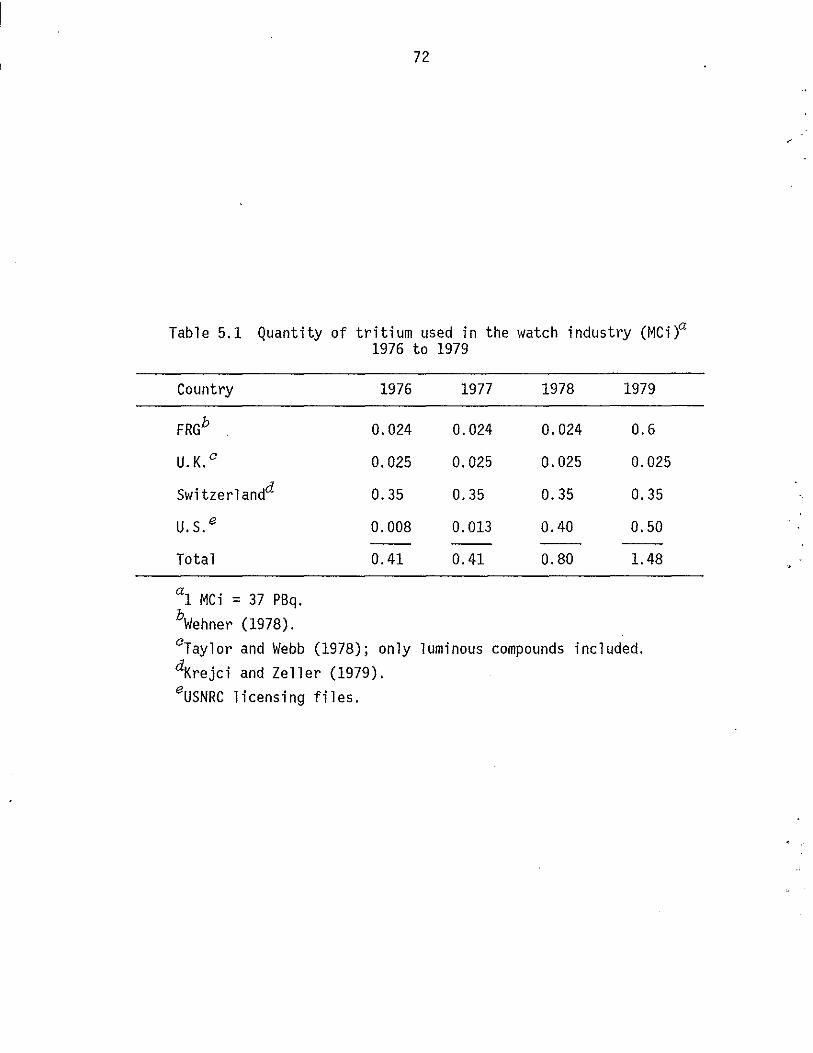
72
Table 5.1 Quantity of tritium used in the watch industry (MCi)a 1976 to 1979
country 1976 1977 1978 1979
FRGb 0.024 0.024 0.024 0.6
U.K.c 0.025 0.025 0.025 0.025
Switzerlandd 0.35 0.35 0.35 0.35
U.S. e 0.008 0.013 0.40 0.50 -- --
Total 0.41 0.41 0.80 1. 48
a1 MCi = 37 PBq. b Wehner (1978). CTaylor and Webb (1978); only luminous compounds included. dKrejci and Zeller (1979). eUSNRC licensing files.

. ,
73
would release all of the tritium, oxidized to 3HOH, to the atmosphere. We assume that 50% of all discarded watches will be incinerated (McDowell-Boyer and O'Donnell, 1978b). Table 5.2 lists the quantity of tritium projected to be released worldwide to the atmosphere under these assumptions.
5.1.2 World nuclear power industry
The projection for nuc 1 ear energy growth was di vi ded into two periods, the first period ·covering the 12 years from 1975 through 1986 and the second extendi ng from 1987 to 2020. Nucl ear energy growth during the first period is relatively easy to predict because nuclear plants that will be operating during this time either have already been completed, are currently under construction, or are scheduled for construction. Data for this period were taken from recently published 1 i st i ngs (USERDA, 1976b; Kee et a 1., 1976; IAEA, 1975; AIF, 1976). Included in the listings are descriptions of reactor type, generating capacity, date of availability, and location by country.
The forecast for nucl ear growth beyond 1986 incorporates assumpt ions and data pub 1 i shed by the Organi zat i on for Economi c Cooperation and Development and the International Atomic Energy Agency (DECO, 1975), and by Hanrahan et a 1. (1976). Project ions in our study also i ncorporate estimates of the contribution from Eastern Bloc countries and China, based on data suppl ied by the Energy Research and Development Administration (USERDA, 1975).
5.1. 2.1 Reactor types and fuel reprocess i ng. The types of reactors considered in this study include pressurized-water reactors (PWR), boil i ng-water reactors (BWR) , water-cooled graphi te-moderated reactors (GMR), fast breeder reactors (FBR), high-temperature gas-cooled reactors (HTGR), and other reactors not included in these categories (e.g., ad-vanced gas reactors and heavy-water-moderated reactors). light-water-cooled reactors (LWR) constructed after 1986, assumed to be PWRs and 35% BWRs.
Among the 65% are
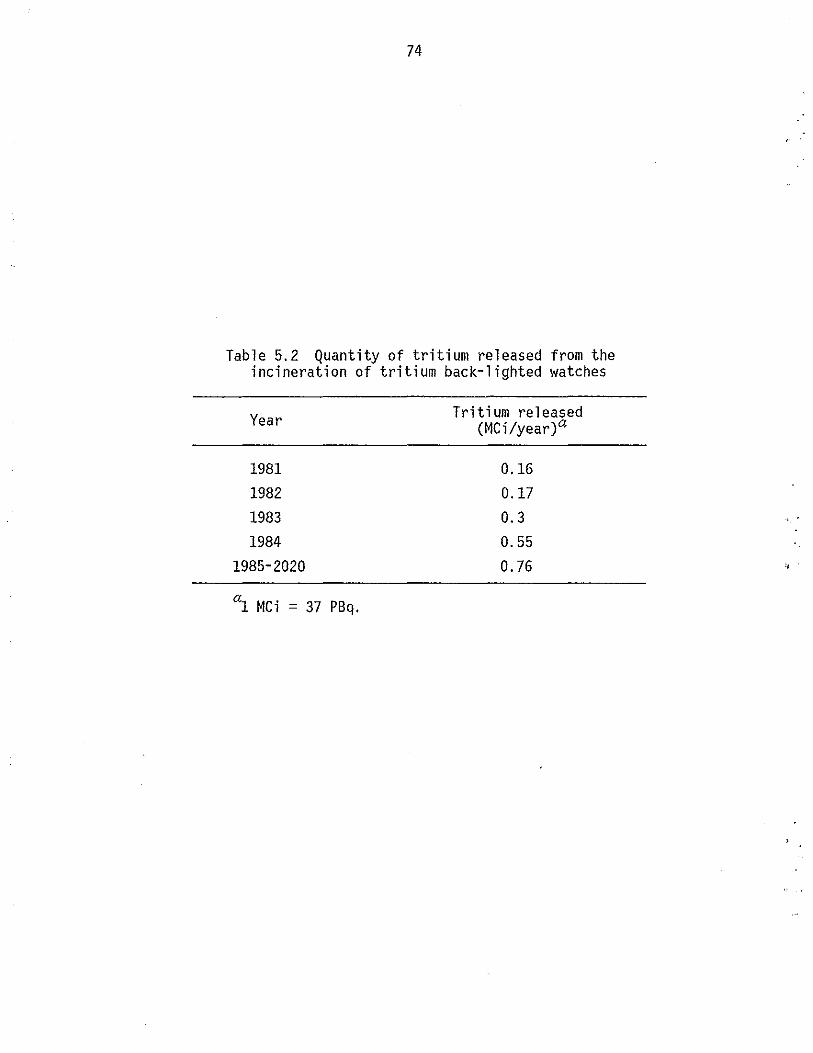
74
Table 5.2 Quantity of tritium released from the incineration of tritium back-lighted watches
Year Tritium released (MCi/year)a
1981 0.16 1982 0.17 1983 0.3 1984 0.55
1985-2020 0.76
a1 MCi := 37 PBq.
'I '

• 0
"
75
Figure 5.1 shows plots of the scenario developed for world nuclear electrical generating capacity by reactor type between 1975 and 2020 . Light-water reactors (PWRs and BWRs) wi 11 continue to domi nate duri ng most of this period, but FBRs will playa more important role during the last decade of the 45-year period as the contribution from LWRs diminishes. Total installed nuclear capacity eventually approaches a steadystate scenario.
Reprocessing of the spent nuclear fuel from the reactor scenario in Fig. 5.1 is projected in Fig. 5.2. Because of the uncertainty associated with fuel reprocessing at this writing, there are no reliable published data that project worldwide fuel reprocessing needs. We estimate the fuel reprocessing requirements on the basis of the factors shown in Table 5.3. We have relied on the estimates of Kee et al. (1976) for LWR and HTGR cycl es and those of Tennery et a 1. (1976) for LMFBRs. It is further assumed that commercial reprocessing of LWR fuel begins in 1980, GMR fuel in 1990, HTGR fuel in 1995, FBR f~el in 2000, and fuel from other reactor types (excepting the HWR) in 1985. Our scenario implies that in 2020 fuel reprocessing reaches equilibrium with nuclear reactor spent fuel output.
5.1.2.2 Source terms and projections for the release of tritium to the atmosphere. Table 5.4 lists the source terms used in this study for tritium releases to the atmosphere by the nuclear industry. The most important site of atmospheric release is at fuel reprocessing plants, although the total release by reactors contributes significantly to the atmospheric global inventory and may exceed that of reprocessing plants when confinement of tritium is used during reprocessing.
It is important to recognize that these source terms account for on ly that tri t i um whi ch is released as a gaseous effl uent. The radi 0-
logical impact of tritium released to liquid effluents will be discussed in Sect. 5.3 in some detail. Liquid release rates are considered in Sect. 5.1. 2. 3.
The atmospheric source terms are listed in Table 5.4 for tritium at the reactor, and at the reprocessing plant as a function of the confinement factor (CF). The confi nement factor is defi ned as the number of

'"= .!!. ;t ~
UJ "->-f-
a: ~ u <l UJ a: >-m >-f-U
if. <l u 0 UJ ...J ...J
~ if)
~
>-(!) a: UJ z UJ
a: <l UJ ...J U ::J Z
76
ORNL -DWG 77 -1I796R 104r---~---.----.----.----'---~~~~~'-~~
5
2
103
5
2
to2
5
2
tot
5
2
toO
5
2
TOTAL INSTALLED CAPACITY ALL TYPES OF REACTORS
to-t 1975 80 85 90 95 2000 05
YEAR
to 15 20
Fig. 5.1 Scenario projecting the growth of nuclear energy world-wide
,.
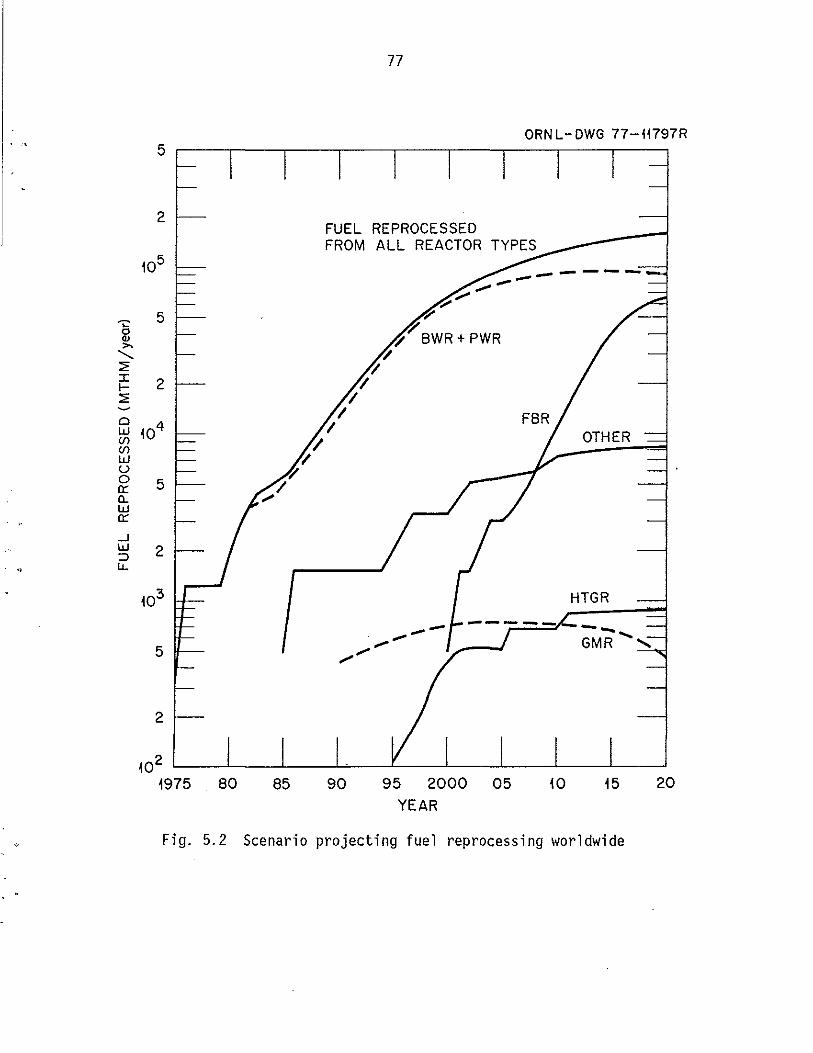
-;:: 0 OJ >-....... ~ ::r:: f-~
a w (/) (/) w u 0 0::: CL W 0:::
..J W ::>
• lL.
77
ORNL-DWG 77-11797R 5 .---,----,----,----,---,----,----,----,---,
2
105
5
2
104
5
2
103
5
2
85
FUEL REPROCESSED FROM ALL REACTOR TYPES
..........
90
.......... --
95 2000 05 YEAR
OTHER
--GMR .... '
Fig. 5.2 Scenario projecting fuel reprocessing worldwide
20
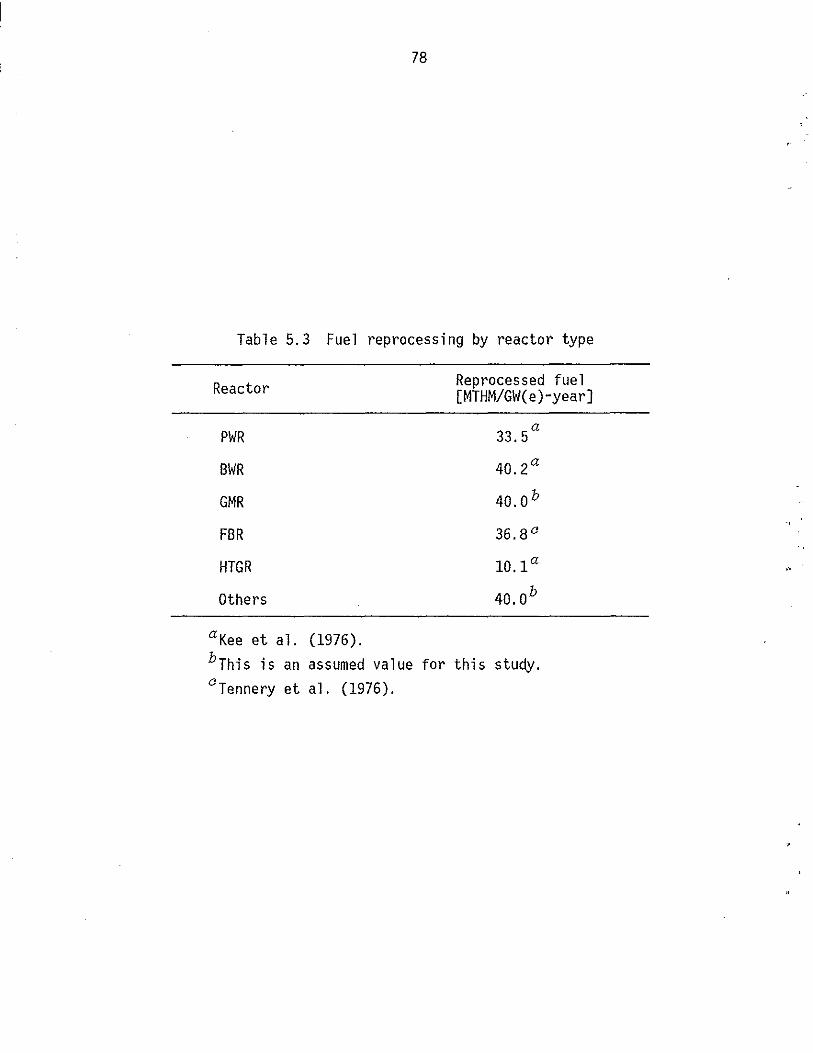
78
Table 5.3 Fuel reprocessing by reactor type
Reactor Reprocessed fuel [MTHM/GW(e)-year]
PWR 33.5 a
BWR 40.2 a
GMR 40.0b
FBR 36.8°
HTGR 10.1 a
Others 40.0b
a Kee et a 1. (1976). bThis is an assumed value for this study. °Tennery et al. (1976).
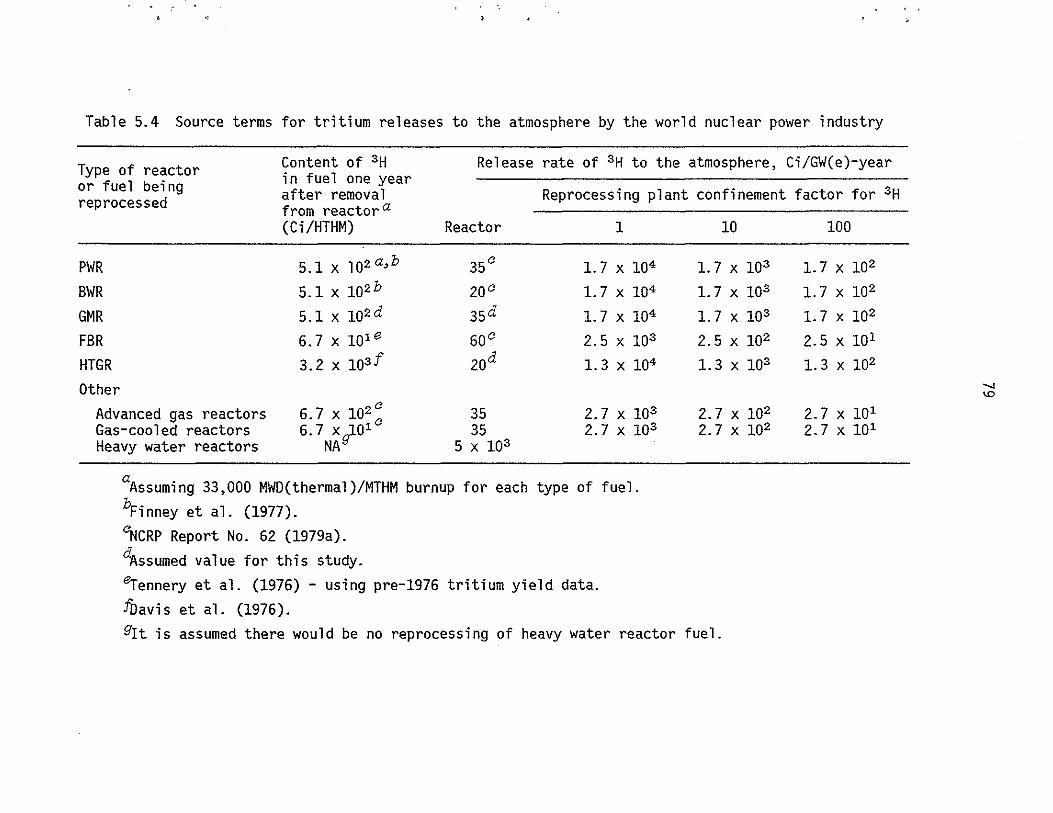
Table 5.4 Source terms for tritium releases to the atmosphere by the world nuclear power industry
Type of reactor Content of 3H Release rate of 3H to the atmosphere, Ci/GW(e)-year or fuel being in fuel one year
Reprocessing plant confinement factor for 3H after removal reprocessed from reactor a (Ci/HTHM) Reactor 1
PWR 5.1 x 10² a,b 35a 1. 7 x 10⁴
BWR 5.1 x 10²b 20 a 1. 7 x 10⁴
GMR 5.1 x 10²d 35 d 1. 7 x 10⁴
FBR 6.7 x 101e 60 a 2.5 x 10³
HTGR 3.2 x 10³f 20d 1.3 x 10⁴
Other Advanced gas reactors 7 2 a
35 2.7 x 10³ 6. x 10 a 2.7 x 10³ Gas-cooled reactors 6.7 X;Ol 35
Heavy water reactors NA 5 x 10³
aAssuming 33,000 MWD(thermal)/MTHM burnup for each type of fuel. bFinney et al. (1977). lNCRP Report No. 62 (1979a). dAssumed value for this study.
erennery et al. (1976) - using pre-1976 tritium yield data. fbavis et al. (1976).
10
1. 7 X 10³
1. 7 X 10³
1. 7 X 10³
2.5 X 10²
1.3 X 10³
2.7 X 10²
2.7 X 10²
gIt is assumed there would be no reprocessing of heavy water reactor fuel.
100
1. 7 X 10²
1. 7 X 10²
1. 7 X 10²
2.5 X 101
1.3 X 10²
2.7 X 101
2.7 X 101
" \0

80
curies of tritium processed divided by the number of curies released. For example, a confinement factor of 10 implies that 90% of the tritium processed would be contained at the reprocessing plant by a retention system, while a confinement factor of 100 implies that 99% is contained. For most reactor types, tritium confinement does not have meaning in the practical sense because retention systems at the reactor designed to trap tritium would not be economically justifiable. The LMFBR is an excepti on, si nce tritium can readily escape from the fuel elements through the cladding and will be collected in cold traps before it can escape into the environment (USAEC, 1974b).
Generally, source terms for gaseous releases at reactors are relatively small compared to reprocessing plants that have no containment of tritium. The heavy-water-moderated reactor, however, such as the CANDU type, is expected to release to the atmosphere approximately 5000 Cil
year (185 TBq/year) per GW(e) (NCRP, 1979aj Gorman and Young, 1979). Thi s input cannot be negl ected as it is assumed in our scenari 0 that heavy-water reactors contri bute about 4% to the total i nsta 11 ed generating capacity between 1985 and 2020. Since the reactors of the CANDU type are fueled wi th natural urani urn, it is assumed there wi 11 be no reprocessing of HWR fuel.
In this scenario, a capacity factor of 0.75 is assumed, where the capacity factor is defined as actual power generated [GW(e)-year] divided by the power generated assumi ng continuous reactor ope rat ion [GW( e)year]. Thi s capacity factor iss 1 i ght ly greater than that assumed by some investigators (Hanrahan et al., 1976j Kelly et al., 1975); however, the use of the 0.75 value in this chapter is intended to reflec~ expected improvements in reactor technology and reliability.
The release of tritium from reactors was calculated by multiplying the total installed capacity by the corresponding tritium inventory from Table 5.4 and by the capacity factor. For reprocessing plants, the number of metric tons of heavy metal reprocessed each year for each type of reactor fuel was multiplied by the tritium inventory in curies per metri c ton heavy metal (MTHM) to gi ve the curi es per year of tritium avail ab 1 e for release to the atmosphere. The confi nement factor is
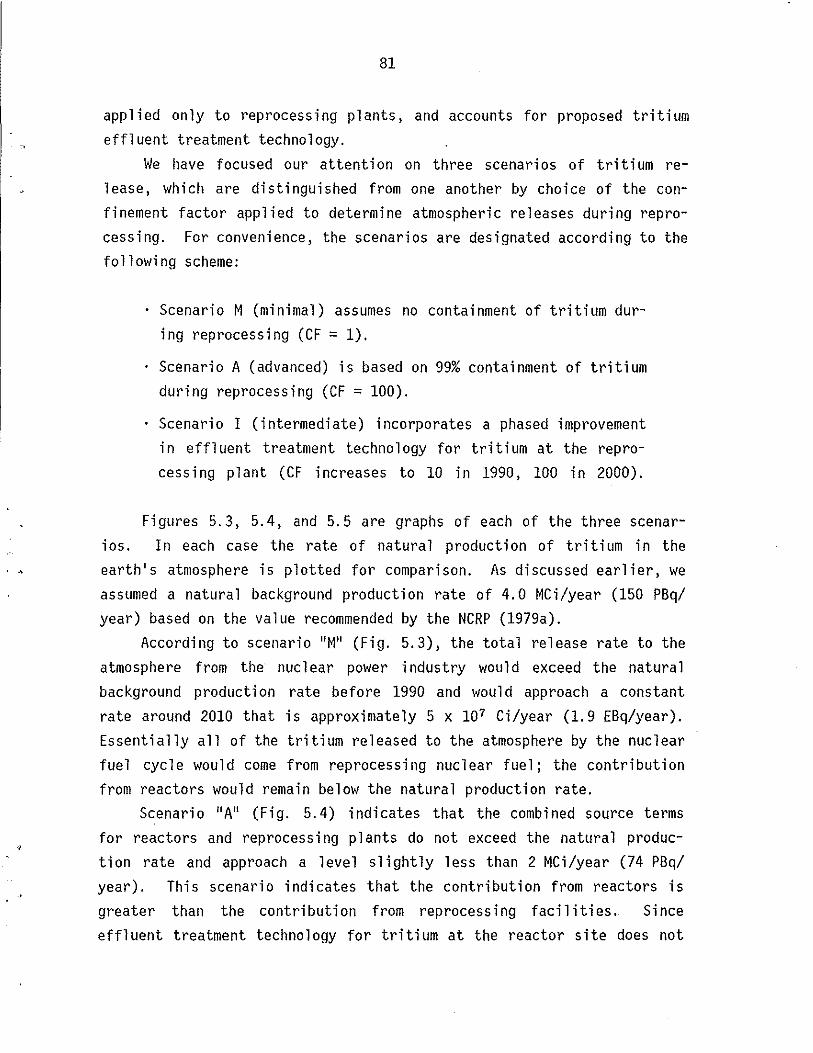
81
app 1 i ed only to reprocess i ng plants, and accounts for proposed tri t i um effluent treatment technology.
We have focused our attention on three scenarios of tritium release, which are distinguished from one another by choice of the confinement factor applied to determine atmospheric releases during reprocessing. For convenience, the scenarios are designated according to the following scheme:
Scenario M (minimal) assumes no containment of tritium during reprocessing (CF = 1).
Scenario A (advanced) is based on 99% containment of tritium during reprocessing (CF = 100).
Scenario I (intermediate) incorporates a phased improvement in effl uent treatment techno logy for tri t i um at the reprocessing plant (CF increases to 10 in 1990, 100 in 2000).
Figures 5.3, 5.4, and 5.5 are graphs of each of the three scenarios. In each case the rate of natural production of tritium in the earth's atmosphere is plotted for comparison. As discussed earlier, we assumed a natural background production rate of 4.0 MCi/year (150 PBql year) based on the value recommended by the NCRP (1979a).
According to scenario "M" (Fig. 5.3), the total release rate to the atmosphere from the nuc 1 ear power industry woul d exceed the natural background production rate before 1990 and would approach a constant rate around 2010 that is approximately 5 x 10⁷ Ci/year (1.9 EBq/year). Essentially all of the tritium released to the atmosphere by the nuclear fuel cycle would come from reprocessing nuclear fuel j the contribution from reactors would remain below the natural production rate.
Scenario "A" (Fig. 5.4) indicates that the combined source terms for reactors and reprocess i ng plants do not exceed the natural production rate and approach a level slightly less than 2 MCi/year (74 PBql year). Thi s scenari 0 i ndi cates that the contri buti on from reactors is greater than the contribution from reprocessing facilities. Since effl uent treatment techno logy for tri t i um at the reactor site does not

~ .... 0 ., ~ 2 w 0:: w J: 0.. (J) 0 ::2: t;;: W J: I-
g Cl w (J) <l: W ...J W 0:: J:
r<l
107
106
~05
104
82
ORNL-DWG 79-19388&1
~---
________ 7"':'..lJATURA1.. BACKGROUNQ. PRODUCTIO tLRATE_
/ 4 x ~06 Ci/yeor
.. / ,/
I
COMMERCIAL PRODUCTS _ ----
REPROCESSING --- REACTORS
TOTAL
(REACTORS AND
REPROCESSING)
103 ~ __ -L __ ~~ __ ~ __ ~ ____ ~ __ ~ ____ -L __ ~ ____ ~
1975 80 85 90 95 2000 05 10 ~5 2020
YEAR
Fig. 5.3 Scenario M (minimal): Tritium released to the atmosphere by the nuclear industry. The reprocessing plant confinement factor = 1
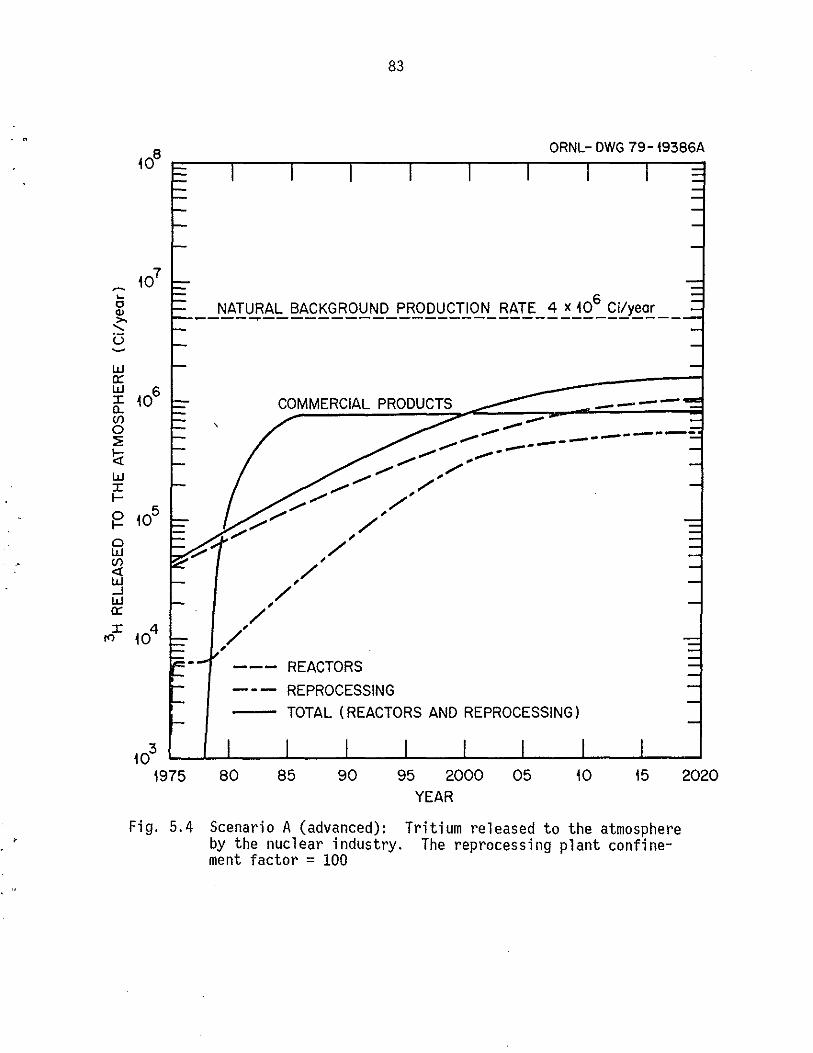
83
ORNL- DWG 79-19386A ~08 ~--~----~----T---~----~----~--~r----r--~
NATURAL BACKGROUND PRODUCTION RATE 4 x ~06 Ci/yeor ---- ...... ---------------------------------
, --------.",,- ---.------
.,.",. ----- -.-- .. ............ .. ...... ............ , ......
...... / ,/ /...... ,/
,
,/'/
,/ /
/ ,
--- REACTORS
- - - REPROCESSING TOTAL (REACTORS AND REPROCESSING)
103 L---L.-L. ____ .J-. __ --.J. ___ -L-_--l __ -L... __ .l...-_--'-_----J
1975 80 85 90 95 2000 05 10 15 YEAR
Fig. 5.4 Scenario A (advanced): Tritium released to the atmosphere by the nuclear industry. The reprocessing plant confinement factor = 100
2020
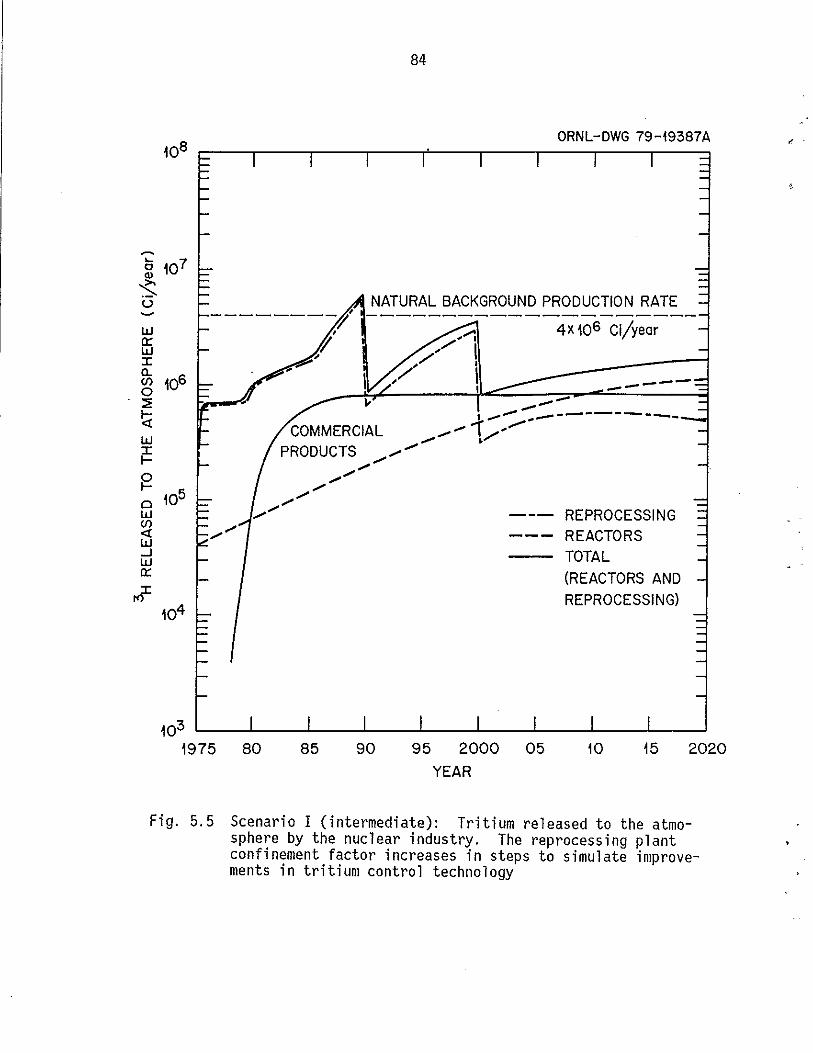
84
ORNL-DWG 79-19387A 108 r---.----.----.----r---,----~--_,----,_~
....
NATURAL BACKGROUND PRODUCTION RATE --------------------
,'1 4x 10⁶ ci/yeor /1 ,/ ,
,/ 1 I ---I ~....- .. ___ --------_
COMMERCIAL ............ ,/'....-PRODUCTS ............ •
............ ........
........
REPROCESSING REACTORS TOTAL (REACTORS AND REPROCESSING)
103 L-__ ~ __ -i ____ L-__ ~ __ ~ ____ L_ __ _L __ ~L_~
1975 80 85 90 95 2000 05 10 15 2020
YEAR
Fig. 5.5 Scenario I (intermediate): Tritium released to the atmosphere by the nuclear industry. The reprocessing plant confinement factor increases in steps to simulate improvements in tritium control technology
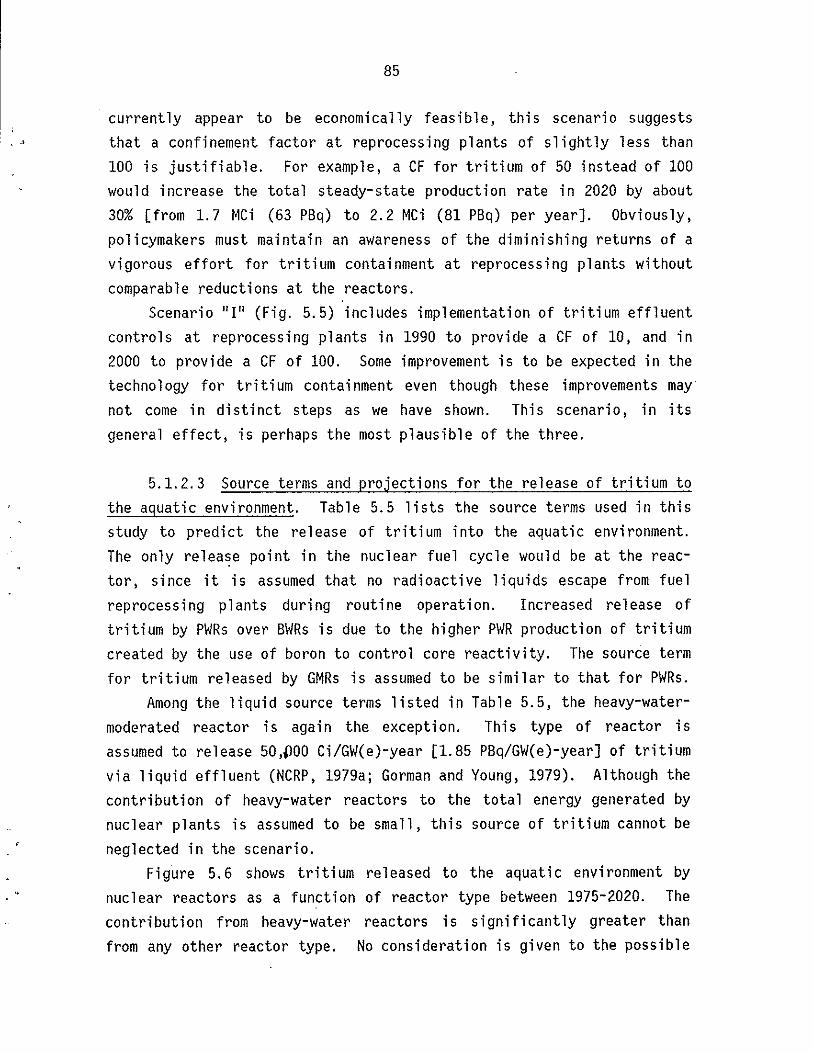
-,
85
currently appear to be economically feasible, this scenario suggests that a confinement factor at reprocessing plants of slightly less than 100 is justifiable. For example, a CF for tritium of 50 instead of 100 would increase the total steady-state production rate in 2020 by about 30% [from 1.7 MCi (63 PBq) to 2.2 MCi (81 PBq) per year]. Obviously, policymakers must maintain an awareness of the diminishing returns of a vigorous effort for tritium containment at reprocessing plants without comparable reductions at the reactors.
Scenario "I" (Fig. 5.5) includes implementation of tritium effluent contro 1 s at reprocess i ng plants in 1990 to provi de a CF of 10, and in 2000 to provide a CF of 100. Some improvement is to be expected in the techno logy for tri t i um contai nment even though these improvements may not come in distinct steps as we have shown. This scenario, in its general effect, is perhaps the most plausible of the three.
5.1.2.3 Source terms and projections for the release of tritium to the aquatic environment. Table 5.5 lists the source terms used in this study to predict the release of tritium into the aquatic environment. The only release point in the nuclear fuel cycle would be at the reactor, since it is assumed that no radioactive liquids escape from fuel reprocessing plants during routine operation. Increased release of tritium by PWRs over BWRs is due to the higher PWR production of tritium created by the use of boron to control core reactivity. The source term for tritium released by GMRs is assumed to be similar to that for PWRs.
Among the liquid source terms listed in Table 5.5, the heavy-watermoderated reactor is again the exception. This type of reactor is assumed to release 50,~OO Ci/GW(e)-year [1.85 PBq/GW(e)-year] of tritium via liquid effluent (NCRP, 1979a; Gorman and Young, 1979). Although the contribution of heavy-water reactors to the total energy generated by nuclear plants is assumed to be small, this source of tritium cannot be neglected in the scenario.
Figure 5.6 shows tritium released to the aquatic environment by nuclear reactors as a function of reactor type between 1975-2020. The contri buti on from heavy-water reactors iss i gnifi cant ly greater than from any other reactor type. No consideration is given to the possible

86
Table 5.5 Source terms for tritium released in liquid effluents of nuclear reactors a
Type of Release rate of 3H to the environ~ent nuclear reactor in liquid effluent [Ci/GW(e)-year ]
BWR
PWR
GMR
FBR
HTGR
Others HWR AGR GCR
50,000a SOd
SOd
art is assumed that no tritium would escape in liquid effluent from reprocessing plants.
bl Ci = 37 GBq a NCRP Report 62 (1979a). dAssumed value for this study.

87
• 4
I i -.
ORNL-DWG 79-20973R
107
~
0-m 0 Ol
Ol
I'- 106 PWR r0
" U ~
~
U 105 ~
0 w <.f) BWR <! w ..J W 0:::
~ 104 ::> f-0::: HTGR f-
103
1975 80 85 90 95 2000 05 10 15 20 YEAR
Fig. 5.6 Release of tritium from nuclear reactors to the aquatic environment
88
se 1 ect i ve contai nment of 3H in 1 i qui d effl uent duri ng thi s .scenari 0,
although treatment of liquid effluent, particularly in heavy-water reactors, may occur in the future.
5.2 Global Tritium Modeling
Because of the ubiquitous nature of tritium as 3HOH, global population dose estimates due to specific tritium sources have received cons i derab 1 e attention. However, estimates of annual gl oba 1 dose commi tments ari sing from a 1 Ci /year (37 GBq/year) atmospheric release are found to range from an EPA estimate (USEPA, 1973) of 4 x 10⁻⁴ man-rem/ year, (4 x 10⁻⁶ man-Sv/year) to 2.2 x 10⁻² man-rem/year (2.2 x 10- 4
man-Sv/year) obtained by Soldat and Baker (1979). The calculation of global dose requires the estimation of environmental tritium concentrations and their potential biological hazard to an individual. It can be shown (Sect. 2) that, for a given atmospheric concentration of tritium, several dosimetry models yield very similar dose estimates when normalized for comparison. Consequently, we must focus our attention on the estimates of envi ronmenta 1 tritium concentrations to exp 1 ai n the range of global dose estimates cited above. In the following we review the basic global tritium distribution models, discuss the uncertainties associ ated with these mode 1 s, and present a "reasonable" bound for concentrations obtained from simple assumptions. This discussion excludes the additional consideration of the influence of tritiated gas, 3HH, on global dose estimates.
5.2.1 Bases of global models
For the purpose of estimating global dose commitments due to specific tritium sources, a global distribution model is assumed to reach a semi-equilibrium state. Thus, no local, regional, or even global firstpass influences are considered. The accuracy of any dose estimates will depend on the accuracy with which the distribution model estimates the triti urn concentrations in those envi ronmenta 1 pools that di rect ly contribute to individual exposure. Therefore, even though the role of deep

89
ocean water as a tritium sink may be important to global dynamics, the
deep ocean concentration need not be known to estimate doses. The rela
tive isolation of the hydrologic cycles of the northern and southern
hemispheres, coupled with the demographic concentration of almost 90% of
the world population in the northern hemisphere, justifies the restric
t i on of most models to cons i derat i on of northern hemi spheri ca 1 tri t i um
circulation, even though the models are referred to as "global."
The bas i c assumption of gl oba 1 tri t i um mode 1 sis that tritium
follows the hydrologic cycle without discrimination. The standard
approach to describing tritium distribution is to consider the primary
water pools as compartments and to describe equilibrium tritium concen
trations in each compartment. The simplest model (USEPA, 1973) treats
the entire circulating surface ~Iater of the northern hemisphere as a
si ng1 e compartment, i gnori ng atmospheri c water due to its re 1 at i ve 1y
small volume. Bonka (1979) employs a two-compartment box model with an
ocean mixed layer and an ocean deep layer.
The difficulty with these simple models is that they have large
compartments, in which the tritium concentrations are assumed to be
uniform. In nature, tritium concentrations vary considerably, even in
the equil i bri um state, between vari ous aqueous poo 1 sand geographi ca 1
locations.
To construct a model that accurate 1y refl ects envi ronmenta 1 equi-
1ibrium concentrations, a natural step is to increase the number of com
partments to reflect the identifiably distinct aqueous pools. A simple
t'hree compartment model discussed by NCRP (1979a) distinguishes atmos
pheric water, circulating ocean surface water, and land surface water.
Under equilibrium assumptions this model differs little from the one
compartment model, except to give a slightly more accurate total water
volume for dilution. The most reasonable model, in terms of accounting
for distinct accumulation pools, is of the type proposed by Easterly and
Jacobs (1975) with seven compartments, and that of Bergman et a1. (1979)
wi th ei ght compartments. For these more refi ned models, equil i bri um
assumpt ions are i nappropri ate; instead, trans fer coeffi ci ents between
compartments are estimated and the system is simulated until it reaches
90
a pseudo-equil i bri um state. Thi s enab 1 es the compari son of proj ect ions with different initial conditions and transfer coefficients. The transfer coefficents are usually estimated on the basis of hydrogen transport studies and gross meterological data, but in some cases are simply chosen to balance the system. Their accuracy is thus uncertain and as the comp 1 exi ty of a model is increased, the combi ned effect of the additional parameter uncertainty could result in reduced predictive re 1 i ab il ity.
Another obvi ous prob 1 em with gl oba 1 ci rcul at i on models is that, withi n a phys i ca 11y di st i nct compartment such as the atmosphere, there is not uni formity even in the steady state due to the dynami cs of the hydrologic cycle. However, the major hydrologic flow is in a west-east direction with diffusion from the poles toward the equator. The result is that actual tritium concentrations within a given pool at fixed latitudes are re 1 ati ve 1y constant, with primary differences appeari ng between latitude levels. (Actually, Atlantic Ocean surface concentrations are consistently somewhat greater than concentrations at the same latitude in the Pacific Ocean.) Bander et al. (1979) have introduced 100
1 at i tudi na 1 bands into a two-compartment tritium mode 1, i nc1 udi ng sur-face water and atmospheri c water. Thei r model requi res 104 transfer " coefficients, compared to the 19 parameters in the Easterly-Jacobs model (1975), and thus, although only a generalized two-compartment model, the Bander model has a higher factor of parameter uncertainty than the seven-compartment model.
5.2.2 Reasonable concentration bounds
In 1 i ght of the increased parameter uncertai nty associ ated wi th further refinements of global tritium models, it seems appropriate to reconsider basic tritium distribution data and to establish "reasonable" bounds for estimates of environmental tritium concentrations. Such bounds may then provide a basis for making usable global dose estimates. They may also be used to identify estimates from more refined global models that appear to be too large, indicating a need for careful uncertainty analysis of such models' parameter bases.

91
We will now establish upper and lower bounds for estimated global tritium dose based on empirical evidence of actual tritium distributions. Schell et al. (1973) considered troposphere tritium distribution in the northern hemisphere and found that it could be described by a function of the form
yea) = (5.1)
(see Fig. 5.7), where a represents the latitude and yea) the concentrat i on of tri ti urn in water. The surpri sing result was that the exponent coefficient a remained relatively constant at a = 0.0538 when the total trit i urn inventory vari ed. The At 1 ant i c Ocean surface tritium profi 1 e and precipitation data of Weiss et al. (1979) fit a value of a = 0.044. We choose the hi gher a value of 0.0538 for our cal cul ati ons as thi s yields higher dose estimates, a prudent course of action. The total tritium M can be represented by an integral of the form
M = 900
r yea) dV(a), )00
(5.2)
where yea) is as above and dV(a) is the incremental rate of change of the circulating water volume as a function of latitude a. The value of Yo' as a function of total tritium, is given by
M (5.3) y = --------------
o £:00
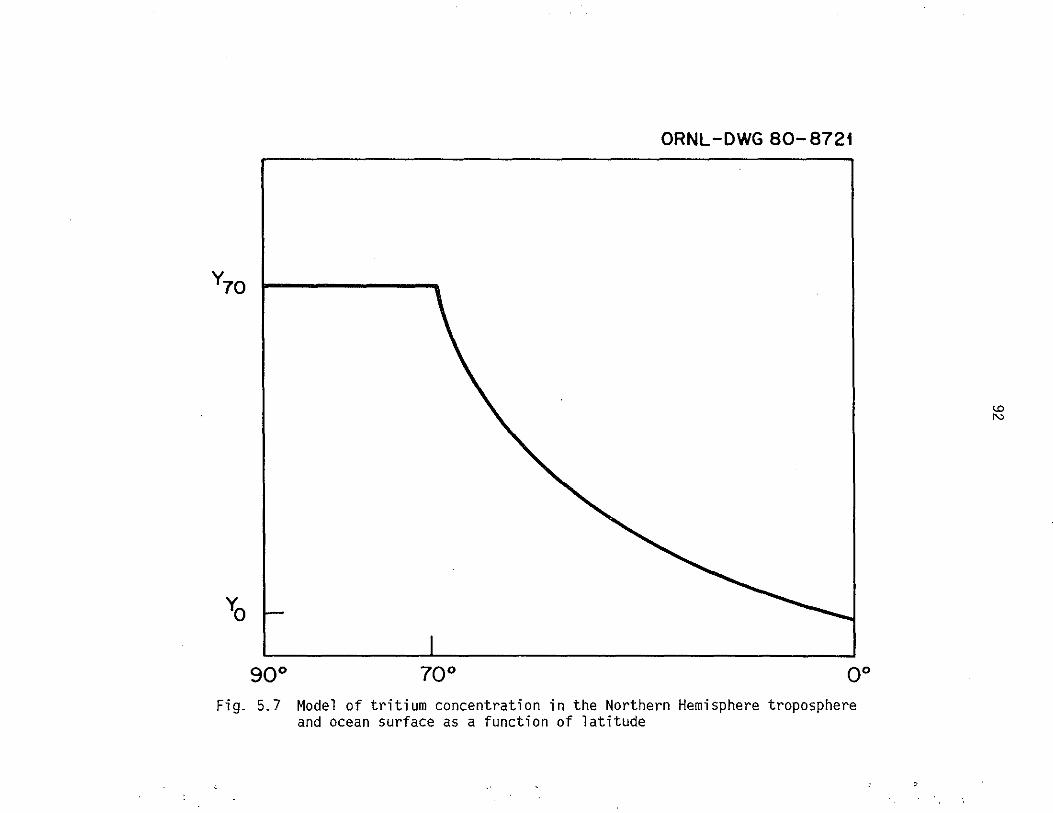
ORNL-DWG 80-8721
Y70
Yo
90° 70° 0° Fig. 5.7 Model of tritium concentration in the Northern Hemisphere troposphere
and ocean surface as a function of latitude
,
<D N
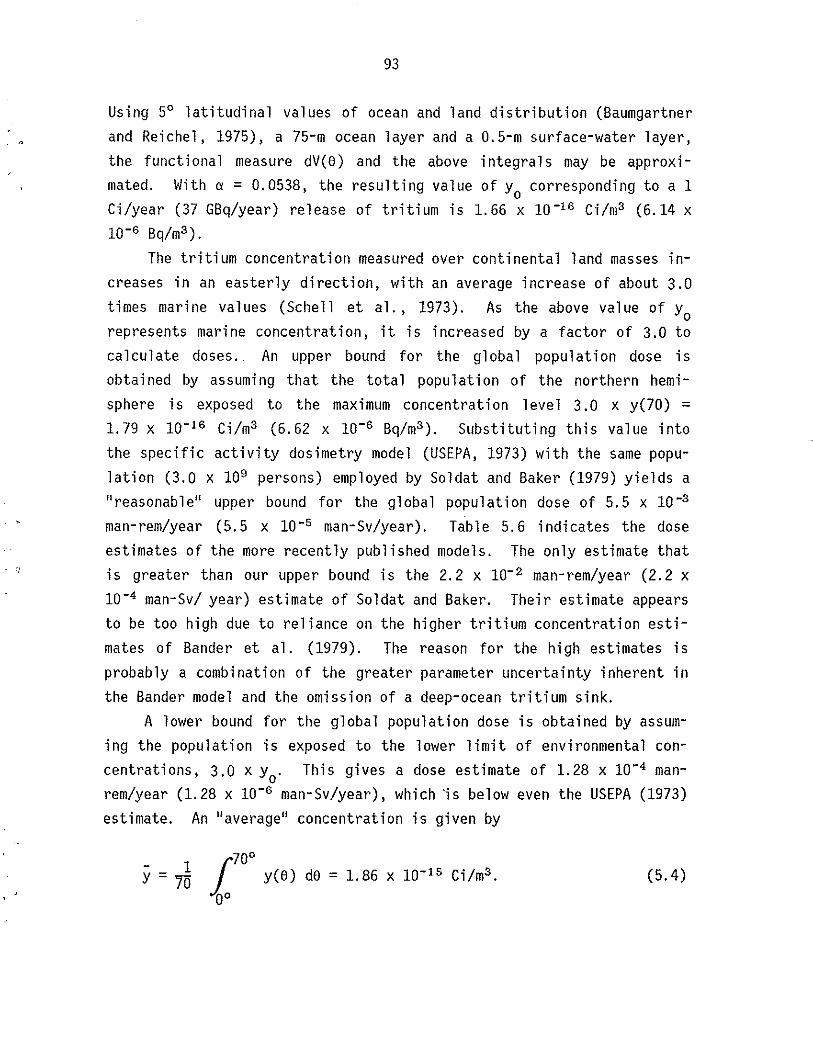
93
Using 5° latitudinal values of ocean and land distribution (Baumgartner and Reichel, 1975), a 75-m ocean layer and a 0.5-m surface-water layer, the functional measure dV(e) and the above integrals may be approximated. With a = 0.0538, the resulting value of Yo corresponding to a 1 Ci/year (37 GBq/year) release of tritium is 1.66 x 10⁻¹⁶ Ci/m3 (6.14 x 10⁻⁶ Bq/m3 ).
The tritium concentration measured over continental land masses increases in an easterly direction, with an average increase of about 3.0 times marine values (Schell et al., 1973). As the above value of Yo represents marine concentration, it is increased by a factor of 3.0 to calculate doses .. An upper bound for the global population dose is obtai ned by assumi ng that the total popul at i on of the northern hemisphere is exposed to the maximum concentration 1 eve 1 3.0 x y(70) =
1.79 x 10⁻¹⁶ Ci/m3 (6.62 x 10⁻⁶ Bq/m3 ). Substituting this value into the specific activity dosimetry model (USEPA, 1973) with the same population (3.0 x 10⁹ persons) employed by Soldat and Baker (1979) yields a "reasonable" upper bound for the global population dose of 5.5 x 10⁻³
man-rem/year (5.5 x 10⁻⁵ man-Sv/year). Table 5.6 indicates the dose estimates of the more recently published models. The only estimate that is greater than our upper bound is the 2.2 x 10- 2 man-rem/year (2.2 x 10⁻⁴ man-Sv/ year) estimate of Soldat and Baker. Their estimate appears to be too high due to reliance on the higher tritium concentration estimates of Bander et al. (1979). The reason for the high estimates is probably a combination of the greater parameter uncertainty inherent in the Bander model and the omission of a deep-ocean tritium sink.
A lower bound for the global population dose is obtained by assuming the population is exposed to the lower limit of environmental concentrations, 3.0 x yo' This gives a dose estimate of 1.28 x 10⁻⁴ manrem/year (1. 28 x 10-6 man-Sv/year), which "is below even the USEPA (1973) estimate. An "average" concentration is given by
70° [ y(e) de = 1.86 x 10⁻¹⁵ Ci/m3 .
0° (5.4)
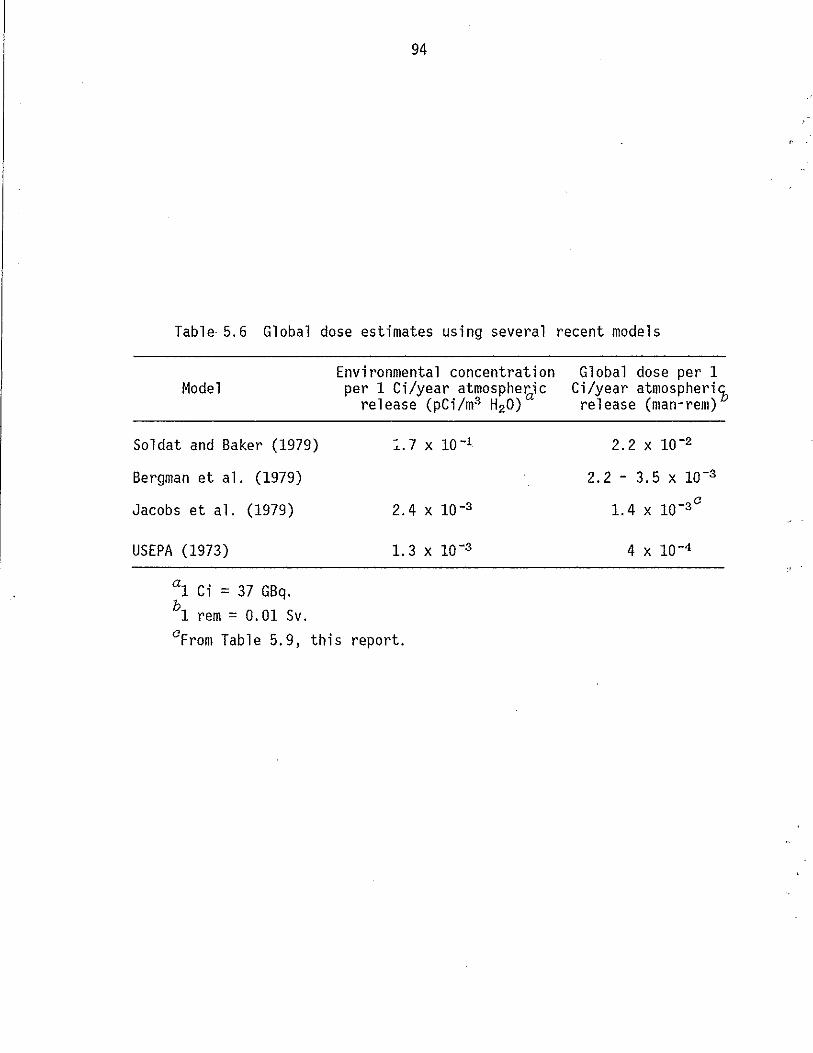
94
Table- 5.6 Global dose estimates using several recent models
Model
Soldat and Baker (1979)
Bergman et al. (1979)
Jacobs et al. (1979)
USEPA (1973)
a1 Ci = 37 GBq. hI rem = 0.01 Sv.
Environmental concentration per 1 Ci/year atmosphe~ic
release (pCi/m3 H20)
2.4 X 10⁻³
°From Table 5.9, this report.
Global dose per 1 Ci/year atmospheri~ release (man-rem)
2.2 X 10⁻²
2.2 - 3.5 X 10⁻³
1.4 X 10⁻³°

95
This concentration results in a global population dose estimate of 1.43 x 10⁻³ man-rem/year (1.43 x 10⁻⁵ man-Sv/year). This value presumes a uniformly distributed population.
The global dose estimates of Sect. 5.3 are slightly different in the sense that they are calculated for varying tritium release strategi es. However, us i ng data from Page 101, wi th constant popul ati on levels, results in an estimate of global population doses resulting from 1 Ci/year (37 GBq/year) release, of 1. 42 x 10 -3 man-rem/year (1. 42 x
10-5 man-Sv/year), a value within our bounds.
5.3 Global Component of Tritium Dose to the World Population
The collective dose commitment Hoo to the world population due to a globally dispersed release of tritium is based on the equation
too
Hoo = / N(t)'O(t)'dt man-rem, (5.5)
to
where N(t) denotes the number of individuals in the population at time t and OCt) is the dose rate (rem'year-1 ) to an average individual at time t. The time to is taken as the beginning of the·release.
Estimation of the individual dose rate OCt) is accomplished as fol-lows:
(5.6)
where (DRF) is a dose-equivalent rate factor for body water (rem'year-1
per g 3H m -3), F w is the average fraction of body tissue that is water, "'0.75 (ICRP, 1975), and Cm(t) is an estimate of the concentration of tritium in the body water of an average member of the population (g 3H m-3) at time t. With 1 g tritium in each m3 of body water (1 m3 = 106 g H20), we have

where
(DRF)
96
= (51.2)(5.7 X 10⁻³ MeV dis-1) x 1 9 3H x 9.606
lOs 9 body water
X 109 ~Ci(g 3H)-1 x 365 d year-1
= 1.02 X 10⁶ rem (1.02 x 10⁴ Sv) year-1 per 9 3H m-3 ,
51.2 = (3.7 x 10⁴ dis S-1 Ci-1 )(1.6 x 10⁻⁶ er 100 erg (g tissue -
x 86,400 S d-1 , a unit conversion factor.
(5.7)
(5.8)
Eq. (5.7) is based on the well known internal dose rate formula (ICRP,
1959)
dose-rate = 51.2e . q rad d-1 ,
m (5.9)
where e(MeV di s -1) is the absorbed energy, m is the mass (g) of the
absorbing medium, and q is the activity (~Ci) assumed to be distributed
uniformly throughout the medium. If e is assumed to contain a quality
factor appropriate to the decay radiations, the formula of Eq. (5.9) may
be considered to represent dose equivalent rate in units of rem d- 1 .
For the 5.7 keV ~- emissions of tritium, a quality factor of unity is
assumed for the present section; contrary i ndi cati ons are di scussed in
Chap. 3 of this report.
The factor Cm(t) of Eq. (5.6) is estimated from a dynamic simula
t i on of concentrations of re 1 eased tritium in the water of several
reservoi rs of the gl oba 1 hydro 1 ogi c cyc 1 e, in proportion as the water
from these sources is taken in by man. With assumptions similar to
those of NCRP Report No. 62 of the NCRP (1979a), we write for the parti
tion of Cm'
C = 0.99 C. + 1.99 C + 0.02 C m 3.0 alr ~ water ~ ocean
(5.10)

97
where the variables on the right denote concentrations of tritium (g
m-3 ) in the media indicated by the subscripts. The first term is
assumed to contribute to the concentration in body water by inhalation
(0.13 £ d- 1 ), absorption through the skin (0.09 £ d-1 ), and to one-half
of the concentration in the water taken in food (0.77 £ d-1 ). The
second term expresses the assumed contribution of the land waters
through the remaining half of water content in food and through drinking
water (0.77 and 1.22 Q d-1 ). In the third term, a small contribution
due to eating fi sh is taken into account. The total water intake for
the reference individual is 3.0 liter d-1 •
Simulations of dynamic exchange of tritium among global reservoirs
were carried out with our implementation of a seven-reservoir model
defined in NCRP Report No. 62 (1979a), which is itself a variant of a
model of Easterly and Jacobs (1975) (see Sect. 5.2). Exchange rates are
assumed to be proportional to the tritium levels in the donor compart
ments, with the transfer coefficients being derived from estimated
steady-state fluxes of the global hydrologic cycle. Table 5.7 charac
teri zes the structure and parameteri zat i on of the model; the reader is
referred to NCRP (1979a) and Easterly and Jacobs (1975) for further
details and references.
The seven differential equations that express the rates of change
of tritium levels in the world reservoirs are solved with exogeneous
functi ons that represent inputs of triti urn into several of the reser
voirs as a result of the releases being simUlated. In the case of re-
1 eases from the nuc 1 ear power industry, the recei vi ng compartments are
atmosphere and water: for aquatic releases, approximately 80% is
assumed to be discharged to surface streams and freshwater lakes, while
the remaining 20% goes into the surface waters of the ocean. In simula
tions of transport of nuclear weapons-produced tritium, the total input
is assumed to enter the system through the atmosphere. In all cases,
the dynamic levels of tritium in the reservoirs that are available to
man are diluted in the reservoir water volumes (Table 5.7) and the , resulting concentrations inserted in Eq. (5.10). We have retained the
NCRP (1979a) assumption that 80% of drinking water is from streams and

Table 5.7 Reservoir model of the global hydrological cycle applied to the transport of tritium
Transfer coefficientsa (year-1 ) _ .... _---
Water A OS DO SW GW FW SL Volume (m3 )
.A 24.62 7.638 0.4615E-1 0.7692E-2 1. 3El3
OS 0.129E-1b 0.5926E-1 2.7E16
DO 0.1240E-2 1. 29El8
SW 1.022 0.3806 0.4388 6.7El3
GW 0.2874E-2 0.1l98E-3 0.4790E-4 8.35E15
FW 0.7937E-2 0.2381 1. 26El4
SL 0.4808E-2 1. 04El4
aAbbreviations: A = atmosphere, OS = ocean surface (75 m), DO = deep ocean, SW = surface soil water, GW = deep ground water, FW = surface streams and fresh water lakes, and SL = saline lakes and inland seas.
bRead as 0.129 x 10⁻¹ .
<0 co
99
fresh\~ater lakes, with the remaining 20% being drawn from deep wells (deep groundwater). In our calculation, Cwater of Eq. (5.10) is a composite of the tritium concentrations in these two compartments; in the NCRP calculation, however, the surface soil water compartment appears to be included as well.
The world population scenario, N(t), [Eq. (5.5)] is based on the "medi urn vari ant" projection pub 1 i shed by the United Nations (1974) through the year 2075. Subsequent to that date we have assumed the population to be stationary at the 2075 level. Table 5.8 shows the projected population values at 25-year intervals.
Table 5.9 displays the collective dose commitments estimated in the manner described above for releases of tritium from consumer products and the nuclear power industry 1975 to 2020 under scenarios A, I, and M (Sect. 5.2), together with the estimated collective dose commitment due to the estimated tritium production from nuclear weapons 1940 to 1975. Each of these total collective dose commitments is broken down to show components associated with the several environmental exposure media (atmosphere, deep groundwater, freshwater lakes and streams, and ocean surface). These components do not constitute an analysis of pathways re 1 at i ve to modes of release, but rather i ndi cate the extent to whi ch man's exposure to each of the respective environmental compartments contributes to dose for the combinations of release modes assumed for the power scenarios, weapons testing, and natural tritium.
The two columns of Table 5.9 that give collective dose commitments from the natural source of tritium deserve some comment. The first and larger total (1.05 x 10⁶ man-rem or 1.05 x 10⁴ man-Sv) is based on integrating the product of the constant individual dose rate of 7.3 x 10- 4
millirem'year-1 (7.3 x 10⁻⁶ mSv·year-1 ) (caused by the naturally produced tritium that is in steady-state in the environment) and the population, N(t), over a period comparable to the nuclear power scenarios: 1975 to 2020 (release period) plus 100 years (approximately 8 half-lives of tri t i urn). The second total is the result of treating the estimated natural rate of production (4.0 MCi'year- 1 or 0.15 EBq·year-1 ) in the same manner as a nuclear industry scenario and integrating the consequent collective dose rate from 1975 to 2020; then wi th thi s source
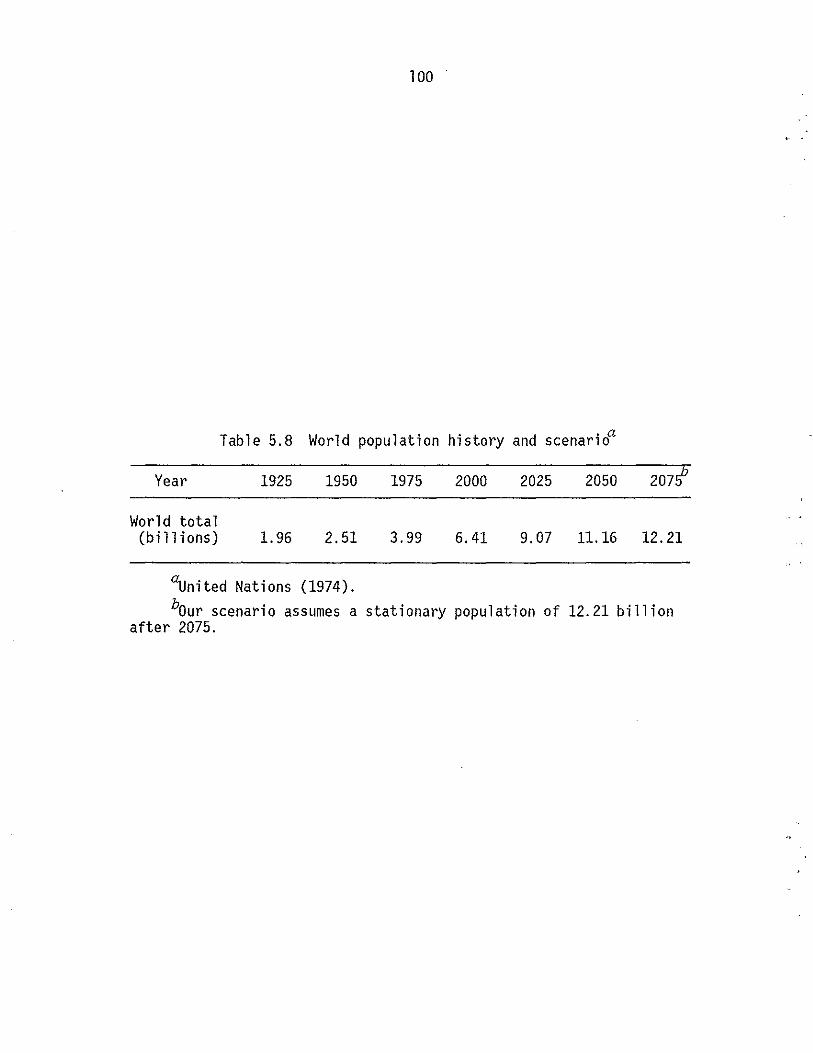
100
Table 5.8 World population history and scenarioa
Year
World total (bi 11 ions)
1925
1. 96
1950
2.51
aunited Nations (1974).
1975 2000 2025 2050 2075P
3.99 6.41 9.07 11.16 12.21
bOur scenario assumes a stationary population of 12.21 billion after 2075.
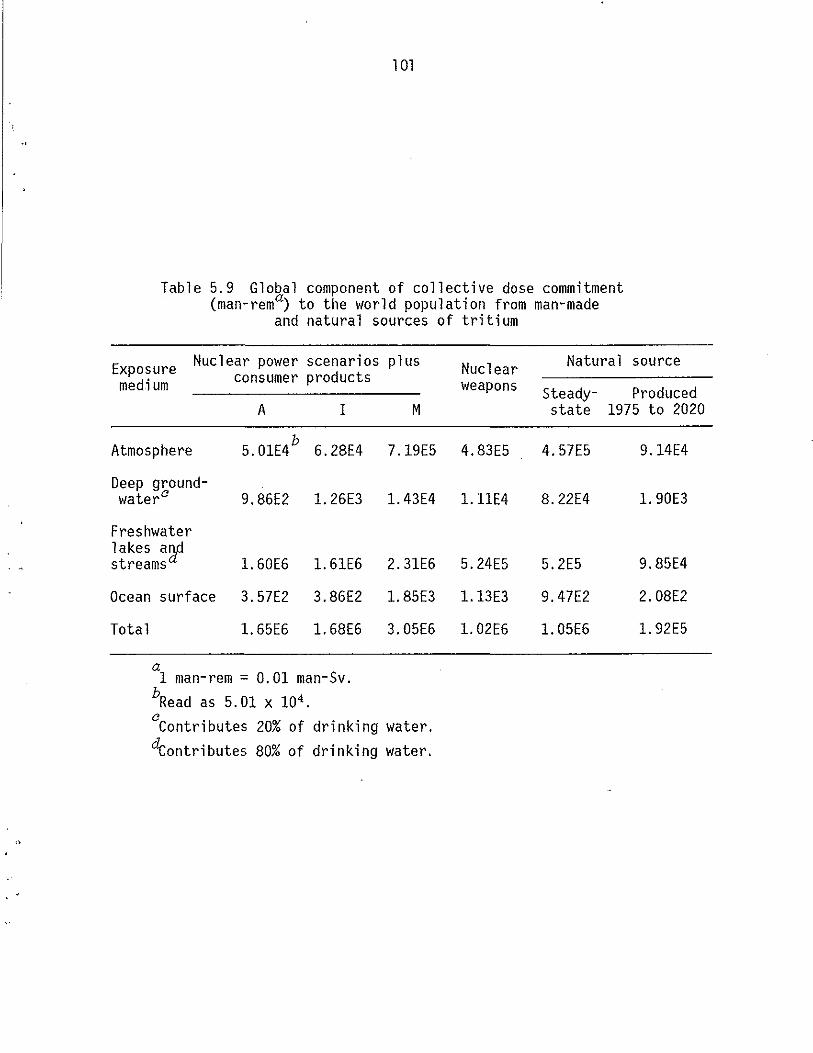
101
Table 5.9 Global component of collective dose commitment (man-rema) to the world population from man-made
and natural sources of tritium
Exposure Nuclear power scenarios plus medium consumer products
A I M
Atmosphere 5.01E4b
6.28E4 7.19E5
Deep ground-waterC 9.86E2 1. 26E3 1. 43E4
Freshwater lakes a~ streams l. 60E6 1. 61E6 2.31E6
Ocean surface 3.57E2 3.86E2 1. 85E3
Total l. 65E6 1. 68E6 3.05E6
a 1 man-rem = 0.01 man-Sv.
bRead as 5.01 x 10⁴ .
CContributes 20% of drinking water. acontributes 80% of drinking water.
Nuclear weapons
4.83E5
1.11E4
5.24E5
1.13E3
l. 02E6
Natural source
Steady- Produced state 1975 to 2020
4.57E5 9. 14E4
8.22E4 1. 90E3
5.2E5 9.85E4
9.47E2 2.08E2
1.05E6 l. 92E5
102
switched off, the integration is continued to infinity. Comparing co 11 ect i ve dose commitments from the power scenari os to the 1 atter number is analogous to comparing release rates to the natural production rate.
The estimate of collective dose commitment due to nuclear weapons testing is less than that of any power scenario, even though the cumulat i ve weapons source term is greater than those of the power scenari os (e. g., 1890 MCi vs 1464 MCi for scenario M) (70 EBq vs 54 EBq). Two factors are involved in this relation: first, the population is greatest when the release rate is maximum in each of the power scenarios, and that popul at i on exceeds the 1 eve 1 s of the 1950s and 1960s by a factor greater than 2; and second, the power scenarios involve significant releases to the freshwater aquatic environment (Sect. 5.1. 2. 3) which contribute substantially to dose through food and drinking water, whereas the weapons releases are to the atmosphere (undersea bursts have been ignored) and contaminate the freshwater environment only indirectly. In particular, the dose commitment to a stationary population from a unit release to the compartment representing freshwater lakes and streams is about four times that for a unit release to the atmosphere.
Such comparisons of collective dose commitments are premature, however, until satisfactory estimates of first-pass and regional components can be estimated. There are some indications (Kelly et al., 1975) that these components could account for a significant fraction of the collective dose commitment and further analyses of this problem are currently being conducted.
6. CONCLUSIONS
This study of key parameters related to the assessment of tritium released to the environment leads to several conclusions. It is evident that the production and use of tritium and its release to the biosphere will continue and that tritium is an important contributor to dose from nuclear fuel cycle facilities. Although methodologies exist for evaluat i ng man-made tri t i urn enteri ng the envi ronment, these methodo 1 ogi es vary considerably in complexity and generally apply to chronic exposure conditions only. NCRP methodology,
A new model has been proposed, based primarily upon that maintains both simplicity and the ability to in-
corporate dose from tritium in food products grown at several locations. Our analysis of recent experimental data leads to the conclusion
that a reevaluation of the quality factor for tritium is needed and that a value of 1. 7 for Q is more representative of data pub 1 i shed since 1968. Est imated dose from tritium is 1 i nearly dependent upon quality factor; gi ven the current "conservat i veil approach to radi at i on protect ion, we recommend returni ng to a Q value of 1. 7 for triti urn betas.
Genera 1 agreement appears to exi st among researchers that organically bound tritium in the body must be incorporated into the calculation of dose. Neglecting this fraction can result in underestimation of dose by approximately 20%.
Absolute humidity and drinking water dilution coefficients are important factors in the calculation of dose from environmental releases of tritium. We present data allowing choice of a regional estimate of abso 1 ute humi di ty, rather than the default value of 8 g H20/m3 recommended by the NRC when site-specific data are not available. Dilution coefficients for drinking water have also been recommended for a number of cases, although it is suggested that site-specific water supply data be used when available.
Several models exist which calculate the buildup of tritium in the atmosphere and dose to the global population. Our estimates for the release of man-made tritium to the environment and prediction of collective dose commitment to man suggest that the dose from nuclear weapons
103
104
test i ng wi 11 be 1 ess than that from proposed nucl ear power scenari os even though the cumulative weapons source term is greater than that for any of our energy scenarios.
In summary. tri t i um conti nues to be a radi onucl i de of interest because of the 1 arge quant it i es released to the envi ronment from manmade sources and because of tritium's potentially large contribution to dose around nuclear facilities. This study has reviewed new theoretical and experimental data- that affect the assessment of envi ronmenta 1 releases of tritium and has analyzed the significance of this recent information in terms of the dose to man.
J

105
REFERENCES
Anspaugh, L. R., J. J. Koranda, vI. L. Robison, and J. R. Martin, Dose to Man Via the Food-Chain Transfer Resulting from Exposure to Tritiated Water Vapor, USAEC Report UCRL-73195, Rev. 1 (1972).
Ashley, C., C. C. Zeigler, D. R. Quinsenberry, "Tritium in the Environment at the Savannah River Plant," E. 1. duPont de Nemours and Company, Aiken, SC, DPSPU 79-30-9 (July 1979).
Atomic Industrial Forum (AIF), INFO (News Release), Nuclear Power Plants Outside the U.S., Washington, D.C. (May 1, 1976).
Balanov, M. I., E. I. Dolgirev, and I. A. Likhtarev, "Exchange Kinetics and Dosimetry of Tritium Oxide in Man for Different Routes of Administration," Health Phys. 27:367-75 (1974).
Bander, T. J., D. S. Renne, and W. F. Sandusky, "An Analysis of Tritium Rel eases to the Atmosphere by a Controll ed Thermonucl ear Reactor," Symposium on the Behaviour of Tritium in the Environment, ed,' S. Freeman, pp. 125-138, IAEA, Vi enna (1979).
Baumgartner, A. and E. Reichel, The World Water Balanoe, Elsevier Sci. Pub. Co., New York (1975).
Bedford, J. S., J. B. Mitchell, H. G. Griggs, and M. A. Bender, "Cell Killing by Gamma Rays and Beta Particles from Tritiated Water and Incorporated Tritiated Thymidine," Radiat. Res. 63:531-543 (1975).
Bell, M. J., ORIGEN-The ORNL Isotope Generation and Depletion Code, ORNL-4628 (May 1973).
Bennett, B. G., The Radiation Dose Due to Aoute Intake of Tpitium by Man, USAEC Report, HASL-253 (April 1972) 17 pp.
Bennett, B. G., "Environmental Tritium and the Dose to Man," Prooeedings of the Third International Congress of the IRPA, p. 1047, Washington, DC (September 1973).
Bergman, R., U. Bergstro'm, and S. Evans, "Environmental Transport and Long~Term Exposure for Tritium Released in the Biosphere," Symposium on the Behaviour of Tritium in the Environment, ed. S. Freeman, pp. 535-554, IAEA, Vienna (1979).
Bogen, D. C., G. A. Welford, and C. G. \~hite, "Tritium Distribution in Man and His Environment," Symposium on the Behaviour of Tritium in the Environment, ed. S. Freeman, pp. 567-572, IAEA, Vienna (1979).
Bonka, H., "Production and Emission of Tritium from Nuclear Facilities, and the Resulting Problems," Symposium on the Behaviour of Tritium in the Environment, ed. S. Freeman, pp. 105-121, IAEA, Vienna (1979).

106
Bush, W. R., Assessing and Controlling the Hazard from T~itated Water, USAEC Report, AECL-4150 (April 1972).
Buzzelli, G., S. Langer, C. Jones, and B. Gainey, "Tritium: Fast Fission Yields of 238U and 232Th," Trans. Am. Nual. Soa., 24:458-459 (1976).
Buzzell i, G. and S. Langer, "Thorium Conversion and Tritium Fission Yields in an EBR-II Irradiation," Trans. Am. NuaZ. Soa., 27:283-284 (1977).
Carter, M. W. and A. A. Moghissi, "Three Decades of Nuclear Testing," Health Phys. 33(1):215-219 (April 1977).
Carsten, A. L. and S. L. Commerford, "Dominant Lethal Mutations in Mice Resulting from Chronic Tritiated Water (HTO) Ingestion," Radiat. Res., 66:609-614 (1976).
Caspersson, J. A., M. R. Culwich, J. J. Prabulos, and P. K. Doherty, Initial Assessment of (Th, U) Alternate Fuels Performanae in LMFBRs, CE-FBR-77-370 (COO-2426-108) (August 1978). .
Cawley, C. N., D. B. Spitzberg, W. G. Cale, Jr., and E. J. Feryves, "A Model to Estimate the Biological Half-life of Tritium in Man," Summer Computer Simulation Conferenae, Newport Beaah, California, July 1978.
Croach, J. W., "Theoretical Radiation Dose to the Human System from Assimilated Tritium," Health Phys. 24:17-22 (1973).
Cumming, R. B., G. A. Sega, and M. F. Walton, "Radiation Dosimetry in Experimental Animals Exposed to Tritiated Water Under D.ifferent Condi tions," Symposium on the Behaviour of Tritium in the Environment, ed. S. Freeman, pp. 463-467, IAEA, Vienna (1979).
Davis, W., Jr., R. E. Blanco, B. C. Finney, G. S. Hill, R. E. Moore, and J. P. Witherspoon, Correlation of Radioaative Waste Treatment Costs and the Environmental Impaat of flaste Effluents in the NuaZear Fuel Cyale -Reprooessing of High Temperature Gas-Cooled Reaotor Fuel Containing U-233 and Thorium, ORNL/NUREG/TM-4 (May 1976).
Dobson, R. L., J. H. Arrington, and T. C. Kwan, Tritium Toxioity: Inoreased Relative Biologioal Effeativeness of 3HOH with Protraotion of Exposure, UCRL-76558 (March 1975).
Dobson, R. L., C. G. Koehler, J. S. Felton, C. Kwan, B. J. Wuebbles, and D. C. L. Jones, "Vulnerability of Female Germ Cells in Developing Mice and Monkeys to Tritium, Gamma Rays, and Polycyclic Aromatic Hydrocarbons," Proaeedings of the Severtteenth Hanford Biology Symposium, Oatober 16-18, 1977, Riohland, Washington.

107
Dobson, R. L. and T. C. Kwan, "The RBE of Tritium Radiation Measured in Mouse Oocytes: Increase at Low Exposure Level s," Radiat. Res., 66:615-625 (1976).
Dunning, D. E., Jr., S. R. Bernard, P. J. Walsh, G. G. Killough, and J. C. Pleasant, Estimates of Internal Dose Equivalent to 22 Target Organs for Radionuolides Ooourring in Routine Releases from Nuolear Fuel-Cyole Faoilities - Vol. II, NUREG/CR-0150, ORNL/NUREG/TM-190/V2 (October 1979).
Easterly, C. E. and D. G. Jacobs, "Tritium Release Strategy for a Global System," Prooeedings of Radiation Effeots and Tritium Teohnology for Flision Reaotors, Vol. III, eds.J. S. Watson and F. W. Wiffen, CONF-750989, Springfield, Virginia (October 1975).
Ebersole, E. R., W. R. Vroman, and J. R. Krsul, Trans. Am. Nuol. Soo., 14(1):321 (1971).
ENDF/BVIV Library - Tapes 401-411 and 414-419, National Neutron Cross Section Center, Brookhaven National Laboratory (December 1974).
Etnier, E. L., "Regional and Site-Specific Absolute Humidity Data for Use in Tritium Dose Calculations," Health Phys. In Press (1980).
Evans, A. G., "New Dose Estimates from Chronic Tritium Exposures," Health phys. 16:57-63 (1969).
Finney, B. C., R. E. Blanco, R. C. Dahlman, G. S. Hill, F. G. Kitts, R. E. Moore, and J. P. Witherspoon, Correlation of Radioaotive Waste Treatment Costs and the Environmental Irrrpaot of vlaste Effluents in the Nuolear Fuel Cyole - Reprooessing Light Water Reactor Fuel, ORNL/NUREG/TM-6 (January 1977).
Flamm, E., R. E. Lingenfelter, J. F. MacDonald, and W. F. Libby, "Tritium and Helium-3 Solar Flares and Loss of Helium from the Earth's Atmosphere," Soienoe, 138:48 (1962).
Gainey, B. W., A Review of Tritium Behavior in HTGR Systems, GA-AI3461, General Atomics Corporation (April 30, 1976).
Glasstone S. and P. J. Dolan, The Effeots of Nuolear Weapons, NWA Third Edition, U.S. Department of Defense and U.S. Department of Energy (1977) .
Goode, J. R. and C. M. Cox, The Distribution of Fission Produot Tritium in Ziroalloy-Clad U02 Blanket Rod from PWR-l, ORNL/TM-2994 (1970).
Goode, J. R. and J. C. A. Vaughen, Experiments on Behavior of Tritium During Head-End Prooessing of Irradiated Reaotor Fuel, ORNL/TM-2793 (February 1970).
108
Gorman, D. J. and K. Y. Young, "Environmental Aspects of Tritium from CANDU Station Releases," Symposium on the Behaviour of Tritium in the Environment, ed. S. Freeman, pp. 623-632, IAEA, Vienna (1979).
Hanrahan, E. J., R. H. Will iamson, and R. W. Brown, "World Requirements and Supply of Uranium," Atomic Industrial- Forum International- Conference on Uranium, Geneva, Switzerl-and, September 13-18, 1976.
Harrison, F. L. and J. J. Koranda, "Tritiation of Aquatic Animals in an Experimental Freshwater Pool," Proceedings of the Third National Symposium on Radioecology, Oak Ridge, Tennessee (May 10-12, 1971) CONF-710501-P1, pp. 425-434 (1971).
Hatch, F. T. and J. A. Mazrimas, "Tritiation of Animals from Tritiated Water," Radiat. Res. 50:339-357 (1972).
Hoenes, G. R. and J. V. Soldat, Age-Specific Radiation Dose Commitment Factors for a One-Year Chronic Intake, NUREG-0172 (1977).
International Atomic Energy Agency, Power Reactors in Member States-1975 Edition, STI/PUB/423, IAEA, Vienna (1975).
International Atomic Energy Agency, Symposium on the Behaviour of Tritium in the Environment, ed. S. Freeman, STI/PUB/498, IAEA, Vienna (1979) .
International Commission on Radiological Protection, Report of Commit-tee II on Permissible Dose for Internal- Radiation, ICRP Publication 2, Pergamon Press, Oxford (1959).
International Commission on Radiological Protection, The Evaluation of Risks from Radiation, Publication 8, Pergamon Press, Oxford (1966).
International Commission on Radiological Protection, Recommendations of the International Commission on Radiological Protection (Adopted September 17, 1965), ICRP Publication 9, Pergamon Press, Oxford (1966) .
International Commission on Radiological Protection, "Progress Report," Health Phys. 17:389 (1969).
International Commission on Radiological Protection, Report of the Task Group on Reference Man, ICRP Publication 23, Pergamon Press, Oxford (1975).
International Commission on Radiation Units and Measurements, Radiation Quantities and Units, Report lOa, NBS Handbook 84,.Washington, DC (1962).
> •
, .~ ..
109
Istomina, A. G. and Yu 1. Moskalev, "Kinetics of Accumulation and Tissue Doses in Chronic Administration of Tritium Oxide to Rats," Biologiaal Effeats of Radiation from External and Internal SOUY'aes, (ed. Yu I. Moskalev and V. S. Kalistratova), Moscow, Meditsino, pp. 160:68, (1972).
Jacobs, D. G., Souraes of Tritium and Its Behavior Upon Release to the Environment, Report No. TID-24635, U.S. Atomic Energy Commission, Washington, DC (1968).
Jacobs, D. G., C. E. Easterly, and J. E. Phillips, "The Influence of the Rate of Conversion of HT to HTO on Projected Radiation Doses from Release of Molecular Tritium," Symposium on the Behaviour of Tritium in the Environment, ed. S. Freeman, IAEA, Vienna (1979).
Kabele, T. J., Parametria Study of the Tritium Distribution in the FFTF, HEDL-TME 74-6 (February 1974).
Kaye, S. V. and J. E. Till, "Environmentally Important Radionuclides in Nonproliferative Fuel Cycles," Proaeedings of the Conferenae on Radioaktivitat und Umwelt, Norderney, Federal Republic of Germany (October 1978).
Kee, C. W., A. G. Croff, and J. O. Blomeke, Updated Projeations of Radioaative Wastes to be Generated by the U.S. Nualear Power Industry, USERDA Report ORNL/TM-5427 (1976).
Kelly, G. N., J. A. Jones, P. M. Bryant, and F. Morley, The Prediated Radiation Ewposure of the Population of the European Community Resulting from Disaharges of Krypton-8o, Tritium, Carbon-14, and Iodine-129 from the Nualear Power Industry to the Year 2000, Commission of the European Communities, Directorate of Health Protection, Directorate-General for Social Affairs, Luxembourg, Doc V/2676/75 (1975).
Killough, G. G., D. E. Dunning, Jr., S. R. Bernard, and J. C. Pleasant, Estimates of Internal Dose Equivalent to 22 Target Organs for Radionualides Oaaurring in Routine Releases from Nualear Fuel-Cyale Faailities, Vol. I, ORNL/NUREG/TM-190 (1978).
Killough, G. G. and J. E. Till, "Scenarios of IltC Releases from the World Nuclear Power Industry from 1975 to 2020 and Estimated Radiological Impact," Nual. Saf. 19(5) :602-617 (September-October 1978).
Kocher, D. C., Dose-Rate Conversion Faators for External ExposUY'e to Photon and EZeatron Radiation from RadionuaZides OaaUY'ring in Routine Releases from Nualear Fuel CyaZe Faailities, NUREG/CR-0494, ORNL/NUREG/TM-283 (February 1979).
Kouts, H. and J. Long, "Tritium Production in Nuclear Reactors," Tritium, eds. A. A. Moghissi and M. W. Carter, Messenger Graphics, Phoenix, Ari zona (1973).
110
Krejci, K. and A. Zeller, Jr., "Tritium Pollution in Swiss Luminous Compound Industry," Symposiwn on the Behaviour of Tritiwn in the Environment, ed. S. Freeman, pp. 67-78, IAEA, Vienna (1979).
Lambert, B. E., "Cytological Damage Produced in the Mouse Testes by Tritiated Thymidine, Tritiated Water, and X-Rays," Health Phys. 17:547-557 (1969).
Lambert, B. E. and R. J. Clifton, "Radiation Doses Resulting from the Administration of Tritiated Folic Acid and Tritiated Water to the Rat," Br. J. Radiol. 40:56-61 (1967).
Leipunsky, O. I., "The Radiation Hazards of Explosions of Pure Hydrogen in Ordinary Atomic Bombs," Atomnaya Energy, 3:530 (1957). (English translation in Fallout from Nuclear Weapons Tests, U.S. Congressional Hearings 1959, Vol. 3, pp. 24-27).
Lewis, W. B. and J. S. Foster, Canadian Operating Experience with Heavy Water Power Reactors, Report No. AECL-3569, Atomic Energy of Canada Limited, Chalk River, Ontario (1970).
Mason, A. S. and H. G. Ostlund, "Atmospheric HT and HTO: Distribution and Large-Scale Circulation," Symposiwn on the Behaviour of Tritiwn in the Environment, ed. S. Freeman, pp. 3-15, IAEA, Vienna (1979).
McDowell-Boyer, L. M. and F. R. O'Donnell, Radiation Dose Estimates from Time-Pieces Containing Tritiwn or Promethiwn-147 in Radiolwninous Paints, ORNL/NUREG/TM-150 (1978a).
McDowell-Boyer, L. M. and F. R. O'Donnell, Estimates of Potential Radiation Doses from Wristwatches Containing Tpitiwn Gas, ORNL/NUREG/ TM-225 (1978b).
Miske1, J. A., "Production of Tritium by Nuclear Weapons," in Tritiwn, eds. A. A. Moghissi and M. W. Carter, Messenger Graphics, Phoenix, Ari zona, (1973).
Moore, R. E., C. F. Baes III, L. M. McDowell-Boyer, A. P. Watson, F. O. Hoffman, J. C. Pleasant, and C. W. Miller, AIRDOS-EPA: A Computerized Methodology for Estimating Environmental Concentrations and Dose to Man from Airborne Releases of Radionuclides, ORNL-5532 (1979).
Moska1ev, Y. 1., V. F. Zhurav1ev, and A. G. Istomina, "Relative Biological Effectiveness of Tritium," in Tritiwn, eds. A. A. Moghissi and M. W. Carter, Messenger Graphics, Phoenix, Arizona (1973).
Moska1ev, Y. I., V. F. Zhurav1ev, V. S. Ka1istratova, A. G. Istomina, J. K. Petrovich, and D. A. Kazbekova, "Evaluation of Relative Biological Effectiveness of Tritium Oxide," Biological Effects of Radiation from External and Internal Sources, eds. Y. I. Moska1ev and V. S. Ka1istratova, ISAEC Report AEC-tr-7457 (1972),
, ,
, '
<.I •

111
Murphy, C. E., Jr. and M. M. Pendergast, "Environmental Transport and Cycling of Tritium in the Vicinity of Atmospheric Releases," Symposium on the Behavioup of Tritium in the Enviponment, ed. S. Freeman, pp. 361-371, IAEA, Vienna (1979).
National Council on Radiation Protection and Measurements, Tritium in the Enviponment, NCRP Report No. 62, Washington, DC (1979a).
National Council on Radiation Protection and Measurements, Tritium and Othep Radionuo~ide Labe~ed Organio Compounds Inooppopated in Genetia Matepia~, NCRP Report No. 63 (1979b).
National Oceanic and Atmospheric Administration, U.S. Standapd Atmosphepe, 1976, Report No. NOAA-S/T76-1562, Boulder, Colorado (1976).
National Oceanic and Atmospheric Administration, C~imato~ogiaa~ Data, Annua~ SummaPy, Vol. 28 (13), U.S. Department of Commerce (1977).
Nir, A., S. T. Kruger, R. E. Lingenfelter, and E. J. Flamm, "Natural Tritium," Rev. Geophys. 4(4):441 (1966).
Organization for Economic Cooperation and Development, and the International Atomic Energy Agency, "Uranium Resources, Production and Demand," IAEA, Vienna (1975).
Peterson, H. T., J. E. Martin, C. L. Weaver, and E. D. Harward, "Environmental Tritium Contamination from Increasing Utilization of Nuclear Energy Sources," Enviponmenta~ Contamination by Radioaotive Matepia~s, IAEA Report SM-117/78 (1969).
Pinson, E. A., E. C. Anderson, and V. Lotz, The speaifia Aotivity of Tritium in the Opgania Components of the Skin and Fat of Man Fo~~owing Eight Months' Chponia Exposupe to HTO in Body F~uids, USAEC Report LA-1468, 8 pp. (October 1952).
Richold, P. H. C. V., J. A. B. Gibson, and M. Marshall, The Re~ative Bio~ogiaal Effeativeness of Tritium in Aqueous So~utions of Ribonualease, AERE-R 6951 (1971).
Rohwer, P. S., Relative Radio~ogiaal Impoptanoe of Enviponmentally Released Tritium and Rrypton-85, IAEA-SM-172/76, p. 79-90 (1976).
Rohwer, P. S. and H. W. Wilcox, "Radiological Aspects of Environmental Tritium," Nual. Saf. 17:216-222 (1976).
Russell, W. L., R. B. Cumming, E. M. Kelly, and E. L. Phipps, "Induction of Specific-Locus Mutations in the Mouse by Tritiated Water," Symposium on the Be7mvioup of Tpitium in the Enviponment, ed. S. Freeman, pp. 489-495, IAEA, Vienna (1979).

112
Sanders, S. M., Jr. and W. C. Reinig, "Assessment of Tritium in Man," in Diagnosis and Treatment of Deposited Radionuolides (ed. H. A. Kornberg and W. D. Norwood) Excerpta Media Foundation, pp. 534-542 (1968).
Schell, W. R., G. Sauzay, and B. R. Payne, "World Distribution of Environmental Tritium," Prooeedings of Physioal Behavior of Radioaotive Contaminants in the Atmosphere, IAEA-SM-181/34, Vienna (November 1973).
Snyder, W. S., B. R. Fish, S. R. Bernard, and M. R. Ford, "Urinary Excretion of Tritium Following Exposure of Man to HTO - A Two Exponential Model," Phys. Med. Biol. 13:574-559 (1968).
Soldat, J. K. and D. A. Baker, "Worldwide Population Doses from Tritium Released from Nuclear Facilities," Symposium on the Behaviour of Tritium in the Environment, ed. S. Freeman, pp. 575-581, IAEA, Vi enna (1979).
Strand, J. A. and R. C. Thompson, Biologioal Effeots of Tritium Releases from Fusion Power Plants, USERDA Report BNWL-2022 (September 1976).
Tadmor, J., "Deposition of 85Kr and Tritium Released from a Nuclear Fuel Reprocessing Plant," HeaZth Phys. 24:37 (1973).
Taylor, F. E. and G. A. M. Webb, Radiation Exposure cf the U.K. Population, National Radiological Protection Board, NK2B-R77 (1978).
Tennery, V. J., E. S. Bomar, W. D. Bond, H. R. Meyer, L. E. Moore, and J. E. Till, Environmental Assessment of Alternate FBR Fuels: Radiological Assessment of Reprooessing and Refabrioation of Thorium/ Uranium Carbide Fuel, ORNL/TM-6493 (August 1978).
Tennery, V. J., L. E. Morse, E. S. Bomar, R. D. Seagren, W. D. Bond, L. B. Shappert, G. S. Hill, and J. E. T1ll, Environmental Assessment of LMFBR Advanced FUels: A Radiologioal Analysis of Fuel Reprooessing, Refabrioation, and Transportation, ORNL-5230 (November 1976).
Thompson, R. C., Effeot of Body Distribution and Retention of Tritium on the Hazard of Exposure to Tritium Oxide, HW-30340 (1954).
Thompson, R. C. and J. E. Ballou, Distribution of Bound Tritium in the Rat Following Chronio Exposure to Tritium Oxide, HW-30437 (January 1954) .
Till, J. L, H. R. Meyer, L. E. Morse, W. D. Bond, E. S. Bomar, V. J. Tennery, "Reprocessing Nuclear Fuels of the Future: A Radiological Assessment of Advanced (Th, U) Carbide Fuel," Nuol. Technol. (in
"
press). ~
113
United Nations, Concise Report on the World Population Situation in 1970 - 1975 and Its Long-Range Implications, UN Report ST/ESA/ SER.A/56, New York: UN Department of Economic and Society Affairs (1974).
U.S. Atomic Energy Commission, Environmental Survey of the Uranium Fuel cycle, WASH-1284 (April 1974a).
U.s. Atomic Energy Commission, Proposed Final Environmental Statement, Liquid Metal Fast Breeder Reactor Program, WASH-1535 (December 1974b).
u.s. Department of Commerce, "Climatic Atlas of the United States," National Climatic Center, Asheville, NC (1968).
U.S. Energy Research and Development Administration, Office of Planning and Analysis, unpublished data on nuclear energy growth projections through the year 2000 (March 1975).
U.S. Energy Research and Development Administration, Final Environmental Statement, Light Water Breeder Reactor Program, ERDA-1541 (June 1976a).
U.S. Energy Research and Development Administration, Nuclear Reactors Built, Being Built, or Planned in the u.S. as of June 30, 1976, ERDA Report TID-8200-R34 (1976b).
U.S. Environmental Protection Agency, Environmental Analysis of the Uranium Fuel Cycle, Part III, Nuclear Fuel Reprocessing, EPA-520/ 9-73-003-D, U.S. Environmental Protection Agency, Office of Radiation Programs, Washington, DC (October 1973).
U.S. Environmental Protection Agency, Environmental Radiation Protection Standards for Nuclear Power o,oerations, Title 40, Part 190, Federal Register, Vol. 42, No.9 (January 1977).
U.S. Nuclear Regulatory Commission, Calculation of Annual Doses to Man from Routine Releases of Reactor Effluents for the Purpose of Evaluating Compliance with 10 CFR Part 50, Appendix I, Regulatory Guide 1.109 (1977).
Van den Hoek, J., "Transfer and Incorporation of Tritium in Mammals," Symposium on the Behavior of Tritium in the Environment, ed. S. Freeman, IAEA, Vienna (1979).
Vennart, J. "The Qual ity Factor for Low-Energy tl-Emitters," Health Phys. 541-548 (1968).
\<lehner, G., "Discharges of Tritium to the Environment from Unrestricted Use of Consumer Products Containing this Radionucl ide," Symposium on the Behaviour of Tritium in the Environment, ed. S. Freeman, pp. 79-92, IAEA, Vienna (1979).
114
Weiss, W., W. Roether, and E. Dreisigacker, "Tritium in the North Atlantic Ocean: Inventory, Input and Transfer into Deep Water," Symposium on the Behaviour of Tritium in the Environment, ed. S. Freeman, pp. 315-334, IAEA, Vienna (1979).
Wozadlo, G. P. B. F. Rubin, and P. Roy, TPitium Analysis of Mixed-Oxide Fuel Rods Irradiated in a Fast Flux, GEAP-13864 (August 1972).
Young, J. R., B. F. Gore, D. D. Mahlum, J. A. Strand, R. C. Thompson, and J. K. Soldat, Info~ation Requirements for Controlled Thermonuclear Reactor Environmental Impact Statements, BNWL-1883 (January 1975).
, '
. '
I
, \
\ 7 • . '
1. 2. 3. 4. 5. 6. 7. 8. 9.
10. 11. 12. 13. 14. 15. 16. 17. 18. 19.
20-24. 25. 26. 27. 28. 29. 30. 31. 32. 33. 34. 35. 36.
37-41. 42.
S. I. Auerbach C. F. Baes III B. A. Berven R. E. Blanco B. G. Bl ayl ock E. E. Bloom E. S. Bomar S. J. Cotter K. E. Cowser D. J. Crawford W. Davis, Jr. H. W. Dickson R. W. Doane R. G. Donnelly D. E. Dunning C. E. Easterly K. F. Eckerman B. S. Ellis J. W. Elwood E. L. Etnier M. L. Frank R. D. Gentry W. A. Goldsmith W. O. Harms G. S. Hill F. O. Hoffman C. F. Holoway F. J. Homan H. S. Hoy K. K. Kanak P. R. Kasten S. V. Kaye G. G. Killough D. C. Kocher
115
ORNL/TM-6990 Dist. Categories UC-79b, -79c
INTERNAL DISTRIBUTION
43. 44. 45. 46.
47-51. 52. 53. 54. 55. 56. 57. 58. 59. 60. 61. 62. 63.
64-88. 89. 90. 91. 92. 93. 94.
95-194. 195-199.
200. 201. 202.
203-204. 205.
206-207. 208. 209.
C. A. Little E. L. Long, Jr. A. L. Lotts L. M. McDowell-Boyer H. R. Meyer C. W. Miller B. D. Murphy T. W. Oakes F. R. 0 I Donne 11 A. R. 01 son D. C. Parzyck P. Patriarca H. A. Pfuderer J. E. Phillips M. L. Randolph D. E. Reichle C. R. Richmond P. S. Rohwer T. H. Row W. L. Russell M. T. Ryan G. Schwarz K. E. Shank R. W. Shor V. J. Tennery J. E. Till C. C. Travis V. C. A. Vaughn J. P. Witherspoon Central Research Library Document Reference Section Laboratory Records Department Laboratory Records, ORNL-RC ORNL Patent Office
EXTERNAL DISTRIBUTION
210. Manager, National Breeder Reactor Safety Program, Argonne National Laboratory, Technical Management Center, 9700 South Cass Ave. , Argonne, IL 60439.
211. George L. Sherwood, Office of Nuclear Energy Programs, Plans and Analysis Division, Germantown, MD 20767 .
212-216. Director, DOE Division of Reactor Research and Development, Washington, DC 20545.
116
217. Chief, Physics and Safety Branch, DOE Division of Reactor Research and Development, Washington, DC 20545.
218. Chief, Safety Section, DOE Division of Reactor Research and Development, Washington, DC 20545.
219. Office of Assistant Manager, Energy Research and Development, DOE, Oak Ridge Operations Office, P. O. Box E, Oak Ridge, TN 37830.
220-404. Given distribution as shown in TID-4500 distribution categories UC-79b (Fuels and Materials Engineering Development) and UC-79c (Fuel Recycle).
RU.S. GOVERNMENT PRINTING OFFICE: 1980·64().245/055
;-
I,