Embed Size (px)
Citation preview

Monthly Labor Review October 2006 35
‘
Trends in labor force participationin the United States
After a long-term increase, the overall labor force participation ratehas declined in recent years; although there was a sharp risein participation among individuals aged 55 years and older,this increase did not offset declines in the participation ratesof younger persons
Abraham MosisaandSteven Hipple
Abraham Mosisa andSteven Hipple areeconomists in theDivision of Labor ForceStatistics, Bureau ofLabor Statistics.
The labor force participation rate—the pro- portion of the working-age population either working or actively looking for
work—is an important labor market measurebecause it represents the relative size of laborresources available in the production of theNation’s goods and services.1 After rising fairlysteadily for more than five decades, the laborforce participation rate peaked at 67.1 percent inthe late 1990s. However, since 1999, the rate hasreceded—to 66.0 percent in 2004–05. (See chart1 and table 1.)
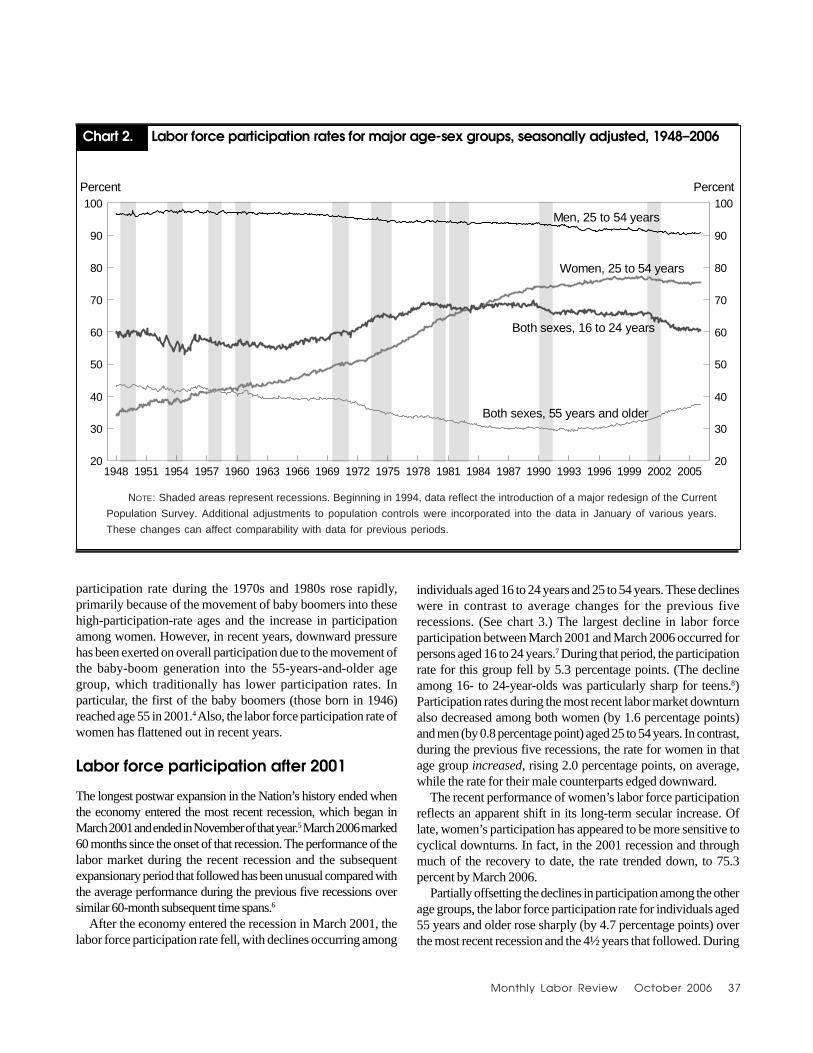
The decrease in labor force participation inrecent years occurred across most of the major age-sex groups. (See chart 2 and table 1.) The par-ticipation rate for persons aged 16 to 24 years—especially teenagers aged 16 to 19 years—droppedsharply. Among individuals aged 25 to 54 years,the rate for women decreased after rising steadilyfor more than a half century. The rate for men aged25 to 54 years continued its long-term decline,reaching an all-time low in 2005. Since about 1995,however, a dramatic increase in labor forceparticipation among individuals aged 55 years andolder bucked these trends.
In the short term, the participation rate isprocyclical. That is, the rate increases duringeconomic expansions, when more individuals jointhe labor force because jobs are easier to find, andfalls during economic downturns, as individualsleave the labor force altogether in response torelatively fewer job opportunities. In addition tocyclical influences, longer term structural factors
have had an important impact on labor forceparticipation. Among these factors are changes inthe age composition of the population, changes inthe propensity of women to participate in the laborforce, a rise in school enrollment, and changes toemployer-provided private pensions and SocialSecurity.
Using labor force estimates from the CurrentPopulation Survey (CPS), this article analyzeshistorical trends in labor force participation,focusing primarily on recent trends.2 The analysishighlights changes in labor force participationamong various demographic groups, discussespossible reasons for those changes, and explainshow the changes affected the overall participationrate.
Population change
For nearly six decades, an event that has had a pro-found effect on the population’s size and com-position has been the aging of the “baby-boom”generation—those born between 1946 and 1964.3The baby-boom generation—and the concomitantrise in participation of women—have had anenormous impact on overall participation. Table 2shows the change in the noninstitutional civilianpopulation by age group since 1950. During the1970s and 1980s, baby boomers moved into agecohorts typically exhibiting very high levels of laborforce participation—for example, 25 to 34 years and35 to 44 years. Indeed, after being stagnant overthe 1950s and 1960s, the aggregate labor force
Trends in labor Force Participation

36 Monthly Labor Review October 2006
Trends in Labor force Participation
Labor force participation rates by age and sex, selected years, annual averages, 1948–2005
1948 ................. 58.8 59.2 96.6 35.0 43.31950 ................. 59.2 59.9 96.5 36.8 43.01955 ................. 59.3 56.1 97.4 39.8 42.11960 ................. 59.4 56.4 97.0 42.9 40.91965 ................. 58.9 55.8 96.7 45.2 39.41970 ................. 60.4 59.8 95.8 50.1 38.91975 ................. 61.2 64.6 94.4 55.1 34.71980 ................. 63.8 68.1 94.2 64.0 32.81985 ................. 64.8 68.3 93.9 69.6 30.31990 ................. 66.5 67.3 93.4 74.0 30.1
1994 ................. 66.6 66.4 91.7 75.3 30.11995 ................. 66.6 66.3 91.6 75.6 30.01996 ................. 66.8 65.5 91.8 76.1 30.31997 ................. 67.1 65.4 91.8 76.7 30.91998 ................. 67.1 65.9 91.8 76.5 31.31999 ................. 67.1 65.5 91.7 76.8 31.82000 ................. 67.1 65.8 91.6 76.7 32.42001 ................. 66.8 64.5 91.3 76.4 33.22002 ................. 66.6 63.3 91.0 75.9 34.52003 ................. 66.2 61.6 90.6 75.6 35.72004 ................. 66.0 61.1 90.5 75.3 36.22005 ................. 66.0 60.8 90.5 75.3 37.2
Year Both sexes, 16 yearsand older
Both sexes, 16 to 24 years
Both sexes,55 years and older
Table 1.
Men,25 to 54 years
Women,25 to 54 years
1948 1951 1954 1957 1960 1963 1966 1969 1972 1975 1978 1981 1984 1987 1990 1993 1996 1999 2002 200550
60
70
50
60
70Percent Percent
Chart 1. Civilian labor force participation rate of persons 16 years and older, seasonally adjusted, 1948–2006
NOTE: Shaded areas represent recessions. Beginning in 1994, data reflect the introduction of a major redesign of the Current
Population Survey. Additional adjustments to population controls were incorporated into the data in January of various years.
These changes can affect comparability with data for previous periods.
Monthly Labor Review October 2006 37
participation rate during the 1970s and 1980s rose rapidly,primarily because of the movement of baby boomers into thesehigh-participation-rate ages and the increase in participationamong women. However, in recent years, downward pressurehas been exerted on overall participation due to the movement ofthe baby-boom generation into the 55-years-and-older agegroup, which traditionally has lower participation rates. Inparticular, the first of the baby boomers (those born in 1946)reached age 55 in 2001.4 Also, the labor force participation rate ofwomen has flattened out in recent years.
Labor force participation after 2001
The longest postwar expansion in the Nation’s history ended whenthe economy entered the most recent recession, which began inMarch 2001 and ended in November of that year.5 March 2006 marked60 months since the onset of that recession. The performance of thelabor market during the recent recession and the subsequentexpansionary period that followed has been unusual compared withthe average performance during the previous five recessions oversimilar 60-month subsequent time spans.6
After the economy entered the recession in March 2001, thelabor force participation rate fell, with declines occurring among
individuals aged 16 to 24 years and 25 to 54 years. These declineswere in contrast to average changes for the previous fiverecessions. (See chart 3.) The largest decline in labor forceparticipation between March 2001 and March 2006 occurred forpersons aged 16 to 24 years.7 During that period, the participationrate for this group fell by 5.3 percentage points. (The declineamong 16- to 24-year-olds was particularly sharp for teens.8)Participation rates during the most recent labor market downturnalso decreased among both women (by 1.6 percentage points)and men (by 0.8 percentage point) aged 25 to 54 years. In contrast,during the previous five recessions, the rate for women in thatage group increased, rising 2.0 percentage points, on average,while the rate for their male counterparts edged downward.
The recent performance of women’s labor force participationreflects an apparent shift in its long-term secular increase. Oflate, women’s participation has appeared to be more sensitive tocyclical downturns. In fact, in the 2001 recession and throughmuch of the recovery to date, the rate trended down, to 75.3percent by March 2006.
Partially offsetting the declines in participation among the otherage groups, the labor force participation rate for individuals aged55 years and older rose sharply (by 4.7 percentage points) overthe most recent recession and the 4½ years that followed. During
1948 1951 1954 1957 1960 1963 1966 1969 1972 1975 1978 1981 1984 1987 1990 1993 1996 1999 2002 200520
30
40
50
60
70
80
90
100
20
30
40
50
60
70
80
90
100
Chart 2. Labor force participation rates for major age-sex groups, seasonally adjusted, 1948–2006
Percent
NOTE: Shaded areas represent recessions. Befinning in 1994, data reflect the introduction of a major redesign of the Current Population Survey. Additional adjustments to population controsl were incorporated into the data in January of various years. These changes can affect comparability with data for previous periods.
Percent
Men, 25 to 54 years
Women, 25 to 54 years
Both sexes, 16 to 24 years
Both sexes, 55 years and older
NOTE: Shaded areas represent recessions. Beginning in 1994, data reflect the introduction of a major redesign of the Current
Population Survey. Additional adjustments to population controls were incorporated into the data in January of various years.
These changes can affect comparability with data for previous periods.
38 Monthly Labor Review October 2006
Trends in Labor force Participation
Annual growth rates of the civilian noninstitutional population, by sex and age, 1950–2005
Total, 16 years and older ............. 1.1 1.6 2.0 1.2 1.2 1.2Men ..................................................... .9 1.5 2.1 1.3 1.2 1.4Women ................................................ 1.3 1.7 2.0 1.1 1.1 1.1
16 to 19 years .................................... 2.3 3.6 1.3 –1.3 .9 .620 to 24 years .................................... –.8 4.1 3.0 –.9 –.3 2.125 to 34 years .................................... –.5 1.1 4.1 1.6 –1.0 .235 to 44 years .................................... 1.3 –.4 1.3 4.0 1.6 –.645 to 54 years .................................... 1.8 1.1 –.2 1.1 4.1 2.355 years and older ............................. 2.2 1.9 2.1 .9 1.4 2.5
55 to 59 years ............................... – – 1.5 –1.1 2.7 5.160 to 64 years ............................... – – 1.9 .4 .3 3.765 years and older ........................ 3.0 2.2 2.5 1.8 1.4 .9
Age of oldest (1946) baby boomers .. 4 to 14 years 14 to 24 years 24 to 34 years 34 to 44 years 44 to 54 years 54 to 59 years
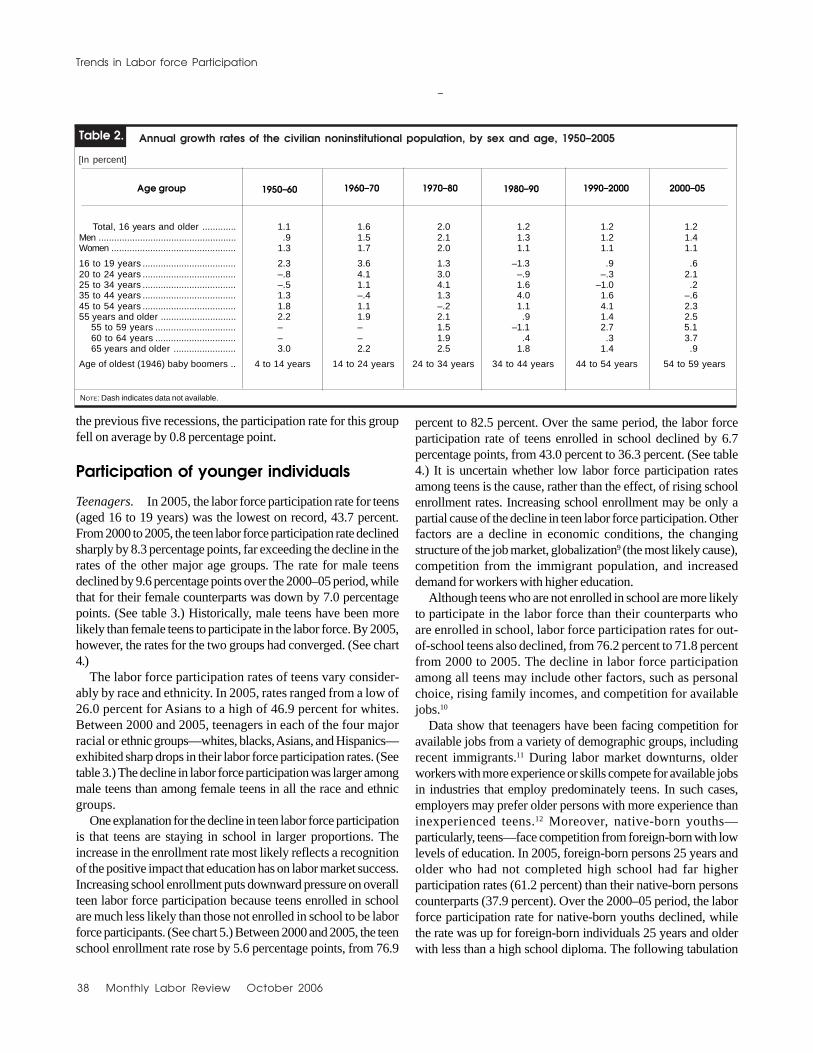
the previous five recessions, the participation rate for this groupfell on average by 0.8 percentage point.
Participation of younger individuals
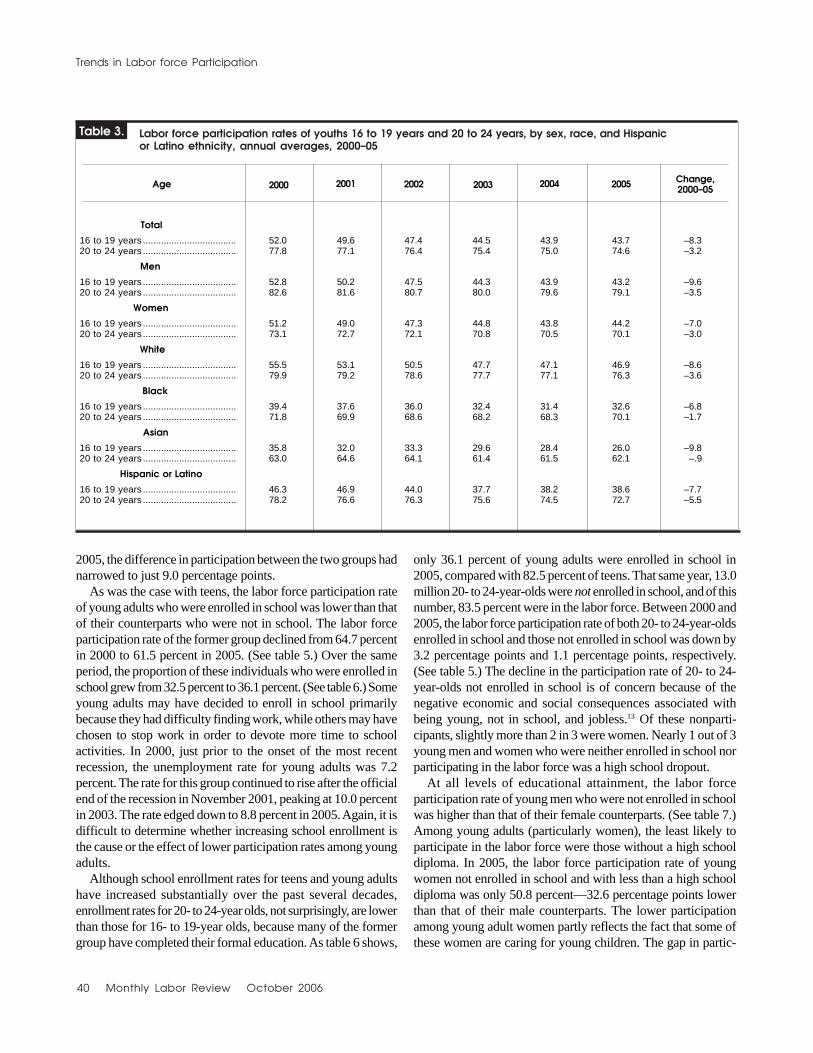
Teenagers. In 2005, the labor force participation rate for teens(aged 16 to 19 years) was the lowest on record, 43.7 percent.From 2000 to 2005, the teen labor force participation rate declinedsharply by 8.3 percentage points, far exceeding the decline in therates of the other major age groups. The rate for male teensdeclined by 9.6 percentage points over the 2000–05 period, whilethat for their female counterparts was down by 7.0 percentagepoints. (See table 3.) Historically, male teens have been morelikely than female teens to participate in the labor force. By 2005,however, the rates for the two groups had converged. (See chart4.)
The labor force participation rates of teens vary consider-ably by race and ethnicity. In 2005, rates ranged from a low of26.0 percent for Asians to a high of 46.9 percent for whites.Between 2000 and 2005, teenagers in each of the four majorracial or ethnic groups—whites, blacks, Asians, and Hispanics—exhibited sharp drops in their labor force participation rates. (Seetable 3.) The decline in labor force participation was larger amongmale teens than among female teens in all the race and ethnicgroups.
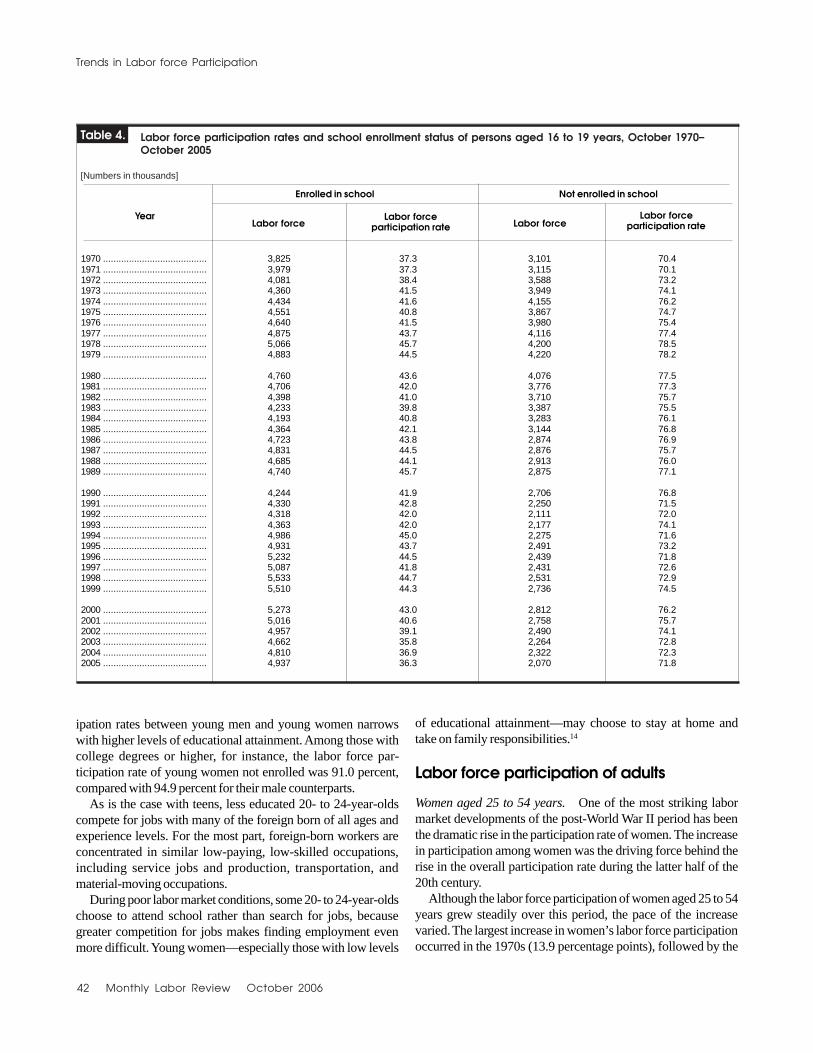
One explanation for the decline in teen labor force participationis that teens are staying in school in larger proportions. Theincrease in the enrollment rate most likely reflects a recognitionof the positive impact that education has on labor market success.Increasing school enrollment puts downward pressure on overallteen labor force participation because teens enrolled in schoolare much less likely than those not enrolled in school to be laborforce participants. (See chart 5.) Between 2000 and 2005, the teenschool enrollment rate rose by 5.6 percentage points, from 76.9
percent to 82.5 percent. Over the same period, the labor forceparticipation rate of teens enrolled in school declined by 6.7percentage points, from 43.0 percent to 36.3 percent. (See table4.) It is uncertain whether low labor force participation ratesamong teens is the cause, rather than the effect, of rising schoolenrollment rates. Increasing school enrollment may be only apartial cause of the decline in teen labor force participation. Otherfactors are a decline in economic conditions, the changingstructure of the job market, globalization9 (the most likely cause),competition from the immigrant population, and increaseddemand for workers with higher education.
Although teens who are not enrolled in school are more likelyto participate in the labor force than their counterparts whoare enrolled in school, labor force participation rates for out-of-school teens also declined, from 76.2 percent to 71.8 percentfrom 2000 to 2005. The decline in labor force participationamong all teens may include other factors, such as personalchoice, rising family incomes, and competition for availablejobs.10
Data show that teenagers have been facing competition foravailable jobs from a variety of demographic groups, includingrecent immigrants.11 During labor market downturns, olderworkers with more experience or skills compete for available jobsin industries that employ predominately teens. In such cases,employers may prefer older persons with more experience thaninexperienced teens.12 Moreover, native-born youths—particularly, teens—face competition from foreign-born with lowlevels of education. In 2005, foreign-born persons 25 years andolder who had not completed high school had far higherparticipation rates (61.2 percent) than their native-born personscounterparts (37.9 percent). Over the 2000–05 period, the laborforce participation rate for native-born youths declined, whilethe rate was up for foreign-born individuals 25 years and olderwith less than a high school diploma. The following tabulation
Age group 1950–60 1960–70 2000–05
Table 2.
1970–80 1990–2000
[In percent]
1980–90
NOTE: Dash indicates data not available.
–

Monthly Labor Review October 2006 39
shows that, in 2005, older foreign-born workers with low levelsof educational attainment and skills worked in occupations similarto those of native-born younger workers:
Foreign born,25 years and
older with lessNative born, than a high
Occupation aged 16 to 24 school diploma
Total employed (thousands) ..... 17,352 5,868Percent distribution ................... 100.0 100.0
Management, business, andfinancial ............................... 4.3 2.1
Professional and related ........ 10.8 1.1Service ................................... 29.1 32.9Sales and related .................... 18.2 5.1Office and administrative
support ............................... 16.6 4.0Farming, fishing, and forestry 1.0 4.8Construction and extraction .. 5.6 18.9Installation, maintenance, and
repair ................................... 2.9 3.5Production ............................. 4.8 17.0Transportation and material
moving ................................. 6.7 10.6
In 2005, roughly 1 in every 3 workers in both groups wasemployed in a service occupation. However, older less educatedforeign-born workers were much more likely than younger native-born workers to hold construction, production, transportation,and farming jobs.
Young adults. The trend in labor force participation from 2000to 2005 among young adults (that is, individuals aged 20 to 24years) is somewhat similar to the trend for 16- to 19-year-olds.However, in relative terms, the decline in participation ofyoung adults was not as steep as it was for teenagers. Over the2000–05 period, the participation rate for young adults fell by 3.2percentage points, compared with a decline of 8.3 percentagepoints for teens. (See table 3.)
The decrease in labor force participation from 2000 to 2005was about the same for young men and young women: 3.5 and3.0 percentage points, respectively. Unlike the situation withteens, the labor force participation rate of young men was stillhigher than that of young women in 2005. Nonetheless, overthe past half century, the gap in labor force participationamong young men and young women has narroweddramatically. For example, in 1959, the labor force participationrate of young men was 87.8 percent, compared with 45.1 percentfor young women—a difference of 42.7 percentage points. By
-6
-4
-2
0
2
4
6
0
-6
-4
-2
0
2
4
6
Total, 16 yearsand older
Chart 3. Change in labor force participation rates around economic downturns, by age and sex
0
2
4
6
–2
–4
–6
0
–2
–4
–6
6
4
2
Men, 25 to 54years
Women, 25 to 54years
Total, 55 yearsand older
Total, 16 to 24years
Change, March 2001 to March 2006
Average for previous five recessions
40 Monthly Labor Review October 2006
Trends in Labor force Participation
2005, the difference in participation between the two groups hadnarrowed to just 9.0 percentage points.
As was the case with teens, the labor force participation rateof young adults who were enrolled in school was lower than thatof their counterparts who were not in school. The labor forceparticipation rate of the former group declined from 64.7 percentin 2000 to 61.5 percent in 2005. (See table 5.) Over the sameperiod, the proportion of these individuals who were enrolled inschool grew from 32.5 percent to 36.1 percent. (See table 6.) Someyoung adults may have decided to enroll in school primarilybecause they had difficulty finding work, while others may havechosen to stop work in order to devote more time to schoolactivities. In 2000, just prior to the onset of the most recentrecession, the unemployment rate for young adults was 7.2percent. The rate for this group continued to rise after the officialend of the recession in November 2001, peaking at 10.0 percentin 2003. The rate edged down to 8.8 percent in 2005. Again, it isdifficult to determine whether increasing school enrollment isthe cause or the effect of lower participation rates among youngadults.
Although school enrollment rates for teens and young adultshave increased substantially over the past several decades,enrollment rates for 20- to 24-year olds, not surprisingly, are lowerthan those for 16- to 19-year olds, because many of the formergroup have completed their formal education. As table 6 shows,
only 36.1 percent of young adults were enrolled in school in2005, compared with 82.5 percent of teens. That same year, 13.0million 20- to 24-year-olds were not enrolled in school, and of thisnumber, 83.5 percent were in the labor force. Between 2000 and2005, the labor force participation rate of both 20- to 24-year-oldsenrolled in school and those not enrolled in school was down by3.2 percentage points and 1.1 percentage points, respectively.(See table 5.) The decline in the participation rate of 20- to 24-year-olds not enrolled in school is of concern because of thenegative economic and social consequences associated withbeing young, not in school, and jobless.13 Of these nonparti-cipants, slightly more than 2 in 3 were women. Nearly 1 out of 3young men and women who were neither enrolled in school norparticipating in the labor force was a high school dropout.
At all levels of educational attainment, the labor forceparticipation rate of young men who were not enrolled in schoolwas higher than that of their female counterparts. (See table 7.)Among young adults (particularly women), the least likely toparticipate in the labor force were those without a high schooldiploma. In 2005, the labor force participation rate of youngwomen not enrolled in school and with less than a high schooldiploma was only 50.8 percent—32.6 percentage points lowerthan that of their male counterparts. The lower participationamong young adult women partly reflects the fact that some ofthese women are caring for young children. The gap in partic-
Labor force participation rates of youths 16 to 19 years and 20 to 24 years, by sex, race, and Hispanicor Latino ethnicity, annual averages, 2000–05
Total
16 to 19 years .................................... 52.0 49.6 47.4 44.5 43.9 43.7 –8.320 to 24 years .................................... 77.8 77.1 76.4 75.4 75.0 74.6 –3.2
Men
16 to 19 years .................................... 52.8 50.2 47.5 44.3 43.9 43.2 –9.620 to 24 years .................................... 82.6 81.6 80.7 80.0 79.6 79.1 –3.5
Women
16 to 19 years .................................... 51.2 49.0 47.3 44.8 43.8 44.2 –7.020 to 24 years .................................... 73.1 72.7 72.1 70.8 70.5 70.1 –3.0
White
16 to 19 years .................................... 55.5 53.1 50.5 47.7 47.1 46.9 –8.620 to 24 years .................................... 79.9 79.2 78.6 77.7 77.1 76.3 –3.6
Black
16 to 19 years .................................... 39.4 37.6 36.0 32.4 31.4 32.6 –6.820 to 24 years .................................... 71.8 69.9 68.6 68.2 68.3 70.1 –1.7
Asian
16 to 19 years .................................... 35.8 32.0 33.3 29.6 28.4 26.0 –9.820 to 24 years .................................... 63.0 64.6 64.1 61.4 61.5 62.1 –.9
Hispanic or Latino
16 to 19 years .................................... 46.3 46.9 44.0 37.7 38.2 38.6 –7.720 to 24 years .................................... 78.2 76.6 76.3 75.6 74.5 72.7 –5.5
Age 2000 2001 2005
Table 3.
2002 20042003Change,2000–05

Monthly Labor Review October 2006 41
1948 1952 1956 1960 1964 1968 1972 1976 1980 1984 1988 1992 1996 2000 200430
40
50
60
70
30
40
50
60
70
Chart 4. Labor force participation rates for 16- to 19-year-olds, by sex, seasonally adjusted, 1948—2006
Percent
NOTE: Shaded areas represent recessions. Beginning in 1994, data reflect the introduction of a major redesign of the Current Population Survey. Additional adjustments to population controls were incorporated into the data in January of various years. These changes can affect comparability with data for previous periods.
Percent
Male
Female
1984 1985 1986 1987 1988 1989 1990 1991 1992 1993 1994 1995 1996 1997 1998 1999 2000 2001 2002 2003 2004 200530
40
50
60
70
80
90
30
40
50
60
70
80
90
Chart 5. Labor force participation rates for 16- to 19-year-olds, 1984—2005
Percent Percent
Enrolled in school
Labor force participation rate
NOTE: Shaded areas represent recessions. Beginning in 1994, data reflect the introduction of a major redesign of the Current
Population Survey. Additional adjustments to population controls were incorporated into the data in January of various years.
These changes can affect comparability with data for previous periods.
School enrollment rate
Labor force participation rate
Labor force participation rates and school enrollment rate for 16- to 19-years olds, 1984—2005
42 Monthly Labor Review October 2006
Trends in Labor force Participation
ipation rates between young men and young women narrowswith higher levels of educational attainment. Among those withcollege degrees or higher, for instance, the labor force par-ticipation rate of young women not enrolled was 91.0 percent,compared with 94.9 percent for their male counterparts.
As is the case with teens, less educated 20- to 24-year-oldscompete for jobs with many of the foreign born of all ages andexperience levels. For the most part, foreign-born workers areconcentrated in similar low-paying, low-skilled occupations,including service jobs and production, transportation, andmaterial-moving occupations.
During poor labor market conditions, some 20- to 24-year-oldschoose to attend school rather than search for jobs, becausegreater competition for jobs makes finding employment evenmore difficult. Young women—especially those with low levels
of educational attainment—may choose to stay at home andtake on family responsibilities.14
Labor force participation of adults
Women aged 25 to 54 years. One of the most striking labormarket developments of the post-World War II period has beenthe dramatic rise in the participation rate of women. The increasein participation among women was the driving force behind therise in the overall participation rate during the latter half of the20th century.
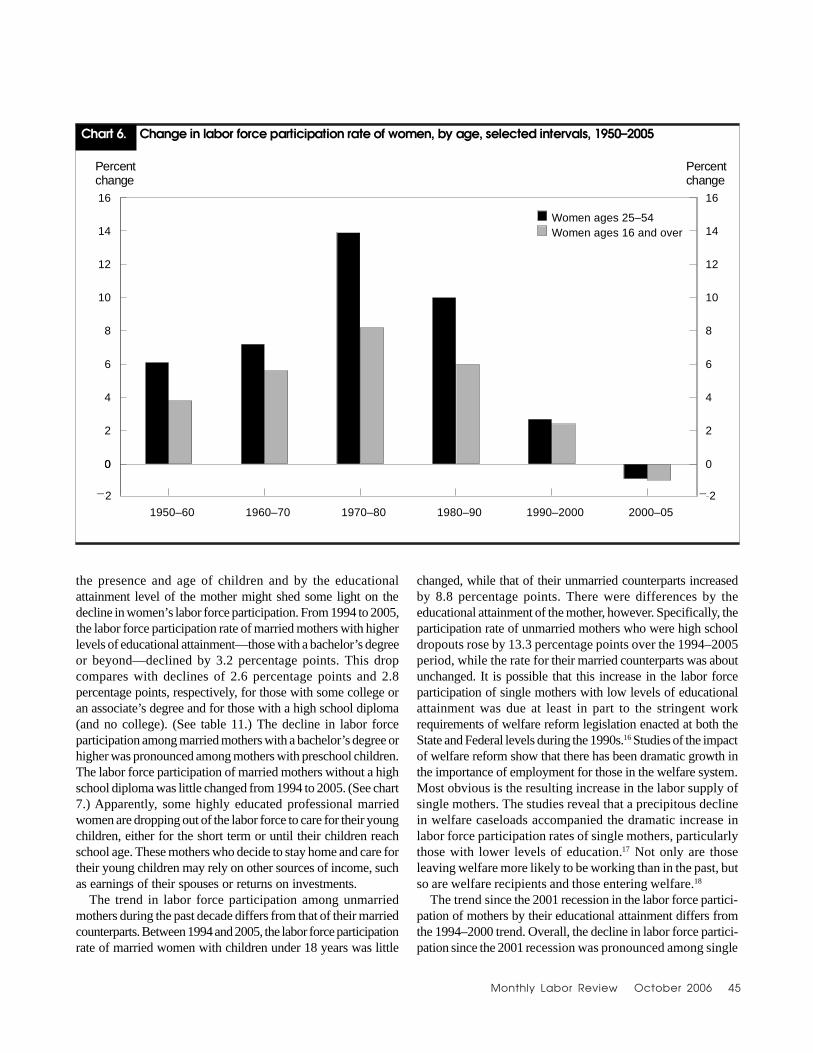
Although the labor force participation of women aged 25 to 54years grew steadily over this period, the pace of the increasevaried. The largest increase in women’s labor force participationoccurred in the 1970s (13.9 percentage points), followed by the
Labor force participation rates and school enrollment status of persons aged 16 to 19 years, October 1970–October 2005
1970 ........................................ 3,825 37.3 3,101 70.41971 ........................................ 3,979 37.3 3,115 70.11972 ........................................ 4,081 38.4 3,588 73.21973 ........................................ 4,360 41.5 3,949 74.11974 ........................................ 4,434 41.6 4,155 76.21975 ........................................ 4,551 40.8 3,867 74.71976 ........................................ 4,640 41.5 3,980 75.41977 ........................................ 4,875 43.7 4,116 77.41978 ........................................ 5,066 45.7 4,200 78.51979 ........................................ 4,883 44.5 4,220 78.2
1980 ........................................ 4,760 43.6 4,076 77.51981 ........................................ 4,706 42.0 3,776 77.31982 ........................................ 4,398 41.0 3,710 75.71983 ........................................ 4,233 39.8 3,387 75.51984 ........................................ 4,193 40.8 3,283 76.11985 ........................................ 4,364 42.1 3,144 76.81986 ........................................ 4,723 43.8 2,874 76.91987 ........................................ 4,831 44.5 2,876 75.71988 ........................................ 4,685 44.1 2,913 76.01989 ........................................ 4,740 45.7 2,875 77.1
1990 ........................................ 4,244 41.9 2,706 76.81991 ........................................ 4,330 42.8 2,250 71.51992 ........................................ 4,318 42.0 2,111 72.01993 ........................................ 4,363 42.0 2,177 74.11994 ........................................ 4,986 45.0 2,275 71.61995 ........................................ 4,931 43.7 2,491 73.21996 ........................................ 5,232 44.5 2,439 71.81997 ........................................ 5,087 41.8 2,431 72.61998 ........................................ 5,533 44.7 2,531 72.91999 ........................................ 5,510 44.3 2,736 74.5
2000 ........................................ 5,273 43.0 2,812 76.22001 ........................................ 5,016 40.6 2,758 75.72002 ........................................ 4,957 39.1 2,490 74.12003 ........................................ 4,662 35.8 2,264 72.82004 ........................................ 4,810 36.9 2,322 72.32005 ........................................ 4,937 36.3 2,070 71.8
YearLabor force
Enrolled in school
Labor force
Table 4.
Labor forceparticipation rate
Not enrolled in school
Labor forceparticipation rate
[Numbers in thousands]

Monthly Labor Review October 2006 43
1980s (10.0 percentage points). During most of the 1990s, theparticipation rate for women aged 25 to 54 years continued torise, peaking at 76.8 percent in 1999; in the years soon after,however, the rate abruptly flattened out. By 2005, the labor forceparticipation rate of women aged 25 to 54 years receded slightly,to 75.3 percent—still well above the rates witnessed throughoutthe 1970s, 1980s, and much of the 1990s. (See table 1 and chart 6.)This recent reversal of the long-term trend has raised a great dealof speculation regarding its cause as well as its impact.
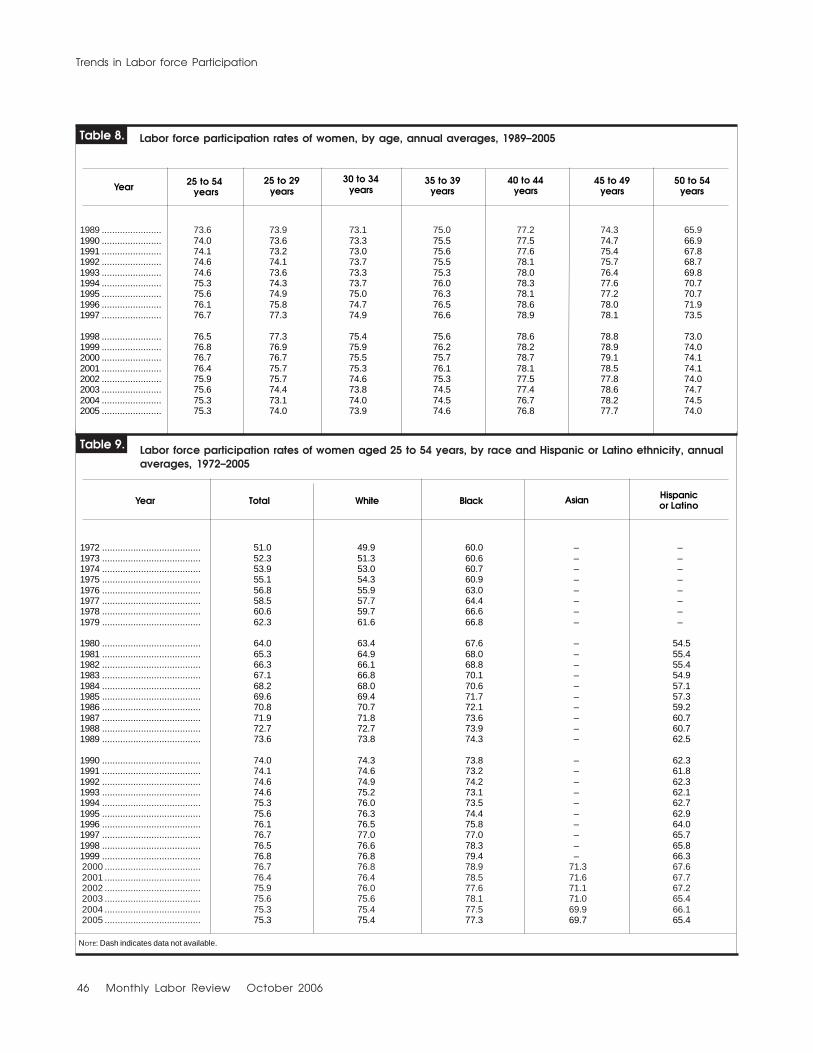
The labor force participation of women differs by age. Astable 8 shows, the overall decline in women’s labor forceparticipation began in 2000, and the rates for all the 5-year agegroups have declined. The youngest age cohort—25- to 29-year-olds—exhibited the largest decline (2.7 percentage points)over the 2000–05 period. The rate for women aged 50 to 54 yearswas about unchanged during the same period.
The participation rate for white, black, Asian, and Hispanicwomen has decreased in recent years. From 1972 until the late1990s, labor force participation increased for all the race andethnic groups, but since 1999, the rates have declined.15 (Seetable 9.)
In earlier generations, full-time homemaking was consideredthe norm for mothers, but, apparently, the current generationviews labor force participation as playing an integral role inmothers’ lives. (See table 10.) Indeed, during the past half century,much of the increase in women’s labor force participation can beattributed to the rising participation rates of women (both marriedand unmarried) with children. Most of these gains occurred inthe late 1970s and the 1980s. Although there were small gains inthe 1990s, the labor force participation rates of women aged 25 to54 years have declined since 1999. (See table 1.)
Changes in the labor force participation pattern of mothers by
Labor force participation rates and school enrollment status of persons aged 20 to 24 years, October 1970—October 2005
1970 ........................................ 1,710 50.9 9,068 74.11971 ........................................ 1,822 50.5 9,583 74.71972 ........................................ 1,918 51.9 10,292 76.71973 ........................................ 1,933 52.8 10,872 78.01974 ........................................ 2,128 55.8 11,101 79.11975 ........................................ 2,179 52.9 11,236 78.91976 ........................................ 2,403 54.9 11,568 80.41977 ........................................ 2,416 55.0 12,047 81.51978 ........................................ 2,409 56.7 12,603 82.61979 ........................................ 2,458 57.3 12,779 82.6
1980 ........................................ 2,696 56.2 13,387 83.0 1981 ........................................ 2,650 56.4 13,455 83.31982 ........................................ 2,800 57.2 13,172 82.71983 ........................................ 2,653 56.2 13,286 82.81984 ........................................ 2,824 57.8 13,152 83.71985 ........................................ 2,854 59.8 12,812 84.61986 ........................................ 2,759 59.4 12,510 84.71987 ........................................ 2,889 60.3 11,795 84.31988 ........................................ 3,029 62.9 11,461 84.11989 ........................................ 2,945 60.9 10,892 83.4
1990 ........................................ 3,057 60.0 10,673 84.11991 ........................................ 3,335 61.7 10,333 82.51992 ........................................ 3,419 61.1 10,102 83.01993 ........................................ 3,329 61.7 10,030 82.8
1994 ........................................ 3,711 63.4 10,368 83.31995 ........................................ 3,370 60.5 10,002 82.41996 ........................................ 3,517 62.6 9,802 84.01997 ........................................ 3,754 62.7 9,721 84.71998 ........................................ 3,674 63.3 9,953 84.31999 ........................................ 3,689 62.3 10,200 84.1
2000 ........................................ 3,910 64.7 10,632 84.62001 ........................................ 3,897 61.2 10,658 84.52002 ........................................ 4,027 60.1 10,654 83.52003 ........................................ 4,270 60.3 10,662 83.42004 ........................................ 4,483 62.9 10,868 82.82005 ........................................ 4,505 61.5 10,826 83.5
YearLabor force
Enrolled in school
Labor force
Table 5.
Labor forceparticipation rate
Not enrolled in school
Labor forceparticipation rate
[Numbers in thousands]

44 Monthly Labor Review October 2006
Trends in Labor force Participation
Proportion of 16- to 19-year-olds and 20- to 24-year-olds enrolled in school, by age, October 1984–October 2005
1984 .................................................... 35,204 14,601 20,603 43.1 70.5 23.71985 .................................................... 34,382 14,464 19,918 44.1 71.7 24.01986 .................................................... 33,942 14,526 19,416 45.5 74.3 23.91987 .................................................... 33,452 14,661 18,791 46.8 74.1 25.51988 .................................................... 32,893 14,454 18,439 46.9 73.5 26.11989 .................................................... 31,990 14,099 17,891 47.5 73.6 27.0
1990 .................................................... 31,420 13,643 17,777 48.4 74.2 28.61991 .................................................... 31,188 13,262 17,926 49.8 76.3 30.11992 .................................................... 30,969 13,206 17,763 51.2 77.8 31.51993 .................................................... 30,844 13,333 17,511 51.2 78.0 30.81994 .................................................... 32,561 14,253 18,308 52.0 77.7 32.01995 .................................................... 32,379 14,677 17,702 52.0 76.8 31.51996 .................................................... 32,452 15,157 17,295 53.6 77.6 32.51997 .................................................... 32,965 15,503 17,462 55.0 78.4 34.31998 .................................................... 33,445 15,841 17,604 54.3 78.1 33.01999 .................................................... 34,172 16,122 18,050 53.8 77.2 32.8
2000 .................................................... 34,568 15,955 18,613 53.0 76.9 32.52001 .................................................... 34,977 15,997 18,980 53.5 77.2 33.62002 .................................................... 35,498 16,034 19,464 54.6 79.0 34.42003 .................................................... 36,017 16,115 19,902 55.8 80.9 35.62004 .................................................... 36,504 16,257 20,246 55.3 80.3 35.22005 .................................................... 36,761 16,466 20,296 56.9 82.5 36.1
Year16 to 24 years 16 to 19 years 20 to 24 years
Table 6.
20 to 24 years 16 to 19 years
[Numbers in thousands]
16 to 24 years
Total civilian population Percent enrolled in school
Labor force participation rates of 20- to 24-year-olds not enrolled in school, by educational attainmentand sex, annual averages, 1994–2005
Men1994 ...................................... 84.5 91.9 93.4 96.4 95.21995 ...................................... 83.5 92.1 92.9 96.4 95.01996 ...................................... 83.3 92.5 92.2 97.4 95.41997 ...................................... 85.0 92.1 93.1 96.5 96.31998 ...................................... 84.0 92.3 92.9 95.3 95.41999 ...................................... 84.0 91.5 93.3 96.3 96.2
2000 ...................................... 86.7 91.0 92.8 97.4 95.62001 ...................................... 85.2 90.6 91.6 95.3 94.42002 ...................................... 85.6 90.4 90.9 95.9 94.72003 ...................................... 85.4 88.9 90.5 95.3 94.12004 ...................................... 84.5 89.1 90.4 96.0 95.42005 ...................................... 83.4 88.7 89.3 94.7 94.9
Women
1994 ...................................... 43.6 73.1 83.7 89.9 93.51995 ...................................... 43.2 72.6 82.9 90.6 92.71996 ...................................... 44.3 75.4 84.5 89.8 94.21997 ...................................... 51.4 76.3 84.1 89.0 92.91998 ...................................... 51.9 76.0 84.7 91.0 92.91999 ...................................... 53.9 76.6 84.7 90.5 92.0
2000 ...................................... 53.3 77.2 84.1 88.0 90.12001 ...................................... 56.9 75.4 83.0 86.8 92.02002 ...................................... 55.5 75.2 84.2 88.5 90.12003 ...................................... 52.9 74.1 83.3 88.5 90.52004 ...................................... 53.2 72.5 81.7 87.7 91.02005 ...................................... 50.8 71.9 82.0 86.3 91.0
Year
Less than ahigh school
diploma
High schoolgraduate,no college
Table 7.
Somecollege, no
degree
Bachelor'sdegree or
higher
Associate'sdegree
Monthly Labor Review October 2006 45
the presence and age of children and by the educationalattainment level of the mother might shed some light on thedecline in women’s labor force participation. From 1994 to 2005,the labor force participation rate of married mothers with higherlevels of educational attainment—those with a bachelor’s degreeor beyond—declined by 3.2 percentage points. This dropcompares with declines of 2.6 percentage points and 2.8percentage points, respectively, for those with some college oran associate’s degree and for those with a high school diploma(and no college). (See table 11.) The decline in labor forceparticipation among married mothers with a bachelor’s degree orhigher was pronounced among mothers with preschool children.The labor force participation of married mothers without a highschool diploma was little changed from 1994 to 2005. (See chart7.) Apparently, some highly educated professional marriedwomen are dropping out of the labor force to care for their youngchildren, either for the short term or until their children reachschool age. These mothers who decide to stay home and care fortheir young children may rely on other sources of income, suchas earnings of their spouses or returns on investments.
The trend in labor force participation among unmarriedmothers during the past decade differs from that of their marriedcounterparts. Between 1994 and 2005, the labor force participationrate of married women with children under 18 years was little
changed, while that of their unmarried counterparts increasedby 8.8 percentage points. There were differences by theeducational attainment of the mother, however. Specifically, theparticipation rate of unmarried mothers who were high schooldropouts rose by 13.3 percentage points over the 1994–2005period, while the rate for their married counterparts was aboutunchanged. It is possible that this increase in the labor forceparticipation of single mothers with low levels of educationalattainment was due at least in part to the stringent workrequirements of welfare reform legislation enacted at both theState and Federal levels during the 1990s.16 Studies of the impactof welfare reform show that there has been dramatic growth inthe importance of employment for those in the welfare system.Most obvious is the resulting increase in the labor supply ofsingle mothers. The studies reveal that a precipitous declinein welfare caseloads accompanied the dramatic increase inlabor force participation rates of single mothers, particularlythose with lower levels of education.17 Not only are thoseleaving welfare more likely to be working than in the past, butso are welfare recipients and those entering welfare.18
The trend since the 2001 recession in the labor force partici-pation of mothers by their educational attainment differs fromthe 1994–2000 trend. Overall, the decline in labor force partici-pation since the 2001 recession was pronounced among single
1950–60 1960–70 1970–80 1980–90 1990–2000 2000–05
-2
0
2
4
6
8
10
12
14
16
0
-2
0
2
4
6
8
10
12
14
16
Women ages 25–54Women ages 16 and over
Chart 6. Change in labor force participation rate of women, by age, selected intervals, 1950–2005
Percent change
Percent change
– –
46 Monthly Labor Review October 2006
Trends in Labor force Participation
Labor force participation rates of women, by age, annual averages, 1989–2005
1989 ....................... 73.6 73.9 73.1 75.0 77.2 74.3 65.91990 ....................... 74.0 73.6 73.3 75.5 77.5 74.7 66.91991 ....................... 74.1 73.2 73.0 75.6 77.6 75.4 67.81992 ....................... 74.6 74.1 73.7 75.5 78.1 75.7 68.71993 ....................... 74.6 73.6 73.3 75.3 78.0 76.4 69.81994 ....................... 75.3 74.3 73.7 76.0 78.3 77.6 70.71995 ....................... 75.6 74.9 75.0 76.3 78.1 77.2 70.71996 ....................... 76.1 75.8 74.7 76.5 78.6 78.0 71.91997 ....................... 76.7 77.3 74.9 76.6 78.9 78.1 73.5
1998 ....................... 76.5 77.3 75.4 75.6 78.6 78.8 73.01999 ....................... 76.8 76.9 75.9 76.2 78.2 78.9 74.02000 ....................... 76.7 76.7 75.5 75.7 78.7 79.1 74.12001 ....................... 76.4 75.7 75.3 76.1 78.1 78.5 74.12002 ....................... 75.9 75.7 74.6 75.3 77.5 77.8 74.02003 ....................... 75.6 74.4 73.8 74.5 77.4 78.6 74.72004 ....................... 75.3 73.1 74.0 74.5 76.7 78.2 74.52005 ....................... 75.3 74.0 73.9 74.6 76.8 77.7 74.0
Year25 to 54 years
25 to 29years
Table 8.
30 to 34years
40 to 44years
35 to 39years
50 to 54years
45 to 49years
Labor force participation rates of women aged 25 to 54 years, by race and Hispanic or Latino ethnicity, annual
averages, 1972–2005
1972 ...................................... 51.0 49.9 60.0 – –1973 ...................................... 52.3 51.3 60.6 – –1974 ...................................... 53.9 53.0 60.7 – –1975 ...................................... 55.1 54.3 60.9 – –1976 ...................................... 56.8 55.9 63.0 – –1977 ...................................... 58.5 57.7 64.4 – –1978 ...................................... 60.6 59.7 66.6 – –1979 ...................................... 62.3 61.6 66.8 – –
1980 ...................................... 64.0 63.4 67.6 – 54.51981 ...................................... 65.3 64.9 68.0 – 55.41982 ...................................... 66.3 66.1 68.8 – 55.41983 ...................................... 67.1 66.8 70.1 – 54.91984 ...................................... 68.2 68.0 70.6 – 57.11985 ...................................... 69.6 69.4 71.7 – 57.31986 ...................................... 70.8 70.7 72.1 – 59.21987 ...................................... 71.9 71.8 73.6 – 60.71988 ...................................... 72.7 72.7 73.9 – 60.71989 ...................................... 73.6 73.8 74.3 – 62.5
1990 ...................................... 74.0 74.3 73.8 – 62.31991 ...................................... 74.1 74.6 73.2 – 61.81992 ...................................... 74.6 74.9 74.2 – 62.31993 ...................................... 74.6 75.2 73.1 – 62.11994 ...................................... 75.3 76.0 73.5 – 62.71995 ...................................... 75.6 76.3 74.4 – 62.91996 ...................................... 76.1 76.5 75.8 – 64.01997 ...................................... 76.7 77.0 77.0 – 65.71998 ...................................... 76.5 76.6 78.3 – 65.81999 ...................................... 76.8 76.8 79.4 – 66.3 2000 ..................................... 76.7 76.8 78.9 71.3 67.6 2001 ..................................... 76.4 76.4 78.5 71.6 67.7 2002 ..................................... 75.9 76.0 77.6 71.1 67.2 2003 ..................................... 75.6 75.6 78.1 71.0 65.4 2004 ..................................... 75.3 75.4 77.5 69.9 66.1 2005 ..................................... 75.3 75.4 77.3 69.7 65.4
Year Total White
Table 9.
BlackHispanicor Latino
Asian
NOTE: Dash indicates data not available.

Monthly Labor Review October 2006 47
mothers without a high school diploma (5.1 percentagepoints). Irrespective of the marital status of the mother, thedecline in labor force participation since the 2001 recessionwas highest for mothers with less than a high school edu-cation and lowest for mothers with a bachelor’s degree orbeyond. From 2000 to 2005, the labor force participation ofmothers (both married and unmarried) with children under 18years declined by 3.3 percentage points for those without ahigh school diploma, while it was about unchanged for thosewith bachelor’s degree or higher. This difference is not sur-prising, considering that persons with less educational attain-ment and skills are more sensitive to business cycles, increasingtheir participation during expansions and substituting otheractivities for paid work during recessions. Among unmarriedmothers (or single mothers), the decline in labor forceparticipation was highest for mothers with less than a highschool diploma and was lowest for mothers with a bachelor’sdegree or beyond. (See table 11.) (Labor force participationpatterns of 5-year cohorts of women and men who were betweenages of 20 and 69 years in 2005 are discussed in the appendix.)
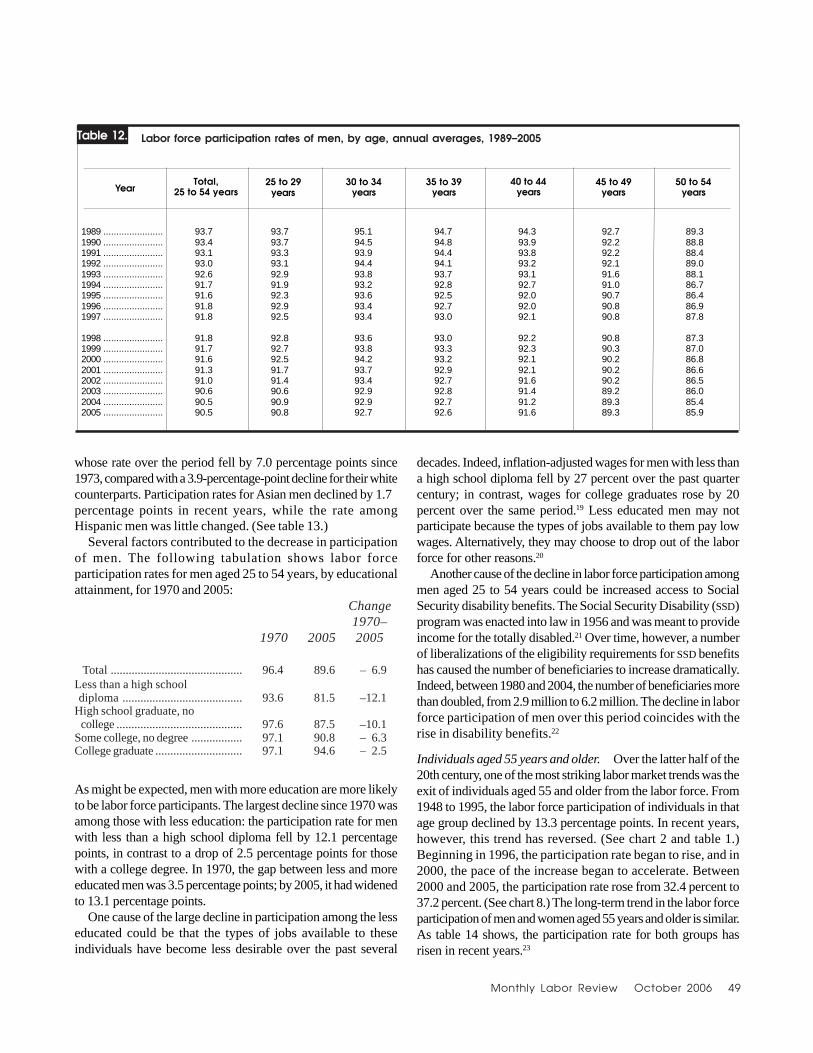
Men aged 25 to 54 years. A significant development in thelabor force over the past 50 years has been the steady decline inlabor force participation among men aged 25 to 54 years. Afterpeaking at 97.4 percent in the mid-1950s, the participation rate forthese men has fallen steadily, reaching a low of 90.5 percent in2005. (See table 1.) Dropping by an average of 0.8 percentagepoint each decade between 1950 and 1990, the labor forceparticipation rate for men aged 25 to 54 years has declined muchmore since the 1990s. For example, between 1990 and 2000 therate fell by 1.8 percentage points, and since 2000 it has droppedby 1.1 percentage points.
Within the 25- to 54-year age group, men aged 50 to 54 yearsare somewhat less likely to participate in the labor force than menin other 5-year age groups, all of which had fairly similar rates.Labor force participation rates of all of these groups declinedafter 2000. (See table 12.)
The participation rate of men in all the major categories de-clined in recent years. Over the past quarter century, white andblack men experienced a decrease in their labor force partic-ipation. The decline was particularly steep among black men,
Labor force participation rates of mothers, by age of youngest child, March 1975–2005
1975 ................................... 47.4 54.9 39.0 34.31976 ................................... 48.8 56.2 40.1 34.11977 ................................... 50.8 58.3 41.2 35.41978 ................................... 53.0 60.0 44.0 39.41979 ................................... 54.5 61.6 45.7 41.11980 ................................... 56.6 64.3 46.8 41.91981 ................................... 58.1 65.5 48.9 44.31982 ................................... 58.5 65.8 49.9 45.61983 ................................... 58.9 66.3 50.5 46.01984 ................................... 60.5 68.1 52.1 47.6
1985 ................................... 62.1 69.9 53.5 49.51986 ................................... 62.8 70.4 54.4 50.81987 ................................... 64.7 72.0 56.7 52.91988 ................................... 65.1 73.3 56.1 52.41989 ................................... 65.7 74.2 56.7 52.41990 ................................... 66.7 74.7 58.2 53.61991 ................................... 66.6 74.4 58.4 54.51992 ................................... 67.2 75.9 58.0 54.51993 ................................... 66.9 75.4 57.9 53.91994 ................................... 68.4 76.0 60.3 57.1
1995 ................................... 69.7 76.4 62.3 58.71996 ................................... 70.2 77.2 62.3 59.01997 ................................... 72.1 78.1 65.0 61.81998 ................................... 72.3 78.4 65.2 62.21999 ................................... 72.1 78.5 64.4 60.72000 ................................... 72.9 79.0 65.3 61.02001 ................................... 72.7 79.4 64.4 60.72002 ................................... 72.2 78.6 64.1 60.52003 ................................... 71.7 78.7 62.9 58.72004 ................................... 70.7 77.5 62.2 57.32005 ................................... 70.5 76.9 62.6 59.0
YearMothers with children
under 18 yearsMothers with chldren
6 to 17 years
Table 10.
Mothers with childrenunder 6 years
Mothers with childrenunder 3 years

48 Monthly Labor Review October 2006
Trends in Labor force Participation
Labor force participation rates of women with children under 18 years, by educational attainment and maritalstatus, annual averages, 1994–2005
College graduates
Total, with children under 18 years ................ 78.6 78.4 78.5 78.7 77.6 77.6 76.2 75.5 75.6 75.7 75.3 75.9 –2.4 –2.7 –0.3
Married, spouse present .. 76.9 76.7 76.7 76.8 75.5 75.3 74.1 73.1 72.9 73.3 72.9 73.7 –2.8 –3.2 –.4Not married ..................... 90.9 90.7 91.4 91.0 91.7 92.2 90.9 91.6 91.4 90.5 90.1 89.2 .0 –1.7 –1.7
Some college or associate’s degree
Total, with children under 18 years ......................... 75.5 75.5 76.5 76.7 76.9 76.9 77.2 76.8 76.2 75.9 75.2 75 1.7 –.5 –2.2
Married, spouse present .. 74.4 74.0 74.7 74.2 74.0 73.4 74 73.6 72.7 72.6 72 71.8 –.4 –2.6 –2.2Not married ..................... 78.2 79.4 80.9 82.9 84.1 85.4 85.3 84.5 84.6 83.4 82.3 81.9 7.1 3.7 –3.4
High school graduates, no college
Total, with children under 18 years ......................... 68.9 70.1 71.2 72.4 71.7 72.2 72.4 72.2 72.1 71.2 70.0 69.7 3.5 .8 –2.7
Married, spouse present . 69.0 69.5 70.0 70.1 68.9 69.0 69.2 69.1 68.9 68.0 66.3 66.2 .2 –2.8 –3.0Not married ..................... 68.8 71.5 74.2 77.7 78.4 79.5 79.5 79.1 79.0 78.0 77.7 76.4 10.7 7.6 –3.1
Less than high school diploma
Total, with children under 18 years ......................... 44.5 46.0 47.6 50.5 52.2 52.7 53.9 54.4 53.6 51.5 50.7 50.6 9.4 6.1 –3.3
Married, spouse present .. 45.7 47.1 47.5 49.3 49.2 48.8 48.9 50.2 48.8 47.1 46.1 46.8 3.2 1.1 –2.1Not married ..................... 42.8 44.6 47.8 52.2 56.4 58.3 61.2 60.6 60.9 58.3 57.7 56.1 18.4 13.3 –5.1
Educational attainmentand marital status 1994 1995
Table 11.
1996 1994–2005
1997 2000–2005
2005 1994–2000
200420032001 2002200019991998
Change
1994 1995 1996 1997 1998 1999 2000 2001 2002 2003 2004 200530
40
50
60
70
80
90
30
40
50
60
70
80
90
Chart 7. Labor force participation of married women with spouse present and children under 18 years, by educational attainment, 1994–2005
Percent Percent
College graduates
Some college or associate's degree
High school graduate, no college
Less than high school diploma
Monthly Labor Review October 2006 49
whose rate over the period fell by 7.0 percentage points since1973, compared with a 3.9-percentage-point decline for their whitecounterparts. Participation rates for Asian men declined by 1.7percentage points in recent years, while the rate amongHispanic men was little changed. (See table 13.)
Several factors contributed to the decrease in participationof men. The following tabulation shows labor forceparticipation rates for men aged 25 to 54 years, by educationalattainment, for 1970 and 2005:
Change1970–
1970 2005 2005
Total ............................................ 96.4 89.6 – 6.9Less than a high schooldiploma ........................................ 93.6 81.5 –12.1
High school graduate, no college .......................................... 97.6 87.5 –10.1
Some college, no degree ................. 97.1 90.8 – 6.3College graduate ............................. 97.1 94.6 – 2.5
As might be expected, men with more education are more likelyto be labor force participants. The largest decline since 1970 wasamong those with less education: the participation rate for menwith less than a high school diploma fell by 12.1 percentagepoints, in contrast to a drop of 2.5 percentage points for thosewith a college degree. In 1970, the gap between less and moreeducated men was 3.5 percentage points; by 2005, it had widenedto 13.1 percentage points.
One cause of the large decline in participation among the lesseducated could be that the types of jobs available to theseindividuals have become less desirable over the past several
Labor force participation rates of men, by age, annual averages, 1989–2005
1989 ....................... 93.7 93.7 95.1 94.7 94.3 92.7 89.31990 ....................... 93.4 93.7 94.5 94.8 93.9 92.2 88.81991 ....................... 93.1 93.3 93.9 94.4 93.8 92.2 88.41992 ....................... 93.0 93.1 94.4 94.1 93.2 92.1 89.01993 ....................... 92.6 92.9 93.8 93.7 93.1 91.6 88.11994 ....................... 91.7 91.9 93.2 92.8 92.7 91.0 86.71995 ....................... 91.6 92.3 93.6 92.5 92.0 90.7 86.41996 ....................... 91.8 92.9 93.4 92.7 92.0 90.8 86.91997 ....................... 91.8 92.5 93.4 93.0 92.1 90.8 87.8
1998 ....................... 91.8 92.8 93.6 93.0 92.2 90.8 87.31999 ....................... 91.7 92.7 93.8 93.3 92.3 90.3 87.02000 ....................... 91.6 92.5 94.2 93.2 92.1 90.2 86.82001 ....................... 91.3 91.7 93.7 92.9 92.1 90.2 86.62002 ....................... 91.0 91.4 93.4 92.7 91.6 90.2 86.52003 ....................... 90.6 90.6 92.9 92.8 91.4 89.2 86.02004 ....................... 90.5 90.9 92.9 92.7 91.2 89.3 85.42005 ....................... 90.5 90.8 92.7 92.6 91.6 89.3 85.9
YearTotal,
25 to 54 years25 to 29
years
Table 12.
30 to 34years
40 to 44years
35 to 39years
50 to 54years
45 to 49years
decades. Indeed, inflation-adjusted wages for men with less thana high school diploma fell by 27 percent over the past quartercentury; in contrast, wages for college graduates rose by 20percent over the same period.19 Less educated men may notparticipate because the types of jobs available to them pay lowwages. Alternatively, they may choose to drop out of the laborforce for other reasons.20
Another cause of the decline in labor force participation amongmen aged 25 to 54 years could be increased access to SocialSecurity disability benefits. The Social Security Disability (SSD)program was enacted into law in 1956 and was meant to provideincome for the totally disabled.21 Over time, however, a numberof liberalizations of the eligibility requirements for SSD benefitshas caused the number of beneficiaries to increase dramatically.Indeed, between 1980 and 2004, the number of beneficiaries morethan doubled, from 2.9 million to 6.2 million. The decline in laborforce participation of men over this period coincides with therise in disability benefits.22
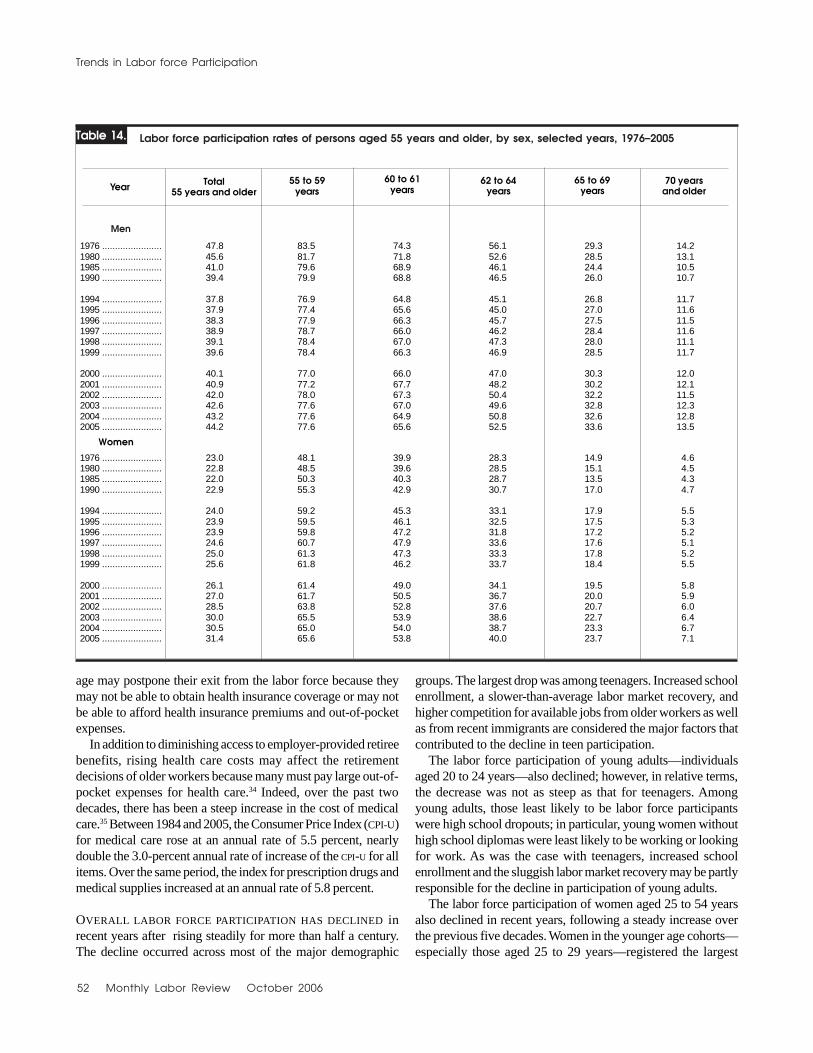
Individuals aged 55 years and older. Over the latter half of the20th century, one of the most striking labor market trends was theexit of individuals aged 55 and older from the labor force. From1948 to 1995, the labor force participation of individuals in thatage group declined by 13.3 percentage points. In recent years,however, this trend has reversed. (See chart 2 and table 1.)Beginning in 1996, the participation rate began to rise, and in2000, the pace of the increase began to accelerate. Between2000 and 2005, the participation rate rose from 32.4 percent to37.2 percent. (See chart 8.) The long-term trend in the labor forceparticipation of men and women aged 55 years and older is similar.As table 14 shows, the participation rate for both groups hasrisen in recent years.23

50 Monthly Labor Review October 2006
Trends in Labor force Participation
For women, all ages 55 years and older experienced an increasein participation since 2000. (See table 15.)
Several factors may have contributed to the recent rise inlabor force participation among older individuals.24 One wasthe passage of the Senior Citizens Freedom to Work Act, whichremoved the earnings test, or “earnings penalty,” for workersaged 65 to 70 years who earned wages; the removal of theearnings test may have influenced the retirement decisions ofsome older individuals, especially those employed full time.25
Another factor was the gradual increase, beginning in 2000, inthe normal retirement age for receiving Social Security benefits;this legislation may have induced some individuals to stay in thelabor force longer than they had originally planned.26 Tradi-tionally, retirement benefits are first available at age 62, with areduction for each month that benefits are received before age65, the age at which individuals are eligible for full Social Securitybenefits. The normal retirement age was raised as part of the 1983
Labor force participation rates of men aged 25 to 54 years, by race and Hispanic or Latino ethnicity, annual
averages, 1972–2005
1972 ...................................... 95.1 95.7 90.0 – –1973 ...................................... 95.0 95.5 90.3 – –1974 ...................................... 94.7 95.4 89.4 – –1975 ...................................... 94.4 95.1 88.6 – –1976 ...................................... 94.2 94.9 88.3 – –1977 ...................................... 94.2 95.0 88.4 – –1978 ...................................... 94.3 95.0 88.8 – –1979 ...................................... 94.4 95.1 89.1 – –
1980 ...................................... 94.2 95.0 88.4 – 93.01981 ...................................... 94.1 95.0 87.5 – 92.71982 ...................................... 94.0 94.9 87.7 – 92.71983 ...................................... 93.8 94.6 88.2 – 92.51984 ...................................... 93.9 94.8 88.1 – 92.61985 ...................................... 93.9 94.8 87.8 – 92.21986 ...................................... 93.8 94.6 88.4 – 92.71987 ...................................... 93.7 94.5 87.9 – 92.31988 ...................................... 93.6 94.5 87.7 – 92.61989 ...................................... 93.7 94.6 87.8 – 92.8
1990 ...................................... 93.4 94.4 87.4 – 92.41991 ...................................... 93.1 94.1 86.6 – 91.21992 ...................................... 93.0 94.0 86.1 – 91.51993 ...................................... 92.6 93.7 85.3 – 91.71994 ...................................... 91.7 92.9 84.5 – 90.91995 ...................................... 91.6 92.7 84.1 – 90.91996 ...................................... 91.8 93.0 84.1 – 91.51997 ...................................... 91.8 93.0 84.4 – 91.81998 ...................................... 91.8 92.9 84.4 – 91.61999 ...................................... 91.7 92.8 85.1 – 91.6
2000 ...................................... 91.6 92.7 84.4 91.7 92.52001 ...................................... 91.3 92.4 83.6 91.3 91.72002 ...................................... 91.0 92.2 83.5 90.5 91.5
2003 ..................................... 90.6 91.7 82.9 89.7 91.62004 ...................................... 90.5 91.6 82.5 90.7 92.12005 ...................................... 90.5 91.6 83.3 90.0 92.0
Year Total White
Table 13.
Black HispanicAsian
Table 15 shows data for 2000 and 2005 on participation ratesby age and sex for individuals approaching or who have reachedretirement age. Labor force participation trends closely track agerequirements for receiving Social Security earnings benefits. Datashow a steep decline in labor force participation when individualsreach age 62—the age they first become eligible for SocialSecurity benefits—and again at age 65—the age they becomeeligible for full Social Security benefits. In 2005, the rate for menfell by 5.8 percentage points at age 62 and 7.8 percentage pointsat age 65; for women, the decreases at age 62 and 65 were 7.1percentage points and 6.8 percentage points, respectively.
Although men aged 55 years and older are much more likelythan their female counterparts to participate in the labor force,the increase in the participation rate for women was slightlyhigher than that for men between 2000 and 2005 (5.3 percentagepoints compared with 4.1 percentage points). For men, the rise inparticipation was mostly among those aged 59 years and older.
NOTE: Dash indicates data not available.

Monthly Labor Review October 2006 51
Social Security reform legislation. The age rises gradually forindividuals born in 1937 or later. Currently, the highest normalretirement age will be 67 years, for those born in 1960 or later.
In addition to changes to Social Security, fundamentalchanges to private retirement plans have coincided with therise in participation of older workers. In one of these changes,in recent decades there has been a decline in the number ofindividuals covered by defined-benefit pension plans and anincrease in the number covered by defined-contribution plans,with most of the growth attributable to an increase in thenumber of 401(k) plans.27 For instance, in the early 1990s,defined-benefit pensions and defined-contribution plans eachcovered about a third of private-industry workers. By 2005,defined-contribution plans covered about twice as manyprivate-sector workers as did defined-benefit pensions—42percent and 21 percent, respectively.
The main impact of the rise in the prevalence of defined-contribution plans has been the placement of more responsibilityfor accumulating retirement assets onto individuals, a re-sponsibility that may have caused some to participate in thelabor force longer.28 Retirement income from a defined-contribution plan depends on the decision of workers toparticipate in the plan, the share of their income they choose tosave, and the rate of return on their account balances. Because
investment risk in a defined-contribution plan is borne byworkers, an extended stock market downturn, for example, mayhave a detrimental effect on account balances and cause someindividuals to delay their decision to exit the labor force.29
The rise in labor force participation rates among older workersalso may reflect improvement in the health status of olderindividuals. Research has shown that health is clearly animportant determinant of whether a person will exit the laborforce.30 Older workers today have longer life expectanciesbecause of improvements in their health. For instance, accordingto data from the National Center for Health Statistics, individualsborn between 1939 and 1941 could expect to live 64 years, onaverage; for individuals born 10 years later, the average rose to68 years.31
Another factor that probably affects the labor force parti-cipation of older workers is access to retiree health benefits. In1997, 22 percent of private-sector employers offered retiree healthbenefits to individuals who retired prior to age 65; by 2002, theproportion had declined to 13 percent.32 For individuals eligiblefor Medicare—those aged 65 years and older—the proportionof private-sector employers offering retiree health benefitsdeclined from 20 percent in 1997 to 13 percent in 2002.33 Thesechanges may influence the retirement decisions of individualsapproaching retirement age. Specifically, workers near retirement
1990 1991 1992 1993 1994 1995 1996 1997 1998 1999 2000 2001 2002 2003 2004 2005 200625
30
35
40
25
30
35
40
Chart 8. Civilian labor force participation rate of persons 55 years and older, seasonally adjusted, 1990–2006
Percent Percent
52 Monthly Labor Review October 2006
Trends in Labor force Participation
age may postpone their exit from the labor force because theymay not be able to obtain health insurance coverage or may notbe able to afford health insurance premiums and out-of-pocketexpenses.
In addition to diminishing access to employer-provided retireebenefits, rising health care costs may affect the retirementdecisions of older workers because many must pay large out-of-pocket expenses for health care.34 Indeed, over the past twodecades, there has been a steep increase in the cost of medicalcare.35 Between 1984 and 2005, the Consumer Price Index (CPI-U)for medical care rose at an annual rate of 5.5 percent, nearlydouble the 3.0-percent annual rate of increase of the CPI-U for allitems. Over the same period, the index for prescription drugs andmedical supplies increased at an annual rate of 5.8 percent.
OVERALL LABOR FORCE PARTICIPATION HAS DECLINED inrecent years after rising steadily for more than half a century.The decline occurred across most of the major demographic
Labor force participation rates of persons aged 55 years and older, by sex, selected years, 1976–2005
Men
1976 ....................... 47.8 83.5 74.3 56.1 29.3 14.21980 ....................... 45.6 81.7 71.8 52.6 28.5 13.11985 ....................... 41.0 79.6 68.9 46.1 24.4 10.51990 ....................... 39.4 79.9 68.8 46.5 26.0 10.7
1994 ....................... 37.8 76.9 64.8 45.1 26.8 11.71995 ....................... 37.9 77.4 65.6 45.0 27.0 11.61996 ....................... 38.3 77.9 66.3 45.7 27.5 11.51997 ....................... 38.9 78.7 66.0 46.2 28.4 11.61998 ....................... 39.1 78.4 67.0 47.3 28.0 11.11999 ....................... 39.6 78.4 66.3 46.9 28.5 11.7
2000 ....................... 40.1 77.0 66.0 47.0 30.3 12.02001 ....................... 40.9 77.2 67.7 48.2 30.2 12.12002 ....................... 42.0 78.0 67.3 50.4 32.2 11.52003 ....................... 42.6 77.6 67.0 49.6 32.8 12.32004 ....................... 43.2 77.6 64.9 50.8 32.6 12.82005 ....................... 44.2 77.6 65.6 52.5 33.6 13.5
Women
1976 ....................... 23.0 48.1 39.9 28.3 14.9 4.61980 ....................... 22.8 48.5 39.6 28.5 15.1 4.51985 ....................... 22.0 50.3 40.3 28.7 13.5 4.31990 ....................... 22.9 55.3 42.9 30.7 17.0 4.7
1994 ....................... 24.0 59.2 45.3 33.1 17.9 5.51995 ....................... 23.9 59.5 46.1 32.5 17.5 5.31996 ....................... 23.9 59.8 47.2 31.8 17.2 5.21997 ....................... 24.6 60.7 47.9 33.6 17.6 5.11998 ....................... 25.0 61.3 47.3 33.3 17.8 5.21999 ....................... 25.6 61.8 46.2 33.7 18.4 5.5
2000 ....................... 26.1 61.4 49.0 34.1 19.5 5.82001 ....................... 27.0 61.7 50.5 36.7 20.0 5.92002 ....................... 28.5 63.8 52.8 37.6 20.7 6.02003 ....................... 30.0 65.5 53.9 38.6 22.7 6.42004 ....................... 30.5 65.0 54.0 38.7 23.3 6.72005 ....................... 31.4 65.6 53.8 40.0 23.7 7.1
YearTotal
55 years and older55 to 59
years
Table 14.
60 to 61years
65 to 69years
62 to 64years
70 yearsand older
groups. The largest drop was among teenagers. Increased schoolenrollment, a slower-than-average labor market recovery, andhigher competition for available jobs from older workers as wellas from recent immigrants are considered the major factors thatcontributed to the decline in teen participation.
The labor force participation of young adults—individualsaged 20 to 24 years—also declined; however, in relative terms,the decrease was not as steep as that for teenagers. Amongyoung adults, those least likely to be labor force participantswere high school dropouts; in particular, young women withouthigh school diplomas were least likely to be working or lookingfor work. As was the case with teenagers, increased schoolenrollment and the sluggish labor market recovery may be partlyresponsible for the decline in participation of young adults.
The labor force participation of women aged 25 to 54 yearsalso declined in recent years, following a steady increase overthe previous five decades. Women in the younger age cohorts—especially those aged 25 to 29 years—registered the largest
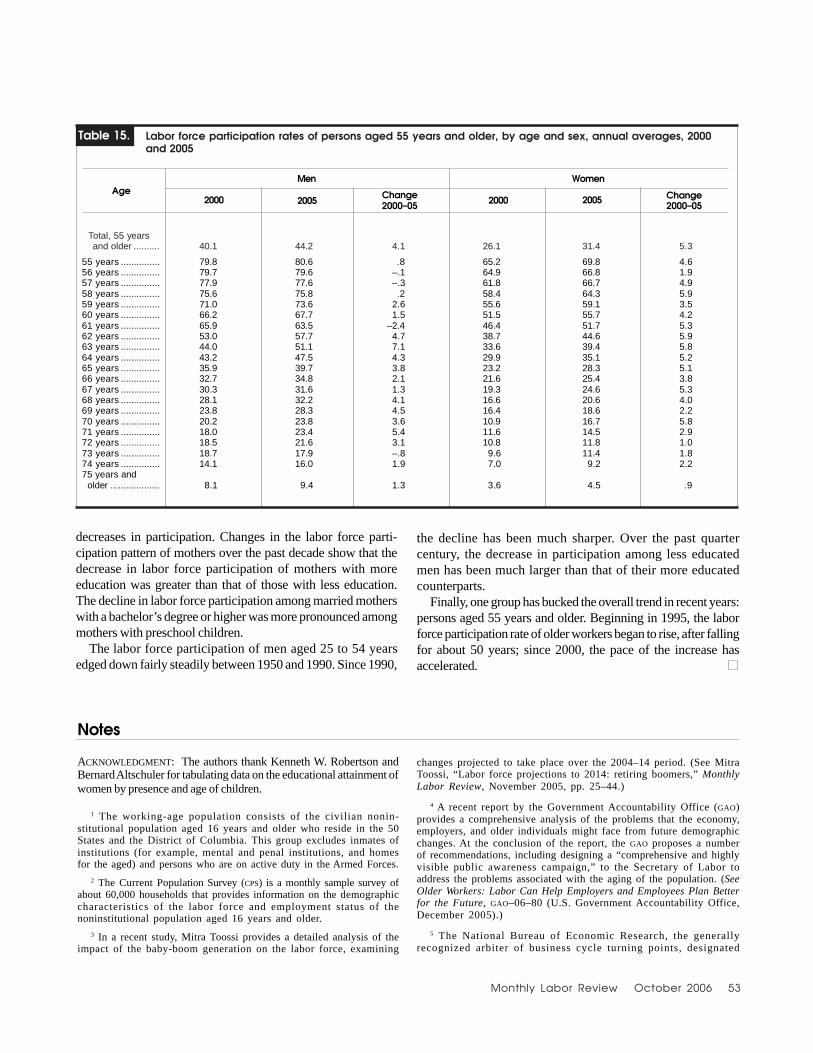
Monthly Labor Review October 2006 53
decreases in participation. Changes in the labor force parti-cipation pattern of mothers over the past decade show that thedecrease in labor force participation of mothers with moreeducation was greater than that of those with less education.The decline in labor force participation among married motherswith a bachelor’s degree or higher was more pronounced amongmothers with preschool children.
The labor force participation of men aged 25 to 54 yearsedged down fairly steadily between 1950 and 1990. Since 1990,
the decline has been much sharper. Over the past quartercentury, the decrease in participation among less educatedmen has been much larger than that of their more educatedcounterparts.
Finally, one group has bucked the overall trend in recent years:persons aged 55 years and older. Beginning in 1995, the laborforce participation rate of older workers began to rise, after fallingfor about 50 years; since 2000, the pace of the increase hasaccelerated.
Age2000 2005
Table 15.
Change2000–05
20052000Change2000–05
Men Women
Labor force participation rates of persons aged 55 years and older, by age and sex, annual averages, 2000and 2005
Total, 55 years and older .......... 40.1 44.2 4.1 26.1 31.4 5.3
55 years ............... 79.8 80.6 .8 65.2 69.8 4.656 years ............... 79.7 79.6 –.1 64.9 66.8 1.957 years ............... 77.9 77.6 –.3 61.8 66.7 4.958 years ............... 75.6 75.8 .2 58.4 64.3 5.959 years ............... 71.0 73.6 2.6 55.6 59.1 3.560 years ............... 66.2 67.7 1.5 51.5 55.7 4.261 years ............... 65.9 63.5 –2.4 46.4 51.7 5.362 years ............... 53.0 57.7 4.7 38.7 44.6 5.963 years ............... 44.0 51.1 7.1 33.6 39.4 5.864 years ............... 43.2 47.5 4.3 29.9 35.1 5.265 years ............... 35.9 39.7 3.8 23.2 28.3 5.166 years ............... 32.7 34.8 2.1 21.6 25.4 3.867 years ............... 30.3 31.6 1.3 19.3 24.6 5.368 years ............... 28.1 32.2 4.1 16.6 20.6 4.069 years ............... 23.8 28.3 4.5 16.4 18.6 2.270 years ............... 20.2 23.8 3.6 10.9 16.7 5.871 years ............... 18.0 23.4 5.4 11.6 14.5 2.972 years ............... 18.5 21.6 3.1 10.8 11.8 1.073 years ............... 18.7 17.9 –.8 9.6 11.4 1.874 years ............... 14.1 16.0 1.9 7.0 9.2 2.275 years and older ................... 8.1 9.4 1.3 3.6 4.5 .9
Notes
ACKNOWLEDGMENT: The authors thank Kenneth W. Robertson andBernard Altschuler for tabulating data on the educational attainment ofwomen by presence and age of children.
1 The working-age population consists of the civilian nonin-stitutional population aged 16 years and older who reside in the 50States and the District of Columbia. This group excludes inmates ofinstitutions (for example, mental and penal institutions, and homesfor the aged) and persons who are on active duty in the Armed Forces.
2 The Current Population Survey (CPS) is a monthly sample survey ofabout 60,000 households that provides information on the demographiccharacteristics of the labor force and employment status of thenoninstitutional population aged 16 years and older.
3 In a recent study, Mitra Toossi provides a detailed analysis of theimpact of the baby-boom generation on the labor force, examining
changes projected to take place over the 2004–14 period. (See MitraToossi, “Labor force projections to 2014: retiring boomers,” MonthlyLabor Review, November 2005, pp. 25–44.)
4 A recent report by the Government Accountability Office (GAO)provides a comprehensive analysis of the problems that the economy,employers, and older individuals might face from future demographicchanges. At the conclusion of the report, the GAO proposes a numberof recommendations, including designing a “comprehensive and highlyvisible public awareness campaign,” to the Secretary of Labor toaddress the problems associated with the aging of the population. (SeeOlder Workers: Labor Can Help Employers and Employees Plan Betterfor the Future, GAO–06–80 (U.S. Government Accountability Office,December 2005).)
5 The National Bureau of Economic Research, the generallyrecognized arbiter of business cycle turning points, designated
Table 15.

54 Monthly Labor Review October 2006
Trends in Labor force Participation
November 2001 as the trough of the recession which began in Marchof that year.
6 For this analysis, only five previous recessions were used, tominimize any overlap of recessionary periods. Although the mostrecent recession officially ended in November 2001, the labor marketcontinued to be somewhat sluggish.
7 Note, however, that labor force participation rates of youngerworkers are highly sensitive to cyclical changes in labor marketconditions.
8 In general, the movement in the teen labor force participation rateparallels the business cycle, growing during periods of economic expansionand shrinking during periods of economic contraction. However, in the 5years following the onset of the March 2001 recession, the labor forceparticipation rate of teenagers trended downward, falling by 7.0 percentagepoints, from 50.9 percent in March 2001 to 43.9 percent in March 2006.In contrast, in the 60 months that followed the onset of the previous8 recessions, the labor force participation rate for teens was, onaverage, essentially unchanged.
9 The authors examine the recent decline in teen work activity, offeringexplanations for both the long secular decline since the late 1970s and therecent acceleration in this decline since 2000. They argue that much ofthis pattern is due to a significant increase in the rewards to formaleducation. They also explore the importance of changes to labor demand,crowding out by substitutable workers, the increased work activity ofmothers, and increases in wealth. Daniel Aaronson, Kyung-Hong Park,and Daniel G. Sullivan, “The Decline in Teen Labor Force Participation,”Economic Perspectives, Quarter I, 2006 Available on the Internet atssrn.com/abstract=888529, visited October 30, 2006.
10 The No Child Left Behind Act (NCLB) of 2001 may have forcedsome teens who were enrolled in school to pull out of the labor force.The Act, the latest revision of the 1965 Elementary and SecondaryEducation Act, was signed into law in early 2002 and is a State-mandated testing requirement imposed on schools. To help schoolsand districts meet the goals required by the NCLB, the law provides ablend of requirements, incentives, and resources. Because teens mayhave to work harder and, probably, longer hours to pass the Act’srequirements, many may substitute schoolwork for paid work.
11 According to George J. Borjas, “Even though the average nativegains somewhat from immigration, this does not mean that everyone inthe country gains. There are distinct groups of winners and losers. Thewinners are the people who employ or use immigrant services, and achievetheir economic goals at lower costs. The losers are the people who competewith immigrant workers, and experience a corresponding reduction intheir income.” (See George J. Borjas, Heaven’s Door: Immigration Policyand the American Economy (Princeton University Press, 1999), p. 103.)
12 One group of researchers suggests that low-skilled women who enteredthe labor force in response to welfare reform may have crowded out jobsfor inexperienced teenagers and young adults. However, these sameresearchers conclude that the decline in youth participation has been duelargely to increases in family wealth and higher returns to schooling,rather than to factors related to the demand for labor. (See DanielAaronson, Kyung-Hong Park, and Daniel G. Sullivan, “The Decline inTeen Labor Force Participation,” Economic Perspectives, 2006, on theInternet at ssrn.com/abstract=888529, visited October 30, 2006.)
13 See Rima Shore, Reducing the Number of Disconnected Youth,(Baltimore, The Annie E. Casey Foundation, July 2005); and ThomasA. Mroz and Timothy H. Savage, The Long-term Effects of YouthUnemployment, (Washington, DC, Employment Policies Institute,October 2001).
14 Note, however, that the lack of available jobs is not necessarilythe only reason young adults choose to enroll in school. Individualsaged 20 to 24 years may stay in school because education is an
investment that can lead to higher paying jobs with greater access toemployee benefits. In addition, persons with higher education are lesslikely to be unemployed and more likely to be employed. Likewise,weak labor market conditions may not necessarily be the main reasonyoung mothers withdraw from school and the labor force to care fortheir children.
15 Data for Asians are available only since 2000.16 The 1996 Welfare Reform Bill, The Personal Responsibility and
Work Opportunity Reconciliation Act of 1996, changed the Nation’swelfare system into one that requires work in exchange for time-limitedassistance. The bill contains strong work requirements, a performancebonus to reward States for moving welfare recipients into jobs, Statemaintenance-of-effort requirements, comprehensive child supportenforcement, and supports for families moving from welfare to work—including increased funding for childcare and guaranteed health carecoverage. These changes encourage single mothers to enter the laborforce. For more information on the impact of welfare reform, see TheNational Evaluation of the Welfare-to-Work Grants Program: Final Report(Princeton, MI, Washington, DC, and Cambridge, MA, Mathematica PolicyResearch, Inc., September 2004); and Robert F. Schoeni and Rebecca M.Blank, “What Has Welfare Reform Accomplished? Impacts of WelfareParticipation, Employment, Income, Poverty, and Family Structure,”Working Paper No. 7627, (National Bureau of Economic Research, March2000).
17 See Timothy J. Bartik, Instrumental Variable Estimates of theLabor Market Spillover Effects of Welfare Reform, Working Paper No.02–078 (Kalamazoo, MI, The W.E Upjohn Institute for EmploymentResearch, April 2002), pp. 2, 47.
18 See William J. Carrington, Peter R. Mueser, and Kenneth R. Troske,The Impact of Welfare Reform on Leaver Characteristics, Employmentand Recidivism, Discussion Paper No. 561 (Bonn, Germany, IZA, August2002).
19 “Wages” refers to median weekly earnings of men aged 25 yearsand older, in constant 2004 dollars. The change in wages is that between1979 and 2004.
20 See Chinhui Juhn and Simon Potter’s recent study, “Changes inLabor Force Participation in the United States,” Journal of EconomicPerspectives, summer 2006, pp. 27–46. The authors find that over thepast three decades profound changes have occurred in the U.S. labormarket, with one recurring theme being a decline in demand for less skilledworkers. The authors conclude that the result has been both a decline inwages among less skilled men and a sharp fall in the employment of lesseducated men.
21 For more information on the history of Social Security Disabilityprograms, see A History of the Social Security Disability Programs(Social Security Administration, January 1986).
22 A study conducted in 2001 concluded that the increase in theliberalization of disability benefits may have caused less educated individualsto exit the labor force. ( See David H. Author and Mark G. Duggan, “TheRise in the Disability Rolls and the Decline in Unemployment,” QuarterlyJournal of Economics, February 2003, pp. 157–205.) Research conductedby Jonathan S. Leonard found that nearly half of the decline in labor forceparticipation rates among “prime-age” men during the 1960s and 1970swas due to the growth of the Social Security Disability program. (SeeJonathan S. Leonard, The Social Security Disability Program and LaborForce Participation, Working Paper No. 392 (National Bureau ofEconomic Research, August 1979).
23 The long-term trends in labor force participation for men andwomen aged 55 years and older are similar to those of men and womenaged 25 to 54 years. That is, the rate for older men has declined, whilethat for older women has increased.
24 In a recent paper, Kevin E. Cahill, Michael D. Giandrea, and JosephF. Quinn discuss the concept of “bridge jobs,” or jobs that older individuals

Monthly Labor Review October 2006 55
take in moving from full-time “career” employment to completewithdrawal from the labor force. The authors argue that bridge jobs havebecome more prevalent in recent years due to a number of changes in theretirement environment. (See Kevin E. Cahill, Michael D. Giandrea, andJoseph F. Quinn, Are Traditional Retirements a Thing of the Past? NewEvidence on Retirement Patterns and Bridge Jobs, Working Paper 384,(Bureau of Labor Statistics, September 2005).) For an analysis of theimpact of Social Security on the labor force participation of older workers,see David A. Wise, “Social Security Provisions and the Labor ForceParticipation of Older Workers,” in Linda J. Waite, ed., Aging, Health,and Public Policy: Demographic and Economic Perspectives (New York,Population Council, 2005), pp. 176–204. An analysis carried out by GaryBurtless and Joseph F. Quinn examines long-term trends in retirementamong older individuals and discusses policies that might increase thelabor force participation of older workers. (See Gary Burtless and JosephF. Quinn, “Retirement Trends and Policies to Encourage Work AmongOlder Americans,” in Peter Budetti, Richard Burkhauser, Janice Gregory,and Allan Hunt, eds., Ensuring Health and Income Security for an AgingWorkforce (Kalamazoo, MI, W. E. Upjohn Institute for EmploymentResearch, 2001), pp. 375–415.)
25 See Steven J. Haider and David S. Loughran, Do the ElderlyRespond to Taxes on Earnings? Evidence from the Social SecurityRetirement Earnings Test, RAND Working Paper WP 223 (Santa Monica,CA, RAND Corporation, January 2005). The authors found that removalof the earnings test had little influence on the labor supply decisionsof women; there was evidence, however, that eliminating the earningstest may have had an impact on the labor supply decisions of men.
26 Courtney Coile and Jonathan Gruber found that Social Securitypolicies which increase incentives to work at older ages can significantlyreduce the exit rate of older workers from the labor force. (See CourtneyCoile and Jonathan Gruber, Social Security and Retirement, WorkingPaper No. 7830 (National Bureau of Economic Research, August 2000).)
27 For more information on trends in retirement plan coverage, seeDallas L. Salisbury, ed., The Future of Private Retirement Plans(Washington, DC, Employee Benefit Research Institute, 2000).
28 See Leora Freidberg and Anthony Webb, Retirement and theEvolution of Pension Structure, Working Paper No. 9999 (NationalBureau of Economic Research, September 2003).
29 Some researchers have speculated that the performance of thestock market may influence retirement decisions of older workers. Forexample, the poor performance of equities over the 2000–02 periodmay have caused some older individuals to delay their exit from thelabor force, thus raising their labor force participation rates. (SeeAndrew D. Eschtruth and Jonathan Gemus, “Are Older WorkersResponding to the Bear Market?” Just the Facts on Retirement Issues(Chestnut Hill, MA, Center for Retirement Research at Boston College,September 2002).) However, in a recent study, Courtney Coile andPhillip Levine found scant evidence that the stock market affectsretirement decisions or reentry into the labor force. (See Courtney C.Coile and Phillip B. Levine, Bulls, Bears, and Retirement Behavior,Working Paper No. 10779 (National Bureau of Economic Research,September 2004).)
30 For example, research has found that poor health leads to an exitfrom the labor force for many older workers. (See John Bound, MichaelSchoenbaum, Todd R. Stinebrickner, and Timothy Waidmann, “TheDynamic Effects of Health on the Labor Force Transitions of OlderWorkers,” Labor Economics, June 1999, pp. 179–202.)
31 See United States Life Tables, 2002 (U.S. Department of Healthand Human Services, National Center for Health Statistics, November2004).
32 See The Impact of the Erosion of Retiree Health Benefits onWorkers and Retirees, Issue Brief No. 279 (Washington, DC, EmployeeBenefit Research Institute, March 2005).
33 Ibid.34 See Richard W. Johnson and Rudolph G. Penner, Will Health Care
Costs Erode Retirement Security? Issue In Brief No. 23, (ChestnutHill, MA, Center for Retirement Research at Boston College, October2004); and Richard W. Johnson, Amy J. Davidoff, and Kevin Perese,“Health Insurance Costs and Early Retirement Decisions,” Industrialand Labor Relations Review, July 2003, pp. 716–29.
35 According to the Centers for Medicare and Medicaid Services,national health expenditures accounted for about 9 percent of totalgross domestic product in the late 1970s; by 2004, the proportion hadrisen to 16 percent.

56 Monthly Labor Review October 2006
Trends in Labor force Participation
APPENDIX: Worklife patterns
Women born at different times have had dramatically differentworklife patterns. That women at or near retirement ages havemuch lower participation rates than young women is only partlydue to an aging effect. More so, it reflects differences betweencohorts of women. For instance, many women aged 50 years andolder in 2005 first reached the age at which they entered the laborforce in the 1960s and 1970s, when women were not usuallyexpected or encouraged to work and when employmentopportunities were somewhat limited.
In more recent decades, changes in social norms regardingwomen’s workforce participation affected young womendramatically, and the effect has been lasting. As a result, women intheir late thirties in 2005 are far more likely to be labor forceparticipants than were their mothers or grandmothers at any age.
Chart A–1 shows differences in the labor force participationpatterns of 5-year cohorts of women who were between the ages of 20and 69 years in 2005. By linking together the participation rates ofthese cohorts as they passed through successive ages (for example,women aged 65 to 69 years in 2005 were aged 50 to 54 years in 1990,55 to 59 years in 1995, and so forth), a longitudinal perspective isderived from cross-sectional CPS data. As the chart illustrates, evenbetween groups born as little as 5 years apart, differences in laborforce participation are striking. At every age, each successive cohortwas more likely to work than the preceding one. Part of the rise inparticipation of women probably reflects a delay in marriage and in thebirth of the first child. A comparison of the oldest and youngest groupsof women illustrates the cumulative effect of that trend. For instance,more than 70 percent of women in their thirties in 2005 were in thelabor force, nearly twice as many as in 1975.
Not only have participation rates increased with each successivegroup of women, but, as chart A–1 illustrates, worklife patterns
have changed fundamentally over time. The older cohorts followeda pattern in which about half of women were in the labor force intheir early twenties. Their participation rates dropped sharplyduring their childbearing years and then increased to a peak in theirlate forties. The peak rose higher and higher for each successivegroup, but the pattern began to change with the cohort entering thelabor force in the late1960s.
In the last several decades, the latter pattern has been replaced byone in which participation rates start much higher and continue torise, with no dropoff during childbearing years. Note, however,that, instead of rising steadily, the labor force participation patternfor the cohort currently in its early thirties has fallen over the past5 years.1 Chart A–2 shows current labor force patterns for men ateach age. Although women’s participation rates are lower than men’sat each age, the current labor force patterns of young womenresemble those of their fathers more closely than those of theirmothers. Until the mid-1960s, women’s participation rates by agedipped during the main childbearing years of the twenties. Thatpattern is now shifted to an inverted “U” and thus is similar to thatof men.
Note to Appendix
1 The decline in labor force participation of the youngest cohort couldreflect, in part, a rise in the number of births among women aged 30 to 34years. For example, in 1976, there were 56.4 births per 1,000 women inthis cohort; by 2004, the number rose to 93.8 births per 1,000 women.(See U.S. Census Bureau, Current Population Survey, June 2004.)

Monthly Labor Review October 2006 57
20–24 25–29 30–34 35–39 40–44 45–49 50–54 55–59 60–64 65–6920
25
30
35
40
45
50
55
60
65
70
75
80
85
20
25
30
35
40
45
50
55
60
65
70
75
80
85
Chart A-1. Labor force participation rates for selected 5-year cohorts of women, by age in 2005
Percent Percent
65–69
60–64
55–59
50–54
45–49
40–4435–39
30–34
20–24 25–29 30–34 35–39 40–44 45–49 50–54 55–59 60–64 65–6925
30
35
40
45
50
55
60
65
70
75
80
85
90
95
100
25
30
35
40
45
50
55
60
65
70
75
80
85
90
95
100
Chart A-2. Labor force participation rates for selected 5-year cohorts of men, by age in 2005
Percent Percent
50–54
55–59
65–69
60–64