Embed Size (px)
Citation preview
PoIlc~lA Pt gU
| Polcy Research
WQRKING PAPERS
Human Resources
Latin Ainerica Technical DepartmentThe World BankFebruary 1992
WPS 856
Latin American Women'sEarnings and Participation,
in the Labor Force
George Psacharopoulosand
Zafiris Tzannatos
Despite worsened economic conditions since the 1970s, women'sparticipation in the labor force has increased significantly sincethe 1 950s - possibly beca, se women have benefited dispropor-tionately from expansion of the public sector. Sound publicpolicy on education, family planning, childcare, and taxes - aswell as public efforts to increase women's job opportunities -
is most likely to improve women's (and hence children's)welfare.
Policy Research Woduing Papers disseminate the findmgs of work in progress and encourage the exchange of ideas among Bank staff and
aU others interested in development issues. Thesc papers, distributed by the Research Advisory Staff, carry the names of the authors, reflect
only theirvicws. and should beused and cited accordmnglylhe findings, interpretations, and conclusions are theauthors'own. They should
not be attributed to the World Bank. its Board of DirecLors, its management, or any of its member counines
Pub
lic D
iscl
osur
e A
utho
rized
Pub
lic D
iscl
osur
e A
utho
rized
Pub
lic D
iscl
osur
e A
utho
rized
Pub
lic D
iscl
osur
e A
utho
rized
Pub
lic D
iscl
osur
e A
utho
rized
Pub
lic D
iscl
osur
e A
utho
rized
Pub
lic D
iscl
osur
e A
utho
rized
Pub
lic D
iscl
osur
e A
utho
rized

Poldid Rwaxegh|
Human Resources|
WPS 856
This paper - a product of the Human Resources Division, Latin America Technical Department - is asummary of a larger LAC study, with subsiantial contributions from the Women in Development Divisiornof the Population and Human Resources Depanment, funded largely by the Norwegian Trust Fund. Copiesof the paper are available free from the World Bank, 1818 H Street NW, Washington, DC 20433. Pleasecontaci Liliana Longo, room 14-187, extension 39244 (38 pages). February 1992.
Using historical census data and the latest child-care facilities. Women's participation inhousenold surveys, Psacharopoulos and the labor force can also be affected by improvingTzannatos investigate changes in female employ- family law and tax regulations that createment in Latin America, the factors that determine hardships for women, especially in the Carib-women's participation in the labor force, and the bean, where intemal and overseas migration arereasons for the gap between men's and women's common (women as urban domestic servants andearnings. men as industrial workers abroad), where
visiting partnerships are common, and wherePsacharopoulos and Tzannatos find, to their women are often thrown into a vicious cycle of
surprise, that despite worsened economic condi- poverty and an inability to work.tions since the 1970s, women's participation inthe labor force has increased significantly since I'sacha-^poulos and Tzannatos found that thethe 1950s. One explanation may be that women same margina! investment (one additional year- especially educated urban women, most of of education) yields higher returns for womenwhom probably come from the middle and upper than for men; and that the most cost-effectiveclasses - benefited disproportionately from approach is to emphasize increased primaryexpansion of the public sector. The factors that education for poorly educated women rather thanhave most affected women's decisions to join the more public tertiary education for morework force have been (after controlling for age) advantaged women.education and family conditions (whether thewoman is married, is a head of household, or has In all of the countries studied, women arechildren). Creating opportunities for women's rewarded less than men and gender differenceseducation and employment when such factors are in human capital endowments account for anabsent because of market failures (of which average of about a third of the observed differ-discrimination may be only one cause) will ence in earnings - prima facie evidence ofimprove efficiency and reduce poverty. discrimination. On the other hand, women
appear to be rewarded more proportionate toOther policy-based factors that can affect their human capital endowments than men are.
women's participation in the work force include This may be because they benefit disproportion-the availability of family planning services and ately from expansion of the public sector.
The Policy Research Working PaperSeriesdissminates thePfindingsofwork underway in theBank. Anobjectiveoftheseriesis to get these faidings out quickly, even if presentations are less than fully polished. The findings, intetpretations, andconclusions in these papers do not necessarily represent official Bank policy.
Produced by the Policy Research Disseminafion Center
Table of Contents
1. Introduction 1
2. Female Labor Force Participation Trends 1
3. The Determinants of Female Participation 6
4. Female-Male Pay Differentials 10
5. Decomposing the Pay Differential 12
6. Contribution of Specific Variables to the Decomposition 18
7. Summary of Findings and Policy Options 21
8. Concluding Remarks 27
References 28

ACKNOWLEDGEMENTS
This paper is a summary of a larger LAC regional study, with substantial contributionsfrom PHRWD and largely funded by the Norwegian Trust Fund. The results presented heredraw from individual country papers prepared by Shahidur Khandker, Indermit Gill, CarolynWinter, Eduardo Velez, Maurice Stelchner, James Tenjo, Timothy Gindling, George Jakubson,Jill Tiefenhaler, Ying Ng, Katherine Scott, Thiery Magnac, Diane Steele, Hongyu Yang andMary Arends.
We are grateful to Barbara Herz for her continuous encouragement throughout thisproject, and for commenting on earlier drafts of this paper.
George PsacharopoulosSenior Human Resources Advisor
LATDR

1. Introduon
The reasons for women's inferior employment and earnings position in the labor marketsof developing countries have become a much debated topic in Labor and DevelopmentEconomics. In this spirit, we first examine broad trends in female participation in 15 LatinAmerica countries using population census data for the post-war period.' We subsequentlypresent the results of female participation functions that show which characteristics influence awoman in her decision to join or not join the labor market. In addition, we utilize the latestnational household surveys to assess the earnings differentials between women and men. Wesubsequently examine whether workers are rewarded only according to their economiccharacteristics, or whether their sex plays a role. If the latter, then one can legitimately talkabout sex discrimination in the labor market and start thinking of ways to remove this socialinequity and inefficiency. The distributional effects of such policies will be in the right directionas recent developmental work has demonstrated the "feminization" of poverty.2 This is,perhaps, one of the rare examples in social policy where intervention can simultaneously achievebeneficial efficiency ad equity effects provided, of course, that the diagnosis is correct.
2. Female Labor Force P_aricipation Trends
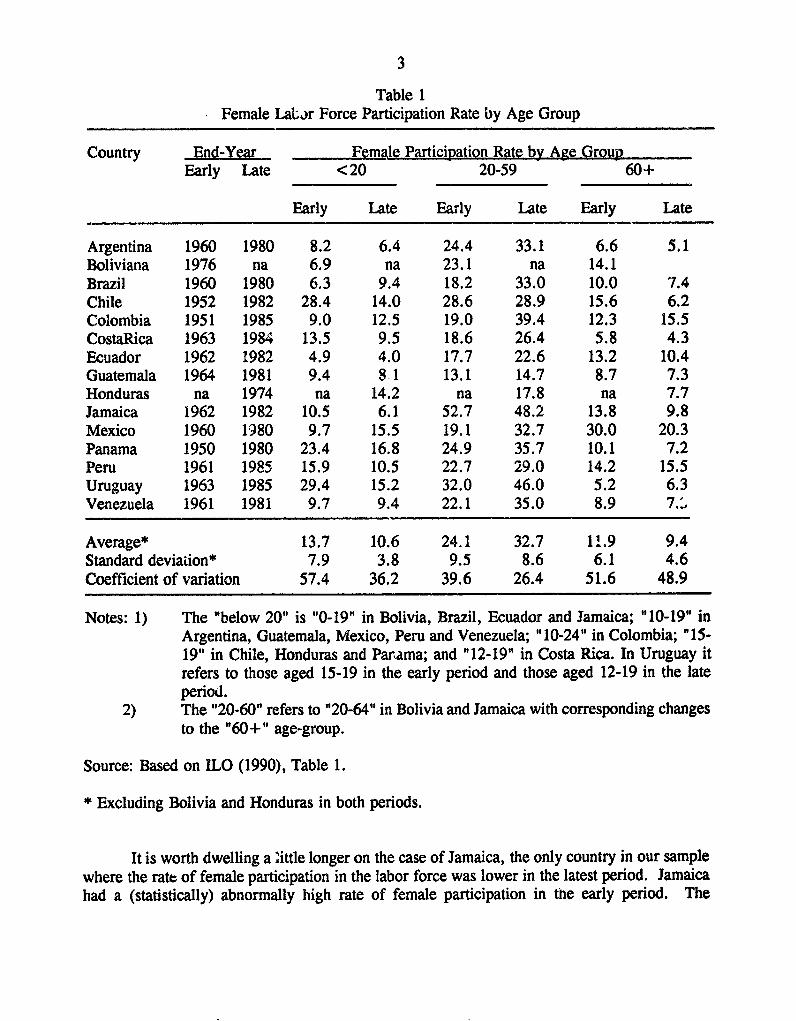
Latin America and the Caribbean have twice the number of countries examined in thispaper. However, our countries account for more than 90 percent of the 120 million total(female and male) labor force in the region.3 In this respect, any conclusion drawn from oursample should be fairly representative of the whole region. Table 1 shows the femaleparticipation rate in the countries under consideration for two time periods (sometime in the19,50s and the 1980s depending on the country). The aggregate (all-ages) labor forceparticipation rate is potentially misleading, especially in cross-country comparisons, as it isaffected by differences in the age-pyramid of the population. We have, therefore, broken downthe information into three crucial age groups: the young (those below the age of 20 years), theprime-age (20 to 59) and older (60+) . .en.
Bearing in mind that there is sume variation in the way national statistics draw thedistinction between work and non-work,4 the table clearly suggests that women's labor force
1 The countries studied are Argentina, Bolivia, Brazil, Chile, Colombia, Costa Rica, Ecuador,Guatemala, Honduras, Jamaica, Mexico, Panama, Peru, Uruguay and Venezuela (for more informationon the data sources see Psacharopoulos and Tzannatos, 1991).
2 Tokman (1989).
3 ILO (1990) provides information for 35 Latin America and Caribbean countries but many of thecountries not included in the present analysis are too small to alter the general picture. The mostpopulous country excluded from the present analysis is Cuba (with about 3.5 million workers) which doesnot have, however, a market oriented economy.
4 See Bowers (1975), Standing (1981), Psacharopoulos and Tzannatos (1989).
2
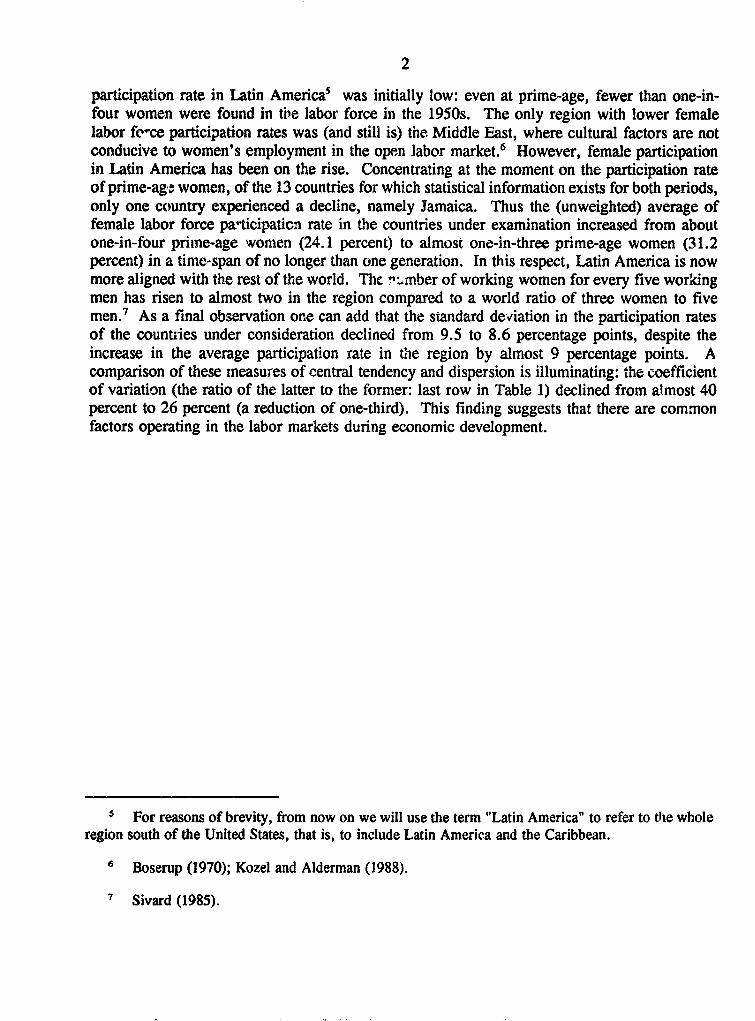
participation rate in Latin America5 was initially low: even at prime-age, fewer than one-in-four women were found in the labor force in the 1950s. The only region with lower femalelabor fece participation rates was (and still is) the Middle East, where cultural factors are notconducive to women's employment in the open labor market.6 However, female participationin Latin America has been on the rise. Concentrating at the moment on the participation rateof prime-ag. women, of the 13 countries for which statistical information exists for both periods,only one country experienced a decline, namely Jamaica. Thus the (unweighted) average offemale labor force participaticn rate in the countries under examination increased from aboutone-in-four prime-age women (24.1 percent) to almost one-in-three prime-age women (31.2percent) in a time-span of no longer than one generation. In this respect, Latin America is nowmore aligned with the rest of the world. The rn_..ber of working women for every five workingmen has risen to almost two in the region compared to a world ratio of three women to fivemen.7 As a final observation one can add that the standard deviation in the participation ratesof the countiies under consideration declined from 9.5 to 8.6 percentage points, despite theincrease in the average participation rate in tne region by almost 9 percentage points. Acomparison of these measures of central tendency and dispersion is illuminating: the coefficientof variation (the ratio of the latter to the former: last row in Table 1) declined from almost 40percent to 26 percent (a reduction of one-third). This finding suggests that there are commonfactors operating in the labor markets during economic development.
5 For reasons of brevity, from now on we will use the term "Latin America" to refer to the wholeregion south of the United States, that is, to include Latin America and the Caribbean.
6 Boserup (1970); Kozel and Alderman (1988).
7 Sivard (1985).
3
Table 1Female LaLar Force Participation Rate by Age Group
Country End-Year Female Participation Rate by Age GroupEarly Late < 20 20-59 60+i
Early Late Early Late Early Late
Argentina 1960 1980 8.2 6.4 24.4 33.1 6.6 5.1Boliviana 1976 na 6.9 na 23.1 na 14.1Brazil 1960 1980 6.3 9.4 18.2 33.0 10.0 7.4Chile 1952 1982 28.4 14.0 28.6 28.9 15.6 6.2Colombia 1951 1985 9.0 12.5 19.0 39.4 12.3 15.5CostaRica 1963 1984 13.5 9.5 18.6 26.4 5.8 4.3Ecuador 1962 1982 4.9 4.0 17.7 22.6 13.2 10.4Guatemala 1964 1981 9.4 8-1 13.1 14.7 8.7 7.3Honduras na 1974 na 14.2 na 17.8 na 7.7Jamaica 1962 1982 10.5 6.1 52.7 48.2 13.8 9.8Mexico 1960 1980 9.7 15.5 19.1 32.7 30.0 20.3Panama 1950 1980 23.4 16.8 24.9 35.7 10.1 7.2Peru 1961 1985 15.9 10.5 22.7 29.0 14.2 15.5Uruguay 1963 1985 29.4 15.2 32.0 46.0 5.2 6.3Venezuela 1961 1981 9.7 9.4 22.1 35.0 8.9 7.-
Average* 13.7 10.6 24.1 32.7 1'.9 9.4Standard deviadion* 7.9 3.8 9.5 8.6 6.1 4.6Coefficient of variation 57.4 36.2 39.6 26.4 51.6 48.9
Notes: 1) The "below 20" is "0-19" in Bolivia, Brazil, Ecuador and Jamaica; "10-19" inArgentina, Guatemala, Mexico, Peru and Venezuela; "10-24" in Colombia; "15-19" in Chile, Honduras and Parama; and "12-19" in Costa Rica. In Uruguay itrefers to those aged 15-19 in the early period and those aged 12-19 in the lateperiod.
2) The "20-60" refers to "20-64" in Bolivia and Jamaica with corresponding changesto the "60+" age-group.
Source: Based on ILO (1990), Table 1.
* Excluding Bolivia and Honduras in both periods.
It is worth dwelling a 'ittle longer on the case of Jamaica, the only country in our samplewhere the rate of female participation in the labor force was lower in the latest period. Jamaicahad a (statistically) abnormally high rate of female participation in the early period. The

4
Jamaican female participation rate was more than double the regional average and about 3standards deviations greater thaal the regional mean. In this respect, one might have expectedthat, if there were to be a change, the change would have most probably ue a dowriward one.In fact, the rate of male labor force participation in Jamaica also fell from 96 percent in 1962to 76 percent in '982.8 The changes in both the female and the male participation rates suggestthat still women iln Jamaica experienced a lesser decline in participation than men. Perhaps, acommon factor behind the decline in the participation rates of both women and men in Jamaicahas been the significant negative economic growth that the country experienced during the lasttwo-and-a-half decades: per capita GDP fell by as much as 1.3 percent per annum between 1965and 1989.9
In contrast to the increase in the participation rate of prime-age women in the region, theparticipation rates of younger and older women have consistently declined since the 1950s. Withrespect to younger age-groups, the only countries where participation increased were Brazil andColtombia. This was not unexpected: both countries experienced the highest rate of growth inthe participation rate of prime-age women (from almost 19 percent for both countries in thel950s to 33 and 39 percent respectively for Brazil and Colombia in the 1980s). Hence, theremust have been some factors in these two countries that were more conducive to an expansionof the overall female labor supply than in other countries in the region. Colombia also showsa rise in the participation rate of older women along with (mild increases) in Peru and Uruguay.However, these mild exceptions do not change the overall picture and, in summary terms, theaverage participation of young women fell from 13.7 percent to 10.6 percent and that for olderwomen decreased from 11.9 percent to 9.4 percent. The previous remr,ark on the cross-countryvariance of participation rates in the region that was made for the case of prime-age womenholds also in the case of the two other age-groups: the coefficient of variation for both younge,and older women was reduced significantly. Jt was reduced by almost half for young womenand by one-quarter for older women. This finding reinforces the view that the countries in theregion tend to become more homogeneous with respect to the use of female labor duringeconomic development.
The increase in female participation in the region was somewhat unexpected given theexperience of industrialized countries. The latter saw a rise in women's female participationduring periods of consistent economic growth and tight labor market conditions.'1 In contrast,the sizeable increase in female participation in Latin kmerica occured in a period of adversteeconomic conditions. For example, in five of the countries in the region (Argentina, ElSalvador, Jamaica, Peru and Venezuela) per capita GDP showed a negative average growth rate
8 ILO (1990), Table 1.
9 World Bank (1991, Table 1, p. 204).
1' See for example Mincer (1962), Cain (1966), Oppenheimer (1974) for the American case;Nakamura, Nakamura and Cullen (1979a) for C(nada; Joshi, Layard and Owen (1985) for Britain. Fora survey of the experience of the industrialized countries see Killingsworth (1986).

5
between 1965 and 1989.11 Per capita GDP was also lower in 1985 than it was in 1981 inanother 15 countries out of the additional 27 countries in the region for which informationexists."2 An explanation for the apparently diverse experience betwcvn Latin America and thegroup of industrialized countries may be the expanding opportunities for employment in thepublic sector -- a traditional employer of female labor. It is therefore possible that the expansionof the public sector has in turn retarded the growth in the region."3 Unfortunately the paucityof historical data with respect to the important distinction between private versus privateemployment does not allow us to pursue further this reasoning.
Could women's h-gher participation rates in the more recent period be the result of the"added worker" effect? This effect sugge3ts that more women (or, more appropriately, moresecondary workers) enter tthe labor market during periods of economic recession in an attemptto preserve family income and the level of household consumption. In contrast, the "discouragedworker" effect suggests that women drop out of the labor force during periods of recessionbecause expected retums to search are low: wages are depressed and the probability ot findingemployment is small. We do not think that either effect has much to do with the observed risein female participation in the region, even more so for the dominance of the added worker effectover the discouraged worker effect. There are three reasons for this belief. First, both theadded and discouraged worker effects are operating at the margin and relate to cyclical, notlong-term, variation. Our observation period is long enough for the task in hand so that anycyclical effect should not be sufficiently strong to distort the overall picture. Second, empiricalstudies have consistently found that in the case of women, the discouraged worker effect is thedominant one. One of the reasons for this is that during an economic recession women leaveemployment and become economically inactive in contrast to men who move from employmentto unemployment. Or they may switch more to home-based work which may be outside theformal sector. Another reason is simple arithmetic: the added and discouraged worker effectsoperate basically on the percentage of the labor force who are unemployed and who usuallyconstitute a small percentage of the total labor force. Hence, the broad trends in participationrates are primarily determined by the, say, 80 or even 90 percent of the labor force who are inemployment. Third, and finally, the drop in the participation rates of younger women is notcompatible with a dominant added worker effect.'4 We, therefore, conclude that the rise infemale participation that our data suggest for the post-war period is due to an underlying trendand cminot be attributed to the recession that hit the region in the eighties.
" World Bank (1991, Table 1, pp. 4-5).
12 World Bank (1990, Table 1, pp. 4-5).
13 This assertion is made by Schultz (1990).
14 For example, Joshi (1981) found no evidence that women have a different degree of cyclicalchange in employment than men through specific groups of women andf men (such as the younger andpensioiiers) have markedly different trends of cyclical instability.

6
In conclusion, the evidence suggests that women's participation rat. has risensignificantly since the 1950s. The rise was due to greater participation rtes of prime-agewomen. In addiion, the labor force in the countries examined in this paper has become morehomogenous with respect to women's participation. This o,servation applies to all three age-groups (young, prime-age and older women). Something that cannot be ruled out whether theincrease was the result of market forces or an expanding public sector.
3. The Determinants of Female Participation
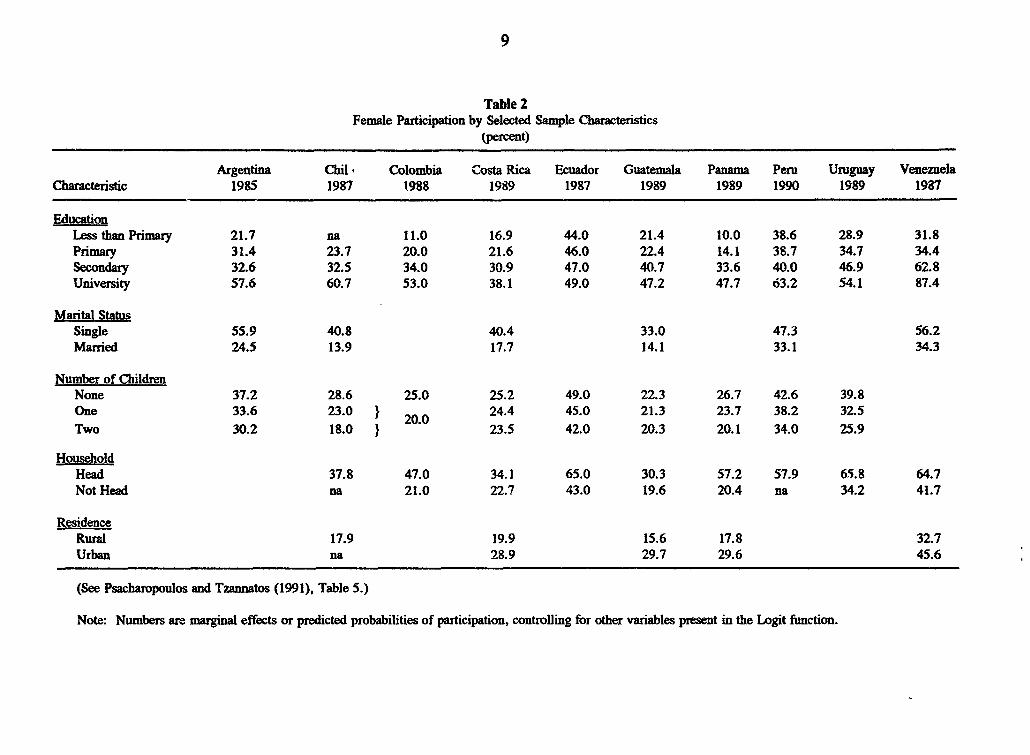
An obvious precondition fur any policy targeted at female participation is to understandthe factors that affect a woman's decision to join or not to join the labor market, especially acomparison of her marginal product at home and the wage labor force. In order to cast morelight in this area, we fitted a series of Logit regressions on "a wom in's decision to participate"in the labor force. The dependent variable took the value of zero, if the woman was notworking, and unity, if the woman was observed to be in the labor force. The independentvariables included a number of what can be labelled as exogenous factors such as age, years ofschooling, husband's earnings and other income, location (rural/urban or regional dummies),family size and so on. The exact specification was dictated by the availability of informationin the respective country household surveys at our disposition."5 Table 2 summarizes theeffects of some key variables on women's decision to participate in the labor market in selectedcountries.
Education has a significant effect on participation. For exampl-, in Argentina a womanwith less than primary education has a ceteris paribus probability oiL participation of only 28percent compared with a probability of 58 percent of a woman who is a university graduate.In Venezuela the probability of participation for the corresponding education groups rises fromabout 30 percent to more than 85 percent.
Women's family characteristics exercise a strong effect on participation, too. Marriedwomen's probability of participating in the labor force is about half the probability for singlewomen. For example, the probability for married women in Chile drops to 14 percent comparedto 41 percent for single women. In Costa Rica the corresponding decrease is from 40 percentto 18 perce1it, in Venezuela from 56 percent to 33 percent and in Guatemala from 33 percentto 14 percent.
Not surpisingly, being head of household increases the probability of participation in allcountries under consideration. In fact, this demographic aspect seems to be one of the strongestdeterminants of female labor force participation. For example, in Colombia the probability fora woman who is head of household jumps .o 47 percent (from 21 percent for non-heads of
15 The full results are reported in the country studies contained in Psacharopoulos and Tzannatos(1991).
7
household), in Panama to 57 percent (from 20 percent), in Uruguay to 66 percent (from 34percent), in Venezuela to 65 percent (from 42 percent) and in Guatemala to 30 percent (from20 percent).
The effect of children is mixed depending on their age. As a general rule, results fromcountries ihich could not take into account the age of childien suggest that the probability ofparticipation drops by about 3 to 5 percentage points for each child. When the age of childrencould be taren into account, the results for young children (aged less than 6 years) suggest thatthe effect is even stronger. However, the presence of older children increases the probabilityof female participation in some cour'_-es. This can be explained by the fact that older childrenmay be substitutes for women's services at home, as older children can both supervise theiryounger siblings and also contribute toward other areas of family production.16 I must also -estressed, that fertility and labor force participation could be a joint decision, raising importantendogeneity/estimation issues.
Individual country studies also report effects of variables whl:h are country specific. Forexample, in Bolivia the probability of a Spanish speaking woman to be in the labor market is42 percent while the corresponding probability for an indigenous woman is only 22 percent.17
Also, variables relating to ie physical health of a woman have the predicted effect of women,that is, ill-health affects adversely the probability of participation. In addition, the presence ofadult non-workers il the household decreases the probability of female participation. This maysuggest that there is higher demand for domestic services when household size increases and thistranslates into an increase in women's shadow wage at home.'8 Finally geographical locationis another significant factor for women's decision to participate. As: general rule women inurban areas have a much higher probability of participation than their counterparts in rural areas.
Another consistent result in the participation functions is that, after controlling for otherfactors, women's propensity to work for pay is high even during the childbearing age (thecoefficient on age increases up about the age of 40 to 45 years in all country studies, and it isboth sizeable and statistically significant). In this respect, women's behavior appears to be exante similar to that of men. However, the actual age profile of female participation dips during
Boserup (1970) and Stand j (1981).
7 For example, indigenous women have a lower probability of being in the labor force comparedwith women of other origin. Also in Brazil there are substantial differences in the participationprobabilities of women belonging to different racial groups (white, black, Asian and Mulatto).
'8 These estimates may understate the effect of the presence of non-working adults in the householdupon the probability of female participation as such aduits may also assist in some household tasksperformed by women.

8
the reproductive age.19 The conflict between productive and reproductive decisions is obvious.In fact, it is this a,-ymmetry, in part biological and in pdrt. stemming from societal norms, whichlargely destines women to the observed employment and pay characteristics in the labor market.
In conclusion, the country studies confirm that women's decision to participate in thelabor market depends, on the one hand, on education and, on the other hand, on theirdemographic characteristics. Of course, these results are partly based on the assumpticn. thatthese characteristics are exogenous to the participatior functions, and this assumption is notnecessarily appropriate. However, the magnitude and consistency of results are sufficiently clearfor the limited generalizations attempted ldter in this paper.
19 See chapter on "Female Labor Force Participation in Latin America: Patterns and Trends, 1950-1985" in Psacharopoulos and Tzannatos (1991).
9
Table 2Female Participation by Selected Sample Characteristics
(percent)
Argentina Chil Colombia Costa Rica Ecuador Guatemala Panara Peru Uruguay VenezuelaCharacteristic 1985 1987 1988 1989 1987 1989 1989 1990 1989 1987
EducationLess than Primary 21.7 na 11.0 16.9 44.0 21.4 10.0 38.6 28.9 31.8Primary 31.4 23.7 20.0 21.6 46.0 22.4 14.1 38.7 34.7 34.4Secondary 32.6 32.5 34.0 30.9 47.0 40.7 33.6 40.0 46.9 62.8University 57.6 60.7 53.0 38.1 49.0 47.2 47.7 63.2 54.1 87.4
Marital StatusSingle 55.9 40.8 40.4 33.0 47.3 56.2Married 24.5 13.9 17.7 14.1 33.1 34.3
Number of ChildrenNone 37.2 28.6 25.0 25.2 49.0 22.3 26.7 42.6 39.8One 33.6 23.0 } 20.0 24.4 45.0 21.3 23.7 38.2 32.5Two 30.2 18.0 } 23.5 42.0 20.3 20.1 34.0 25.9
HouseholdHead 37.8 47.0 34.1 65.0 30.3 57.2 57.9 65.8 64.7Not Head na 21.0 22.7 43.0 19.6 20.4 na 34.2 41.7
ResidenceRual 17.9 19.9 15.6 17.8 32.7Urban na 28.9 29.7 29.6 45.6
(See Psacharopoulos and Tzmaatos (1991), Table 5.)
Note: Numbers are marginal effects or predicted probabilities of participation, controlling for other variables present in the Logit function.

10
4. Female-Male Pay Differentials
Table 3 shows the average earnings of women and men in the 15 countries for which wehave household-level surveys.20 In all countries female workers are paid less than male workersand in some countries (such as Argentina, Bolivia, Chile, Ecuador and Jamaica) women are paidsubstantially less than men (female pay less than 30 percent of female pay). Though somevariation is due to the fact that the time period to which earnings refer is different acrosscountries, this variation is not great: the standard deviation of the ratio of female-to-male payis 11 percentage points compared with a regional mean of 73 percent. This may be taken asevidence that women, as a factor of production, are again treated in a rather uniform way acrossthe region with respect to pay as was, indeed, the case of participation.
Table 3Mean Earnings by Sex
Earnings Female/MaleEarnings Ratio
Country Year Currency Female Male (percent)
Argentina 1985 Australes/month 63559.0 98483.5 64.5Bolivia 1989 Bolivianos/week 68.9 110.5 62.3Brazil 1989 Cruzados/hour 7.7 10.9 70.3Chile 1987 Pesos/month 10912.0 23166.0 47.1Colombia 1989 Pesos/week 9078.0 10727.0 84.6CostaRica 1989 Colones/month 14910.0 18459.0 80.8Ecuador 1987 Sucres/month 22327.0 35077.0 63.7Guatemala 1989 Quetzals/month 183.5 238.8 76.8Honduras 1989 Lempiras/week 73.5 90.4 81.3Jamaica 1989 Jam$/week 33.1 57.4 57.7Mexico 1984 Pesos/week 5643.7 6590.9 85.6Panama 1989 Balboas/hour 1.7 2.0 84.8Peru 1990 Intis/hour 46.1 56.0 82.3Uruguay 1987 Pesos/hour 730.0 980.0 74.5Venezuela 1989 Bolivares/week 1179.9 1518.2 77.7
Source: Psacharopoulos and Tzannatos (1991) and references therein.
2 For reasons of comparison, in Table 3 earnings are presented in the same "form" (that is, perhour, week or month) as they were used in the earnings functions that follow.
11
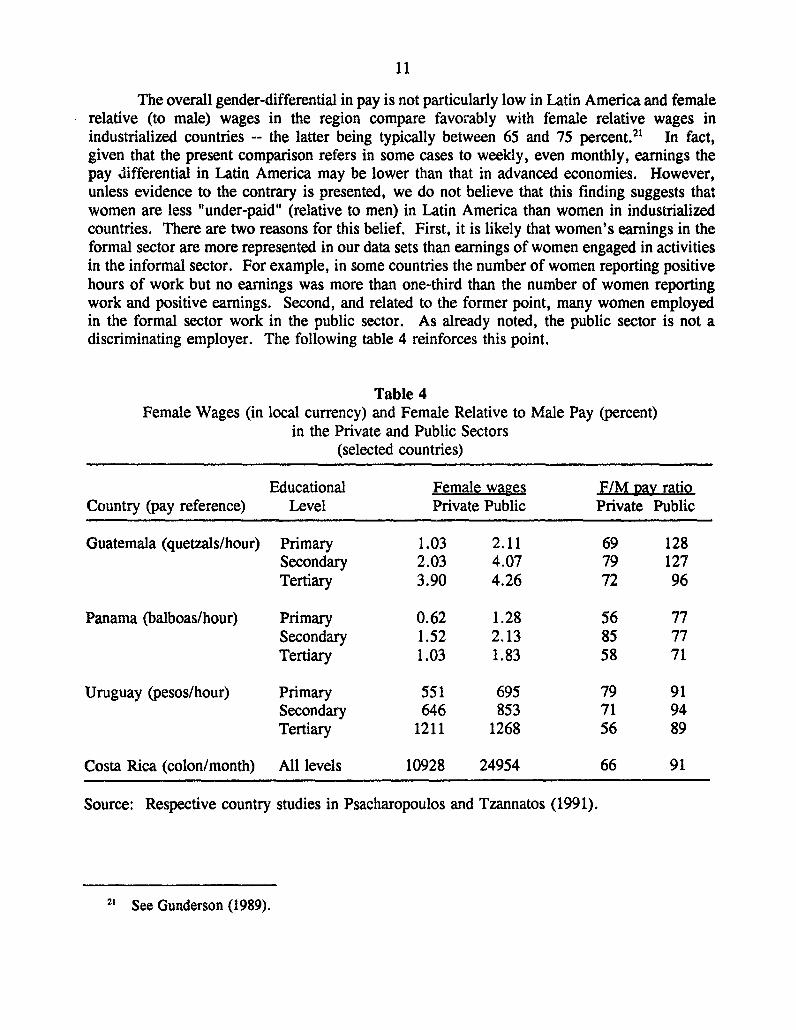
The overall gender-differential in pay is not particularly low in Latin America and femalerelative (to male) wages in the region compare favorably with female relative wages inindustrialized countries -- the latter being typically between 65 and 75 percent.2" In fact,given that the present comparison refers in some cases to weekly, even monthly, earnings thepay differential in Latin America may be lower than that in advanced economies. However,unless evidence to the contrary is presented, we do not believe that this finding suggests thatwomen are less "under-paid" (relative to men) in Latin America than women in industrializedcountries. There are two reasons for this belief. First, it is likely that women's earnings in theformal sector are more represented in our data sets than earnings of women engaged in activitiesin the informal sector. For example, in some countries the number of women reporting positivehours of work but no earnings was more than one-third than the number of women reportingwork and positive earnings. Second, and related to the former point, many women employedin the formal sector work in the public sector. As already noted, the public sector is not adiscriminating employer. The following table 4 reinforces this point.
Table 4Female Wages (in local currency) and Female Relative to Male Pay (percent)
in the Private and Public Sectors(selected countries)
Educational Female wazes F/M pay ratioCountry (pay reference) Level Private Public Private Public
Guatemala (quetzals/hour) Primary 1.03 2.11 69 128Secondary 2.03 4.07 79 127Tertiary 3.90 4.26 72 96
Panama (balboas/hour) Primary 0.62 1.28 56 77Secondary 1.52 2.13 85 77Tertiary 1.03 1.83 58 71
Uruguay (pesos/hour) Primary 551 695 79 91Secondary 646 853 71 94Tertiary 1211 1268 56 89
Costa Rica (colon/month) All levels 10928 24954 66 91
Source: Respective country studies in Psacharopoulos and Tzannatos (1991).
21 See Gunderson (1989).

12
It is obvious from the above table that women workers in the public sector are paid morethan their counterparts in the private sector. In addition women in the public sector have greaterpay equality compared to men than their counterparts in the private sector. To some extent v ,edifferences reflect the fact that wome in the public sector tend to be more educated than womenin the private sector, and also relative to men in the public sector. However, another way toestablish that women workers in the public sector enjoy a pay premium is the following. Insome earnings functions we included a variable indicating the sector (public/private) in whichthe worker was employed.' In this way we controlled for other characteristics and thecoefficient on this variable indicates the rs effect on pay from holding a job with the publicsector. In the case of Ecuador, women workers in the public sector have a ceterisparibus wagepremium of 25 percent compared with female workers in the private sector. However, maleworlcers in Ecuador do not seem to enjoy any pay advantage from employment in the publicsector. Also, the female pay premium in public sector employment in Guatemala is 15 percentafter controlling for other characteristics. In contrast, male public sector employees inGuatemala have a pay disadvantage of nearly 8 percent.23
Consequently, the role of the public sector in the region may distort the overall estimatesof female relative pay in a way similar to the observed rise of female participation in the region.The difference between public and private sector pay is not as important in advanced countries.On the contrary, the public sector in the latter group of countries is generally considered to bea low-pay employer because of the other non-pecuniary advantages that it usually offers (tenure,social benefits, pension and so on). These remarks explain why somewhat unexpectedly femalerelative pay in Latin America appears to be on the high side compared with women's pay inadvanced countries.
5. Decomposing the Pay Differential
Two different approaches are typically used to account for the factors determining theobserved pay differential between women and men. First, one can examine whether there is afixed premium/disadvantage associated with the sex of the worker. Second, one can investigatewhether individ6al characteristics of female workers are rewarded differently in the labor marketthan the corresponding characteristics of men. The former approach relates to a "shift" in theearnings function and the latter to a "difference in the slope coefficients" of the earningsfunction.
The first approach consists of running a regression of earnings upon the characteristicsof all (male and female) workers including a separate variable which indicates the sex of the
2 The inclusion of the public/private sector variable was dependent on the available information.
t See chapters 16 and 24 respectively for Ecuador and Guatemala in Psacharopoulos and Tzannatos(1991).

13
worker.24 This can be shown as follows
ln(W) = C + (X)a + b(F) + ei (1)
where ln(W) is the logarithm of the ith worker's pay,25 C is a constant term, X is a vectordenoting whatever measurable personal characteristics of relevance are utilized by the researcher,a is the vector of the estimated coefficients/effects of these characteristics upon pay, F is a(dummy) variable taking the value of 1 if the worker is female and 0 if the worker is male, ande refers to unobserved or unmeasurable characteristics.26 The interpretation of equation 1 is thatindividual earnings depend on the workers's observed characteristics (X's), the worker's sex (F),and unobserved characteristics (the error term) assuming that e is not correlated to F at givenx. 27
The coefficient of interest is that on the variable representing the sex of the worker,which shows whether women receive on average lower pay than men (b < 0) other things beingequal (after adjusting for whatever the X's account for). This approach constrains, however, thevalues of the coefficients on the other explanatory variables, such as education and experience,to be the same for women and men. Given that sex-specific earnings functions have producedcoefficients on female characteristics that are significantly different than those for men,28 afinding confirmed also by the present studies, this approach is bound to yield, in general, biasedresults.
The second approach consists of running two regressions separately on women's earningsand men's earnings and comparing the outcome. This method requires the two regressions tohave a strictly comparable specification, that is, the number and type of variables should be thesame in both the female and male earnings functions. Thus the estimation can start with thefollowing two regressions (omitting subscripts for notational simplicity)
I' See Beller (1984), Fallon and Verry (1988, Chapter 5) or Killingsworth (1990, Chapter 3). Forapplications and extensions of this approach to measuring wage differentials in other areas of researchsee Smith (1977), Oswald (1985) and Ehrenberg and Schwarz (1986).
"The logarithm of earnings, rather than the level of earnings as such, is considered to be theappropriate regressand both on theoretical grounds (Mincer, 1974) and also on enmpirical grounds(Dougherty and Jimenez, 1991).
'he error term is assumed to be normally distributed with zero mean.
27'f the error term is negatively correlated to F, then the coefficient on discrimination will be biasedupwards as women will possess fewer unobservables than men with the same X's. This bias arisesbecause the characteristics which are unobserved and affect women negatively will register an effect viathe coefficient on the dummy variable measuring sex in addition to the pure efiect of sex upon pay.
'Psacharopoulos (1985); Tilak (1987); Sahn and Alderman (1988); Schultz (1989b); Bustillo (1989).

14
ln(Wm) = Cm + (Xm)m +e, (2)ln(Wf) = Cf + (Xf)f +ef (3)
where C, (s=male or female) is the constant term, X, is the vector of male or femalecharacteristics, m and f are the respective coefficients on these characteristics, and e, is the errorterm with the usual properties. Then, the "adjusted" pay gap can be estimated in the followingway: the difference in the averag logarithms of male and female pay [ln(W,)-ln(W,) - nosubscripts] can be shown to be equal to the percentage difference of male to female average pay(W. and Wf)9
ln(WV) - ln(Wf) = ln[(l +(W"-Wf)/Wf] (4)= (Wi-Wf)/Wf
Given the previous two equations and utilizing the regression property that the error termhas a mean value of zero, one can rewrite the right hand side of equation (4) as
1n(WJ) - ln(Wf) = (Cm - Cf) + [(X,)m - (Xf)f] (5)
where first bracket refers to the respective constant terms in the male and female earningsfunctions, and X. and Xf are the average values of the male and female characteristics in thesample. Adding to and subtracting from equation (5) the term (Xf)m or (X,)f and rearrangingproduces the following two "decompositions" of the gross differential in average pay
ln(W.) - ln(Wf) = [(C.-Cf)+(Xf)(m-f)] + [(X,-Xf)m] or (6)= ((Ci-Cf)+(X.)(m-f)] + [(X.-Xf)f] (7)
Thus, the percentage difference in pay can be seen to come from two different sources.First, the differential rewards to male and female characteristics (m-f) in the labor marketincluding the difference between the constant terms and, second, the differences in the quantitiesof these characteristics held by men and women (X,-Xf). In this approach, the portion of thewage gap due to differences between the endowments of productive characteristics held bywomen and men can be considered to be nondiscriminatory (or "justified" discrimination).30
On the other hand, the portion of the wage gap which is due to differences in the values of thecoefficients, including the constant term, can be thought of as the upper bound of ("unjustified")discrimination. Obviously, this approach (equations 6 and 7), which utilizes two separateearnings functions, encompasses the previous one (equation 1) which is based on a singleregression and examines, in effect, only the difference in the constant terms. This explains thepopularity of the decomposition based on separate earnings functions for women and men in
'Oaxaca (1973).
3Blinder (1974).
15
applied research.3 ' This is the approach followed here.
One should note that equations (6) and (7) do not produce the same results. The formerdecomposition evaluates the justified and potentially discriminatory components of the pay gap,if women were paid as men. The latter decomposition assumes that men are paid like women.This is a common problem with index numbers.32 In practice, it is not certain whether adecomposition based on female means will produce a higher or lower estimate for justified orunjustified discrimination than a decomposition based on male means. It all depends on therelative "flatness" of the two earnings functions (that is, the curvature of the lines around theregion of the average female and male characteristics). However, both decompositions haveproduced similar results in applied research -- including the present country studies.
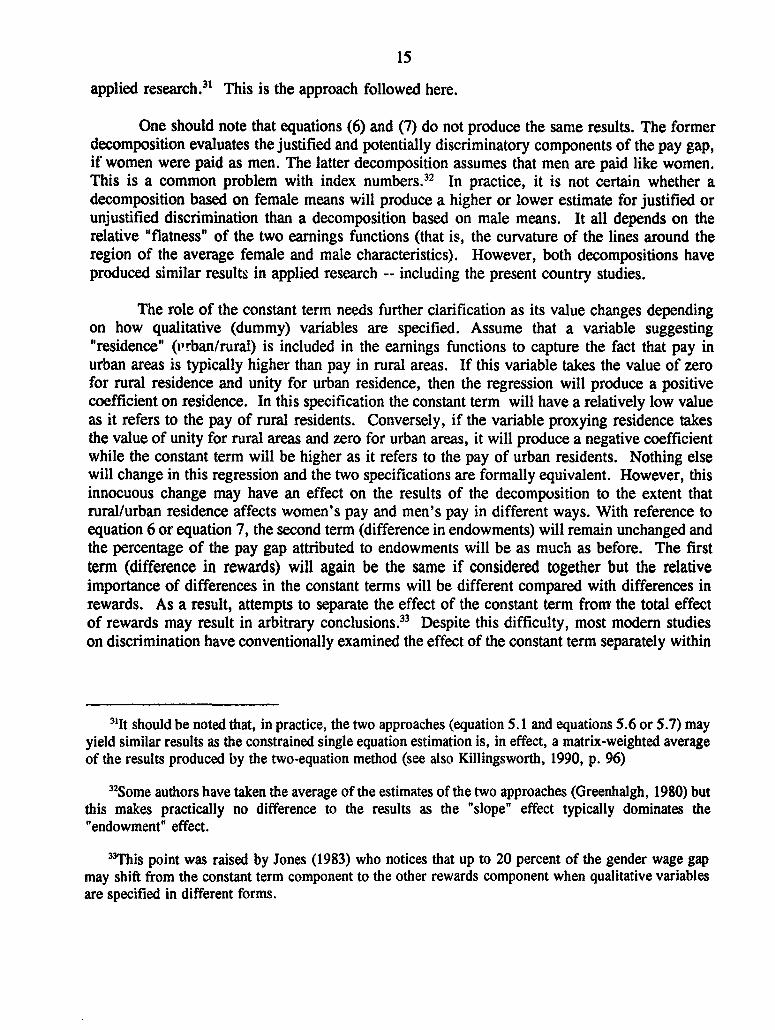
The role of the constant term needs further clarification as its value changes dependingon how qualitative (dummy) variables are specified. Assume that a variable suggesting"residence" (vrban/rural) is included in the earnings functions to capture the fact that pay inurban areas is typically higher than pay in rural areas. If this variable takes the value of zerofor rural residence and unity for urban residence, then the regression will produce a positivecoefficient on residence. In this specification the constant term will have a relatively low valueas it refers to the pay of rural residents. Conversely, if the variable proxying residence takesthe value of unity for rural areas and zero for urban areas, it will produce a negative coefficientwhile the constant term will be higher as it refers to the pay of urban residents. Nothing elsewill change in this regression and the two specifications are formally equivalent. However, thisinnocuous change may have an effect on the results of the decomposition to the extent thatrural/urban residence affects women's pay and men's pay in different ways. With reference toequation 6 or equation 7, the second term (difference in endowments) will remain unchanged andthe percentage of the pay gap attributed to endowments will be as much as before. The firstterm (difference in rewards) will again be the same if considered together but the relativeimportance of differences in the constant terms will be different compared with differences inrewards. As a result, attempts to separate the effect of the constant term from the total effectof rewards may result in arbitrary conclusions.33 Despite this difficulty, most modern studieson discrimination have conventionally examined the effect of the constant term separately within
3"It should be noted that, in practice, the two approaches (equation 5. 1 and equations 5.6 or 5.7) mayyield similar results as the constrained single equation estimation is, in effect, a matrix-weighted averageof the results produced by the two-equation method (see also Killingsworth, 1990, p. 96)
32Some authors have taken the average of the estimates of the two approaches (Greenhalgh, 1980) butthis makes practically no difference to the results as the "slope' effect typically dominates the"endowment" effect.
33This point was raised by Jones (1983) who notices that up to 20 percent of the gender wage gapmay shift from the constant term component to the other rewards component when qualitative variablesare specified in different forms.

16
the 'rewards part" of the gender wage gap.' In what follows, the nature of our resultsnecessitates the separation of the effects from the difference in the constant terms and thedifferences b-tween rewards but the previous qualifications should be borne in mind.
Bearing these remarks in mind we ran separate earnings function for women and men.In addition, we corrected for selectivity, when appropriate the earnings functions of women.This is a well established procedure in order to take into account the possibility that womenworkers may not be representative of all women in the economy." Table 5 presents thepercentage of the pay gap which can be attributed, on the one hand, to differences in the labormarket endowments held by women and men and, on the other hand, to differences in the labormarket rewards associated with these characteristics.36
Table 5Decomposition of the Male Pay Advantage in the Region
(percent)
Evaluated atSelectivity Pay advantage Female means Male meansCorrection due to
No Endowments 3.2 2.9Rewards 96.8 97.1
Yes Endowments 20.4 17.4Rewards 79.6 82.6
Total' 100.0 100.0
The overall male pay advantage is 30 log-percentage points.
A number of clarifications need be made in order to correctly interpret the summarydecomposition results. First, the pay gap is shown as log-percentage points of the male pay
'See among others, Shapiro and Stelcner (1986); Behrman and Wolfe (1986); Birdsall and Fox(1985); Knight and Sabot (1982) and the collection of papers in Birdsall and Sabot (forthcoming).
35See Heckman (1979) and the extensive discussion of the subject in Psacharopoulos and Tzannatos(1991, Chapter 5).
MThe information presented in the Table 5 is derived from Appendix Table Al. There we reportresults wlhich are standardized on female means (women paid as men: columns 2-3 and 6-7) and also onmale means (men paid as women: columns 4-5 and 8-9). We also report separately the results obtainedfrom coefficients which were uncorrected (columns 2 to 5) or had been corrected for selectivity bias(columns 6 to 9).
17
advantage.37 This corresponds closely to the ratio of average male earnings to average femaleearnings in the sample.3s Second, differences in endowments refer to the difference in theaverage values of a particular characteristic in the sample between men and women.39 Third,differences in rewards refer to the difference in the corresponding coefficients as reported in theearnings functions. Again this difference is calculated between men and women.
According to the data, the male pay advantage in the present data set varies betweenabout 15-20 percent (in Colombia, Mexico and Peru) and 40-50 percent (in Argentina, Bolivia,Ecuador and Jamaica). This gives an unweighted average of male pay advantage in the regionof about 30 log-percentage points (or female/male pay of about 75 percent). The two mostobvious conclusions that can be drawn from Table 5 are the following.
First, the selectivity corrected estimates for the part of the pay gw attributable todifferences in rewards (upper bound of discrimination) are lower than the results derived fromthe uncorrected estimates. Correcting for selectivity reduces the upper bound of discriminationfrom 97 percent to 80 percent. The reason that selectivity correction (lambda) reduces theunexplained part of the wage gap in the region is because in most country studies the coefficienton lambda was negative.40 This implies that the difference in the wage offers of women andmen is smaller than the difference in atual wages. Though it is not strictly appropriate tocalculate averages from percentages, especially when these percentages refer to countries whichdiffer in population size (and characteristics) as much as Jamaica differs from Brazil, themagnitude of the corrected and uncorrected results may be taken to suggest that only a small partof the difference in the actual wages between women and men reflects self-selection of womenin the labor force. Our figures imply that, if the average female worker had the characteristics
3'The reason for expressing the pay gap in terms of male advantage is because the decomposition isformulated in this way. Recall that our decomposition refers to the difference in the average logarithmsof earnings between men and women, that is, log(W,)-log(Wf): see equation 6.
3'For example, in Argentina the pay gap is indicated as 43.2 percent and this should be taken to meanthat men earn on average 43.2 percent more than women. In other words the pay differential is notexpressed in one of the more conventional vays - such as in terms of the relative female/male wage(which is 69.8 percent) or the underpayment of women (which is 30.2 percent).
39Again with reference to Argentina working women have on average 9.4 years of schoolingcompared to 8.8 years of schooling for men (see Appendix Table A3). In this case the relevant differenceis -0.6 years of schooling and the negative sign suggests that, had women and men been equally endowedin terms of schooling, the male pay advantage would have been even greater.
'he coefficient on lambda was positive and significant only in the case of Uruguay. Insignificantpositive coefficients are reported for Ecuador, Peru (1986) and Bolivia. Insignificant negative results arereported for Argentina, Colombia (1979), Costa Rica, Peru (1990) and Venezuela (1989) (see AppendixTable A6).
18
of the average woman in the population, then the observed pay gap would decrease byapproximately 15 percent (or about 5 percentage points).4 '
A second conclusion is that, irrespective of whether the results are based on correctedor uncorrected coefficients, only a small part of the pay gap is attributable .o differences inendowments. Even in the case of selectivity- corrected results almost four-fifths of the pay gapis due to differences in rewards. This finding warrants further inspection in order to see whichare the variables in the earnings functions that give rise to such result.
6. Contribution of specifi cvariables to the decomposition
The decomposition was estimated from separate earnings functions for women and men.In particular, the typical earnings function had the following simplified gezieral form (omittingsubscripts i for notational simplicity)
ln(Wm) = C. + amSm +bmEm +c.ln(Hm) +(Xm)m +em (8)ln(Wf) = Cf + afSf +bfEf +cfln(HL) +(Xf)f +ef (9)
where W stands for weekly earnings, C is the constant term, S refers to education measured inyears of schooling, E is potential experience also in years (age minus years of schooling minus6), H is weekly hours worked and X is a vector representing whatever other variables mighthave been included in the earnings functions of individual country studies. Lower case lettersattached to these variables stand for their respective coefficients, subscripts m and f refer to menand women, and e is an error term assumed to have the usual properties. This specification isapplicable when the dependent variable is specified as weekly earnings and below we concentrateon the results from earnings functions specified in this way. For brevity, we report results forcoefficients derived from the sample of women workers only, that is, uncorrected for selectivityfor four reasons. First, the difference between corrected and uncorrected coefficients was notthat great. Second, uncorrected results are more comparable across countries than correctedresults because the variables used in the participation functions (in order to estimate theselectivity correction variable) varied between countries. Third, women workers are theappropriate reference group for explaining the observed (actual) gap in wages (rather than thegap in wage offers). Fourth, the coefficient on the selectivity correction variable (lambda) wasfound to be statistically insignificant in half of the countries studied. A final remark to be notedis that our regional averages were calculated from percentages while there are effects from othervariables which are nct taken explicitly into account (the variables denoted by X in equations8 and 9). As a result, their sums do not match exactly the observed pay gap.
"'This was derived by taking the difference between the uncorrected estimates for the part of the paygap attributed to rewards (97 percent) and corresponding part suggested by the corrected coefficients(about 80 percent). Given that the male pay advantage is about 30 percent, this implies that(0. 17x.0.30=) 5.1 percentage points would be eliminated from the actual wage gap, if working womenwere representative of all women in the economy.

19
Table 6 shows which part of the pay gap can be attributed to differences in endowmentsand which to difference in rewards with respect to each of the main variables indicated in theearnings functions (equations 8 and 9). In terms of endowments, women appear to bedisadvantaged with respect to hours and also experience (though men have longer experiencebecause of fewer years of schooling). These two variables taken together explain just over halfof the pay gap (16.5 log-percentage points). However, differences in schooling favo-!r women.In fact, schooling has a stronger effect than the effect of either hours or experience. As a result,the part of the pay gap that can be attributed to difference in endowments is reduced to only 22percent.
Table 6Contribution (in log-percentage points) of Selected Variables
to the Male Pay Advantage in the Region
Variable Due to differences in Total explained byendowments rewards the variable
Hours 6.6 -32.1 -25.5Education -11.1 -12.3 -23.4Experience 9.9 10.2 20.1Total excl. constant term 5.4 -34.2 -28.8
Constant term 52.2 52.2Total incl. constant term- 5.4 18.0 23.4
(22%) (78%) (100%)
Source: Appendix Tables.
In terms of rewards, women seem to benefit significantly from education and hours(though the latter may be taken as an unfavorable result because women work fewer hours thanmen).42 These two factors would have more than doubled the pay gap had it not been for themitigating effect of the difference in the coefficients on experience. However, the contributionof experience is not that important and, as argued below, it may be a biased result against
4 This is an appropriate point to raise a specific methodological issue in the present decompositionanalysis. Can the greater female coefficients on hours be interpreted as discrimination against men? Infact, this is what a "mechanical" interpretation of the Oaxaca decomposition would suggest. However,we do not think this interpretation is correct. Another way of interpreting the female advantage in therewards of weekly hours is the following: women are penalized in the labor market because workingfewer hours than men reduces their pay proportionately relative to those men who work fewer hours.In this respect, what the present decomposition assigns as a female advantage in terms of rewards is ineffect a disadvantage because the endowments in hours are systematically lower for women than men.

20
women as potential experience is used rather than actual experience. In any case, the net effectof these three variables still suggests a reversal of the pay gap (pay advantage for women).When the constant term is taken into consideration, the effect from the difference in rewards isinflated in the opposite direction to the point that rewards account for 78 percent of the male payadvantage.
These results may be subject to two different interpretations. First, ignoring the effectof differences between the constants terms, one can argue that in many Latin Americancountries only a small fraction (if any) of the gross pay differential can be attributed to aninferior wage structure (differences in rewards) of women relative to men.43 This remarkshould, however, be qualified because formal sector employees may be heavily represented inour samples -- and the role of public sector pay may be particularly distortionary. The over-representation of public sector employees in our data bases and the high wages paid to womenworkers in the government sector make us skeptical about the "no-or-little discrimination" resultssuggested by the present decomposition analysis. In addition, as argued below, it might be truethat the constant term cannot be considered separately from the other "rewards" in thedecomposition analysis but there is no practical objection that its place is among the "rewards"part of the gender wage gap.
The second interpretation stems from the last observation, that is, that the part of thewage gap attributed to the difference in the constant terms falls well within the potentialdiscrimination aspect of the results. The constant term represents the "reward to the sex of theworker" when all other characteristics are equal to zero. In other words, the constant term canbe interpreted as the earnings of an uneducated worker who is just about to enter the labormarket. However, we are not prepared to accept that the difference in constant terms representsactual discrimination because information is lacking: the value of constant term is affected byfactors pertaining to both labor demand and labor supply.' With respect to labor demand, onecan mention differences in productivity between the sexes or imperfect information, while onthe labor supply side there may be differences in tastes between women and men. This is apessimistic conclusion to the present analysis. The light that was shed into the economists'"black box" (differences in rewards or "upper bound of discrimination") revealed that there wasanother black box inside it: the constant term is another black box on its own.
43This is not an uncommon finding in the literature on discrimination for developing countries.Knight and Sabot (1982) report that in Tanzania in 1971 only 5-17 percent of the gross pay differentialbetween women and men can be att^ibuted to different wage structures when evaluated at male meanswhile it is negative (-3 to -45 percent) if evaluated at female means. Similar results are reported in manyof the studies included in Birdsall and Sabot (forthcoming).
4The role of the constant term in measuring discrimination is questionable, if the constant term istaken to proxy the average effect on earnings of productivity characteristics omitted from the analysis.However, if the earnings functions are correctly specified, then the constant term should be included intne decomposition formula.

21
A more optimistic interpretation may, however, be relevant to our findings. The constantterms can be seen as a pure premium that is independent of a worker's other wage-determiningcharacteristics. Hence, if women are undervalued in the market when they have fewcharacteristics (zero endowments) but recoup almost half of the lost ground because of theeffects of schooling, hours of work and, possibly, experience, then one may have a policyprescription to the problem of growth and the feminization of poverty: if a woman's educationincreases and her labor force attachment and experience also increase, her pay will increaseproportionately more than a man's pay in similar initial conditions. In fact, we believe that thisis the way the present findings should be interpreted.
7. Summary of Findings and Policy Options
Female participation has increased significantly in Latin America since the 1950s. Theincrease was due to the higher participation rates of prime-age women in the recent period.Younger and older women experienced a decline in their participation rates. These movementsare comparable to those observed in advanced countries sometime in the past and are also inaccordance with conventional explanations based on income/substitution effects during economicdevelopment and growth. However, in some countries these changes occurred against thebackground of a prolonged and deep recession. One explanation may, therefore, be that womenbenefitted disproportionately to men from the expansion of the public sector. As a result,women as a group have improved their status in the labor market. However, if the public sectorexplanation is relevant, then the efficiency and distributional effects from the increase in femaleparticipatiorn in the region may not have been beneficial -- from an economist's point of view -- for two reasons. First, in general terms the public sector pursues a variety of objectives(political, national, social) and in a way that is not necessarily guided by economic ("price")consideratizDns. Of course, a country's prosperity does not depend only on economic efficiencybut, in the absence of detailed information about country objectives other than economic ones,this is a reservation that need be mentioned. Second, given that workers (and, especially, femaleworkers) in the public sector are more likely to be those with more education, the distributionaleffects of the higher participation of women may also be suspect: urban "middle-class and upper-class" women are more likely to end up consuming most of the public subsidy to education whilefemale absolute and relative-to-male pay is higher in the public sector than in the private sector.This issue requires more statistics than those we detailed had at our disposal.
Our suspicion about the link between publicly (no-fee) provided education and eventualemployment in the public sector does not, however, mitigate the validity of the systematicrelationship that we were able to identify between, on the one hand, education and, on the otherhand, women's employment and pay. The participation functions show that, after controllingfor other factors, the probability of participation is greater the higher a woman's educationalqualification is. Similarly, women's earnings increase as formally acquired education increases.Although the issue of occupational choice has not been explicitly addressed in our study, theeffect of education upon a woman's propensity to work and her level of pay is sufficientlyclearcut to guide public policy -- provided that one avoids the (suspected) distortions mentioned
22
in the previous paragraph with respect to employment and pay practices in the public sector.In particular, creating opportunities for female education and employment when suchopportunities are absent due to some sort of market failure (of which discrimination is just onereason) will enhance efficiency and alleviate poverty.45 When women stay longer in theeducation system their natural (maximum) fertility rate is reduced.46 In addition, women areexposed to influences which typically alter their preferences away from the traditional large-family norms toward fewer children.47 Apart from an effect via lower fertility, educationincreases women's propensity to work because the opportunity cost of staying at home (foregoneincome) also increases. 48 Women's greater attachment to the labor market can subsequentlyincrease their actual labor market experience, augment family income (in a conventional familycontext) and reduce the incidence of poverty among prospective female-headed households.49
The increase in female human capital also assures a more effective use of half of the country'spotential work force and induces men to work in a more competitive environment. Finallyeducation enhances family production broadly defined.50
Female earnings also increase with schooling and, in many cases, faster than maleearnings: on average an additional year of schooling increases female earnings by 13.1 percentin our sample compared to an increase of 11.3 for men (Appendix Table A3, columns 4 and 5).Thus, the distributional effects of more/better female education are warranted and desirable froma social cost-benefit point of view; the same marginal investment (one additional year ofeducation) yields higher returns for women than men. Is a policy of expanding female educationdesirable given that the average length of schooling among female workers is already higher thanthat of men (Appendix Table A3, columns 1 and 2)? The answer is affirmative because whatis relevant is not the educational composition of the female labor force but that of the femalepopulation as a whole. The case even of the most economically advanced countries in oursample is telling indeed. In Venezuela, working women have, on average, 7.9 years ofschooling while non-working women have only 5.5 years of schooling -- far behind the average
45Blau, Behrman and Wolfe (1988), Psacharopoulos and Tzannatos (1989).
'It has been shown that there is a strong negative effect between female education and family sizethrough a price substitution effect as well as birth control knowledge and contraceptive efficiency (Heerand Turner, 1965; Westoff, 1967; Harman, 1969; Da Vanzo, 1971; De Tray, 1972, 1973; Cochrane,1979; Kelly et. al., 1980; Da Silva, 1982; Mueller, 1984).
47Easterlin (1969); Tzannatos and Symons (1989).
9Khandker (1987, 1988); Psacharopoulos and Tzannatos (1990).
49Schultz (1969b).
-'Children's well-being and educational attainment has been found to be highly correlated to mother'seducation. Educated women are in a better position to prepare meals in a more hygienic way and canlook after ill members of tlhe household better (Chiswick, 1974; Leibowitz, 1974; Haveman and Wolfe,1984; Michael, 1984).

23
attainment of men (7.0 years). In Argentina, working women have 9.4 years of schoolingcompared to 8.8 years for men and only 7.8 years for non-working women. The disparitybetween female and male length of schooling is even greater in the less advanced countries ofthe region and between urban and rural areas."
Providing more education to women appears to be a promising direction social policy canmove in. In terms of simple arithmetic, average female education will increase more, and ina more cost-effective way, if many illiterate women attend primary school than if a fewsecondary school graduates attend a 4-year university course. In this respect, the high rates ofreturn to female university education when education entered the earnings fur.ctions as a splinevariable rather than in a continuous variable representing years of schooling, need be qualifiedaccordingly.52 First, the most qualified workers, especially females, find employment in thepublic sector, and our estimates may simply reflect this. Second, and more importantly, theearnings functions that are estimated in the conventional econometric form are based on theexplicit assumption that the only cost of education is foregone earnings during the period ofstudies, which amounts to saying that education is a free good in terms of other costs. This isclearly unrealistic and the difference between the returns to primary and university education isnot necessarily so great as to justify the public provision of more tertiary education at theexpense of lower levels of education.53 Third, and finally, the pro-rich distributional effectsof the emphasis on tertiary education, rather than basic education, in developing countries havebeen widely documented.4
With respect to other determinants of female participation, the econometric resultsshowed that family characteristics are important determinants for a woman to participate or notto participate in the labor force. Single women are more likely to participate than marriedwomen. Among the married, tulose with many and young children are less likely to participatethan those with fewer or older children. Though some of these "characteristics" are endogenous(for example, women decide about whether to work and whether to have a family and children),policies which affect family size can be beneficial. One such measure is improving women'sunderstanding, especially in rural or relatively poor areas, of how to avoid unwanted pregnancies
"See individual country studies in Psacharopoulos and Tzannatos (1991).
n2This finding is quite common in developing countries (Haque, 1984; Khan and Irfan, 1985).
"3For estimates of the cost-efficiency of investment on different levels and types of education seeAdelman (1975); Colclough (1982); Mingat and Tan (1988); Psacharopoulos (1977, 1985); Lockheed(1988).
'The unintentional distributional effects of public expenditure on education have been shown byamong others Ribich (1968); Selowsky (1979); Stromquist (1986); Tzannatos (1991).

24
and have access to contraceptives.55
An additional increase in women's work effort can come through the encouragement ofwomen's re-entry into the labor market after an interruption in employment. This can beachieved by the provision of effective and cost-efficient pre-school and child-care facilities.Recall that the typical pattern is for women in the region to withdraw from the labor marketupon child-bearing with little tendency to re-enter the labor market at a later stage in their lives.The usual approach has been for governments either to provide such child-care facilities free/heavily subsidized or not to provide them at all. Where free child-care facilities are offered,these have been largely urban-based with a relatively limited number of places. As aconsequence, the most needy groups have seldom been the beneficiaries of the subsidies.Offering pre-school care with selective cost recovery measures along social cost-benefit lineswould enable more women to enter employment and, subsequently, to improve their incomepotential. It would also assist childeien from disadvantaged background by exposing them toorganized pre-school education and by improving their socialization."6 In addition, daycare canprovide a medium through which children can be reached with targeted immunization, nutritionand other programs.
The family structure observed in industrialized countries is not that typical in the LatinAmerican region. Internal and overseas migration ("women as urban domestic servants and menas industrial workers abroad") is quite significant while in some areas, especially in theCaribbean, visiting partnerships are a common form of arrangement." Given the longer lifeexpectancy of women and the fact that in most marriages women are younger than theirhusbands, widowhood even during prime age is not uncommon.58 In addition, societal normsmay not encourage re-marriage.59 These complex socio-demographic effects throw women intoa vicious cycle of inability to work and poverty. In our samples female-headed householdsaccounted for between 10-15 percent of all households in Argentina and Venezuela, and for asmuch as one-third in Jamaica (and around 50 percent in the Kingston area alone). Consequently,policies which directly (via the elimination of provisions in family law and taxation regulationswhich induce asymmetry in the treatment of women with respect to family/employment
55Education increase3 the level of contraceptive efficiency and lowers the expenditure oncontraceptives necessary to reduce the risk of pregnancy at a given level (Michael, 1973; Rosenweig andWolpin, 1982).
5"New research indicates that our fears about average day-care programs are baseless: it shows thattypical, not just ideal, daycare seems to have no ill effects..." (Nakamura, Nakamura and Cullen, 1979a,p. 135).
'It is commonly thought that the primary reason for the continuing increase in one-parent familiesis the growth in the number of divorced and separated mothers (Ermisch and Wright, 1990).
"8Mohan (1986).
5'Rosenhouse (1988).

25
decisions) or indirectly (via reducing the burden of child-care) improve women's employmentopportunities during the critical period of family formation are bound to have beneficialdistributional effects.' Whether such policies should be adopted does of course depend oncosts. This is an area of research with potertially significant returns.
The final issue we tackled in this pape. was that of the sex-wage gap. We found thatditrerences in endowments explain little of the gross pay differential and rewards to femaleendowments are in most cases higher than the rewards to male endowments. With respect toeducation, women workers have typically more schooling than men and the economic returnsto female schooling are in general greater than the returns to male schooling. One may note thatthere was no information in our data sets about the type of human capital held by women andmen. The data on education (in effect, schooling) are reported simply in years (or highest gradecompleted) with no reference to the type of education which the individual has acquired. Thislack of information necessitates the adoption of the uncomfortable assumption that there are nodifferences in the type of education acquired by women and men. However, we hasten to addthat this may not be as a serious problem in Latin America as in the case of industrializedcountries. The reason is that relatively few women in the region have attended school beyondthe second education level. Many of women workers have not even completed lower secondaryeducation and it is at the end of lower secondary education that studies become specialized. Infact, even as late as in 1980, about 11 percent of all females in the region aged 15 to 24 wereilliterate, 17 percent in the 25-34 age group and as many as 26 percent in the 35-44 agegroup.6" In conclusion, a relatively small number of observations in our samples is affectedby the failure to standardize for the type of education women and men acquire. We believe,therefore, that our results might have not been significantly different, had we accounted for thedifference in the type of education acquired by women and men.
Differences in endowments with respect to experience did not really exist in the data setsgiven the fact that we used potential, rather actual, experience. This statistical defect does notusually present problems in the case of men. Men are typically found in the labor force duringmost part of their lives. Henc_, potential experience (that is, the difference between, on the onehand, age and, on the other hand, years of schooling and minimum school entry age) shouldbe a fair approximation of men's actual experience. However, many women have interruptedwork careers. Hence, potential experience usually overestimates the actual labor marketexperience of women. The implication of using inappropriately measured experience understatesthe significance of this variable for women's earning power and overstates the extent of
'OEconomic theory predicts (e.g. Becker, Landes and Michael, 1977; Becker, 1981), and empiricalevidence suggests (Goode, 1956, 1962; Bishop, 1980; Kiernan, 1986; Peters, 1986), an inverserelationship betweei, income/class position and marital instability.
61UNESCO, 1990.

26
discrimination. There is no way out of this difficulty until more detailed data becomeavailable.62 In the meantime, it can be noted that studies that had access to more complete datasets than we did have shown that a substantial part of the pay gap between women and menremains unexplained, even if data on actual experience for women are used.63 This conclusionstill holds when "imputed" (that is, estimated from family characteristics) experience is used inan attempt to decrease the bias arising from the use of potential experience in the case ofwomen.64
One can add that, as in the case of failing to control for different types of education heldby women and men, the use of potential experience in earnings functions applied to LatinAmerica countries may not be as damaging as in the case of industrialized countries. The reasonis because the average age of women workers in our samples was typically about 35 years andas low as 31-32 years in Bolivia, Mexico and Peru. Thus the average age of women in theregion is lower than that in industrialized countries and the measurement error between actualand potential experience should be correspondingly lower. In addition, the typical female age-participation profile in the region suggests that women do not usually re-enter the labor marketafter an interruption in employment. As a result, it is possible that many of the working womenin our samples may have been continuously in the labor market since they first started work.This presumption may be valid for another reason. Self-employment and family work are moreprevalent in developing countries than in industrialized ones. These two types of work are morecompatible with work at home than dependent employment and do not necessitate aninterruption of employment when family formation starts. Therefore, a higher percentage ofwomen in the region may have had continuous work experience since they started workingcompared with women in industrialized countries. Finally, one can add that it is possible thateven many women who work in the formal sector may have had continuous work history aswomen are heavily employed in the public sector. These women have access to institutionalizedmaternity provisions which safeguard their return to work, if they wished to do so. Hence, it
620f course, to the extent that women's labor force participation decisions are affected bydiscrimination in the fifst instance, then even the use of actual experience in the earnings functions willproduce biased results.
'Wright and 'rmisch (1991) report that in the case of Britain, the use of actual experience reducesthe unexplained part of the pay difference between women and men by one-third compared to the resultsderived from potential experience. The reduction in the part of the sex wage gap attributed todiscrimination is practically the same when uncorrected and selectivity corrected earnings functions areused.
'Miller (1987); Wright and Ermisch (1991). In fact, the latter study attributes the "success ofimputed experience" to the strong predictive power of childbearing patterns for women's actual workexperience (ibid. p. 519). In the same tune, an earlier study concluded that the use of act jal experienceversus potential experience increases the percentage of the sex pay gap attributed to differences inendowments by only 5 to 10 percentage points (Zabalza and Arrufat, 1985) still leaving a substantial part(up to two-thirds) of the pay gap open to a number of alternative interpretations (Zabalza and Tzannatos,1985, Chapter 1).

27
may be more likely than not that most of the women who were observed as working in oursamples had worked continuously since they first entered the labor market and the bias arisingfrom the inclusion of potential experience in the earnings functions may not be significant in theLatin America region.
8. Concluding Remarks
This paper examined the change in female participation over time, the determinants ofwomen's decision to participate in the labor market in the late 1980s, and the factors explainingthe sex-wage gap in 15 Latin American and Caribbean countries. The results were illuminatingin certain respects but, equally, three issues remained unresolved. First, the fact that femaleparticipation rose during periods of recession is puzzling: this is not what we expected from ourknowledge of the experience of industrialized countries. The relatively low gender differentialin pay (compared with industrialized countries) is also difficult to explain: wage differentialsin advanced countries were reduced only recently and in most cases only after legislation wasenacted. Finally, women appear to be rewarded more than men with respect to thecharacteristics they hold: does this suggest that men are discriminated against? In our opinion,the only common explanation for these three findings is the dominance of a possiblydistortionary public sector. At present this is a mere assertion that requires further research.

28
REFERENCES
Adelman, I. "Development Economics: A Reassessment of Goals." American EconomicReview, Vol. 65 (1975). PP. 302-309.
Becker, G.S., E.M. Landes and R.T. Michael. "An Economic Analysis of Marital Instability."Journal of Political Economy, Vol. 85, no. 6 (1977). pp. 1141-1187.
Becker, G. S. and N. Tomes. "An Equilibrium Theory of the Distribution of Income andIntergenerational Mortality." Journal of Political Economy, Vol. 87, no. 6 (1979). pp.1141-1187.
Behrman, J. R., B.L. Wolfe and D.M. Blau. "Human Capital and Earnings Distribution in aDeveloping Country: The Case of Prerevolutionary Nicaragua. " Economic Developmentand Cultural Change. Vol. 34, no. 1 (1985). pp. 1-29.
Beller, A. H. "Trends in Occupational Segregation by Sex and Race, 1960-1981" in B. F.Reskin (ed.). Sex Segregation in the Workplace: Trends, Explanations, Remedies.Washington DC: National Academy Press, 1984. pp. 11-26.
Birdsall, N. and R. Sabot (eds.). Unfair Advantage:_ Labor Market Discrimination inDeveloping Countries. The World Bank, 1991.
Birdsall, N. and M.L. Fox. "Why Men Earn More than Women?", Economic Development andCultural Change. Vol. 33, no. 3 (April 1985). pp. 533-556.
Bishop, J. "Jobs, Cash Transfers and Marital Instability: A Review and Synthesis of theEvidence." Journal of Human Resources. Vol. 15, no. 2 (1980). pp. 301-334.
Blinder, A. S. Toward an Economic Theory of Income Distribution. Cambridge Mass.: MITPress, 1974.
Blau, D.M., J.R. Behrman and B.L. Wolfe. "Schooling and Earnings Distributions withEndogenous Labour Force Participation, Marital Status and Family Size." EconomicaVol. 55 (1988). pp. 297-316.
Boserup, E. Woman's Role in Economic Development. New York: St. Martin's Press, 1970.
Bowers, J. K. "British Activity Rates: A Survey of Research." Scottish Journal of PoliticalEconomy, Vol. 22, no.1 (1975). pp. 57-90.
Bustillo, I. "Female Educational Attainment in Latin America: A Survey. " Washington DC: TheWorld Bank (PHREE/89/16), 1989.

29
Cain, G. G. Married Women in the Labor Force. Chicago: University of Chicago Press, 1966.
Chiswick, B.R. Income Ingquality: Regional Analyses within a Human Capital Framework. NewYork: Colombia University Press, 1974.
Cochrane, S.H. Fertility and Education: What Do We Really Know? Baltimore: Johns HopkinsUniversity Press, 1979.
Colclough, C. "The Impact of Primary Schooling on Economic Development: A Review of theEvidence." World Development, Vol 10 (1982). pp. 167-185.
Da Silva, L. "Greater Opportunities for Women Related to Population Growth." Working PaperNo. 11, Belo Horizonte, Brazil: Federal University of Minas Gerais, Center forDevelopment and Regional Planning, 1982.
Da Vanzo, J. "Family Formation in Chile." Santa Monica: Rand Corporation, R830 AID, 1971.
De Tray, D.N. "Child Quality and Demand for Children." Journal of Political Economy, Vol.81, no 2 (Part 2) (1973). pp. 70-95.
Dougherty, C.R.S. and E. Jimenez. "The Specification of Earnings Functions: Tests andImplications". Economics of Education Review. Vol. 10, no. 2. (1991) pp. 85-98
Ehrenberg, R. G. and J.L. Schwarz. "Public-Sector Labor Markets" in 0. Ashenfelter and R.Layard (eds.). Handbook of Labor Economics. Amsterdam: North Holland, 1986. pp.1219-1259.
Ermisch, J.F. and R.E. Wright. "Entry to Lone Parenthood: Analysis of Marital Dissolution."Discussion Paper in Economics No. 9/90. University of London: Birkbeck College,1990.
Fallon, P. and D. Verry. The Economics of Labour Markets. Oxford: Philip Alan, 1988.
Greenhalgh, C. "Male-Female Wage Differentials in Great Britain: Is Marriage an EqualOpportunity?" Economic Journal, Vol. 90 (1980). PP. 651-675.
Goode, W.J. "Marital Satisfaction and Instability: A Cross-Cultural Class Analysis of DivorceRates." International Social Sciences Journal, Vol. 14, no. 3 (1962). pp. 507-526.
Gunderson, M. "Male-Female Wage Differentials and Policy Responses." Journal of EconomicLiteratu re, Vol. 27, no. 1 (1989). pp. 46-117.
Haque, N. "Work Status Choice and the Distribution of Family Earnir, gs. " Santa Monica: RandCorporation, 1984.
30
Harman, A. "Interrelationship Between Procreation and Other Family Decision-Making." SantaMonica: Rand Corporation, 1969.
Haveman, R. and B. Wolfe. "Education and Economic Well Being." Journal of HumanResources. Vol. 19 (1984). pp. 377-407.
Heer, D.M. and E. Tumer. "A Real Difference in Latin American Fertility." PopulationStudies, Vol. 18, no. 3 (1965). pp. 279-292.
Jones, P.L. "On Decomposing the Wage Gap: A Critical Comment on Blinder's Method".Journal of Human Resources. Vol. XVIII, no. I (1983). pp. 126-130.
Joshi, H., R. Layard and S. Owen. "Why Are More Women Working in Britain?" JoumrnalofLabor Economics, Special Issue (1985). pp. S147-S176.
Joshi, H. "Secondary Workers in the Employment Cycle: Great Britain, 1961-1974".Economica, Vol. 48 (1981). pp. 29-44.
Kelly, A. and L. Da Silva. "The Choice of Family and the Compatibility of Female WorkforceParticipation in the Low-Income Setting." Review Economigue, Vol. 31, no. 6 (1980).pp. 1081-1104.
Keeley, M. C. Labor Suply and Public Policy: A Critical Review. New York: Academic Press,1981.
Khandker, S.R. "Determinants of Women's Time Allocation in Bangladesh." EconomicDevelopment and Cultural Change, Vol. 37, no. 1 (1988). pp. 111-126.
Kiernan, K. "Teenage Marriage and Marital Dissolution: A Longitudinal Study." Population.Sties, Vol. 40 (1986). pp. 35-54.
Khan, S. and M. Irfan. "Rates of Returns to Education and the Determinants of Earnings inPakistan." Paldstan Development Review, Vol. 24, no. 3/4 (1985). pp. 671-680.
Leibowitz, A. "Home Investment in Children." Joumal of Political Economy, Vol. 82, no. 2(Part 2) (1974). pp. S111-S131.
Lockheed, M.E. and E. Hanushek. "Improving Educational Efficiency in DevelopingCountries." Compare, Vol. 18, no. 1 (1988) pp. 21-38.
Killingsworth, M. R. The Economics of Comparable Work. Kalamazoo Michigan: W.E Upjohn!nstitute for Employment Research, 1990.

31
Knight, J.B. and R. Sabot. "Labor Market Discrin.;nation in Tanzania". IQurnal of DevelopmentStudies. Vol. 19 (October 1982). pp. 67-87.
Miller, P. W. "The Wage Effect of Occupational Segregation of Women in Britain". EconomicJournal. Vol. 97 (December 1987). pp. 885-896.
Mincer, J. "Labor Force Participation of Married Women: A Study of Labor Supply." Aspctsof Labor Economics. National Bureau of Economic Research. Princeton, NJ.: PrincetonUniversity Press, 1962, pp. 63-97.
Mincer, J. Schooling. Experience and Earninys. National Bureau of Economic Research. NewYork: Columbia University Press, 1974.
Mohan, R. Work, Wages and Welfare in a Developing Metropolis. New York: OxfordUniversity Press, 1986.
Mueller, E. "The Allocation of Women's Time and Its Relation to Fertility" in R. Anker, M.Buvinic and N. Youssef (eds.). Women's Roles and Population Trends in the ThirdWorld. London: Croom Helm, L.82. pp. 87-115.
Mingat, A. and J.P. Tan. Analytical Tools for Sector Work in Education. Baltimore: JohnsHopkins University Press, 1985.
Nakamura, A., N. Nakamura and D. Cullen. Employment and Earnings of Married Females.Ottawa: Ministry of Supplies and Services, 1979.
Nakamura, M., A. Nakamura and D. Cullen. "Job Opportunities, the Offered Wage, and theLabor Supply of Married Women." American Economic Review, Vol. 69, no. 5(1979b). pp. 787-805.
Oaxaca, R. "Male-Female Wage Differentials in Urban Labor Markets." International EconomicReview, Vol. 14, no. 1 (1973). pp. 693-709.
Oppenheimer, V. The Female Labor Force in the United States: Demographic and EconomicFactors Governing its Growth and Changing Composition, Berkeley, 1974.
Oswald, A. J. "The Economic Theory of Trade Unions: An Introductory Survey." ScandinavianJournal of Economics, Vol. 87 (1985). pp. 160-193.
Peters, H.E. "Marriage and Divorce: Informational Constraints and Private Contracting."American Economic Review, Vol. 76, no. 3 (1986). pp. 437-454.
Psacharopoulos, G. and R. Layard. "Human Capital and Earnings: British Evidence and aCritique." Review of Economic Studies, Vol. 46 (1979). pp. 485-503.
32
Psacharopoulos, G. "Returns to Education: A Further International Update and Implications."Journal of Human Resources, Vol. 14, no. 4 (1985). pp. 584-604.
Psacharopoulos, G. and Z. Tzannatos. "Female Labor Force Participation: An InternationalPerspective." The World Bank Research Observer, Vol. 4, no. 2 (1989). pp. 187-202.
Psacharopoulos, G. and Z. Tzannatos. "Female Labor Force Participation and Education."Chapter 6 in Essays on Poverty, Equity and Growth, George Psacharopoulos, ed.,Pergamon 1990: 266-290.
Psacharopoulos, G. and Tzannatos, Z., "Women's Employment and Pay in Latin America,"Volumes I and II. The World Bank, Latin America and the Caribbean Region, TechnicalDepartment, Regional Studies Report No. 2., October 1991.
Ribich, T. Education and Poverty. Washington D.C.: Brookings Institute, 1968.
Rosenhouse, S. "Identifying the Poor: Is Headship a Useful Concept?" New York: PopulationCouncil, 1988.
Rosenzweig, M.R. and K.I. Wolpin. "Government Interventions and 1kjusehold Behaviour ina Developing Country." Journal of Development Economics, Vol. 10, no. 2 (1982). pp.209-225.
Rosen, H. S. "On Interindustry Wage and Hours Structure." Journal of Political Economy,Vol. 77 (1969). pp. 249-73.
Sahn, D. and H. Alderman. "The Effects of Human Capital on Wages and the Determinants ofLabor Supply in a Developing Country." Journal of Development Economics, Vol. 28(1988). pp. 157-173.
Schultz, T. P. "Returns to Women's Education." Washington DC: The World Bank(PHRWD/89/001), 1989b.
Schultz, T.P. "Women's Changing Participation in the Labor Force: A World Perspective."Economic Development and Cultural Change, Vol. 38, no. 3 (1990). pp.-857-488.
Selowsky, M. Who Benefits From Government Expenditure: A Case Study of Colombia.Oxford: Oxford University Press, 1979.
Sivard, R. L. Women: A World Survey. Washington DC.: World Priorities, 1985.
Smith, S. P. Equal Pay in the Public Sector: Fact or Fantasy? Princeton NJ: PrincetonUniversity Press, 1977.

33
Standing, G. Labor Force Participation and Development. 1981 (2nd edition). Geneva: ILO.
Stromquist, N.P. "Empowering Women Through Knowledge: Policies and Practices inInternational Cooperation in Basic Education." Stanford University: SIDEC School ofEducation, 1986.
Tilak, J. B. G. The Economics of Inequality in Education. New Delhi: Sage, 1987.
Tokman, V. "Policies for the Heterogenous Informal Sector in Latin America:. WorldDeveloment. Vol. 17, no. 7.
Tzannatos, Z. "Reverse Discrimination in Higher Education: Does It Reduce Inequality and atWhat Cost to the Poor?" International Journal of Educational Development, 1991.
Westoff, C.F. "Fertility Control in the U.S.A." in Proceedings of the World PopulationConference, Vol. II, pp. 245-247. New York: United Nations, 1967.
Wright, R.E. and J.F. Ermisch. "Gender Discrimination in the British Labour Market: AReassessment". Economic Journal. Vol. 101 (May 1991). pp. 508-522.
Zabalza, A. and J.L. Arrufat in A. Zabalza and Z. Tzannatos. Women and Equal Pay: TheEffects of Legislation on Female Employment and Wages in Britain. Cambridge:Cambridge University Press, 1985. pp. 70-94.
Zabalza, A. and Z. Tzannatos. Women and Equal Pay: The Effects of Legislation on FemaleEmp.loyment and Wages in Britain. Cambridge: Cambridge University Press, 1985.
2i.

34
Appendix Table AwlPercentage of Male Pay Advantage Attributed to Differences in Endowments and Rewards
Selectivity Uncorrected Selectivity Corrected'
Evaluated at Evaluated atMale pay Female means Male means Female means Male meansadvantage2
Country Yeai END REW END REW END REW END REW
(1) (2) (3) (4) (5) (6) (7) (8) (9)
Argentina 1985 43.2 22.0 78.0 32.0 68.0 54.0 46.0 87.0 13.Bolivia 1989 47.3 14.9 85.1 24.1 75.9 14.9 85.1 24.1 75.BErazil 1989 35.7 n.a n.a. n.a. n.a. 19.0 81.0 11.0 89.Chile 1987 33.8 n.a n.a. n.a. n.a. -14.9 114.9 -13.7 113.Colombia 1988 16.7 12.3 87.7 22.1 77.9 8.0 92.0 14.8 85.Costa Rica 1989 21.3 -3.6 03.6 -3.2 103.9 5.5 94.5 6.7 93.Ecuador 1987 41.6 26.4 73.6 33.2 66.8 37.8 62.2 57.2 42.Guatemala 1989 26.4 -1.8 101.8 0.4 99.6 n.a. n.a. 65.4 34.Honduras 1989 21.1 -69.2 169.2 -81.9 181.9 -50.6 150.6 -46.5 146.Jamaica 1989 55.1 n.a. n.a. n.a. n.a. -13.7 113.7 -19.1 119.Mexico 1984 15.7 n.a. n.a. n.a. n.a. 28.1 71.9 20.0 80.Panama 1989 22.1 -22.9 122.9 -40.6 140.6 58.1 41.9 11.2 88.Peru 1990 17.7 19.5 80.5 15.1 84.9 19.5 80.5 15.1 84.Uruguay 1989 29.5 24.0 76.0 26.0 74.0 23.0 77.0 23.0 77.Venezuela 1989 25.5 14.0 86.0 5.0 95.0 14.0 86.0 5.0 95.
Average' 30.2 3.2 96.8 2.9 97.1 20.4 79.6 17.4 82.
Notes: 1) Selectivity correction statistically insignificant in Argentina, Bolivia, Costa Rica, Peru and Venezuela.2) Measured in log-percentage points. It refers to hourly pay in Brazil, Ecuador and Peru and weekly/monthly pay in other countries.3) The figures for Brazil refer to married w.tmen working as employees.4) Unweighted average.

35
Appendix Table A-2aAverage Hours per Week and Coefficients on Log (hours) by Sex
Male MaleAverage hours advantage Coefficient on advantage in
Country Year per week in hours Log (hours) coefficients(percent) (percent)
M F (1)/(2) M F (4)/(5)
(1) (2) (3) (4) (5) (6)
Argentina 1985 46.31 37.48 23.6 0.391 0.659 -40.7Bolivia 1989 51.30 44.12 16.3 0.354 0.424 -16.5Colombia 1988 49.90 46.10 8.2 0.426 0.458 -7.0Costa Rica 1989 47.64 40.53 17.5 0.626 0.718 -12.8Guatemala 1989 48.12 42.27 13.8 0.344 0.475 -27.6Honduras 1989 45.73 43.75 4.5 0.301 0.438 -31.3Panama 1989 42.76 40.14 6.5 0.660 0.600 10.0Uruguay 1989 48.44 37.31 29.8 0.587 0.685 -14.3Venezuela 1989 43.71 38.48 13.6 0.541 0.554 -2.3
Average 47.10 4'.13 14.9 0.470 0.557 -15.8
Appendix Table A-2bContribution of Differences in Hours to the Male Pay Advantage
Evaluated at Total 96 of maleFemale means Male means effect pay
of hours advantageColuntry Year Effect due to Effect due to upon explained
differences in differences in the pay gap by(7) + (8) or differences
Endow. Coeff Endow. Coeff (9)+(10)) in hours
(7) (8) (9) (10) (11) (12)
Argentina 1985 0.083 -0.971 0.139 -1.028 -0.888 -205.8Bolivia 1989 0.053 -0.265 0.064 -0.276 -0.212 -44.8Colombia 1988 0.034 -0.123 0.036 -0.12S -0.089 -53.2Costa Rica 1989 0.101 -0.341 0.116 -0.355 -0.239 -112.2Guatemala 1989 0.045 -0.490 0.062 -0.507 -0.446 -169.2Honduras 1999 0.013 -0.518 0.019 -0.524 -0.504 -239.3Panama 1989 0.042 0.222 0.038 0.225 0.263 119.3Uruguay 1989 0.153 -0.355 0.179 -0.380 -0.201 -68.4Venezuela 1989 0.069 -0.047 0.071 -0.049 0.021 8.4
Average 0.066 -0.321 0.080 -0.335 -0.255 -85.0% of pay gap explained 23.4 -114.2 28.6 -119.4 -90.8

36
Appendix Table A-3aAverage Yem of Schooling and Estimated Coefficients on Schooling by Sex
Average years Male Coefficient on MaleCountry Year of schooling advantage in schooling advantage in
schooling (x 100) coefficients(percent_ (Percent)
M F (1)/(2) M F (4)/(5)
(1) (2) (3) (4) (5) (6)
Argentina 1985 8.80 9.41 -6.5 9.1 10.7 .15.0Bolivia 1989 9.50 8.97 5.9 7.1 6.3 12.7Brazil 1980 4.86 6.96 -30.2 14.7 15.6 -5.8Colombia 1988 7.60 8.70 -12.6 12.0 11.2 7.1Costa Rica 1989 6.66 8.47 -21.4 10.1 13.1 -22.9Ecuador 1987 9.70 9.05 7.2 9.7 9.0 7.8C-uatemala 1989 3.90 4.72 -17.4 14.3 16.4 -12.8Honduras l989 4.89 6.29 -22.3 15.4 17.8 -13.5Jamaica 1989 7.37 7.84 -6.0 12.3 21.5 -42.8Mtxico 1984 6.26 7.56 -17.2 13.2 14.7 -10.2Panama 1989 9.21 10.45 -11.9 9.7 11.9 -18.5Peru 1986 8.21 9.01 -8.9 11.5 12.4 -7.3Uruguay 1989 8.34 9.06 -7.9 9.9 11.1 -10.8Venezuela 1989 6.93 8.52 -10.7 9.1 11.1 -18.0
Average 7.30 8.22 -12.0 11.3 13.1 -10.7
Appendix Table A-3bCont.ibution of Differences in Schooling to the Male Pay Advantage
Evaluated atFemale means Male means
Total % of male payCountry Year Effect due. to Effect due to effect of advantage
differences in differences in schooling explained(7) +(8) or by differences
Endow. Coeff Endow. Coeff. (9)+(10) in schooling
(7) (8) (9) (10) (11) (12)
Argentina 1985 -0.141 -0.065 -0.151 -0.056 -0.206 -47.7Bolivis 1989 0.076 0.033 0.072 0.038 0.109 23.2Brazil 1980 -0.044 -0.328 -0.063 -0.309 -0.371 -130.2Colombia 1988 0.061 -0.123 0.070 -0.132 -0.062 -37.4Costa Rica 1989 -0.200 -0.237 -0.254 -0.183 -0.437 -204.7Ecuador 1987 0.068 0.058 0.063 0.063 0.126 30.4Guatemala 1989 -0.080 -0.134 -0.099 -0.117 -0.216 -82.1Hondums 1989 -0.117 -0.249 -0.151 -0.216 -0.367 -173.9Jamaica 1989 -0.678 -0.101 -0.721 -0.058 -C.779 -141.5Mexico 1984 -0.094 -0.191 -0.113 -0.172 -0.285 -181.5Panuam 1989 -0.203 -0.148 -0.230 -0.120 -0.350 -158.6Peru 1986 -0.074 -0.099 -0.081 -0.092 -0.173 -95.2Uruguay 1989 -0.100 -0.080 -0.109 -0.071 -0.180 -61.1Venezuela 1989 -0.139 -0.176 -0.170 -0.145 -0.315 -123.7
Average -0.111 -0.123 -0.129 -0.105 -0.234 -92.3% of pay gap explained -40.4 -44.7 -47.0 -38.1 -85.1

37
Appendix Table A4aAVerage Years of Potential Experience and Coefficients on Potential Experience by Sex
Average yearS Male Coefficient on MaleCountry Year of potential advantage in experience advantage in
exPeCrence (percent) (X 100) (OerCent
M F (1)/(2) M F (4)/(S)
(1) (2) (3) (4) (5) (6)
Argentina 1985 24.19 21.30 13.6 4.9 3.8 28.Bolivia 1989 18.44 20.49 -10.0 5.0 2.8 78.Brazil 1980 26.31 21.01 25.2 4.2 3.9 7.Colombia 1979 7.04 5.56 26.7 2.5 2.2 13.Costa Rica 1989 22.45 19.10 17.5 3.5 3.1 12.Ecuador 1987 23.60 22.80 3.5 3.1 1.4 121.Guatemala 1989 24.90 22.16 12.4 4.5 4.1 9.Honduras 1989 23.81 21.33 11.6 5.2 5.0 4.Jamaica 1989 21.35 22.64 -5.7 7.7 8.2 -6.Mexico 1984 20.76 16.91 22.8 8.6 6.6 30.Panama 1989 20.36 18.36 10.9 7.9 10.3 -23.Peru 1986 19.22 15.86 21.2 5.5 7.6 -27.UrugUay 1989 24.47 22.48 8.9 5.8 4.2 38.Venezuela 1989 23.05 19.55 17.9 3.5 2.8 25.
AVerage 21.4 19.3 12.6 5.1 4.7 22.
Appendix Table A-4bContribution of Differences in Potential Experience to the Male Pay Advantage
Evaluated atFemale mean Male eans
Total % of male payCountry Year Effect due to Effect due to effect of advantag
differences in differences in experience explaine(7)+(8) or by differen
Endow. Coeff Endow. Coeff. (9)+(10) in exper-n
(7) (8) (9) (10) (11) (12)Argentina 1985 0.266 0.110 0.234 0.142 0.376 87.1Bolivia 1989 0.406 -0.057 0.451 -0.103 0.348 73.7Brazil 1980 0.079 0.207 0.063 0.223 0.286 100.2Colombia 1979 0.021 0.033 0.017 0.037 0.054 19.0Costa Rica 1989 0.090 0.104 0.076 0.117 0.194 90.7Ecuador 1987 0.401 0.011 0.388 0.025 0.412 99.2Guatemala 1989 0.100 0.112 0.089 0.123 0.212 80.4Honduras 1989 0.048 0.124 0.043 0.129 0.172 81.4Jamaica 1989 -0.107 -0.106 -0.113 -0.099 -0.213 -38.6Mexico 1984 0.415 0.254 0.338 0.331 0.669 426.3Panama 1989 -0.489 0.206 .0.441 0.158 -0.283 -128.0Peru 1986 -0.404 0.255 -0.333 0.185 -0.148 -81.4Uruguay 1989 0.392 0.084 0.36U 0.115 0.475 161.3VeneZUela 1989 0.161 0.098 0.137 0.123 0.259 101.8
Aveage 0.099 0.102 0.093 0.108 0.201 76.69 of pay gap explained 32.6 33.9 30.9 35.5 66.4

38
Appendix Table A-5Contribution of differences in the constant terms to the male pay advantage
% of male payMale pay Constant term Difference in advantage
Country Year advantage Male Female constant terms explained(2)-(3) (4)/(l)
(1) (2) (3) (4) (5)
Argentina 1985 0.43 8.34 7.07 1.27 294.1Bolivia 1989 0.47 1.58 1.35 0.23 48.7Brazil 1980 0.29 2.40 1.75 0.65 227.9Colombia 1988 0.17 5.66 5.66 0.00 0.0Costa Rica 1989 0.21 4.53 3.69 0.84 393.6Ecuador 1987 0.42 3.58 3.48 0.10 24.0Guatemala 1989 0.26 2.01 0.97 1.04 394.7Honduras 1989 0.21 1.25 0.33 0.92 436.5Jamaica 1989 0.55 1.61 -0.44 2.05 372.3Mexico 1984 0.16 6.66 6.58 0.08 51.0Panama 1989 0.22 0.72 0.48 0.24 108.7Peru 1990 0.18 2.10 1.78 0.32 180.5Uruguay 1989 0.29 1.1i 0.42 0.69 234.3Venezuela 1989 0.25 3.92 3.52 0.40 157.1
Average 0.30 3.52 2.62 0.63 208.8
Appendix Table A-6The value and significance of the Lambda sample selection variable
in the earnings h;nctions
Country Year Coefficient Value t
Argentina 1985 -0.08 1.7Bolivia 1989 0.07 1.2Brazil 1980 -0.30 6.5Chile 1987 -0.82 9.9Colombia 1979 -0.09 1.3Costa Rica 1989 -0.05 1.1Ecuador 1987 0.03 0.5Guatemala 1989 -0.29 7.5Honduras 1989 -0.59 11.3Jamaica 1989 -0.39 4.3Mexico 1984 -1.45 6.7Panama 1989 -0.39 12.3Peru 1990 -0.05 1.0Uruguay 1989 0.06 2.0Venezuela 1989 -0.14 1.6
Notes: See notes to Appendix Table Al.

Policy Researclh Working Paper Series
ContactTitle Author Date for paper
WPS 842 Capital Flows to South Asia and Ishrat Husain January 1992 S. King-WatsonASEAN Countries: Trends, Kwang W. Jun 31047Determinants, and Policy Implications
WPS843 How Financial Markets Affect Long- Ejaz Ghani January 1992 A. NokhostinRun Growth: A Cross-Country Study 34150
WPS844 Heterogeneity, Distribution, and Ravi Kanbur January 1992 WDR OfficeCooperation in Common Property 31393Resource Management
WPS845 Inflation Stabilization in Turkey: Luc Everaert January 1992 B. MondestinAn Application of the RMSM-X Model 36071
WPS846 Incorporating Cost and Cost- Larry Forgy January 1992 0. NadoraEffectiveness Analysis into the Diana M. Measham 31091Development of Safe Motherhood Anne G. TinkerPrograms
WPS847 Coping with the Legacies of Silvia B. Sagari January 1992 M. GuirboSubsidized Mortgage Credit in Loic Chiquier 35015Hungary
WPS848 How EC 1992 and Reforms of the Merlinda D. lngco February 1992 P. KokilaCommon Agricultural Policy Would Donald 0. Mitchell 33716Affect Developing Countries' Grain Trade
WPS849 Financial Structures and Economic Ross Levine February 1992 W. PitayatonakarnDevelopment 37666
WPS850 Fiscal Adjustment and the Real Kazi M. Matin February 1992 D. BallantyneExchange Rate: The Case of Bangladesh 38004
WPS851 Sources of World Bank Estimates Eduard Bos February 1992 0. Nadoraof Current Mortality Rates My T. Vu 31091
Patience W. Stephens
WPS852 How Health Insurance Affects the Joseph Kutzin February 1992 0. NadoraDelivery of Health Care in Developing Howard BPrnum 31091Countries
WPS853 Policy Uncertainty, Information Gerard Caprio February 1992 W. PitayatonakarnAsymmetries, and Financial 37664Intermediation
WPS854 Is There a Case for an Optimal Export Takamasa Akiyama February 1992 G. llogonTax on Perennial Crops? 33732
WPS855 Sovereign Debt: A Primer Jonathan Eaton February 1992 S. King-Watson31047

Policy Research Working Paper Series
ContactTitle Author Date for paper
WPS856 Latin American Women's Earnings George Psacharopoulos February 1992 L. Longoand Participation in the Labor Force Zafiris Tzannatos 39244
WPS857 The Life Insurance Industry in the Kenneth M. Wright February 1992 W. PitayatonakarnUnited States: An Analysis of Economic 37664and Regulatory Issues