Embed Size (px)
Citation preview


1-4 April 2014, Arena and Convention Centre Liverpool
THIRD JOINT CONFERENCE
OF BHIVA AND BASHH 2014
Ms Sarah CollinsPublic Health England

Trends in HIV testing outside of
traditional services
Sarah Collins 3rd April 2014
Immunisation, Hepatitis, & Blood Safety Department, Public Health England
On behalf of the sentinel surveillances of blood borne virus testing

Background• BHIVA and BASHH guidelines1 highlight the importance of increasing HIV
testing in non-traditional services (NTS) to increase early diagnosis.
• In areas of high HIV prevalence (>2 per 1,000 population) the offer of a HIV
test should be made to
new registrants in general practice (GP)
all general medical admissions
• Although HIV testing in GUM clinics and antenatal screening programmes is
well described less is known about HIV testing in NTS.
• The Sentinel Surveillance of Blood-Borne Virus testing collects
laboratory data irrespective of test result; providing information on the
population undergoing HIV testing.
1 British HIV Association, British Association for Sexual Health and HIV, British Infection Society. UK National Guidelines
for HIV Testing. 2008.
4 Trends in HIV testing outside of traditional services

Method• Data extracted from sentinel laboratories were transformed into a unified format
and load into the ‘Denom’ database
• Demographic and testing data from 15 laboratories for people tested for HIV
between 2008 and 2012 were extracted in yearly cohorts
• Duplicate records, reference testing, under 16’s, and people tested via unknown
locations were excluded
• HIV positive individuals were excluded from analysis in subsequent years
• The service requesting the test was identified and mapped to the Local Authority
Using data from SOPHID2 HIV prevalence was classified as high (HP) if >2/1,000 and
low (LP) when ≤2/1,000
• Ethnicity was assigned using self-reported ethnicity or name analysis software
2 Data from the Survey of Prevalent HIV Infections Diagnosed (SOPHID), Public Health England, 2012.
5 Trends in HIV testing outside of traditional services
Asian or Asian British (AAB)
other or mixed ethnicity (O/M)
black or black British (BBB)
white or white British (WWB)

Trends in HIV testing
6 Trends in HIV testing outside of traditional services
GUM (n=724,525) testing was stable
Overall positivity 1.2%
Antenatal screening (n=294,149)
due to changes in commissioning
Overall positivity 0.2%
NTS (n=462,208) testing 160%
from 69,940 in 2008 to 112,033 in
2012
• LP: testing 141%
positivity from 0.9% to 0.7%
• HP: testing 178%
positivity from 1.0% to 0.6%
0
20,000
40,000
60,000
80,000
100,000
120,000
140,000
160,000
Nu
mb
er
of
ind
ivid
ua
ls t
es
ted
Year
GUM - HP Antenatal - HP NTS - HP
GUM - LP Antenatal - LP NTS - LP
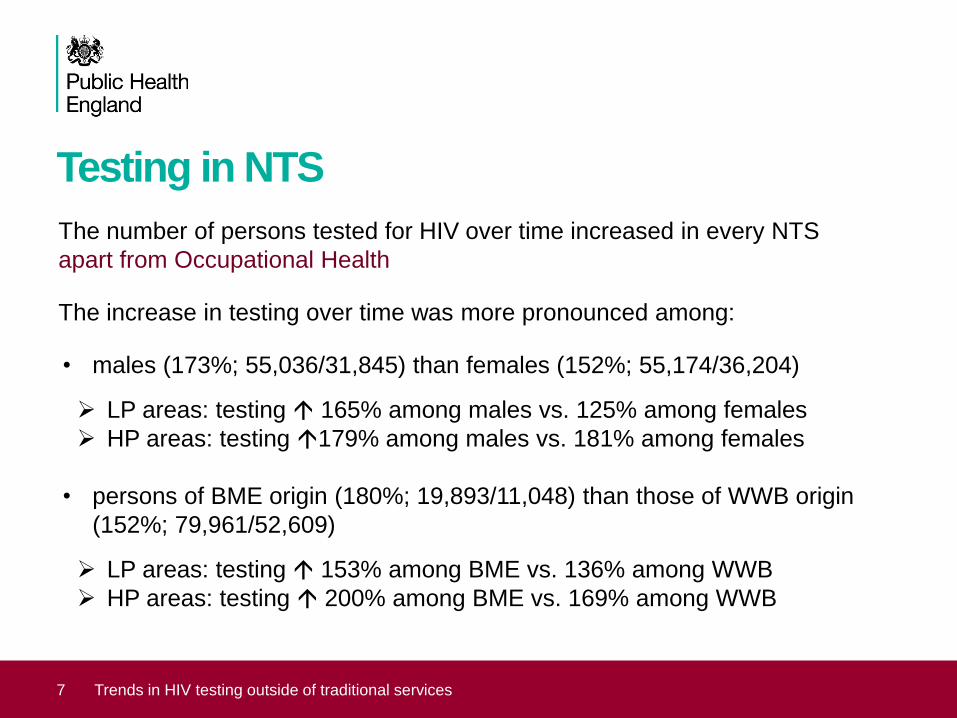
Testing in NTS
The number of persons tested for HIV over time increased in every NTS
apart from Occupational Health
The increase in testing over time was more pronounced among:
• males (173%; 55,036/31,845) than females (152%; 55,174/36,204)
LP areas: testing 165% among males vs. 125% among females
HP areas: testing 179% among males vs. 181% among females
• persons of BME origin (180%; 19,893/11,048) than those of WWB origin
(152%; 79,961/52,609)
LP areas: testing 153% among BME vs. 136% among WWB
HP areas: testing 200% among BME vs. 169% among WWB
7 Trends in HIV testing outside of traditional services

Testing in GP
8 Trends in HIV testing outside of traditional services
170,304 persons tested
161% from 25,731 in 2008 to
41,310 in 2012
HP: testing 207%
positivity varied from 0.5% to 0.7%
LP: testing 120%
positivity varied from 0.5% to 0.6%
0
2,000
4,000
6,000
8,000
10,000
12,000
14,000
16,000
18,000
20,000
22,000
24,000
26,000
0.0
0.1
0.2
0.3
0.4
0.5
0.6
0.7
0.8
0.9
1.0
2008 2009 2010 2011 2012
Nu
mb
er
of
ind
ivid
ua
ls t
es
ted
Pro
po
rtio
n H
IV p
os
itiv
e
Year
HP % positive LP % positiveHP tested LP tested

Comparison with HCV – testing in GP
9 Trends in HIV testing outside of traditional services
0
2,000
4,000
6,000
8,000
10,000
12,000
14,000
16,000
18,000
20,000
22,000
24,000
26,000
0.0
0.1
0.2
0.3
0.4
0.5
0.6
0.7
0.8
0.9
1.0
2008 2009 2010 2011 2012
Nu
mb
er
of
ind
ivid
ua
ls t
es
ted
Pro
po
rtio
n H
IV p
osit
ive
Year
HP % positive
LP % positive
HP tested
LP tested
0
2,000
4,000
6,000
8,000
10,000
12,000
14,000
16,000
18,000
20,000
22,000
24,000
26,000
0.0
1.0
2.0
3.0
4.0
5.0
6.0
7.0
2008 2009 2010 2011 2012
Nu
mb
er
of
ind
ivid
ua
ls t
es
ted
fo
r a
nti
-HC
V
Pro
po
rtio
n H
CV
po
sit
ive
Year
HP % positive
LP % positive
HP tested
LP tested

Testing in general medical surgical
10 Trends in HIV testing outside of traditional services
0
500
1,000
1,500
2,000
2,500
3,000
3,500
4,000
4,500
5,000
0.0
0.5
1.0
1.5
2.0
2.5
3.0
3.5
2008 2009 2010 2011 2012
Nu
mb
er
of
ind
ivid
ua
ls t
es
ted
Pro
po
rtio
n H
IV p
os
itiv
e
Year
HP % positive LP % positiveHP tested LP tested
26,566 persons tested
244% from 2,939 in 2008 to
7,176 in 2012
HP: testing 275%
positivity from 2.8% to 1.4%
LP: testing 206%
positivity from 3.2% to 1.2%

HIV positivity in NTSThe odds of testing HIV positive were
significantly higher among
• males (aOR=1.76; 95% CI=1.63-1.90)
• those of black ethnic origin (aOR=5.40;
95% CI=4.85-6.02)
• those attending A&E services (aOR=4.28;
95% CI=3.60-5.08)
• those attending specialist liver services
(aOR=5.21; 95% CI=4.65-5.83)
Positivity decreased over time (aOR=0.84;
95% CI=0.82-0.87)
LP/HP was not significant p=0.14
11 Trends in HIV testing outside of traditional services
0.0
0.5
1.0
1.5
2.0
2.5
3.0
3.5
4.0
4.5
Male / LP Male /HP
Female /LP
Female /HP
Pro
po
rtio
n p
os
itiv
e
Gender / prevalence
AAB BBB O/M WWB

Conclusions
During 2008-12, 50% of persons were tested for HIV by GUM clinics, 20% by
antenatal screening services, and 30% by NTS
BUT the greatest increase in testing during this period was in NTS
• 141% in LP areas
• 178% in HP areas
In GP increased testing has not resulted in proportional reduction in positivity
the pool of persons with undiagnosed HIV infections who engage with GP
has not been exhausted
12 Trends in HIV testing outside of traditional services

AcknowledgementsImmunisation, Hepatitis, and Blood Safety department PHEDr Sam Lattimore Dr Sema Mandal Dr Mary Ramsay
Celia Penman Tracey Leach
Participating Sentinel Laboratories: HIV trend dataAshford Hamid Jalal, Melanie Matthews, Rachael Smith. Addenbrookes Hospital, Cambridge
John Croall. Chester Microbiology Laboratory, Countess of Chester Hospital, Chester
Tony Vicca. Diana Princess of Wales Hospital, Grimsby
Valerie Delpech, Jennifer Tosswill Public Health England, London
Janet Mowbray, Erasmus Smit. West Midlands laboratory, Birmingham
David Lewis, Antony Hale. Leeds Teaching Hospitals NHS Trust, Leeds
David Johnson, Mark Zuckerman. Kings College Hospital, London
Alan Blackley, Paul Klapper, Ken Mutton. Manchester Royal Infirmary, Manchester
Matthew Longbone, Mohammed Osman Hassan Ibrahim, Royal Sussex County Hospital, Brighton
Will Irving, Lisa Prichett, Yursi Taha. Queens Medical Centre, Nottingham
Josephine Silles. Middlesex University Hospital, London
Louise Hesketh. Royal Preston Hospital, Preston
Lynne Ashton, Ian Hart. Royal Liverpool Hospital, Liverpool
Mike Kidd, Peter Luton. University College Hospital, London
Mark Baker, James Nash. William Harvey Hospital, Ashford, Kent
13 Trends in HIV testing outside of traditional services