Embed Size (px)
Citation preview
On the following pages:
Missouri and CountiesG‐001. Missouri G‐002. Adair County G‐003. Andrew County G‐004. Atchison County
G‐005. Audrain County G‐006. Barry County G‐007. Barton County G‐008. Bates County
G‐009. Benton County G‐010. Bollinger County G‐011. Boone County G‐012. Buchanan County
G‐013. Butler County G‐014. Caldwell County G‐015. Callaway County G‐016. Camden County
G‐017. Cape Girardeau County G‐018. Carroll County G‐019. Carter County G‐020. Cass County
G‐021. Cedar County G‐022. Chariton County G‐023. Christian County G‐024. Clark County
G‐025. Clay County G‐026. Clinton County G‐027. Cole County G‐028. Cooper County
G‐029. Crawford County G‐030. Dade County G‐031. Dallas County G‐032. Daviess County
G‐033. DeKalb County G‐034. Dent County G‐035. Douglas County G‐036. Dunklin County
G‐037. Franklin County G‐038. Gasconade County G‐039. Gentry County G‐040. Greene County
G‐041. Grundy County G‐042. Harrison County G‐043. Henry County G‐044. Hickory County
G‐045. Holt County G‐046. Howard County G‐047. Howell County G‐048. Iron County
G‐049. Jackson County G‐050. Jasper County G‐051. Jefferson County G‐052. Johnson County
G‐053. Knox County G‐054. Laclede County G‐055. Lafayette County G‐056. Lawrence County
G‐057. Lewis County G‐058. Lincoln County G‐059. Linn County G‐060. Livingston County
G‐061. McDonald County G‐062. Macon County G‐063. Madison County G‐064. Maries County
G‐065. Marion County G‐066. Mercer County G‐067. Miller County G‐068. Mississippi County
G‐069. Moniteau County G‐070. Monroe County G‐071. Montgomery County G‐072. Morgan County
G‐073. New Madrid County G‐074. Newton County G‐075. Nodaway County G‐076. Oregon County
G‐077. Osage County G‐078. Ozark County G‐079. Pemiscot County G‐080. Perry County
G‐081. Pettis County G‐082. Phelps County G‐083. Pike County G‐084. Platte County
G‐085. Polk County G‐086. Pulaski County G‐087. Putnam County G‐088. Ralls County
G‐089. Randolph County G‐090. Ray County G‐091. Reynolds County G‐092. Ripley County
G‐093. Saint Charles County G‐094. Saint Clair County G‐095. Saint Genevieve County G‐096. Saint Francois County
G‐097. Saint Louis County G‐098. Saline County G‐099. Schuyler County G‐100. Scotland County
G‐101. Scott County G‐102. Shannon County G‐103. Shelby County G‐104. Stoddard County
G‐105. Stone County G‐106. Sullivan County G‐107. Taney County G‐108. Texas County
G‐109. Vernon County G‐110. Warren County G‐111. Washington County G‐112. Wayne County
G‐113. Webster County G‐114. Worth County G‐115, Wright County G‐116. Saint Louis City
Planning and Data Analysis RegionsG‐117. Northwest Region G‐118. Central Region G‐119. Eastern Region G‐120. Southwest Region
G‐121. Southeast Region
Service Areas for Mental Health Disorders (MH)G‐122. MH Service Area 1 G‐123. MH Service Areas 2‐5 G‐124. MH Service Area 6 G‐125. MH Service Area 7
G‐126. MH Service Area 8A G‐127. MH Service Area 8B G‐128. MH Service Area 9 G‐129. MH Service Area 10
G‐130. MH Service Area 11 G‐131. MH Service Area 12 G‐132. MH Service Area 13 G‐133. MH Service Area 14
G‐134. MH Service Area 15 G‐135. MH Service Area 16 G‐136. MH Service Area 17A G‐137. MH Service Area 17B
G‐138. MH Service Area 18 G‐139. MH Service Area 19 G‐140. MH Service Area 20 G‐141. MH Service Area 21
G‐142. MH Service Area 22 G‐143. MH Service Area 23 G‐144. MH Service Areas 24‐25
2019 Status Report on Missouri's Substance Use and Mental Health Page G-000
TREATMENT SERVICES FOR MENTAL DISORDERSMaps illustrating the geographic areas are provided in the Status Report Appendix.

Total Individuals Served
Housing Unknown
Other
Homeless
Independent Living
Dependent Living
HOUSING / LIVING ARRANGEMENT
Employment Status Unknown
Not in Labor Force
Unemployed
Employed
Referral Source Unknown
Other
Court / Criminal Justice
Health Care Provider
Mental Health Provider
School
Self / Family / Friend
Education Level Unknown
Bachelor or Advanced Degree
Associate Degree or Some College
High School Grad or G.E.D.
Less than High School Diploma
Commitment Type Unknown
Sexual Predatory
Criminal
Civil
Voluntary
TREATMENT REFERRAL SOURCE
EMPLOYMENT
EDUCATION
TYPE OF COMMITMENT
Age Unknown
55 to 59
50 to 54
60 and Over
30 to 34
25 to 29
18 to 24
14 to 17
10 to 13
6 to 9
Under 6
40 to 44
35 to 39
45 to 49
AGE
Hearing Impaired
Past or Current Military Service599
1,874
Race/Ethnicity Unknown
Other Race
Hispanic
Asian / Pacific Islander
Native American / Alaskan
African American
Caucasian
17
4,917
1,887
209
227
16,069
56,533
GENDERMale
Female 41,010
36,943
Diagnosis Unknown
Other Disorders
Sexual Disorders
Schizophrenia and Psychotic Disorders
Personality Disorders
Depressive Mood Disorders
Impulse Control and Conduct DisordersDevelopmental and Age Related Disorders
Trauma and Stress Related Disorders
Anxiety and Fear Disorders
Bipolar Mood Disorders
DIAGNOSIS CATEGORY
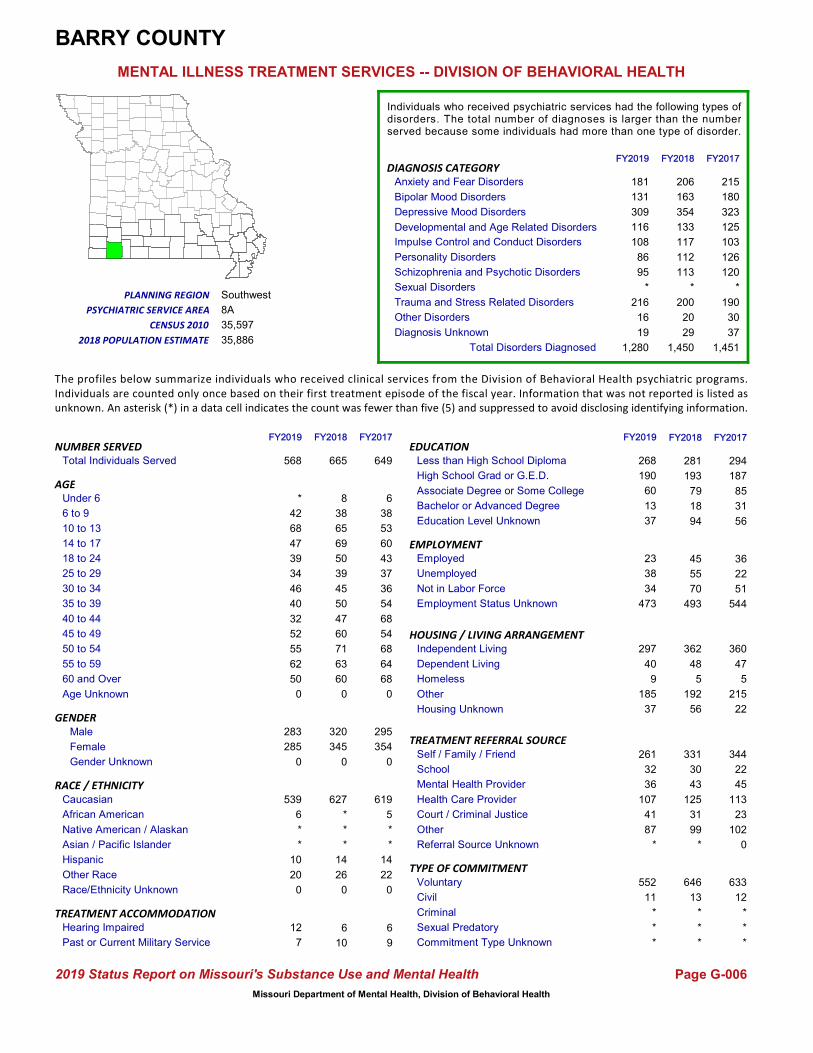
The profiles below summarize individuals who received clinical services from the Division of Behavioral Health psychiatric programs.Individuals are counted only once based on their first treatment episode of the fiscal year. Information that was not reported is listed asunknown. An asterisk (*) in a data cell indicates the count was fewer than five (5) and suppressed to avoid disclosing identifying information.
6,908
6,846
6,071
719
4,531
5,977
6,196
6,251
5,747
6,566
7,127
8,032
6,984
All Service Areas
All Regions
6,126,452
5,988,927
MISSOURI
30,432
23,302
10,959
2,883
5,059
12,113
1,664
78,181
398
1,091
856
18,623
19,255
34,060
12,680
7,215
7,840
15,624
335
17,744
41,597
1,995
7,046
12,867
2,677
13,467
2,777
3,933
5,223
10,637
20,073
17,525
36,016
12,787
7,249
6,672
15,005
362
19,183
2,864
805
4,619
6,652
6,378
6,501
5,930
6,495
7,804
#Name?
Page G-001
MENTAL ILLNESS TREATMENT SERVICES -- DIVISION OF BEHAVIORAL HEALTH
FY2018 FY2017
RACE / ETHNICITY
TREATMENT ACCOMMODATION
2019 Status Report on Missouri's Substance Use and Mental Health
3,0014,834
10,394
58,846 58,1776,869
6,113
6,936
7,714
7,468
1,496
271
343
77,97280,284NUMBER SERVED
PLANNING REGION
PSYCHIATRIC SERVICE AREA
2018 POPULATION ESTIMATE
CENSUS 2010
FY2019 FY2018 FY2017
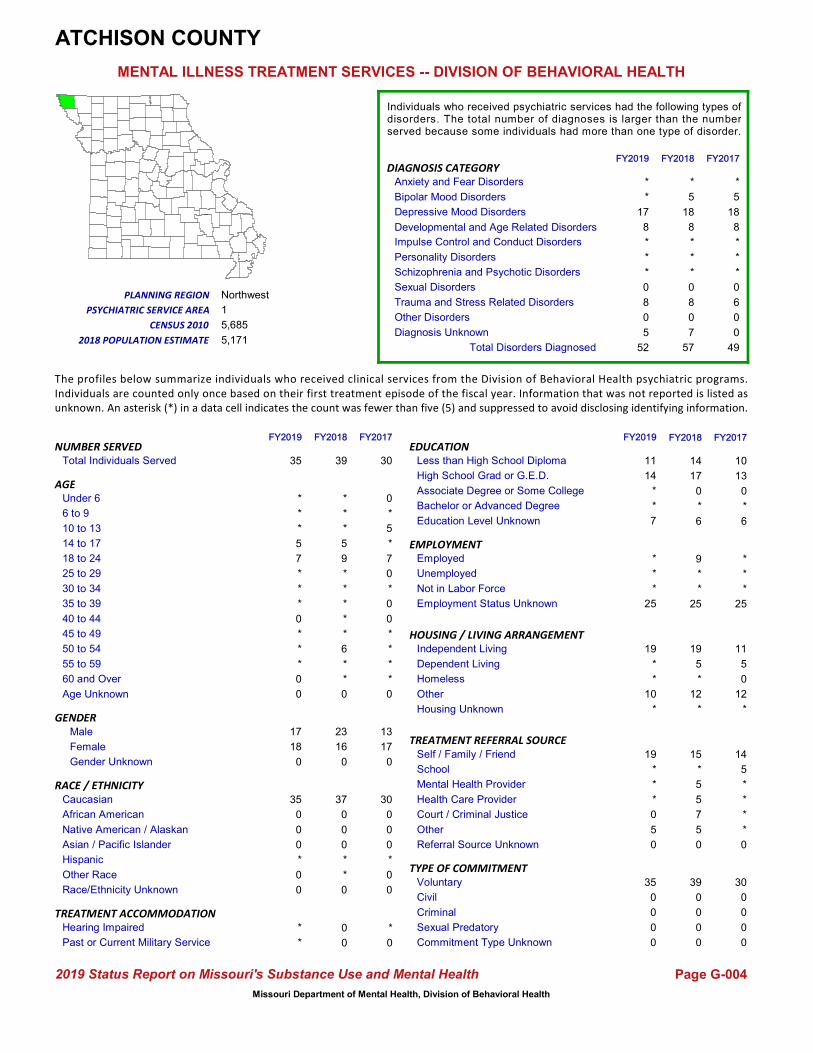
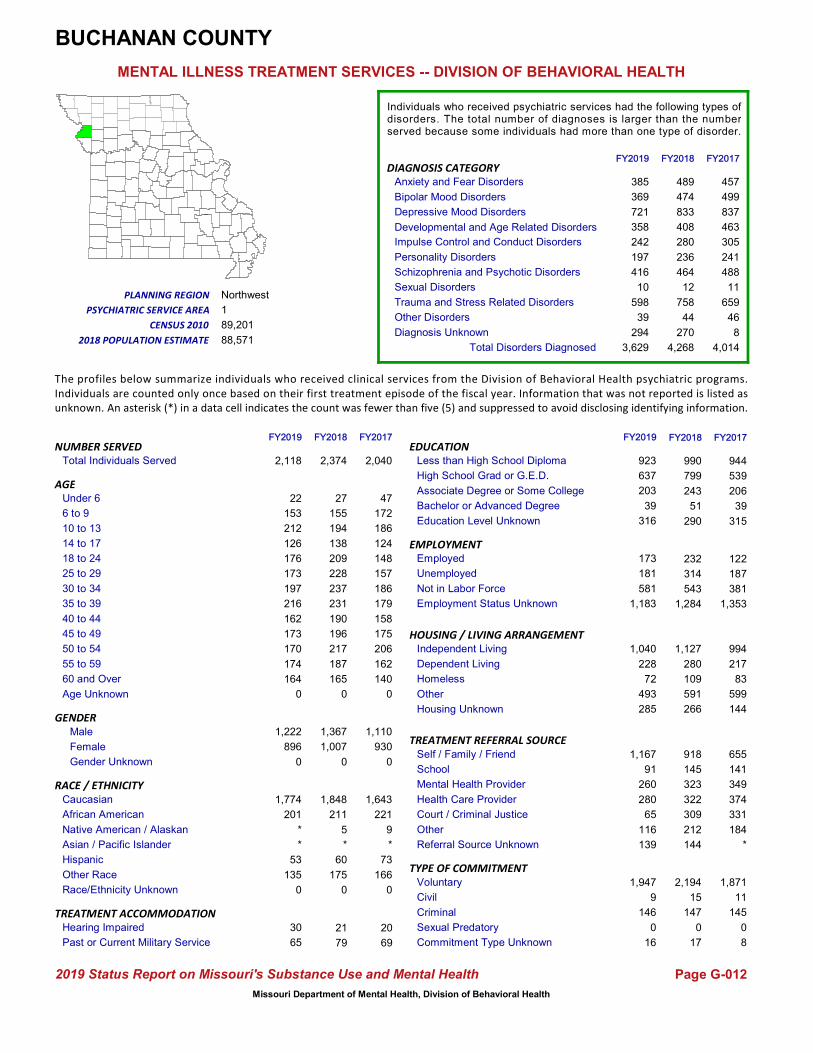
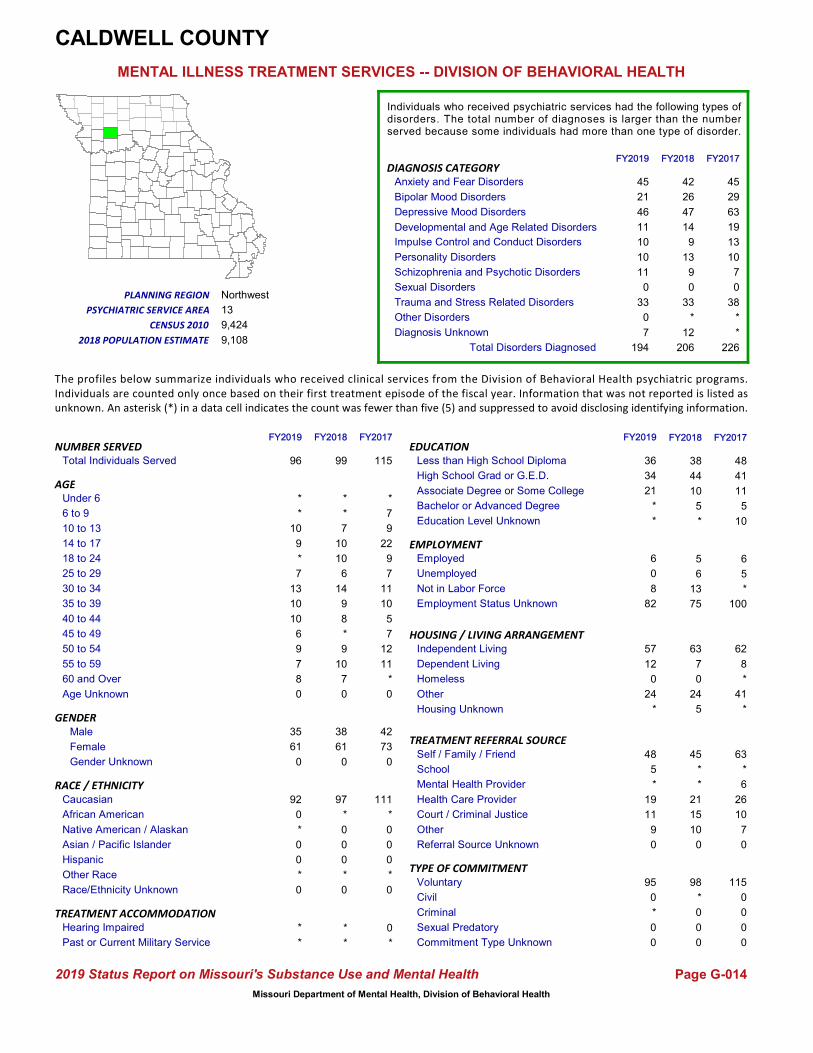
Individuals who received psychiatric services had the following types ofdisorders. The total number of diagnoses is larger than the numberserved because some individuals had more than one type of disorder.
56,816
16,357
216
223
2,025
31,524
24,426
11,102
2,868
5,401
0
10,364
75,858
621
1,139
37,682
1,582
6,403
13,204
3,938
15,121
42
236
118
19,293
18,342
35,335
12,743
7,338
7,230
15,224
340
18,637
3,177
3,959
4,267
8,656
42,185
3,139
42,036
8,743
2,788
21,103 21,577
5,202 2,828
FY2018 FY2017
38,493
41,791
Gender Unknown 190
1700
*
43,084
40,179
83,264
7,465
7,249
6,756
6,303
7,013
0
5,489
FY2019
1,309
1,874
2,223
216
214
17,704
59,633
8,241
6,592
6,221
6,875
7,119
7,484
5,082
864
FY2019
5,798
23,221
3,313
8,898
42,036
306
281
1,461
60,741
12,299
12,890
5,111
4,522
13,729
2,291
12,875
6,638
2,735
44,338
1,128
336
81,213
2,815
10,793
32,084
25,273
Total Disorders Diagnosed 139,154142,570 141,618
Missouri Department of Mental Health, Division of Behavioral Health

Total Individuals Served
Housing Unknown
Other
Homeless
Independent Living
Dependent Living
HOUSING / LIVING ARRANGEMENT
Employment Status Unknown
Not in Labor Force
Unemployed
Employed
Referral Source Unknown
Other
Court / Criminal Justice
Health Care Provider
Mental Health Provider
School
Self / Family / Friend
Education Level Unknown
Bachelor or Advanced Degree
Associate Degree or Some College
High School Grad or G.E.D.
Less than High School Diploma
Commitment Type Unknown
Sexual Predatory
Criminal
Civil
Voluntary
TREATMENT REFERRAL SOURCE
EMPLOYMENT
EDUCATION
TYPE OF COMMITMENT
Age Unknown
55 to 59
50 to 54
60 and Over
30 to 34
25 to 29
18 to 24
14 to 17
10 to 13
6 to 9
Under 6
40 to 44
35 to 39
45 to 49
AGE
Hearing Impaired
Past or Current Military Service*
13
Race/Ethnicity Unknown
Other Race
Hispanic
Asian / Pacific Islander
Native American / Alaskan
African American
Caucasian
0
14
*
0
0
16
432
GENDERMale
Female 231
231
Diagnosis Unknown
Other Disorders
Sexual Disorders
Schizophrenia and Psychotic Disorders
Personality Disorders
Depressive Mood Disorders
Impulse Control and Conduct DisordersDevelopmental and Age Related Disorders
Trauma and Stress Related Disorders
Anxiety and Fear Disorders
Bipolar Mood Disorders
DIAGNOSIS CATEGORY
The profiles below summarize individuals who received clinical services from the Division of Behavioral Health psychiatric programs.Individuals are counted only once based on their first treatment episode of the fiscal year. Information that was not reported is listed asunknown. An asterisk (*) in a data cell indicates the count was fewer than five (5) and suppressed to avoid disclosing identifying information.
37
27
28
12
51
35
60
39
20
40
39
40
34
14
Central
25,339
25,607
ADAIR COUNTY
219
187
32
7
5
28
11
480
0
*
*
55
136
135
106
54
16
72
*
80
126
0
13
76
7
262
*
33
7
32
54
108
118
110
49
15
73
*
67
*
7
52
53
65
45
13
42
41
#Name?
Page G-002
MENTAL ILLNESS TREATMENT SERVICES -- DIVISION OF BEHAVIORAL HEALTH
FY2018 FY2017
RACE / ETHNICITY
TREATMENT ACCOMMODATION
2019 Status Report on Missouri's Substance Use and Mental Health
0*
19
423 39225
24
39
38
43
*
*
*
462487NUMBER SERVED
PLANNING REGION
PSYCHIATRIC SERVICE AREA
2018 POPULATION ESTIMATE
CENSUS 2010
FY2019 FY2018 FY2017
Individuals who received psychiatric services had the following types ofdisorders. The total number of diagnoses is larger than the numberserved because some individuals had more than one type of disorder.
449
17
0
0
*
228
198
37
8
18
0
16
453
*
5
121
*
14
74
10
242
0
*
*
55
125
148
115
50
13
74
*
74
*
*
31
32
229
*
239
28
*
199 177
23 15
FY2018 FY2017
240
247
Gender Unknown 00
000
0
228
236
464
40
30
40
24
30
0
20
FY2019
*
10
*
0
0
15
429
43
32
19
39
59
59
41
8
FY2019
27
181
*
28
224
*
*
*
392
16
35
7
30
261
*
69
10
0
116
*
0
460
10
33
233
172
Total Disorders Diagnosed 658603 662
Missouri Department of Mental Health, Division of Behavioral Health

Total Individuals Served
Housing Unknown
Other
Homeless
Independent Living
Dependent Living
HOUSING / LIVING ARRANGEMENT
Employment Status Unknown
Not in Labor Force
Unemployed
Employed
Referral Source Unknown
Other
Court / Criminal Justice
Health Care Provider
Mental Health Provider
School
Self / Family / Friend
Education Level Unknown
Bachelor or Advanced Degree
Associate Degree or Some College
High School Grad or G.E.D.
Less than High School Diploma
Commitment Type Unknown
Sexual Predatory
Criminal
Civil
Voluntary
TREATMENT REFERRAL SOURCE
EMPLOYMENT
EDUCATION
TYPE OF COMMITMENT
Age Unknown
55 to 59
50 to 54
60 and Over
30 to 34
25 to 29
18 to 24
14 to 17
10 to 13
6 to 9
Under 6
40 to 44
35 to 39
45 to 49
AGE
Hearing Impaired
Past or Current Military Service*
*
Race/Ethnicity Unknown
Other Race
Hispanic
Asian / Pacific Islander
Native American / Alaskan
African American
Caucasian
0
*
*
0
0
0
86
GENDERMale
Female 46
42
Diagnosis Unknown
Other Disorders
Sexual Disorders
Schizophrenia and Psychotic Disorders
Personality Disorders
Depressive Mood Disorders
Impulse Control and Conduct DisordersDevelopmental and Age Related Disorders
Trauma and Stress Related Disorders
Anxiety and Fear Disorders
Bipolar Mood Disorders
DIAGNOSIS CATEGORY
The profiles below summarize individuals who received clinical services from the Division of Behavioral Health psychiatric programs.Individuals are counted only once based on their first treatment episode of the fiscal year. Information that was not reported is listed asunknown. An asterisk (*) in a data cell indicates the count was fewer than five (5) and suppressed to avoid disclosing identifying information.
11
9
6
*
11
6
9
8
*
9
5
7
*
1
Northwest
17,607
17,291
ANDREW COUNTY
43
25
8
*
7
19
*
86
0
*
*
24
26
44
23
12
6
11
0
34
28
*
6
25
10
16
0
*
7
12
21
19
43
15
8
6
7
0
22
*
*
*
10
7
9
9
5
7
#Name?
Page G-003
MENTAL ILLNESS TREATMENT SERVICES -- DIVISION OF BEHAVIORAL HEALTH
FY2018 FY2017
RACE / ETHNICITY
TREATMENT ACCOMMODATION
2019 Status Report on Missouri's Substance Use and Mental Health
014
9
58 658
11
8
6
6
*
0
*
8891NUMBER SERVED
PLANNING REGION
PSYCHIATRIC SERVICE AREA
2018 POPULATION ESTIMATE
CENSUS 2010
FY2019 FY2018 FY2017
Individuals who received psychiatric services had the following types ofdisorders. The total number of diagnoses is larger than the numberserved because some individuals had more than one type of disorder.
86
0
0
0
*
38
29
8
*
*
0
14
87
0
*
25
*
9
29
9
12
0
0
0
21
22
41
20
11
6
8
0
32
0
13
7
14
47
*
44
11
*
25 25
* 5
FY2018 FY2017
49
42
Gender Unknown 00
000
0
39
45
84
*
8
*
16
6
0
0
FY2019
*
*
0
0
0
0
84
*
7
10
11
10
6
*
0
FY2019
5
19
0
7
53
*
0
*
54
16
14
5
11
7
*
25
5
*
42
*
0
81
0
7
29
32
Total Disorders Diagnosed 180156 174
Missouri Department of Mental Health, Division of Behavioral Health
Total Individuals Served
Housing Unknown
Other
Homeless
Independent Living
Dependent Living
HOUSING / LIVING ARRANGEMENT
Employment Status Unknown
Not in Labor Force
Unemployed
Employed
Referral Source Unknown
Other
Court / Criminal Justice
Health Care Provider
Mental Health Provider
School
Self / Family / Friend
Education Level Unknown
Bachelor or Advanced Degree
Associate Degree or Some College
High School Grad or G.E.D.
Less than High School Diploma
Commitment Type Unknown
Sexual Predatory
Criminal
Civil
Voluntary
TREATMENT REFERRAL SOURCE
EMPLOYMENT
EDUCATION
TYPE OF COMMITMENT
Age Unknown
55 to 59
50 to 54
60 and Over
30 to 34
25 to 29
18 to 24
14 to 17
10 to 13
6 to 9
Under 6
40 to 44
35 to 39
45 to 49
AGE
Hearing Impaired
Past or Current Military Service*
0
Race/Ethnicity Unknown
Other Race
Hispanic
Asian / Pacific Islander
Native American / Alaskan
African American
Caucasian
0
0
*
0
0
0
30
GENDERMale
Female 17
13
Diagnosis Unknown
Other Disorders
Sexual Disorders
Schizophrenia and Psychotic Disorders
Personality Disorders
Depressive Mood Disorders
Impulse Control and Conduct DisordersDevelopmental and Age Related Disorders
Trauma and Stress Related Disorders
Anxiety and Fear Disorders
Bipolar Mood Disorders
DIAGNOSIS CATEGORY
The profiles below summarize individuals who received clinical services from the Division of Behavioral Health psychiatric programs.Individuals are counted only once based on their first treatment episode of the fiscal year. Information that was not reported is listed asunknown. An asterisk (*) in a data cell indicates the count was fewer than five (5) and suppressed to avoid disclosing identifying information.
*
0
0
0
*
5
*
7
0
*
*
*
*
1
Northwest
5,171
5,685
ATCHISON COUNTY
10
13
0
*
*
*
0
39
0
0
0
*
5
18
8
*
*
*
0
6
15
*
5
5
7
5
0
*
*
*
*
*
17
8
*
*
*
0
8
0
*
*
*
5
9
*
*
*
#Name?
Page G-004
MENTAL ILLNESS TREATMENT SERVICES -- DIVISION OF BEHAVIORAL HEALTH
FY2018 FY2017
RACE / ETHNICITY
TREATMENT ACCOMMODATION
2019 Status Report on Missouri's Substance Use and Mental Health
05
6
25 25*
*
*
6
*
0
0
0
3039NUMBER SERVED
PLANNING REGION
PSYCHIATRIC SERVICE AREA
2018 POPULATION ESTIMATE
CENSUS 2010
FY2019 FY2018 FY2017
Individuals who received psychiatric services had the following types ofdisorders. The total number of diagnoses is larger than the numberserved because some individuals had more than one type of disorder.
37
0
0
0
*
14
17
0
*
*
0
6
30
0
0
14
5
*
*
*
*
0
0
0
*
5
18
8
*
*
*
0
8
0
7
9
5
19
*
11
5
0
12 12
* *
FY2018 FY2017
23
16
Gender Unknown 00
000
0
18
17
35
*
*
*
0
*
0
0
FY2019
*
*
*
0
0
0
35
0
*
*
7
5
*
*
*
FY2019
*
10
*
*
19
0
0
0
25
7
*
*
*
5
0
*
*
*
19
0
0
35
*
*
11
14
Total Disorders Diagnosed 4952 57
Missouri Department of Mental Health, Division of Behavioral Health

Total Individuals Served
Housing Unknown
Other
Homeless
Independent Living
Dependent Living
HOUSING / LIVING ARRANGEMENT
Employment Status Unknown
Not in Labor Force
Unemployed
Employed
Referral Source Unknown
Other
Court / Criminal Justice
Health Care Provider
Mental Health Provider
School
Self / Family / Friend
Education Level Unknown
Bachelor or Advanced Degree
Associate Degree or Some College
High School Grad or G.E.D.
Less than High School Diploma
Commitment Type Unknown
Sexual Predatory
Criminal
Civil
Voluntary
TREATMENT REFERRAL SOURCE
EMPLOYMENT
EDUCATION
TYPE OF COMMITMENT
Age Unknown
55 to 59
50 to 54
60 and Over
30 to 34
25 to 29
18 to 24
14 to 17
10 to 13
6 to 9
Under 6
40 to 44
35 to 39
45 to 49
AGE
Hearing Impaired
Past or Current Military Service5
9
Race/Ethnicity Unknown
Other Race
Hispanic
Asian / Pacific Islander
Native American / Alaskan
African American
Caucasian
0
36
7
*
*
40
540
GENDERMale
Female 341
277
Diagnosis Unknown
Other Disorders
Sexual Disorders
Schizophrenia and Psychotic Disorders
Personality Disorders
Depressive Mood Disorders
Impulse Control and Conduct DisordersDevelopmental and Age Related Disorders
Trauma and Stress Related Disorders
Anxiety and Fear Disorders
Bipolar Mood Disorders
DIAGNOSIS CATEGORY
The profiles below summarize individuals who received clinical services from the Division of Behavioral Health psychiatric programs.Individuals are counted only once based on their first treatment episode of the fiscal year. Information that was not reported is listed asunknown. An asterisk (*) in a data cell indicates the count was fewer than five (5) and suppressed to avoid disclosing identifying information.
37
58
41
*
49
69
62
58
48
44
52
51
47
15
Central
25,473
25,529
AUDRAIN COUNTY
260
232
84
23
15
28
8
541
0
11
9
110
137
276
150
46
42
64
*
139
428
*
32
21
8
53
9
21
10
25
68
94
172
109
40
22
57
0
94
*
5
39
68
63
49
44
39
42
#Name?
Page G-005
MENTAL ILLNESS TREATMENT SERVICES -- DIVISION OF BEHAVIORAL HEALTH
FY2018 FY2017
RACE / ETHNICITY
TREATMENT ACCOMMODATION
2019 Status Report on Missouri's Substance Use and Mental Health
3228
20
489 56338
32
41
51
42
9
0
*
618553NUMBER SERVED
PLANNING REGION
PSYCHIATRIC SERVICE AREA
2018 POPULATION ESTIMATE
CENSUS 2010
FY2019 FY2018 FY2017
Individuals who received psychiatric services had the following types ofdisorders. The total number of diagnoses is larger than the numberserved because some individuals had more than one type of disorder.
465
41
*
*
5
267
197
53
23
37
0
13
614
0
*
480
*
40
26
5
63
0
0
0
83
117
208
130
47
31
58
0
113
5
54
21
45
272
8
317
71
5
195 210
33 15
FY2018 FY2017
261
292
Gender Unknown 00
000
0
234
225
459
32
37
30
24
26
0
31
FY2019
9
6
5
*
*
34
391
32
35
30
43
62
65
39
*
FY2019
38
196
10
21
194
*
0
9
393
16
40
17
9
54
7
32
24
*
331
9
*
448
14
32
244
153
Total Disorders Diagnosed 1,006688 846
Missouri Department of Mental Health, Division of Behavioral Health
Total Individuals Served
Housing Unknown
Other
Homeless
Independent Living
Dependent Living
HOUSING / LIVING ARRANGEMENT
Employment Status Unknown
Not in Labor Force
Unemployed
Employed
Referral Source Unknown
Other
Court / Criminal Justice
Health Care Provider
Mental Health Provider
School
Self / Family / Friend
Education Level Unknown
Bachelor or Advanced Degree
Associate Degree or Some College
High School Grad or G.E.D.
Less than High School Diploma
Commitment Type Unknown
Sexual Predatory
Criminal
Civil
Voluntary
TREATMENT REFERRAL SOURCE
EMPLOYMENT
EDUCATION
TYPE OF COMMITMENT
Age Unknown
55 to 59
50 to 54
60 and Over
30 to 34
25 to 29
18 to 24
14 to 17
10 to 13
6 to 9
Under 6
40 to 44
35 to 39
45 to 49
AGE
Hearing Impaired
Past or Current Military Service6
9
Race/Ethnicity Unknown
Other Race
Hispanic
Asian / Pacific Islander
Native American / Alaskan
African American
Caucasian
0
22
14
*
*
5
619
GENDERMale
Female 354
295
Diagnosis Unknown
Other Disorders
Sexual Disorders
Schizophrenia and Psychotic Disorders
Personality Disorders
Depressive Mood Disorders
Impulse Control and Conduct DisordersDevelopmental and Age Related Disorders
Trauma and Stress Related Disorders
Anxiety and Fear Disorders
Bipolar Mood Disorders
DIAGNOSIS CATEGORY
The profiles below summarize individuals who received clinical services from the Division of Behavioral Health psychiatric programs.Individuals are counted only once based on their first treatment episode of the fiscal year. Information that was not reported is listed asunknown. An asterisk (*) in a data cell indicates the count was fewer than five (5) and suppressed to avoid disclosing identifying information.
54
54
68
6
38
53
60
43
37
36
68
68
64
8A
Southwest
35,886
35,597
BARRY COUNTY
294
187
85
31
55
70
10
646
13
*
6
215
180
323
125
103
126
120
*
190
331
30
43
125
31
99
30
36
22
51
181
131
309
116
108
86
95
*
216
16
8
38
65
69
50
39
45
60
#Name?
Page G-006
MENTAL ILLNESS TREATMENT SERVICES -- DIVISION OF BEHAVIORAL HEALTH
FY2018 FY2017
RACE / ETHNICITY
TREATMENT ACCOMMODATION
2019 Status Report on Missouri's Substance Use and Mental Health
3719
56
493 54450
47
60
71
63
*
*
*
649665NUMBER SERVED
PLANNING REGION
PSYCHIATRIC SERVICE AREA
2018 POPULATION ESTIMATE
CENSUS 2010
FY2019 FY2018 FY2017
Individuals who received psychiatric services had the following types ofdisorders. The total number of diagnoses is larger than the numberserved because some individuals had more than one type of disorder.
627
*
*
*
14
281
193
79
18
26
0
94
633
12
*
344
22
45
113
23
102
0
*
*
206
163
354
133
117
112
113
*
200
20
29
45
48
362
5
360
47
5
192 215
56 22
FY2018 FY2017
320
345
Gender Unknown 00
000
0
285
283
568
62
55
52
32
40
0
20
FY2019
12
7
10
*
*
6
539
50
46
34
39
47
68
42
*
FY2019
37
185
9
40
297
*
*
*
473
37
34
38
23
87
41
107
36
32
261
*
11
552
13
60
268
190
Total Disorders Diagnosed 1,4511,280 1,450
Missouri Department of Mental Health, Division of Behavioral Health

Total Individuals Served
Housing Unknown
Other
Homeless
Independent Living
Dependent Living
HOUSING / LIVING ARRANGEMENT
Employment Status Unknown
Not in Labor Force
Unemployed
Employed
Referral Source Unknown
Other
Court / Criminal Justice
Health Care Provider
Mental Health Provider
School
Self / Family / Friend
Education Level Unknown
Bachelor or Advanced Degree
Associate Degree or Some College
High School Grad or G.E.D.
Less than High School Diploma
Commitment Type Unknown
Sexual Predatory
Criminal
Civil
Voluntary
TREATMENT REFERRAL SOURCE
EMPLOYMENT
EDUCATION
TYPE OF COMMITMENT
Age Unknown
55 to 59
50 to 54
60 and Over
30 to 34
25 to 29
18 to 24
14 to 17
10 to 13
6 to 9
Under 6
40 to 44
35 to 39
45 to 49
AGE
Hearing Impaired
Past or Current Military Service0
*
Race/Ethnicity Unknown
Other Race
Hispanic
Asian / Pacific Islander
Native American / Alaskan
African American
Caucasian
0
*
0
*
0
*
66
GENDERMale
Female 32
40
Diagnosis Unknown
Other Disorders
Sexual Disorders
Schizophrenia and Psychotic Disorders
Personality Disorders
Depressive Mood Disorders
Impulse Control and Conduct DisordersDevelopmental and Age Related Disorders
Trauma and Stress Related Disorders
Anxiety and Fear Disorders
Bipolar Mood Disorders
DIAGNOSIS CATEGORY
The profiles below summarize individuals who received clinical services from the Division of Behavioral Health psychiatric programs.Individuals are counted only once based on their first treatment episode of the fiscal year. Information that was not reported is listed asunknown. An asterisk (*) in a data cell indicates the count was fewer than five (5) and suppressed to avoid disclosing identifying information.
6
7
10
*
5
7
7
*
9
9
*
*
*
9
Southwest
11,798
12,402
BARTON COUNTY
37
14
9
*
13
8
0
76
12
0
0
21
12
38
14
13
11
11
0
24
69
*
0
6
*
11
*
5
12
9
32
27
49
17
14
9
11
*
46
*
0
5
13
11
7
*
9
6
#Name?
Page G-007
MENTAL ILLNESS TREATMENT SERVICES -- DIVISION OF BEHAVIORAL HEALTH
FY2018 FY2017
RACE / ETHNICITY
TREATMENT ACCOMMODATION
2019 Status Report on Missouri's Substance Use and Mental Health
0*
11
59 4710
12
8
*
*
0
0
0
7288NUMBER SERVED
PLANNING REGION
PSYCHIATRIC SERVICE AREA
2018 POPULATION ESTIMATE
CENSUS 2010
FY2019 FY2018 FY2017
Individuals who received psychiatric services had the following types ofdisorders. The total number of diagnoses is larger than the numberserved because some individuals had more than one type of disorder.
82
*
0
*
*
30
23
12
*
*
0
22
59
13
0
52
*
0
9
*
6
0
0
0
21
17
49
17
14
8
12
*
34
*
*
8
*
42
*
36
5
0
30 24
11 7
FY2018 FY2017
46
42
Gender Unknown 00
000
0
57
58
115
6
*
13
15
18
0
8
FY2019
0
0
*
0
0
*
106
5
6
8
8
14
11
5
*
FY2019
9
33
0
9
64
0
0
*
78
19
14
13
10
13
*
13
0
0
87
*
14
100
*
19
49
24
Total Disorders Diagnosed 148214 176
Missouri Department of Mental Health, Division of Behavioral Health

Total Individuals Served
Housing Unknown
Other
Homeless
Independent Living
Dependent Living
HOUSING / LIVING ARRANGEMENT
Employment Status Unknown
Not in Labor Force
Unemployed
Employed
Referral Source Unknown
Other
Court / Criminal Justice
Health Care Provider
Mental Health Provider
School
Self / Family / Friend
Education Level Unknown
Bachelor or Advanced Degree
Associate Degree or Some College
High School Grad or G.E.D.
Less than High School Diploma
Commitment Type Unknown
Sexual Predatory
Criminal
Civil
Voluntary
TREATMENT REFERRAL SOURCE
EMPLOYMENT
EDUCATION
TYPE OF COMMITMENT
Age Unknown
55 to 59
50 to 54
60 and Over
30 to 34
25 to 29
18 to 24
14 to 17
10 to 13
6 to 9
Under 6
40 to 44
35 to 39
45 to 49
AGE
Hearing Impaired
Past or Current Military Service*
*
Race/Ethnicity Unknown
Other Race
Hispanic
Asian / Pacific Islander
Native American / Alaskan
African American
Caucasian
0
13
6
*
*
*
165
GENDERMale
Female 88
95
Diagnosis Unknown
Other Disorders
Sexual Disorders
Schizophrenia and Psychotic Disorders
Personality Disorders
Depressive Mood Disorders
Impulse Control and Conduct DisordersDevelopmental and Age Related Disorders
Trauma and Stress Related Disorders
Anxiety and Fear Disorders
Bipolar Mood Disorders
DIAGNOSIS CATEGORY
The profiles below summarize individuals who received clinical services from the Division of Behavioral Health psychiatric programs.Individuals are counted only once based on their first treatment episode of the fiscal year. Information that was not reported is listed asunknown. An asterisk (*) in a data cell indicates the count was fewer than five (5) and suppressed to avoid disclosing identifying information.
9
8
12
5
22
25
14
13
9
23
12
18
13
8B
Southwest
16,320
17,049
BATES COUNTY
102
49
18
*
10
23
*
181
0
*
*
60
39
79
30
33
7
17
0
29
127
0
26
16
0
13
0
6
7
16
62
30
73
33
20
5
19
0
37
*
*
19
28
17
12
9
18
15
#Name?
Page G-008
MENTAL ILLNESS TREATMENT SERVICES -- DIVISION OF BEHAVIORAL HEALTH
FY2018 FY2017
RACE / ETHNICITY
TREATMENT ACCOMMODATION
2019 Status Report on Missouri's Substance Use and Mental Health
*18
12
140 15412
10
9
16
15
*
0
*
183183NUMBER SERVED
PLANNING REGION
PSYCHIATRIC SERVICE AREA
2018 POPULATION ESTIMATE
CENSUS 2010
FY2019 FY2018 FY2017
Individuals who received psychiatric services had the following types ofdisorders. The total number of diagnoses is larger than the numberserved because some individuals had more than one type of disorder.
168
*
*
*
5
87
47
17
*
10
0
29
180
0
*
145
0
10
17
*
8
0
0
0
63
32
80
31
28
6
13
0
34
*
8
10
23
85
*
89
17
5
66 69
8 *
FY2018 FY2017
92
91
Gender Unknown 00
000
0
95
98
193
13
15
11
16
17
0
9
FY2019
*
*
*
0
*
*
179
18
15
6
11
23
30
17
*
FY2019
14
74
*
29
75
*
0
5
138
33
35
12
8
30
0
12
27
0
120
5
0
187
*
19
85
54
Total Disorders Diagnosed 295299 296
Missouri Department of Mental Health, Division of Behavioral Health

Total Individuals Served
Housing Unknown
Other
Homeless
Independent Living
Dependent Living
HOUSING / LIVING ARRANGEMENT
Employment Status Unknown
Not in Labor Force
Unemployed
Employed
Referral Source Unknown
Other
Court / Criminal Justice
Health Care Provider
Mental Health Provider
School
Self / Family / Friend
Education Level Unknown
Bachelor or Advanced Degree
Associate Degree or Some College
High School Grad or G.E.D.
Less than High School Diploma
Commitment Type Unknown
Sexual Predatory
Criminal
Civil
Voluntary
TREATMENT REFERRAL SOURCE
EMPLOYMENT
EDUCATION
TYPE OF COMMITMENT
Age Unknown
55 to 59
50 to 54
60 and Over
30 to 34
25 to 29
18 to 24
14 to 17
10 to 13
6 to 9
Under 6
40 to 44
35 to 39
45 to 49
AGE
Hearing Impaired
Past or Current Military Service0
5
Race/Ethnicity Unknown
Other Race
Hispanic
Asian / Pacific Islander
Native American / Alaskan
African American
Caucasian
0
9
*
*
*
*
254
GENDERMale
Female 140
128
Diagnosis Unknown
Other Disorders
Sexual Disorders
Schizophrenia and Psychotic Disorders
Personality Disorders
Depressive Mood Disorders
Impulse Control and Conduct DisordersDevelopmental and Age Related Disorders
Trauma and Stress Related Disorders
Anxiety and Fear Disorders
Bipolar Mood Disorders
DIAGNOSIS CATEGORY
The profiles below summarize individuals who received clinical services from the Division of Behavioral Health psychiatric programs.Individuals are counted only once based on their first treatment episode of the fiscal year. Information that was not reported is listed asunknown. An asterisk (*) in a data cell indicates the count was fewer than five (5) and suppressed to avoid disclosing identifying information.
26
12
20
5
16
16
25
13
24
26
27
39
19
8B
Southwest
19,278
19,056
BENTON COUNTY
123
83
41
*
16
28
5
306
*
0
*
102
67
120
42
33
10
36
0
71
195
*
56
34
*
17
*
*
10
18
134
61
139
63
43
11
36
0
105
*
*
21
24
27
27
18
20
27
#Name?
Page G-009
MENTAL ILLNESS TREATMENT SERVICES -- DIVISION OF BEHAVIORAL HEALTH
FY2018 FY2017
RACE / ETHNICITY
TREATMENT ACCOMMODATION
2019 Status Report on Missouri's Substance Use and Mental Health
518
17
260 23727
19
31
40
24
0
0
*
268308NUMBER SERVED
PLANNING REGION
PSYCHIATRIC SERVICE AREA
2018 POPULATION ESTIMATE
CENSUS 2010
FY2019 FY2018 FY2017
Individuals who received psychiatric services had the following types ofdisorders. The total number of diagnoses is larger than the numberserved because some individuals had more than one type of disorder.
293
*
0
*
*
146
94
48
*
10
0
18
266
0
*
210
*
11
28
5
11
0
0
0
125
69
136
51
43
8
38
0
92
*
9
*
39
156
7
155
26
*
87 75
19 8
FY2018 FY2017
148
160
Gender Unknown 00
000
0
183
168
351
25
44
29
20
23
0
14
FY2019
*
7
6
*
0
*
332
35
23
17
34
38
33
24
6
FY2019
26
109
8
32
176
*
0
0
290
39
39
10
12
33
*
28
51
*
234
0
0
350
5
41
158
108
Total Disorders Diagnosed 490612 575
Missouri Department of Mental Health, Division of Behavioral Health

Total Individuals Served
Housing Unknown
Other
Homeless
Independent Living
Dependent Living
HOUSING / LIVING ARRANGEMENT
Employment Status Unknown
Not in Labor Force
Unemployed
Employed
Referral Source Unknown
Other
Court / Criminal Justice
Health Care Provider
Mental Health Provider
School
Self / Family / Friend
Education Level Unknown
Bachelor or Advanced Degree
Associate Degree or Some College
High School Grad or G.E.D.
Less than High School Diploma
Commitment Type Unknown
Sexual Predatory
Criminal
Civil
Voluntary
TREATMENT REFERRAL SOURCE
EMPLOYMENT
EDUCATION
TYPE OF COMMITMENT
Age Unknown
55 to 59
50 to 54
60 and Over
30 to 34
25 to 29
18 to 24
14 to 17
10 to 13
6 to 9
Under 6
40 to 44
35 to 39
45 to 49
AGE
Hearing Impaired
Past or Current Military Service0
20
Race/Ethnicity Unknown
Other Race
Hispanic
Asian / Pacific Islander
Native American / Alaskan
African American
Caucasian
0
27
9
0
*
12
364
GENDERMale
Female 234
171
Diagnosis Unknown
Other Disorders
Sexual Disorders
Schizophrenia and Psychotic Disorders
Personality Disorders
Depressive Mood Disorders
Impulse Control and Conduct DisordersDevelopmental and Age Related Disorders
Trauma and Stress Related Disorders
Anxiety and Fear Disorders
Bipolar Mood Disorders
DIAGNOSIS CATEGORY
The profiles below summarize individuals who received clinical services from the Division of Behavioral Health psychiatric programs.Individuals are counted only once based on their first treatment episode of the fiscal year. Information that was not reported is listed asunknown. An asterisk (*) in a data cell indicates the count was fewer than five (5) and suppressed to avoid disclosing identifying information.
49
39
31
0
17
24
28
21
39
27
46
42
42
21
Southeast
12,169
12,363
BOLLINGER COUNTY
158
103
33
10
47
53
14
381
0
5
*
53
94
161
46
23
14
90
0
34
244
6
20
65
9
35
*
54
37
57
49
87
124
39
24
14
73
0
31
0
*
15
12
25
26
29
32
46
#Name?
Page G-010
MENTAL ILLNESS TREATMENT SERVICES -- DIVISION OF BEHAVIORAL HEALTH
FY2018 FY2017
RACE / ETHNICITY
TREATMENT ACCOMMODATION
2019 Status Report on Missouri's Substance Use and Mental Health
3520
102
233 25835
33
40
49
43
8
0
*
405388NUMBER SERVED
PLANNING REGION
PSYCHIATRIC SERVICE AREA
2018 POPULATION ESTIMATE
CENSUS 2010
FY2019 FY2018 FY2017
Individuals who received psychiatric services had the following types ofdisorders. The total number of diagnoses is larger than the numberserved because some individuals had more than one type of disorder.
339
10
*
0
10
153
118
35
*
30
0
79
391
*
11
240
*
22
83
20
36
0
0
*
51
88
147
45
21
20
81
0
29
*
44
54
18
201
*
212
18
*
94 149
71 22
FY2018 FY2017
173
215
Gender Unknown 00
000
0
170
173
343
38
41
31
27
29
0
28
FY2019
12
9
9
0
*
11
302
31
29
29
27
19
18
21
*
FY2019
47
132
*
25
138
*
0
*
224
55
39
34
46
28
*
56
14
7
233
*
0
337
*
27
138
119
Total Disorders Diagnosed 554461 528
Missouri Department of Mental Health, Division of Behavioral Health

Total Individuals Served
Housing Unknown
Other
Homeless
Independent Living
Dependent Living
HOUSING / LIVING ARRANGEMENT
Employment Status Unknown
Not in Labor Force
Unemployed
Employed
Referral Source Unknown
Other
Court / Criminal Justice
Health Care Provider
Mental Health Provider
School
Self / Family / Friend
Education Level Unknown
Bachelor or Advanced Degree
Associate Degree or Some College
High School Grad or G.E.D.
Less than High School Diploma
Commitment Type Unknown
Sexual Predatory
Criminal
Civil
Voluntary
TREATMENT REFERRAL SOURCE
EMPLOYMENT
EDUCATION
TYPE OF COMMITMENT
Age Unknown
55 to 59
50 to 54
60 and Over
30 to 34
25 to 29
18 to 24
14 to 17
10 to 13
6 to 9
Under 6
40 to 44
35 to 39
45 to 49
AGE
Hearing Impaired
Past or Current Military Service19
48
Race/Ethnicity Unknown
Other Race
Hispanic
Asian / Pacific Islander
Native American / Alaskan
African American
Caucasian
0
164
57
10
8
533
1,296
GENDERMale
Female 1,044
967
Diagnosis Unknown
Other Disorders
Sexual Disorders
Schizophrenia and Psychotic Disorders
Personality Disorders
Depressive Mood Disorders
Impulse Control and Conduct DisordersDevelopmental and Age Related Disorders
Trauma and Stress Related Disorders
Anxiety and Fear Disorders
Bipolar Mood Disorders
DIAGNOSIS CATEGORY
The profiles below summarize individuals who received clinical services from the Division of Behavioral Health psychiatric programs.Individuals are counted only once based on their first treatment episode of the fiscal year. Information that was not reported is listed asunknown. An asterisk (*) in a data cell indicates the count was fewer than five (5) and suppressed to avoid disclosing identifying information.
194
173
131
13
148
154
189
182
141
153
164
202
167
12
Central
180,005
162,642
BOONE COUNTY
802
563
374
137
65
184
40
1,844
6
20
37
346
409
857
240
179
122
342
*
498
1,135
77
98
260
83
200
15
67
48
116
417
340
730
185
150
105
299
*
521
21
10
128
170
191
161
112
133
184
#Name?
Page G-011
MENTAL ILLNESS TREATMENT SERVICES -- DIVISION OF BEHAVIORAL HEALTH
FY2018 FY2017
RACE / ETHNICITY
TREATMENT ACCOMMODATION
2019 Status Report on Missouri's Substance Use and Mental Health
2570
132
1,572 1,777139
122
163
187
175
22
*
*
2,0111,875NUMBER SERVED
PLANNING REGION
PSYCHIATRIC SERVICE AREA
2018 POPULATION ESTIMATE
CENSUS 2010
FY2019 FY2018 FY2017
Individuals who received psychiatric services had the following types ofdisorders. The total number of diagnoses is larger than the numberserved because some individuals had more than one type of disorder.
1,143
520
9
7
55
697
514
368
116
175
0
180
1,966
6
21
1,008
109
131
331
148
281
0
*
12
389
360
829
222
175
120
323
*
524
21
49
54
194
952
106
1,043
217
109
546 606
77 34
FY2018 FY2017
908
967
Gender Unknown 00
000
0
862
785
1,647
142
165
131
118
135
0
147
FY2019
38
32
46
5
5
466
1,024
175
128
105
145
164
132
101
6
FY2019
63
480
106
158
840
*
*
22
1,327
209
192
63
65
192
87
220
78
75
975
15
11
1,616
88
306
606
438
Total Disorders Diagnosed 3,0352,842 3,014
Missouri Department of Mental Health, Division of Behavioral Health
Total Individuals Served
Housing Unknown
Other
Homeless
Independent Living
Dependent Living
HOUSING / LIVING ARRANGEMENT
Employment Status Unknown
Not in Labor Force
Unemployed
Employed
Referral Source Unknown
Other
Court / Criminal Justice
Health Care Provider
Mental Health Provider
School
Self / Family / Friend
Education Level Unknown
Bachelor or Advanced Degree
Associate Degree or Some College
High School Grad or G.E.D.
Less than High School Diploma
Commitment Type Unknown
Sexual Predatory
Criminal
Civil
Voluntary
TREATMENT REFERRAL SOURCE
EMPLOYMENT
EDUCATION
TYPE OF COMMITMENT
Age Unknown
55 to 59
50 to 54
60 and Over
30 to 34
25 to 29
18 to 24
14 to 17
10 to 13
6 to 9
Under 6
40 to 44
35 to 39
45 to 49
AGE
Hearing Impaired
Past or Current Military Service20
69
Race/Ethnicity Unknown
Other Race
Hispanic
Asian / Pacific Islander
Native American / Alaskan
African American
Caucasian
0
166
73
*
9
221
1,643
GENDERMale
Female 930
1,110
Diagnosis Unknown
Other Disorders
Sexual Disorders
Schizophrenia and Psychotic Disorders
Personality Disorders
Depressive Mood Disorders
Impulse Control and Conduct DisordersDevelopmental and Age Related Disorders
Trauma and Stress Related Disorders
Anxiety and Fear Disorders
Bipolar Mood Disorders
DIAGNOSIS CATEGORY
The profiles below summarize individuals who received clinical services from the Division of Behavioral Health psychiatric programs.Individuals are counted only once based on their first treatment episode of the fiscal year. Information that was not reported is listed asunknown. An asterisk (*) in a data cell indicates the count was fewer than five (5) and suppressed to avoid disclosing identifying information.
175
179
158
47
172
186
124
148
157
186
140
206
162
1
Northwest
88,571
89,201
BUCHANAN COUNTY
944
539
206
39
314
543
79
2,194
15
147
21
457
499
837
463
305
241
488
11
659
918
145
323
322
309
212
46
122
187
381
385
369
721
358
242
197
416
10
598
39
27
155
194
138
209
228
237
165
#Name?
Page G-012
MENTAL ILLNESS TREATMENT SERVICES -- DIVISION OF BEHAVIORAL HEALTH
FY2018 FY2017
RACE / ETHNICITY
TREATMENT ACCOMMODATION
2019 Status Report on Missouri's Substance Use and Mental Health
8294
315
1,284 1,353231
190
196
217
187
144
0
17
2,0402,374NUMBER SERVED
PLANNING REGION
PSYCHIATRIC SERVICE AREA
2018 POPULATION ESTIMATE
CENSUS 2010
FY2019 FY2018 FY2017
Individuals who received psychiatric services had the following types ofdisorders. The total number of diagnoses is larger than the numberserved because some individuals had more than one type of disorder.
1,848
211
5
*
60
990
799
243
51
175
0
290
1,871
11
145
655
141
349
374
331
184
*
0
8
489
474
833
408
280
236
464
12
758
44
270
232
280
1,127
109
994
217
83
591 599
266 144
FY2018 FY2017
1,367
1,007
Gender Unknown 00
000
0
896
1,222
2,118
174
170
173
162
216
0
135
FY2019
30
65
53
*
*
201
1,774
164
197
173
176
126
212
153
22
FY2019
285
493
72
228
1,040
16
0
139
1,183
316
581
181
173
116
65
280
260
91
1,167
146
9
1,947
39
203
923
637
Total Disorders Diagnosed 4,0143,629 4,268
Missouri Department of Mental Health, Division of Behavioral Health

Total Individuals Served
Housing Unknown
Other
Homeless
Independent Living
Dependent Living
HOUSING / LIVING ARRANGEMENT
Employment Status Unknown
Not in Labor Force
Unemployed
Employed
Referral Source Unknown
Other
Court / Criminal Justice
Health Care Provider
Mental Health Provider
School
Self / Family / Friend
Education Level Unknown
Bachelor or Advanced Degree
Associate Degree or Some College
High School Grad or G.E.D.
Less than High School Diploma
Commitment Type Unknown
Sexual Predatory
Criminal
Civil
Voluntary
TREATMENT REFERRAL SOURCE
EMPLOYMENT
EDUCATION
TYPE OF COMMITMENT
Age Unknown
55 to 59
50 to 54
60 and Over
30 to 34
25 to 29
18 to 24
14 to 17
10 to 13
6 to 9
Under 6
40 to 44
35 to 39
45 to 49
AGE
Hearing Impaired
Past or Current Military Service7
31
Race/Ethnicity Unknown
Other Race
Hispanic
Asian / Pacific Islander
Native American / Alaskan
African American
Caucasian
0
20
8
0
*
79
893
GENDERMale
Female 553
441
Diagnosis Unknown
Other Disorders
Sexual Disorders
Schizophrenia and Psychotic Disorders
Personality Disorders
Depressive Mood Disorders
Impulse Control and Conduct DisordersDevelopmental and Age Related Disorders
Trauma and Stress Related Disorders
Anxiety and Fear Disorders
Bipolar Mood Disorders
DIAGNOSIS CATEGORY
The profiles below summarize individuals who received clinical services from the Division of Behavioral Health psychiatric programs.Individuals are counted only once based on their first treatment episode of the fiscal year. Information that was not reported is listed asunknown. An asterisk (*) in a data cell indicates the count was fewer than five (5) and suppressed to avoid disclosing identifying information.
101
84
96
*
49
77
63
49
68
87
119
108
89
19
Southeast
42,639
42,794
BUTLER COUNTY
443
405
100
21
51
87
28
1,036
0
*
23
234
310
450
127
87
77
156
5
186
576
6
158
178
43
75
12
41
51
66
267
282
454
159
88
63
157
*
223
8
5
27
91
62
73
62
86
124
#Name?
Page G-013
MENTAL ILLNESS TREATMENT SERVICES -- DIVISION OF BEHAVIORAL HEALTH
FY2018 FY2017
RACE / ETHNICITY
TREATMENT ACCOMMODATION
2019 Status Report on Missouri's Substance Use and Mental Health
1235
26
872 83792
107
105
99
107
*
*
*
9941,040NUMBER SERVED
PLANNING REGION
PSYCHIATRIC SERVICE AREA
2018 POPULATION ESTIMATE
CENSUS 2010
FY2019 FY2018 FY2017
Individuals who received psychiatric services had the following types ofdisorders. The total number of diagnoses is larger than the numberserved because some individuals had more than one type of disorder.
936
78
*
0
13
436
399
139
30
21
0
37
981
0
10
525
9
106
186
78
90
0
*
0
234
317
464
133
79
68
152
5
196
10
25
30
74
665
33
648
46
15
204 255
64 30
FY2018 FY2017
450
590
Gender Unknown 00
000
0
594
483
1,077
108
89
93
101
97
0
21
FY2019
33
21
10
0
*
92
962
127
66
85
77
82
101
49
*
FY2019
40
302
34
57
644
*
*
*
953
21
58
45
21
77
26
184
157
15
615
*
0
1,072
29
139
484
404
Total Disorders Diagnosed 1,6561,740 1,683
Missouri Department of Mental Health, Division of Behavioral Health
Total Individuals Served
Housing Unknown
Other
Homeless
Independent Living
Dependent Living
HOUSING / LIVING ARRANGEMENT
Employment Status Unknown
Not in Labor Force
Unemployed
Employed
Referral Source Unknown
Other
Court / Criminal Justice
Health Care Provider
Mental Health Provider
School
Self / Family / Friend
Education Level Unknown
Bachelor or Advanced Degree
Associate Degree or Some College
High School Grad or G.E.D.
Less than High School Diploma
Commitment Type Unknown
Sexual Predatory
Criminal
Civil
Voluntary
TREATMENT REFERRAL SOURCE
EMPLOYMENT
EDUCATION
TYPE OF COMMITMENT
Age Unknown
55 to 59
50 to 54
60 and Over
30 to 34
25 to 29
18 to 24
14 to 17
10 to 13
6 to 9
Under 6
40 to 44
35 to 39
45 to 49
AGE
Hearing Impaired
Past or Current Military Service0
*
Race/Ethnicity Unknown
Other Race
Hispanic
Asian / Pacific Islander
Native American / Alaskan
African American
Caucasian
0
*
0
0
0
*
111
GENDERMale
Female 73
42
Diagnosis Unknown
Other Disorders
Sexual Disorders
Schizophrenia and Psychotic Disorders
Personality Disorders
Depressive Mood Disorders
Impulse Control and Conduct DisordersDevelopmental and Age Related Disorders
Trauma and Stress Related Disorders
Anxiety and Fear Disorders
Bipolar Mood Disorders
DIAGNOSIS CATEGORY
The profiles below summarize individuals who received clinical services from the Division of Behavioral Health psychiatric programs.Individuals are counted only once based on their first treatment episode of the fiscal year. Information that was not reported is listed asunknown. An asterisk (*) in a data cell indicates the count was fewer than five (5) and suppressed to avoid disclosing identifying information.
7
10
5
*
7
9
22
9
7
11
*
12
11
13
Northwest
9,108
9,424
CALDWELL COUNTY
48
41
11
5
6
13
*
98
*
0
*
45
29
63
19
13
10
7
0
38
45
*
*
21
15
10
*
6
5
*
45
21
46
11
10
10
11
0
33
0
*
*
7
10
10
6
14
7
#Name?
Page G-014
MENTAL ILLNESS TREATMENT SERVICES -- DIVISION OF BEHAVIORAL HEALTH
FY2018 FY2017
RACE / ETHNICITY
TREATMENT ACCOMMODATION
2019 Status Report on Missouri's Substance Use and Mental Health
*7
10
75 1009
8
*
9
10
0
0
0
11599NUMBER SERVED
PLANNING REGION
PSYCHIATRIC SERVICE AREA
2018 POPULATION ESTIMATE
CENSUS 2010
FY2019 FY2018 FY2017
Individuals who received psychiatric services had the following types ofdisorders. The total number of diagnoses is larger than the numberserved because some individuals had more than one type of disorder.
97
*
0
0
0
38
44
10
5
*
0
*
115
0
0
63
*
6
26
10
7
0
0
0
42
26
47
14
9
13
9
0
33
*
12
5
7
63
0
62
8
*
24 41
5 *
FY2018 FY2017
38
61
Gender Unknown 00
000
0
61
35
96
7
9
6
10
10
0
*
FY2019
*
*
0
0
*
0
92
8
13
7
*
9
10
*
*
FY2019
*
24
0
12
57
0
0
0
82
*
8
0
6
9
11
19
*
5
48
*
0
95
*
21
36
34
Total Disorders Diagnosed 226194 206
Missouri Department of Mental Health, Division of Behavioral Health

Total Individuals Served
Housing Unknown
Other
Homeless
Independent Living
Dependent Living
HOUSING / LIVING ARRANGEMENT
Employment Status Unknown
Not in Labor Force
Unemployed
Employed
Referral Source Unknown
Other
Court / Criminal Justice
Health Care Provider
Mental Health Provider
School
Self / Family / Friend
Education Level Unknown
Bachelor or Advanced Degree
Associate Degree or Some College
High School Grad or G.E.D.
Less than High School Diploma
Commitment Type Unknown
Sexual Predatory
Criminal
Civil
Voluntary
TREATMENT REFERRAL SOURCE
EMPLOYMENT
EDUCATION
TYPE OF COMMITMENT
Age Unknown
55 to 59
50 to 54
60 and Over
30 to 34
25 to 29
18 to 24
14 to 17
10 to 13
6 to 9
Under 6
40 to 44
35 to 39
45 to 49
AGE
Hearing Impaired
Past or Current Military Service11
18
Race/Ethnicity Unknown
Other Race
Hispanic
Asian / Pacific Islander
Native American / Alaskan
African American
Caucasian
0
37
15
0
*
63
564
GENDERMale
Female 296
369
Diagnosis Unknown
Other Disorders
Sexual Disorders
Schizophrenia and Psychotic Disorders
Personality Disorders
Depressive Mood Disorders
Impulse Control and Conduct DisordersDevelopmental and Age Related Disorders
Trauma and Stress Related Disorders
Anxiety and Fear Disorders
Bipolar Mood Disorders
DIAGNOSIS CATEGORY
The profiles below summarize individuals who received clinical services from the Division of Behavioral Health psychiatric programs.Individuals are counted only once based on their first treatment episode of the fiscal year. Information that was not reported is listed asunknown. An asterisk (*) in a data cell indicates the count was fewer than five (5) and suppressed to avoid disclosing identifying information.
53
64
53
*
26
54
70
53
58
66
61
57
48
15
Central
44,889
44,332
CALLAWAY COUNTY
267
189
70
17
13
124
16
513
*
50
11
85
140
252
126
97
109
136
42
135
357
*
35
38
8
51
10
22
18
123
65
96
200
104
96
101
115
42
100
8
*
29
53
68
36
49
61
59
#Name?
Page G-015
MENTAL ILLNESS TREATMENT SERVICES -- DIVISION OF BEHAVIORAL HEALTH
FY2018 FY2017
RACE / ETHNICITY
TREATMENT ACCOMMODATION
2019 Status Report on Missouri's Substance Use and Mental Health
4137
123
452 50357
52
47
58
41
121
47
0
665613NUMBER SERVED
PLANNING REGION
PSYCHIATRIC SERVICE AREA
2018 POPULATION ESTIMATE
CENSUS 2010
FY2019 FY2018 FY2017
Individuals who received psychiatric services had the following types ofdisorders. The total number of diagnoses is larger than the numberserved because some individuals had more than one type of disorder.
441
26
*
*
10
289
216
49
23
30
0
36
577
*
34
387
*
72
48
97
56
0
45
*
71
119
207
111
99
103
119
42
105
8
49
24
50
217
10
251
95
8
197 236
139 75
FY2018 FY2017
356
257
Gender Unknown 00
000
0
232
341
573
36
48
41
49
56
0
31
FY2019
12
18
16
*
0
73
468
60
50
46
34
65
54
32
*
FY2019
163
193
6
34
177
0
46
130
383
52
145
15
30
69
9
35
33
*
294
60
*
466
16
49
265
191
Total Disorders Diagnosed 1,173964 1,033
Missouri Department of Mental Health, Division of Behavioral Health

Total Individuals Served
Housing Unknown
Other
Homeless
Independent Living
Dependent Living
HOUSING / LIVING ARRANGEMENT
Employment Status Unknown
Not in Labor Force
Unemployed
Employed
Referral Source Unknown
Other
Court / Criminal Justice
Health Care Provider
Mental Health Provider
School
Self / Family / Friend
Education Level Unknown
Bachelor or Advanced Degree
Associate Degree or Some College
High School Grad or G.E.D.
Less than High School Diploma
Commitment Type Unknown
Sexual Predatory
Criminal
Civil
Voluntary
TREATMENT REFERRAL SOURCE
EMPLOYMENT
EDUCATION
TYPE OF COMMITMENT
Age Unknown
55 to 59
50 to 54
60 and Over
30 to 34
25 to 29
18 to 24
14 to 17
10 to 13
6 to 9
Under 6
40 to 44
35 to 39
45 to 49
AGE
Hearing Impaired
Past or Current Military Service*
7
Race/Ethnicity Unknown
Other Race
Hispanic
Asian / Pacific Islander
Native American / Alaskan
African American
Caucasian
0
12
6
*
*
*
387
GENDERMale
Female 252
154
Diagnosis Unknown
Other Disorders
Sexual Disorders
Schizophrenia and Psychotic Disorders
Personality Disorders
Depressive Mood Disorders
Impulse Control and Conduct DisordersDevelopmental and Age Related Disorders
Trauma and Stress Related Disorders
Anxiety and Fear Disorders
Bipolar Mood Disorders
DIAGNOSIS CATEGORY
The profiles below summarize individuals who received clinical services from the Division of Behavioral Health psychiatric programs.Individuals are counted only once based on their first treatment episode of the fiscal year. Information that was not reported is listed asunknown. An asterisk (*) in a data cell indicates the count was fewer than five (5) and suppressed to avoid disclosing identifying information.
40
34
29
6
33
41
46
23
21
27
26
53
27
11
Central
45,815
44,002
CAMDEN COUNTY
205
122
50
10
14
29
7
419
0
*
6
145
66
195
47
39
14
30
0
97
267
*
39
69
*
37
*
13
12
36
144
67
219
55
43
9
36
0
88
0
8
34
48
39
29
26
23
25
#Name?
Page G-016
MENTAL ILLNESS TREATMENT SERVICES -- DIVISION OF BEHAVIORAL HEALTH
FY2018 FY2017
RACE / ETHNICITY
TREATMENT ACCOMMODATION
2019 Status Report on Missouri's Substance Use and Mental Health
*41
19
358 34533
23
47
54
32
*
0
0
406421NUMBER SERVED
PLANNING REGION
PSYCHIATRIC SERVICE AREA
2018 POPULATION ESTIMATE
CENSUS 2010
FY2019 FY2018 FY2017
Individuals who received psychiatric services had the following types ofdisorders. The total number of diagnoses is larger than the numberserved because some individuals had more than one type of disorder.
397
5
0
*
8
209
122
57
13
17
0
20
403
*
*
274
*
8
68
10
42
0
0
*
126
62
201
45
39
12
26
0
88
*
30
20
32
232
5
225
34
8
140 134
12 5
FY2018 FY2017
170
251
Gender Unknown 00
000
0
302
206
508
39
45
51
36
37
0
24
FY2019
9
6
13
*
*
10
472
38
32
38
37
59
59
29
8
FY2019
35
161
10
39
263
0
0
*
400
50
67
20
21
87
*
70
35
*
306
*
*
501
5
74
228
151
Total Disorders Diagnosed 637702 630
Missouri Department of Mental Health, Division of Behavioral Health

Total Individuals Served
Housing Unknown
Other
Homeless
Independent Living
Dependent Living
HOUSING / LIVING ARRANGEMENT
Employment Status Unknown
Not in Labor Force
Unemployed
Employed
Referral Source Unknown
Other
Court / Criminal Justice
Health Care Provider
Mental Health Provider
School
Self / Family / Friend
Education Level Unknown
Bachelor or Advanced Degree
Associate Degree or Some College
High School Grad or G.E.D.
Less than High School Diploma
Commitment Type Unknown
Sexual Predatory
Criminal
Civil
Voluntary
TREATMENT REFERRAL SOURCE
EMPLOYMENT
EDUCATION
TYPE OF COMMITMENT
Age Unknown
55 to 59
50 to 54
60 and Over
30 to 34
25 to 29
18 to 24
14 to 17
10 to 13
6 to 9
Under 6
40 to 44
35 to 39
45 to 49
AGE
Hearing Impaired
Past or Current Military Service13
35
Race/Ethnicity Unknown
Other Race
Hispanic
Asian / Pacific Islander
Native American / Alaskan
African American
Caucasian
0
156
48
*
*
233
1,453
GENDERMale
Female 1,062
784
Diagnosis Unknown
Other Disorders
Sexual Disorders
Schizophrenia and Psychotic Disorders
Personality Disorders
Depressive Mood Disorders
Impulse Control and Conduct DisordersDevelopmental and Age Related Disorders
Trauma and Stress Related Disorders
Anxiety and Fear Disorders
Bipolar Mood Disorders
DIAGNOSIS CATEGORY
The profiles below summarize individuals who received clinical services from the Division of Behavioral Health psychiatric programs.Individuals are counted only once based on their first treatment episode of the fiscal year. Information that was not reported is listed asunknown. An asterisk (*) in a data cell indicates the count was fewer than five (5) and suppressed to avoid disclosing identifying information.
162
172
130
5
74
133
124
204
152
182
193
163
152
21
Southeast
78,753
75,674
CAPE GIRARDEAU COUNTY
488
409
206
72
271
226
29
1,567
0
11
23
304
355
669
206
108
64
232
*
185
1,052
67
65
216
76
98
15
357
303
295
194
276
564
152
115
47
169
*
158
7
8
64
88
104
174
134
149
160
#Name?
Page G-017
MENTAL ILLNESS TREATMENT SERVICES -- DIVISION OF BEHAVIORAL HEALTH
FY2018 FY2017
RACE / ETHNICITY
TREATMENT ACCOMMODATION
2019 Status Report on Missouri's Substance Use and Mental Health
317107
670
786 890163
120
147
145
129
11
0
7
1,8461,585NUMBER SERVED
PLANNING REGION
PSYCHIATRIC SERVICE AREA
2018 POPULATION ESTIMATE
CENSUS 2010
FY2019 FY2018 FY2017
Individuals who received psychiatric services had the following types ofdisorders. The total number of diagnoses is larger than the numberserved because some individuals had more than one type of disorder.
1,234
199
*
*
44
466
364
187
74
137
0
494
1,826
0
17
1,253
58
74
256
86
119
0
0
*
276
319
663
160
111
56
214
*
170
7
186
302
76
1,083
38
1,277
74
28
316 436
72 31
FY2018 FY2017
686
899
Gender Unknown 00
000
0
704
632
1,336
90
108
110
118
150
0
120
FY2019
36
23
30
*
*
193
1,021
108
146
120
132
96
93
59
6
FY2019
44
320
32
100
841
6
0
6
704
320
144
229
259
66
63
155
50
46
950
8
*
1,321
54
142
467
353
Total Disorders Diagnosed 2,4571,791 2,163
Missouri Department of Mental Health, Division of Behavioral Health

Total Individuals Served
Housing Unknown
Other
Homeless
Independent Living
Dependent Living
HOUSING / LIVING ARRANGEMENT
Employment Status Unknown
Not in Labor Force
Unemployed
Employed
Referral Source Unknown
Other
Court / Criminal Justice
Health Care Provider
Mental Health Provider
School
Self / Family / Friend
Education Level Unknown
Bachelor or Advanced Degree
Associate Degree or Some College
High School Grad or G.E.D.
Less than High School Diploma
Commitment Type Unknown
Sexual Predatory
Criminal
Civil
Voluntary
TREATMENT REFERRAL SOURCE
EMPLOYMENT
EDUCATION
TYPE OF COMMITMENT
Age Unknown
55 to 59
50 to 54
60 and Over
30 to 34
25 to 29
18 to 24
14 to 17
10 to 13
6 to 9
Under 6
40 to 44
35 to 39
45 to 49
AGE
Hearing Impaired
Past or Current Military Service0
*
Race/Ethnicity Unknown
Other Race
Hispanic
Asian / Pacific Islander
Native American / Alaskan
African American
Caucasian
0
*
*
0
0
6
133
GENDERMale
Female 71
69
Diagnosis Unknown
Other Disorders
Sexual Disorders
Schizophrenia and Psychotic Disorders
Personality Disorders
Depressive Mood Disorders
Impulse Control and Conduct DisordersDevelopmental and Age Related Disorders
Trauma and Stress Related Disorders
Anxiety and Fear Disorders
Bipolar Mood Disorders
DIAGNOSIS CATEGORY
The profiles below summarize individuals who received clinical services from the Division of Behavioral Health psychiatric programs.Individuals are counted only once based on their first treatment episode of the fiscal year. Information that was not reported is listed asunknown. An asterisk (*) in a data cell indicates the count was fewer than five (5) and suppressed to avoid disclosing identifying information.
16
8
8
*
10
16
17
7
8
10
17
11
11
12
Central
8,743
9,295
CARROLL COUNTY
60
65
11
*
*
6
*
160
0
0
*
64
33
85
48
22
18
28
0
59
98
*
16
27
7
11
6
*
6
7
68
29
95
41
26
14
26
0
59
5
*
11
25
19
7
10
11
20
#Name?
Page G-018
MENTAL ILLNESS TREATMENT SERVICES -- DIVISION OF BEHAVIORAL HEALTH
FY2018 FY2017
RACE / ETHNICITY
TREATMENT ACCOMMODATION
2019 Status Report on Missouri's Substance Use and Mental Health
0*
*
150 12314
5
12
13
10
0
0
*
140161NUMBER SERVED
PLANNING REGION
PSYCHIATRIC SERVICE AREA
2018 POPULATION ESTIMATE
CENSUS 2010
FY2019 FY2018 FY2017
Individuals who received psychiatric services had the following types ofdisorders. The total number of diagnoses is larger than the numberserved because some individuals had more than one type of disorder.
153
6
0
0
*
95
47
14
*
*
0
*
140
0
0
85
*
14
30
5
5
0
0
0
71
32
101
48
30
16
29
0
63
5
*
*
16
79
*
71
24
0
61 45
* 0
FY2018 FY2017
66
95
Gender Unknown 00
000
0
93
55
148
10
12
10
8
14
0
6
FY2019
*
*
*
0
0
5
137
19
7
7
8
21
19
11
*
FY2019
*
53
*
11
80
0
0
0
132
*
11
*
*
11
*
27
13
*
91
0
0
148
*
13
87
43
Total Disorders Diagnosed 363367 397
Missouri Department of Mental Health, Division of Behavioral Health

Total Individuals Served
Housing Unknown
Other
Homeless
Independent Living
Dependent Living
HOUSING / LIVING ARRANGEMENT
Employment Status Unknown
Not in Labor Force
Unemployed
Employed
Referral Source Unknown
Other
Court / Criminal Justice
Health Care Provider
Mental Health Provider
School
Self / Family / Friend
Education Level Unknown
Bachelor or Advanced Degree
Associate Degree or Some College
High School Grad or G.E.D.
Less than High School Diploma
Commitment Type Unknown
Sexual Predatory
Criminal
Civil
Voluntary
TREATMENT REFERRAL SOURCE
EMPLOYMENT
EDUCATION
TYPE OF COMMITMENT
Age Unknown
55 to 59
50 to 54
60 and Over
30 to 34
25 to 29
18 to 24
14 to 17
10 to 13
6 to 9
Under 6
40 to 44
35 to 39
45 to 49
AGE
Hearing Impaired
Past or Current Military Service0
*
Race/Ethnicity Unknown
Other Race
Hispanic
Asian / Pacific Islander
Native American / Alaskan
African American
Caucasian
0
0
0
0
0
0
74
GENDERMale
Female 50
24
Diagnosis Unknown
Other Disorders
Sexual Disorders
Schizophrenia and Psychotic Disorders
Personality Disorders
Depressive Mood Disorders
Impulse Control and Conduct DisordersDevelopmental and Age Related Disorders
Trauma and Stress Related Disorders
Anxiety and Fear Disorders
Bipolar Mood Disorders
DIAGNOSIS CATEGORY
The profiles below summarize individuals who received clinical services from the Division of Behavioral Health psychiatric programs.Individuals are counted only once based on their first treatment episode of the fiscal year. Information that was not reported is listed asunknown. An asterisk (*) in a data cell indicates the count was fewer than five (5) and suppressed to avoid disclosing identifying information.
7
9
10
*
*
*
5
*
*
*
12
10
8
19
Southeast
6,054
6,265
CARTER COUNTY
35
31
6
*
5
7
*
71
0
0
*
15
24
31
*
*
6
18
0
13
37
0
10
18
*
5
*
*
6
11
22
16
38
5
8
*
16
*
17
0
0
*
*
5
*
*
6
15
#Name?
Page G-019
MENTAL ILLNESS TREATMENT SERVICES -- DIVISION OF BEHAVIORAL HEALTH
FY2018 FY2017
RACE / ETHNICITY
TREATMENT ACCOMMODATION
2019 Status Report on Missouri's Substance Use and Mental Health
0*
*
58 567
13
5
7
7
0
0
0
7471NUMBER SERVED
PLANNING REGION
PSYCHIATRIC SERVICE AREA
2018 POPULATION ESTIMATE
CENSUS 2010
FY2019 FY2018 FY2017
Individuals who received psychiatric services had the following types ofdisorders. The total number of diagnoses is larger than the numberserved because some individuals had more than one type of disorder.
71
0
0
0
0
28
31
6
0
0
0
6
72
*
*
33
0
8
24
*
6
0
0
0
17
18
33
*
*
*
18
0
10
0
*
*
*
58
0
63
*
0
8 10
* 0
FY2018 FY2017
26
45
Gender Unknown 00
000
0
54
33
87
6
7
10
12
9
0
0
FY2019
*
*
0
0
0
0
87
14
*
5
*
7
6
*
*
FY2019
0
22
*
*
60
0
0
0
75
*
7
*
*
5
*
19
9
0
53
0
0
87
0
8
42
35
Total Disorders Diagnosed 114127 108
Missouri Department of Mental Health, Division of Behavioral Health

Total Individuals Served
Housing Unknown
Other
Homeless
Independent Living
Dependent Living
HOUSING / LIVING ARRANGEMENT
Employment Status Unknown
Not in Labor Force
Unemployed
Employed
Referral Source Unknown
Other
Court / Criminal Justice
Health Care Provider
Mental Health Provider
School
Self / Family / Friend
Education Level Unknown
Bachelor or Advanced Degree
Associate Degree or Some College
High School Grad or G.E.D.
Less than High School Diploma
Commitment Type Unknown
Sexual Predatory
Criminal
Civil
Voluntary
TREATMENT REFERRAL SOURCE
EMPLOYMENT
EDUCATION
TYPE OF COMMITMENT
Age Unknown
55 to 59
50 to 54
60 and Over
30 to 34
25 to 29
18 to 24
14 to 17
10 to 13
6 to 9
Under 6
40 to 44
35 to 39
45 to 49
AGE
Hearing Impaired
Past or Current Military Service7
24
Race/Ethnicity Unknown
Other Race
Hispanic
Asian / Pacific Islander
Native American / Alaskan
African American
Caucasian
0
46
24
*
*
38
802
GENDERMale
Female 498
395
Diagnosis Unknown
Other Disorders
Sexual Disorders
Schizophrenia and Psychotic Disorders
Personality Disorders
Depressive Mood Disorders
Impulse Control and Conduct DisordersDevelopmental and Age Related Disorders
Trauma and Stress Related Disorders
Anxiety and Fear Disorders
Bipolar Mood Disorders
DIAGNOSIS CATEGORY
The profiles below summarize individuals who received clinical services from the Division of Behavioral Health psychiatric programs.Individuals are counted only once based on their first treatment episode of the fiscal year. Information that was not reported is listed asunknown. An asterisk (*) in a data cell indicates the count was fewer than five (5) and suppressed to avoid disclosing identifying information.
73
70
58
15
74
79
84
96
65
69
60
87
63
7
Northwest
104,954
99,478
CASS COUNTY
387
264
99
26
37
111
22
875
0
6
8
265
183
380
166
83
29
96
*
176
625
*
93
104
*
47
14
43
33
110
306
160
444
199
84
22
94
*
229
12
11
79
81
97
94
53
61
72
#Name?
Page G-020
MENTAL ILLNESS TREATMENT SERVICES -- DIVISION OF BEHAVIORAL HEALTH
FY2018 FY2017
RACE / ETHNICITY
TREATMENT ACCOMMODATION
2019 Status Report on Missouri's Substance Use and Mental Health
1773
125
689 71563
59
81
70
61
5
*
0
893882NUMBER SERVED
PLANNING REGION
PSYCHIATRIC SERVICE AREA
2018 POPULATION ESTIMATE
CENSUS 2010
FY2019 FY2018 FY2017
Individuals who received psychiatric services had the following types ofdisorders. The total number of diagnoses is larger than the numberserved because some individuals had more than one type of disorder.
786
33
5
5
23
371
278
106
27
48
0
100
880
0
8
674
*
22
132
14
48
0
*
*
274
160
380
173
89
24
89
*
196
11
54
44
95
448
35
482
92
26
279 274
24 18
FY2018 FY2017
399
483
Gender Unknown 00
000
0
557
458
1,015
67
74
81
64
72
0
55
FY2019
9
20
41
6
5
47
902
83
69
63
98
117
116
95
16
FY2019
72
343
42
109
449
0
*
6
773
178
142
48
52
131
*
107
116
*
650
5
0
1,009
28
103
410
296
Total Disorders Diagnosed 1,4111,625 1,454
Missouri Department of Mental Health, Division of Behavioral Health

Total Individuals Served
Housing Unknown
Other
Homeless
Independent Living
Dependent Living
HOUSING / LIVING ARRANGEMENT
Employment Status Unknown
Not in Labor Force
Unemployed
Employed
Referral Source Unknown
Other
Court / Criminal Justice
Health Care Provider
Mental Health Provider
School
Self / Family / Friend
Education Level Unknown
Bachelor or Advanced Degree
Associate Degree or Some College
High School Grad or G.E.D.
Less than High School Diploma
Commitment Type Unknown
Sexual Predatory
Criminal
Civil
Voluntary
TREATMENT REFERRAL SOURCE
EMPLOYMENT
EDUCATION
TYPE OF COMMITMENT
Age Unknown
55 to 59
50 to 54
60 and Over
30 to 34
25 to 29
18 to 24
14 to 17
10 to 13
6 to 9
Under 6
40 to 44
35 to 39
45 to 49
AGE
Hearing Impaired
Past or Current Military Service0
6
Race/Ethnicity Unknown
Other Race
Hispanic
Asian / Pacific Islander
Native American / Alaskan
African American
Caucasian
0
*
*
0
*
*
206
GENDERMale
Female 121
91
Diagnosis Unknown
Other Disorders
Sexual Disorders
Schizophrenia and Psychotic Disorders
Personality Disorders
Depressive Mood Disorders
Impulse Control and Conduct DisordersDevelopmental and Age Related Disorders
Trauma and Stress Related Disorders
Anxiety and Fear Disorders
Bipolar Mood Disorders
DIAGNOSIS CATEGORY
The profiles below summarize individuals who received clinical services from the Division of Behavioral Health psychiatric programs.Individuals are counted only once based on their first treatment episode of the fiscal year. Information that was not reported is listed asunknown. An asterisk (*) in a data cell indicates the count was fewer than five (5) and suppressed to avoid disclosing identifying information.
22
25
16
0
16
16
14
14
17
17
20
15
20
8B
Southwest
14,165
13,982
CEDAR COUNTY
86
91
21
*
9
25
*
240
*
*
*
62
45
100
16
19
13
35
*
44
195
*
13
21
*
11
*
6
8
22
85
49
127
12
16
10
34
0
58
*
0
13
23
21
15
23
16
26
#Name?
Page G-021
MENTAL ILLNESS TREATMENT SERVICES -- DIVISION OF BEHAVIORAL HEALTH
FY2018 FY2017
RACE / ETHNICITY
TREATMENT ACCOMMODATION
2019 Status Report on Missouri's Substance Use and Mental Health
*14
12
206 17635
11
21
18
21
*
0
*
212243NUMBER SERVED
PLANNING REGION
PSYCHIATRIC SERVICE AREA
2018 POPULATION ESTIMATE
CENSUS 2010
FY2019 FY2018 FY2017
Individuals who received psychiatric services had the following types ofdisorders. The total number of diagnoses is larger than the numberserved because some individuals had more than one type of disorder.
235
*
*
0
*
104
96
25
6
*
0
12
211
0
*
164
*
12
19
*
12
0
0
0
74
50
115
14
23
11
35
0
60
*
*
*
27
131
9
110
27
6
71 65
5 *
FY2018 FY2017
109
134
Gender Unknown 00
000
0
133
117
250
21
19
22
14
33
0
5
FY2019
*
*
*
0
*
*
241
30
19
26
18
18
16
12
*
FY2019
13
67
13
31
126
*
0
0
196
19
32
10
12
26
*
23
13
*
185
*
0
248
5
30
90
106
Total Disorders Diagnosed 338406 386
Missouri Department of Mental Health, Division of Behavioral Health

Total Individuals Served
Housing Unknown
Other
Homeless
Independent Living
Dependent Living
HOUSING / LIVING ARRANGEMENT
Employment Status Unknown
Not in Labor Force
Unemployed
Employed
Referral Source Unknown
Other
Court / Criminal Justice
Health Care Provider
Mental Health Provider
School
Self / Family / Friend
Education Level Unknown
Bachelor or Advanced Degree
Associate Degree or Some College
High School Grad or G.E.D.
Less than High School Diploma
Commitment Type Unknown
Sexual Predatory
Criminal
Civil
Voluntary
TREATMENT REFERRAL SOURCE
EMPLOYMENT
EDUCATION
TYPE OF COMMITMENT
Age Unknown
55 to 59
50 to 54
60 and Over
30 to 34
25 to 29
18 to 24
14 to 17
10 to 13
6 to 9
Under 6
40 to 44
35 to 39
45 to 49
AGE
Hearing Impaired
Past or Current Military Service0
*
Race/Ethnicity Unknown
Other Race
Hispanic
Asian / Pacific Islander
Native American / Alaskan
African American
Caucasian
0
0
0
0
0
*
61
GENDERMale
Female 38
25
Diagnosis Unknown
Other Disorders
Sexual Disorders
Schizophrenia and Psychotic Disorders
Personality Disorders
Depressive Mood Disorders
Impulse Control and Conduct DisordersDevelopmental and Age Related Disorders
Trauma and Stress Related Disorders
Anxiety and Fear Disorders
Bipolar Mood Disorders
DIAGNOSIS CATEGORY
The profiles below summarize individuals who received clinical services from the Division of Behavioral Health psychiatric programs.Individuals are counted only once based on their first treatment episode of the fiscal year. Information that was not reported is listed asunknown. An asterisk (*) in a data cell indicates the count was fewer than five (5) and suppressed to avoid disclosing identifying information.
7
8
*
0
6
9
10
5
*
*
*
*
*
12
Central
7,451
7,831
CHARITON COUNTY
35
14
9
*
0
*
*
63
*
0
*
16
14
32
15
7
*
8
0
21
49
0
*
7
*
*
0
*
*
0
14
11
22
10
7
*
*
0
29
0
*
6
11
12
5
*
*
*
#Name?
Page G-022
MENTAL ILLNESS TREATMENT SERVICES -- DIVISION OF BEHAVIORAL HEALTH
FY2018 FY2017
RACE / ETHNICITY
TREATMENT ACCOMMODATION
2019 Status Report on Missouri's Substance Use and Mental Health
0*
*
62 609
*
*
5
*
*
0
0
6364NUMBER SERVED
PLANNING REGION
PSYCHIATRIC SERVICE AREA
2018 POPULATION ESTIMATE
CENSUS 2010
FY2019 FY2018 FY2017
Individuals who received psychiatric services had the following types ofdisorders. The total number of diagnoses is larger than the numberserved because some individuals had more than one type of disorder.
61
*
0
0
0
38
18
7
*
*
0
0
62
*
0
49
0
*
8
*
*
0
0
0
17
12
26
10
6
*
*
0
25
0
*
*
6
29
0
27
9
*
28 25
* 0
FY2018 FY2017
23
41
Gender Unknown 00
000
0
35
29
64
*
*
6
7
6
0
0
FY2019
*
*
0
0
0
*
63
*
*
0
6
10
9
6
*
FY2019
0
29
0
10
25
0
0
*
57
5
6
0
*
6
*
6
*
*
46
*
0
63
*
*
38
16
Total Disorders Diagnosed 115100 102
Missouri Department of Mental Health, Division of Behavioral Health

Total Individuals Served
Housing Unknown
Other
Homeless
Independent Living
Dependent Living
HOUSING / LIVING ARRANGEMENT
Employment Status Unknown
Not in Labor Force
Unemployed
Employed
Referral Source Unknown
Other
Court / Criminal Justice
Health Care Provider
Mental Health Provider
School
Self / Family / Friend
Education Level Unknown
Bachelor or Advanced Degree
Associate Degree or Some College
High School Grad or G.E.D.
Less than High School Diploma
Commitment Type Unknown
Sexual Predatory
Criminal
Civil
Voluntary
TREATMENT REFERRAL SOURCE
EMPLOYMENT
EDUCATION
TYPE OF COMMITMENT
Age Unknown
55 to 59
50 to 54
60 and Over
30 to 34
25 to 29
18 to 24
14 to 17
10 to 13
6 to 9
Under 6
40 to 44
35 to 39
45 to 49
AGE
Hearing Impaired
Past or Current Military Service*
12
Race/Ethnicity Unknown
Other Race
Hispanic
Asian / Pacific Islander
Native American / Alaskan
African American
Caucasian
0
37
11
*
*
7
314
GENDERMale
Female 182
179
Diagnosis Unknown
Other Disorders
Sexual Disorders
Schizophrenia and Psychotic Disorders
Personality Disorders
Depressive Mood Disorders
Impulse Control and Conduct DisordersDevelopmental and Age Related Disorders
Trauma and Stress Related Disorders
Anxiety and Fear Disorders
Bipolar Mood Disorders
DIAGNOSIS CATEGORY
The profiles below summarize individuals who received clinical services from the Division of Behavioral Health psychiatric programs.Individuals are counted only once based on their first treatment episode of the fiscal year. Information that was not reported is listed asunknown. An asterisk (*) in a data cell indicates the count was fewer than five (5) and suppressed to avoid disclosing identifying information.
25
42
21
16
36
43
25
19
15
27
28
34
30
10
Southwest
86,983
77,422
CHRISTIAN COUNTY
170
92
68
14
11
56
8
319
0
*
*
123
90
122
78
74
48
79
*
101
120
*
24
111
13
51
5
12
9
34
132
58
150
91
73
31
53
*
114
7
20
26
32
18
24
18
21
23
#Name?
Page G-023
MENTAL ILLNESS TREATMENT SERVICES -- DIVISION OF BEHAVIORAL HEALTH
FY2018 FY2017
RACE / ETHNICITY
TREATMENT ACCOMMODATION
2019 Status Report on Missouri's Substance Use and Mental Health
3370
17
245 30632
22
25
36
27
*
0
*
361324NUMBER SERVED
PLANNING REGION
PSYCHIATRIC SERVICE AREA
2018 POPULATION ESTIMATE
CENSUS 2010
FY2019 FY2018 FY2017
Individuals who received psychiatric services had the following types ofdisorders. The total number of diagnoses is larger than the numberserved because some individuals had more than one type of disorder.
279
*
*
*
11
138
83
66
11
36
0
26
358
0
*
137
*
27
118
13
63
0
0
*
139
73
131
64
64
44
66
*
107
6
18
12
32
144
5
152
30
*
122 158
21 17
FY2018 FY2017
164
160
Gender Unknown 00
000
0
211
209
420
21
26
19
27
22
0
35
FY2019
6
6
14
*
*
9
371
23
22
16
25
61
76
66
16
FY2019
37
228
8
41
107
*
0
6
314
122
74
15
17
67
8
96
23
56
165
6
0
413
12
44
176
66
Total Disorders Diagnosed 754781 713
Missouri Department of Mental Health, Division of Behavioral Health

Total Individuals Served
Housing Unknown
Other
Homeless
Independent Living
Dependent Living
HOUSING / LIVING ARRANGEMENT
Employment Status Unknown
Not in Labor Force
Unemployed
Employed
Referral Source Unknown
Other
Court / Criminal Justice
Health Care Provider
Mental Health Provider
School
Self / Family / Friend
Education Level Unknown
Bachelor or Advanced Degree
Associate Degree or Some College
High School Grad or G.E.D.
Less than High School Diploma
Commitment Type Unknown
Sexual Predatory
Criminal
Civil
Voluntary
TREATMENT REFERRAL SOURCE
EMPLOYMENT
EDUCATION
TYPE OF COMMITMENT
Age Unknown
55 to 59
50 to 54
60 and Over
30 to 34
25 to 29
18 to 24
14 to 17
10 to 13
6 to 9
Under 6
40 to 44
35 to 39
45 to 49
AGE
Hearing Impaired
Past or Current Military Service0
0
Race/Ethnicity Unknown
Other Race
Hispanic
Asian / Pacific Islander
Native American / Alaskan
African American
Caucasian
0
*
0
0
0
*
72
GENDERMale
Female 48
30
Diagnosis Unknown
Other Disorders
Sexual Disorders
Schizophrenia and Psychotic Disorders
Personality Disorders
Depressive Mood Disorders
Impulse Control and Conduct DisordersDevelopmental and Age Related Disorders
Trauma and Stress Related Disorders
Anxiety and Fear Disorders
Bipolar Mood Disorders
DIAGNOSIS CATEGORY
The profiles below summarize individuals who received clinical services from the Division of Behavioral Health psychiatric programs.Individuals are counted only once based on their first treatment episode of the fiscal year. Information that was not reported is listed asunknown. An asterisk (*) in a data cell indicates the count was fewer than five (5) and suppressed to avoid disclosing identifying information.
*
*
*
*
10
20
8
6
6
*
*
5
5
14
Central
6,842
7,139
CLARK COUNTY
48
22
*
*
*
7
0
108
0
0
0
8
21
24
27
8
*
*
*
14
18
*
0
*
0
87
*
*
*
*
12
23
31
30
17
*
7
*
20
0
6
15
22
21
7
8
*
5
#Name?
Page G-024
MENTAL ILLNESS TREATMENT SERVICES -- DIVISION OF BEHAVIORAL HEALTH
FY2018 FY2017
RACE / ETHNICITY
TREATMENT ACCOMMODATION
2019 Status Report on Missouri's Substance Use and Mental Health
*0
*
96 70*
5
*
6
*
*
*
0
78109NUMBER SERVED
PLANNING REGION
PSYCHIATRIC SERVICE AREA
2018 POPULATION ESTIMATE
CENSUS 2010
FY2019 FY2018 FY2017
Individuals who received psychiatric services had the following types ofdisorders. The total number of diagnoses is larger than the numberserved because some individuals had more than one type of disorder.
100
*
0
0
*
69
21
10
*
6
0
8
77
0
0
10
*
0
*
*
61
0
*
0
14
27
37
36
16
*
*
*
18
0
0
*
*
40
0
35
*
0
61 41
* 0
FY2018 FY2017
47
62
Gender Unknown 00
000
0
64
43
107
*
5
6
*
*
0
6
FY2019
0
0
0
0
0
*
99
*
*
8
6
16
23
16
11
FY2019
*
69
0
*
30
0
*
*
99
6
7
*
0
93
0
*
0
0
12
0
0
106
*
6
73
21
Total Disorders Diagnosed 112143 156
Missouri Department of Mental Health, Division of Behavioral Health

Total Individuals Served
Housing Unknown
Other
Homeless
Independent Living
Dependent Living
HOUSING / LIVING ARRANGEMENT
Employment Status Unknown
Not in Labor Force
Unemployed
Employed
Referral Source Unknown
Other
Court / Criminal Justice
Health Care Provider
Mental Health Provider
School
Self / Family / Friend
Education Level Unknown
Bachelor or Advanced Degree
Associate Degree or Some College
High School Grad or G.E.D.
Less than High School Diploma
Commitment Type Unknown
Sexual Predatory
Criminal
Civil
Voluntary
TREATMENT REFERRAL SOURCE
EMPLOYMENT
EDUCATION
TYPE OF COMMITMENT
Age Unknown
55 to 59
50 to 54
60 and Over
30 to 34
25 to 29
18 to 24
14 to 17
10 to 13
6 to 9
Under 6
40 to 44
35 to 39
45 to 49
AGE
Hearing Impaired
Past or Current Military Service17
38
Race/Ethnicity Unknown
Other Race
Hispanic
Asian / Pacific Islander
Native American / Alaskan
African American
Caucasian
0
245
128
11
13
203
2,257
GENDERMale
Female 1,587
1,142
Diagnosis Unknown
Other Disorders
Sexual Disorders
Schizophrenia and Psychotic Disorders
Personality Disorders
Depressive Mood Disorders
Impulse Control and Conduct DisordersDevelopmental and Age Related Disorders
Trauma and Stress Related Disorders
Anxiety and Fear Disorders
Bipolar Mood Disorders
DIAGNOSIS CATEGORY
The profiles below summarize individuals who received clinical services from the Division of Behavioral Health psychiatric programs.Individuals are counted only once based on their first treatment episode of the fiscal year. Information that was not reported is listed asunknown. An asterisk (*) in a data cell indicates the count was fewer than five (5) and suppressed to avoid disclosing identifying information.
222
258
196
25
135
176
216
238
228
247
269
289
230
6
Northwest
246,365
221,939
CLAY COUNTY
844
898
542
178
188
253
34
2,761
0
10
11
1,126
907
1,504
567
234
566
434
6
871
2,595
39
30
83
*
26
259
149
191
227
1,061
817
1,398
469
197
456
449
5
843
154
5
115
182
166
263
228
207
323
#Name?
Page G-025
MENTAL ILLNESS TREATMENT SERVICES -- DIVISION OF BEHAVIORAL HEALTH
FY2018 FY2017
RACE / ETHNICITY
TREATMENT ACCOMMODATION
2019 Status Report on Missouri's Substance Use and Mental Health
72106
269
2,185 2,164264
227
255
293
257
8
*
13
2,7292,785NUMBER SERVED
PLANNING REGION
PSYCHIATRIC SERVICE AREA
2018 POPULATION ESTIMATE
CENSUS 2010
FY2019 FY2018 FY2017
Individuals who received psychiatric services had the following types ofdisorders. The total number of diagnoses is larger than the numberserved because some individuals had more than one type of disorder.
2,292
181
14
15
139
806
936
562
206
276
0
275
2,712
*
11
2,505
39
32
96
18
35
*
*
*
1,066
850
1,502
499
187
499
448
*
870
203
132
159
395
1,705
61
1,674
327
65
504 591
120 61
FY2018 FY2017
1,175
1,610
Gender Unknown 00
000
0
1,471
1,089
2,560
245
244
226
208
230
0
234
FY2019
46
26
121
16
11
199
2,100
338
194
197
216
186
171
95
10
FY2019
112
488
68
360
1,532
10
*
7
2,044
201
215
166
135
27
*
78
40
41
2,363
6
*
2,542
193
489
767
910
Total Disorders Diagnosed 6,5465,955 6,260
Missouri Department of Mental Health, Division of Behavioral Health

Total Individuals Served
Housing Unknown
Other
Homeless
Independent Living
Dependent Living
HOUSING / LIVING ARRANGEMENT
Employment Status Unknown
Not in Labor Force
Unemployed
Employed
Referral Source Unknown
Other
Court / Criminal Justice
Health Care Provider
Mental Health Provider
School
Self / Family / Friend
Education Level Unknown
Bachelor or Advanced Degree
Associate Degree or Some College
High School Grad or G.E.D.
Less than High School Diploma
Commitment Type Unknown
Sexual Predatory
Criminal
Civil
Voluntary
TREATMENT REFERRAL SOURCE
EMPLOYMENT
EDUCATION
TYPE OF COMMITMENT
Age Unknown
55 to 59
50 to 54
60 and Over
30 to 34
25 to 29
18 to 24
14 to 17
10 to 13
6 to 9
Under 6
40 to 44
35 to 39
45 to 49
AGE
Hearing Impaired
Past or Current Military Service0
5
Race/Ethnicity Unknown
Other Race
Hispanic
Asian / Pacific Islander
Native American / Alaskan
African American
Caucasian
0
6
*
0
*
*
156
GENDERMale
Female 106
63
Diagnosis Unknown
Other Disorders
Sexual Disorders
Schizophrenia and Psychotic Disorders
Personality Disorders
Depressive Mood Disorders
Impulse Control and Conduct DisordersDevelopmental and Age Related Disorders
Trauma and Stress Related Disorders
Anxiety and Fear Disorders
Bipolar Mood Disorders
DIAGNOSIS CATEGORY
The profiles below summarize individuals who received clinical services from the Division of Behavioral Health psychiatric programs.Individuals are counted only once based on their first treatment episode of the fiscal year. Information that was not reported is listed asunknown. An asterisk (*) in a data cell indicates the count was fewer than five (5) and suppressed to avoid disclosing identifying information.
12
20
12
*
10
23
19
9
12
17
10
18
6
1
Northwest
20,470
20,743
CLINTON COUNTY
74
39
27
6
9
32
*
209
*
0
0
55
44
82
38
28
12
22
*
64
108
*
17
36
19
29
8
*
7
30
53
30
96
33
22
9
24
*
75
*
*
9
26
21
14
20
21
12
#Name?
Page G-026
MENTAL ILLNESS TREATMENT SERVICES -- DIVISION OF BEHAVIORAL HEALTH
FY2018 FY2017
RACE / ETHNICITY
TREATMENT ACCOMMODATION
2019 Status Report on Missouri's Substance Use and Mental Health
*35
24
146 12926
14
16
20
10
0
0
*
169212NUMBER SERVED
PLANNING REGION
PSYCHIATRIC SERVICE AREA
2018 POPULATION ESTIMATE
CENSUS 2010
FY2019 FY2018 FY2017
Individuals who received psychiatric services had the following types ofdisorders. The total number of diagnoses is larger than the numberserved because some individuals had more than one type of disorder.
197
*
*
0
5
81
72
31
7
9
0
21
167
*
0
80
*
11
42
11
23
0
0
0
58
37
90
32
27
6
26
*
71
*
26
25
13
126
9
88
21
6
61 53
* *
FY2018 FY2017
99
113
Gender Unknown 00
000
0
124
107
231
16
15
21
16
22
0
8
FY2019
*
*
*
0
*
*
218
11
23
15
37
22
25
7
*
FY2019
5
54
*
31
140
*
0
0
147
61
50
15
19
14
11
31
11
*
163
0
0
230
7
23
72
68
Total Disorders Diagnosed 355381 378
Missouri Department of Mental Health, Division of Behavioral Health

Total Individuals Served
Housing Unknown
Other
Homeless
Independent Living
Dependent Living
HOUSING / LIVING ARRANGEMENT
Employment Status Unknown
Not in Labor Force
Unemployed
Employed
Referral Source Unknown
Other
Court / Criminal Justice
Health Care Provider
Mental Health Provider
School
Self / Family / Friend
Education Level Unknown
Bachelor or Advanced Degree
Associate Degree or Some College
High School Grad or G.E.D.
Less than High School Diploma
Commitment Type Unknown
Sexual Predatory
Criminal
Civil
Voluntary
TREATMENT REFERRAL SOURCE
EMPLOYMENT
EDUCATION
TYPE OF COMMITMENT
Age Unknown
55 to 59
50 to 54
60 and Over
30 to 34
25 to 29
18 to 24
14 to 17
10 to 13
6 to 9
Under 6
40 to 44
35 to 39
45 to 49
AGE
Hearing Impaired
Past or Current Military Service12
21
Race/Ethnicity Unknown
Other Race
Hispanic
Asian / Pacific Islander
Native American / Alaskan
African American
Caucasian
0
61
20
0
*
151
587
GENDERMale
Female 428
372
Diagnosis Unknown
Other Disorders
Sexual Disorders
Schizophrenia and Psychotic Disorders
Personality Disorders
Depressive Mood Disorders
Impulse Control and Conduct DisordersDevelopmental and Age Related Disorders
Trauma and Stress Related Disorders
Anxiety and Fear Disorders
Bipolar Mood Disorders
DIAGNOSIS CATEGORY
The profiles below summarize individuals who received clinical services from the Division of Behavioral Health psychiatric programs.Individuals are counted only once based on their first treatment episode of the fiscal year. Information that was not reported is listed asunknown. An asterisk (*) in a data cell indicates the count was fewer than five (5) and suppressed to avoid disclosing identifying information.
76
53
61
12
77
85
63
42
39
60
71
90
71
11
Central
76,796
75,990
COLE COUNTY
354
230
127
38
33
79
19
896
*
9
13
169
172
266
118
67
76
187
5
161
616
*
98
98
16
71
10
28
24
83
191
169
317
122
62
80
183
5
209
15
13
92
106
99
62
46
64
92
#Name?
Page G-027
MENTAL ILLNESS TREATMENT SERVICES -- DIVISION OF BEHAVIORAL HEALTH
FY2018 FY2017
RACE / ETHNICITY
TREATMENT ACCOMMODATION
2019 Status Report on Missouri's Substance Use and Mental Health
1356
54
772 66860
58
74
82
63
10
*
*
800911NUMBER SERVED
PLANNING REGION
PSYCHIATRIC SERVICE AREA
2018 POPULATION ESTIMATE
CENSUS 2010
FY2019 FY2018 FY2017
Individuals who received psychiatric services had the following types ofdisorders. The total number of diagnoses is larger than the numberserved because some individuals had more than one type of disorder.
647
177
*
0
19
419
259
119
32
79
0
82
783
*
12
506
*
94
107
24
65
0
*
0
181
166
291
129
75
74
185
5
184
13
35
27
103
374
27
364
88
24
361 301
46 23
FY2018 FY2017
427
484
Gender Unknown 00
000
0
511
444
955
74
83
70
68
51
0
92
FY2019
19
18
40
0
*
190
672
102
59
48
71
102
128
80
19
FY2019
118
328
23
109
377
*
*
8
749
183
133
25
48
147
18
99
82
*
598
10
0
941
38
114
378
242
Total Disorders Diagnosed 1,2441,409 1,338
Missouri Department of Mental Health, Division of Behavioral Health

Total Individuals Served
Housing Unknown
Other
Homeless
Independent Living
Dependent Living
HOUSING / LIVING ARRANGEMENT
Employment Status Unknown
Not in Labor Force
Unemployed
Employed
Referral Source Unknown
Other
Court / Criminal Justice
Health Care Provider
Mental Health Provider
School
Self / Family / Friend
Education Level Unknown
Bachelor or Advanced Degree
Associate Degree or Some College
High School Grad or G.E.D.
Less than High School Diploma
Commitment Type Unknown
Sexual Predatory
Criminal
Civil
Voluntary
TREATMENT REFERRAL SOURCE
EMPLOYMENT
EDUCATION
TYPE OF COMMITMENT
Age Unknown
55 to 59
50 to 54
60 and Over
30 to 34
25 to 29
18 to 24
14 to 17
10 to 13
6 to 9
Under 6
40 to 44
35 to 39
45 to 49
AGE
Hearing Impaired
Past or Current Military Service*
*
Race/Ethnicity Unknown
Other Race
Hispanic
Asian / Pacific Islander
Native American / Alaskan
African American
Caucasian
0
7
*
0
*
11
121
GENDERMale
Female 85
56
Diagnosis Unknown
Other Disorders
Sexual Disorders
Schizophrenia and Psychotic Disorders
Personality Disorders
Depressive Mood Disorders
Impulse Control and Conduct DisordersDevelopmental and Age Related Disorders
Trauma and Stress Related Disorders
Anxiety and Fear Disorders
Bipolar Mood Disorders
DIAGNOSIS CATEGORY
The profiles below summarize individuals who received clinical services from the Division of Behavioral Health psychiatric programs.Individuals are counted only once based on their first treatment episode of the fiscal year. Information that was not reported is listed asunknown. An asterisk (*) in a data cell indicates the count was fewer than five (5) and suppressed to avoid disclosing identifying information.
14
18
9
0
*
8
10
13
12
16
16
16
8
12
Central
17,603
17,601
COOPER COUNTY
40
53
34
6
8
13
*
166
*
*
*
32
43
42
10
9
12
21
*
38
107
7
*
23
20
8
*
7
7
9
56
40
70
24
45
10
18
0
44
*
0
7
24
17
16
11
16
16
#Name?
Page G-028
MENTAL ILLNESS TREATMENT SERVICES -- DIVISION OF BEHAVIORAL HEALTH
FY2018 FY2017
RACE / ETHNICITY
TREATMENT ACCOMMODATION
2019 Status Report on Missouri's Substance Use and Mental Health
88
8
141 11819
12
9
16
7
*
0
*
141170NUMBER SERVED
PLANNING REGION
PSYCHIATRIC SERVICE AREA
2018 POPULATION ESTIMATE
CENSUS 2010
FY2019 FY2018 FY2017
Individuals who received psychiatric services had the following types ofdisorders. The total number of diagnoses is larger than the numberserved because some individuals had more than one type of disorder.
138
18
*
0
*
71
51
27
7
11
0
14
139
*
0
86
0
9
21
19
6
0
0
*
44
35
63
15
26
13
18
*
46
*
7
8
24
84
*
95
11
*
50 31
10 *
FY2018 FY2017
76
94
Gender Unknown 00
000
0
102
102
204
12
15
12
10
18
0
21
FY2019
*
*
6
0
*
16
165
10
9
12
10
28
37
23
8
FY2019
5
96
*
15
87
*
0
*
185
19
9
*
9
5
16
22
*
43
113
*
0
201
5
28
108
44
Total Disorders Diagnosed 218317 269
Missouri Department of Mental Health, Division of Behavioral Health

Total Individuals Served
Housing Unknown
Other
Homeless
Independent Living
Dependent Living
HOUSING / LIVING ARRANGEMENT
Employment Status Unknown
Not in Labor Force
Unemployed
Employed
Referral Source Unknown
Other
Court / Criminal Justice
Health Care Provider
Mental Health Provider
School
Self / Family / Friend
Education Level Unknown
Bachelor or Advanced Degree
Associate Degree or Some College
High School Grad or G.E.D.
Less than High School Diploma
Commitment Type Unknown
Sexual Predatory
Criminal
Civil
Voluntary
TREATMENT REFERRAL SOURCE
EMPLOYMENT
EDUCATION
TYPE OF COMMITMENT
Age Unknown
55 to 59
50 to 54
60 and Over
30 to 34
25 to 29
18 to 24
14 to 17
10 to 13
6 to 9
Under 6
40 to 44
35 to 39
45 to 49
AGE
Hearing Impaired
Past or Current Military Service0
11
Race/Ethnicity Unknown
Other Race
Hispanic
Asian / Pacific Islander
Native American / Alaskan
African American
Caucasian
0
13
9
0
*
*
382
GENDERMale
Female 215
183
Diagnosis Unknown
Other Disorders
Sexual Disorders
Schizophrenia and Psychotic Disorders
Personality Disorders
Depressive Mood Disorders
Impulse Control and Conduct DisordersDevelopmental and Age Related Disorders
Trauma and Stress Related Disorders
Anxiety and Fear Disorders
Bipolar Mood Disorders
DIAGNOSIS CATEGORY
The profiles below summarize individuals who received clinical services from the Division of Behavioral Health psychiatric programs.Individuals are counted only once based on their first treatment episode of the fiscal year. Information that was not reported is listed asunknown. An asterisk (*) in a data cell indicates the count was fewer than five (5) and suppressed to avoid disclosing identifying information.
32
41
38
7
33
33
34
26
23
34
26
39
32
17A
Southeast
23,957
24,696
CRAWFORD COUNTY
211
94
40
*
11
54
10
415
0
0
6
91
110
160
50
45
9
47
0
77
309
6
11
63
*
24
*
11
12
41
100
111
183
60
43
8
58
*
83
*
9
29
47
28
28
34
27
33
#Name?
Page G-029
MENTAL ILLNESS TREATMENT SERVICES -- DIVISION OF BEHAVIORAL HEALTH
FY2018 FY2017
RACE / ETHNICITY
TREATMENT ACCOMMODATION
2019 Status Report on Missouri's Substance Use and Mental Health
*18
50
340 33335
26
43
38
38
*
0
0
398415NUMBER SERVED
PLANNING REGION
PSYCHIATRIC SERVICE AREA
2018 POPULATION ESTIMATE
CENSUS 2010
FY2019 FY2018 FY2017
Individuals who received psychiatric services had the following types ofdisorders. The total number of diagnoses is larger than the numberserved because some individuals had more than one type of disorder.
399
*
*
0
5
220
93
47
5
13
0
50
398
0
0
302
*
9
51
*
30
0
0
0
91
105
165
52
51
6
52
*
80
*
12
10
37
227
8
221
40
6
124 123
19 8
FY2018 FY2017
176
239
Gender Unknown 00
000
0
265
224
489
45
47
50
41
42
0
19
FY2019
*
10
11
0
*
5
464
38
29
30
25
41
61
29
11
FY2019
44
159
9
66
211
0
0
*
370
86
77
23
19
50
0
78
9
*
346
*
*
486
6
51
232
114
Total Disorders Diagnosed 593667 618
Missouri Department of Mental Health, Division of Behavioral Health
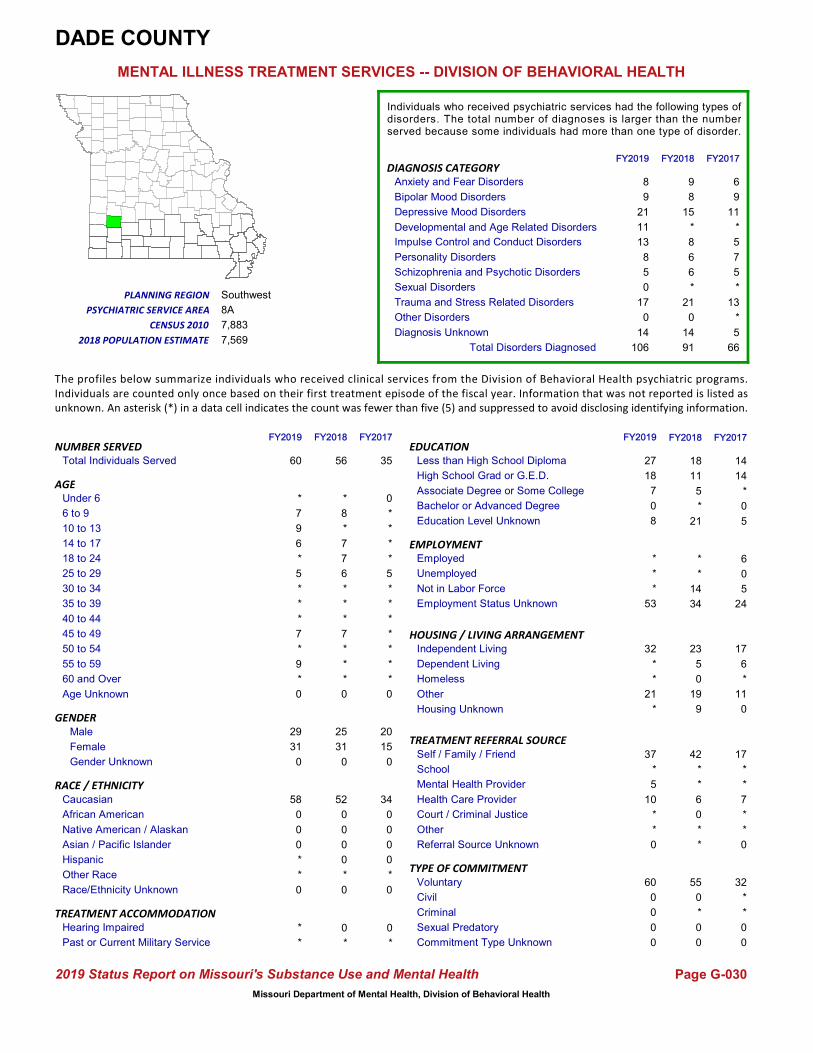
Total Individuals Served
Housing Unknown
Other
Homeless
Independent Living
Dependent Living
HOUSING / LIVING ARRANGEMENT
Employment Status Unknown
Not in Labor Force
Unemployed
Employed
Referral Source Unknown
Other
Court / Criminal Justice
Health Care Provider
Mental Health Provider
School
Self / Family / Friend
Education Level Unknown
Bachelor or Advanced Degree
Associate Degree or Some College
High School Grad or G.E.D.
Less than High School Diploma
Commitment Type Unknown
Sexual Predatory
Criminal
Civil
Voluntary
TREATMENT REFERRAL SOURCE
EMPLOYMENT
EDUCATION
TYPE OF COMMITMENT
Age Unknown
55 to 59
50 to 54
60 and Over
30 to 34
25 to 29
18 to 24
14 to 17
10 to 13
6 to 9
Under 6
40 to 44
35 to 39
45 to 49
AGE
Hearing Impaired
Past or Current Military Service0
*
Race/Ethnicity Unknown
Other Race
Hispanic
Asian / Pacific Islander
Native American / Alaskan
African American
Caucasian
0
*
0
0
0
0
34
GENDERMale
Female 15
20
Diagnosis Unknown
Other Disorders
Sexual Disorders
Schizophrenia and Psychotic Disorders
Personality Disorders
Depressive Mood Disorders
Impulse Control and Conduct DisordersDevelopmental and Age Related Disorders
Trauma and Stress Related Disorders
Anxiety and Fear Disorders
Bipolar Mood Disorders
DIAGNOSIS CATEGORY
The profiles below summarize individuals who received clinical services from the Division of Behavioral Health psychiatric programs.Individuals are counted only once based on their first treatment episode of the fiscal year. Information that was not reported is listed asunknown. An asterisk (*) in a data cell indicates the count was fewer than five (5) and suppressed to avoid disclosing identifying information.
*
*
*
0
*
*
*
*
5
*
*
*
*
8A
Southwest
7,569
7,883
DADE COUNTY
14
14
*
0
*
14
*
55
0
*
0
6
9
11
*
5
7
5
*
13
42
*
*
6
0
*
*
6
0
5
8
9
21
11
13
8
5
0
17
0
*
8
*
7
7
6
*
*
#Name?
Page G-030
MENTAL ILLNESS TREATMENT SERVICES -- DIVISION OF BEHAVIORAL HEALTH
FY2018 FY2017
RACE / ETHNICITY
TREATMENT ACCOMMODATION
2019 Status Report on Missouri's Substance Use and Mental Health
514
5
34 24*
*
7
*
*
*
0
0
3556NUMBER SERVED
PLANNING REGION
PSYCHIATRIC SERVICE AREA
2018 POPULATION ESTIMATE
CENSUS 2010
FY2019 FY2018 FY2017
Individuals who received psychiatric services had the following types ofdisorders. The total number of diagnoses is larger than the numberserved because some individuals had more than one type of disorder.
52
0
0
0
0
18
11
5
*
*
0
21
32
*
*
17
*
*
7
*
*
0
0
0
9
8
15
*
8
6
6
*
21
0
14
*
5
23
0
17
6
*
19 11
9 0
FY2018 FY2017
25
31
Gender Unknown 00
000
0
31
29
60
9
*
7
*
*
0
*
FY2019
*
*
*
0
0
0
58
*
*
5
*
6
9
7
*
FY2019
*
21
*
*
32
0
0
0
53
8
*
*
*
*
*
10
5
*
37
0
0
60
0
7
27
18
Total Disorders Diagnosed 66106 91
Missouri Department of Mental Health, Division of Behavioral Health

Total Individuals Served
Housing Unknown
Other
Homeless
Independent Living
Dependent Living
HOUSING / LIVING ARRANGEMENT
Employment Status Unknown
Not in Labor Force
Unemployed
Employed
Referral Source Unknown
Other
Court / Criminal Justice
Health Care Provider
Mental Health Provider
School
Self / Family / Friend
Education Level Unknown
Bachelor or Advanced Degree
Associate Degree or Some College
High School Grad or G.E.D.
Less than High School Diploma
Commitment Type Unknown
Sexual Predatory
Criminal
Civil
Voluntary
TREATMENT REFERRAL SOURCE
EMPLOYMENT
EDUCATION
TYPE OF COMMITMENT
Age Unknown
55 to 59
50 to 54
60 and Over
30 to 34
25 to 29
18 to 24
14 to 17
10 to 13
6 to 9
Under 6
40 to 44
35 to 39
45 to 49
AGE
Hearing Impaired
Past or Current Military Service*
*
Race/Ethnicity Unknown
Other Race
Hispanic
Asian / Pacific Islander
Native American / Alaskan
African American
Caucasian
0
11
*
0
0
0
99
GENDERMale
Female 46
64
Diagnosis Unknown
Other Disorders
Sexual Disorders
Schizophrenia and Psychotic Disorders
Personality Disorders
Depressive Mood Disorders
Impulse Control and Conduct DisordersDevelopmental and Age Related Disorders
Trauma and Stress Related Disorders
Anxiety and Fear Disorders
Bipolar Mood Disorders
DIAGNOSIS CATEGORY
The profiles below summarize individuals who received clinical services from the Division of Behavioral Health psychiatric programs.Individuals are counted only once based on their first treatment episode of the fiscal year. Information that was not reported is listed asunknown. An asterisk (*) in a data cell indicates the count was fewer than five (5) and suppressed to avoid disclosing identifying information.
10
12
11
*
8
15
10
6
*
*
8
12
12
10
Southwest
16,762
16,777
DALLAS COUNTY
54
31
19
*
6
11
*
95
0
0
*
23
23
42
15
18
11
23
*
28
47
*
7
29
*
10
*
*
6
6
29
17
42
9
8
10
27
0
31
*
*
7
8
*
*
*
5
7
#Name?
Page G-031
MENTAL ILLNESS TREATMENT SERVICES -- DIVISION OF BEHAVIORAL HEALTH
FY2018 FY2017
RACE / ETHNICITY
TREATMENT ACCOMMODATION
2019 Status Report on Missouri's Substance Use and Mental Health
57
*
77 9512
11
10
11
12
0
0
0
11095NUMBER SERVED
PLANNING REGION
PSYCHIATRIC SERVICE AREA
2018 POPULATION ESTIMATE
CENSUS 2010
FY2019 FY2018 FY2017
Individuals who received psychiatric services had the following types ofdisorders. The total number of diagnoses is larger than the numberserved because some individuals had more than one type of disorder.
90
*
0
0
*
44
26
13
*
*
0
11
108
*
*
50
*
9
31
*
15
0
0
0
27
18
44
5
9
11
23
0
28
*
5
*
6
44
*
37
12
*
32 51
12 8
FY2018 FY2017
55
40
Gender Unknown 00
000
0
43
53
96
18
6
12
6
7
0
7
FY2019
*
*
*
0
0
*
87
6
*
7
*
8
12
7
0
FY2019
18
36
*
7
34
0
0
0
76
17
14
5
*
17
*
21
5
*
51
0
0
96
*
10
41
26
Total Disorders Diagnosed 190181 171
Missouri Department of Mental Health, Division of Behavioral Health

Total Individuals Served
Housing Unknown
Other
Homeless
Independent Living
Dependent Living
HOUSING / LIVING ARRANGEMENT
Employment Status Unknown
Not in Labor Force
Unemployed
Employed
Referral Source Unknown
Other
Court / Criminal Justice
Health Care Provider
Mental Health Provider
School
Self / Family / Friend
Education Level Unknown
Bachelor or Advanced Degree
Associate Degree or Some College
High School Grad or G.E.D.
Less than High School Diploma
Commitment Type Unknown
Sexual Predatory
Criminal
Civil
Voluntary
TREATMENT REFERRAL SOURCE
EMPLOYMENT
EDUCATION
TYPE OF COMMITMENT
Age Unknown
55 to 59
50 to 54
60 and Over
30 to 34
25 to 29
18 to 24
14 to 17
10 to 13
6 to 9
Under 6
40 to 44
35 to 39
45 to 49
AGE
Hearing Impaired
Past or Current Military Service*
*
Race/Ethnicity Unknown
Other Race
Hispanic
Asian / Pacific Islander
Native American / Alaskan
African American
Caucasian
0
*
*
0
0
0
110
GENDERMale
Female 73
41
Diagnosis Unknown
Other Disorders
Sexual Disorders
Schizophrenia and Psychotic Disorders
Personality Disorders
Depressive Mood Disorders
Impulse Control and Conduct DisordersDevelopmental and Age Related Disorders
Trauma and Stress Related Disorders
Anxiety and Fear Disorders
Bipolar Mood Disorders
DIAGNOSIS CATEGORY
The profiles below summarize individuals who received clinical services from the Division of Behavioral Health psychiatric programs.Individuals are counted only once based on their first treatment episode of the fiscal year. Information that was not reported is listed asunknown. An asterisk (*) in a data cell indicates the count was fewer than five (5) and suppressed to avoid disclosing identifying information.
12
12
7
*
8
14
11
15
7
*
6
7
8
13
Northwest
8,313
8,433
DAVIESS COUNTY
48
37
14
*
*
6
*
124
0
0
0
43
32
57
19
10
13
*
*
39
74
8
*
17
14
8
*
*
10
7
58
40
59
32
20
10
7
*
48
*
*
13
16
15
14
9
7
7
#Name?
Page G-032
MENTAL ILLNESS TREATMENT SERVICES -- DIVISION OF BEHAVIORAL HEALTH
FY2018 FY2017
RACE / ETHNICITY
TREATMENT ACCOMMODATION
2019 Status Report on Missouri's Substance Use and Mental Health
5*
13
111 947
8
9
9
8
0
0
0
114124NUMBER SERVED
PLANNING REGION
PSYCHIATRIC SERVICE AREA
2018 POPULATION ESTIMATE
CENSUS 2010
FY2019 FY2018 FY2017
Individuals who received psychiatric services had the following types ofdisorders. The total number of diagnoses is larger than the numberserved because some individuals had more than one type of disorder.
118
0
0
0
6
61
36
19
*
6
0
*
114
0
0
68
*
5
17
14
8
0
0
0
52
34
54
29
12
11
*
*
48
*
*
*
14
62
*
62
15
*
46 34
* 0
FY2018 FY2017
50
74
Gender Unknown 00
000
0
78
57
135
9
10
9
12
10
0
5
FY2019
0
*
*
0
0
*
129
7
5
12
12
21
11
14
*
FY2019
*
48
*
7
78
0
0
0
125
*
6
0
*
6
14
20
*
6
86
0
0
135
6
20
65
41
Total Disorders Diagnosed 224280 250
Missouri Department of Mental Health, Division of Behavioral Health
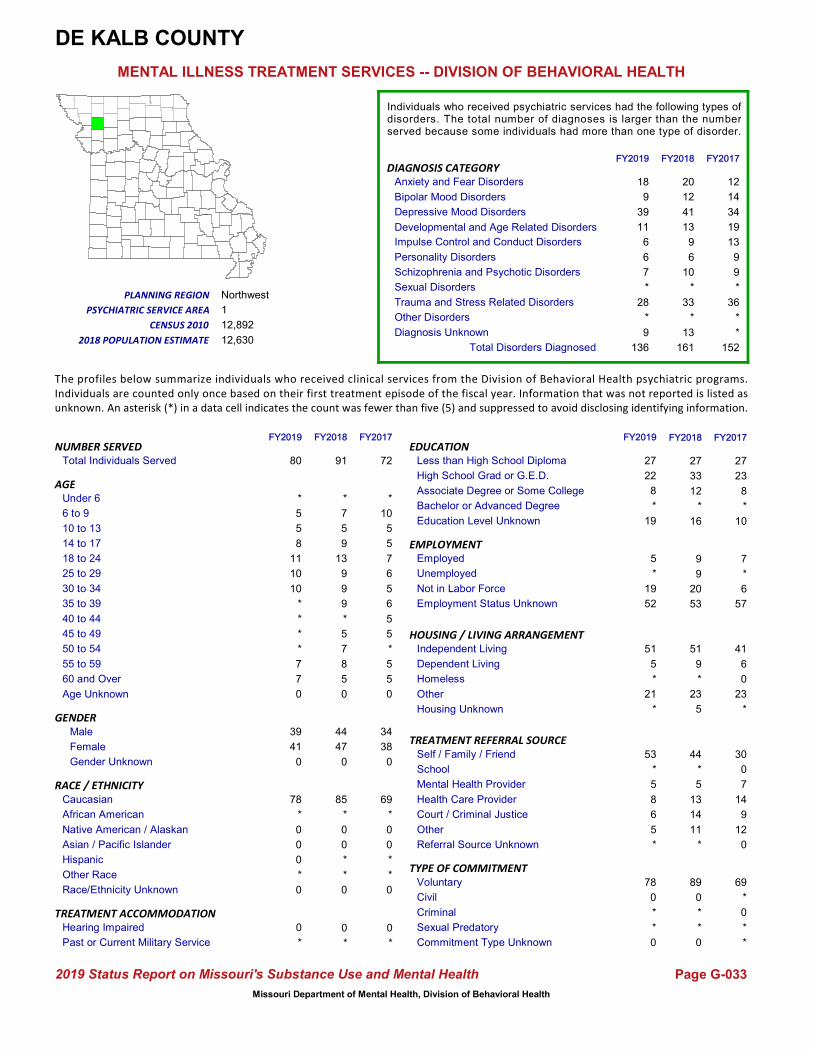
Total Individuals Served
Housing Unknown
Other
Homeless
Independent Living
Dependent Living
HOUSING / LIVING ARRANGEMENT
Employment Status Unknown
Not in Labor Force
Unemployed
Employed
Referral Source Unknown
Other
Court / Criminal Justice
Health Care Provider
Mental Health Provider
School
Self / Family / Friend
Education Level Unknown
Bachelor or Advanced Degree
Associate Degree or Some College
High School Grad or G.E.D.
Less than High School Diploma
Commitment Type Unknown
Sexual Predatory
Criminal
Civil
Voluntary
TREATMENT REFERRAL SOURCE
EMPLOYMENT
EDUCATION
TYPE OF COMMITMENT
Age Unknown
55 to 59
50 to 54
60 and Over
30 to 34
25 to 29
18 to 24
14 to 17
10 to 13
6 to 9
Under 6
40 to 44
35 to 39
45 to 49
AGE
Hearing Impaired
Past or Current Military Service0
*
Race/Ethnicity Unknown
Other Race
Hispanic
Asian / Pacific Islander
Native American / Alaskan
African American
Caucasian
0
*
*
0
0
*
69
GENDERMale
Female 38
34
Diagnosis Unknown
Other Disorders
Sexual Disorders
Schizophrenia and Psychotic Disorders
Personality Disorders
Depressive Mood Disorders
Impulse Control and Conduct DisordersDevelopmental and Age Related Disorders
Trauma and Stress Related Disorders
Anxiety and Fear Disorders
Bipolar Mood Disorders
DIAGNOSIS CATEGORY
The profiles below summarize individuals who received clinical services from the Division of Behavioral Health psychiatric programs.Individuals are counted only once based on their first treatment episode of the fiscal year. Information that was not reported is listed asunknown. An asterisk (*) in a data cell indicates the count was fewer than five (5) and suppressed to avoid disclosing identifying information.
5
6
5
*
10
5
5
7
6
5
5
*
5
1
Northwest
12,630
12,892
DE KALB COUNTY
27
23
8
*
9
20
*
89
0
*
0
12
14
34
19
13
9
9
*
36
44
*
5
13
14
11
*
7
*
6
18
9
39
11
6
6
7
*
28
*
*
7
5
9
13
9
9
5
#Name?
Page G-033
MENTAL ILLNESS TREATMENT SERVICES -- DIVISION OF BEHAVIORAL HEALTH
FY2018 FY2017
RACE / ETHNICITY
TREATMENT ACCOMMODATION
2019 Status Report on Missouri's Substance Use and Mental Health
*9
10
53 579
*
5
7
8
*
*
0
7291NUMBER SERVED
PLANNING REGION
PSYCHIATRIC SERVICE AREA
2018 POPULATION ESTIMATE
CENSUS 2010
FY2019 FY2018 FY2017
Individuals who received psychiatric services had the following types ofdisorders. The total number of diagnoses is larger than the numberserved because some individuals had more than one type of disorder.
85
*
0
0
*
27
33
12
*
*
0
16
69
*
0
30
0
7
14
9
12
0
*
*
20
12
41
13
9
6
10
*
33
*
13
9
9
51
*
41
6
0
23 23
5 *
FY2018 FY2017
44
47
Gender Unknown 00
000
0
41
39
80
7
*
*
*
*
0
*
FY2019
0
*
0
0
0
*
78
7
10
10
11
8
5
5
*
FY2019
*
21
*
5
51
0
*
*
52
19
19
*
5
5
6
8
5
*
53
*
0
78
*
8
27
22
Total Disorders Diagnosed 152136 161
Missouri Department of Mental Health, Division of Behavioral Health
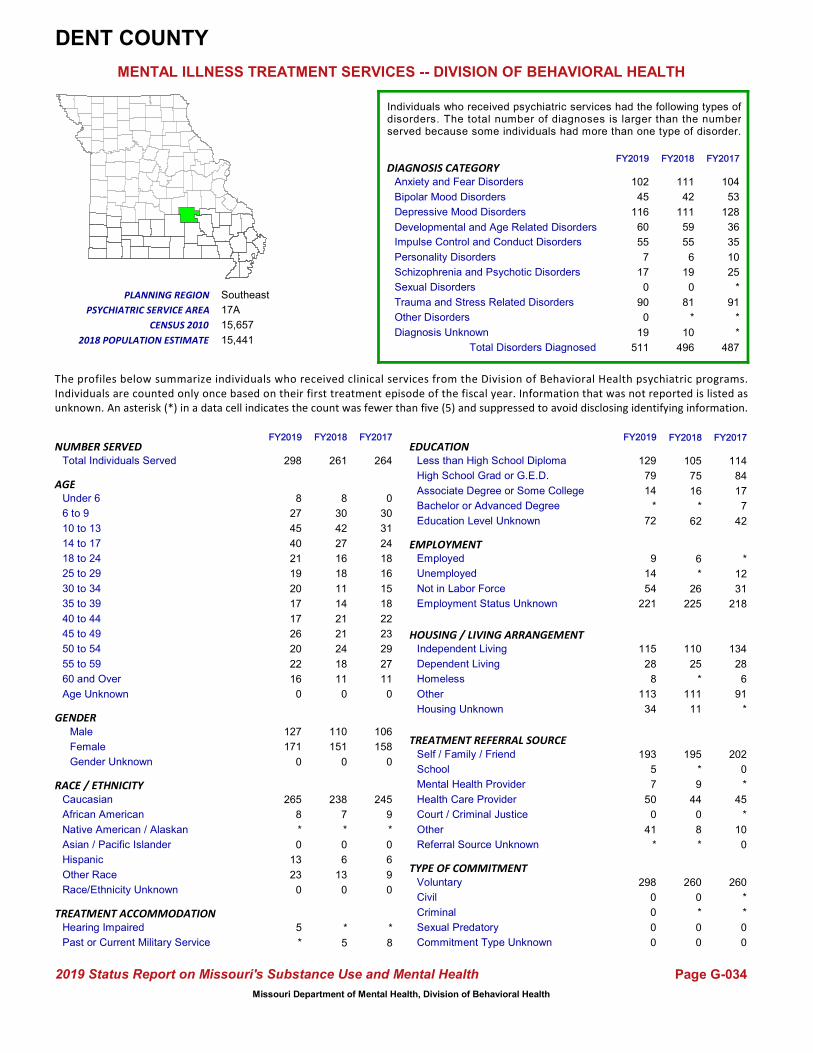
Total Individuals Served
Housing Unknown
Other
Homeless
Independent Living
Dependent Living
HOUSING / LIVING ARRANGEMENT
Employment Status Unknown
Not in Labor Force
Unemployed
Employed
Referral Source Unknown
Other
Court / Criminal Justice
Health Care Provider
Mental Health Provider
School
Self / Family / Friend
Education Level Unknown
Bachelor or Advanced Degree
Associate Degree or Some College
High School Grad or G.E.D.
Less than High School Diploma
Commitment Type Unknown
Sexual Predatory
Criminal
Civil
Voluntary
TREATMENT REFERRAL SOURCE
EMPLOYMENT
EDUCATION
TYPE OF COMMITMENT
Age Unknown
55 to 59
50 to 54
60 and Over
30 to 34
25 to 29
18 to 24
14 to 17
10 to 13
6 to 9
Under 6
40 to 44
35 to 39
45 to 49
AGE
Hearing Impaired
Past or Current Military Service*
8
Race/Ethnicity Unknown
Other Race
Hispanic
Asian / Pacific Islander
Native American / Alaskan
African American
Caucasian
0
9
6
0
*
9
245
GENDERMale
Female 158
106
Diagnosis Unknown
Other Disorders
Sexual Disorders
Schizophrenia and Psychotic Disorders
Personality Disorders
Depressive Mood Disorders
Impulse Control and Conduct DisordersDevelopmental and Age Related Disorders
Trauma and Stress Related Disorders
Anxiety and Fear Disorders
Bipolar Mood Disorders
DIAGNOSIS CATEGORY
The profiles below summarize individuals who received clinical services from the Division of Behavioral Health psychiatric programs.Individuals are counted only once based on their first treatment episode of the fiscal year. Information that was not reported is listed asunknown. An asterisk (*) in a data cell indicates the count was fewer than five (5) and suppressed to avoid disclosing identifying information.
23
18
22
0
30
31
24
18
16
15
11
29
27
17A
Southeast
15,441
15,657
DENT COUNTY
114
84
17
7
*
26
5
260
0
*
*
104
53
128
36
35
10
25
*
91
195
*
9
44
0
8
*
*
12
31
102
45
116
60
55
7
17
0
90
0
8
30
42
27
16
18
11
11
#Name?
Page G-034
MENTAL ILLNESS TREATMENT SERVICES -- DIVISION OF BEHAVIORAL HEALTH
FY2018 FY2017
RACE / ETHNICITY
TREATMENT ACCOMMODATION
2019 Status Report on Missouri's Substance Use and Mental Health
*19
42
225 21814
21
21
24
18
*
0
0
264261NUMBER SERVED
PLANNING REGION
PSYCHIATRIC SERVICE AREA
2018 POPULATION ESTIMATE
CENSUS 2010
FY2019 FY2018 FY2017
Individuals who received psychiatric services had the following types ofdisorders. The total number of diagnoses is larger than the numberserved because some individuals had more than one type of disorder.
238
7
*
0
6
105
75
16
*
13
0
62
260
*
*
202
0
*
45
*
10
0
0
0
111
42
111
59
55
6
19
0
81
*
10
6
25
110
*
134
28
6
111 91
11 *
FY2018 FY2017
110
151
Gender Unknown 00
000
0
171
127
298
22
20
26
17
17
0
23
FY2019
5
*
13
0
*
8
265
16
20
19
21
40
45
27
8
FY2019
34
113
8
28
115
0
0
*
221
72
54
14
9
41
0
50
7
5
193
0
0
298
*
14
129
79
Total Disorders Diagnosed 487511 496
Missouri Department of Mental Health, Division of Behavioral Health
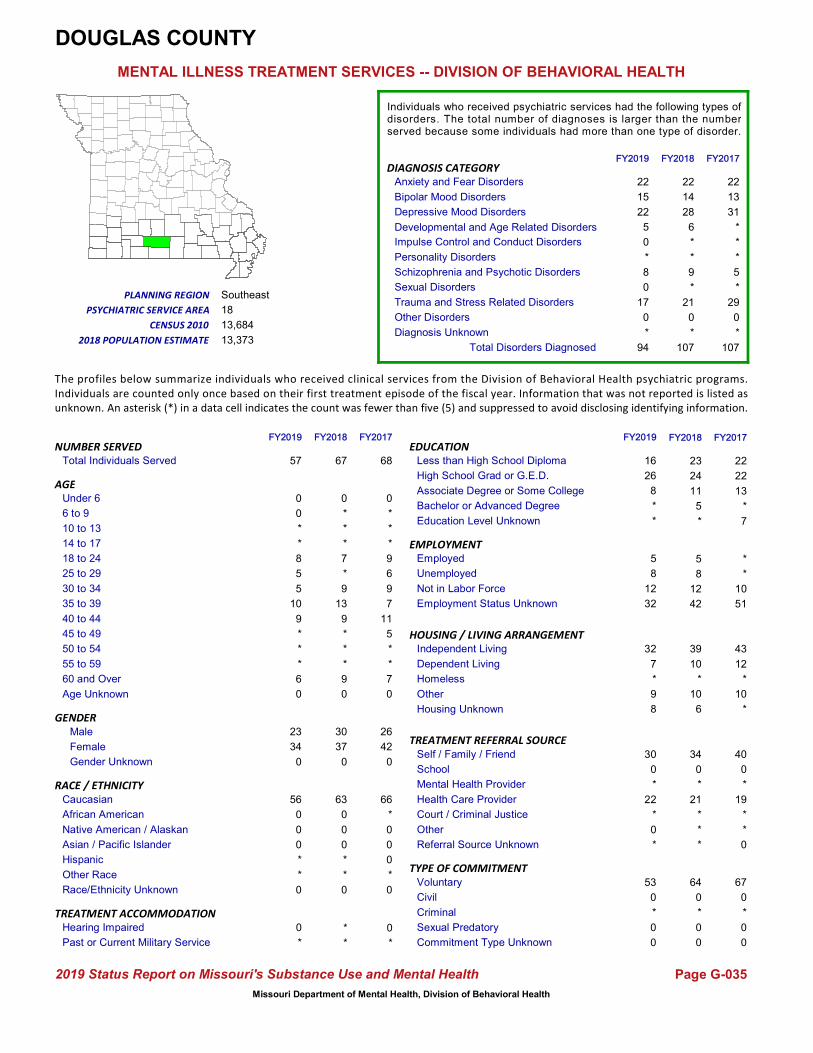
Total Individuals Served
Housing Unknown
Other
Homeless
Independent Living
Dependent Living
HOUSING / LIVING ARRANGEMENT
Employment Status Unknown
Not in Labor Force
Unemployed
Employed
Referral Source Unknown
Other
Court / Criminal Justice
Health Care Provider
Mental Health Provider
School
Self / Family / Friend
Education Level Unknown
Bachelor or Advanced Degree
Associate Degree or Some College
High School Grad or G.E.D.
Less than High School Diploma
Commitment Type Unknown
Sexual Predatory
Criminal
Civil
Voluntary
TREATMENT REFERRAL SOURCE
EMPLOYMENT
EDUCATION
TYPE OF COMMITMENT
Age Unknown
55 to 59
50 to 54
60 and Over
30 to 34
25 to 29
18 to 24
14 to 17
10 to 13
6 to 9
Under 6
40 to 44
35 to 39
45 to 49
AGE
Hearing Impaired
Past or Current Military Service0
*
Race/Ethnicity Unknown
Other Race
Hispanic
Asian / Pacific Islander
Native American / Alaskan
African American
Caucasian
0
*
0
0
0
*
66
GENDERMale
Female 42
26
Diagnosis Unknown
Other Disorders
Sexual Disorders
Schizophrenia and Psychotic Disorders
Personality Disorders
Depressive Mood Disorders
Impulse Control and Conduct DisordersDevelopmental and Age Related Disorders
Trauma and Stress Related Disorders
Anxiety and Fear Disorders
Bipolar Mood Disorders
DIAGNOSIS CATEGORY
The profiles below summarize individuals who received clinical services from the Division of Behavioral Health psychiatric programs.Individuals are counted only once based on their first treatment episode of the fiscal year. Information that was not reported is listed asunknown. An asterisk (*) in a data cell indicates the count was fewer than five (5) and suppressed to avoid disclosing identifying information.
5
7
11
0
*
*
*
9
6
9
7
*
*
18
Southeast
13,373
13,684
DOUGLAS COUNTY
22
22
13
*
8
12
*
64
0
*
*
22
13
31
*
*
*
5
*
29
34
0
*
21
*
*
0
*
*
10
22
15
22
5
0
*
8
0
17
0
0
*
*
*
7
*
9
9
#Name?
Page G-035
MENTAL ILLNESS TREATMENT SERVICES -- DIVISION OF BEHAVIORAL HEALTH
FY2018 FY2017
RACE / ETHNICITY
TREATMENT ACCOMMODATION
2019 Status Report on Missouri's Substance Use and Mental Health
**
7
42 5113
9
*
*
*
*
0
0
6867NUMBER SERVED
PLANNING REGION
PSYCHIATRIC SERVICE AREA
2018 POPULATION ESTIMATE
CENSUS 2010
FY2019 FY2018 FY2017
Individuals who received psychiatric services had the following types ofdisorders. The total number of diagnoses is larger than the numberserved because some individuals had more than one type of disorder.
63
0
0
0
*
23
24
11
5
*
0
*
67
0
*
40
0
*
19
*
*
0
0
0
22
14
28
6
*
*
9
*
21
0
*
5
10
39
*
43
12
*
10 10
6 *
FY2018 FY2017
30
37
Gender Unknown 00
000
0
34
23
57
*
*
*
9
10
0
*
FY2019
0
*
*
0
0
0
56
6
5
5
8
*
*
0
0
FY2019
8
9
*
7
32
0
0
*
32
*
12
8
5
0
*
22
*
0
30
*
0
53
*
8
16
26
Total Disorders Diagnosed 10794 107
Missouri Department of Mental Health, Division of Behavioral Health

Total Individuals Served
Housing Unknown
Other
Homeless
Independent Living
Dependent Living
HOUSING / LIVING ARRANGEMENT
Employment Status Unknown
Not in Labor Force
Unemployed
Employed
Referral Source Unknown
Other
Court / Criminal Justice
Health Care Provider
Mental Health Provider
School
Self / Family / Friend
Education Level Unknown
Bachelor or Advanced Degree
Associate Degree or Some College
High School Grad or G.E.D.
Less than High School Diploma
Commitment Type Unknown
Sexual Predatory
Criminal
Civil
Voluntary
TREATMENT REFERRAL SOURCE
EMPLOYMENT
EDUCATION
TYPE OF COMMITMENT
Age Unknown
55 to 59
50 to 54
60 and Over
30 to 34
25 to 29
18 to 24
14 to 17
10 to 13
6 to 9
Under 6
40 to 44
35 to 39
45 to 49
AGE
Hearing Impaired
Past or Current Military Service*
19
Race/Ethnicity Unknown
Other Race
Hispanic
Asian / Pacific Islander
Native American / Alaskan
African American
Caucasian
0
26
9
0
*
121
591
GENDERMale
Female 416
325
Diagnosis Unknown
Other Disorders
Sexual Disorders
Schizophrenia and Psychotic Disorders
Personality Disorders
Depressive Mood Disorders
Impulse Control and Conduct DisordersDevelopmental and Age Related Disorders
Trauma and Stress Related Disorders
Anxiety and Fear Disorders
Bipolar Mood Disorders
DIAGNOSIS CATEGORY
The profiles below summarize individuals who received clinical services from the Division of Behavioral Health psychiatric programs.Individuals are counted only once based on their first treatment episode of the fiscal year. Information that was not reported is listed asunknown. An asterisk (*) in a data cell indicates the count was fewer than five (5) and suppressed to avoid disclosing identifying information.
69
71
80
*
33
49
48
42
58
71
72
76
71
19
Southeast
29,423
31,953
DUNKLIN COUNTY
354
294
69
16
35
57
19
811
0
8
10
285
234
310
90
59
73
130
*
117
399
0
110
176
74
59
5
12
30
51
358
242
393
118
68
64
142
*
179
*
*
22
46
45
61
61
77
83
#Name?
Page G-036
MENTAL ILLNESS TREATMENT SERVICES -- DIVISION OF BEHAVIORAL HEALTH
FY2018 FY2017
RACE / ETHNICITY
TREATMENT ACCOMMODATION
2019 Status Report on Missouri's Substance Use and Mental Health
1518
10
712 65081
92
83
90
82
5
0
5
741824NUMBER SERVED
PLANNING REGION
PSYCHIATRIC SERVICE AREA
2018 POPULATION ESTIMATE
CENSUS 2010
FY2019 FY2018 FY2017
Individuals who received psychiatric services had the following types ofdisorders. The total number of diagnoses is larger than the numberserved because some individuals had more than one type of disorder.
656
135
*
0
11
380
321
80
21
29
0
22
726
*
12
317
*
84
175
96
66
0
0
0
311
255
347
95
58
64
138
*
125
5
25
19
73
548
25
481
50
13
136 177
41 19
FY2018 FY2017
348
476
Gender Unknown 00
000
0
463
401
864
88
86
87
90
79
0
39
FY2019
15
18
20
0
0
147
678
78
78
70
58
48
60
36
6
FY2019
23
189
14
65
571
5
0
*
762
14
46
31
25
63
87
193
83
29
406
8
0
851
17
94
399
340
Total Disorders Diagnosed 1,3191,586 1,424
Missouri Department of Mental Health, Division of Behavioral Health
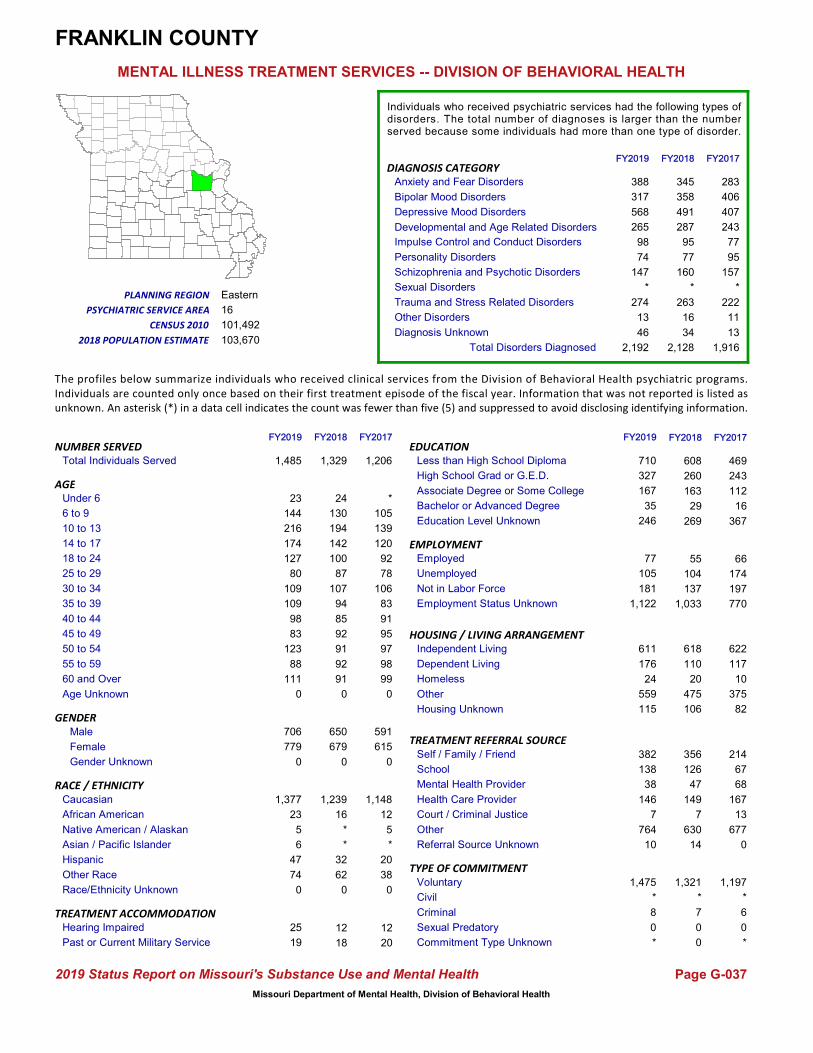
Total Individuals Served
Housing Unknown
Other
Homeless
Independent Living
Dependent Living
HOUSING / LIVING ARRANGEMENT
Employment Status Unknown
Not in Labor Force
Unemployed
Employed
Referral Source Unknown
Other
Court / Criminal Justice
Health Care Provider
Mental Health Provider
School
Self / Family / Friend
Education Level Unknown
Bachelor or Advanced Degree
Associate Degree or Some College
High School Grad or G.E.D.
Less than High School Diploma
Commitment Type Unknown
Sexual Predatory
Criminal
Civil
Voluntary
TREATMENT REFERRAL SOURCE
EMPLOYMENT
EDUCATION
TYPE OF COMMITMENT
Age Unknown
55 to 59
50 to 54
60 and Over
30 to 34
25 to 29
18 to 24
14 to 17
10 to 13
6 to 9
Under 6
40 to 44
35 to 39
45 to 49
AGE
Hearing Impaired
Past or Current Military Service12
20
Race/Ethnicity Unknown
Other Race
Hispanic
Asian / Pacific Islander
Native American / Alaskan
African American
Caucasian
0
38
20
*
5
12
1,148
GENDERMale
Female 615
591
Diagnosis Unknown
Other Disorders
Sexual Disorders
Schizophrenia and Psychotic Disorders
Personality Disorders
Depressive Mood Disorders
Impulse Control and Conduct DisordersDevelopmental and Age Related Disorders
Trauma and Stress Related Disorders
Anxiety and Fear Disorders
Bipolar Mood Disorders
DIAGNOSIS CATEGORY
The profiles below summarize individuals who received clinical services from the Division of Behavioral Health psychiatric programs.Individuals are counted only once based on their first treatment episode of the fiscal year. Information that was not reported is listed asunknown. An asterisk (*) in a data cell indicates the count was fewer than five (5) and suppressed to avoid disclosing identifying information.
95
83
91
*
105
139
120
92
78
106
99
97
98
16
Eastern
103,670
101,492
FRANKLIN COUNTY
469
243
112
16
104
137
18
1,321
*
7
12
283
406
407
243
77
95
157
*
222
356
126
47
149
7
630
11
66
174
197
388
317
568
265
98
74
147
*
274
13
24
130
194
142
100
87
107
91
#Name?
Page G-037
MENTAL ILLNESS TREATMENT SERVICES -- DIVISION OF BEHAVIORAL HEALTH
FY2018 FY2017
RACE / ETHNICITY
TREATMENT ACCOMMODATION
2019 Status Report on Missouri's Substance Use and Mental Health
1346
367
1,033 77094
85
92
91
92
14
0
0
1,2061,329NUMBER SERVED
PLANNING REGION
PSYCHIATRIC SERVICE AREA
2018 POPULATION ESTIMATE
CENSUS 2010
FY2019 FY2018 FY2017
Individuals who received psychiatric services had the following types ofdisorders. The total number of diagnoses is larger than the numberserved because some individuals had more than one type of disorder.
1,239
16
*
*
32
608
260
163
29
62
0
269
1,197
*
6
214
67
68
167
13
677
0
0
*
345
358
491
287
95
77
160
*
263
16
34
55
110
618
20
622
117
10
475 375
106 82
FY2018 FY2017
650
679
Gender Unknown 00
000
0
779
706
1,485
88
123
83
98
109
0
74
FY2019
25
19
47
6
5
23
1,377
111
109
80
127
174
216
144
23
FY2019
115
559
24
176
611
*
0
10
1,122
246
181
105
77
764
7
146
38
138
382
8
*
1,475
35
167
710
327
Total Disorders Diagnosed 1,9162,192 2,128
Missouri Department of Mental Health, Division of Behavioral Health

Total Individuals Served
Housing Unknown
Other
Homeless
Independent Living
Dependent Living
HOUSING / LIVING ARRANGEMENT
Employment Status Unknown
Not in Labor Force
Unemployed
Employed
Referral Source Unknown
Other
Court / Criminal Justice
Health Care Provider
Mental Health Provider
School
Self / Family / Friend
Education Level Unknown
Bachelor or Advanced Degree
Associate Degree or Some College
High School Grad or G.E.D.
Less than High School Diploma
Commitment Type Unknown
Sexual Predatory
Criminal
Civil
Voluntary
TREATMENT REFERRAL SOURCE
EMPLOYMENT
EDUCATION
TYPE OF COMMITMENT
Age Unknown
55 to 59
50 to 54
60 and Over
30 to 34
25 to 29
18 to 24
14 to 17
10 to 13
6 to 9
Under 6
40 to 44
35 to 39
45 to 49
AGE
Hearing Impaired
Past or Current Military Service*
*
Race/Ethnicity Unknown
Other Race
Hispanic
Asian / Pacific Islander
Native American / Alaskan
African American
Caucasian
0
*
*
0
*
*
152
GENDERMale
Female 82
76
Diagnosis Unknown
Other Disorders
Sexual Disorders
Schizophrenia and Psychotic Disorders
Personality Disorders
Depressive Mood Disorders
Impulse Control and Conduct DisordersDevelopmental and Age Related Disorders
Trauma and Stress Related Disorders
Anxiety and Fear Disorders
Bipolar Mood Disorders
DIAGNOSIS CATEGORY
The profiles below summarize individuals who received clinical services from the Division of Behavioral Health psychiatric programs.Individuals are counted only once based on their first treatment episode of the fiscal year. Information that was not reported is listed asunknown. An asterisk (*) in a data cell indicates the count was fewer than five (5) and suppressed to avoid disclosing identifying information.
15
18
14
0
11
17
12
11
6
14
9
13
18
17A
Southeast
14,705
15,222
GASCONADE COUNTY
75
49
22
*
10
16
*
161
*
*
*
38
35
70
25
21
7
22
0
46
116
0
6
23
0
15
*
*
8
20
55
28
81
21
23
*
15
0
39
*
*
13
22
13
8
7
12
10
#Name?
Page G-038
MENTAL ILLNESS TREATMENT SERVICES -- DIVISION OF BEHAVIORAL HEALTH
FY2018 FY2017
RACE / ETHNICITY
TREATMENT ACCOMMODATION
2019 Status Report on Missouri's Substance Use and Mental Health
*11
9
136 12617
11
17
17
17
*
0
0
158165NUMBER SERVED
PLANNING REGION
PSYCHIATRIC SERVICE AREA
2018 POPULATION ESTIMATE
CENSUS 2010
FY2019 FY2018 FY2017
Individuals who received psychiatric services had the following types ofdisorders. The total number of diagnoses is larger than the numberserved because some individuals had more than one type of disorder.
155
*
*
0
0
76
59
20
*
*
0
7
155
*
*
99
0
*
27
*
24
0
0
0
48
32
69
20
27
*
19
0
42
*
8
*
19
84
*
92
18
*
52 43
8 *
FY2018 FY2017
79
86
Gender Unknown 00
000
0
87
89
176
19
15
11
12
14
0
5
FY2019
6
*
5
0
*
*
168
17
8
8
13
20
23
12
*
FY2019
21
54
*
21
78
0
0
*
134
25
21
13
8
35
0
27
6
0
106
*
*
174
*
25
74
50
Total Disorders Diagnosed 269277 268
Missouri Department of Mental Health, Division of Behavioral Health

Total Individuals Served
Housing Unknown
Other
Homeless
Independent Living
Dependent Living
HOUSING / LIVING ARRANGEMENT
Employment Status Unknown
Not in Labor Force
Unemployed
Employed
Referral Source Unknown
Other
Court / Criminal Justice
Health Care Provider
Mental Health Provider
School
Self / Family / Friend
Education Level Unknown
Bachelor or Advanced Degree
Associate Degree or Some College
High School Grad or G.E.D.
Less than High School Diploma
Commitment Type Unknown
Sexual Predatory
Criminal
Civil
Voluntary
TREATMENT REFERRAL SOURCE
EMPLOYMENT
EDUCATION
TYPE OF COMMITMENT
Age Unknown
55 to 59
50 to 54
60 and Over
30 to 34
25 to 29
18 to 24
14 to 17
10 to 13
6 to 9
Under 6
40 to 44
35 to 39
45 to 49
AGE
Hearing Impaired
Past or Current Military Service0
*
Race/Ethnicity Unknown
Other Race
Hispanic
Asian / Pacific Islander
Native American / Alaskan
African American
Caucasian
0
0
0
0
0
0
47
GENDERMale
Female 23
24
Diagnosis Unknown
Other Disorders
Sexual Disorders
Schizophrenia and Psychotic Disorders
Personality Disorders
Depressive Mood Disorders
Impulse Control and Conduct DisordersDevelopmental and Age Related Disorders
Trauma and Stress Related Disorders
Anxiety and Fear Disorders
Bipolar Mood Disorders
DIAGNOSIS CATEGORY
The profiles below summarize individuals who received clinical services from the Division of Behavioral Health psychiatric programs.Individuals are counted only once based on their first treatment episode of the fiscal year. Information that was not reported is listed asunknown. An asterisk (*) in a data cell indicates the count was fewer than five (5) and suppressed to avoid disclosing identifying information.
*
*
*
0
*
*
5
6
5
*
*
6
*
1
Northwest
6,628
6,738
GENTRY COUNTY
19
21
*
0
10
10
*
58
0
0
0
11
13
23
6
8
9
5
0
18
21
*
*
6
13
10
0
*
*
*
13
12
12
7
5
8
*
0
17
0
0
6
*
6
9
8
*
*
#Name?
Page G-039
MENTAL ILLNESS TREATMENT SERVICES -- DIVISION OF BEHAVIORAL HEALTH
FY2018 FY2017
RACE / ETHNICITY
TREATMENT ACCOMMODATION
2019 Status Report on Missouri's Substance Use and Mental Health
**
*
34 38*
*
*
*
*
*
0
0
4758NUMBER SERVED
PLANNING REGION
PSYCHIATRIC SERVICE AREA
2018 POPULATION ESTIMATE
CENSUS 2010
FY2019 FY2018 FY2017
Individuals who received psychiatric services had the following types ofdisorders. The total number of diagnoses is larger than the numberserved because some individuals had more than one type of disorder.
56
0
0
0
0
17
27
5
0
*
0
9
46
0
*
17
*
7
9
6
6
*
0
0
19
10
22
7
9
9
*
0
22
0
6
*
9
32
*
21
5
*
16 18
0 *
FY2018 FY2017
35
23
Gender Unknown 00
000
0
21
23
44
*
*
*
5
*
0
*
FY2019
0
*
*
0
0
0
42
*
*
5
6
5
5
*
0
FY2019
*
12
*
7
20
0
0
*
27
7
11
*
*
8
7
6
*
*
16
0
0
44
*
*
18
15
Total Disorders Diagnosed 9482 108
Missouri Department of Mental Health, Division of Behavioral Health
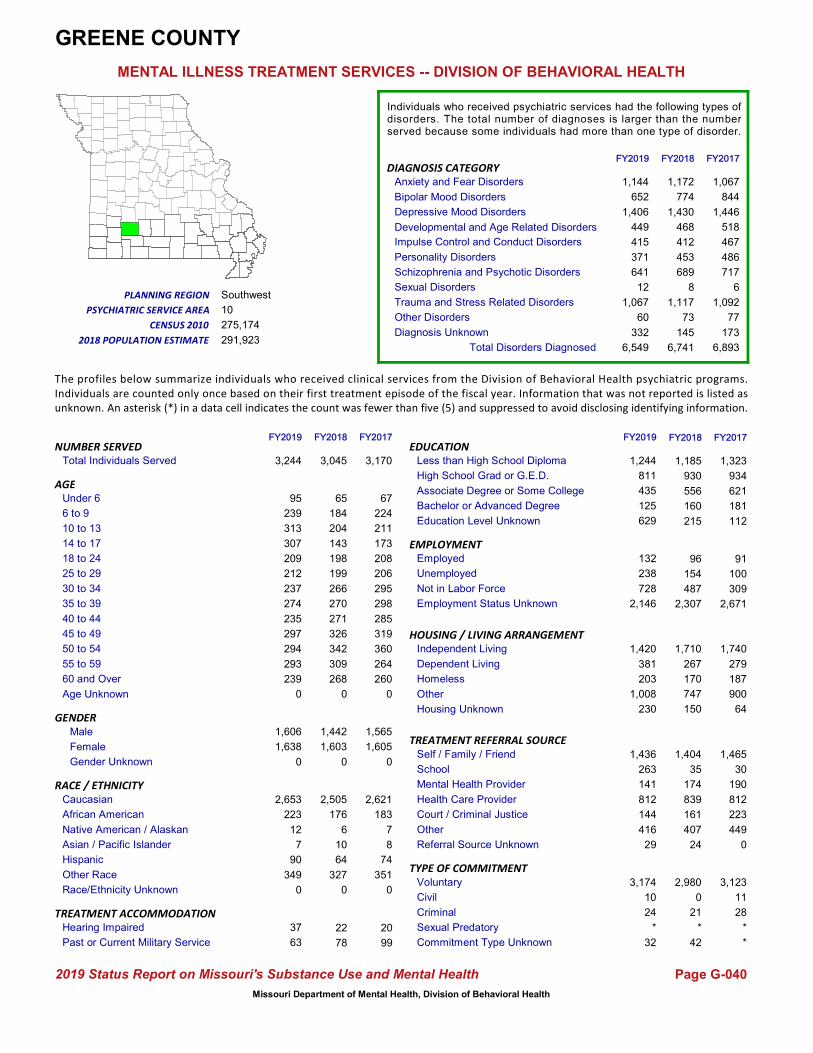
Total Individuals Served
Housing Unknown
Other
Homeless
Independent Living
Dependent Living
HOUSING / LIVING ARRANGEMENT
Employment Status Unknown
Not in Labor Force
Unemployed
Employed
Referral Source Unknown
Other
Court / Criminal Justice
Health Care Provider
Mental Health Provider
School
Self / Family / Friend
Education Level Unknown
Bachelor or Advanced Degree
Associate Degree or Some College
High School Grad or G.E.D.
Less than High School Diploma
Commitment Type Unknown
Sexual Predatory
Criminal
Civil
Voluntary
TREATMENT REFERRAL SOURCE
EMPLOYMENT
EDUCATION
TYPE OF COMMITMENT
Age Unknown
55 to 59
50 to 54
60 and Over
30 to 34
25 to 29
18 to 24
14 to 17
10 to 13
6 to 9
Under 6
40 to 44
35 to 39
45 to 49
AGE
Hearing Impaired
Past or Current Military Service20
99
Race/Ethnicity Unknown
Other Race
Hispanic
Asian / Pacific Islander
Native American / Alaskan
African American
Caucasian
0
351
74
8
7
183
2,621
GENDERMale
Female 1,605
1,565
Diagnosis Unknown
Other Disorders
Sexual Disorders
Schizophrenia and Psychotic Disorders
Personality Disorders
Depressive Mood Disorders
Impulse Control and Conduct DisordersDevelopmental and Age Related Disorders
Trauma and Stress Related Disorders
Anxiety and Fear Disorders
Bipolar Mood Disorders
DIAGNOSIS CATEGORY
The profiles below summarize individuals who received clinical services from the Division of Behavioral Health psychiatric programs.Individuals are counted only once based on their first treatment episode of the fiscal year. Information that was not reported is listed asunknown. An asterisk (*) in a data cell indicates the count was fewer than five (5) and suppressed to avoid disclosing identifying information.
319
298
285
67
224
211
173
208
206
295
260
360
264
10
Southwest
291,923
275,174
GREENE COUNTY
1,323
934
621
181
154
487
78
2,980
0
21
22
1,067
844
1,446
518
467
486
717
6
1,092
1,404
35
174
839
161
407
77
91
100
309
1,144
652
1,406
449
415
371
641
12
1,067
60
65
184
204
143
198
199
266
268
#Name?
Page G-040
MENTAL ILLNESS TREATMENT SERVICES -- DIVISION OF BEHAVIORAL HEALTH
FY2018 FY2017
RACE / ETHNICITY
TREATMENT ACCOMMODATION
2019 Status Report on Missouri's Substance Use and Mental Health
173332
112
2,307 2,671270
271
326
342
309
24
*
42
3,1703,045NUMBER SERVED
PLANNING REGION
PSYCHIATRIC SERVICE AREA
2018 POPULATION ESTIMATE
CENSUS 2010
FY2019 FY2018 FY2017
Individuals who received psychiatric services had the following types ofdisorders. The total number of diagnoses is larger than the numberserved because some individuals had more than one type of disorder.
2,505
176
6
10
64
1,185
930
556
160
327
0
215
3,123
11
28
1,465
30
190
812
223
449
0
*
*
1,172
774
1,430
468
412
453
689
8
1,117
73
145
96
267
1,710
170
1,740
279
187
747 900
150 64
FY2018 FY2017
1,442
1,603
Gender Unknown 00
000
0
1,638
1,606
3,244
293
294
297
235
274
0
349
FY2019
37
63
90
7
12
223
2,653
239
237
212
209
307
313
239
95
FY2019
230
1,008
203
381
1,420
32
*
29
2,146
629
728
238
132
416
144
812
141
263
1,436
24
10
3,174
125
435
1,244
811
Total Disorders Diagnosed 6,8936,549 6,741
Missouri Department of Mental Health, Division of Behavioral Health

Total Individuals Served
Housing Unknown
Other
Homeless
Independent Living
Dependent Living
HOUSING / LIVING ARRANGEMENT
Employment Status Unknown
Not in Labor Force
Unemployed
Employed
Referral Source Unknown
Other
Court / Criminal Justice
Health Care Provider
Mental Health Provider
School
Self / Family / Friend
Education Level Unknown
Bachelor or Advanced Degree
Associate Degree or Some College
High School Grad or G.E.D.
Less than High School Diploma
Commitment Type Unknown
Sexual Predatory
Criminal
Civil
Voluntary
TREATMENT REFERRAL SOURCE
EMPLOYMENT
EDUCATION
TYPE OF COMMITMENT
Age Unknown
55 to 59
50 to 54
60 and Over
30 to 34
25 to 29
18 to 24
14 to 17
10 to 13
6 to 9
Under 6
40 to 44
35 to 39
45 to 49
AGE
Hearing Impaired
Past or Current Military Service*
19
Race/Ethnicity Unknown
Other Race
Hispanic
Asian / Pacific Islander
Native American / Alaskan
African American
Caucasian
0
15
10
0
*
5
428
GENDERMale
Female 257
192
Diagnosis Unknown
Other Disorders
Sexual Disorders
Schizophrenia and Psychotic Disorders
Personality Disorders
Depressive Mood Disorders
Impulse Control and Conduct DisordersDevelopmental and Age Related Disorders
Trauma and Stress Related Disorders
Anxiety and Fear Disorders
Bipolar Mood Disorders
DIAGNOSIS CATEGORY
The profiles below summarize individuals who received clinical services from the Division of Behavioral Health psychiatric programs.Individuals are counted only once based on their first treatment episode of the fiscal year. Information that was not reported is listed asunknown. An asterisk (*) in a data cell indicates the count was fewer than five (5) and suppressed to avoid disclosing identifying information.
44
30
24
12
40
45
39
42
41
37
34
36
25
13
Northwest
9,914
10,261
GRUNDY COUNTY
201
158
62
8
13
16
16
453
0
0
5
152
104
211
80
54
40
30
0
140
261
30
13
80
17
55
8
24
12
17
172
117
239
83
54
47
31
0
174
*
11
41
60
40
33
35
31
43
#Name?
Page G-041
MENTAL ILLNESS TREATMENT SERVICES -- DIVISION OF BEHAVIORAL HEALTH
FY2018 FY2017
RACE / ETHNICITY
TREATMENT ACCOMMODATION
2019 Status Report on Missouri's Substance Use and Mental Health
1714
22
419 39835
28
34
35
32
*
0
5
449458NUMBER SERVED
PLANNING REGION
PSYCHIATRIC SERVICE AREA
2018 POPULATION ESTIMATE
CENSUS 2010
FY2019 FY2018 FY2017
Individuals who received psychiatric services had the following types ofdisorders. The total number of diagnoses is larger than the numberserved because some individuals had more than one type of disorder.
442
*
*
0
10
206
169
60
8
13
0
15
449
0
0
247
31
13
78
25
53
*
0
0
145
112
223
82
60
54
29
0
150
8
14
10
27
252
11
267
22
6
164 149
* 5
FY2018 FY2017
210
248
Gender Unknown 00
000
0
280
214
494
39
40
33
28
40
0
12
FY2019
10
13
7
0
*
7
474
41
26
42
40
53
54
46
12
FY2019
10
172
*
24
286
5
0
*
452
*
25
7
10
55
31
77
12
32
285
*
0
488
17
54
231
188
Total Disorders Diagnosed 836935 877
Missouri Department of Mental Health, Division of Behavioral Health
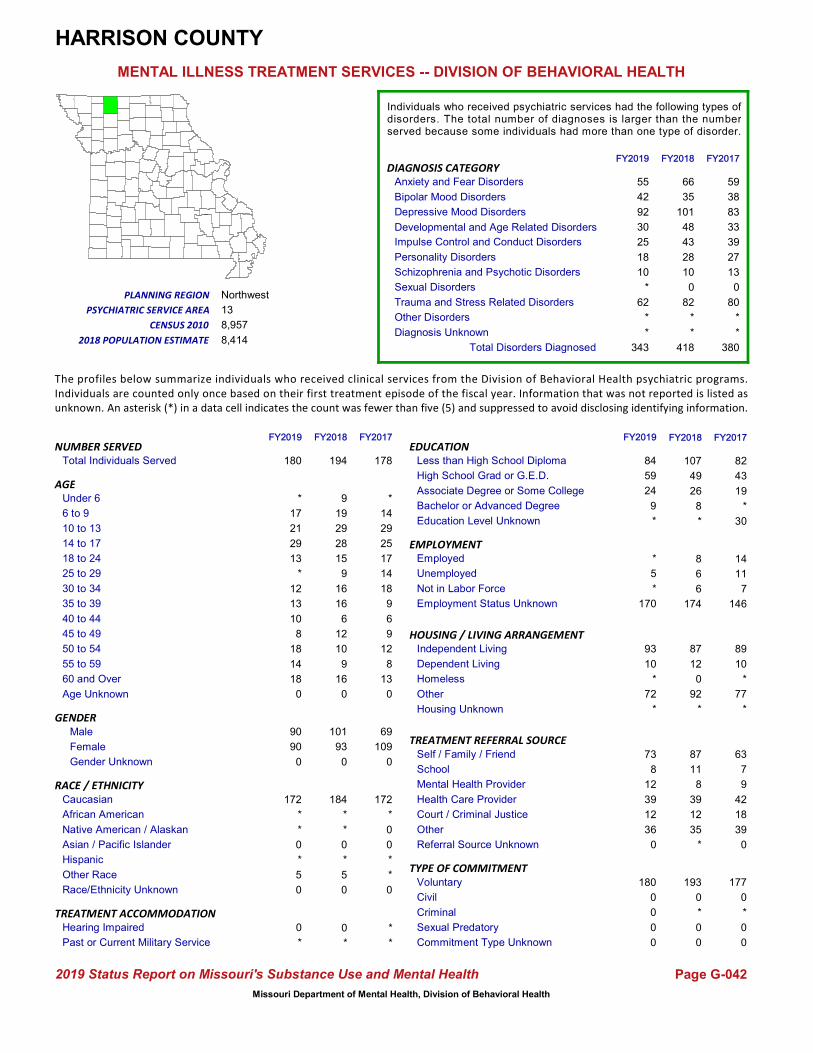
Total Individuals Served
Housing Unknown
Other
Homeless
Independent Living
Dependent Living
HOUSING / LIVING ARRANGEMENT
Employment Status Unknown
Not in Labor Force
Unemployed
Employed
Referral Source Unknown
Other
Court / Criminal Justice
Health Care Provider
Mental Health Provider
School
Self / Family / Friend
Education Level Unknown
Bachelor or Advanced Degree
Associate Degree or Some College
High School Grad or G.E.D.
Less than High School Diploma
Commitment Type Unknown
Sexual Predatory
Criminal
Civil
Voluntary
TREATMENT REFERRAL SOURCE
EMPLOYMENT
EDUCATION
TYPE OF COMMITMENT
Age Unknown
55 to 59
50 to 54
60 and Over
30 to 34
25 to 29
18 to 24
14 to 17
10 to 13
6 to 9
Under 6
40 to 44
35 to 39
45 to 49
AGE
Hearing Impaired
Past or Current Military Service*
*
Race/Ethnicity Unknown
Other Race
Hispanic
Asian / Pacific Islander
Native American / Alaskan
African American
Caucasian
0
*
*
0
0
*
172
GENDERMale
Female 109
69
Diagnosis Unknown
Other Disorders
Sexual Disorders
Schizophrenia and Psychotic Disorders
Personality Disorders
Depressive Mood Disorders
Impulse Control and Conduct DisordersDevelopmental and Age Related Disorders
Trauma and Stress Related Disorders
Anxiety and Fear Disorders
Bipolar Mood Disorders
DIAGNOSIS CATEGORY
The profiles below summarize individuals who received clinical services from the Division of Behavioral Health psychiatric programs.Individuals are counted only once based on their first treatment episode of the fiscal year. Information that was not reported is listed asunknown. An asterisk (*) in a data cell indicates the count was fewer than five (5) and suppressed to avoid disclosing identifying information.
9
9
6
*
14
29
25
17
14
18
13
12
8
13
Northwest
8,414
8,957
HARRISON COUNTY
82
43
19
*
6
6
*
193
0
*
0
59
38
83
33
39
27
13
0
80
87
11
8
39
12
35
*
14
11
7
55
42
92
30
25
18
10
*
62
*
9
19
29
28
15
9
16
16
#Name?
Page G-042
MENTAL ILLNESS TREATMENT SERVICES -- DIVISION OF BEHAVIORAL HEALTH
FY2018 FY2017
RACE / ETHNICITY
TREATMENT ACCOMMODATION
2019 Status Report on Missouri's Substance Use and Mental Health
**
30
174 14616
6
12
10
9
*
0
0
178194NUMBER SERVED
PLANNING REGION
PSYCHIATRIC SERVICE AREA
2018 POPULATION ESTIMATE
CENSUS 2010
FY2019 FY2018 FY2017
Individuals who received psychiatric services had the following types ofdisorders. The total number of diagnoses is larger than the numberserved because some individuals had more than one type of disorder.
184
*
*
0
*
107
49
26
8
5
0
*
177
0
*
63
7
9
42
18
39
0
0
0
66
35
101
48
43
28
10
0
82
*
*
8
12
87
0
89
10
*
92 77
* *
FY2018 FY2017
101
93
Gender Unknown 00
000
0
90
90
180
14
18
8
10
13
0
5
FY2019
0
*
*
0
*
*
172
18
12
*
13
29
21
17
*
FY2019
*
72
*
10
93
0
0
0
170
*
*
5
*
36
12
39
12
8
73
0
0
180
9
24
84
59
Total Disorders Diagnosed 380343 418
Missouri Department of Mental Health, Division of Behavioral Health

Total Individuals Served
Housing Unknown
Other
Homeless
Independent Living
Dependent Living
HOUSING / LIVING ARRANGEMENT
Employment Status Unknown
Not in Labor Force
Unemployed
Employed
Referral Source Unknown
Other
Court / Criminal Justice
Health Care Provider
Mental Health Provider
School
Self / Family / Friend
Education Level Unknown
Bachelor or Advanced Degree
Associate Degree or Some College
High School Grad or G.E.D.
Less than High School Diploma
Commitment Type Unknown
Sexual Predatory
Criminal
Civil
Voluntary
TREATMENT REFERRAL SOURCE
EMPLOYMENT
EDUCATION
TYPE OF COMMITMENT
Age Unknown
55 to 59
50 to 54
60 and Over
30 to 34
25 to 29
18 to 24
14 to 17
10 to 13
6 to 9
Under 6
40 to 44
35 to 39
45 to 49
AGE
Hearing Impaired
Past or Current Military Service0
11
Race/Ethnicity Unknown
Other Race
Hispanic
Asian / Pacific Islander
Native American / Alaskan
African American
Caucasian
0
8
*
0
*
5
452
GENDERMale
Female 271
195
Diagnosis Unknown
Other Disorders
Sexual Disorders
Schizophrenia and Psychotic Disorders
Personality Disorders
Depressive Mood Disorders
Impulse Control and Conduct DisordersDevelopmental and Age Related Disorders
Trauma and Stress Related Disorders
Anxiety and Fear Disorders
Bipolar Mood Disorders
DIAGNOSIS CATEGORY
The profiles below summarize individuals who received clinical services from the Division of Behavioral Health psychiatric programs.Individuals are counted only once based on their first treatment episode of the fiscal year. Information that was not reported is listed asunknown. An asterisk (*) in a data cell indicates the count was fewer than five (5) and suppressed to avoid disclosing identifying information.
40
38
42
*
24
27
38
44
31
35
50
55
40
8B
Southwest
21,792
22,272
HENRY COUNTY
198
169
68
10
14
42
11
449
0
*
0
131
111
219
47
54
23
62
0
118
270
*
23
41
*
114
*
22
18
35
163
113
238
59
56
19
71
0
121
*
5
20
34
34
42
37
27
43
#Name?
Page G-043
MENTAL ILLNESS TREATMENT SERVICES -- DIVISION OF BEHAVIORAL HEALTH
FY2018 FY2017
RACE / ETHNICITY
TREATMENT ACCOMMODATION
2019 Status Report on Missouri's Substance Use and Mental Health
*26
22
378 39239
36
41
46
53
*
0
5
466457NUMBER SERVED
PLANNING REGION
PSYCHIATRIC SERVICE AREA
2018 POPULATION ESTIMATE
CENSUS 2010
FY2019 FY2018 FY2017
Individuals who received psychiatric services had the following types ofdisorders. The total number of diagnoses is larger than the numberserved because some individuals had more than one type of disorder.
439
*
*
0
*
193
168
60
9
9
0
27
458
*
*
225
0
19
35
12
175
0
0
*
135
103
198
47
49
20
67
0
120
*
16
23
46
261
16
268
50
9
112 123
22 16
FY2018 FY2017
192
265
Gender Unknown 00
000
0
317
248
565
56
54
50
38
48
0
21
FY2019
*
9
14
*
*
6
533
50
33
44
55
50
52
31
*
FY2019
44
158
13
49
301
*
0
5
450
60
65
17
33
130
*
48
29
*
347
5
0
556
12
74
205
214
Total Disorders Diagnosed 770868 757
Missouri Department of Mental Health, Division of Behavioral Health

Total Individuals Served
Housing Unknown
Other
Homeless
Independent Living
Dependent Living
HOUSING / LIVING ARRANGEMENT
Employment Status Unknown
Not in Labor Force
Unemployed
Employed
Referral Source Unknown
Other
Court / Criminal Justice
Health Care Provider
Mental Health Provider
School
Self / Family / Friend
Education Level Unknown
Bachelor or Advanced Degree
Associate Degree or Some College
High School Grad or G.E.D.
Less than High School Diploma
Commitment Type Unknown
Sexual Predatory
Criminal
Civil
Voluntary
TREATMENT REFERRAL SOURCE
EMPLOYMENT
EDUCATION
TYPE OF COMMITMENT
Age Unknown
55 to 59
50 to 54
60 and Over
30 to 34
25 to 29
18 to 24
14 to 17
10 to 13
6 to 9
Under 6
40 to 44
35 to 39
45 to 49
AGE
Hearing Impaired
Past or Current Military Service*
0
Race/Ethnicity Unknown
Other Race
Hispanic
Asian / Pacific Islander
Native American / Alaskan
African American
Caucasian
0
*
0
0
0
0
30
GENDERMale
Female 23
9
Diagnosis Unknown
Other Disorders
Sexual Disorders
Schizophrenia and Psychotic Disorders
Personality Disorders
Depressive Mood Disorders
Impulse Control and Conduct DisordersDevelopmental and Age Related Disorders
Trauma and Stress Related Disorders
Anxiety and Fear Disorders
Bipolar Mood Disorders
DIAGNOSIS CATEGORY
The profiles below summarize individuals who received clinical services from the Division of Behavioral Health psychiatric programs.Individuals are counted only once based on their first treatment episode of the fiscal year. Information that was not reported is listed asunknown. An asterisk (*) in a data cell indicates the count was fewer than five (5) and suppressed to avoid disclosing identifying information.
*
*
*
*
*
5
*
*
*
0
*
*
*
8B
Southwest
9,509
9,627
HICKORY COUNTY
18
5
5
*
*
*
0
31
*
0
0
12
10
15
5
*
*
*
0
12
20
0
*
*
*
*
0
*
*
*
12
7
12
5
*
*
6
0
12
0
0
*
5
*
5
*
*
*
#Name?
Page G-044
MENTAL ILLNESS TREATMENT SERVICES -- DIVISION OF BEHAVIORAL HEALTH
FY2018 FY2017
RACE / ETHNICITY
TREATMENT ACCOMMODATION
2019 Status Report on Missouri's Substance Use and Mental Health
**
*
24 26*
*
*
*
*
0
0
0
3232NUMBER SERVED
PLANNING REGION
PSYCHIATRIC SERVICE AREA
2018 POPULATION ESTIMATE
CENSUS 2010
FY2019 FY2018 FY2017
Individuals who received psychiatric services had the following types ofdisorders. The total number of diagnoses is larger than the numberserved because some individuals had more than one type of disorder.
31
0
0
0
0
16
7
*
*
*
0
*
31
0
*
20
0
*
8
*
*
0
0
0
16
8
13
7
*
*
*
*
14
0
0
*
*
14
0
17
*
0
13 11
* *
FY2018 FY2017
12
20
Gender Unknown 00
000
0
22
19
41
*
*
*
*
5
0
*
FY2019
0
0
0
0
0
0
38
*
*
*
6
6
*
*
0
FY2019
*
14
*
7
16
0
0
*
30
*
5
*
*
*
*
5
*
0
27
*
0
40
*
6
24
6
Total Disorders Diagnosed 6465 67
Missouri Department of Mental Health, Division of Behavioral Health

Total Individuals Served
Housing Unknown
Other
Homeless
Independent Living
Dependent Living
HOUSING / LIVING ARRANGEMENT
Employment Status Unknown
Not in Labor Force
Unemployed
Employed
Referral Source Unknown
Other
Court / Criminal Justice
Health Care Provider
Mental Health Provider
School
Self / Family / Friend
Education Level Unknown
Bachelor or Advanced Degree
Associate Degree or Some College
High School Grad or G.E.D.
Less than High School Diploma
Commitment Type Unknown
Sexual Predatory
Criminal
Civil
Voluntary
TREATMENT REFERRAL SOURCE
EMPLOYMENT
EDUCATION
TYPE OF COMMITMENT
Age Unknown
55 to 59
50 to 54
60 and Over
30 to 34
25 to 29
18 to 24
14 to 17
10 to 13
6 to 9
Under 6
40 to 44
35 to 39
45 to 49
AGE
Hearing Impaired
Past or Current Military Service0
*
Race/Ethnicity Unknown
Other Race
Hispanic
Asian / Pacific Islander
Native American / Alaskan
African American
Caucasian
0
0
0
0
0
0
27
GENDERMale
Female 13
14
Diagnosis Unknown
Other Disorders
Sexual Disorders
Schizophrenia and Psychotic Disorders
Personality Disorders
Depressive Mood Disorders
Impulse Control and Conduct DisordersDevelopmental and Age Related Disorders
Trauma and Stress Related Disorders
Anxiety and Fear Disorders
Bipolar Mood Disorders
DIAGNOSIS CATEGORY
The profiles below summarize individuals who received clinical services from the Division of Behavioral Health psychiatric programs.Individuals are counted only once based on their first treatment episode of the fiscal year. Information that was not reported is listed asunknown. An asterisk (*) in a data cell indicates the count was fewer than five (5) and suppressed to avoid disclosing identifying information.
*
*
*
0
*
*
*
*
*
*
*
*
*
1
Northwest
4,404
4,912
HOLT COUNTY
10
9
*
*
*
5
0
30
0
0
0
*
11
9
5
5
*
5
0
12
11
0
*
5
7
5
*
5
*
*
8
5
12
*
*
*
*
0
12
0
0
*
*
*
*
*
*
*
#Name?
Page G-045
MENTAL ILLNESS TREATMENT SERVICES -- DIVISION OF BEHAVIORAL HEALTH
FY2018 FY2017
RACE / ETHNICITY
TREATMENT ACCOMMODATION
2019 Status Report on Missouri's Substance Use and Mental Health
0*
*
18 18*
*
*
*
*
0
0
0
2730NUMBER SERVED
PLANNING REGION
PSYCHIATRIC SERVICE AREA
2018 POPULATION ESTIMATE
CENSUS 2010
FY2019 FY2018 FY2017
Individuals who received psychiatric services had the following types ofdisorders. The total number of diagnoses is larger than the numberserved because some individuals had more than one type of disorder.
29
*
0
0
0
13
14
*
*
0
0
*
27
0
0
10
0
0
10
6
*
0
0
0
7
7
10
*
0
*
*
0
14
*
6
*
5
18
*
19
*
*
5 5
* 0
FY2018 FY2017
16
14
Gender Unknown 00
000
0
16
10
26
*
*
*
*
*
0
0
FY2019
0
0
0
0
0
*
25
*
0
*
*
*
*
*
0
FY2019
0
6
*
*
16
0
0
0
15
*
*
*
*
*
*
*
*
0
14
0
0
26
0
*
10
11
Total Disorders Diagnosed 5651 53
Missouri Department of Mental Health, Division of Behavioral Health

Total Individuals Served
Housing Unknown
Other
Homeless
Independent Living
Dependent Living
HOUSING / LIVING ARRANGEMENT
Employment Status Unknown
Not in Labor Force
Unemployed
Employed
Referral Source Unknown
Other
Court / Criminal Justice
Health Care Provider
Mental Health Provider
School
Self / Family / Friend
Education Level Unknown
Bachelor or Advanced Degree
Associate Degree or Some College
High School Grad or G.E.D.
Less than High School Diploma
Commitment Type Unknown
Sexual Predatory
Criminal
Civil
Voluntary
TREATMENT REFERRAL SOURCE
EMPLOYMENT
EDUCATION
TYPE OF COMMITMENT
Age Unknown
55 to 59
50 to 54
60 and Over
30 to 34
25 to 29
18 to 24
14 to 17
10 to 13
6 to 9
Under 6
40 to 44
35 to 39
45 to 49
AGE
Hearing Impaired
Past or Current Military Service0
*
Race/Ethnicity Unknown
Other Race
Hispanic
Asian / Pacific Islander
Native American / Alaskan
African American
Caucasian
0
7
0
*
0
7
55
GENDERMale
Female 31
40
Diagnosis Unknown
Other Disorders
Sexual Disorders
Schizophrenia and Psychotic Disorders
Personality Disorders
Depressive Mood Disorders
Impulse Control and Conduct DisordersDevelopmental and Age Related Disorders
Trauma and Stress Related Disorders
Anxiety and Fear Disorders
Bipolar Mood Disorders
DIAGNOSIS CATEGORY
The profiles below summarize individuals who received clinical services from the Division of Behavioral Health psychiatric programs.Individuals are counted only once based on their first treatment episode of the fiscal year. Information that was not reported is listed asunknown. An asterisk (*) in a data cell indicates the count was fewer than five (5) and suppressed to avoid disclosing identifying information.
8
7
*
0
0
5
7
*
5
5
9
8
9
12
Central
10,137
10,144
HOWARD COUNTY
32
23
13
*
*
*
*
61
0
0
*
15
19
28
5
7
*
15
*
13
40
*
5
13
*
*
*
6
*
14
26
14
37
10
7
*
7
0
16
*
0
0
8
8
5
*
*
11
#Name?
Page G-046
MENTAL ILLNESS TREATMENT SERVICES -- DIVISION OF BEHAVIORAL HEALTH
FY2018 FY2017
RACE / ETHNICITY
TREATMENT ACCOMMODATION
2019 Status Report on Missouri's Substance Use and Mental Health
**
*
51 507
*
*
6
5
0
0
*
7162NUMBER SERVED
PLANNING REGION
PSYCHIATRIC SERVICE AREA
2018 POPULATION ESTIMATE
CENSUS 2010
FY2019 FY2018 FY2017
Individuals who received psychiatric services had the following types ofdisorders. The total number of diagnoses is larger than the numberserved because some individuals had more than one type of disorder.
47
*
0
*
0
28
19
7
*
10
0
5
71
0
0
42
0
11
14
*
*
0
0
0
14
14
31
*
6
*
8
0
9
*
*
6
5
31
*
42
*
*
21 22
* *
FY2018 FY2017
32
30
Gender Unknown 00
000
0
46
36
82
*
*
*
5
10
0
11
FY2019
*
*
0
*
0
6
64
7
*
*
8
13
17
6
0
FY2019
*
41
*
*
34
*
0
0
74
9
*
*
*
*
*
12
5
25
36
0
0
81
0
12
42
19
Total Disorders Diagnosed 110123 92
Missouri Department of Mental Health, Division of Behavioral Health

Total Individuals Served
Housing Unknown
Other
Homeless
Independent Living
Dependent Living
HOUSING / LIVING ARRANGEMENT
Employment Status Unknown
Not in Labor Force
Unemployed
Employed
Referral Source Unknown
Other
Court / Criminal Justice
Health Care Provider
Mental Health Provider
School
Self / Family / Friend
Education Level Unknown
Bachelor or Advanced Degree
Associate Degree or Some College
High School Grad or G.E.D.
Less than High School Diploma
Commitment Type Unknown
Sexual Predatory
Criminal
Civil
Voluntary
TREATMENT REFERRAL SOURCE
EMPLOYMENT
EDUCATION
TYPE OF COMMITMENT
Age Unknown
55 to 59
50 to 54
60 and Over
30 to 34
25 to 29
18 to 24
14 to 17
10 to 13
6 to 9
Under 6
40 to 44
35 to 39
45 to 49
AGE
Hearing Impaired
Past or Current Military Service9
38
Race/Ethnicity Unknown
Other Race
Hispanic
Asian / Pacific Islander
Native American / Alaskan
African American
Caucasian
0
27
6
*
*
*
916
GENDERMale
Female 539
410
Diagnosis Unknown
Other Disorders
Sexual Disorders
Schizophrenia and Psychotic Disorders
Personality Disorders
Depressive Mood Disorders
Impulse Control and Conduct DisordersDevelopmental and Age Related Disorders
Trauma and Stress Related Disorders
Anxiety and Fear Disorders
Bipolar Mood Disorders
DIAGNOSIS CATEGORY
The profiles below summarize individuals who received clinical services from the Division of Behavioral Health psychiatric programs.Individuals are counted only once based on their first treatment episode of the fiscal year. Information that was not reported is listed asunknown. An asterisk (*) in a data cell indicates the count was fewer than five (5) and suppressed to avoid disclosing identifying information.
88
100
83
*
44
40
37
116
124
118
49
80
66
18
Southeast
40,076
40,400
HOWELL COUNTY
284
337
203
33
40
125
27
1,012
0
0
9
289
136
502
96
30
42
64
*
294
514
*
14
441
17
25
8
49
35
144
330
108
516
131
32
35
50
*
282
5
7
69
48
50
137
115
130
61
#Name?
Page G-047
MENTAL ILLNESS TREATMENT SERVICES -- DIVISION OF BEHAVIORAL HEALTH
FY2018 FY2017
RACE / ETHNICITY
TREATMENT ACCOMMODATION
2019 Status Report on Missouri's Substance Use and Mental Health
3528
93
775 722116
65
84
74
59
*
*
*
9491,015NUMBER SERVED
PLANNING REGION
PSYCHIATRIC SERVICE AREA
2018 POPULATION ESTIMATE
CENSUS 2010
FY2019 FY2018 FY2017
Individuals who received psychiatric services had the following types ofdisorders. The total number of diagnoses is larger than the numberserved because some individuals had more than one type of disorder.
980
6
*
*
6
333
368
207
32
26
0
74
947
0
*
448
*
11
422
20
46
0
*
0
304
116
530
122
30
37
60
*
293
9
34
74
126
599
42
569
162
44
200 153
47 21
FY2018 FY2017
450
565
Gender Unknown 00
000
0
537
445
982
57
64
73
72
88
0
14
FY2019
11
17
*
0
*
*
963
58
109
105
148
57
79
68
*
FY2019
24
221
34
132
571
*
*
*
719
96
93
84
86
34
10
350
23
0
564
0
0
980
32
149
308
397
Total Disorders Diagnosed 1,4971,518 1,536
Missouri Department of Mental Health, Division of Behavioral Health

Total Individuals Served
Housing Unknown
Other
Homeless
Independent Living
Dependent Living
HOUSING / LIVING ARRANGEMENT
Employment Status Unknown
Not in Labor Force
Unemployed
Employed
Referral Source Unknown
Other
Court / Criminal Justice
Health Care Provider
Mental Health Provider
School
Self / Family / Friend
Education Level Unknown
Bachelor or Advanced Degree
Associate Degree or Some College
High School Grad or G.E.D.
Less than High School Diploma
Commitment Type Unknown
Sexual Predatory
Criminal
Civil
Voluntary
TREATMENT REFERRAL SOURCE
EMPLOYMENT
EDUCATION
TYPE OF COMMITMENT
Age Unknown
55 to 59
50 to 54
60 and Over
30 to 34
25 to 29
18 to 24
14 to 17
10 to 13
6 to 9
Under 6
40 to 44
35 to 39
45 to 49
AGE
Hearing Impaired
Past or Current Military Service*
8
Race/Ethnicity Unknown
Other Race
Hispanic
Asian / Pacific Islander
Native American / Alaskan
African American
Caucasian
0
*
0
0
*
5
167
GENDERMale
Female 94
81
Diagnosis Unknown
Other Disorders
Sexual Disorders
Schizophrenia and Psychotic Disorders
Personality Disorders
Depressive Mood Disorders
Impulse Control and Conduct DisordersDevelopmental and Age Related Disorders
Trauma and Stress Related Disorders
Anxiety and Fear Disorders
Bipolar Mood Disorders
DIAGNOSIS CATEGORY
The profiles below summarize individuals who received clinical services from the Division of Behavioral Health psychiatric programs.Individuals are counted only once based on their first treatment episode of the fiscal year. Information that was not reported is listed asunknown. An asterisk (*) in a data cell indicates the count was fewer than five (5) and suppressed to avoid disclosing identifying information.
10
15
18
*
8
8
7
20
13
14
19
17
24
17B
Southeast
10,177
10,630
IRON COUNTY
69
76
9
*
15
44
6
174
0
5
10
24
43
57
24
10
27
46
*
45
59
*
26
57
*
28
*
*
10
32
24
47
72
25
8
15
40
*
40
15
*
*
14
8
16
17
8
20
#Name?
Page G-048
MENTAL ILLNESS TREATMENT SERVICES -- DIVISION OF BEHAVIORAL HEALTH
FY2018 FY2017
RACE / ETHNICITY
TREATMENT ACCOMMODATION
2019 Status Report on Missouri's Substance Use and Mental Health
*8
20
114 13113
21
16
14
26
7
*
0
175180NUMBER SERVED
PLANNING REGION
PSYCHIATRIC SERVICE AREA
2018 POPULATION ESTIMATE
CENSUS 2010
FY2019 FY2018 FY2017
Individuals who received psychiatric services had the following types ofdisorders. The total number of diagnoses is larger than the numberserved because some individuals had more than one type of disorder.
163
7
*
0
0
74
68
11
*
*
0
24
169
0
*
54
0
31
52
8
30
0
*
*
21
39
62
25
7
18
42
*
36
6
8
7
22
86
*
67
34
*
45 56
23 14
FY2018 FY2017
86
94
Gender Unknown 00
000
0
116
90
206
23
19
19
22
14
0
5
FY2019
9
8
*
0
*
9
191
26
12
16
17
12
13
9
*
FY2019
32
49
8
26
91
0
*
*
129
42
52
15
10
21
0
58
27
*
93
*
0
202
*
18
74
71
Total Disorders Diagnosed 283295 265
Missouri Department of Mental Health, Division of Behavioral Health

Total Individuals Served
Housing Unknown
Other
Homeless
Independent Living
Dependent Living
HOUSING / LIVING ARRANGEMENT
Employment Status Unknown
Not in Labor Force
Unemployed
Employed
Referral Source Unknown
Other
Court / Criminal Justice
Health Care Provider
Mental Health Provider
School
Self / Family / Friend
Education Level Unknown
Bachelor or Advanced Degree
Associate Degree or Some College
High School Grad or G.E.D.
Less than High School Diploma
Commitment Type Unknown
Sexual Predatory
Criminal
Civil
Voluntary
TREATMENT REFERRAL SOURCE
EMPLOYMENT
EDUCATION
TYPE OF COMMITMENT
Age Unknown
55 to 59
50 to 54
60 and Over
30 to 34
25 to 29
18 to 24
14 to 17
10 to 13
6 to 9
Under 6
40 to 44
35 to 39
45 to 49
AGE
Hearing Impaired
Past or Current Military Service104
268
Race/Ethnicity Unknown
Other Race
Hispanic
Asian / Pacific Islander
Native American / Alaskan
African American
Caucasian
10
1,297
608
53
60
4,973
6,233
GENDERMale
Female 6,440
6,175
Diagnosis Unknown
Other Disorders
Sexual Disorders
Schizophrenia and Psychotic Disorders
Personality Disorders
Depressive Mood Disorders
Impulse Control and Conduct DisordersDevelopmental and Age Related Disorders
Trauma and Stress Related Disorders
Anxiety and Fear Disorders
Bipolar Mood Disorders
DIAGNOSIS CATEGORY
The profiles below summarize individuals who received clinical services from the Division of Behavioral Health psychiatric programs.Individuals are counted only once based on their first treatment episode of the fiscal year. Information that was not reported is listed asunknown. An asterisk (*) in a data cell indicates the count was fewer than five (5) and suppressed to avoid disclosing identifying information.
1,148
1,096
1,006
71
669
855
1,001
1,073
998
1,028
1,135
1,345
1,191
2, 3, 4, 5
Northwest
700,307
674,158
JACKSON COUNTY
4,632
3,656
1,742
507
946
2,438
245
12,024
47
130
140
2,586
2,421
5,354
1,971
1,019
778
2,712
28
3,021
6,200
192
1,526
1,900
280
2,028
1,218
732
1,074
2,665
2,813
2,315
5,472
1,816
883
768
2,646
29
3,163
1,663
81
543
791
842
963
985
1,035
1,284
#Name?
Page G-049
MENTAL ILLNESS TREATMENT SERVICES -- DIVISION OF BEHAVIORAL HEALTH
FY2018 FY2017
RACE / ETHNICITY
TREATMENT ACCOMMODATION
2019 Status Report on Missouri's Substance Use and Mental Health
1,2171,384
2,078
8,068 8,1441,114
979
1,101
1,279
1,264
138
8
52
12,62612,261NUMBER SERVED
PLANNING REGION
PSYCHIATRIC SERVICE AREA
2018 POPULATION ESTIMATE
CENSUS 2010
FY2019 FY2018 FY2017
Individuals who received psychiatric services had the following types ofdisorders. The total number of diagnoses is larger than the numberserved because some individuals had more than one type of disorder.
5,845
4,925
49
46
625
4,401
3,881
1,665
445
1,284
0
1,869
12,413
54
143
5,931
224
1,610
2,050
524
2,282
17
7
21
2,724
2,310
5,408
1,718
915
801
2,661
27
3,099
1,770
1,231
812
1,447
6,314
1,051
6,650
1,444
967
2,752 3,175
700 398
FY2018 FY2017
6,109
6,152
Gender Unknown 110
1000
0
6,261
6,273
12,534
1,234
1,190
1,100
987
1,120
0
1,284
FY2019
214
221
628
48
46
5,089
6,065
1,416
1,106
1,055
989
871
836
578
52
FY2019
652
2,860
1,128
1,431
6,463
54
8
123
8,473
1,807
2,264
974
823
1,870
265
2,068
1,427
251
6,531
137
42
12,293
442
1,658
4,474
4,153
Total Disorders Diagnosed 22,32522,952 22,664
Missouri Department of Mental Health, Division of Behavioral Health
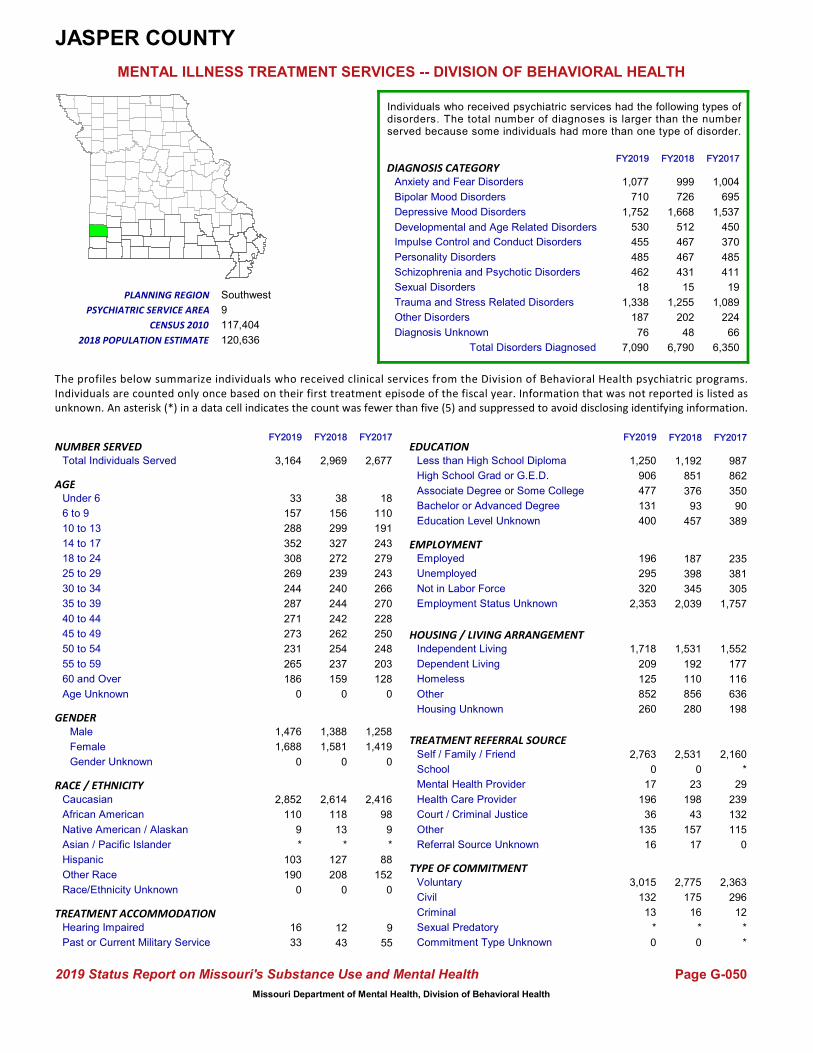
Total Individuals Served
Housing Unknown
Other
Homeless
Independent Living
Dependent Living
HOUSING / LIVING ARRANGEMENT
Employment Status Unknown
Not in Labor Force
Unemployed
Employed
Referral Source Unknown
Other
Court / Criminal Justice
Health Care Provider
Mental Health Provider
School
Self / Family / Friend
Education Level Unknown
Bachelor or Advanced Degree
Associate Degree or Some College
High School Grad or G.E.D.
Less than High School Diploma
Commitment Type Unknown
Sexual Predatory
Criminal
Civil
Voluntary
TREATMENT REFERRAL SOURCE
EMPLOYMENT
EDUCATION
TYPE OF COMMITMENT
Age Unknown
55 to 59
50 to 54
60 and Over
30 to 34
25 to 29
18 to 24
14 to 17
10 to 13
6 to 9
Under 6
40 to 44
35 to 39
45 to 49
AGE
Hearing Impaired
Past or Current Military Service9
55
Race/Ethnicity Unknown
Other Race
Hispanic
Asian / Pacific Islander
Native American / Alaskan
African American
Caucasian
0
152
88
*
9
98
2,416
GENDERMale
Female 1,419
1,258
Diagnosis Unknown
Other Disorders
Sexual Disorders
Schizophrenia and Psychotic Disorders
Personality Disorders
Depressive Mood Disorders
Impulse Control and Conduct DisordersDevelopmental and Age Related Disorders
Trauma and Stress Related Disorders
Anxiety and Fear Disorders
Bipolar Mood Disorders
DIAGNOSIS CATEGORY
The profiles below summarize individuals who received clinical services from the Division of Behavioral Health psychiatric programs.Individuals are counted only once based on their first treatment episode of the fiscal year. Information that was not reported is listed asunknown. An asterisk (*) in a data cell indicates the count was fewer than five (5) and suppressed to avoid disclosing identifying information.
250
270
228
18
110
191
243
279
243
266
128
248
203
9
Southwest
120,636
117,404
JASPER COUNTY
987
862
350
90
398
345
43
2,775
175
16
12
1,004
695
1,537
450
370
485
411
19
1,089
2,531
0
23
198
43
157
224
235
381
305
1,077
710
1,752
530
455
485
462
18
1,338
187
38
156
299
327
272
239
240
159
#Name?
Page G-050
MENTAL ILLNESS TREATMENT SERVICES -- DIVISION OF BEHAVIORAL HEALTH
FY2018 FY2017
RACE / ETHNICITY
TREATMENT ACCOMMODATION
2019 Status Report on Missouri's Substance Use and Mental Health
6676
389
2,039 1,757244
242
262
254
237
17
*
0
2,6772,969NUMBER SERVED
PLANNING REGION
PSYCHIATRIC SERVICE AREA
2018 POPULATION ESTIMATE
CENSUS 2010
FY2019 FY2018 FY2017
Individuals who received psychiatric services had the following types ofdisorders. The total number of diagnoses is larger than the numberserved because some individuals had more than one type of disorder.
2,614
118
13
*
127
1,192
851
376
93
208
0
457
2,363
296
12
2,160
*
29
239
132
115
0
*
*
999
726
1,668
512
467
467
431
15
1,255
202
48
187
192
1,531
110
1,552
177
116
856 636
280 198
FY2018 FY2017
1,388
1,581
Gender Unknown 00
000
0
1,688
1,476
3,164
265
231
273
271
287
0
190
FY2019
16
33
103
*
9
110
2,852
186
244
269
308
352
288
157
33
FY2019
260
852
125
209
1,718
0
*
16
2,353
400
320
295
196
135
36
196
17
0
2,763
13
132
3,015
131
477
1,250
906
Total Disorders Diagnosed 6,3507,090 6,790
Missouri Department of Mental Health, Division of Behavioral Health
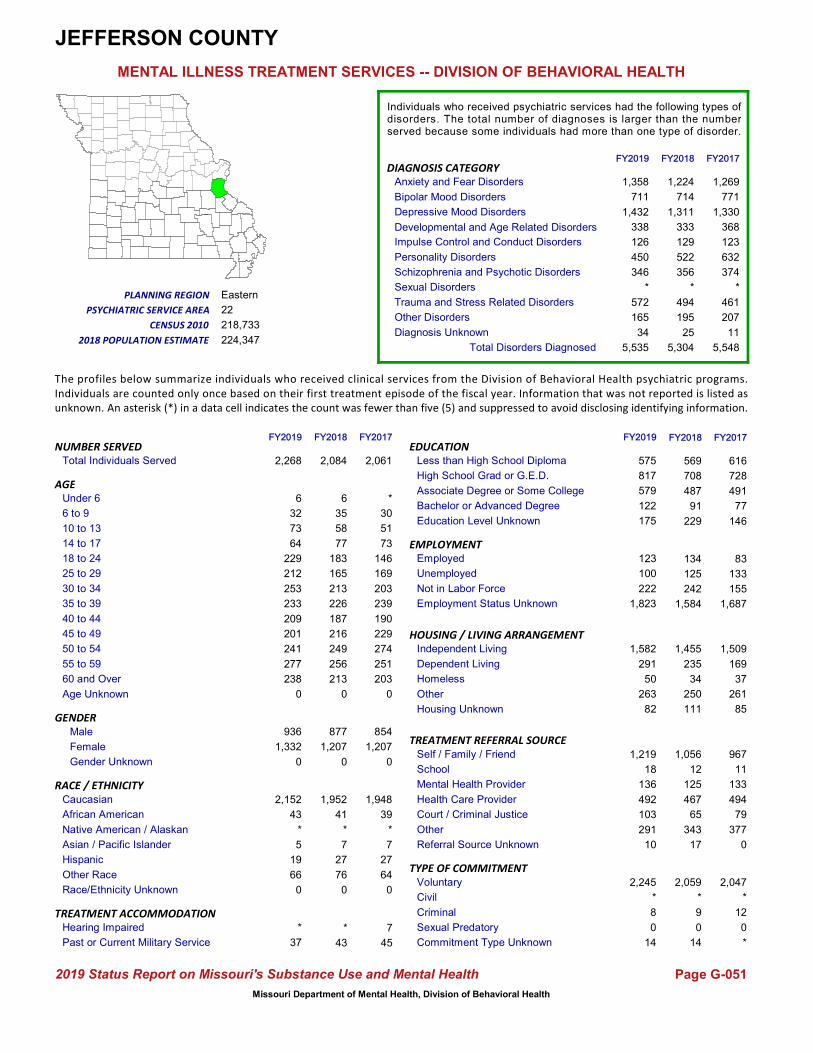
Total Individuals Served
Housing Unknown
Other
Homeless
Independent Living
Dependent Living
HOUSING / LIVING ARRANGEMENT
Employment Status Unknown
Not in Labor Force
Unemployed
Employed
Referral Source Unknown
Other
Court / Criminal Justice
Health Care Provider
Mental Health Provider
School
Self / Family / Friend
Education Level Unknown
Bachelor or Advanced Degree
Associate Degree or Some College
High School Grad or G.E.D.
Less than High School Diploma
Commitment Type Unknown
Sexual Predatory
Criminal
Civil
Voluntary
TREATMENT REFERRAL SOURCE
EMPLOYMENT
EDUCATION
TYPE OF COMMITMENT
Age Unknown
55 to 59
50 to 54
60 and Over
30 to 34
25 to 29
18 to 24
14 to 17
10 to 13
6 to 9
Under 6
40 to 44
35 to 39
45 to 49
AGE
Hearing Impaired
Past or Current Military Service7
45
Race/Ethnicity Unknown
Other Race
Hispanic
Asian / Pacific Islander
Native American / Alaskan
African American
Caucasian
0
64
27
7
*
39
1,948
GENDERMale
Female 1,207
854
Diagnosis Unknown
Other Disorders
Sexual Disorders
Schizophrenia and Psychotic Disorders
Personality Disorders
Depressive Mood Disorders
Impulse Control and Conduct DisordersDevelopmental and Age Related Disorders
Trauma and Stress Related Disorders
Anxiety and Fear Disorders
Bipolar Mood Disorders
DIAGNOSIS CATEGORY
The profiles below summarize individuals who received clinical services from the Division of Behavioral Health psychiatric programs.Individuals are counted only once based on their first treatment episode of the fiscal year. Information that was not reported is listed asunknown. An asterisk (*) in a data cell indicates the count was fewer than five (5) and suppressed to avoid disclosing identifying information.
229
239
190
*
30
51
73
146
169
203
203
274
251
22
Eastern
224,347
218,733
JEFFERSON COUNTY
616
728
491
77
125
242
43
2,059
*
9
*
1,269
771
1,330
368
123
632
374
*
461
1,056
12
125
467
65
343
207
83
133
155
1,358
711
1,432
338
126
450
346
*
572
165
6
35
58
77
183
165
213
213
#Name?
Page G-051
MENTAL ILLNESS TREATMENT SERVICES -- DIVISION OF BEHAVIORAL HEALTH
FY2018 FY2017
RACE / ETHNICITY
TREATMENT ACCOMMODATION
2019 Status Report on Missouri's Substance Use and Mental Health
1134
146
1,584 1,687226
187
216
249
256
17
0
14
2,0612,084NUMBER SERVED
PLANNING REGION
PSYCHIATRIC SERVICE AREA
2018 POPULATION ESTIMATE
CENSUS 2010
FY2019 FY2018 FY2017
Individuals who received psychiatric services had the following types ofdisorders. The total number of diagnoses is larger than the numberserved because some individuals had more than one type of disorder.
1,952
41
*
7
27
569
708
487
91
76
0
229
2,047
*
12
967
11
133
494
79
377
0
0
*
1,224
714
1,311
333
129
522
356
*
494
195
25
134
235
1,455
34
1,509
169
37
250 261
111 85
FY2018 FY2017
877
1,207
Gender Unknown 00
000
0
1,332
936
2,268
277
241
201
209
233
0
66
FY2019
*
37
19
5
*
43
2,152
238
253
212
229
64
73
32
6
FY2019
82
263
50
291
1,582
14
0
10
1,823
175
222
100
123
291
103
492
136
18
1,219
8
*
2,245
122
579
575
817
Total Disorders Diagnosed 5,5485,535 5,304
Missouri Department of Mental Health, Division of Behavioral Health

Total Individuals Served
Housing Unknown
Other
Homeless
Independent Living
Dependent Living
HOUSING / LIVING ARRANGEMENT
Employment Status Unknown
Not in Labor Force
Unemployed
Employed
Referral Source Unknown
Other
Court / Criminal Justice
Health Care Provider
Mental Health Provider
School
Self / Family / Friend
Education Level Unknown
Bachelor or Advanced Degree
Associate Degree or Some College
High School Grad or G.E.D.
Less than High School Diploma
Commitment Type Unknown
Sexual Predatory
Criminal
Civil
Voluntary
TREATMENT REFERRAL SOURCE
EMPLOYMENT
EDUCATION
TYPE OF COMMITMENT
Age Unknown
55 to 59
50 to 54
60 and Over
30 to 34
25 to 29
18 to 24
14 to 17
10 to 13
6 to 9
Under 6
40 to 44
35 to 39
45 to 49
AGE
Hearing Impaired
Past or Current Military Service*
14
Race/Ethnicity Unknown
Other Race
Hispanic
Asian / Pacific Islander
Native American / Alaskan
African American
Caucasian
0
23
12
*
*
28
455
GENDERMale
Female 281
227
Diagnosis Unknown
Other Disorders
Sexual Disorders
Schizophrenia and Psychotic Disorders
Personality Disorders
Depressive Mood Disorders
Impulse Control and Conduct DisordersDevelopmental and Age Related Disorders
Trauma and Stress Related Disorders
Anxiety and Fear Disorders
Bipolar Mood Disorders
DIAGNOSIS CATEGORY
The profiles below summarize individuals who received clinical services from the Division of Behavioral Health psychiatric programs.Individuals are counted only once based on their first treatment episode of the fiscal year. Information that was not reported is listed asunknown. An asterisk (*) in a data cell indicates the count was fewer than five (5) and suppressed to avoid disclosing identifying information.
48
54
50
6
18
37
45
44
34
47
35
57
33
7
Northwest
53,652
52,595
JOHNSON COUNTY
182
206
78
25
26
74
15
609
*
*
8
118
131
244
69
28
11
74
0
121
494
*
47
41
*
24
*
19
15
46
206
150
292
62
42
14
69
0
145
*
6
24
41
42
70
48
55
36
#Name?
Page G-052
MENTAL ILLNESS TREATMENT SERVICES -- DIVISION OF BEHAVIORAL HEALTH
FY2018 FY2017
RACE / ETHNICITY
TREATMENT ACCOMMODATION
2019 Status Report on Missouri's Substance Use and Mental Health
536
18
490 42961
62
65
57
47
*
0
0
508614NUMBER SERVED
PLANNING REGION
PSYCHIATRIC SERVICE AREA
2018 POPULATION ESTIMATE
CENSUS 2010
FY2019 FY2018 FY2017
Individuals who received psychiatric services had the following types ofdisorders. The total number of diagnoses is larger than the numberserved because some individuals had more than one type of disorder.
543
38
*
*
16
199
253
92
27
26
0
43
504
*
*
424
*
12
37
5
27
0
0
*
155
144
273
64
33
12
65
0
124
6
18
24
70
339
47
300
60
26
138 120
20 *
FY2018 FY2017
260
354
Gender Unknown 00
000
0
418
278
696
56
57
64
64
61
0
44
FY2019
14
17
23
*
*
41
603
44
67
55
88
49
50
35
6
FY2019
47
152
32
86
379
0
0
6
513
97
104
40
39
64
*
49
44
*
528
7
*
687
30
83
210
276
Total Disorders Diagnosed 8051,020 894
Missouri Department of Mental Health, Division of Behavioral Health

Total Individuals Served
Housing Unknown
Other
Homeless
Independent Living
Dependent Living
HOUSING / LIVING ARRANGEMENT
Employment Status Unknown
Not in Labor Force
Unemployed
Employed
Referral Source Unknown
Other
Court / Criminal Justice
Health Care Provider
Mental Health Provider
School
Self / Family / Friend
Education Level Unknown
Bachelor or Advanced Degree
Associate Degree or Some College
High School Grad or G.E.D.
Less than High School Diploma
Commitment Type Unknown
Sexual Predatory
Criminal
Civil
Voluntary
TREATMENT REFERRAL SOURCE
EMPLOYMENT
EDUCATION
TYPE OF COMMITMENT
Age Unknown
55 to 59
50 to 54
60 and Over
30 to 34
25 to 29
18 to 24
14 to 17
10 to 13
6 to 9
Under 6
40 to 44
35 to 39
45 to 49
AGE
Hearing Impaired
Past or Current Military Service0
*
Race/Ethnicity Unknown
Other Race
Hispanic
Asian / Pacific Islander
Native American / Alaskan
African American
Caucasian
0
*
0
0
0
11
56
GENDERMale
Female 28
43
Diagnosis Unknown
Other Disorders
Sexual Disorders
Schizophrenia and Psychotic Disorders
Personality Disorders
Depressive Mood Disorders
Impulse Control and Conduct DisordersDevelopmental and Age Related Disorders
Trauma and Stress Related Disorders
Anxiety and Fear Disorders
Bipolar Mood Disorders
DIAGNOSIS CATEGORY
The profiles below summarize individuals who received clinical services from the Division of Behavioral Health psychiatric programs.Individuals are counted only once based on their first treatment episode of the fiscal year. Information that was not reported is listed asunknown. An asterisk (*) in a data cell indicates the count was fewer than five (5) and suppressed to avoid disclosing identifying information.
10
9
7
0
*
*
*
*
*
*
10
9
7
14
Central
3,947
4,131
KNOX COUNTY
26
30
11
*
*
*
*
76
0
0
*
11
18
21
*
*
*
29
0
7
18
0
*
29
0
25
0
5
*
*
8
17
22
10
7
0
26
0
6
*
0
5
6
5
*
*
*
10
#Name?
Page G-053
MENTAL ILLNESS TREATMENT SERVICES -- DIVISION OF BEHAVIORAL HEALTH
FY2018 FY2017
RACE / ETHNICITY
TREATMENT ACCOMMODATION
2019 Status Report on Missouri's Substance Use and Mental Health
*0
*
70 628
8
5
5
13
0
0
0
7175NUMBER SERVED
PLANNING REGION
PSYCHIATRIC SERVICE AREA
2018 POPULATION ESTIMATE
CENSUS 2010
FY2019 FY2018 FY2017
Individuals who received psychiatric services had the following types ofdisorders. The total number of diagnoses is larger than the numberserved because some individuals had more than one type of disorder.
58
12
0
0
0
33
31
6
*
5
0
*
71
0
0
14
0
*
36
0
18
0
0
0
9
15
24
6
8
0
25
0
6
*
*
*
*
15
*
18
*
*
47 38
11 12
FY2018 FY2017
48
27
Gender Unknown 00
000
0
28
50
78
11
6
7
9
5
0
*
FY2019
*
*
0
0
0
11
63
15
*
*
*
*
*
7
*
FY2019
7
48
0
6
17
0
0
0
74
*
*
0
*
27
0
29
5
0
17
0
0
78
6
*
31
35
Total Disorders Diagnosed 9797 97
Missouri Department of Mental Health, Division of Behavioral Health

Total Individuals Served
Housing Unknown
Other
Homeless
Independent Living
Dependent Living
HOUSING / LIVING ARRANGEMENT
Employment Status Unknown
Not in Labor Force
Unemployed
Employed
Referral Source Unknown
Other
Court / Criminal Justice
Health Care Provider
Mental Health Provider
School
Self / Family / Friend
Education Level Unknown
Bachelor or Advanced Degree
Associate Degree or Some College
High School Grad or G.E.D.
Less than High School Diploma
Commitment Type Unknown
Sexual Predatory
Criminal
Civil
Voluntary
TREATMENT REFERRAL SOURCE
EMPLOYMENT
EDUCATION
TYPE OF COMMITMENT
Age Unknown
55 to 59
50 to 54
60 and Over
30 to 34
25 to 29
18 to 24
14 to 17
10 to 13
6 to 9
Under 6
40 to 44
35 to 39
45 to 49
AGE
Hearing Impaired
Past or Current Military Service*
9
Race/Ethnicity Unknown
Other Race
Hispanic
Asian / Pacific Islander
Native American / Alaskan
African American
Caucasian
0
33
16
0
*
7
479
GENDERMale
Female 306
216
Diagnosis Unknown
Other Disorders
Sexual Disorders
Schizophrenia and Psychotic Disorders
Personality Disorders
Depressive Mood Disorders
Impulse Control and Conduct DisordersDevelopmental and Age Related Disorders
Trauma and Stress Related Disorders
Anxiety and Fear Disorders
Bipolar Mood Disorders
DIAGNOSIS CATEGORY
The profiles below summarize individuals who received clinical services from the Division of Behavioral Health psychiatric programs.Individuals are counted only once based on their first treatment episode of the fiscal year. Information that was not reported is listed asunknown. An asterisk (*) in a data cell indicates the count was fewer than five (5) and suppressed to avoid disclosing identifying information.
40
42
41
5
39
58
54
29
37
37
40
52
49
11
Central
35,713
35,571
LACLEDE COUNTY
279
155
54
10
18
41
7
560
*
*
5
180
79
266
81
62
18
62
*
162
341
*
25
81
20
91
7
13
20
34
189
81
308
117
73
17
70
*
200
6
10
38
72
73
45
34
25
37
#Name?
Page G-054
MENTAL ILLNESS TREATMENT SERVICES -- DIVISION OF BEHAVIORAL HEALTH
FY2018 FY2017
RACE / ETHNICITY
TREATMENT ACCOMMODATION
2019 Status Report on Missouri's Substance Use and Mental Health
639
25
493 45652
38
39
47
54
*
0
0
523564NUMBER SERVED
PLANNING REGION
PSYCHIATRIC SERVICE AREA
2018 POPULATION ESTIMATE
CENSUS 2010
FY2019 FY2018 FY2017
Individuals who received psychiatric services had the following types ofdisorders. The total number of diagnoses is larger than the numberserved because some individuals had more than one type of disorder.
511
9
*
0
15
301
164
60
8
39
0
31
516
*
*
300
*
10
90
29
91
0
0
0
193
74
294
96
77
18
59
*
170
7
14
12
61
243
17
244
65
11
220 198
23 5
FY2018 FY2017
233
331
Gender Unknown *0
000
0
383
267
650
56
46
45
48
43
0
47
FY2019
13
6
24
0
*
7
592
42
38
41
71
82
82
42
14
FY2019
40
242
23
65
280
0
0
6
540
77
56
29
25
105
25
94
24
*
392
5
*
644
8
69
307
189
Total Disorders Diagnosed 9251,102 1,004
Missouri Department of Mental Health, Division of Behavioral Health

Total Individuals Served
Housing Unknown
Other
Homeless
Independent Living
Dependent Living
HOUSING / LIVING ARRANGEMENT
Employment Status Unknown
Not in Labor Force
Unemployed
Employed
Referral Source Unknown
Other
Court / Criminal Justice
Health Care Provider
Mental Health Provider
School
Self / Family / Friend
Education Level Unknown
Bachelor or Advanced Degree
Associate Degree or Some College
High School Grad or G.E.D.
Less than High School Diploma
Commitment Type Unknown
Sexual Predatory
Criminal
Civil
Voluntary
TREATMENT REFERRAL SOURCE
EMPLOYMENT
EDUCATION
TYPE OF COMMITMENT
Age Unknown
55 to 59
50 to 54
60 and Over
30 to 34
25 to 29
18 to 24
14 to 17
10 to 13
6 to 9
Under 6
40 to 44
35 to 39
45 to 49
AGE
Hearing Impaired
Past or Current Military Service0
10
Race/Ethnicity Unknown
Other Race
Hispanic
Asian / Pacific Islander
Native American / Alaskan
African American
Caucasian
0
9
*
*
*
17
284
GENDERMale
Female 177
135
Diagnosis Unknown
Other Disorders
Sexual Disorders
Schizophrenia and Psychotic Disorders
Personality Disorders
Depressive Mood Disorders
Impulse Control and Conduct DisordersDevelopmental and Age Related Disorders
Trauma and Stress Related Disorders
Anxiety and Fear Disorders
Bipolar Mood Disorders
DIAGNOSIS CATEGORY
The profiles below summarize individuals who received clinical services from the Division of Behavioral Health psychiatric programs.Individuals are counted only once based on their first treatment episode of the fiscal year. Information that was not reported is listed asunknown. An asterisk (*) in a data cell indicates the count was fewer than five (5) and suppressed to avoid disclosing identifying information.
23
24
20
*
31
42
31
15
21
18
24
27
32
7
Northwest
32,598
33,381
LAFAYETTE COUNTY
149
98
36
7
6
52
10
343
0
*
*
67
45
126
58
34
14
33
0
94
242
0
35
49
*
15
*
13
*
19
89
45
139
43
21
12
37
0
90
*
7
33
45
30
27
26
24
29
#Name?
Page G-055
MENTAL ILLNESS TREATMENT SERVICES -- DIVISION OF BEHAVIORAL HEALTH
FY2018 FY2017
RACE / ETHNICITY
TREATMENT ACCOMMODATION
2019 Status Report on Missouri's Substance Use and Mental Health
*60
22
269 27615
22
24
32
34
5
0
*
312348NUMBER SERVED
PLANNING REGION
PSYCHIATRIC SERVICE AREA
2018 POPULATION ESTIMATE
CENSUS 2010
FY2019 FY2018 FY2017
Individuals who received psychiatric services had the following types ofdisorders. The total number of diagnoses is larger than the numberserved because some individuals had more than one type of disorder.
309
19
*
*
*
134
93
43
5
14
0
73
311
0
*
244
0
21
30
*
14
0
0
0
82
31
139
54
28
10
33
0
89
5
37
21
49
157
*
161
31
6
114 109
25 5
FY2018 FY2017
149
199
Gender Unknown 00
000
0
217
168
385
42
23
27
24
20
0
19
FY2019
*
8
11
*
*
21
343
34
25
26
28
43
43
39
11
FY2019
31
134
7
43
170
*
0
6
283
103
64
15
23
54
*
43
33
8
240
5
0
378
5
39
122
116
Total Disorders Diagnosed 479538 508
Missouri Department of Mental Health, Division of Behavioral Health

Total Individuals Served
Housing Unknown
Other
Homeless
Independent Living
Dependent Living
HOUSING / LIVING ARRANGEMENT
Employment Status Unknown
Not in Labor Force
Unemployed
Employed
Referral Source Unknown
Other
Court / Criminal Justice
Health Care Provider
Mental Health Provider
School
Self / Family / Friend
Education Level Unknown
Bachelor or Advanced Degree
Associate Degree or Some College
High School Grad or G.E.D.
Less than High School Diploma
Commitment Type Unknown
Sexual Predatory
Criminal
Civil
Voluntary
TREATMENT REFERRAL SOURCE
EMPLOYMENT
EDUCATION
TYPE OF COMMITMENT
Age Unknown
55 to 59
50 to 54
60 and Over
30 to 34
25 to 29
18 to 24
14 to 17
10 to 13
6 to 9
Under 6
40 to 44
35 to 39
45 to 49
AGE
Hearing Impaired
Past or Current Military Service*
14
Race/Ethnicity Unknown
Other Race
Hispanic
Asian / Pacific Islander
Native American / Alaskan
African American
Caucasian
0
35
16
*
0
*
627
GENDERMale
Female 355
311
Diagnosis Unknown
Other Disorders
Sexual Disorders
Schizophrenia and Psychotic Disorders
Personality Disorders
Depressive Mood Disorders
Impulse Control and Conduct DisordersDevelopmental and Age Related Disorders
Trauma and Stress Related Disorders
Anxiety and Fear Disorders
Bipolar Mood Disorders
DIAGNOSIS CATEGORY
The profiles below summarize individuals who received clinical services from the Division of Behavioral Health psychiatric programs.Individuals are counted only once based on their first treatment episode of the fiscal year. Information that was not reported is listed asunknown. An asterisk (*) in a data cell indicates the count was fewer than five (5) and suppressed to avoid disclosing identifying information.
58
43
46
9
48
52
109
46
40
51
61
55
48
8A
Southwest
38,359
38,634
LAWRENCE COUNTY
333
193
77
16
33
61
11
637
*
*
*
201
181
351
143
130
128
95
*
229
335
53
33
108
29
83
18
26
27
54
196
130
324
133
121
90
81
*
225
14
12
55
61
85
39
46
50
54
#Name?
Page G-056
MENTAL ILLNESS TREATMENT SERVICES -- DIVISION OF BEHAVIORAL HEALTH
FY2018 FY2017
RACE / ETHNICITY
TREATMENT ACCOMMODATION
2019 Status Report on Missouri's Substance Use and Mental Health
1827
45
514 55745
42
52
56
47
*
0
0
666644NUMBER SERVED
PLANNING REGION
PSYCHIATRIC SERVICE AREA
2018 POPULATION ESTIMATE
CENSUS 2010
FY2019 FY2018 FY2017
Individuals who received psychiatric services had the following types ofdisorders. The total number of diagnoses is larger than the numberserved because some individuals had more than one type of disorder.
602
6
0
*
11
317
191
55
11
31
0
70
655
7
*
324
56
47
102
24
112
*
0
0
200
158
347
138
127
109
98
*
242
16
23
37
39
340
10
349
35
9
233 261
23 12
FY2018 FY2017
306
338
Gender Unknown 00
000
0
293
301
594
42
45
46
42
37
0
30
FY2019
9
9
10
*
0
7
556
44
37
40
51
71
79
54
6
FY2019
21
232
9
40
292
0
0
*
496
30
52
27
19
73
46
95
36
49
291
*
*
590
11
58
325
170
Total Disorders Diagnosed 1,4971,345 1,461
Missouri Department of Mental Health, Division of Behavioral Health

Total Individuals Served
Housing Unknown
Other
Homeless
Independent Living
Dependent Living
HOUSING / LIVING ARRANGEMENT
Employment Status Unknown
Not in Labor Force
Unemployed
Employed
Referral Source Unknown
Other
Court / Criminal Justice
Health Care Provider
Mental Health Provider
School
Self / Family / Friend
Education Level Unknown
Bachelor or Advanced Degree
Associate Degree or Some College
High School Grad or G.E.D.
Less than High School Diploma
Commitment Type Unknown
Sexual Predatory
Criminal
Civil
Voluntary
TREATMENT REFERRAL SOURCE
EMPLOYMENT
EDUCATION
TYPE OF COMMITMENT
Age Unknown
55 to 59
50 to 54
60 and Over
30 to 34
25 to 29
18 to 24
14 to 17
10 to 13
6 to 9
Under 6
40 to 44
35 to 39
45 to 49
AGE
Hearing Impaired
Past or Current Military Service0
*
Race/Ethnicity Unknown
Other Race
Hispanic
Asian / Pacific Islander
Native American / Alaskan
African American
Caucasian
0
6
*
0
*
*
90
GENDERMale
Female 54
46
Diagnosis Unknown
Other Disorders
Sexual Disorders
Schizophrenia and Psychotic Disorders
Personality Disorders
Depressive Mood Disorders
Impulse Control and Conduct DisordersDevelopmental and Age Related Disorders
Trauma and Stress Related Disorders
Anxiety and Fear Disorders
Bipolar Mood Disorders
DIAGNOSIS CATEGORY
The profiles below summarize individuals who received clinical services from the Division of Behavioral Health psychiatric programs.Individuals are counted only once based on their first treatment episode of the fiscal year. Information that was not reported is listed asunknown. An asterisk (*) in a data cell indicates the count was fewer than five (5) and suppressed to avoid disclosing identifying information.
8
10
5
0
17
14
13
7
9
*
*
7
7
14
Central
9,855
10,211
LEWIS COUNTY
59
22
9
*
*
9
*
123
0
*
0
19
37
30
32
13
*
5
0
14
15
0
9
12
*
86
0
0
*
8
31
35
43
45
21
5
6
0
19
*
*
12
25
19
9
7
6
*
#Name?
Page G-057
MENTAL ILLNESS TREATMENT SERVICES -- DIVISION OF BEHAVIORAL HEALTH
FY2018 FY2017
RACE / ETHNICITY
TREATMENT ACCOMMODATION
2019 Status Report on Missouri's Substance Use and Mental Health
00
8
111 929
10
9
7
7
*
0
0
100124NUMBER SERVED
PLANNING REGION
PSYCHIATRIC SERVICE AREA
2018 POPULATION ESTIMATE
CENSUS 2010
FY2019 FY2018 FY2017
Individuals who received psychiatric services had the following types ofdisorders. The total number of diagnoses is larger than the numberserved because some individuals had more than one type of disorder.
110
5
*
0
*
69
34
11
*
7
0
8
100
0
0
15
*
6
8
0
70
0
0
0
27
39
46
38
17
5
6
0
14
*
0
*
11
52
0
47
5
0
58 46
* *
FY2018 FY2017
63
61
Gender Unknown 00
000
0
67
71
138
*
6
8
7
7
0
8
FY2019
0
*
0
0
*
5
124
8
10
6
12
21
25
22
*
FY2019
*
74
0
9
51
0
0
*
124
18
10
*
*
107
0
10
9
0
11
*
0
137
*
14
76
28
Total Disorders Diagnosed 151207 194
Missouri Department of Mental Health, Division of Behavioral Health

Total Individuals Served
Housing Unknown
Other
Homeless
Independent Living
Dependent Living
HOUSING / LIVING ARRANGEMENT
Employment Status Unknown
Not in Labor Force
Unemployed
Employed
Referral Source Unknown
Other
Court / Criminal Justice
Health Care Provider
Mental Health Provider
School
Self / Family / Friend
Education Level Unknown
Bachelor or Advanced Degree
Associate Degree or Some College
High School Grad or G.E.D.
Less than High School Diploma
Commitment Type Unknown
Sexual Predatory
Criminal
Civil
Voluntary
TREATMENT REFERRAL SOURCE
EMPLOYMENT
EDUCATION
TYPE OF COMMITMENT
Age Unknown
55 to 59
50 to 54
60 and Over
30 to 34
25 to 29
18 to 24
14 to 17
10 to 13
6 to 9
Under 6
40 to 44
35 to 39
45 to 49
AGE
Hearing Impaired
Past or Current Military Service*
17
Race/Ethnicity Unknown
Other Race
Hispanic
Asian / Pacific Islander
Native American / Alaskan
African American
Caucasian
0
44
15
0
*
45
877
GENDERMale
Female 515
454
Diagnosis Unknown
Other Disorders
Sexual Disorders
Schizophrenia and Psychotic Disorders
Personality Disorders
Depressive Mood Disorders
Impulse Control and Conduct DisordersDevelopmental and Age Related Disorders
Trauma and Stress Related Disorders
Anxiety and Fear Disorders
Bipolar Mood Disorders
DIAGNOSIS CATEGORY
The profiles below summarize individuals who received clinical services from the Division of Behavioral Health psychiatric programs.Individuals are counted only once based on their first treatment episode of the fiscal year. Information that was not reported is listed asunknown. An asterisk (*) in a data cell indicates the count was fewer than five (5) and suppressed to avoid disclosing identifying information.
71
80
60
17
99
106
108
66
70
61
75
79
77
16
Eastern
57,686
52,566
LINCOLN COUNTY
369
209
85
7
132
96
13
950
*
*
*
229
241
415
180
57
59
170
*
190
188
157
16
68
9
507
11
56
186
127
273
193
399
172
42
42
121
0
186
*
14
118
132
105
70
67
55
70
#Name?
Page G-058
MENTAL ILLNESS TREATMENT SERVICES -- DIVISION OF BEHAVIORAL HEALTH
FY2018 FY2017
RACE / ETHNICITY
TREATMENT ACCOMMODATION
2019 Status Report on Missouri's Substance Use and Mental Health
*29
298
691 59969
52
59
64
78
8
0
*
969953NUMBER SERVED
PLANNING REGION
PSYCHIATRIC SERVICE AREA
2018 POPULATION ESTIMATE
CENSUS 2010
FY2019 FY2018 FY2017
Individuals who received psychiatric services had the following types ofdisorders. The total number of diagnoses is larger than the numberserved because some individuals had more than one type of disorder.
840
39
*
0
19
449
203
79
12
71
0
211
962
*
5
166
97
23
65
19
598
*
0
*
248
209
417
200
56
49
150
*
202
10
26
34
39
416
14
472
45
14
366 347
118 92
FY2018 FY2017
459
494
Gender Unknown 00
000
0
512
473
985
71
62
51
62
79
0
74
FY2019
14
9
33
0
*
38
871
75
58
64
66
108
157
119
13
FY2019
129
412
15
45
384
*
0
*
698
213
135
109
43
513
7
81
15
137
227
*
*
982
15
87
462
208
Total Disorders Diagnosed 1,5571,461 1,568
Missouri Department of Mental Health, Division of Behavioral Health
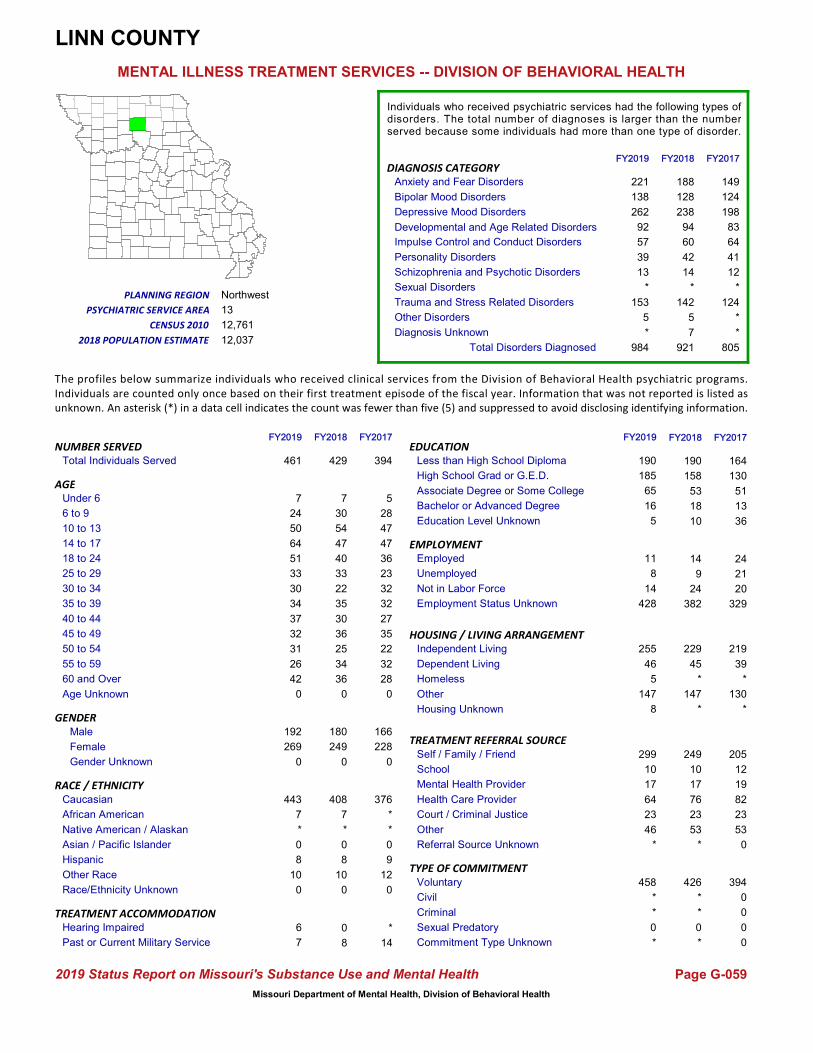
Total Individuals Served
Housing Unknown
Other
Homeless
Independent Living
Dependent Living
HOUSING / LIVING ARRANGEMENT
Employment Status Unknown
Not in Labor Force
Unemployed
Employed
Referral Source Unknown
Other
Court / Criminal Justice
Health Care Provider
Mental Health Provider
School
Self / Family / Friend
Education Level Unknown
Bachelor or Advanced Degree
Associate Degree or Some College
High School Grad or G.E.D.
Less than High School Diploma
Commitment Type Unknown
Sexual Predatory
Criminal
Civil
Voluntary
TREATMENT REFERRAL SOURCE
EMPLOYMENT
EDUCATION
TYPE OF COMMITMENT
Age Unknown
55 to 59
50 to 54
60 and Over
30 to 34
25 to 29
18 to 24
14 to 17
10 to 13
6 to 9
Under 6
40 to 44
35 to 39
45 to 49
AGE
Hearing Impaired
Past or Current Military Service*
14
Race/Ethnicity Unknown
Other Race
Hispanic
Asian / Pacific Islander
Native American / Alaskan
African American
Caucasian
0
12
9
0
*
*
376
GENDERMale
Female 228
166
Diagnosis Unknown
Other Disorders
Sexual Disorders
Schizophrenia and Psychotic Disorders
Personality Disorders
Depressive Mood Disorders
Impulse Control and Conduct DisordersDevelopmental and Age Related Disorders
Trauma and Stress Related Disorders
Anxiety and Fear Disorders
Bipolar Mood Disorders
DIAGNOSIS CATEGORY
The profiles below summarize individuals who received clinical services from the Division of Behavioral Health psychiatric programs.Individuals are counted only once based on their first treatment episode of the fiscal year. Information that was not reported is listed asunknown. An asterisk (*) in a data cell indicates the count was fewer than five (5) and suppressed to avoid disclosing identifying information.
35
32
27
5
28
47
47
36
23
32
28
22
32
13
Northwest
12,037
12,761
LINN COUNTY
164
130
51
13
9
24
8
426
*
*
0
149
124
198
83
64
41
12
*
124
249
10
17
76
23
53
*
24
21
20
221
138
262
92
57
39
13
*
153
5
7
30
54
47
40
33
22
36
#Name?
Page G-059
MENTAL ILLNESS TREATMENT SERVICES -- DIVISION OF BEHAVIORAL HEALTH
FY2018 FY2017
RACE / ETHNICITY
TREATMENT ACCOMMODATION
2019 Status Report on Missouri's Substance Use and Mental Health
**
36
382 32935
30
36
25
34
*
0
*
394429NUMBER SERVED
PLANNING REGION
PSYCHIATRIC SERVICE AREA
2018 POPULATION ESTIMATE
CENSUS 2010
FY2019 FY2018 FY2017
Individuals who received psychiatric services had the following types ofdisorders. The total number of diagnoses is larger than the numberserved because some individuals had more than one type of disorder.
408
7
*
0
8
190
158
53
18
10
0
10
394
0
0
205
12
19
82
23
53
0
0
0
188
128
238
94
60
42
14
*
142
5
7
14
45
229
*
219
39
*
147 130
* *
FY2018 FY2017
180
249
Gender Unknown 00
000
0
269
192
461
26
31
32
37
34
0
10
FY2019
6
7
8
0
*
7
443
42
30
33
51
64
50
24
7
FY2019
8
147
5
46
255
*
0
*
428
5
14
8
11
46
23
64
17
10
299
*
*
458
16
65
190
185
Total Disorders Diagnosed 805984 921
Missouri Department of Mental Health, Division of Behavioral Health

Total Individuals Served
Housing Unknown
Other
Homeless
Independent Living
Dependent Living
HOUSING / LIVING ARRANGEMENT
Employment Status Unknown
Not in Labor Force
Unemployed
Employed
Referral Source Unknown
Other
Court / Criminal Justice
Health Care Provider
Mental Health Provider
School
Self / Family / Friend
Education Level Unknown
Bachelor or Advanced Degree
Associate Degree or Some College
High School Grad or G.E.D.
Less than High School Diploma
Commitment Type Unknown
Sexual Predatory
Criminal
Civil
Voluntary
TREATMENT REFERRAL SOURCE
EMPLOYMENT
EDUCATION
TYPE OF COMMITMENT
Age Unknown
55 to 59
50 to 54
60 and Over
30 to 34
25 to 29
18 to 24
14 to 17
10 to 13
6 to 9
Under 6
40 to 44
35 to 39
45 to 49
AGE
Hearing Impaired
Past or Current Military Service*
19
Race/Ethnicity Unknown
Other Race
Hispanic
Asian / Pacific Islander
Native American / Alaskan
African American
Caucasian
0
14
5
0
*
10
587
GENDERMale
Female 347
265
Diagnosis Unknown
Other Disorders
Sexual Disorders
Schizophrenia and Psychotic Disorders
Personality Disorders
Depressive Mood Disorders
Impulse Control and Conduct DisordersDevelopmental and Age Related Disorders
Trauma and Stress Related Disorders
Anxiety and Fear Disorders
Bipolar Mood Disorders
DIAGNOSIS CATEGORY
The profiles below summarize individuals who received clinical services from the Division of Behavioral Health psychiatric programs.Individuals are counted only once based on their first treatment episode of the fiscal year. Information that was not reported is listed asunknown. An asterisk (*) in a data cell indicates the count was fewer than five (5) and suppressed to avoid disclosing identifying information.
43
53
36
7
29
40
57
63
53
63
68
48
52
13
Northwest
15,146
15,195
LIVINGSTON COUNTY
216
267
76
22
6
11
12
630
*
0
0
220
149
317
88
55
62
73
*
191
359
30
18
114
61
50
8
33
28
31
263
168
339
120
70
57
59
*
229
11
10
42
53
52
64
52
55
75
#Name?
Page G-060
MENTAL ILLNESS TREATMENT SERVICES -- DIVISION OF BEHAVIORAL HEALTH
FY2018 FY2017
RACE / ETHNICITY
TREATMENT ACCOMMODATION
2019 Status Report on Missouri's Substance Use and Mental Health
510
31
608 52053
37
43
47
52
*
0
*
612635NUMBER SERVED
PLANNING REGION
PSYCHIATRIC SERVICE AREA
2018 POPULATION ESTIMATE
CENSUS 2010
FY2019 FY2018 FY2017
Individuals who received psychiatric services had the following types ofdisorders. The total number of diagnoses is larger than the numberserved because some individuals had more than one type of disorder.
593
13
*
*
8
250
254
96
26
26
0
8
611
0
*
337
17
20
130
52
56
0
0
0
244
160
338
96
68
69
60
*
219
14
9
9
74
330
9
352
56
6
205 178
16 20
FY2018 FY2017
278
357
Gender Unknown 00
000
0
354
291
645
50
40
47
44
51
0
19
FY2019
5
9
7
*
0
13
612
77
48
61
54
56
55
49
13
FY2019
26
208
6
52
353
*
0
*
616
8
8
8
13
56
69
115
20
29
354
*
0
641
22
94
256
265
Total Disorders Diagnosed 1,1691,327 1,278
Missouri Department of Mental Health, Division of Behavioral Health

Total Individuals Served
Housing Unknown
Other
Homeless
Independent Living
Dependent Living
HOUSING / LIVING ARRANGEMENT
Employment Status Unknown
Not in Labor Force
Unemployed
Employed
Referral Source Unknown
Other
Court / Criminal Justice
Health Care Provider
Mental Health Provider
School
Self / Family / Friend
Education Level Unknown
Bachelor or Advanced Degree
Associate Degree or Some College
High School Grad or G.E.D.
Less than High School Diploma
Commitment Type Unknown
Sexual Predatory
Criminal
Civil
Voluntary
TREATMENT REFERRAL SOURCE
EMPLOYMENT
EDUCATION
TYPE OF COMMITMENT
Age Unknown
55 to 59
50 to 54
60 and Over
30 to 34
25 to 29
18 to 24
14 to 17
10 to 13
6 to 9
Under 6
40 to 44
35 to 39
45 to 49
AGE
Hearing Impaired
Past or Current Military Service*
*
Race/Ethnicity Unknown
Other Race
Hispanic
Asian / Pacific Islander
Native American / Alaskan
African American
Caucasian
0
33
27
*
*
0
326
GENDERMale
Female 172
189
Diagnosis Unknown
Other Disorders
Sexual Disorders
Schizophrenia and Psychotic Disorders
Personality Disorders
Depressive Mood Disorders
Impulse Control and Conduct DisordersDevelopmental and Age Related Disorders
Trauma and Stress Related Disorders
Anxiety and Fear Disorders
Bipolar Mood Disorders
DIAGNOSIS CATEGORY
The profiles below summarize individuals who received clinical services from the Division of Behavioral Health psychiatric programs.Individuals are counted only once based on their first treatment episode of the fiscal year. Information that was not reported is listed asunknown. An asterisk (*) in a data cell indicates the count was fewer than five (5) and suppressed to avoid disclosing identifying information.
19
23
18
8
50
91
42
26
16
22
13
18
15
9
Southwest
23,078
23,083
MC DONALD COUNTY
229
58
19
*
45
34
5
347
27
*
*
84
61
159
81
65
26
38
0
124
329
0
*
14
*
24
16
21
30
31
95
60
171
81
84
31
41
*
157
10
14
61
72
46
22
20
23
19
#Name?
Page G-061
MENTAL ILLNESS TREATMENT SERVICES -- DIVISION OF BEHAVIORAL HEALTH
FY2018 FY2017
RACE / ETHNICITY
TREATMENT ACCOMMODATION
2019 Status Report on Missouri's Substance Use and Mental Health
1412
50
283 27816
20
23
18
20
*
0
0
361374NUMBER SERVED
PLANNING REGION
PSYCHIATRIC SERVICE AREA
2018 POPULATION ESTIMATE
CENSUS 2010
FY2019 FY2018 FY2017
Individuals who received psychiatric services had the following types ofdisorders. The total number of diagnoses is larger than the numberserved because some individuals had more than one type of disorder.
334
0
*
0
32
224
65
24
*
36
0
58
326
31
*
321
0
*
10
13
15
0
0
0
79
56
176
87
74
31
34
*
132
10
*
13
13
137
*
130
10
*
185 193
39 26
FY2018 FY2017
210
164
Gender Unknown 00
000
0
192
219
411
23
16
27
25
18
0
29
FY2019
*
*
27
*
*
*
379
13
28
29
30
56
79
54
13
FY2019
46
194
*
17
151
0
0
*
322
68
30
41
18
22
*
16
0
*
363
*
27
381
*
39
229
71
Total Disorders Diagnosed 668744 684
Missouri Department of Mental Health, Division of Behavioral Health

Total Individuals Served
Housing Unknown
Other
Homeless
Independent Living
Dependent Living
HOUSING / LIVING ARRANGEMENT
Employment Status Unknown
Not in Labor Force
Unemployed
Employed
Referral Source Unknown
Other
Court / Criminal Justice
Health Care Provider
Mental Health Provider
School
Self / Family / Friend
Education Level Unknown
Bachelor or Advanced Degree
Associate Degree or Some College
High School Grad or G.E.D.
Less than High School Diploma
Commitment Type Unknown
Sexual Predatory
Criminal
Civil
Voluntary
TREATMENT REFERRAL SOURCE
EMPLOYMENT
EDUCATION
TYPE OF COMMITMENT
Age Unknown
55 to 59
50 to 54
60 and Over
30 to 34
25 to 29
18 to 24
14 to 17
10 to 13
6 to 9
Under 6
40 to 44
35 to 39
45 to 49
AGE
Hearing Impaired
Past or Current Military Service0
*
Race/Ethnicity Unknown
Other Race
Hispanic
Asian / Pacific Islander
Native American / Alaskan
African American
Caucasian
0
*
*
*
*
15
125
GENDERMale
Female 86
61
Diagnosis Unknown
Other Disorders
Sexual Disorders
Schizophrenia and Psychotic Disorders
Personality Disorders
Depressive Mood Disorders
Impulse Control and Conduct DisordersDevelopmental and Age Related Disorders
Trauma and Stress Related Disorders
Anxiety and Fear Disorders
Bipolar Mood Disorders
DIAGNOSIS CATEGORY
The profiles below summarize individuals who received clinical services from the Division of Behavioral Health psychiatric programs.Individuals are counted only once based on their first treatment episode of the fiscal year. Information that was not reported is listed asunknown. An asterisk (*) in a data cell indicates the count was fewer than five (5) and suppressed to avoid disclosing identifying information.
8
7
10
*
14
15
31
15
7
11
5
10
11
14
Central
15,153
15,566
MACON COUNTY
77
43
13
*
*
5
*
163
0
0
*
29
42
56
27
20
*
7
0
28
37
*
*
30
*
93
0
5
5
11
29
37
58
35
11
6
12
0
31
0
*
16
18
31
16
8
16
5
#Name?
Page G-062
MENTAL ILLNESS TREATMENT SERVICES -- DIVISION OF BEHAVIORAL HEALTH
FY2018 FY2017
RACE / ETHNICITY
TREATMENT ACCOMMODATION
2019 Status Report on Missouri's Substance Use and Mental Health
**
7
153 1236
14
6
13
14
*
*
*
147164NUMBER SERVED
PLANNING REGION
PSYCHIATRIC SERVICE AREA
2018 POPULATION ESTIMATE
CENSUS 2010
FY2019 FY2018 FY2017
Individuals who received psychiatric services had the following types ofdisorders. The total number of diagnoses is larger than the numberserved because some individuals had more than one type of disorder.
137
17
*
*
*
88
58
12
*
6
0
*
146
0
*
30
*
*
19
*
94
0
0
0
25
48
56
31
17
9
9
0
28
0
*
5
10
81
*
61
13
*
67 69
6 *
FY2018 FY2017
62
102
Gender Unknown 00
000
0
98
72
170
12
11
7
13
9
0
9
FY2019
*
*
*
*
*
15
143
5
13
6
17
32
21
18
6
FY2019
8
77
*
14
69
0
*
*
155
10
9
*
*
104
*
30
*
*
27
0
0
169
*
12
86
58
Total Disorders Diagnosed 215220 227
Missouri Department of Mental Health, Division of Behavioral Health

Total Individuals Served
Housing Unknown
Other
Homeless
Independent Living
Dependent Living
HOUSING / LIVING ARRANGEMENT
Employment Status Unknown
Not in Labor Force
Unemployed
Employed
Referral Source Unknown
Other
Court / Criminal Justice
Health Care Provider
Mental Health Provider
School
Self / Family / Friend
Education Level Unknown
Bachelor or Advanced Degree
Associate Degree or Some College
High School Grad or G.E.D.
Less than High School Diploma
Commitment Type Unknown
Sexual Predatory
Criminal
Civil
Voluntary
TREATMENT REFERRAL SOURCE
EMPLOYMENT
EDUCATION
TYPE OF COMMITMENT
Age Unknown
55 to 59
50 to 54
60 and Over
30 to 34
25 to 29
18 to 24
14 to 17
10 to 13
6 to 9
Under 6
40 to 44
35 to 39
45 to 49
AGE
Hearing Impaired
Past or Current Military Service5
11
Race/Ethnicity Unknown
Other Race
Hispanic
Asian / Pacific Islander
Native American / Alaskan
African American
Caucasian
0
15
5
*
*
*
425
GENDERMale
Female 245
200
Diagnosis Unknown
Other Disorders
Sexual Disorders
Schizophrenia and Psychotic Disorders
Personality Disorders
Depressive Mood Disorders
Impulse Control and Conduct DisordersDevelopmental and Age Related Disorders
Trauma and Stress Related Disorders
Anxiety and Fear Disorders
Bipolar Mood Disorders
DIAGNOSIS CATEGORY
The profiles below summarize individuals who received clinical services from the Division of Behavioral Health psychiatric programs.Individuals are counted only once based on their first treatment episode of the fiscal year. Information that was not reported is listed asunknown. An asterisk (*) in a data cell indicates the count was fewer than five (5) and suppressed to avoid disclosing identifying information.
35
37
40
*
32
38
32
39
34
34
40
47
33
21
Southeast
12,188
12,226
MADISON COUNTY
161
141
22
8
64
50
9
417
0
0
8
60
134
184
75
27
23
62
*
55
264
*
14
72
27
37
*
54
61
64
56
98
150
66
22
9
48
*
53
*
*
27
35
32
35
39
26
36
#Name?
Page G-063
MENTAL ILLNESS TREATMENT SERVICES -- DIVISION OF BEHAVIORAL HEALTH
FY2018 FY2017
RACE / ETHNICITY
TREATMENT ACCOMMODATION
2019 Status Report on Missouri's Substance Use and Mental Health
1819
113
248 26648
32
37
37
31
0
0
0
445418NUMBER SERVED
PLANNING REGION
PSYCHIATRIC SERVICE AREA
2018 POPULATION ESTIMATE
CENSUS 2010
FY2019 FY2018 FY2017
Individuals who received psychiatric services had the following types ofdisorders. The total number of diagnoses is larger than the numberserved because some individuals had more than one type of disorder.
398
6
0
*
7
154
141
29
5
13
0
88
445
0
0
266
8
17
83
28
43
0
0
0
58
127
156
74
25
19
52
*
70
*
18
56
19
262
*
268
22
*
120 146
15 6
FY2018 FY2017
182
236
Gender Unknown 00
000
0
223
156
379
29
24
31
25
32
0
12
FY2019
14
6
6
0
0
10
357
28
30
39
40
36
33
28
*
FY2019
18
118
*
26
214
0
0
0
253
71
38
36
52
26
19
51
12
5
267
0
0
379
*
31
156
117
Total Disorders Diagnosed 641523 601
Missouri Department of Mental Health, Division of Behavioral Health

Total Individuals Served
Housing Unknown
Other
Homeless
Independent Living
Dependent Living
HOUSING / LIVING ARRANGEMENT
Employment Status Unknown
Not in Labor Force
Unemployed
Employed
Referral Source Unknown
Other
Court / Criminal Justice
Health Care Provider
Mental Health Provider
School
Self / Family / Friend
Education Level Unknown
Bachelor or Advanced Degree
Associate Degree or Some College
High School Grad or G.E.D.
Less than High School Diploma
Commitment Type Unknown
Sexual Predatory
Criminal
Civil
Voluntary
TREATMENT REFERRAL SOURCE
EMPLOYMENT
EDUCATION
TYPE OF COMMITMENT
Age Unknown
55 to 59
50 to 54
60 and Over
30 to 34
25 to 29
18 to 24
14 to 17
10 to 13
6 to 9
Under 6
40 to 44
35 to 39
45 to 49
AGE
Hearing Impaired
Past or Current Military Service*
*
Race/Ethnicity Unknown
Other Race
Hispanic
Asian / Pacific Islander
Native American / Alaskan
African American
Caucasian
0
*
0
0
0
0
34
GENDERMale
Female 22
13
Diagnosis Unknown
Other Disorders
Sexual Disorders
Schizophrenia and Psychotic Disorders
Personality Disorders
Depressive Mood Disorders
Impulse Control and Conduct DisordersDevelopmental and Age Related Disorders
Trauma and Stress Related Disorders
Anxiety and Fear Disorders
Bipolar Mood Disorders
DIAGNOSIS CATEGORY
The profiles below summarize individuals who received clinical services from the Division of Behavioral Health psychiatric programs.Individuals are counted only once based on their first treatment episode of the fiscal year. Information that was not reported is listed asunknown. An asterisk (*) in a data cell indicates the count was fewer than five (5) and suppressed to avoid disclosing identifying information.
*
*
6
0
*
6
*
*
*
5
*
*
*
17A
Southeast
8,769
9,176
MARIES COUNTY
13
10
7
*
*
*
*
43
0
0
0
6
9
14
*
7
0
*
0
12
29
0
*
7
0
5
0
*
*
*
11
9
25
9
9
0
*
0
17
0
*
6
5
*
*
5
*
*
#Name?
Page G-064
MENTAL ILLNESS TREATMENT SERVICES -- DIVISION OF BEHAVIORAL HEALTH
FY2018 FY2017
RACE / ETHNICITY
TREATMENT ACCOMMODATION
2019 Status Report on Missouri's Substance Use and Mental Health
**
*
35 266
*
*
*
0
0
0
0
3543NUMBER SERVED
PLANNING REGION
PSYCHIATRIC SERVICE AREA
2018 POPULATION ESTIMATE
CENSUS 2010
FY2019 FY2018 FY2017
Individuals who received psychiatric services had the following types ofdisorders. The total number of diagnoses is larger than the numberserved because some individuals had more than one type of disorder.
40
0
0
0
*
20
13
*
*
*
0
5
35
0
0
23
0
0
7
0
5
0
0
0
8
9
16
6
11
0
*
0
13
0
*
0
7
18
0
16
*
0
15 11
* *
FY2018 FY2017
22
21
Gender Unknown 00
000
0
27
25
52
*
*
*
*
5
0
*
FY2019
0
*
*
0
0
*
47
*
*
9
*
6
5
7
*
FY2019
6
16
*
8
21
0
0
0
39
10
8
*
*
18
*
*
*
0
28
0
0
52
*
6
20
15
Total Disorders Diagnosed 5487 69
Missouri Department of Mental Health, Division of Behavioral Health

Total Individuals Served
Housing Unknown
Other
Homeless
Independent Living
Dependent Living
HOUSING / LIVING ARRANGEMENT
Employment Status Unknown
Not in Labor Force
Unemployed
Employed
Referral Source Unknown
Other
Court / Criminal Justice
Health Care Provider
Mental Health Provider
School
Self / Family / Friend
Education Level Unknown
Bachelor or Advanced Degree
Associate Degree or Some College
High School Grad or G.E.D.
Less than High School Diploma
Commitment Type Unknown
Sexual Predatory
Criminal
Civil
Voluntary
TREATMENT REFERRAL SOURCE
EMPLOYMENT
EDUCATION
TYPE OF COMMITMENT
Age Unknown
55 to 59
50 to 54
60 and Over
30 to 34
25 to 29
18 to 24
14 to 17
10 to 13
6 to 9
Under 6
40 to 44
35 to 39
45 to 49
AGE
Hearing Impaired
Past or Current Military Service*
41
Race/Ethnicity Unknown
Other Race
Hispanic
Asian / Pacific Islander
Native American / Alaskan
African American
Caucasian
0
67
11
*
*
132
933
GENDERMale
Female 557
578
Diagnosis Unknown
Other Disorders
Sexual Disorders
Schizophrenia and Psychotic Disorders
Personality Disorders
Depressive Mood Disorders
Impulse Control and Conduct DisordersDevelopmental and Age Related Disorders
Trauma and Stress Related Disorders
Anxiety and Fear Disorders
Bipolar Mood Disorders
DIAGNOSIS CATEGORY
The profiles below summarize individuals who received clinical services from the Division of Behavioral Health psychiatric programs.Individuals are counted only once based on their first treatment episode of the fiscal year. Information that was not reported is listed asunknown. An asterisk (*) in a data cell indicates the count was fewer than five (5) and suppressed to avoid disclosing identifying information.
90
102
85
24
85
114
105
73
85
108
86
96
82
14
Central
28,592
28,781
MARION COUNTY
578
388
100
27
58
78
34
1,236
0
9
7
193
397
355
269
132
46
217
0
194
258
5
157
133
41
656
8
42
35
57
245
389
414
305
137
45
196
0
251
7
22
113
145
121
108
89
107
96
#Name?
Page G-065
MENTAL ILLNESS TREATMENT SERVICES -- DIVISION OF BEHAVIORAL HEALTH
FY2018 FY2017
RACE / ETHNICITY
TREATMENT ACCOMMODATION
2019 Status Report on Missouri's Substance Use and Mental Health
1521
39
1068 998106
90
77
90
91
6
0
10
1,1351,255NUMBER SERVED
PLANNING REGION
PSYCHIATRIC SERVICE AREA
2018 POPULATION ESTIMATE
CENSUS 2010
FY2019 FY2018 FY2017
Individuals who received psychiatric services had the following types ofdisorders. The total number of diagnoses is larger than the numberserved because some individuals had more than one type of disorder.
1,029
145
*
0
11
624
413
109
30
74
0
79
1,118
*
15
260
*
137
120
30
585
0
0
*
241
396
429
303
144
48
204
0
248
10
18
52
102
526
15
497
77
16
502 489
111 56
FY2018 FY2017
633
622
Gender Unknown 00
000
0
639
627
1,266
88
86
90
99
103
0
68
FY2019
12
31
8
0
*
142
1,054
106
97
88
104
119
154
110
22
FY2019
101
527
18
100
519
7
0
8
1,051
77
92
58
65
718
39
126
131
7
236
9
0
1,250
27
110
631
421
Total Disorders Diagnosed 1,8262,010 2,041
Missouri Department of Mental Health, Division of Behavioral Health

Total Individuals Served
Housing Unknown
Other
Homeless
Independent Living
Dependent Living
HOUSING / LIVING ARRANGEMENT
Employment Status Unknown
Not in Labor Force
Unemployed
Employed
Referral Source Unknown
Other
Court / Criminal Justice
Health Care Provider
Mental Health Provider
School
Self / Family / Friend
Education Level Unknown
Bachelor or Advanced Degree
Associate Degree or Some College
High School Grad or G.E.D.
Less than High School Diploma
Commitment Type Unknown
Sexual Predatory
Criminal
Civil
Voluntary
TREATMENT REFERRAL SOURCE
EMPLOYMENT
EDUCATION
TYPE OF COMMITMENT
Age Unknown
55 to 59
50 to 54
60 and Over
30 to 34
25 to 29
18 to 24
14 to 17
10 to 13
6 to 9
Under 6
40 to 44
35 to 39
45 to 49
AGE
Hearing Impaired
Past or Current Military Service0
*
Race/Ethnicity Unknown
Other Race
Hispanic
Asian / Pacific Islander
Native American / Alaskan
African American
Caucasian
0
*
*
0
0
0
50
GENDERMale
Female 30
24
Diagnosis Unknown
Other Disorders
Sexual Disorders
Schizophrenia and Psychotic Disorders
Personality Disorders
Depressive Mood Disorders
Impulse Control and Conduct DisordersDevelopmental and Age Related Disorders
Trauma and Stress Related Disorders
Anxiety and Fear Disorders
Bipolar Mood Disorders
DIAGNOSIS CATEGORY
The profiles below summarize individuals who received clinical services from the Division of Behavioral Health psychiatric programs.Individuals are counted only once based on their first treatment episode of the fiscal year. Information that was not reported is listed asunknown. An asterisk (*) in a data cell indicates the count was fewer than five (5) and suppressed to avoid disclosing identifying information.
*
*
*
*
5
8
13
5
*
*
*
*
7
13
Northwest
3,641
3,785
MERCER COUNTY
30
16
*
*
*
*
0
56
0
0
0
22
7
26
15
11
*
*
0
14
20
*
*
15
0
15
0
*
*
*
29
11
26
13
7
*
*
0
15
*
*
*
10
10
*
5
*
*
#Name?
Page G-066
MENTAL ILLNESS TREATMENT SERVICES -- DIVISION OF BEHAVIORAL HEALTH
FY2018 FY2017
RACE / ETHNICITY
TREATMENT ACCOMMODATION
2019 Status Report on Missouri's Substance Use and Mental Health
**
5
52 506
*
5
*
7
0
0
0
5456NUMBER SERVED
PLANNING REGION
PSYCHIATRIC SERVICE AREA
2018 POPULATION ESTIMATE
CENSUS 2010
FY2019 FY2018 FY2017
Individuals who received psychiatric services had the following types ofdisorders. The total number of diagnoses is larger than the numberserved because some individuals had more than one type of disorder.
52
*
0
0
0
32
19
*
*
*
0
0
54
0
0
25
*
*
15
0
8
*
0
0
27
9
34
12
7
*
*
0
17
*
0
0
*
27
0
23
*
*
27 26
0 0
FY2018 FY2017
20
36
Gender Unknown 00
000
0
30
26
56
6
*
*
*
6
0
*
FY2019
*
0
*
0
0
0
54
0
*
5
6
11
10
*
*
FY2019
*
25
0
6
23
0
0
*
51
0
*
0
*
7
*
13
*
*
27
*
0
55
*
8
32
15
Total Disorders Diagnosed 104111 115
Missouri Department of Mental Health, Division of Behavioral Health

Total Individuals Served
Housing Unknown
Other
Homeless
Independent Living
Dependent Living
HOUSING / LIVING ARRANGEMENT
Employment Status Unknown
Not in Labor Force
Unemployed
Employed
Referral Source Unknown
Other
Court / Criminal Justice
Health Care Provider
Mental Health Provider
School
Self / Family / Friend
Education Level Unknown
Bachelor or Advanced Degree
Associate Degree or Some College
High School Grad or G.E.D.
Less than High School Diploma
Commitment Type Unknown
Sexual Predatory
Criminal
Civil
Voluntary
TREATMENT REFERRAL SOURCE
EMPLOYMENT
EDUCATION
TYPE OF COMMITMENT
Age Unknown
55 to 59
50 to 54
60 and Over
30 to 34
25 to 29
18 to 24
14 to 17
10 to 13
6 to 9
Under 6
40 to 44
35 to 39
45 to 49
AGE
Hearing Impaired
Past or Current Military Service0
5
Race/Ethnicity Unknown
Other Race
Hispanic
Asian / Pacific Islander
Native American / Alaskan
African American
Caucasian
0
11
*
0
0
*
340
GENDERMale
Female 191
161
Diagnosis Unknown
Other Disorders
Sexual Disorders
Schizophrenia and Psychotic Disorders
Personality Disorders
Depressive Mood Disorders
Impulse Control and Conduct DisordersDevelopmental and Age Related Disorders
Trauma and Stress Related Disorders
Anxiety and Fear Disorders
Bipolar Mood Disorders
DIAGNOSIS CATEGORY
The profiles below summarize individuals who received clinical services from the Division of Behavioral Health psychiatric programs.Individuals are counted only once based on their first treatment episode of the fiscal year. Information that was not reported is listed asunknown. An asterisk (*) in a data cell indicates the count was fewer than five (5) and suppressed to avoid disclosing identifying information.
40
30
27
8
21
22
19
27
28
42
21
41
26
11
Central
25,336
24,748
MILLER COUNTY
166
137
31
*
8
46
*
381
0
*
*
102
87
122
28
28
16
44
*
87
250
*
33
41
17
39
8
10
11
33
110
59
131
30
23
17
32
*
78
*
7
24
39
35
15
28
48
25
#Name?
Page G-067
MENTAL ILLNESS TREATMENT SERVICES -- DIVISION OF BEHAVIORAL HEALTH
FY2018 FY2017
RACE / ETHNICITY
TREATMENT ACCOMMODATION
2019 Status Report on Missouri's Substance Use and Mental Health
*45
14
315 29826
27
39
41
29
*
0
0
352383NUMBER SERVED
PLANNING REGION
PSYCHIATRIC SERVICE AREA
2018 POPULATION ESTIMATE
CENSUS 2010
FY2019 FY2018 FY2017
Individuals who received psychiatric services had the following types ofdisorders. The total number of diagnoses is larger than the numberserved because some individuals had more than one type of disorder.
364
*
*
0
*
195
117
40
6
12
0
25
352
0
0
231
*
5
40
23
52
0
0
0
122
78
142
37
24
13
37
*
66
*
24
14
26
235
*
240
28
8
108 76
11 0
FY2018 FY2017
168
215
Gender Unknown 00
000
0
229
163
392
35
31
32
23
29
0
13
FY2019
*
*
*
0
*
5
372
27
43
24
23
43
42
30
10
FY2019
25
125
7
31
204
0
0
*
305
49
56
11
20
62
6
40
35
0
248
*
0
391
8
39
182
114
Total Disorders Diagnosed 526529 548
Missouri Department of Mental Health, Division of Behavioral Health
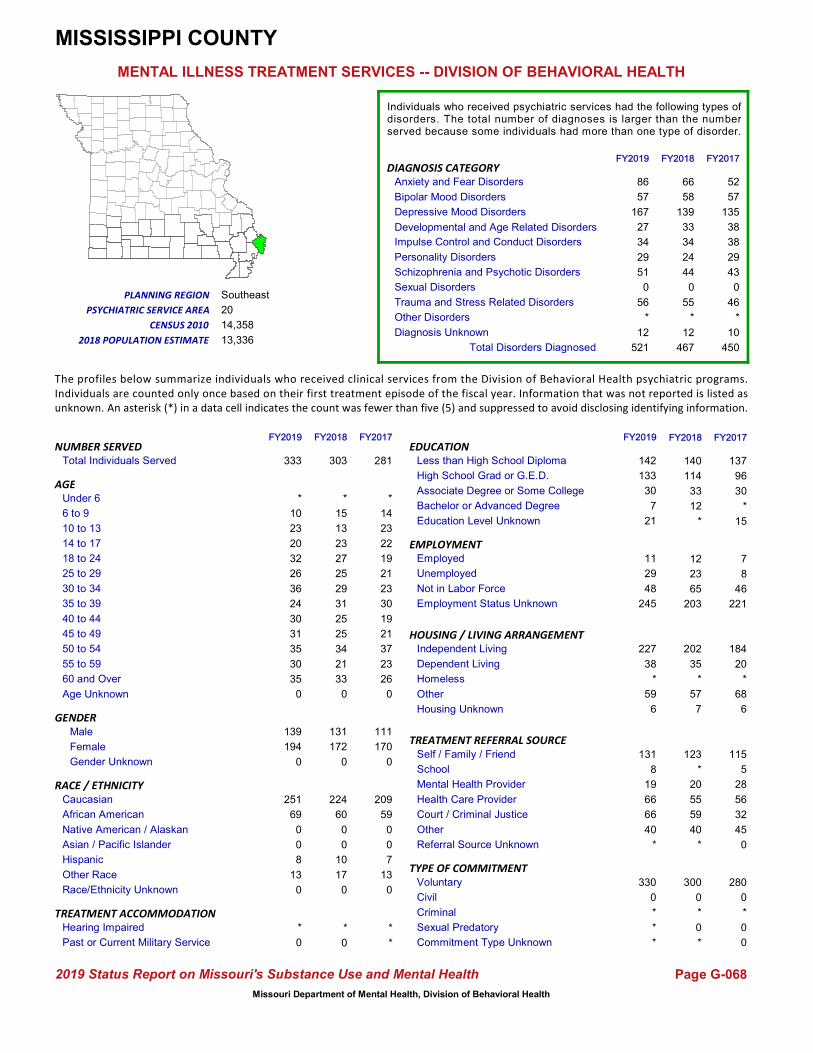
Total Individuals Served
Housing Unknown
Other
Homeless
Independent Living
Dependent Living
HOUSING / LIVING ARRANGEMENT
Employment Status Unknown
Not in Labor Force
Unemployed
Employed
Referral Source Unknown
Other
Court / Criminal Justice
Health Care Provider
Mental Health Provider
School
Self / Family / Friend
Education Level Unknown
Bachelor or Advanced Degree
Associate Degree or Some College
High School Grad or G.E.D.
Less than High School Diploma
Commitment Type Unknown
Sexual Predatory
Criminal
Civil
Voluntary
TREATMENT REFERRAL SOURCE
EMPLOYMENT
EDUCATION
TYPE OF COMMITMENT
Age Unknown
55 to 59
50 to 54
60 and Over
30 to 34
25 to 29
18 to 24
14 to 17
10 to 13
6 to 9
Under 6
40 to 44
35 to 39
45 to 49
AGE
Hearing Impaired
Past or Current Military Service*
*
Race/Ethnicity Unknown
Other Race
Hispanic
Asian / Pacific Islander
Native American / Alaskan
African American
Caucasian
0
13
7
0
0
59
209
GENDERMale
Female 170
111
Diagnosis Unknown
Other Disorders
Sexual Disorders
Schizophrenia and Psychotic Disorders
Personality Disorders
Depressive Mood Disorders
Impulse Control and Conduct DisordersDevelopmental and Age Related Disorders
Trauma and Stress Related Disorders
Anxiety and Fear Disorders
Bipolar Mood Disorders
DIAGNOSIS CATEGORY
The profiles below summarize individuals who received clinical services from the Division of Behavioral Health psychiatric programs.Individuals are counted only once based on their first treatment episode of the fiscal year. Information that was not reported is listed asunknown. An asterisk (*) in a data cell indicates the count was fewer than five (5) and suppressed to avoid disclosing identifying information.
21
30
19
*
14
23
22
19
21
23
26
37
23
20
Southeast
13,336
14,358
MISSISSIPPI COUNTY
137
96
30
*
23
65
0
300
0
*
*
52
57
135
38
38
29
43
0
46
123
*
20
55
59
40
*
7
8
46
86
57
167
27
34
29
51
0
56
*
*
15
13
23
27
25
29
33
#Name?
Page G-068
MENTAL ILLNESS TREATMENT SERVICES -- DIVISION OF BEHAVIORAL HEALTH
FY2018 FY2017
RACE / ETHNICITY
TREATMENT ACCOMMODATION
2019 Status Report on Missouri's Substance Use and Mental Health
1012
15
203 22131
25
25
34
21
*
0
*
281303NUMBER SERVED
PLANNING REGION
PSYCHIATRIC SERVICE AREA
2018 POPULATION ESTIMATE
CENSUS 2010
FY2019 FY2018 FY2017
Individuals who received psychiatric services had the following types ofdisorders. The total number of diagnoses is larger than the numberserved because some individuals had more than one type of disorder.
224
60
0
0
10
140
114
33
12
17
0
*
280
0
*
115
5
28
56
32
45
0
0
0
66
58
139
33
34
24
44
0
55
*
12
12
35
202
*
184
20
*
57 68
7 6
FY2018 FY2017
131
172
Gender Unknown 00
000
0
194
139
333
30
35
31
30
24
0
13
FY2019
*
0
8
0
0
69
251
35
36
26
32
20
23
10
*
FY2019
6
59
*
38
227
*
*
*
245
21
48
29
11
40
66
66
19
8
131
*
0
330
7
30
142
133
Total Disorders Diagnosed 450521 467
Missouri Department of Mental Health, Division of Behavioral Health

Total Individuals Served
Housing Unknown
Other
Homeless
Independent Living
Dependent Living
HOUSING / LIVING ARRANGEMENT
Employment Status Unknown
Not in Labor Force
Unemployed
Employed
Referral Source Unknown
Other
Court / Criminal Justice
Health Care Provider
Mental Health Provider
School
Self / Family / Friend
Education Level Unknown
Bachelor or Advanced Degree
Associate Degree or Some College
High School Grad or G.E.D.
Less than High School Diploma
Commitment Type Unknown
Sexual Predatory
Criminal
Civil
Voluntary
TREATMENT REFERRAL SOURCE
EMPLOYMENT
EDUCATION
TYPE OF COMMITMENT
Age Unknown
55 to 59
50 to 54
60 and Over
30 to 34
25 to 29
18 to 24
14 to 17
10 to 13
6 to 9
Under 6
40 to 44
35 to 39
45 to 49
AGE
Hearing Impaired
Past or Current Military Service*
*
Race/Ethnicity Unknown
Other Race
Hispanic
Asian / Pacific Islander
Native American / Alaskan
African American
Caucasian
0
0
0
*
0
*
60
GENDERMale
Female 38
24
Diagnosis Unknown
Other Disorders
Sexual Disorders
Schizophrenia and Psychotic Disorders
Personality Disorders
Depressive Mood Disorders
Impulse Control and Conduct DisordersDevelopmental and Age Related Disorders
Trauma and Stress Related Disorders
Anxiety and Fear Disorders
Bipolar Mood Disorders
DIAGNOSIS CATEGORY
The profiles below summarize individuals who received clinical services from the Division of Behavioral Health psychiatric programs.Individuals are counted only once based on their first treatment episode of the fiscal year. Information that was not reported is listed asunknown. An asterisk (*) in a data cell indicates the count was fewer than five (5) and suppressed to avoid disclosing identifying information.
*
5
*
*
*
*
*
*
*
*
11
9
9
12
Central
16,121
15,607
MONITEAU COUNTY
28
25
8
*
*
8
*
71
0
*
*
19
24
26
7
*
7
13
0
19
43
0
5
13
6
*
*
*
*
*
25
20
35
12
10
6
7
0
21
*
0
*
6
13
*
5
9
10
#Name?
Page G-069
MENTAL ILLNESS TREATMENT SERVICES -- DIVISION OF BEHAVIORAL HEALTH
FY2018 FY2017
RACE / ETHNICITY
TREATMENT ACCOMMODATION
2019 Status Report on Missouri's Substance Use and Mental Health
*11
*
59 556
*
*
7
7
*
0
0
6273NUMBER SERVED
PLANNING REGION
PSYCHIATRIC SERVICE AREA
2018 POPULATION ESTIMATE
CENSUS 2010
FY2019 FY2018 FY2017
Individuals who received psychiatric services had the following types ofdisorders. The total number of diagnoses is larger than the numberserved because some individuals had more than one type of disorder.
68
*
0
*
*
32
18
12
*
*
0
8
60
0
*
33
0
6
13
*
7
0
0
0
20
19
32
8
6
6
10
0
20
*
5
5
6
40
*
40
6
0
20 14
6 *
FY2018 FY2017
32
41
Gender Unknown 00
000
0
46
39
85
5
7
8
5
6
0
*
FY2019
*
*
*
0
0
*
80
10
6
5
5
10
11
*
*
FY2019
7
29
0
9
40
0
0
*
63
27
15
*
*
8
*
15
*
*
51
*
0
84
*
9
29
17
Total Disorders Diagnosed 119148 127
Missouri Department of Mental Health, Division of Behavioral Health

Total Individuals Served
Housing Unknown
Other
Homeless
Independent Living
Dependent Living
HOUSING / LIVING ARRANGEMENT
Employment Status Unknown
Not in Labor Force
Unemployed
Employed
Referral Source Unknown
Other
Court / Criminal Justice
Health Care Provider
Mental Health Provider
School
Self / Family / Friend
Education Level Unknown
Bachelor or Advanced Degree
Associate Degree or Some College
High School Grad or G.E.D.
Less than High School Diploma
Commitment Type Unknown
Sexual Predatory
Criminal
Civil
Voluntary
TREATMENT REFERRAL SOURCE
EMPLOYMENT
EDUCATION
TYPE OF COMMITMENT
Age Unknown
55 to 59
50 to 54
60 and Over
30 to 34
25 to 29
18 to 24
14 to 17
10 to 13
6 to 9
Under 6
40 to 44
35 to 39
45 to 49
AGE
Hearing Impaired
Past or Current Military Service0
*
Race/Ethnicity Unknown
Other Race
Hispanic
Asian / Pacific Islander
Native American / Alaskan
African American
Caucasian
0
6
0
0
0
6
123
GENDERMale
Female 70
65
Diagnosis Unknown
Other Disorders
Sexual Disorders
Schizophrenia and Psychotic Disorders
Personality Disorders
Depressive Mood Disorders
Impulse Control and Conduct DisordersDevelopmental and Age Related Disorders
Trauma and Stress Related Disorders
Anxiety and Fear Disorders
Bipolar Mood Disorders
DIAGNOSIS CATEGORY
The profiles below summarize individuals who received clinical services from the Division of Behavioral Health psychiatric programs.Individuals are counted only once based on their first treatment episode of the fiscal year. Information that was not reported is listed asunknown. An asterisk (*) in a data cell indicates the count was fewer than five (5) and suppressed to avoid disclosing identifying information.
7
10
12
*
19
14
12
11
7
6
10
12
11
15
Central
8,664
8,840
MONROE COUNTY
70
40
14
*
*
6
*
123
0
0
*
15
40
47
34
19
5
12
*
21
30
0
16
14
*
60
*
7
*
9
17
37
41
27
17
5
19
*
24
*
*
19
11
10
10
10
7
10
#Name?
Page G-070
MENTAL ILLNESS TREATMENT SERVICES -- DIVISION OF BEHAVIORAL HEALTH
FY2018 FY2017
RACE / ETHNICITY
TREATMENT ACCOMMODATION
2019 Status Report on Missouri's Substance Use and Mental Health
6*
8
108 1169
11
5
7
13
*
*
*
135125NUMBER SERVED
PLANNING REGION
PSYCHIATRIC SERVICE AREA
2018 POPULATION ESTIMATE
CENSUS 2010
FY2019 FY2018 FY2017
Individuals who received psychiatric services had the following types ofdisorders. The total number of diagnoses is larger than the numberserved because some individuals had more than one type of disorder.
109
*
*
0
*
60
40
13
*
10
0
9
133
0
*
47
0
16
13
*
58
0
0
0
16
34
44
30
23
6
15
*
21
*
*
7
13
57
*
61
14
*
46 55
8 *
FY2018 FY2017
53
72
Gender Unknown 00
000
0
68
54
122
11
7
5
12
6
0
10
FY2019
0
*
*
0
*
*
108
12
6
10
12
11
12
15
*
FY2019
8
46
0
13
55
*
*
*
100
7
10
*
9
64
*
12
14
0
28
*
0
119
*
10
62
41
Total Disorders Diagnosed 201190 194
Missouri Department of Mental Health, Division of Behavioral Health
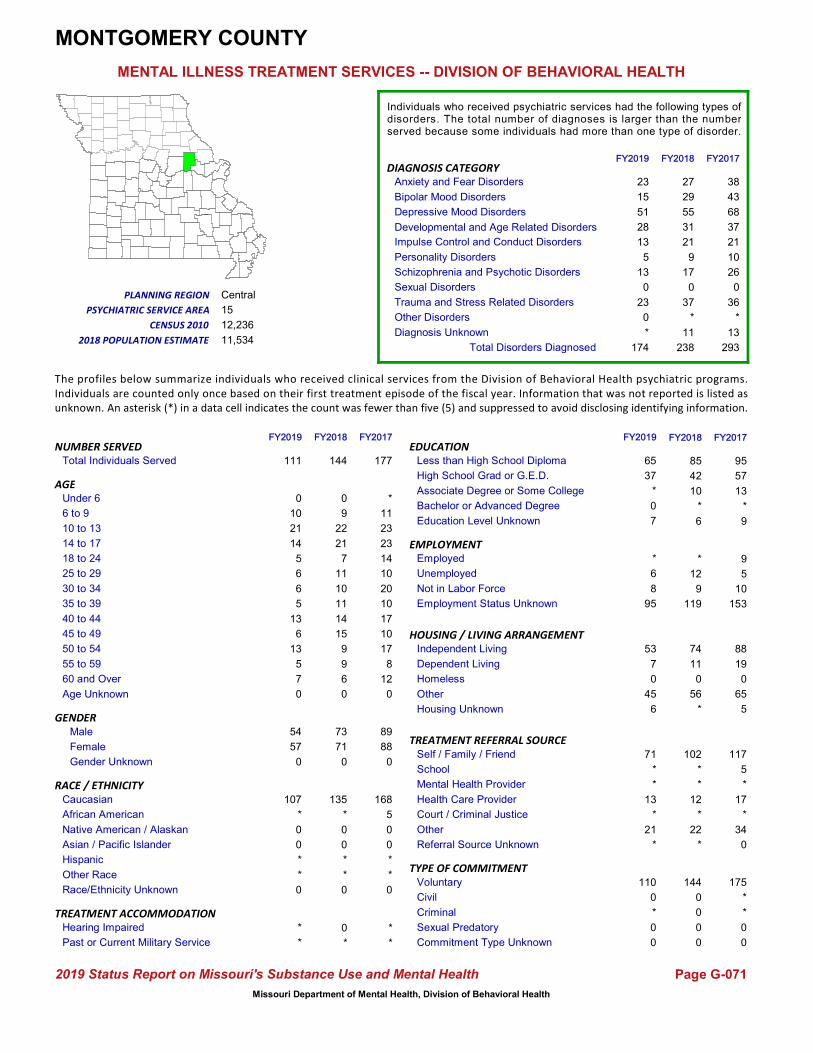
Total Individuals Served
Housing Unknown
Other
Homeless
Independent Living
Dependent Living
HOUSING / LIVING ARRANGEMENT
Employment Status Unknown
Not in Labor Force
Unemployed
Employed
Referral Source Unknown
Other
Court / Criminal Justice
Health Care Provider
Mental Health Provider
School
Self / Family / Friend
Education Level Unknown
Bachelor or Advanced Degree
Associate Degree or Some College
High School Grad or G.E.D.
Less than High School Diploma
Commitment Type Unknown
Sexual Predatory
Criminal
Civil
Voluntary
TREATMENT REFERRAL SOURCE
EMPLOYMENT
EDUCATION
TYPE OF COMMITMENT
Age Unknown
55 to 59
50 to 54
60 and Over
30 to 34
25 to 29
18 to 24
14 to 17
10 to 13
6 to 9
Under 6
40 to 44
35 to 39
45 to 49
AGE
Hearing Impaired
Past or Current Military Service*
*
Race/Ethnicity Unknown
Other Race
Hispanic
Asian / Pacific Islander
Native American / Alaskan
African American
Caucasian
0
*
*
0
0
5
168
GENDERMale
Female 88
89
Diagnosis Unknown
Other Disorders
Sexual Disorders
Schizophrenia and Psychotic Disorders
Personality Disorders
Depressive Mood Disorders
Impulse Control and Conduct DisordersDevelopmental and Age Related Disorders
Trauma and Stress Related Disorders
Anxiety and Fear Disorders
Bipolar Mood Disorders
DIAGNOSIS CATEGORY
The profiles below summarize individuals who received clinical services from the Division of Behavioral Health psychiatric programs.Individuals are counted only once based on their first treatment episode of the fiscal year. Information that was not reported is listed asunknown. An asterisk (*) in a data cell indicates the count was fewer than five (5) and suppressed to avoid disclosing identifying information.
10
10
17
*
11
23
23
14
10
20
12
17
8
15
Central
11,534
12,236
MONTGOMERY COUNTY
95
57
13
*
12
9
*
144
0
0
0
38
43
68
37
21
10
26
0
36
102
*
*
12
*
22
*
9
5
10
23
15
51
28
13
5
13
0
23
0
0
9
22
21
7
11
10
6
#Name?
Page G-071
MENTAL ILLNESS TREATMENT SERVICES -- DIVISION OF BEHAVIORAL HEALTH
FY2018 FY2017
RACE / ETHNICITY
TREATMENT ACCOMMODATION
2019 Status Report on Missouri's Substance Use and Mental Health
13*
9
119 15311
14
15
9
9
*
0
0
177144NUMBER SERVED
PLANNING REGION
PSYCHIATRIC SERVICE AREA
2018 POPULATION ESTIMATE
CENSUS 2010
FY2019 FY2018 FY2017
Individuals who received psychiatric services had the following types ofdisorders. The total number of diagnoses is larger than the numberserved because some individuals had more than one type of disorder.
135
*
0
0
*
85
42
10
*
*
0
6
175
*
*
117
5
*
17
*
34
0
0
0
27
29
55
31
21
9
17
0
37
*
11
*
11
74
0
88
19
0
56 65
* 5
FY2018 FY2017
73
71
Gender Unknown 00
000
0
57
54
111
5
13
6
13
5
0
*
FY2019
*
*
*
0
0
*
107
7
6
6
5
14
21
10
0
FY2019
6
45
0
7
53
0
0
*
95
7
8
6
*
21
*
13
*
*
71
*
0
110
0
*
65
37
Total Disorders Diagnosed 293174 238
Missouri Department of Mental Health, Division of Behavioral Health

Total Individuals Served
Housing Unknown
Other
Homeless
Independent Living
Dependent Living
HOUSING / LIVING ARRANGEMENT
Employment Status Unknown
Not in Labor Force
Unemployed
Employed
Referral Source Unknown
Other
Court / Criminal Justice
Health Care Provider
Mental Health Provider
School
Self / Family / Friend
Education Level Unknown
Bachelor or Advanced Degree
Associate Degree or Some College
High School Grad or G.E.D.
Less than High School Diploma
Commitment Type Unknown
Sexual Predatory
Criminal
Civil
Voluntary
TREATMENT REFERRAL SOURCE
EMPLOYMENT
EDUCATION
TYPE OF COMMITMENT
Age Unknown
55 to 59
50 to 54
60 and Over
30 to 34
25 to 29
18 to 24
14 to 17
10 to 13
6 to 9
Under 6
40 to 44
35 to 39
45 to 49
AGE
Hearing Impaired
Past or Current Military Service*
*
Race/Ethnicity Unknown
Other Race
Hispanic
Asian / Pacific Islander
Native American / Alaskan
African American
Caucasian
0
9
*
0
0
*
183
GENDERMale
Female 111
83
Diagnosis Unknown
Other Disorders
Sexual Disorders
Schizophrenia and Psychotic Disorders
Personality Disorders
Depressive Mood Disorders
Impulse Control and Conduct DisordersDevelopmental and Age Related Disorders
Trauma and Stress Related Disorders
Anxiety and Fear Disorders
Bipolar Mood Disorders
DIAGNOSIS CATEGORY
The profiles below summarize individuals who received clinical services from the Division of Behavioral Health psychiatric programs.Individuals are counted only once based on their first treatment episode of the fiscal year. Information that was not reported is listed asunknown. An asterisk (*) in a data cell indicates the count was fewer than five (5) and suppressed to avoid disclosing identifying information.
22
11
23
*
11
8
15
9
16
11
18
26
21
12
Central
20,358
20,565
MORGAN COUNTY
85
76
23
*
7
16
*
197
0
0
*
54
88
68
21
8
9
24
0
53
127
*
9
32
6
21
*
*
*
16
63
58
85
28
19
10
17
0
55
*
5
12
18
16
*
13
16
20
#Name?
Page G-072
MENTAL ILLNESS TREATMENT SERVICES -- DIVISION OF BEHAVIORAL HEALTH
FY2018 FY2017
RACE / ETHNICITY
TREATMENT ACCOMMODATION
2019 Status Report on Missouri's Substance Use and Mental Health
*22
7
172 17215
18
22
21
17
0
0
0
194197NUMBER SERVED
PLANNING REGION
PSYCHIATRIC SERVICE AREA
2018 POPULATION ESTIMATE
CENSUS 2010
FY2019 FY2018 FY2017
Individuals who received psychiatric services had the following types ofdisorders. The total number of diagnoses is larger than the numberserved because some individuals had more than one type of disorder.
186
*
*
0
*
100
54
20
8
9
0
15
193
*
0
121
0
8
32
9
24
0
0
0
56
66
80
27
18
12
19
0
55
*
6
*
19
117
0
143
7
*
56 40
5 *
FY2018 FY2017
92
105
Gender Unknown 00
000
0
122
89
211
16
24
24
19
15
0
11
FY2019
6
*
*
0
*
*
197
24
19
11
9
21
17
9
*
FY2019
6
51
*
24
127
0
0
0
149
42
44
10
8
28
5
33
9
*
134
0
0
211
5
24
79
61
Total Disorders Diagnosed 328358 340
Missouri Department of Mental Health, Division of Behavioral Health

Total Individuals Served
Housing Unknown
Other
Homeless
Independent Living
Dependent Living
HOUSING / LIVING ARRANGEMENT
Employment Status Unknown
Not in Labor Force
Unemployed
Employed
Referral Source Unknown
Other
Court / Criminal Justice
Health Care Provider
Mental Health Provider
School
Self / Family / Friend
Education Level Unknown
Bachelor or Advanced Degree
Associate Degree or Some College
High School Grad or G.E.D.
Less than High School Diploma
Commitment Type Unknown
Sexual Predatory
Criminal
Civil
Voluntary
TREATMENT REFERRAL SOURCE
EMPLOYMENT
EDUCATION
TYPE OF COMMITMENT
Age Unknown
55 to 59
50 to 54
60 and Over
30 to 34
25 to 29
18 to 24
14 to 17
10 to 13
6 to 9
Under 6
40 to 44
35 to 39
45 to 49
AGE
Hearing Impaired
Past or Current Military Service*
*
Race/Ethnicity Unknown
Other Race
Hispanic
Asian / Pacific Islander
Native American / Alaskan
African American
Caucasian
0
20
5
0
0
57
246
GENDERMale
Female 170
153
Diagnosis Unknown
Other Disorders
Sexual Disorders
Schizophrenia and Psychotic Disorders
Personality Disorders
Depressive Mood Disorders
Impulse Control and Conduct DisordersDevelopmental and Age Related Disorders
Trauma and Stress Related Disorders
Anxiety and Fear Disorders
Bipolar Mood Disorders
DIAGNOSIS CATEGORY
The profiles below summarize individuals who received clinical services from the Division of Behavioral Health psychiatric programs.Individuals are counted only once based on their first treatment episode of the fiscal year. Information that was not reported is listed asunknown. An asterisk (*) in a data cell indicates the count was fewer than five (5) and suppressed to avoid disclosing identifying information.
29
28
19
5
20
34
29
32
19
25
36
20
27
20
Southeast
17,296
18,956
NEW MADRID COUNTY
163
106
22
8
20
62
6
358
0
*
5
71
60
150
48
46
24
67
*
62
180
6
26
73
26
47
*
9
14
39
89
70
193
63
45
19
71
*
79
*
5
15
37
27
32
28
26
38
#Name?
Page G-073
MENTAL ILLNESS TREATMENT SERVICES -- DIVISION OF BEHAVIORAL HEALTH
FY2018 FY2017
RACE / ETHNICITY
TREATMENT ACCOMMODATION
2019 Status Report on Missouri's Substance Use and Mental Health
711
20
267 25730
29
33
27
35
*
0
*
323362NUMBER SERVED
PLANNING REGION
PSYCHIATRIC SERVICE AREA
2018 POPULATION ESTIMATE
CENSUS 2010
FY2019 FY2018 FY2017
Individuals who received psychiatric services had the following types ofdisorders. The total number of diagnoses is larger than the numberserved because some individuals had more than one type of disorder.
269
67
0
0
7
153
143
34
11
23
0
21
322
0
*
139
10
37
60
21
56
0
0
0
82
69
165
47
52
22
74
*
76
*
8
13
45
212
*
183
40
*
97 94
5 5
FY2018 FY2017
183
179
Gender Unknown 00
000
0
204
181
385
33
28
36
39
33
0
31
FY2019
6
*
6
0
0
71
283
41
32
23
36
24
36
20
*
FY2019
*
95
*
41
243
*
0
*
316
11
44
21
*
49
27
83
24
11
190
*
0
383
8
39
163
164
Total Disorders Diagnosed 539643 598
Missouri Department of Mental Health, Division of Behavioral Health

Total Individuals Served
Housing Unknown
Other
Homeless
Independent Living
Dependent Living
HOUSING / LIVING ARRANGEMENT
Employment Status Unknown
Not in Labor Force
Unemployed
Employed
Referral Source Unknown
Other
Court / Criminal Justice
Health Care Provider
Mental Health Provider
School
Self / Family / Friend
Education Level Unknown
Bachelor or Advanced Degree
Associate Degree or Some College
High School Grad or G.E.D.
Less than High School Diploma
Commitment Type Unknown
Sexual Predatory
Criminal
Civil
Voluntary
TREATMENT REFERRAL SOURCE
EMPLOYMENT
EDUCATION
TYPE OF COMMITMENT
Age Unknown
55 to 59
50 to 54
60 and Over
30 to 34
25 to 29
18 to 24
14 to 17
10 to 13
6 to 9
Under 6
40 to 44
35 to 39
45 to 49
AGE
Hearing Impaired
Past or Current Military Service0
14
Race/Ethnicity Unknown
Other Race
Hispanic
Asian / Pacific Islander
Native American / Alaskan
African American
Caucasian
0
39
24
*
8
13
809
GENDERMale
Female 507
364
Diagnosis Unknown
Other Disorders
Sexual Disorders
Schizophrenia and Psychotic Disorders
Personality Disorders
Depressive Mood Disorders
Impulse Control and Conduct DisordersDevelopmental and Age Related Disorders
Trauma and Stress Related Disorders
Anxiety and Fear Disorders
Bipolar Mood Disorders
DIAGNOSIS CATEGORY
The profiles below summarize individuals who received clinical services from the Division of Behavioral Health psychiatric programs.Individuals are counted only once based on their first treatment episode of the fiscal year. Information that was not reported is listed asunknown. An asterisk (*) in a data cell indicates the count was fewer than five (5) and suppressed to avoid disclosing identifying information.
77
77
71
6
49
62
86
108
67
86
52
74
56
9
Southwest
58,266
58,114
NEWTON COUNTY
334
271
116
27
93
85
16
873
42
*
*
312
202
493
147
92
153
140
*
350
793
*
7
53
10
52
61
65
95
81
301
206
515
160
111
140
149
6
373
47
17
55
85
115
96
52
74
54
#Name?
Page G-074
MENTAL ILLNESS TREATMENT SERVICES -- DIVISION OF BEHAVIORAL HEALTH
FY2018 FY2017
RACE / ETHNICITY
TREATMENT ACCOMMODATION
2019 Status Report on Missouri's Substance Use and Mental Health
89
120
684 62765
71
83
81
73
*
*
*
871921NUMBER SERVED
PLANNING REGION
PSYCHIATRIC SERVICE AREA
2018 POPULATION ESTIMATE
CENSUS 2010
FY2019 FY2018 FY2017
Individuals who received psychiatric services had the following types ofdisorders. The total number of diagnoses is larger than the numberserved because some individuals had more than one type of disorder.
835
17
12
*
31
356
275
125
29
50
0
135
792
73
5
722
*
11
63
32
42
0
*
0
299
209
515
182
111
135
134
*
375
53
5
59
61
482
14
532
38
8
281 234
83 60
FY2018 FY2017
394
527
Gender Unknown 00
000
0
512
396
908
78
95
56
78
68
0
43
FY2019
*
12
24
*
6
17
841
59
64
69
98
103
85
49
6
FY2019
76
272
10
61
491
*
*
*
706
129
78
86
38
52
8
54
6
*
786
0
41
864
30
134
355
260
Total Disorders Diagnosed 1,9612,017 2,022
Missouri Department of Mental Health, Division of Behavioral Health

Total Individuals Served
Housing Unknown
Other
Homeless
Independent Living
Dependent Living
HOUSING / LIVING ARRANGEMENT
Employment Status Unknown
Not in Labor Force
Unemployed
Employed
Referral Source Unknown
Other
Court / Criminal Justice
Health Care Provider
Mental Health Provider
School
Self / Family / Friend
Education Level Unknown
Bachelor or Advanced Degree
Associate Degree or Some College
High School Grad or G.E.D.
Less than High School Diploma
Commitment Type Unknown
Sexual Predatory
Criminal
Civil
Voluntary
TREATMENT REFERRAL SOURCE
EMPLOYMENT
EDUCATION
TYPE OF COMMITMENT
Age Unknown
55 to 59
50 to 54
60 and Over
30 to 34
25 to 29
18 to 24
14 to 17
10 to 13
6 to 9
Under 6
40 to 44
35 to 39
45 to 49
AGE
Hearing Impaired
Past or Current Military Service0
6
Race/Ethnicity Unknown
Other Race
Hispanic
Asian / Pacific Islander
Native American / Alaskan
African American
Caucasian
0
8
*
*
0
*
180
GENDERMale
Female 98
94
Diagnosis Unknown
Other Disorders
Sexual Disorders
Schizophrenia and Psychotic Disorders
Personality Disorders
Depressive Mood Disorders
Impulse Control and Conduct DisordersDevelopmental and Age Related Disorders
Trauma and Stress Related Disorders
Anxiety and Fear Disorders
Bipolar Mood Disorders
DIAGNOSIS CATEGORY
The profiles below summarize individuals who received clinical services from the Division of Behavioral Health psychiatric programs.Individuals are counted only once based on their first treatment episode of the fiscal year. Information that was not reported is listed asunknown. An asterisk (*) in a data cell indicates the count was fewer than five (5) and suppressed to avoid disclosing identifying information.
15
9
11
*
17
18
23
19
12
20
10
15
20
1
Northwest
22,304
23,370
NODAWAY COUNTY
71
77
19
8
18
35
*
218
*
*
*
50
44
99
43
29
15
15
0
64
82
13
22
39
31
32
5
9
12
18
39
28
89
37
21
12
16
0
61
*
*
11
22
25
31
23
19
15
#Name?
Page G-075
MENTAL ILLNESS TREATMENT SERVICES -- DIVISION OF BEHAVIORAL HEALTH
FY2018 FY2017
RACE / ETHNICITY
TREATMENT ACCOMMODATION
2019 Status Report on Missouri's Substance Use and Mental Health
019
17
144 15316
10
12
12
21
*
0
0
192221NUMBER SERVED
PLANNING REGION
PSYCHIATRIC SERVICE AREA
2018 POPULATION ESTIMATE
CENSUS 2010
FY2019 FY2018 FY2017
Individuals who received psychiatric services had the following types ofdisorders. The total number of diagnoses is larger than the numberserved because some individuals had more than one type of disorder.
212
*
0
0
*
82
88
21
*
*
0
26
190
*
*
73
9
24
39
12
35
0
0
0
45
38
93
40
25
13
15
0
77
6
22
24
25
128
*
112
17
*
61 59
5 *
FY2018 FY2017
113
108
Gender Unknown 00
000
0
100
98
198
19
17
14
12
17
0
8
FY2019
*
*
*
*
0
*
184
15
14
19
20
15
20
14
*
FY2019
7
50
0
15
126
0
0
*
119
42
43
15
21
31
22
36
22
9
75
*
0
196
*
19
65
68
Total Disorders Diagnosed 364324 374
Missouri Department of Mental Health, Division of Behavioral Health

Total Individuals Served
Housing Unknown
Other
Homeless
Independent Living
Dependent Living
HOUSING / LIVING ARRANGEMENT
Employment Status Unknown
Not in Labor Force
Unemployed
Employed
Referral Source Unknown
Other
Court / Criminal Justice
Health Care Provider
Mental Health Provider
School
Self / Family / Friend
Education Level Unknown
Bachelor or Advanced Degree
Associate Degree or Some College
High School Grad or G.E.D.
Less than High School Diploma
Commitment Type Unknown
Sexual Predatory
Criminal
Civil
Voluntary
TREATMENT REFERRAL SOURCE
EMPLOYMENT
EDUCATION
TYPE OF COMMITMENT
Age Unknown
55 to 59
50 to 54
60 and Over
30 to 34
25 to 29
18 to 24
14 to 17
10 to 13
6 to 9
Under 6
40 to 44
35 to 39
45 to 49
AGE
Hearing Impaired
Past or Current Military Service*
*
Race/Ethnicity Unknown
Other Race
Hispanic
Asian / Pacific Islander
Native American / Alaskan
African American
Caucasian
0
5
*
*
0
*
167
GENDERMale
Female 96
78
Diagnosis Unknown
Other Disorders
Sexual Disorders
Schizophrenia and Psychotic Disorders
Personality Disorders
Depressive Mood Disorders
Impulse Control and Conduct DisordersDevelopmental and Age Related Disorders
Trauma and Stress Related Disorders
Anxiety and Fear Disorders
Bipolar Mood Disorders
DIAGNOSIS CATEGORY
The profiles below summarize individuals who received clinical services from the Division of Behavioral Health psychiatric programs.Individuals are counted only once based on their first treatment episode of the fiscal year. Information that was not reported is listed asunknown. An asterisk (*) in a data cell indicates the count was fewer than five (5) and suppressed to avoid disclosing identifying information.
18
22
12
*
13
9
14
21
11
15
6
19
12
18
Southeast
10,541
10,881
OREGON COUNTY
62
64
24
*
7
18
*
193
*
*
*
53
23
83
28
10
7
18
0
59
110
0
*
78
0
*
*
*
7
18
60
25
95
17
12
7
12
0
41
*
*
10
9
11
26
16
21
10
#Name?
Page G-076
MENTAL ILLNESS TREATMENT SERVICES -- DIVISION OF BEHAVIORAL HEALTH
FY2018 FY2017
RACE / ETHNICITY
TREATMENT ACCOMMODATION
2019 Status Report on Missouri's Substance Use and Mental Health
*7
20
164 14520
16
16
20
20
*
0
0
174196NUMBER SERVED
PLANNING REGION
PSYCHIATRIC SERVICE AREA
2018 POPULATION ESTIMATE
CENSUS 2010
FY2019 FY2018 FY2017
Individuals who received psychiatric services had the following types ofdisorders. The total number of diagnoses is larger than the numberserved because some individuals had more than one type of disorder.
188
0
0
0
*
64
78
29
7
5
0
18
174
0
0
85
0
*
74
0
11
0
0
0
51
28
103
23
8
13
15
0
48
*
7
7
28
123
*
101
27
*
30 41
11 *
FY2018 FY2017
83
113
Gender Unknown 00
000
0
113
65
178
20
13
11
14
20
0
*
FY2019
*
0
0
0
0
0
175
10
18
21
18
9
12
11
*
FY2019
8
38
*
20
110
0
0
*
134
20
23
9
12
*
*
59
0
*
110
*
0
177
*
16
57
81
Total Disorders Diagnosed 286277 298
Missouri Department of Mental Health, Division of Behavioral Health
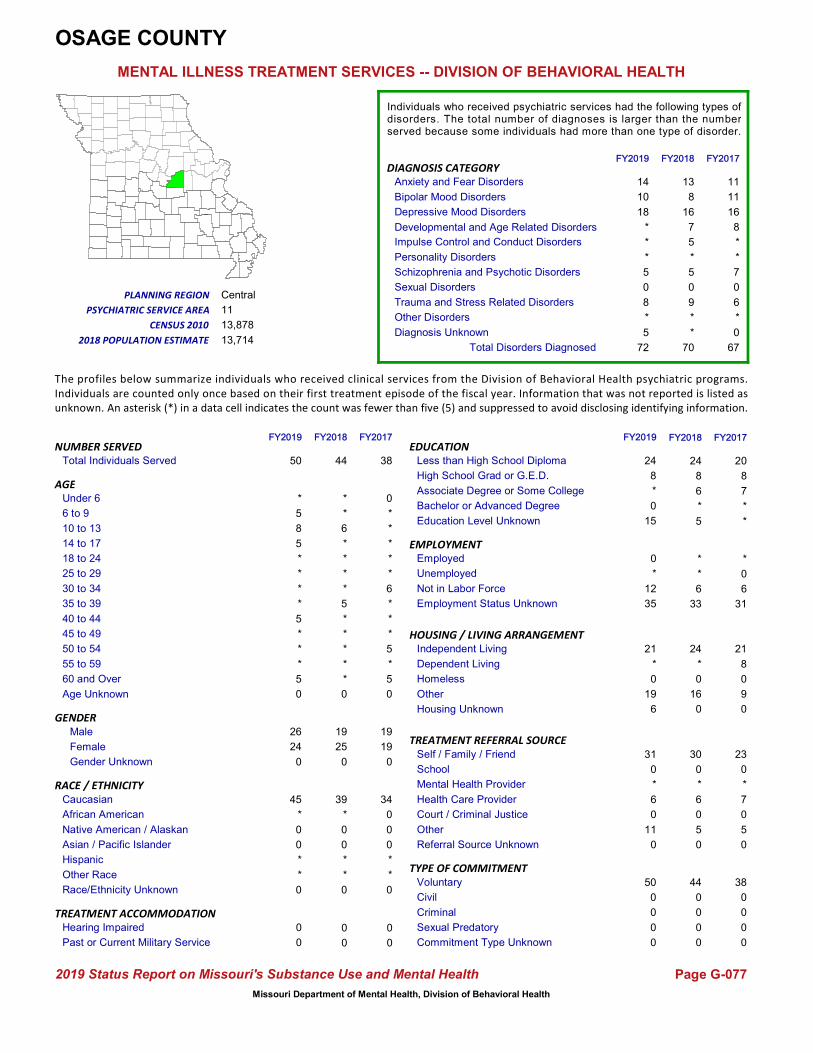
Total Individuals Served
Housing Unknown
Other
Homeless
Independent Living
Dependent Living
HOUSING / LIVING ARRANGEMENT
Employment Status Unknown
Not in Labor Force
Unemployed
Employed
Referral Source Unknown
Other
Court / Criminal Justice
Health Care Provider
Mental Health Provider
School
Self / Family / Friend
Education Level Unknown
Bachelor or Advanced Degree
Associate Degree or Some College
High School Grad or G.E.D.
Less than High School Diploma
Commitment Type Unknown
Sexual Predatory
Criminal
Civil
Voluntary
TREATMENT REFERRAL SOURCE
EMPLOYMENT
EDUCATION
TYPE OF COMMITMENT
Age Unknown
55 to 59
50 to 54
60 and Over
30 to 34
25 to 29
18 to 24
14 to 17
10 to 13
6 to 9
Under 6
40 to 44
35 to 39
45 to 49
AGE
Hearing Impaired
Past or Current Military Service0
0
Race/Ethnicity Unknown
Other Race
Hispanic
Asian / Pacific Islander
Native American / Alaskan
African American
Caucasian
0
*
*
0
0
0
34
GENDERMale
Female 19
19
Diagnosis Unknown
Other Disorders
Sexual Disorders
Schizophrenia and Psychotic Disorders
Personality Disorders
Depressive Mood Disorders
Impulse Control and Conduct DisordersDevelopmental and Age Related Disorders
Trauma and Stress Related Disorders
Anxiety and Fear Disorders
Bipolar Mood Disorders
DIAGNOSIS CATEGORY
The profiles below summarize individuals who received clinical services from the Division of Behavioral Health psychiatric programs.Individuals are counted only once based on their first treatment episode of the fiscal year. Information that was not reported is listed asunknown. An asterisk (*) in a data cell indicates the count was fewer than five (5) and suppressed to avoid disclosing identifying information.
*
*
*
0
*
*
*
*
*
6
5
5
*
11
Central
13,714
13,878
OSAGE COUNTY
20
8
7
*
*
6
0
44
0
0
0
11
11
16
8
*
*
7
0
6
30
0
*
6
0
5
*
*
0
6
14
10
18
*
*
*
5
0
8
*
*
*
6
*
*
*
*
*
#Name?
Page G-077
MENTAL ILLNESS TREATMENT SERVICES -- DIVISION OF BEHAVIORAL HEALTH
FY2018 FY2017
RACE / ETHNICITY
TREATMENT ACCOMMODATION
2019 Status Report on Missouri's Substance Use and Mental Health
05
*
33 315
*
*
*
*
0
0
0
3844NUMBER SERVED
PLANNING REGION
PSYCHIATRIC SERVICE AREA
2018 POPULATION ESTIMATE
CENSUS 2010
FY2019 FY2018 FY2017
Individuals who received psychiatric services had the following types ofdisorders. The total number of diagnoses is larger than the numberserved because some individuals had more than one type of disorder.
39
*
0
0
*
24
8
6
*
*
0
5
38
0
0
23
0
*
7
0
5
0
0
0
13
8
16
7
5
*
5
0
9
*
*
*
*
24
0
21
8
0
16 9
0 0
FY2018 FY2017
19
25
Gender Unknown 00
000
0
24
26
50
*
*
*
5
*
0
*
FY2019
0
0
*
0
0
*
45
5
*
*
*
5
8
5
*
FY2019
6
19
0
*
21
0
0
0
35
15
12
*
0
11
0
6
*
0
31
0
0
50
0
*
24
8
Total Disorders Diagnosed 6772 70
Missouri Department of Mental Health, Division of Behavioral Health

Total Individuals Served
Housing Unknown
Other
Homeless
Independent Living
Dependent Living
HOUSING / LIVING ARRANGEMENT
Employment Status Unknown
Not in Labor Force
Unemployed
Employed
Referral Source Unknown
Other
Court / Criminal Justice
Health Care Provider
Mental Health Provider
School
Self / Family / Friend
Education Level Unknown
Bachelor or Advanced Degree
Associate Degree or Some College
High School Grad or G.E.D.
Less than High School Diploma
Commitment Type Unknown
Sexual Predatory
Criminal
Civil
Voluntary
TREATMENT REFERRAL SOURCE
EMPLOYMENT
EDUCATION
TYPE OF COMMITMENT
Age Unknown
55 to 59
50 to 54
60 and Over
30 to 34
25 to 29
18 to 24
14 to 17
10 to 13
6 to 9
Under 6
40 to 44
35 to 39
45 to 49
AGE
Hearing Impaired
Past or Current Military Service0
*
Race/Ethnicity Unknown
Other Race
Hispanic
Asian / Pacific Islander
Native American / Alaskan
African American
Caucasian
0
*
0
0
0
0
74
GENDERMale
Female 42
35
Diagnosis Unknown
Other Disorders
Sexual Disorders
Schizophrenia and Psychotic Disorders
Personality Disorders
Depressive Mood Disorders
Impulse Control and Conduct DisordersDevelopmental and Age Related Disorders
Trauma and Stress Related Disorders
Anxiety and Fear Disorders
Bipolar Mood Disorders
DIAGNOSIS CATEGORY
The profiles below summarize individuals who received clinical services from the Division of Behavioral Health psychiatric programs.Individuals are counted only once based on their first treatment episode of the fiscal year. Information that was not reported is listed asunknown. An asterisk (*) in a data cell indicates the count was fewer than five (5) and suppressed to avoid disclosing identifying information.
8
5
7
0
*
*
7
11
7
8
*
8
8
18
Southeast
9,017
9,723
OZARK COUNTY
24
22
16
*
*
13
*
83
0
*
0
27
8
38
9
*
*
*
0
22
49
0
*
28
*
*
0
*
*
9
26
12
38
16
*
*
*
0
21
0
0
*
6
9
8
7
7
*
#Name?
Page G-078
MENTAL ILLNESS TREATMENT SERVICES -- DIVISION OF BEHAVIORAL HEALTH
FY2018 FY2017
RACE / ETHNICITY
TREATMENT ACCOMMODATION
2019 Status Report on Missouri's Substance Use and Mental Health
**
12
67 628
5
10
14
6
*
0
0
7785NUMBER SERVED
PLANNING REGION
PSYCHIATRIC SERVICE AREA
2018 POPULATION ESTIMATE
CENSUS 2010
FY2019 FY2018 FY2017
Individuals who received psychiatric services had the following types ofdisorders. The total number of diagnoses is larger than the numberserved because some individuals had more than one type of disorder.
80
0
0
0
0
27
24
14
5
*
0
15
75
0
*
43
0
*
31
*
0
0
0
*
27
13
39
12
*
*
*
0
16
0
*
*
15
43
*
38
21
*
18 14
7 *
FY2018 FY2017
34
51
Gender Unknown 00
000
0
49
35
84
7
11
13
5
7
0
*
FY2019
*
*
0
0
0
0
80
*
7
9
5
7
5
5
0
FY2019
*
19
6
9
48
0
0
*
62
14
12
7
*
0
*
27
*
0
54
*
0
83
*
9
21
37
Total Disorders Diagnosed 114125 120
Missouri Department of Mental Health, Division of Behavioral Health

Total Individuals Served
Housing Unknown
Other
Homeless
Independent Living
Dependent Living
HOUSING / LIVING ARRANGEMENT
Employment Status Unknown
Not in Labor Force
Unemployed
Employed
Referral Source Unknown
Other
Court / Criminal Justice
Health Care Provider
Mental Health Provider
School
Self / Family / Friend
Education Level Unknown
Bachelor or Advanced Degree
Associate Degree or Some College
High School Grad or G.E.D.
Less than High School Diploma
Commitment Type Unknown
Sexual Predatory
Criminal
Civil
Voluntary
TREATMENT REFERRAL SOURCE
EMPLOYMENT
EDUCATION
TYPE OF COMMITMENT
Age Unknown
55 to 59
50 to 54
60 and Over
30 to 34
25 to 29
18 to 24
14 to 17
10 to 13
6 to 9
Under 6
40 to 44
35 to 39
45 to 49
AGE
Hearing Impaired
Past or Current Military Service*
9
Race/Ethnicity Unknown
Other Race
Hispanic
Asian / Pacific Islander
Native American / Alaskan
African American
Caucasian
0
13
*
0
0
92
132
GENDERMale
Female 113
124
Diagnosis Unknown
Other Disorders
Sexual Disorders
Schizophrenia and Psychotic Disorders
Personality Disorders
Depressive Mood Disorders
Impulse Control and Conduct DisordersDevelopmental and Age Related Disorders
Trauma and Stress Related Disorders
Anxiety and Fear Disorders
Bipolar Mood Disorders
DIAGNOSIS CATEGORY
The profiles below summarize individuals who received clinical services from the Division of Behavioral Health psychiatric programs.Individuals are counted only once based on their first treatment episode of the fiscal year. Information that was not reported is listed asunknown. An asterisk (*) in a data cell indicates the count was fewer than five (5) and suppressed to avoid disclosing identifying information.
15
8
19
*
37
37
21
13
10
19
13
29
12
19
Southeast
16,272
18,296
PEMISCOT COUNTY
147
69
10
*
18
29
9
281
0
6
0
63
65
86
65
47
16
42
*
38
122
6
24
71
33
24
*
*
7
17
107
68
128
74
65
15
56
*
49
*
*
25
41
26
16
19
23
20
#Name?
Page G-079
MENTAL ILLNESS TREATMENT SERVICES -- DIVISION OF BEHAVIORAL HEALTH
FY2018 FY2017
RACE / ETHNICITY
TREATMENT ACCOMMODATION
2019 Status Report on Missouri's Substance Use and Mental Health
**
11
236 21125
33
14
22
23
9
*
*
237290NUMBER SERVED
PLANNING REGION
PSYCHIATRIC SERVICE AREA
2018 POPULATION ESTIMATE
CENSUS 2010
FY2019 FY2018 FY2017
Individuals who received psychiatric services had the following types ofdisorders. The total number of diagnoses is larger than the numberserved because some individuals had more than one type of disorder.
156
106
0
0
*
157
102
18
5
21
0
8
223
0
11
85
9
22
56
30
35
0
*
*
88
63
117
68
49
16
47
*
32
*
9
6
30
129
18
102
14
8
100 106
12 7
FY2018 FY2017
151
139
Gender Unknown 00
000
0
159
167
326
23
25
26
20
26
0
22
FY2019
0
5
9
0
0
124
180
18
25
25
17
29
55
30
7
FY2019
10
131
11
21
152
*
*
8
287
9
24
9
6
24
29
70
27
30
139
6
0
317
6
24
185
102
Total Disorders Diagnosed 433572 495
Missouri Department of Mental Health, Division of Behavioral Health
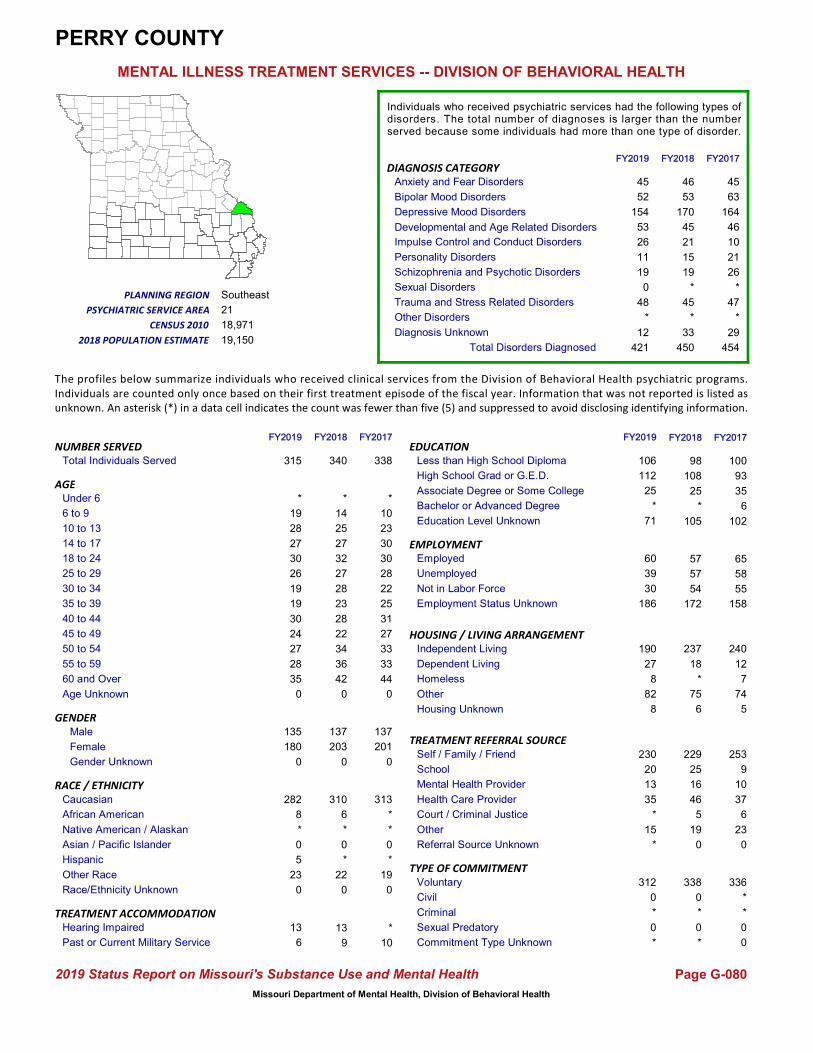
Total Individuals Served
Housing Unknown
Other
Homeless
Independent Living
Dependent Living
HOUSING / LIVING ARRANGEMENT
Employment Status Unknown
Not in Labor Force
Unemployed
Employed
Referral Source Unknown
Other
Court / Criminal Justice
Health Care Provider
Mental Health Provider
School
Self / Family / Friend
Education Level Unknown
Bachelor or Advanced Degree
Associate Degree or Some College
High School Grad or G.E.D.
Less than High School Diploma
Commitment Type Unknown
Sexual Predatory
Criminal
Civil
Voluntary
TREATMENT REFERRAL SOURCE
EMPLOYMENT
EDUCATION
TYPE OF COMMITMENT
Age Unknown
55 to 59
50 to 54
60 and Over
30 to 34
25 to 29
18 to 24
14 to 17
10 to 13
6 to 9
Under 6
40 to 44
35 to 39
45 to 49
AGE
Hearing Impaired
Past or Current Military Service*
10
Race/Ethnicity Unknown
Other Race
Hispanic
Asian / Pacific Islander
Native American / Alaskan
African American
Caucasian
0
19
*
0
*
*
313
GENDERMale
Female 201
137
Diagnosis Unknown
Other Disorders
Sexual Disorders
Schizophrenia and Psychotic Disorders
Personality Disorders
Depressive Mood Disorders
Impulse Control and Conduct DisordersDevelopmental and Age Related Disorders
Trauma and Stress Related Disorders
Anxiety and Fear Disorders
Bipolar Mood Disorders
DIAGNOSIS CATEGORY
The profiles below summarize individuals who received clinical services from the Division of Behavioral Health psychiatric programs.Individuals are counted only once based on their first treatment episode of the fiscal year. Information that was not reported is listed asunknown. An asterisk (*) in a data cell indicates the count was fewer than five (5) and suppressed to avoid disclosing identifying information.
27
25
31
*
10
23
30
30
28
22
44
33
33
21
Southeast
19,150
18,971
PERRY COUNTY
100
93
35
6
57
54
9
338
0
*
13
45
63
164
46
10
21
26
*
47
229
25
16
46
5
19
*
65
58
55
45
52
154
53
26
11
19
0
48
*
*
14
25
27
32
27
28
42
#Name?
Page G-080
MENTAL ILLNESS TREATMENT SERVICES -- DIVISION OF BEHAVIORAL HEALTH
FY2018 FY2017
RACE / ETHNICITY
TREATMENT ACCOMMODATION
2019 Status Report on Missouri's Substance Use and Mental Health
2912
102
172 15823
28
22
34
36
0
0
*
338340NUMBER SERVED
PLANNING REGION
PSYCHIATRIC SERVICE AREA
2018 POPULATION ESTIMATE
CENSUS 2010
FY2019 FY2018 FY2017
Individuals who received psychiatric services had the following types ofdisorders. The total number of diagnoses is larger than the numberserved because some individuals had more than one type of disorder.
310
6
*
0
*
98
108
25
*
22
0
105
336
*
*
253
9
10
37
6
23
0
0
0
46
53
170
45
21
15
19
*
45
*
33
57
18
237
*
240
12
7
75 74
6 5
FY2018 FY2017
137
203
Gender Unknown 00
000
0
180
135
315
28
27
24
30
19
0
23
FY2019
13
6
5
0
*
8
282
35
19
26
30
27
28
19
*
FY2019
8
82
8
27
190
*
0
*
186
71
30
39
60
15
*
35
13
20
230
*
0
312
*
25
106
112
Total Disorders Diagnosed 454421 450
Missouri Department of Mental Health, Division of Behavioral Health

Total Individuals Served
Housing Unknown
Other
Homeless
Independent Living
Dependent Living
HOUSING / LIVING ARRANGEMENT
Employment Status Unknown
Not in Labor Force
Unemployed
Employed
Referral Source Unknown
Other
Court / Criminal Justice
Health Care Provider
Mental Health Provider
School
Self / Family / Friend
Education Level Unknown
Bachelor or Advanced Degree
Associate Degree or Some College
High School Grad or G.E.D.
Less than High School Diploma
Commitment Type Unknown
Sexual Predatory
Criminal
Civil
Voluntary
TREATMENT REFERRAL SOURCE
EMPLOYMENT
EDUCATION
TYPE OF COMMITMENT
Age Unknown
55 to 59
50 to 54
60 and Over
30 to 34
25 to 29
18 to 24
14 to 17
10 to 13
6 to 9
Under 6
40 to 44
35 to 39
45 to 49
AGE
Hearing Impaired
Past or Current Military Service*
12
Race/Ethnicity Unknown
Other Race
Hispanic
Asian / Pacific Islander
Native American / Alaskan
African American
Caucasian
0
28
9
0
0
34
452
GENDERMale
Female 287
227
Diagnosis Unknown
Other Disorders
Sexual Disorders
Schizophrenia and Psychotic Disorders
Personality Disorders
Depressive Mood Disorders
Impulse Control and Conduct DisordersDevelopmental and Age Related Disorders
Trauma and Stress Related Disorders
Anxiety and Fear Disorders
Bipolar Mood Disorders
DIAGNOSIS CATEGORY
The profiles below summarize individuals who received clinical services from the Division of Behavioral Health psychiatric programs.Individuals are counted only once based on their first treatment episode of the fiscal year. Information that was not reported is listed asunknown. An asterisk (*) in a data cell indicates the count was fewer than five (5) and suppressed to avoid disclosing identifying information.
56
46
52
5
32
27
28
37
43
43
38
69
38
12
Central
42,542
42,201
PETTIS COUNTY
231
138
105
14
13
56
8
610
0
6
5
99
170
208
61
51
22
86
*
168
392
41
43
76
17
39
7
14
19
52
116
133
238
98
76
12
73
*
175
5
12
60
68
61
45
29
47
47
#Name?
Page G-081
MENTAL ILLNESS TREATMENT SERVICES -- DIVISION OF BEHAVIORAL HEALTH
FY2018 FY2017
RACE / ETHNICITY
TREATMENT ACCOMMODATION
2019 Status Report on Missouri's Substance Use and Mental Health
824
26
537 42947
54
53
53
41
9
*
0
514617NUMBER SERVED
PLANNING REGION
PSYCHIATRIC SERVICE AREA
2018 POPULATION ESTIMATE
CENSUS 2010
FY2019 FY2018 FY2017
Individuals who received psychiatric services had the following types ofdisorders. The total number of diagnoses is larger than the numberserved because some individuals had more than one type of disorder.
528
41
*
*
20
326
150
84
11
37
0
46
498
0
12
255
26
69
79
31
53
0
*
*
94
147
240
79
57
13
83
*
170
5
32
11
41
308
14
325
25
15
204 134
50 15
FY2018 FY2017
280
337
Gender Unknown 00
000
0
324
298
622
45
56
47
51
52
0
37
FY2019
10
5
23
*
*
44
539
36
38
31
47
71
76
60
12
FY2019
38
225
17
50
292
0
*
9
519
51
67
20
16
41
21
69
35
47
400
7
0
614
15
72
327
157
Total Disorders Diagnosed 882953 923
Missouri Department of Mental Health, Division of Behavioral Health

Total Individuals Served
Housing Unknown
Other
Homeless
Independent Living
Dependent Living
HOUSING / LIVING ARRANGEMENT
Employment Status Unknown
Not in Labor Force
Unemployed
Employed
Referral Source Unknown
Other
Court / Criminal Justice
Health Care Provider
Mental Health Provider
School
Self / Family / Friend
Education Level Unknown
Bachelor or Advanced Degree
Associate Degree or Some College
High School Grad or G.E.D.
Less than High School Diploma
Commitment Type Unknown
Sexual Predatory
Criminal
Civil
Voluntary
TREATMENT REFERRAL SOURCE
EMPLOYMENT
EDUCATION
TYPE OF COMMITMENT
Age Unknown
55 to 59
50 to 54
60 and Over
30 to 34
25 to 29
18 to 24
14 to 17
10 to 13
6 to 9
Under 6
40 to 44
35 to 39
45 to 49
AGE
Hearing Impaired
Past or Current Military Service*
7
Race/Ethnicity Unknown
Other Race
Hispanic
Asian / Pacific Islander
Native American / Alaskan
African American
Caucasian
0
21
5
*
*
22
465
GENDERMale
Female 278
232
Diagnosis Unknown
Other Disorders
Sexual Disorders
Schizophrenia and Psychotic Disorders
Personality Disorders
Depressive Mood Disorders
Impulse Control and Conduct DisordersDevelopmental and Age Related Disorders
Trauma and Stress Related Disorders
Anxiety and Fear Disorders
Bipolar Mood Disorders
DIAGNOSIS CATEGORY
The profiles below summarize individuals who received clinical services from the Division of Behavioral Health psychiatric programs.Individuals are counted only once based on their first treatment episode of the fiscal year. Information that was not reported is listed asunknown. An asterisk (*) in a data cell indicates the count was fewer than five (5) and suppressed to avoid disclosing identifying information.
39
51
36
*
40
46
65
48
44
43
24
36
34
17A
Southeast
44,732
45,156
PHELPS COUNTY
239
155
70
8
14
40
6
499
*
5
7
162
79
244
100
74
21
41
0
164
361
*
31
78
7
22
6
12
26
31
170
66
240
85
70
11
52
0
156
7
10
30
63
58
42
30
41
24
#Name?
Page G-082
MENTAL ILLNESS TREATMENT SERVICES -- DIVISION OF BEHAVIORAL HEALTH
FY2018 FY2017
RACE / ETHNICITY
TREATMENT ACCOMMODATION
2019 Status Report on Missouri's Substance Use and Mental Health
725
38
441 44146
32
47
42
41
*
0
0
510506NUMBER SERVED
PLANNING REGION
PSYCHIATRIC SERVICE AREA
2018 POPULATION ESTIMATE
CENSUS 2010
FY2019 FY2018 FY2017
Individuals who received psychiatric services had the following types ofdisorders. The total number of diagnoses is larger than the numberserved because some individuals had more than one type of disorder.
461
17
*
0
6
239
162
66
16
23
0
23
502
*
7
388
*
9
70
9
33
0
0
0
180
72
252
90
73
13
50
0
162
7
13
11
59
241
20
252
64
17
173 163
13 14
FY2018 FY2017
235
271
Gender Unknown 00
000
0
306
241
547
46
39
37
25
48
0
30
FY2019
8
*
15
0
*
19
497
43
52
33
50
61
59
44
10
FY2019
48
180
9
81
228
0
0
*
420
94
77
28
22
84
6
83
26
*
341
*
0
543
13
49
221
170
Total Disorders Diagnosed 898882 912
Missouri Department of Mental Health, Division of Behavioral Health

Total Individuals Served
Housing Unknown
Other
Homeless
Independent Living
Dependent Living
HOUSING / LIVING ARRANGEMENT
Employment Status Unknown
Not in Labor Force
Unemployed
Employed
Referral Source Unknown
Other
Court / Criminal Justice
Health Care Provider
Mental Health Provider
School
Self / Family / Friend
Education Level Unknown
Bachelor or Advanced Degree
Associate Degree or Some College
High School Grad or G.E.D.
Less than High School Diploma
Commitment Type Unknown
Sexual Predatory
Criminal
Civil
Voluntary
TREATMENT REFERRAL SOURCE
EMPLOYMENT
EDUCATION
TYPE OF COMMITMENT
Age Unknown
55 to 59
50 to 54
60 and Over
30 to 34
25 to 29
18 to 24
14 to 17
10 to 13
6 to 9
Under 6
40 to 44
35 to 39
45 to 49
AGE
Hearing Impaired
Past or Current Military Service0
5
Race/Ethnicity Unknown
Other Race
Hispanic
Asian / Pacific Islander
Native American / Alaskan
African American
Caucasian
0
*
*
0
0
13
154
GENDERMale
Female 89
82
Diagnosis Unknown
Other Disorders
Sexual Disorders
Schizophrenia and Psychotic Disorders
Personality Disorders
Depressive Mood Disorders
Impulse Control and Conduct DisordersDevelopmental and Age Related Disorders
Trauma and Stress Related Disorders
Anxiety and Fear Disorders
Bipolar Mood Disorders
DIAGNOSIS CATEGORY
The profiles below summarize individuals who received clinical services from the Division of Behavioral Health psychiatric programs.Individuals are counted only once based on their first treatment episode of the fiscal year. Information that was not reported is listed asunknown. An asterisk (*) in a data cell indicates the count was fewer than five (5) and suppressed to avoid disclosing identifying information.
12
10
16
0
14
16
21
10
15
14
10
18
15
15
Central
18,504
18,516
PIKE COUNTY
84
51
27
*
8
5
6
182
0
*
0
30
58
55
40
16
12
37
*
28
92
*
26
25
*
29
*
*
8
9
36
58
60
49
15
5
33
*
41
0
*
20
25
16
6
13
15
11
#Name?
Page G-083
MENTAL ILLNESS TREATMENT SERVICES -- DIVISION OF BEHAVIORAL HEALTH
FY2018 FY2017
RACE / ETHNICITY
TREATMENT ACCOMMODATION
2019 Status Report on Missouri's Substance Use and Mental Health
8*
7
160 15011
19
11
19
16
*
*
0
171184NUMBER SERVED
PLANNING REGION
PSYCHIATRIC SERVICE AREA
2018 POPULATION ESTIMATE
CENSUS 2010
FY2019 FY2018 FY2017
Individuals who received psychiatric services had the following types ofdisorders. The total number of diagnoses is larger than the numberserved because some individuals had more than one type of disorder.
159
14
0
0
*
106
47
22
5
10
0
*
169
0
0
98
*
15
22
*
31
0
*
*
35
54
57
51
22
6
32
*
40
*
6
10
16
84
*
84
12
*
70 69
10 5
FY2018 FY2017
94
90
Gender Unknown 00
000
0
93
89
182
19
15
18
12
10
0
9
FY2019
*
6
*
0
0
14
159
16
16
13
9
17
19
15
*
FY2019
15
73
0
11
83
0
*
*
160
*
9
6
7
29
*
28
26
*
90
*
0
179
*
17
95
65
Total Disorders Diagnosed 286300 306
Missouri Department of Mental Health, Division of Behavioral Health

Total Individuals Served
Housing Unknown
Other
Homeless
Independent Living
Dependent Living
HOUSING / LIVING ARRANGEMENT
Employment Status Unknown
Not in Labor Force
Unemployed
Employed
Referral Source Unknown
Other
Court / Criminal Justice
Health Care Provider
Mental Health Provider
School
Self / Family / Friend
Education Level Unknown
Bachelor or Advanced Degree
Associate Degree or Some College
High School Grad or G.E.D.
Less than High School Diploma
Commitment Type Unknown
Sexual Predatory
Criminal
Civil
Voluntary
TREATMENT REFERRAL SOURCE
EMPLOYMENT
EDUCATION
TYPE OF COMMITMENT
Age Unknown
55 to 59
50 to 54
60 and Over
30 to 34
25 to 29
18 to 24
14 to 17
10 to 13
6 to 9
Under 6
40 to 44
35 to 39
45 to 49
AGE
Hearing Impaired
Past or Current Military Service7
12
Race/Ethnicity Unknown
Other Race
Hispanic
Asian / Pacific Islander
Native American / Alaskan
African American
Caucasian
0
51
25
9
*
50
571
GENDERMale
Female 394
291
Diagnosis Unknown
Other Disorders
Sexual Disorders
Schizophrenia and Psychotic Disorders
Personality Disorders
Depressive Mood Disorders
Impulse Control and Conduct DisordersDevelopmental and Age Related Disorders
Trauma and Stress Related Disorders
Anxiety and Fear Disorders
Bipolar Mood Disorders
DIAGNOSIS CATEGORY
The profiles below summarize individuals who received clinical services from the Division of Behavioral Health psychiatric programs.Individuals are counted only once based on their first treatment episode of the fiscal year. Information that was not reported is listed asunknown. An asterisk (*) in a data cell indicates the count was fewer than five (5) and suppressed to avoid disclosing identifying information.
55
66
47
5
29
48
61
67
63
72
59
55
58
6
Northwest
102,985
89,322
PLATTE COUNTY
198
229
133
55
42
58
10
698
0
*
*
271
218
367
139
61
124
128
*
209
649
*
10
29
*
11
62
33
41
60
268
199
359
115
41
107
106
*
217
31
7
27
34
69
68
56
64
78
#Name?
Page G-084
MENTAL ILLNESS TREATMENT SERVICES -- DIVISION OF BEHAVIORAL HEALTH
FY2018 FY2017
RACE / ETHNICITY
TREATMENT ACCOMMODATION
2019 Status Report on Missouri's Substance Use and Mental Health
2343
67
554 54865
55
62
67
54
*
*
5
685706NUMBER SERVED
PLANNING REGION
PSYCHIATRIC SERVICE AREA
2018 POPULATION ESTIMATE
CENSUS 2010
FY2019 FY2018 FY2017
Individuals who received psychiatric services had the following types ofdisorders. The total number of diagnoses is larger than the numberserved because some individuals had more than one type of disorder.
574
54
5
11
37
204
248
135
44
61
0
75
684
0
*
628
*
15
29
8
7
0
*
0
252
199
375
115
48
112
116
*
213
42
43
52
85
416
25
405
89
16
153 161
27 14
FY2018 FY2017
307
399
Gender Unknown 00
000
0
381
302
683
55
53
63
59
61
0
66
FY2019
10
9
41
7
7
50
553
78
47
58
66
55
53
28
7
FY2019
43
148
26
97
369
*
*
*
525
57
60
45
53
9
*
30
15
10
613
*
0
674
48
131
207
240
Total Disorders Diagnosed 1,6041,488 1,517
Missouri Department of Mental Health, Division of Behavioral Health

Total Individuals Served
Housing Unknown
Other
Homeless
Independent Living
Dependent Living
HOUSING / LIVING ARRANGEMENT
Employment Status Unknown
Not in Labor Force
Unemployed
Employed
Referral Source Unknown
Other
Court / Criminal Justice
Health Care Provider
Mental Health Provider
School
Self / Family / Friend
Education Level Unknown
Bachelor or Advanced Degree
Associate Degree or Some College
High School Grad or G.E.D.
Less than High School Diploma
Commitment Type Unknown
Sexual Predatory
Criminal
Civil
Voluntary
TREATMENT REFERRAL SOURCE
EMPLOYMENT
EDUCATION
TYPE OF COMMITMENT
Age Unknown
55 to 59
50 to 54
60 and Over
30 to 34
25 to 29
18 to 24
14 to 17
10 to 13
6 to 9
Under 6
40 to 44
35 to 39
45 to 49
AGE
Hearing Impaired
Past or Current Military Service0
5
Race/Ethnicity Unknown
Other Race
Hispanic
Asian / Pacific Islander
Native American / Alaskan
African American
Caucasian
0
41
*
0
*
5
193
GENDERMale
Female 97
143
Diagnosis Unknown
Other Disorders
Sexual Disorders
Schizophrenia and Psychotic Disorders
Personality Disorders
Depressive Mood Disorders
Impulse Control and Conduct DisordersDevelopmental and Age Related Disorders
Trauma and Stress Related Disorders
Anxiety and Fear Disorders
Bipolar Mood Disorders
DIAGNOSIS CATEGORY
The profiles below summarize individuals who received clinical services from the Division of Behavioral Health psychiatric programs.Individuals are counted only once based on their first treatment episode of the fiscal year. Information that was not reported is listed asunknown. An asterisk (*) in a data cell indicates the count was fewer than five (5) and suppressed to avoid disclosing identifying information.
17
20
15
7
18
25
21
25
22
21
17
20
12
10
Southwest
32,201
31,137
POLK COUNTY
123
68
29
5
8
45
6
223
*
5
*
63
54
78
52
45
22
59
*
73
97
*
26
56
9
33
*
11
6
33
86
49
97
50
43
18
66
0
82
*
5
15
18
22
24
24
19
14
#Name?
Page G-085
MENTAL ILLNESS TREATMENT SERVICES -- DIVISION OF BEHAVIORAL HEALTH
FY2018 FY2017
RACE / ETHNICITY
TREATMENT ACCOMMODATION
2019 Status Report on Missouri's Substance Use and Mental Health
718
15
171 19019
17
16
20
16
6
0
0
240229NUMBER SERVED
PLANNING REGION
PSYCHIATRIC SERVICE AREA
2018 POPULATION ESTIMATE
CENSUS 2010
FY2019 FY2018 FY2017
Individuals who received psychiatric services had the following types ofdisorders. The total number of diagnoses is larger than the numberserved because some individuals had more than one type of disorder.
175
5
*
0
*
108
73
22
*
43
0
22
231
*
8
92
*
23
61
26
36
*
0
0
65
59
77
47
39
20
59
*
70
*
9
5
17
76
*
83
19
9
86 114
47 15
FY2018 FY2017
130
99
Gender Unknown 00
000
0
120
151
271
21
21
18
18
33
0
35
FY2019
*
*
*
0
*
6
228
13
22
19
24
29
27
19
7
FY2019
44
99
*
30
94
0
0
*
178
54
68
12
13
44
11
64
18
*
129
*
0
268
*
22
106
85
Total Disorders Diagnosed 458512 450
Missouri Department of Mental Health, Division of Behavioral Health

Total Individuals Served
Housing Unknown
Other
Homeless
Independent Living
Dependent Living
HOUSING / LIVING ARRANGEMENT
Employment Status Unknown
Not in Labor Force
Unemployed
Employed
Referral Source Unknown
Other
Court / Criminal Justice
Health Care Provider
Mental Health Provider
School
Self / Family / Friend
Education Level Unknown
Bachelor or Advanced Degree
Associate Degree or Some College
High School Grad or G.E.D.
Less than High School Diploma
Commitment Type Unknown
Sexual Predatory
Criminal
Civil
Voluntary
TREATMENT REFERRAL SOURCE
EMPLOYMENT
EDUCATION
TYPE OF COMMITMENT
Age Unknown
55 to 59
50 to 54
60 and Over
30 to 34
25 to 29
18 to 24
14 to 17
10 to 13
6 to 9
Under 6
40 to 44
35 to 39
45 to 49
AGE
Hearing Impaired
Past or Current Military Service*
*
Race/Ethnicity Unknown
Other Race
Hispanic
Asian / Pacific Islander
Native American / Alaskan
African American
Caucasian
0
23
13
0
*
39
339
GENDERMale
Female 234
169
Diagnosis Unknown
Other Disorders
Sexual Disorders
Schizophrenia and Psychotic Disorders
Personality Disorders
Depressive Mood Disorders
Impulse Control and Conduct DisordersDevelopmental and Age Related Disorders
Trauma and Stress Related Disorders
Anxiety and Fear Disorders
Bipolar Mood Disorders
DIAGNOSIS CATEGORY
The profiles below summarize individuals who received clinical services from the Division of Behavioral Health psychiatric programs.Individuals are counted only once based on their first treatment episode of the fiscal year. Information that was not reported is listed asunknown. An asterisk (*) in a data cell indicates the count was fewer than five (5) and suppressed to avoid disclosing identifying information.
30
39
27
7
41
32
28
39
33
37
21
34
35
11
Central
52,014
52,274
PULASKI COUNTY
176
109
62
13
6
22
*
334
0
*
6
154
66
211
69
56
7
39
*
131
264
0
9
46
*
12
*
7
14
24
110
35
140
54
43
*
31
*
96
*
0
33
36
35
26
19
28
24
#Name?
Page G-086
MENTAL ILLNESS TREATMENT SERVICES -- DIVISION OF BEHAVIORAL HEALTH
FY2018 FY2017
RACE / ETHNICITY
TREATMENT ACCOMMODATION
2019 Status Report on Missouri's Substance Use and Mental Health
*11
43
303 35827
21
33
22
33
*
*
0
403337NUMBER SERVED
PLANNING REGION
PSYCHIATRIC SERVICE AREA
2018 POPULATION ESTIMATE
CENSUS 2010
FY2019 FY2018 FY2017
Individuals who received psychiatric services had the following types ofdisorders. The total number of diagnoses is larger than the numberserved because some individuals had more than one type of disorder.
288
25
*
*
7
157
97
48
8
18
0
27
398
*
*
341
0
*
48
6
7
0
*
0
131
55
175
63
55
7
33
*
97
*
7
6
33
171
9
226
43
13
116 116
8 5
FY2018 FY2017
148
189
Gender Unknown 00
000
0
169
135
304
28
21
28
23
13
0
20
FY2019
6
*
12
*
*
27
252
23
21
19
22
42
40
21
*
FY2019
26
104
7
36
131
0
*
5
243
57
41
10
10
40
*
45
8
*
201
*
0
299
8
24
131
84
Total Disorders Diagnosed 739527 625
Missouri Department of Mental Health, Division of Behavioral Health

Total Individuals Served
Housing Unknown
Other
Homeless
Independent Living
Dependent Living
HOUSING / LIVING ARRANGEMENT
Employment Status Unknown
Not in Labor Force
Unemployed
Employed
Referral Source Unknown
Other
Court / Criminal Justice
Health Care Provider
Mental Health Provider
School
Self / Family / Friend
Education Level Unknown
Bachelor or Advanced Degree
Associate Degree or Some College
High School Grad or G.E.D.
Less than High School Diploma
Commitment Type Unknown
Sexual Predatory
Criminal
Civil
Voluntary
TREATMENT REFERRAL SOURCE
EMPLOYMENT
EDUCATION
TYPE OF COMMITMENT
Age Unknown
55 to 59
50 to 54
60 and Over
30 to 34
25 to 29
18 to 24
14 to 17
10 to 13
6 to 9
Under 6
40 to 44
35 to 39
45 to 49
AGE
Hearing Impaired
Past or Current Military Service0
*
Race/Ethnicity Unknown
Other Race
Hispanic
Asian / Pacific Islander
Native American / Alaskan
African American
Caucasian
0
0
0
0
0
0
48
GENDERMale
Female 22
26
Diagnosis Unknown
Other Disorders
Sexual Disorders
Schizophrenia and Psychotic Disorders
Personality Disorders
Depressive Mood Disorders
Impulse Control and Conduct DisordersDevelopmental and Age Related Disorders
Trauma and Stress Related Disorders
Anxiety and Fear Disorders
Bipolar Mood Disorders
DIAGNOSIS CATEGORY
The profiles below summarize individuals who received clinical services from the Division of Behavioral Health psychiatric programs.Individuals are counted only once based on their first treatment episode of the fiscal year. Information that was not reported is listed asunknown. An asterisk (*) in a data cell indicates the count was fewer than five (5) and suppressed to avoid disclosing identifying information.
7
*
*
*
5
8
5
*
*
*
5
*
*
13
Northwest
4,757
4,979
PUTNAM COUNTY
21
17
*
*
*
*
*
58
0
0
0
11
10
18
14
*
*
6
*
18
27
6
*
9
*
8
*
0
*
*
14
9
24
18
6
*
5
0
24
0
8
7
10
*
*
*
*
5
#Name?
Page G-087
MENTAL ILLNESS TREATMENT SERVICES -- DIVISION OF BEHAVIORAL HEALTH
FY2018 FY2017
RACE / ETHNICITY
TREATMENT ACCOMMODATION
2019 Status Report on Missouri's Substance Use and Mental Health
**
6
52 44*
*
7
*
*
*
0
0
4858NUMBER SERVED
PLANNING REGION
PSYCHIATRIC SERVICE AREA
2018 POPULATION ESTIMATE
CENSUS 2010
FY2019 FY2018 FY2017
Individuals who received psychiatric services had the following types ofdisorders. The total number of diagnoses is larger than the numberserved because some individuals had more than one type of disorder.
57
0
0
0
0
32
15
6
*
0
0
*
48
0
0
19
*
*
10
*
8
0
0
0
13
9
24
22
6
*
6
0
22
*
*
0
*
24
0
24
*
*
29 20
* 0
FY2018 FY2017
29
29
Gender Unknown 00
000
0
29
28
57
*
*
*
*
6
0
*
FY2019
0
0
0
0
0
0
56
5
*
*
*
*
12
7
5
FY2019
*
28
*
*
22
0
0
*
52
*
*
0
*
7
5
8
*
5
28
0
0
57
*
6
31
16
Total Disorders Diagnosed 88104 108
Missouri Department of Mental Health, Division of Behavioral Health
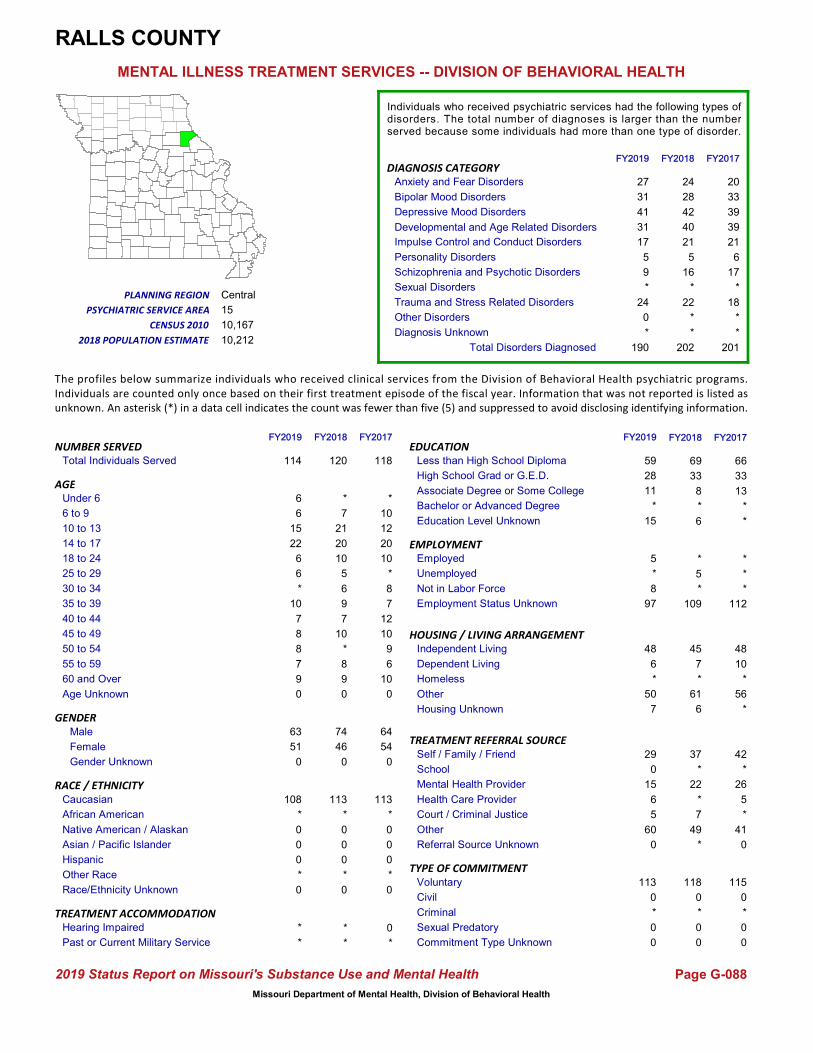
Total Individuals Served
Housing Unknown
Other
Homeless
Independent Living
Dependent Living
HOUSING / LIVING ARRANGEMENT
Employment Status Unknown
Not in Labor Force
Unemployed
Employed
Referral Source Unknown
Other
Court / Criminal Justice
Health Care Provider
Mental Health Provider
School
Self / Family / Friend
Education Level Unknown
Bachelor or Advanced Degree
Associate Degree or Some College
High School Grad or G.E.D.
Less than High School Diploma
Commitment Type Unknown
Sexual Predatory
Criminal
Civil
Voluntary
TREATMENT REFERRAL SOURCE
EMPLOYMENT
EDUCATION
TYPE OF COMMITMENT
Age Unknown
55 to 59
50 to 54
60 and Over
30 to 34
25 to 29
18 to 24
14 to 17
10 to 13
6 to 9
Under 6
40 to 44
35 to 39
45 to 49
AGE
Hearing Impaired
Past or Current Military Service0
*
Race/Ethnicity Unknown
Other Race
Hispanic
Asian / Pacific Islander
Native American / Alaskan
African American
Caucasian
0
*
0
0
0
*
113
GENDERMale
Female 54
64
Diagnosis Unknown
Other Disorders
Sexual Disorders
Schizophrenia and Psychotic Disorders
Personality Disorders
Depressive Mood Disorders
Impulse Control and Conduct DisordersDevelopmental and Age Related Disorders
Trauma and Stress Related Disorders
Anxiety and Fear Disorders
Bipolar Mood Disorders
DIAGNOSIS CATEGORY
The profiles below summarize individuals who received clinical services from the Division of Behavioral Health psychiatric programs.Individuals are counted only once based on their first treatment episode of the fiscal year. Information that was not reported is listed asunknown. An asterisk (*) in a data cell indicates the count was fewer than five (5) and suppressed to avoid disclosing identifying information.
10
7
12
*
10
12
20
10
*
8
10
9
6
15
Central
10,212
10,167
RALLS COUNTY
66
33
13
*
5
*
*
118
0
*
*
20
33
39
39
21
6
17
*
18
37
*
22
*
7
49
*
*
*
*
27
31
41
31
17
5
9
*
24
0
*
7
21
20
10
5
6
9
#Name?
Page G-088
MENTAL ILLNESS TREATMENT SERVICES -- DIVISION OF BEHAVIORAL HEALTH
FY2018 FY2017
RACE / ETHNICITY
TREATMENT ACCOMMODATION
2019 Status Report on Missouri's Substance Use and Mental Health
**
*
109 1129
7
10
*
8
*
0
0
118120NUMBER SERVED
PLANNING REGION
PSYCHIATRIC SERVICE AREA
2018 POPULATION ESTIMATE
CENSUS 2010
FY2019 FY2018 FY2017
Individuals who received psychiatric services had the following types ofdisorders. The total number of diagnoses is larger than the numberserved because some individuals had more than one type of disorder.
113
*
0
0
0
69
33
8
*
*
0
6
115
0
*
42
*
26
5
*
41
0
0
0
24
28
42
40
21
5
16
*
22
*
*
*
7
45
*
48
10
*
61 56
6 *
FY2018 FY2017
74
46
Gender Unknown 00
000
0
51
63
114
7
8
8
7
10
0
*
FY2019
*
*
0
0
0
*
108
9
*
6
6
22
15
6
6
FY2019
7
50
*
6
48
0
0
0
97
15
8
*
5
60
5
6
15
0
29
*
0
113
*
11
59
28
Total Disorders Diagnosed 201190 202
Missouri Department of Mental Health, Division of Behavioral Health

Total Individuals Served
Housing Unknown
Other
Homeless
Independent Living
Dependent Living
HOUSING / LIVING ARRANGEMENT
Employment Status Unknown
Not in Labor Force
Unemployed
Employed
Referral Source Unknown
Other
Court / Criminal Justice
Health Care Provider
Mental Health Provider
School
Self / Family / Friend
Education Level Unknown
Bachelor or Advanced Degree
Associate Degree or Some College
High School Grad or G.E.D.
Less than High School Diploma
Commitment Type Unknown
Sexual Predatory
Criminal
Civil
Voluntary
TREATMENT REFERRAL SOURCE
EMPLOYMENT
EDUCATION
TYPE OF COMMITMENT
Age Unknown
55 to 59
50 to 54
60 and Over
30 to 34
25 to 29
18 to 24
14 to 17
10 to 13
6 to 9
Under 6
40 to 44
35 to 39
45 to 49
AGE
Hearing Impaired
Past or Current Military Service*
7
Race/Ethnicity Unknown
Other Race
Hispanic
Asian / Pacific Islander
Native American / Alaskan
African American
Caucasian
0
20
*
0
*
21
267
GENDERMale
Female 173
136
Diagnosis Unknown
Other Disorders
Sexual Disorders
Schizophrenia and Psychotic Disorders
Personality Disorders
Depressive Mood Disorders
Impulse Control and Conduct DisordersDevelopmental and Age Related Disorders
Trauma and Stress Related Disorders
Anxiety and Fear Disorders
Bipolar Mood Disorders
DIAGNOSIS CATEGORY
The profiles below summarize individuals who received clinical services from the Division of Behavioral Health psychiatric programs.Individuals are counted only once based on their first treatment episode of the fiscal year. Information that was not reported is listed asunknown. An asterisk (*) in a data cell indicates the count was fewer than five (5) and suppressed to avoid disclosing identifying information.
29
38
31
*
11
18
30
20
26
31
24
23
25
12
Central
24,763
25,414
RANDOLPH COUNTY
137
97
61
6
9
37
5
350
0
6
*
57
93
109
33
17
9
48
*
88
220
40
13
37
24
15
8
9
11
18
68
58
144
45
31
7
45
*
139
5
7
41
35
34
29
16
35
33
#Name?
Page G-089
MENTAL ILLNESS TREATMENT SERVICES -- DIVISION OF BEHAVIORAL HEALTH
FY2018 FY2017
RACE / ETHNICITY
TREATMENT ACCOMMODATION
2019 Status Report on Missouri's Substance Use and Mental Health
*9
7
306 27028
27
25
29
19
9
*
*
309358NUMBER SERVED
PLANNING REGION
PSYCHIATRIC SERVICE AREA
2018 POPULATION ESTIMATE
CENSUS 2010
FY2019 FY2018 FY2017
Individuals who received psychiatric services had the following types ofdisorders. The total number of diagnoses is larger than the numberserved because some individuals had more than one type of disorder.
304
30
0
0
*
176
99
55
5
16
0
23
304
0
*
179
12
23
43
32
20
0
*
0
52
67
122
50
23
7
45
*
118
5
15
6
52
168
7
159
65
5
118 74
13 6
FY2018 FY2017
162
196
Gender Unknown 00
000
0
202
193
395
23
27
31
25
32
0
22
FY2019
5
6
11
0
0
36
337
30
24
19
30
41
47
61
5
FY2019
11
161
7
40
176
0
*
5
347
20
27
11
10
24
31
42
14
61
218
*
0
390
*
51
208
112
Total Disorders Diagnosed 465552 506
Missouri Department of Mental Health, Division of Behavioral Health

Total Individuals Served
Housing Unknown
Other
Homeless
Independent Living
Dependent Living
HOUSING / LIVING ARRANGEMENT
Employment Status Unknown
Not in Labor Force
Unemployed
Employed
Referral Source Unknown
Other
Court / Criminal Justice
Health Care Provider
Mental Health Provider
School
Self / Family / Friend
Education Level Unknown
Bachelor or Advanced Degree
Associate Degree or Some College
High School Grad or G.E.D.
Less than High School Diploma
Commitment Type Unknown
Sexual Predatory
Criminal
Civil
Voluntary
TREATMENT REFERRAL SOURCE
EMPLOYMENT
EDUCATION
TYPE OF COMMITMENT
Age Unknown
55 to 59
50 to 54
60 and Over
30 to 34
25 to 29
18 to 24
14 to 17
10 to 13
6 to 9
Under 6
40 to 44
35 to 39
45 to 49
AGE
Hearing Impaired
Past or Current Military Service*
6
Race/Ethnicity Unknown
Other Race
Hispanic
Asian / Pacific Islander
Native American / Alaskan
African American
Caucasian
*
6
*
0
*
*
208
GENDERMale
Female 117
103
Diagnosis Unknown
Other Disorders
Sexual Disorders
Schizophrenia and Psychotic Disorders
Personality Disorders
Depressive Mood Disorders
Impulse Control and Conduct DisordersDevelopmental and Age Related Disorders
Trauma and Stress Related Disorders
Anxiety and Fear Disorders
Bipolar Mood Disorders
DIAGNOSIS CATEGORY
The profiles below summarize individuals who received clinical services from the Division of Behavioral Health psychiatric programs.Individuals are counted only once based on their first treatment episode of the fiscal year. Information that was not reported is listed asunknown. An asterisk (*) in a data cell indicates the count was fewer than five (5) and suppressed to avoid disclosing identifying information.
15
17
19
*
9
12
20
17
13
31
19
29
16
6
Northwest
22,883
23,494
RAY COUNTY
75
70
27
9
31
39
7
245
0
0
*
79
89
113
43
33
36
32
0
73
221
0
*
17
0
5
23
27
27
25
69
67
94
21
28
32
33
0
52
15
*
11
10
14
20
21
26
21
#Name?
Page G-090
MENTAL ILLNESS TREATMENT SERVICES -- DIVISION OF BEHAVIORAL HEALTH
FY2018 FY2017
RACE / ETHNICITY
TREATMENT ACCOMMODATION
2019 Status Report on Missouri's Substance Use and Mental Health
1115
39
143 14122
28
23
27
23
*
*
*
221247NUMBER SERVED
PLANNING REGION
PSYCHIATRIC SERVICE AREA
2018 POPULATION ESTIMATE
CENSUS 2010
FY2019 FY2018 FY2017
Individuals who received psychiatric services had the following types ofdisorders. The total number of diagnoses is larger than the numberserved because some individuals had more than one type of disorder.
229
*
*
0
*
84
81
31
11
13
0
40
220
0
0
197
0
0
16
*
6
*
0
*
86
84
122
28
29
34
36
0
73
18
26
34
43
136
6
125
30
5
37 36
25 25
FY2018 FY2017
109
138
Gender Unknown *0
*00
0
101
87
188
22
25
19
18
17
0
12
FY2019
6
*
*
0
0
*
173
17
7
17
18
10
10
6
*
FY2019
21
28
*
32
104
*
*
*
109
25
33
22
24
6
*
11
*
0
165
*
0
184
7
25
62
69
Total Disorders Diagnosed 532426 536
Missouri Department of Mental Health, Division of Behavioral Health

Total Individuals Served
Housing Unknown
Other
Homeless
Independent Living
Dependent Living
HOUSING / LIVING ARRANGEMENT
Employment Status Unknown
Not in Labor Force
Unemployed
Employed
Referral Source Unknown
Other
Court / Criminal Justice
Health Care Provider
Mental Health Provider
School
Self / Family / Friend
Education Level Unknown
Bachelor or Advanced Degree
Associate Degree or Some College
High School Grad or G.E.D.
Less than High School Diploma
Commitment Type Unknown
Sexual Predatory
Criminal
Civil
Voluntary
TREATMENT REFERRAL SOURCE
EMPLOYMENT
EDUCATION
TYPE OF COMMITMENT
Age Unknown
55 to 59
50 to 54
60 and Over
30 to 34
25 to 29
18 to 24
14 to 17
10 to 13
6 to 9
Under 6
40 to 44
35 to 39
45 to 49
AGE
Hearing Impaired
Past or Current Military Service*
*
Race/Ethnicity Unknown
Other Race
Hispanic
Asian / Pacific Islander
Native American / Alaskan
African American
Caucasian
0
*
0
0
0
*
50
GENDERMale
Female 32
22
Diagnosis Unknown
Other Disorders
Sexual Disorders
Schizophrenia and Psychotic Disorders
Personality Disorders
Depressive Mood Disorders
Impulse Control and Conduct DisordersDevelopmental and Age Related Disorders
Trauma and Stress Related Disorders
Anxiety and Fear Disorders
Bipolar Mood Disorders
DIAGNOSIS CATEGORY
The profiles below summarize individuals who received clinical services from the Division of Behavioral Health psychiatric programs.Individuals are counted only once based on their first treatment episode of the fiscal year. Information that was not reported is listed asunknown. An asterisk (*) in a data cell indicates the count was fewer than five (5) and suppressed to avoid disclosing identifying information.
9
6
*
0
0
5
*
*
*
*
7
9
6
19
Southeast
6,254
6,696
REYNOLDS COUNTY
21
24
8
0
*
6
*
48
0
*
*
10
17
26
*
*
*
10
0
13
20
*
7
13
*
5
0
*
0
5
5
17
29
*
*
*
11
0
11
*
0
0
6
*
*
*
*
8
#Name?
Page G-091
MENTAL ILLNESS TREATMENT SERVICES -- DIVISION OF BEHAVIORAL HEALTH
FY2018 FY2017
RACE / ETHNICITY
TREATMENT ACCOMMODATION
2019 Status Report on Missouri's Substance Use and Mental Health
00
*
43 485
*
9
7
7
*
0
0
5451NUMBER SERVED
PLANNING REGION
PSYCHIATRIC SERVICE AREA
2018 POPULATION ESTIMATE
CENSUS 2010
FY2019 FY2018 FY2017
Individuals who received psychiatric services had the following types ofdisorders. The total number of diagnoses is larger than the numberserved because some individuals had more than one type of disorder.
45
*
0
0
0
20
17
9
0
*
0
5
53
0
0
24
*
5
16
*
5
0
0
*
7
15
25
*
*
*
12
0
11
*
0
*
*
35
0
39
*
0
8 12
6 *
FY2018 FY2017
20
31
Gender Unknown 00
000
0
34
19
53
7
6
8
6
*
0
*
FY2019
*
*
*
0
0
*
49
5
6
*
*
*
5
*
0
FY2019
9
7
0
*
36
0
0
*
47
6
*
*
*
6
*
13
12
0
20
*
0
51
*
5
23
18
Total Disorders Diagnosed 8580 80
Missouri Department of Mental Health, Division of Behavioral Health

Total Individuals Served
Housing Unknown
Other
Homeless
Independent Living
Dependent Living
HOUSING / LIVING ARRANGEMENT
Employment Status Unknown
Not in Labor Force
Unemployed
Employed
Referral Source Unknown
Other
Court / Criminal Justice
Health Care Provider
Mental Health Provider
School
Self / Family / Friend
Education Level Unknown
Bachelor or Advanced Degree
Associate Degree or Some College
High School Grad or G.E.D.
Less than High School Diploma
Commitment Type Unknown
Sexual Predatory
Criminal
Civil
Voluntary
TREATMENT REFERRAL SOURCE
EMPLOYMENT
EDUCATION
TYPE OF COMMITMENT
Age Unknown
55 to 59
50 to 54
60 and Over
30 to 34
25 to 29
18 to 24
14 to 17
10 to 13
6 to 9
Under 6
40 to 44
35 to 39
45 to 49
AGE
Hearing Impaired
Past or Current Military Service*
*
Race/Ethnicity Unknown
Other Race
Hispanic
Asian / Pacific Islander
Native American / Alaskan
African American
Caucasian
0
*
*
0
0
*
142
GENDERMale
Female 88
57
Diagnosis Unknown
Other Disorders
Sexual Disorders
Schizophrenia and Psychotic Disorders
Personality Disorders
Depressive Mood Disorders
Impulse Control and Conduct DisordersDevelopmental and Age Related Disorders
Trauma and Stress Related Disorders
Anxiety and Fear Disorders
Bipolar Mood Disorders
DIAGNOSIS CATEGORY
The profiles below summarize individuals who received clinical services from the Division of Behavioral Health psychiatric programs.Individuals are counted only once based on their first treatment episode of the fiscal year. Information that was not reported is listed asunknown. An asterisk (*) in a data cell indicates the count was fewer than five (5) and suppressed to avoid disclosing identifying information.
16
14
9
*
*
8
8
10
8
12
24
21
12
19
Southeast
13,401
14,100
RIPLEY COUNTY
48
72
14
5
10
9
*
141
0
*
6
25
54
59
18
9
10
22
*
35
70
0
13
38
6
13
*
*
5
8
37
42
67
26
15
10
31
*
34
*
0
*
6
6
6
11
13
23
#Name?
Page G-092
MENTAL ILLNESS TREATMENT SERVICES -- DIVISION OF BEHAVIORAL HEALTH
FY2018 FY2017
RACE / ETHNICITY
TREATMENT ACCOMMODATION
2019 Status Report on Missouri's Substance Use and Mental Health
*5
6
121 12912
13
16
20
15
*
0
0
145142NUMBER SERVED
PLANNING REGION
PSYCHIATRIC SERVICE AREA
2018 POPULATION ESTIMATE
CENSUS 2010
FY2019 FY2018 FY2017
Individuals who received psychiatric services had the following types ofdisorders. The total number of diagnoses is larger than the numberserved because some individuals had more than one type of disorder.
137
*
0
0
*
51
68
13
5
*
0
5
143
*
0
80
*
9
34
6
15
0
0
0
31
51
65
13
9
13
27
*
30
*
*
*
7
109
*
105
8
*
15 28
7 *
FY2018 FY2017
54
88
Gender Unknown 00
000
0
99
66
165
19
15
16
11
13
0
*
FY2019
7
*
*
0
0
*
161
21
15
14
*
15
12
10
0
FY2019
6
46
5
*
104
0
0
*
149
10
7
8
*
14
*
44
8
0
93
*
0
164
5
17
68
65
Total Disorders Diagnosed 236270 243
Missouri Department of Mental Health, Division of Behavioral Health

Total Individuals Served
Housing Unknown
Other
Homeless
Independent Living
Dependent Living
HOUSING / LIVING ARRANGEMENT
Employment Status Unknown
Not in Labor Force
Unemployed
Employed
Referral Source Unknown
Other
Court / Criminal Justice
Health Care Provider
Mental Health Provider
School
Self / Family / Friend
Education Level Unknown
Bachelor or Advanced Degree
Associate Degree or Some College
High School Grad or G.E.D.
Less than High School Diploma
Commitment Type Unknown
Sexual Predatory
Criminal
Civil
Voluntary
TREATMENT REFERRAL SOURCE
EMPLOYMENT
EDUCATION
TYPE OF COMMITMENT
Age Unknown
55 to 59
50 to 54
60 and Over
30 to 34
25 to 29
18 to 24
14 to 17
10 to 13
6 to 9
Under 6
40 to 44
35 to 39
45 to 49
AGE
Hearing Impaired
Past or Current Military Service12
43
Race/Ethnicity Unknown
Other Race
Hispanic
Asian / Pacific Islander
Native American / Alaskan
African American
Caucasian
0
206
76
11
8
248
2,332
GENDERMale
Female 1,474
1,331
Diagnosis Unknown
Other Disorders
Sexual Disorders
Schizophrenia and Psychotic Disorders
Personality Disorders
Depressive Mood Disorders
Impulse Control and Conduct DisordersDevelopmental and Age Related Disorders
Trauma and Stress Related Disorders
Anxiety and Fear Disorders
Bipolar Mood Disorders
DIAGNOSIS CATEGORY
The profiles below summarize individuals who received clinical services from the Division of Behavioral Health psychiatric programs.Individuals are counted only once based on their first treatment episode of the fiscal year. Information that was not reported is listed asunknown. An asterisk (*) in a data cell indicates the count was fewer than five (5) and suppressed to avoid disclosing identifying information.
196
212
175
27
236
371
340
225
200
214
196
208
205
16
Eastern
399,182
360,485
SAINT CHARLES COUNTY
882
478
363
97
290
278
35
2,682
*
12
11
855
764
1,208
668
174
203
367
*
466
632
322
51
186
10
1,511
35
192
516
368
773
616
1,158
595
150
152
335
*
488
23
21
258
404
333
235
188
175
195
#Name?
Page G-093
MENTAL ILLNESS TREATMENT SERVICES -- DIVISION OF BEHAVIORAL HEALTH
FY2018 FY2017
RACE / ETHNICITY
TREATMENT ACCOMMODATION
2019 Status Report on Missouri's Substance Use and Mental Health
1066
981
2,034 1,725189
164
181
191
203
27
*
40
2,8052,737NUMBER SERVED
PLANNING REGION
PSYCHIATRIC SERVICE AREA
2018 POPULATION ESTIMATE
CENSUS 2010
FY2019 FY2018 FY2017
Individuals who received psychiatric services had the following types ofdisorders. The total number of diagnoses is larger than the numberserved because some individuals had more than one type of disorder.
2,232
223
7
12
77
1,094
578
380
104
250
0
581
2,783
6
16
466
201
76
235
21
1,805
*
*
0
830
699
1,186
707
185
189
345
*
501
36
46
137
219
1,233
54
1,396
188
51
981 965
252 205
FY2018 FY2017
1,319
1,418
Gender Unknown 00
000
0
1,460
1,385
2,845
209
180
164
170
192
0
284
FY2019
16
31
101
6
5
262
2,288
222
189
197
272
320
429
270
31
FY2019
246
1,050
71
288
1,192
41
*
32
2,183
490
332
187
143
1,496
9
179
49
338
746
13
*
2,788
109
402
1,160
684
Total Disorders Diagnosed 4,7524,358 4,726
Missouri Department of Mental Health, Division of Behavioral Health

Total Individuals Served
Housing Unknown
Other
Homeless
Independent Living
Dependent Living
HOUSING / LIVING ARRANGEMENT
Employment Status Unknown
Not in Labor Force
Unemployed
Employed
Referral Source Unknown
Other
Court / Criminal Justice
Health Care Provider
Mental Health Provider
School
Self / Family / Friend
Education Level Unknown
Bachelor or Advanced Degree
Associate Degree or Some College
High School Grad or G.E.D.
Less than High School Diploma
Commitment Type Unknown
Sexual Predatory
Criminal
Civil
Voluntary
TREATMENT REFERRAL SOURCE
EMPLOYMENT
EDUCATION
TYPE OF COMMITMENT
Age Unknown
55 to 59
50 to 54
60 and Over
30 to 34
25 to 29
18 to 24
14 to 17
10 to 13
6 to 9
Under 6
40 to 44
35 to 39
45 to 49
AGE
Hearing Impaired
Past or Current Military Service*
*
Race/Ethnicity Unknown
Other Race
Hispanic
Asian / Pacific Islander
Native American / Alaskan
African American
Caucasian
0
5
*
0
0
0
100
GENDERMale
Female 61
44
Diagnosis Unknown
Other Disorders
Sexual Disorders
Schizophrenia and Psychotic Disorders
Personality Disorders
Depressive Mood Disorders
Impulse Control and Conduct DisordersDevelopmental and Age Related Disorders
Trauma and Stress Related Disorders
Anxiety and Fear Disorders
Bipolar Mood Disorders
DIAGNOSIS CATEGORY
The profiles below summarize individuals who received clinical services from the Division of Behavioral Health psychiatric programs.Individuals are counted only once based on their first treatment episode of the fiscal year. Information that was not reported is listed asunknown. An asterisk (*) in a data cell indicates the count was fewer than five (5) and suppressed to avoid disclosing identifying information.
15
6
11
0
*
9
10
5
7
8
5
12
14
8B
Southwest
9,395
9,805
SAINT CLAIR COUNTY
50
26
17
*
*
14
*
107
0
*
*
27
26
50
7
9
*
12
0
26
58
0
11
22
*
15
*
*
7
15
33
21
76
14
13
*
15
0
30
*
*
5
9
10
7
*
7
7
#Name?
Page G-094
MENTAL ILLNESS TREATMENT SERVICES -- DIVISION OF BEHAVIORAL HEALTH
FY2018 FY2017
RACE / ETHNICITY
TREATMENT ACCOMMODATION
2019 Status Report on Missouri's Substance Use and Mental Health
**
11
90 8010
8
14
11
16
*
0
*
105110NUMBER SERVED
PLANNING REGION
PSYCHIATRIC SERVICE AREA
2018 POPULATION ESTIMATE
CENSUS 2010
FY2019 FY2018 FY2017
Individuals who received psychiatric services had the following types ofdisorders. The total number of diagnoses is larger than the numberserved because some individuals had more than one type of disorder.
103
0
0
0
*
47
33
12
*
6
0
14
105
0
0
50
0
8
22
*
22
0
0
0
29
21
53
9
11
*
12
0
27
*
*
*
9
67
*
56
19
*
28 24
5 *
FY2018 FY2017
51
59
Gender Unknown 00
000
0
83
64
147
15
12
17
6
11
0
9
FY2019
*
6
5
0
*
*
134
13
11
*
16
19
15
6
*
FY2019
15
40
*
18
70
*
0
0
113
23
23
*
7
29
*
20
8
0
88
0
0
145
5
12
56
51
Total Disorders Diagnosed 163211 168
Missouri Department of Mental Health, Division of Behavioral Health
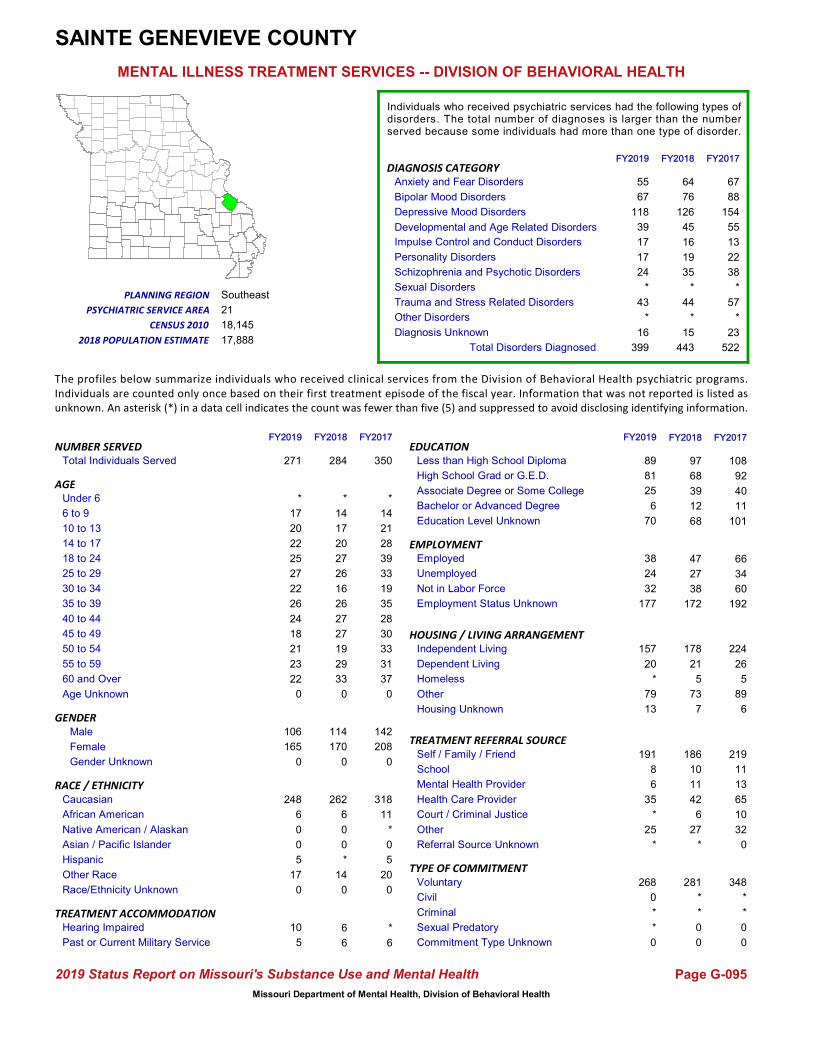
Total Individuals Served
Housing Unknown
Other
Homeless
Independent Living
Dependent Living
HOUSING / LIVING ARRANGEMENT
Employment Status Unknown
Not in Labor Force
Unemployed
Employed
Referral Source Unknown
Other
Court / Criminal Justice
Health Care Provider
Mental Health Provider
School
Self / Family / Friend
Education Level Unknown
Bachelor or Advanced Degree
Associate Degree or Some College
High School Grad or G.E.D.
Less than High School Diploma
Commitment Type Unknown
Sexual Predatory
Criminal
Civil
Voluntary
TREATMENT REFERRAL SOURCE
EMPLOYMENT
EDUCATION
TYPE OF COMMITMENT
Age Unknown
55 to 59
50 to 54
60 and Over
30 to 34
25 to 29
18 to 24
14 to 17
10 to 13
6 to 9
Under 6
40 to 44
35 to 39
45 to 49
AGE
Hearing Impaired
Past or Current Military Service*
6
Race/Ethnicity Unknown
Other Race
Hispanic
Asian / Pacific Islander
Native American / Alaskan
African American
Caucasian
0
20
5
0
*
11
318
GENDERMale
Female 208
142
Diagnosis Unknown
Other Disorders
Sexual Disorders
Schizophrenia and Psychotic Disorders
Personality Disorders
Depressive Mood Disorders
Impulse Control and Conduct DisordersDevelopmental and Age Related Disorders
Trauma and Stress Related Disorders
Anxiety and Fear Disorders
Bipolar Mood Disorders
DIAGNOSIS CATEGORY
The profiles below summarize individuals who received clinical services from the Division of Behavioral Health psychiatric programs.Individuals are counted only once based on their first treatment episode of the fiscal year. Information that was not reported is listed asunknown. An asterisk (*) in a data cell indicates the count was fewer than five (5) and suppressed to avoid disclosing identifying information.
30
35
28
*
14
21
28
39
33
19
37
33
31
21
Southeast
17,888
18,145
SAINTE GENEVIEVE COUNTY
108
92
40
11
27
38
6
281
*
*
6
67
88
154
55
13
22
38
*
57
186
10
11
42
6
27
*
66
34
60
55
67
118
39
17
17
24
*
43
*
*
14
17
20
27
26
16
33
#Name?
Page G-095
MENTAL ILLNESS TREATMENT SERVICES -- DIVISION OF BEHAVIORAL HEALTH
FY2018 FY2017
RACE / ETHNICITY
TREATMENT ACCOMMODATION
2019 Status Report on Missouri's Substance Use and Mental Health
2316
101
172 19226
27
27
19
29
*
0
0
350284NUMBER SERVED
PLANNING REGION
PSYCHIATRIC SERVICE AREA
2018 POPULATION ESTIMATE
CENSUS 2010
FY2019 FY2018 FY2017
Individuals who received psychiatric services had the following types ofdisorders. The total number of diagnoses is larger than the numberserved because some individuals had more than one type of disorder.
262
6
0
0
*
97
68
39
12
14
0
68
348
*
*
219
11
13
65
10
32
0
0
0
64
76
126
45
16
19
35
*
44
*
15
47
21
178
5
224
26
5
73 89
7 6
FY2018 FY2017
114
170
Gender Unknown 00
000
0
165
106
271
23
21
18
24
26
0
17
FY2019
10
5
5
0
0
6
248
22
22
27
25
22
20
17
*
FY2019
13
79
*
20
157
0
*
*
177
70
32
24
38
25
*
35
6
8
191
*
0
268
6
25
89
81
Total Disorders Diagnosed 522399 443
Missouri Department of Mental Health, Division of Behavioral Health
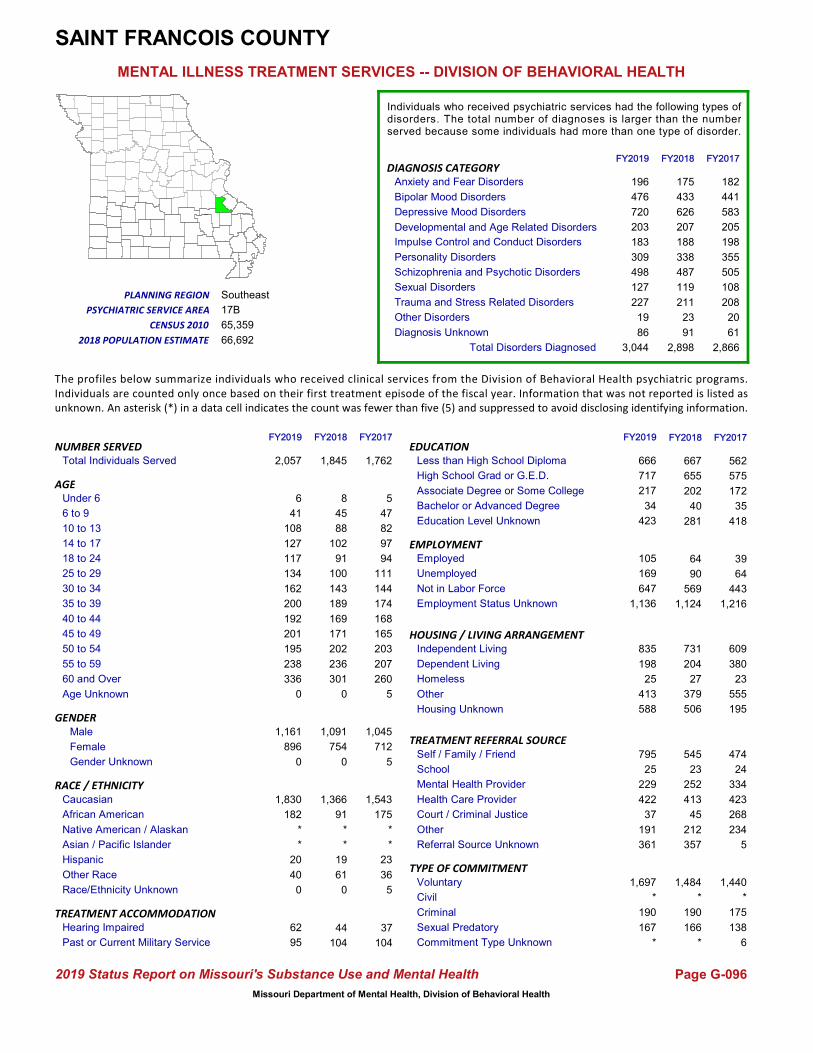
Total Individuals Served
Housing Unknown
Other
Homeless
Independent Living
Dependent Living
HOUSING / LIVING ARRANGEMENT
Employment Status Unknown
Not in Labor Force
Unemployed
Employed
Referral Source Unknown
Other
Court / Criminal Justice
Health Care Provider
Mental Health Provider
School
Self / Family / Friend
Education Level Unknown
Bachelor or Advanced Degree
Associate Degree or Some College
High School Grad or G.E.D.
Less than High School Diploma
Commitment Type Unknown
Sexual Predatory
Criminal
Civil
Voluntary
TREATMENT REFERRAL SOURCE
EMPLOYMENT
EDUCATION
TYPE OF COMMITMENT
Age Unknown
55 to 59
50 to 54
60 and Over
30 to 34
25 to 29
18 to 24
14 to 17
10 to 13
6 to 9
Under 6
40 to 44
35 to 39
45 to 49
AGE
Hearing Impaired
Past or Current Military Service37
104
Race/Ethnicity Unknown
Other Race
Hispanic
Asian / Pacific Islander
Native American / Alaskan
African American
Caucasian
5
36
23
*
*
175
1,543
GENDERMale
Female 712
1,045
Diagnosis Unknown
Other Disorders
Sexual Disorders
Schizophrenia and Psychotic Disorders
Personality Disorders
Depressive Mood Disorders
Impulse Control and Conduct DisordersDevelopmental and Age Related Disorders
Trauma and Stress Related Disorders
Anxiety and Fear Disorders
Bipolar Mood Disorders
DIAGNOSIS CATEGORY
The profiles below summarize individuals who received clinical services from the Division of Behavioral Health psychiatric programs.Individuals are counted only once based on their first treatment episode of the fiscal year. Information that was not reported is listed asunknown. An asterisk (*) in a data cell indicates the count was fewer than five (5) and suppressed to avoid disclosing identifying information.
165
174
168
5
47
82
97
94
111
144
260
203
207
17B
Southeast
66,692
65,359
SAINT FRANCOIS COUNTY
562
575
172
35
90
569
104
1,484
*
190
44
182
441
583
205
198
355
505
108
208
545
23
252
413
45
212
20
39
64
443
196
476
720
203
183
309
498
127
227
19
8
45
88
102
91
100
143
301
#Name?
Page G-096
MENTAL ILLNESS TREATMENT SERVICES -- DIVISION OF BEHAVIORAL HEALTH
FY2018 FY2017
RACE / ETHNICITY
TREATMENT ACCOMMODATION
2019 Status Report on Missouri's Substance Use and Mental Health
6186
418
1,124 1,216189
169
171
202
236
357
166
*
1,7621,845NUMBER SERVED
PLANNING REGION
PSYCHIATRIC SERVICE AREA
2018 POPULATION ESTIMATE
CENSUS 2010
FY2019 FY2018 FY2017
Individuals who received psychiatric services had the following types ofdisorders. The total number of diagnoses is larger than the numberserved because some individuals had more than one type of disorder.
1,366
91
*
*
19
667
655
202
40
61
0
281
1,440
*
175
474
24
334
423
268
234
5
138
6
175
433
626
207
188
338
487
119
211
23
91
64
204
731
27
609
380
23
379 555
506 195
FY2018 FY2017
1,091
754
Gender Unknown 50
500
0
896
1,161
2,057
238
195
201
192
200
0
40
FY2019
62
95
20
*
*
182
1,830
336
162
134
117
127
108
41
6
FY2019
588
413
25
198
835
*
167
361
1,136
423
647
169
105
191
37
422
229
25
795
190
*
1,697
34
217
666
717
Total Disorders Diagnosed 2,8663,044 2,898
Missouri Department of Mental Health, Division of Behavioral Health

Total Individuals Served
Housing Unknown
Other
Homeless
Independent Living
Dependent Living
HOUSING / LIVING ARRANGEMENT
Employment Status Unknown
Not in Labor Force
Unemployed
Employed
Referral Source Unknown
Other
Court / Criminal Justice
Health Care Provider
Mental Health Provider
School
Self / Family / Friend
Education Level Unknown
Bachelor or Advanced Degree
Associate Degree or Some College
High School Grad or G.E.D.
Less than High School Diploma
Commitment Type Unknown
Sexual Predatory
Criminal
Civil
Voluntary
TREATMENT REFERRAL SOURCE
EMPLOYMENT
EDUCATION
TYPE OF COMMITMENT
Age Unknown
55 to 59
50 to 54
60 and Over
30 to 34
25 to 29
18 to 24
14 to 17
10 to 13
6 to 9
Under 6
40 to 44
35 to 39
45 to 49
AGE
Hearing Impaired
Past or Current Military Service65
97
Race/Ethnicity Unknown
Other Race
Hispanic
Asian / Pacific Islander
Native American / Alaskan
African American
Caucasian
0
321
71
31
5
2,674
2,252
GENDERMale
Female 2,677
2,606
Diagnosis Unknown
Other Disorders
Sexual Disorders
Schizophrenia and Psychotic Disorders
Personality Disorders
Depressive Mood Disorders
Impulse Control and Conduct DisordersDevelopmental and Age Related Disorders
Trauma and Stress Related Disorders
Anxiety and Fear Disorders
Bipolar Mood Disorders
DIAGNOSIS CATEGORY
The profiles below summarize individuals who received clinical services from the Division of Behavioral Health psychiatric programs.Individuals are counted only once based on their first treatment episode of the fiscal year. Information that was not reported is listed asunknown. An asterisk (*) in a data cell indicates the count was fewer than five (5) and suppressed to avoid disclosing identifying information.
446
445
388
26
202
346
424
452
402
438
613
594
507
23
Eastern
996,945
998,954
SAINT LOUIS COUNTY
1,835
1,513
980
310
130
1,142
88
5,823
*
56
88
505
1,520
1,988
816
266
621
1,697
10
619
1,584
123
1,246
1,174
179
1,503
57
150
149
669
640
1,583
2,636
957
330
590
1,745
12
710
51
24
253
401
477
570
483
489
687
#Name?
Page G-097
MENTAL ILLNESS TREATMENT SERVICES -- DIVISION OF BEHAVIORAL HEALTH
FY2018 FY2017
RACE / ETHNICITY
TREATMENT ACCOMMODATION
2019 Status Report on Missouri's Substance Use and Mental Health
116249
642
4,361 4,312467
435
461
596
557
91
6
14
5,2835,900NUMBER SERVED
PLANNING REGION
PSYCHIATRIC SERVICE AREA
2018 POPULATION ESTIMATE
CENSUS 2010
FY2019 FY2018 FY2017
Individuals who received psychiatric services had the following types ofdisorders. The total number of diagnoses is larger than the numberserved because some individuals had more than one type of disorder.
2,409
2,973
5
44
103
1,889
1,535
1,016
307
414
0
1,155
5,197
10
65
1,250
89
809
1,104
219
1,812
*
5
7
562
1,571
2,333
922
320
591
1,684
10
666
57
169
267
1,228
2,962
145
2,393
1,388
129
1,380 1273
185 100
FY2018 FY2017
2,953
2,947
Gender Unknown 00
000
0
3,286
3,331
6,617
614
582
496
484
570
0
448
FY2019
117
92
123
48
*
3,387
2,731
734
559
543
675
565
434
321
40
FY2019
271
1,608
184
1,220
3,333
12
6
88
4,479
1,864
1433
333
372
1,404
144
1,204
1,261
116
2,400
61
*
6,536
317
1,020
1,799
1,617
Total Disorders Diagnosed 8,2159,503 8,885
Missouri Department of Mental Health, Division of Behavioral Health

Total Individuals Served
Housing Unknown
Other
Homeless
Independent Living
Dependent Living
HOUSING / LIVING ARRANGEMENT
Employment Status Unknown
Not in Labor Force
Unemployed
Employed
Referral Source Unknown
Other
Court / Criminal Justice
Health Care Provider
Mental Health Provider
School
Self / Family / Friend
Education Level Unknown
Bachelor or Advanced Degree
Associate Degree or Some College
High School Grad or G.E.D.
Less than High School Diploma
Commitment Type Unknown
Sexual Predatory
Criminal
Civil
Voluntary
TREATMENT REFERRAL SOURCE
EMPLOYMENT
EDUCATION
TYPE OF COMMITMENT
Age Unknown
55 to 59
50 to 54
60 and Over
30 to 34
25 to 29
18 to 24
14 to 17
10 to 13
6 to 9
Under 6
40 to 44
35 to 39
45 to 49
AGE
Hearing Impaired
Past or Current Military Service*
*
Race/Ethnicity Unknown
Other Race
Hispanic
Asian / Pacific Islander
Native American / Alaskan
African American
Caucasian
0
15
5
0
0
20
170
GENDERMale
Female 118
87
Diagnosis Unknown
Other Disorders
Sexual Disorders
Schizophrenia and Psychotic Disorders
Personality Disorders
Depressive Mood Disorders
Impulse Control and Conduct DisordersDevelopmental and Age Related Disorders
Trauma and Stress Related Disorders
Anxiety and Fear Disorders
Bipolar Mood Disorders
DIAGNOSIS CATEGORY
The profiles below summarize individuals who received clinical services from the Division of Behavioral Health psychiatric programs.Individuals are counted only once based on their first treatment episode of the fiscal year. Information that was not reported is listed asunknown. An asterisk (*) in a data cell indicates the count was fewer than five (5) and suppressed to avoid disclosing identifying information.
15
18
15
*
*
27
18
9
14
21
13
27
23
12
Central
22,895
23,370
SALINE COUNTY
79
78
29
*
5
20
5
249
*
*
6
57
48
80
41
26
20
44
*
65
140
9
13
66
10
10
5
*
9
19
80
62
104
68
44
21
49
*
98
5
*
17
35
29
15
17
16
17
#Name?
Page G-098
MENTAL ILLNESS TREATMENT SERVICES -- DIVISION OF BEHAVIORAL HEALTH
FY2018 FY2017
RACE / ETHNICITY
TREATMENT ACCOMMODATION
2019 Status Report on Missouri's Substance Use and Mental Health
*15
14
221 17119
18
24
28
17
7
*
0
205255NUMBER SERVED
PLANNING REGION
PSYCHIATRIC SERVICE AREA
2018 POPULATION ESTIMATE
CENSUS 2010
FY2019 FY2018 FY2017
Individuals who received psychiatric services had the following types ofdisorders. The total number of diagnoses is larger than the numberserved because some individuals had more than one type of disorder.
210
16
0
0
12
119
86
26
6
22
0
18
200
0
*
112
*
19
50
12
10
0
*
0
73
54
100
63
40
17
48
*
85
9
5
9
32
107
*
101
24
*
94 75
19 5
FY2018 FY2017
103
152
Gender Unknown 00
000
0
165
135
300
21
29
30
19
21
0
28
FY2019
6
5
14
0
*
23
248
18
15
13
21
43
38
28
*
FY2019
14
134
7
32
113
0
*
5
259
37
25
12
*
25
12
64
10
27
157
*
0
295
8
27
135
93
Total Disorders Diagnosed 391548 495
Missouri Department of Mental Health, Division of Behavioral Health

Total Individuals Served
Housing Unknown
Other
Homeless
Independent Living
Dependent Living
HOUSING / LIVING ARRANGEMENT
Employment Status Unknown
Not in Labor Force
Unemployed
Employed
Referral Source Unknown
Other
Court / Criminal Justice
Health Care Provider
Mental Health Provider
School
Self / Family / Friend
Education Level Unknown
Bachelor or Advanced Degree
Associate Degree or Some College
High School Grad or G.E.D.
Less than High School Diploma
Commitment Type Unknown
Sexual Predatory
Criminal
Civil
Voluntary
TREATMENT REFERRAL SOURCE
EMPLOYMENT
EDUCATION
TYPE OF COMMITMENT
Age Unknown
55 to 59
50 to 54
60 and Over
30 to 34
25 to 29
18 to 24
14 to 17
10 to 13
6 to 9
Under 6
40 to 44
35 to 39
45 to 49
AGE
Hearing Impaired
Past or Current Military Service0
*
Race/Ethnicity Unknown
Other Race
Hispanic
Asian / Pacific Islander
Native American / Alaskan
African American
Caucasian
0
0
0
0
0
0
30
GENDERMale
Female 13
17
Diagnosis Unknown
Other Disorders
Sexual Disorders
Schizophrenia and Psychotic Disorders
Personality Disorders
Depressive Mood Disorders
Impulse Control and Conduct DisordersDevelopmental and Age Related Disorders
Trauma and Stress Related Disorders
Anxiety and Fear Disorders
Bipolar Mood Disorders
DIAGNOSIS CATEGORY
The profiles below summarize individuals who received clinical services from the Division of Behavioral Health psychiatric programs.Individuals are counted only once based on their first treatment episode of the fiscal year. Information that was not reported is listed asunknown. An asterisk (*) in a data cell indicates the count was fewer than five (5) and suppressed to avoid disclosing identifying information.
*
*
*
*
6
*
*
*
*
*
*
*
*
14
Central
4,599
4,431
SCHUYLER COUNTY
13
11
*
0
*
*
*
38
0
0
0
*
6
11
*
5
0
*
0
5
9
0
*
9
*
18
0
*
*
*
6
*
11
5
7
0
*
0
*
0
*
*
6
*
*
*
*
*
#Name?
Page G-099
MENTAL ILLNESS TREATMENT SERVICES -- DIVISION OF BEHAVIORAL HEALTH
FY2018 FY2017
RACE / ETHNICITY
TREATMENT ACCOMMODATION
2019 Status Report on Missouri's Substance Use and Mental Health
00
*
34 27*
*
7
*
*
0
0
0
3038NUMBER SERVED
PLANNING REGION
PSYCHIATRIC SERVICE AREA
2018 POPULATION ESTIMATE
CENSUS 2010
FY2019 FY2018 FY2017
Individuals who received psychiatric services had the following types ofdisorders. The total number of diagnoses is larger than the numberserved because some individuals had more than one type of disorder.
37
*
0
0
0
19
11
6
0
0
0
*
30
0
0
5
0
*
8
*
14
0
0
0
5
5
13
7
7
0
*
0
7
0
0
0
*
17
0
17
*
0
14 9
* *
FY2018 FY2017
23
15
Gender Unknown 00
000
0
10
24
34
*
*
*
0
*
0
*
FY2019
0
*
0
0
0
*
32
*
*
*
*
*
12
5
0
FY2019
*
19
0
*
10
0
0
0
30
*
*
*
0
21
0
7
*
0
5
0
0
34
0
*
24
7
Total Disorders Diagnosed 3639 48
Missouri Department of Mental Health, Division of Behavioral Health

Total Individuals Served
Housing Unknown
Other
Homeless
Independent Living
Dependent Living
HOUSING / LIVING ARRANGEMENT
Employment Status Unknown
Not in Labor Force
Unemployed
Employed
Referral Source Unknown
Other
Court / Criminal Justice
Health Care Provider
Mental Health Provider
School
Self / Family / Friend
Education Level Unknown
Bachelor or Advanced Degree
Associate Degree or Some College
High School Grad or G.E.D.
Less than High School Diploma
Commitment Type Unknown
Sexual Predatory
Criminal
Civil
Voluntary
TREATMENT REFERRAL SOURCE
EMPLOYMENT
EDUCATION
TYPE OF COMMITMENT
Age Unknown
55 to 59
50 to 54
60 and Over
30 to 34
25 to 29
18 to 24
14 to 17
10 to 13
6 to 9
Under 6
40 to 44
35 to 39
45 to 49
AGE
Hearing Impaired
Past or Current Military Service0
0
Race/Ethnicity Unknown
Other Race
Hispanic
Asian / Pacific Islander
Native American / Alaskan
African American
Caucasian
0
0
0
0
0
0
34
GENDERMale
Female 22
12
Diagnosis Unknown
Other Disorders
Sexual Disorders
Schizophrenia and Psychotic Disorders
Personality Disorders
Depressive Mood Disorders
Impulse Control and Conduct DisordersDevelopmental and Age Related Disorders
Trauma and Stress Related Disorders
Anxiety and Fear Disorders
Bipolar Mood Disorders
DIAGNOSIS CATEGORY
The profiles below summarize individuals who received clinical services from the Division of Behavioral Health psychiatric programs.Individuals are counted only once based on their first treatment episode of the fiscal year. Information that was not reported is listed asunknown. An asterisk (*) in a data cell indicates the count was fewer than five (5) and suppressed to avoid disclosing identifying information.
*
*
0
*
*
7
6
5
*
5
0
*
*
14
Central
4,966
4,843
SCOTLAND COUNTY
20
11
*
0
0
*
*
42
0
0
0
8
7
12
10
*
0
*
0
6
5
0
0
5
0
32
0
*
*
*
7
7
14
10
*
0
*
*
10
0
*
*
9
6
5
*
6
0
#Name?
Page G-100
MENTAL ILLNESS TREATMENT SERVICES -- DIVISION OF BEHAVIORAL HEALTH
FY2018 FY2017
RACE / ETHNICITY
TREATMENT ACCOMMODATION
2019 Status Report on Missouri's Substance Use and Mental Health
00
0
40 31*
0
*
*
0
0
0
0
3442NUMBER SERVED
PLANNING REGION
PSYCHIATRIC SERVICE AREA
2018 POPULATION ESTIMATE
CENSUS 2010
FY2019 FY2018 FY2017
Individuals who received psychiatric services had the following types ofdisorders. The total number of diagnoses is larger than the numberserved because some individuals had more than one type of disorder.
42
0
0
0
0
24
12
*
0
0
0
*
34
0
0
*
0
*
*
0
25
0
0
0
7
8
12
11
*
0
*
0
8
0
0
*
0
18
0
16
0
0
22 18
* 0
FY2018 FY2017
17
25
Gender Unknown 00
000
0
26
18
44
*
*
*
0
*
0
0
FY2019
0
0
0
0
0
0
44
0
5
*
*
7
13
5
*
FY2019
*
23
0
0
19
0
0
0
40
*
*
0
*
32
0
6
0
0
6
0
0
44
0
*
28
12
Total Disorders Diagnosed 4856 53
Missouri Department of Mental Health, Division of Behavioral Health

Total Individuals Served
Housing Unknown
Other
Homeless
Independent Living
Dependent Living
HOUSING / LIVING ARRANGEMENT
Employment Status Unknown
Not in Labor Force
Unemployed
Employed
Referral Source Unknown
Other
Court / Criminal Justice
Health Care Provider
Mental Health Provider
School
Self / Family / Friend
Education Level Unknown
Bachelor or Advanced Degree
Associate Degree or Some College
High School Grad or G.E.D.
Less than High School Diploma
Commitment Type Unknown
Sexual Predatory
Criminal
Civil
Voluntary
TREATMENT REFERRAL SOURCE
EMPLOYMENT
EDUCATION
TYPE OF COMMITMENT
Age Unknown
55 to 59
50 to 54
60 and Over
30 to 34
25 to 29
18 to 24
14 to 17
10 to 13
6 to 9
Under 6
40 to 44
35 to 39
45 to 49
AGE
Hearing Impaired
Past or Current Military Service7
17
Race/Ethnicity Unknown
Other Race
Hispanic
Asian / Pacific Islander
Native American / Alaskan
African American
Caucasian
0
47
10
*
*
156
721
GENDERMale
Female 513
414
Diagnosis Unknown
Other Disorders
Sexual Disorders
Schizophrenia and Psychotic Disorders
Personality Disorders
Depressive Mood Disorders
Impulse Control and Conduct DisordersDevelopmental and Age Related Disorders
Trauma and Stress Related Disorders
Anxiety and Fear Disorders
Bipolar Mood Disorders
DIAGNOSIS CATEGORY
The profiles below summarize individuals who received clinical services from the Division of Behavioral Health psychiatric programs.Individuals are counted only once based on their first treatment episode of the fiscal year. Information that was not reported is listed asunknown. An asterisk (*) in a data cell indicates the count was fewer than five (5) and suppressed to avoid disclosing identifying information.
84
81
69
13
66
66
80
59
57
83
87
89
93
20
Southeast
38,458
39,191
SCOTT COUNTY
407
333
81
30
64
180
22
975
*
6
11
209
228
414
123
100
82
177
*
176
462
20
79
215
67
135
8
38
41
145
219
220
485
142
124
69
196
*
212
7
8
62
74
80
72
72
78
107
#Name?
Page G-101
MENTAL ILLNESS TREATMENT SERVICES -- DIVISION OF BEHAVIORAL HEALTH
FY2018 FY2017
RACE / ETHNICITY
TREATMENT ACCOMMODATION
2019 Status Report on Missouri's Substance Use and Mental Health
1918
75
710 70293
72
89
84
95
9
*
*
927986NUMBER SERVED
PLANNING REGION
PSYCHIATRIC SERVICE AREA
2018 POPULATION ESTIMATE
CENSUS 2010
FY2019 FY2018 FY2017
Individuals who received psychiatric services had the following types ofdisorders. The total number of diagnoses is larger than the numberserved because some individuals had more than one type of disorder.
761
162
0
*
12
441
351
105
25
56
0
64
921
*
*
406
15
89
191
68
158
0
*
0
208
221
435
119
105
75
182
*
178
6
24
33
117
575
15
542
97
17
254 255
26 16
FY2018 FY2017
442
544
Gender Unknown 00
000
0
587
493
1,080
98
82
91
82
109
0
56
FY2019
17
18
15
0
*
192
831
116
94
75
75
78
108
66
6
FY2019
20
284
23
103
651
*
*
7
897
39
98
55
30
148
99
238
70
37
482
5
*
1,070
27
105
468
441
Total Disorders Diagnosed 1,5371,693 1,554
Missouri Department of Mental Health, Division of Behavioral Health
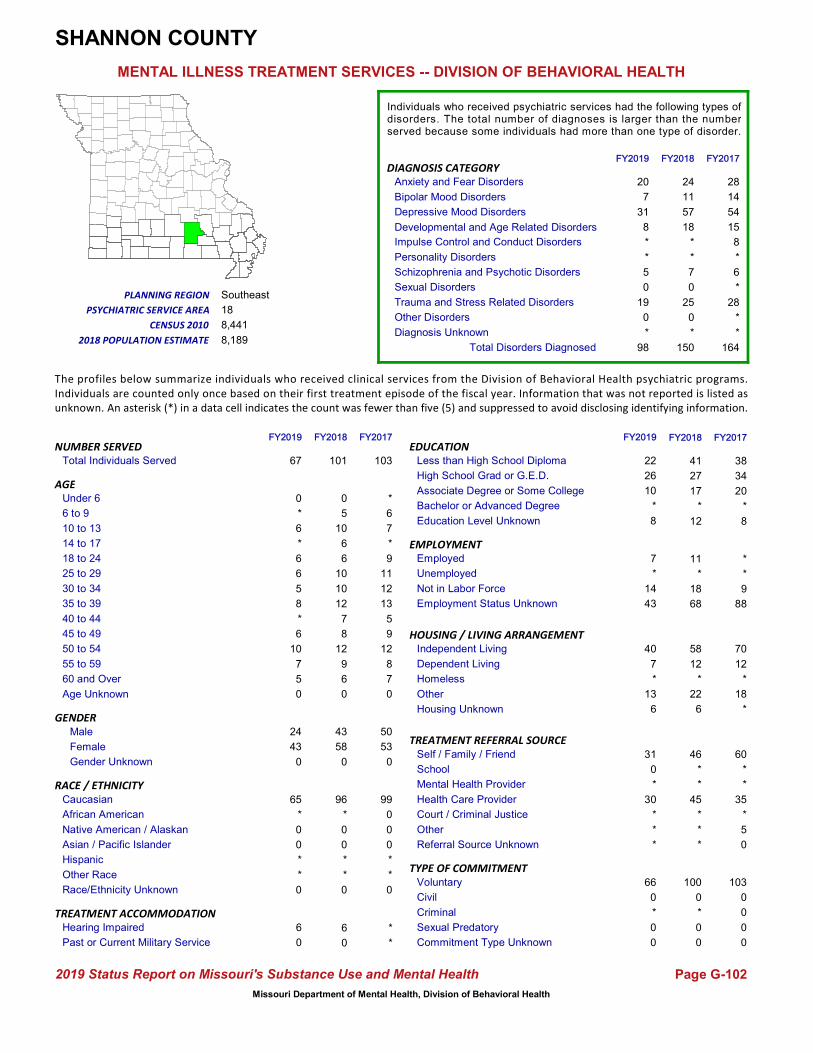
Total Individuals Served
Housing Unknown
Other
Homeless
Independent Living
Dependent Living
HOUSING / LIVING ARRANGEMENT
Employment Status Unknown
Not in Labor Force
Unemployed
Employed
Referral Source Unknown
Other
Court / Criminal Justice
Health Care Provider
Mental Health Provider
School
Self / Family / Friend
Education Level Unknown
Bachelor or Advanced Degree
Associate Degree or Some College
High School Grad or G.E.D.
Less than High School Diploma
Commitment Type Unknown
Sexual Predatory
Criminal
Civil
Voluntary
TREATMENT REFERRAL SOURCE
EMPLOYMENT
EDUCATION
TYPE OF COMMITMENT
Age Unknown
55 to 59
50 to 54
60 and Over
30 to 34
25 to 29
18 to 24
14 to 17
10 to 13
6 to 9
Under 6
40 to 44
35 to 39
45 to 49
AGE
Hearing Impaired
Past or Current Military Service*
*
Race/Ethnicity Unknown
Other Race
Hispanic
Asian / Pacific Islander
Native American / Alaskan
African American
Caucasian
0
*
*
0
0
0
99
GENDERMale
Female 53
50
Diagnosis Unknown
Other Disorders
Sexual Disorders
Schizophrenia and Psychotic Disorders
Personality Disorders
Depressive Mood Disorders
Impulse Control and Conduct DisordersDevelopmental and Age Related Disorders
Trauma and Stress Related Disorders
Anxiety and Fear Disorders
Bipolar Mood Disorders
DIAGNOSIS CATEGORY
The profiles below summarize individuals who received clinical services from the Division of Behavioral Health psychiatric programs.Individuals are counted only once based on their first treatment episode of the fiscal year. Information that was not reported is listed asunknown. An asterisk (*) in a data cell indicates the count was fewer than five (5) and suppressed to avoid disclosing identifying information.
9
13
5
*
6
7
*
9
11
12
7
12
8
18
Southeast
8,189
8,441
SHANNON COUNTY
38
34
20
*
*
18
0
100
0
*
6
28
14
54
15
8
*
6
*
28
46
*
*
45
*
*
*
*
*
9
20
7
31
8
*
*
5
0
19
0
0
5
10
6
6
10
10
6
#Name?
Page G-102
MENTAL ILLNESS TREATMENT SERVICES -- DIVISION OF BEHAVIORAL HEALTH
FY2018 FY2017
RACE / ETHNICITY
TREATMENT ACCOMMODATION
2019 Status Report on Missouri's Substance Use and Mental Health
**
8
68 8812
7
8
12
9
*
0
0
103101NUMBER SERVED
PLANNING REGION
PSYCHIATRIC SERVICE AREA
2018 POPULATION ESTIMATE
CENSUS 2010
FY2019 FY2018 FY2017
Individuals who received psychiatric services had the following types ofdisorders. The total number of diagnoses is larger than the numberserved because some individuals had more than one type of disorder.
96
*
0
0
*
41
27
17
*
*
0
12
103
0
0
60
*
*
35
*
5
0
0
0
24
11
57
18
*
*
7
0
25
0
*
11
12
58
*
70
12
*
22 18
6 *
FY2018 FY2017
43
58
Gender Unknown 00
000
0
43
24
67
7
10
6
*
8
0
*
FY2019
6
0
*
0
0
*
65
5
5
6
6
*
6
*
0
FY2019
6
13
*
7
40
0
0
*
43
8
14
*
7
*
*
30
*
0
31
*
0
66
*
10
22
26
Total Disorders Diagnosed 16498 150
Missouri Department of Mental Health, Division of Behavioral Health
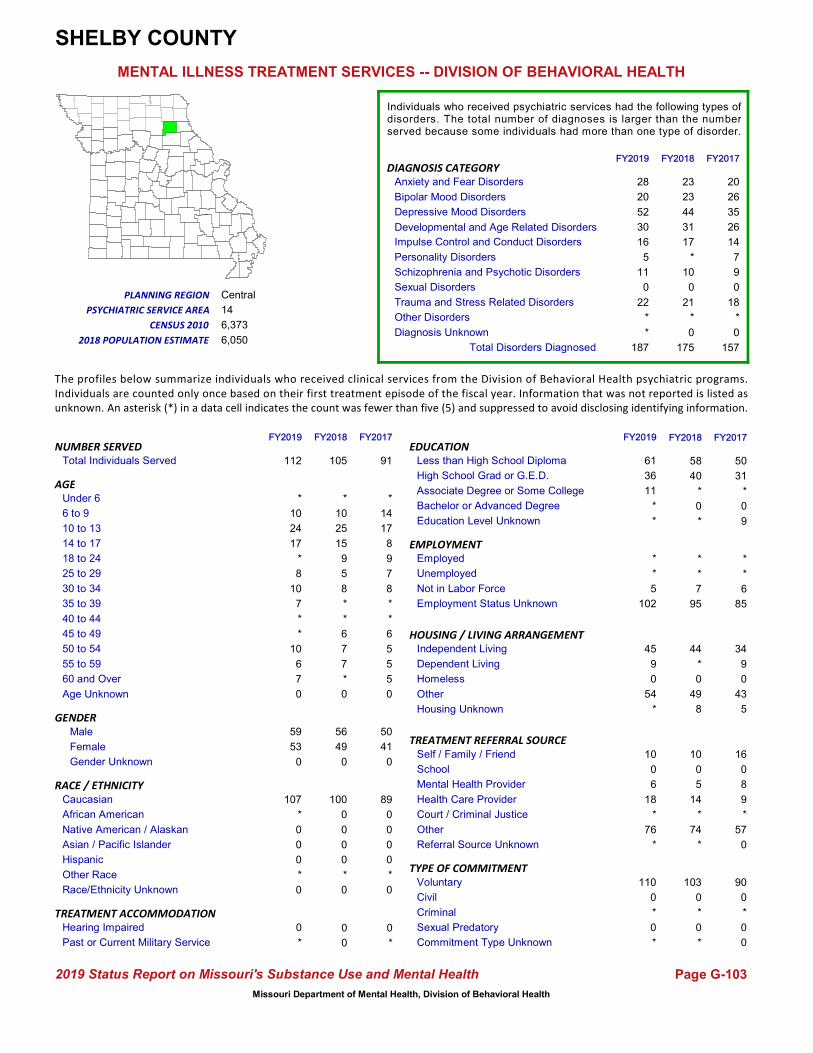
Total Individuals Served
Housing Unknown
Other
Homeless
Independent Living
Dependent Living
HOUSING / LIVING ARRANGEMENT
Employment Status Unknown
Not in Labor Force
Unemployed
Employed
Referral Source Unknown
Other
Court / Criminal Justice
Health Care Provider
Mental Health Provider
School
Self / Family / Friend
Education Level Unknown
Bachelor or Advanced Degree
Associate Degree or Some College
High School Grad or G.E.D.
Less than High School Diploma
Commitment Type Unknown
Sexual Predatory
Criminal
Civil
Voluntary
TREATMENT REFERRAL SOURCE
EMPLOYMENT
EDUCATION
TYPE OF COMMITMENT
Age Unknown
55 to 59
50 to 54
60 and Over
30 to 34
25 to 29
18 to 24
14 to 17
10 to 13
6 to 9
Under 6
40 to 44
35 to 39
45 to 49
AGE
Hearing Impaired
Past or Current Military Service0
*
Race/Ethnicity Unknown
Other Race
Hispanic
Asian / Pacific Islander
Native American / Alaskan
African American
Caucasian
0
*
0
0
0
0
89
GENDERMale
Female 41
50
Diagnosis Unknown
Other Disorders
Sexual Disorders
Schizophrenia and Psychotic Disorders
Personality Disorders
Depressive Mood Disorders
Impulse Control and Conduct DisordersDevelopmental and Age Related Disorders
Trauma and Stress Related Disorders
Anxiety and Fear Disorders
Bipolar Mood Disorders
DIAGNOSIS CATEGORY
The profiles below summarize individuals who received clinical services from the Division of Behavioral Health psychiatric programs.Individuals are counted only once based on their first treatment episode of the fiscal year. Information that was not reported is listed asunknown. An asterisk (*) in a data cell indicates the count was fewer than five (5) and suppressed to avoid disclosing identifying information.
6
*
*
*
14
17
8
9
7
8
5
5
5
14
Central
6,050
6,373
SHELBY COUNTY
50
31
*
0
*
7
0
103
0
*
0
20
26
35
26
14
7
9
0
18
10
0
5
14
*
74
*
*
*
6
28
20
52
30
16
5
11
0
22
*
*
10
25
15
9
5
8
*
#Name?
Page G-103
MENTAL ILLNESS TREATMENT SERVICES -- DIVISION OF BEHAVIORAL HEALTH
FY2018 FY2017
RACE / ETHNICITY
TREATMENT ACCOMMODATION
2019 Status Report on Missouri's Substance Use and Mental Health
0*
9
95 85*
*
6
7
7
*
0
*
91105NUMBER SERVED
PLANNING REGION
PSYCHIATRIC SERVICE AREA
2018 POPULATION ESTIMATE
CENSUS 2010
FY2019 FY2018 FY2017
Individuals who received psychiatric services had the following types ofdisorders. The total number of diagnoses is larger than the numberserved because some individuals had more than one type of disorder.
100
0
0
0
0
58
40
*
0
*
0
*
90
0
*
16
0
8
9
*
57
0
0
0
23
23
44
31
17
*
10
0
21
*
0
*
*
44
0
34
9
0
49 43
8 5
FY2018 FY2017
56
49
Gender Unknown 00
000
0
53
59
112
6
10
*
*
7
0
*
FY2019
0
*
0
0
0
*
107
7
10
8
*
17
24
10
*
FY2019
*
54
0
9
45
*
0
*
102
*
5
*
*
76
*
18
6
0
10
*
0
110
*
11
61
36
Total Disorders Diagnosed 157187 175
Missouri Department of Mental Health, Division of Behavioral Health
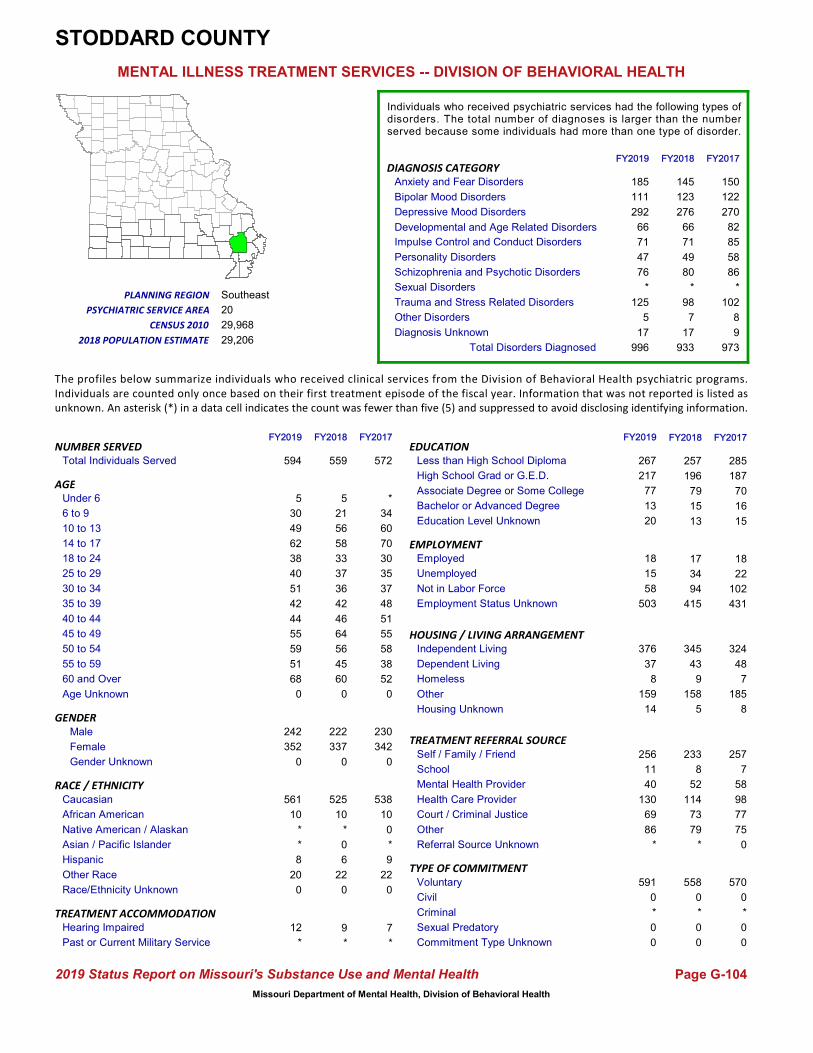
Total Individuals Served
Housing Unknown
Other
Homeless
Independent Living
Dependent Living
HOUSING / LIVING ARRANGEMENT
Employment Status Unknown
Not in Labor Force
Unemployed
Employed
Referral Source Unknown
Other
Court / Criminal Justice
Health Care Provider
Mental Health Provider
School
Self / Family / Friend
Education Level Unknown
Bachelor or Advanced Degree
Associate Degree or Some College
High School Grad or G.E.D.
Less than High School Diploma
Commitment Type Unknown
Sexual Predatory
Criminal
Civil
Voluntary
TREATMENT REFERRAL SOURCE
EMPLOYMENT
EDUCATION
TYPE OF COMMITMENT
Age Unknown
55 to 59
50 to 54
60 and Over
30 to 34
25 to 29
18 to 24
14 to 17
10 to 13
6 to 9
Under 6
40 to 44
35 to 39
45 to 49
AGE
Hearing Impaired
Past or Current Military Service7
*
Race/Ethnicity Unknown
Other Race
Hispanic
Asian / Pacific Islander
Native American / Alaskan
African American
Caucasian
0
22
9
*
0
10
538
GENDERMale
Female 342
230
Diagnosis Unknown
Other Disorders
Sexual Disorders
Schizophrenia and Psychotic Disorders
Personality Disorders
Depressive Mood Disorders
Impulse Control and Conduct DisordersDevelopmental and Age Related Disorders
Trauma and Stress Related Disorders
Anxiety and Fear Disorders
Bipolar Mood Disorders
DIAGNOSIS CATEGORY
The profiles below summarize individuals who received clinical services from the Division of Behavioral Health psychiatric programs.Individuals are counted only once based on their first treatment episode of the fiscal year. Information that was not reported is listed asunknown. An asterisk (*) in a data cell indicates the count was fewer than five (5) and suppressed to avoid disclosing identifying information.
55
48
51
*
34
60
70
30
35
37
52
58
38
20
Southeast
29,206
29,968
STODDARD COUNTY
285
187
70
16
34
94
*
558
0
*
9
150
122
270
82
85
58
86
*
102
233
8
52
114
73
79
8
18
22
102
185
111
292
66
71
47
76
*
125
5
5
21
56
58
33
37
36
60
#Name?
Page G-104
MENTAL ILLNESS TREATMENT SERVICES -- DIVISION OF BEHAVIORAL HEALTH
FY2018 FY2017
RACE / ETHNICITY
TREATMENT ACCOMMODATION
2019 Status Report on Missouri's Substance Use and Mental Health
917
15
415 43142
46
64
56
45
*
0
0
572559NUMBER SERVED
PLANNING REGION
PSYCHIATRIC SERVICE AREA
2018 POPULATION ESTIMATE
CENSUS 2010
FY2019 FY2018 FY2017
Individuals who received psychiatric services had the following types ofdisorders. The total number of diagnoses is larger than the numberserved because some individuals had more than one type of disorder.
525
10
*
0
6
257
196
79
15
22
0
13
570
0
*
257
7
58
98
77
75
0
0
0
145
123
276
66
71
49
80
*
98
7
17
17
43
345
9
324
48
7
158 185
5 8
FY2018 FY2017
222
337
Gender Unknown 00
000
0
352
242
594
51
59
55
44
42
0
20
FY2019
12
*
8
*
*
10
561
68
51
40
38
62
49
30
5
FY2019
14
159
8
37
376
0
0
*
503
20
58
15
18
86
69
130
40
11
256
*
0
591
13
77
267
217
Total Disorders Diagnosed 973996 933
Missouri Department of Mental Health, Division of Behavioral Health

Total Individuals Served
Housing Unknown
Other
Homeless
Independent Living
Dependent Living
HOUSING / LIVING ARRANGEMENT
Employment Status Unknown
Not in Labor Force
Unemployed
Employed
Referral Source Unknown
Other
Court / Criminal Justice
Health Care Provider
Mental Health Provider
School
Self / Family / Friend
Education Level Unknown
Bachelor or Advanced Degree
Associate Degree or Some College
High School Grad or G.E.D.
Less than High School Diploma
Commitment Type Unknown
Sexual Predatory
Criminal
Civil
Voluntary
TREATMENT REFERRAL SOURCE
EMPLOYMENT
EDUCATION
TYPE OF COMMITMENT
Age Unknown
55 to 59
50 to 54
60 and Over
30 to 34
25 to 29
18 to 24
14 to 17
10 to 13
6 to 9
Under 6
40 to 44
35 to 39
45 to 49
AGE
Hearing Impaired
Past or Current Military Service*
7
Race/Ethnicity Unknown
Other Race
Hispanic
Asian / Pacific Islander
Native American / Alaskan
African American
Caucasian
0
19
*
0
*
*
161
GENDERMale
Female 85
98
Diagnosis Unknown
Other Disorders
Sexual Disorders
Schizophrenia and Psychotic Disorders
Personality Disorders
Depressive Mood Disorders
Impulse Control and Conduct DisordersDevelopmental and Age Related Disorders
Trauma and Stress Related Disorders
Anxiety and Fear Disorders
Bipolar Mood Disorders
DIAGNOSIS CATEGORY
The profiles below summarize individuals who received clinical services from the Division of Behavioral Health psychiatric programs.Individuals are counted only once based on their first treatment episode of the fiscal year. Information that was not reported is listed asunknown. An asterisk (*) in a data cell indicates the count was fewer than five (5) and suppressed to avoid disclosing identifying information.
22
16
18
6
7
18
18
12
8
12
11
18
17
10
Southwest
31,749
32,202
STONE COUNTY
78
63
28
*
12
31
*
180
*
*
*
47
37
85
25
24
18
37
0
51
89
0
9
47
8
31
5
*
*
15
50
22
85
32
31
15
34
0
70
5
*
11
15
14
14
10
13
12
#Name?
Page G-105
MENTAL ILLNESS TREATMENT SERVICES -- DIVISION OF BEHAVIORAL HEALTH
FY2018 FY2017
RACE / ETHNICITY
TREATMENT ACCOMMODATION
2019 Status Report on Missouri's Substance Use and Mental Health
1123
11
137 16217
17
20
15
24
*
0
*
183186NUMBER SERVED
PLANNING REGION
PSYCHIATRIC SERVICE AREA
2018 POPULATION ESTIMATE
CENSUS 2010
FY2019 FY2018 FY2017
Individuals who received psychiatric services had the following types ofdisorders. The total number of diagnoses is larger than the numberserved because some individuals had more than one type of disorder.
165
*
0
0
*
66
68
29
*
18
0
22
182
0
*
85
*
13
50
6
28
0
0
0
45
36
83
28
25
19
35
0
55
*
10
6
17
82
6
87
14
*
56 73
25 7
FY2018 FY2017
91
95
Gender Unknown 00
000
0
104
121
225
16
19
19
10
11
0
23
FY2019
*
*
10
0
*
*
199
9
10
7
6
37
32
45
*
FY2019
33
115
7
15
55
*
0
*
168
43
39
12
6
25
9
47
8
61
72
*
0
219
*
19
118
42
Total Disorders Diagnosed 340367 340
Missouri Department of Mental Health, Division of Behavioral Health

Total Individuals Served
Housing Unknown
Other
Homeless
Independent Living
Dependent Living
HOUSING / LIVING ARRANGEMENT
Employment Status Unknown
Not in Labor Force
Unemployed
Employed
Referral Source Unknown
Other
Court / Criminal Justice
Health Care Provider
Mental Health Provider
School
Self / Family / Friend
Education Level Unknown
Bachelor or Advanced Degree
Associate Degree or Some College
High School Grad or G.E.D.
Less than High School Diploma
Commitment Type Unknown
Sexual Predatory
Criminal
Civil
Voluntary
TREATMENT REFERRAL SOURCE
EMPLOYMENT
EDUCATION
TYPE OF COMMITMENT
Age Unknown
55 to 59
50 to 54
60 and Over
30 to 34
25 to 29
18 to 24
14 to 17
10 to 13
6 to 9
Under 6
40 to 44
35 to 39
45 to 49
AGE
Hearing Impaired
Past or Current Military Service*
*
Race/Ethnicity Unknown
Other Race
Hispanic
Asian / Pacific Islander
Native American / Alaskan
African American
Caucasian
0
7
5
0
*
*
91
GENDERMale
Female 56
46
Diagnosis Unknown
Other Disorders
Sexual Disorders
Schizophrenia and Psychotic Disorders
Personality Disorders
Depressive Mood Disorders
Impulse Control and Conduct DisordersDevelopmental and Age Related Disorders
Trauma and Stress Related Disorders
Anxiety and Fear Disorders
Bipolar Mood Disorders
DIAGNOSIS CATEGORY
The profiles below summarize individuals who received clinical services from the Division of Behavioral Health psychiatric programs.Individuals are counted only once based on their first treatment episode of the fiscal year. Information that was not reported is listed asunknown. An asterisk (*) in a data cell indicates the count was fewer than five (5) and suppressed to avoid disclosing identifying information.
14
*
8
*
6
8
14
10
11
8
5
*
7
13
Northwest
6,221
6,714
SULLIVAN COUNTY
40
46
7
*
*
*
*
115
0
0
0
27
33
46
16
18
7
7
0
26
65
*
*
28
7
11
0
*
*
8
36
35
60
19
15
8
9
0
36
0
*
7
15
19
15
9
5
*
#Name?
Page G-106
MENTAL ILLNESS TREATMENT SERVICES -- DIVISION OF BEHAVIORAL HEALTH
FY2018 FY2017
RACE / ETHNICITY
TREATMENT ACCOMMODATION
2019 Status Report on Missouri's Substance Use and Mental Health
**
6
104 878
8
12
*
6
*
0
0
102116NUMBER SERVED
PLANNING REGION
PSYCHIATRIC SERVICE AREA
2018 POPULATION ESTIMATE
CENSUS 2010
FY2019 FY2018 FY2017
Individuals who received psychiatric services had the following types ofdisorders. The total number of diagnoses is larger than the numberserved because some individuals had more than one type of disorder.
108
*
*
0
7
53
46
12
*
6
0
*
102
0
0
52
*
5
23
9
11
*
0
0
30
34
53
19
20
9
7
0
37
0
*
6
10
47
0
49
10
*
53 38
5 *
FY2018 FY2017
59
57
Gender Unknown 00
000
0
67
50
117
7
7
9
9
11
0
7
FY2019
0
0
7
0
*
*
107
6
8
10
14
18
12
*
*
FY2019
6
41
0
12
58
0
0
0
107
*
*
*
*
14
6
35
*
*
57
*
0
116
*
12
54
46
Total Disorders Diagnosed 183221 212
Missouri Department of Mental Health, Division of Behavioral Health

Total Individuals Served
Housing Unknown
Other
Homeless
Independent Living
Dependent Living
HOUSING / LIVING ARRANGEMENT
Employment Status Unknown
Not in Labor Force
Unemployed
Employed
Referral Source Unknown
Other
Court / Criminal Justice
Health Care Provider
Mental Health Provider
School
Self / Family / Friend
Education Level Unknown
Bachelor or Advanced Degree
Associate Degree or Some College
High School Grad or G.E.D.
Less than High School Diploma
Commitment Type Unknown
Sexual Predatory
Criminal
Civil
Voluntary
TREATMENT REFERRAL SOURCE
EMPLOYMENT
EDUCATION
TYPE OF COMMITMENT
Age Unknown
55 to 59
50 to 54
60 and Over
30 to 34
25 to 29
18 to 24
14 to 17
10 to 13
6 to 9
Under 6
40 to 44
35 to 39
45 to 49
AGE
Hearing Impaired
Past or Current Military Service*
10
Race/Ethnicity Unknown
Other Race
Hispanic
Asian / Pacific Islander
Native American / Alaskan
African American
Caucasian
0
46
16
*
*
8
425
GENDERMale
Female 276
206
Diagnosis Unknown
Other Disorders
Sexual Disorders
Schizophrenia and Psychotic Disorders
Personality Disorders
Depressive Mood Disorders
Impulse Control and Conduct DisordersDevelopmental and Age Related Disorders
Trauma and Stress Related Disorders
Anxiety and Fear Disorders
Bipolar Mood Disorders
DIAGNOSIS CATEGORY
The profiles below summarize individuals who received clinical services from the Division of Behavioral Health psychiatric programs.Individuals are counted only once based on their first treatment episode of the fiscal year. Information that was not reported is listed asunknown. An asterisk (*) in a data cell indicates the count was fewer than five (5) and suppressed to avoid disclosing identifying information.
45
52
50
17
22
29
25
26
44
40
26
59
47
10
Southwest
55,852
51,675
TANEY COUNTY
178
176
86
17
32
82
9
447
*
*
8
144
115
213
70
53
48
72
0
152
236
*
15
101
34
63
8
25
27
43
177
108
256
144
101
32
68
0
267
10
12
30
24
18
21
37
50
29
#Name?
Page G-107
MENTAL ILLNESS TREATMENT SERVICES -- DIVISION OF BEHAVIORAL HEALTH
FY2018 FY2017
RACE / ETHNICITY
TREATMENT ACCOMMODATION
2019 Status Report on Missouri's Substance Use and Mental Health
2042
27
310 38947
45
43
50
47
*
0
*
482453NUMBER SERVED
PLANNING REGION
PSYCHIATRIC SERVICE AREA
2018 POPULATION ESTIMATE
CENSUS 2010
FY2019 FY2018 FY2017
Individuals who received psychiatric services had the following types ofdisorders. The total number of diagnoses is larger than the numberserved because some individuals had more than one type of disorder.
400
12
*
0
16
157
156
72
10
36
0
58
473
6
*
278
0
24
103
17
60
0
0
0
149
97
203
66
56
40
67
0
150
7
23
29
60
234
22
255
45
40
94 127
43 15
FY2018 FY2017
190
263
Gender Unknown 00
000
0
366
362
728
49
51
44
41
42
0
67
FY2019
17
6
32
0
*
17
640
31
42
37
25
79
117
137
33
FY2019
35
369
24
71
229
*
0
*
518
136
133
42
35
84
34
109
16
226
257
*
*
719
13
54
387
138
Total Disorders Diagnosed 8951,205 858
Missouri Department of Mental Health, Division of Behavioral Health

Total Individuals Served
Housing Unknown
Other
Homeless
Independent Living
Dependent Living
HOUSING / LIVING ARRANGEMENT
Employment Status Unknown
Not in Labor Force
Unemployed
Employed
Referral Source Unknown
Other
Court / Criminal Justice
Health Care Provider
Mental Health Provider
School
Self / Family / Friend
Education Level Unknown
Bachelor or Advanced Degree
Associate Degree or Some College
High School Grad or G.E.D.
Less than High School Diploma
Commitment Type Unknown
Sexual Predatory
Criminal
Civil
Voluntary
TREATMENT REFERRAL SOURCE
EMPLOYMENT
EDUCATION
TYPE OF COMMITMENT
Age Unknown
55 to 59
50 to 54
60 and Over
30 to 34
25 to 29
18 to 24
14 to 17
10 to 13
6 to 9
Under 6
40 to 44
35 to 39
45 to 49
AGE
Hearing Impaired
Past or Current Military Service*
10
Race/Ethnicity Unknown
Other Race
Hispanic
Asian / Pacific Islander
Native American / Alaskan
African American
Caucasian
0
5
5
0
0
*
232
GENDERMale
Female 115
123
Diagnosis Unknown
Other Disorders
Sexual Disorders
Schizophrenia and Psychotic Disorders
Personality Disorders
Depressive Mood Disorders
Impulse Control and Conduct DisordersDevelopmental and Age Related Disorders
Trauma and Stress Related Disorders
Anxiety and Fear Disorders
Bipolar Mood Disorders
DIAGNOSIS CATEGORY
The profiles below summarize individuals who received clinical services from the Division of Behavioral Health psychiatric programs.Individuals are counted only once based on their first treatment episode of the fiscal year. Information that was not reported is listed asunknown. An asterisk (*) in a data cell indicates the count was fewer than five (5) and suppressed to avoid disclosing identifying information.
19
19
24
*
18
23
13
19
19
34
15
19
14
18
Southeast
25,571
26,008
TEXAS COUNTY
98
78
37
9
10
29
6
252
0
*
*
65
43
105
35
11
17
16
0
80
122
0
*
123
*
*
*
6
9
24
58
36
84
36
13
9
13
0
74
0
*
21
19
23
16
23
35
15
#Name?
Page G-108
MENTAL ILLNESS TREATMENT SERVICES -- DIVISION OF BEHAVIORAL HEALTH
FY2018 FY2017
RACE / ETHNICITY
TREATMENT ACCOMMODATION
2019 Status Report on Missouri's Substance Use and Mental Health
*7
16
207 19927
17
15
24
17
*
0
0
238254NUMBER SERVED
PLANNING REGION
PSYCHIATRIC SERVICE AREA
2018 POPULATION ESTIMATE
CENSUS 2010
FY2019 FY2018 FY2017
Individuals who received psychiatric services had the following types ofdisorders. The total number of diagnoses is larger than the numberserved because some individuals had more than one type of disorder.
248
*
0
0
*
104
77
43
10
*
0
20
234
0
*
120
0
5
104
*
6
0
0
*
64
43
99
41
10
11
15
0
87
*
*
8
25
139
5
126
33
14
72 63
13 *
FY2018 FY2017
126
128
Gender Unknown 00
000
0
112
109
221
15
17
17
18
19
0
5
FY2019
*
*
*
0
0
*
214
19
29
19
11
21
22
12
*
FY2019
12
64
*
23
118
0
0
*
177
15
28
8
8
6
0
111
*
*
99
0
*
220
11
31
82
82
Total Disorders Diagnosed 377330 375
Missouri Department of Mental Health, Division of Behavioral Health

Total Individuals Served
Housing Unknown
Other
Homeless
Independent Living
Dependent Living
HOUSING / LIVING ARRANGEMENT
Employment Status Unknown
Not in Labor Force
Unemployed
Employed
Referral Source Unknown
Other
Court / Criminal Justice
Health Care Provider
Mental Health Provider
School
Self / Family / Friend
Education Level Unknown
Bachelor or Advanced Degree
Associate Degree or Some College
High School Grad or G.E.D.
Less than High School Diploma
Commitment Type Unknown
Sexual Predatory
Criminal
Civil
Voluntary
TREATMENT REFERRAL SOURCE
EMPLOYMENT
EDUCATION
TYPE OF COMMITMENT
Age Unknown
55 to 59
50 to 54
60 and Over
30 to 34
25 to 29
18 to 24
14 to 17
10 to 13
6 to 9
Under 6
40 to 44
35 to 39
45 to 49
AGE
Hearing Impaired
Past or Current Military Service*
13
Race/Ethnicity Unknown
Other Race
Hispanic
Asian / Pacific Islander
Native American / Alaskan
African American
Caucasian
0
18
7
*
*
*
394
GENDERMale
Female 225
191
Diagnosis Unknown
Other Disorders
Sexual Disorders
Schizophrenia and Psychotic Disorders
Personality Disorders
Depressive Mood Disorders
Impulse Control and Conduct DisordersDevelopmental and Age Related Disorders
Trauma and Stress Related Disorders
Anxiety and Fear Disorders
Bipolar Mood Disorders
DIAGNOSIS CATEGORY
The profiles below summarize individuals who received clinical services from the Division of Behavioral Health psychiatric programs.Individuals are counted only once based on their first treatment episode of the fiscal year. Information that was not reported is listed asunknown. An asterisk (*) in a data cell indicates the count was fewer than five (5) and suppressed to avoid disclosing identifying information.
33
52
35
*
15
20
19
46
30
52
27
48
38
8B
Southwest
20,528
21,159
VERNON COUNTY
175
137
83
10
14
67
14
426
*
*
8
105
103
217
29
22
24
66
*
101
317
0
28
65
8
12
*
14
15
50
117
94
262
40
33
19
68
*
96
5
*
17
20
23
44
38
39
32
#Name?
Page G-109
MENTAL ILLNESS TREATMENT SERVICES -- DIVISION OF BEHAVIORAL HEALTH
FY2018 FY2017
RACE / ETHNICITY
TREATMENT ACCOMMODATION
2019 Status Report on Missouri's Substance Use and Mental Health
1026
12
339 33856
37
33
44
48
5
*
*
416435NUMBER SERVED
PLANNING REGION
PSYCHIATRIC SERVICE AREA
2018 POPULATION ESTIMATE
CENSUS 2010
FY2019 FY2018 FY2017
Individuals who received psychiatric services had the following types ofdisorders. The total number of diagnoses is larger than the numberserved because some individuals had more than one type of disorder.
413
*
*
0
6
192
131
76
10
15
0
26
406
*
*
310
0
17
61
15
13
0
*
0
112
108
225
35
28
23
74
*
100
*
16
15
63
238
17
251
48
24
89 84
28 9
FY2018 FY2017
200
235
Gender Unknown 00
000
0
261
233
494
55
42
39
46
53
0
19
FY2019
10
14
7
0
*
*
470
37
51
39
40
32
36
23
*
FY2019
43
114
20
69
247
*
7
8
349
45
96
31
18
45
6
67
24
*
342
*
*
483
11
76
204
158
Total Disorders Diagnosed 683764 729
Missouri Department of Mental Health, Division of Behavioral Health

Total Individuals Served
Housing Unknown
Other
Homeless
Independent Living
Dependent Living
HOUSING / LIVING ARRANGEMENT
Employment Status Unknown
Not in Labor Force
Unemployed
Employed
Referral Source Unknown
Other
Court / Criminal Justice
Health Care Provider
Mental Health Provider
School
Self / Family / Friend
Education Level Unknown
Bachelor or Advanced Degree
Associate Degree or Some College
High School Grad or G.E.D.
Less than High School Diploma
Commitment Type Unknown
Sexual Predatory
Criminal
Civil
Voluntary
TREATMENT REFERRAL SOURCE
EMPLOYMENT
EDUCATION
TYPE OF COMMITMENT
Age Unknown
55 to 59
50 to 54
60 and Over
30 to 34
25 to 29
18 to 24
14 to 17
10 to 13
6 to 9
Under 6
40 to 44
35 to 39
45 to 49
AGE
Hearing Impaired
Past or Current Military Service5
14
Race/Ethnicity Unknown
Other Race
Hispanic
Asian / Pacific Islander
Native American / Alaskan
African American
Caucasian
0
27
14
*
*
32
595
GENDERMale
Female 369
288
Diagnosis Unknown
Other Disorders
Sexual Disorders
Schizophrenia and Psychotic Disorders
Personality Disorders
Depressive Mood Disorders
Impulse Control and Conduct DisordersDevelopmental and Age Related Disorders
Trauma and Stress Related Disorders
Anxiety and Fear Disorders
Bipolar Mood Disorders
DIAGNOSIS CATEGORY
The profiles below summarize individuals who received clinical services from the Division of Behavioral Health psychiatric programs.Individuals are counted only once based on their first treatment episode of the fiscal year. Information that was not reported is listed asunknown. An asterisk (*) in a data cell indicates the count was fewer than five (5) and suppressed to avoid disclosing identifying information.
40
56
45
5
59
82
78
52
28
53
50
58
51
16
Eastern
34,711
32,513
WARREN COUNTY
216
132
51
11
80
74
8
611
*
*
*
185
150
367
130
38
51
56
*
120
149
77
20
50
*
313
7
50
125
108
178
100
268
107
28
29
51
*
118
*
7
61
93
73
37
26
50
55
#Name?
Page G-110
MENTAL ILLNESS TREATMENT SERVICES -- DIVISION OF BEHAVIORAL HEALTH
FY2018 FY2017
RACE / ETHNICITY
TREATMENT ACCOMMODATION
2019 Status Report on Missouri's Substance Use and Mental Health
615
247
426 37445
33
36
49
52
5
0
*
657617NUMBER SERVED
PLANNING REGION
PSYCHIATRIC SERVICE AREA
2018 POPULATION ESTIMATE
CENSUS 2010
FY2019 FY2018 FY2017
Individuals who received psychiatric services had the following types ofdisorders. The total number of diagnoses is larger than the numberserved because some individuals had more than one type of disorder.
555
27
0
*
15
277
121
61
10
29
0
148
654
0
*
134
41
17
64
7
394
0
*
0
209
122
326
134
33
38
51
*
132
*
13
37
36
284
10
353
36
7
230 227
57 34
FY2018 FY2017
275
342
Gender Unknown 00
000
0
307
268
575
47
43
28
29
41
0
22
FY2019
6
8
19
*
0
34
515
57
40
24
40
63
81
64
18
FY2019
44
241
11
34
245
*
0
6
418
116
83
48
26
300
*
42
22
51
152
*
*
570
9
48
278
124
Total Disorders Diagnosed 1,112897 1,063
Missouri Department of Mental Health, Division of Behavioral Health
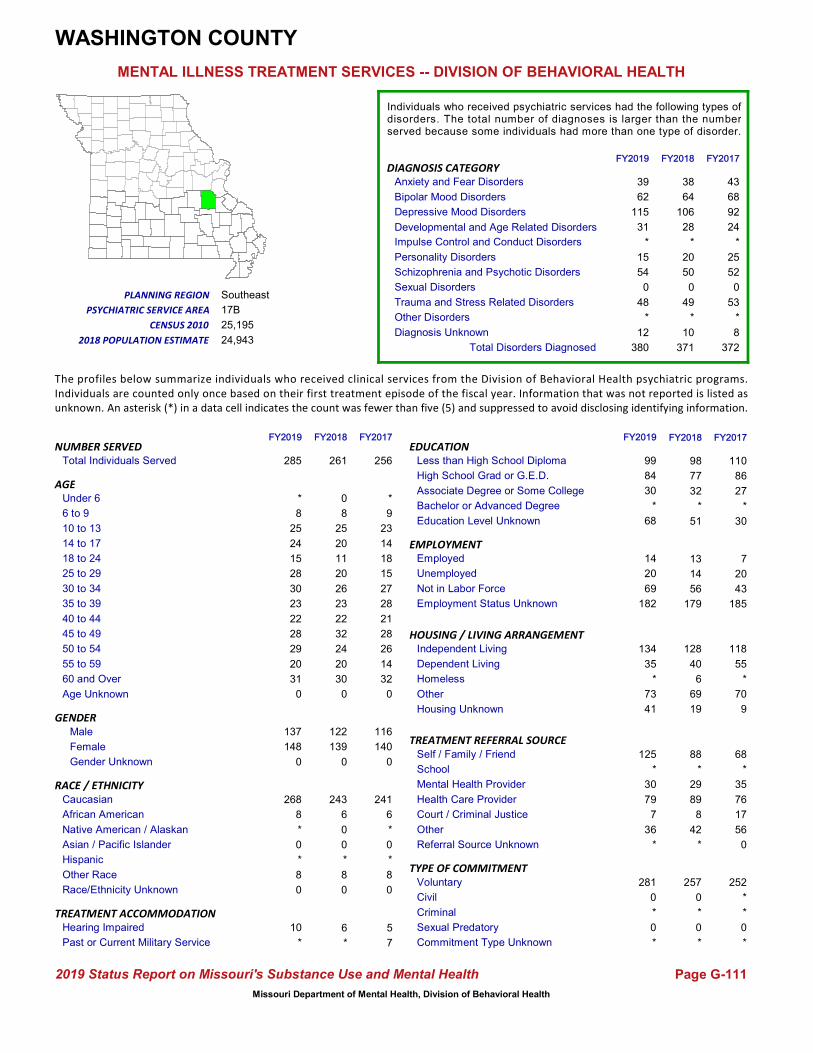
Total Individuals Served
Housing Unknown
Other
Homeless
Independent Living
Dependent Living
HOUSING / LIVING ARRANGEMENT
Employment Status Unknown
Not in Labor Force
Unemployed
Employed
Referral Source Unknown
Other
Court / Criminal Justice
Health Care Provider
Mental Health Provider
School
Self / Family / Friend
Education Level Unknown
Bachelor or Advanced Degree
Associate Degree or Some College
High School Grad or G.E.D.
Less than High School Diploma
Commitment Type Unknown
Sexual Predatory
Criminal
Civil
Voluntary
TREATMENT REFERRAL SOURCE
EMPLOYMENT
EDUCATION
TYPE OF COMMITMENT
Age Unknown
55 to 59
50 to 54
60 and Over
30 to 34
25 to 29
18 to 24
14 to 17
10 to 13
6 to 9
Under 6
40 to 44
35 to 39
45 to 49
AGE
Hearing Impaired
Past or Current Military Service5
7
Race/Ethnicity Unknown
Other Race
Hispanic
Asian / Pacific Islander
Native American / Alaskan
African American
Caucasian
0
8
*
0
*
6
241
GENDERMale
Female 140
116
Diagnosis Unknown
Other Disorders
Sexual Disorders
Schizophrenia and Psychotic Disorders
Personality Disorders
Depressive Mood Disorders
Impulse Control and Conduct DisordersDevelopmental and Age Related Disorders
Trauma and Stress Related Disorders
Anxiety and Fear Disorders
Bipolar Mood Disorders
DIAGNOSIS CATEGORY
The profiles below summarize individuals who received clinical services from the Division of Behavioral Health psychiatric programs.Individuals are counted only once based on their first treatment episode of the fiscal year. Information that was not reported is listed asunknown. An asterisk (*) in a data cell indicates the count was fewer than five (5) and suppressed to avoid disclosing identifying information.
28
28
21
*
9
23
14
18
15
27
32
26
14
17B
Southeast
24,943
25,195
WASHINGTON COUNTY
110
86
27
*
14
56
*
257
0
*
6
43
68
92
24
*
25
52
0
53
88
*
29
89
8
42
*
7
20
43
39
62
115
31
*
15
54
0
48
*
0
8
25
20
11
20
26
30
#Name?
Page G-111
MENTAL ILLNESS TREATMENT SERVICES -- DIVISION OF BEHAVIORAL HEALTH
FY2018 FY2017
RACE / ETHNICITY
TREATMENT ACCOMMODATION
2019 Status Report on Missouri's Substance Use and Mental Health
812
30
179 18523
22
32
24
20
*
0
*
256261NUMBER SERVED
PLANNING REGION
PSYCHIATRIC SERVICE AREA
2018 POPULATION ESTIMATE
CENSUS 2010
FY2019 FY2018 FY2017
Individuals who received psychiatric services had the following types ofdisorders. The total number of diagnoses is larger than the numberserved because some individuals had more than one type of disorder.
243
6
0
0
*
98
77
32
*
8
0
51
252
*
*
68
*
35
76
17
56
0
0
*
38
64
106
28
*
20
50
0
49
*
10
13
40
128
6
118
55
*
69 70
19 9
FY2018 FY2017
122
139
Gender Unknown 00
000
0
148
137
285
20
29
28
22
23
0
8
FY2019
10
*
*
0
*
8
268
31
30
28
15
24
25
8
*
FY2019
41
73
*
35
134
*
0
*
182
68
69
20
14
36
7
79
30
*
125
*
0
281
*
30
99
84
Total Disorders Diagnosed 372380 371
Missouri Department of Mental Health, Division of Behavioral Health

Total Individuals Served
Housing Unknown
Other
Homeless
Independent Living
Dependent Living
HOUSING / LIVING ARRANGEMENT
Employment Status Unknown
Not in Labor Force
Unemployed
Employed
Referral Source Unknown
Other
Court / Criminal Justice
Health Care Provider
Mental Health Provider
School
Self / Family / Friend
Education Level Unknown
Bachelor or Advanced Degree
Associate Degree or Some College
High School Grad or G.E.D.
Less than High School Diploma
Commitment Type Unknown
Sexual Predatory
Criminal
Civil
Voluntary
TREATMENT REFERRAL SOURCE
EMPLOYMENT
EDUCATION
TYPE OF COMMITMENT
Age Unknown
55 to 59
50 to 54
60 and Over
30 to 34
25 to 29
18 to 24
14 to 17
10 to 13
6 to 9
Under 6
40 to 44
35 to 39
45 to 49
AGE
Hearing Impaired
Past or Current Military Service*
8
Race/Ethnicity Unknown
Other Race
Hispanic
Asian / Pacific Islander
Native American / Alaskan
African American
Caucasian
0
5
*
0
*
0
184
GENDERMale
Female 116
75
Diagnosis Unknown
Other Disorders
Sexual Disorders
Schizophrenia and Psychotic Disorders
Personality Disorders
Depressive Mood Disorders
Impulse Control and Conduct DisordersDevelopmental and Age Related Disorders
Trauma and Stress Related Disorders
Anxiety and Fear Disorders
Bipolar Mood Disorders
DIAGNOSIS CATEGORY
The profiles below summarize individuals who received clinical services from the Division of Behavioral Health psychiatric programs.Individuals are counted only once based on their first treatment episode of the fiscal year. Information that was not reported is listed asunknown. An asterisk (*) in a data cell indicates the count was fewer than five (5) and suppressed to avoid disclosing identifying information.
19
20
15
0
*
9
5
8
10
9
36
33
23
19
Southeast
13,122
13,521
WAYNE COUNTY
83
71
28
*
10
17
9
216
0
*
11
55
48
101
17
15
23
30
0
39
87
*
51
50
6
22
*
*
10
24
71
62
166
36
16
19
38
0
71
0
*
7
6
9
16
6
13
43
#Name?
Page G-112
MENTAL ILLNESS TREATMENT SERVICES -- DIVISION OF BEHAVIORAL HEALTH
FY2018 FY2017
RACE / ETHNICITY
TREATMENT ACCOMMODATION
2019 Status Report on Missouri's Substance Use and Mental Health
*7
5
190 15116
13
25
27
36
*
0
0
191219NUMBER SERVED
PLANNING REGION
PSYCHIATRIC SERVICE AREA
2018 POPULATION ESTIMATE
CENSUS 2010
FY2019 FY2018 FY2017
Individuals who received psychiatric services had the following types ofdisorders. The total number of diagnoses is larger than the numberserved because some individuals had more than one type of disorder.
210
0
*
0
*
98
81
30
*
6
0
6
189
0
*
71
*
28
52
12
27
0
0
0
58
50
118
21
14
21
29
0
48
0
7
*
19
159
*
152
10
*
26 26
12 *
FY2018 FY2017
85
134
Gender Unknown 00
000
0
176
130
306
42
42
27
19
16
0
8
FY2019
14
8
7
*
*
*
293
50
20
21
22
17
14
14
*
FY2019
6
58
9
18
217
0
0
*
281
*
16
8
*
30
5
56
70
5
141
*
0
304
6
51
145
100
Total Disorders Diagnosed 330486 366
Missouri Department of Mental Health, Division of Behavioral Health
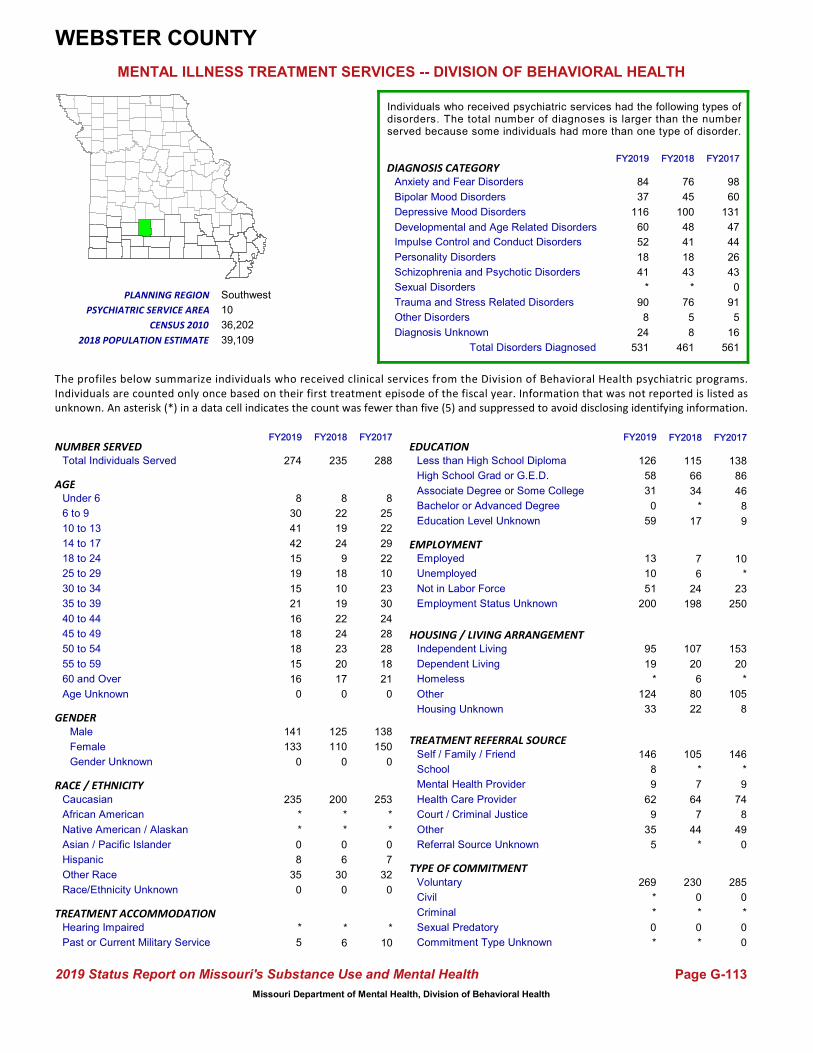
Total Individuals Served
Housing Unknown
Other
Homeless
Independent Living
Dependent Living
HOUSING / LIVING ARRANGEMENT
Employment Status Unknown
Not in Labor Force
Unemployed
Employed
Referral Source Unknown
Other
Court / Criminal Justice
Health Care Provider
Mental Health Provider
School
Self / Family / Friend
Education Level Unknown
Bachelor or Advanced Degree
Associate Degree or Some College
High School Grad or G.E.D.
Less than High School Diploma
Commitment Type Unknown
Sexual Predatory
Criminal
Civil
Voluntary
TREATMENT REFERRAL SOURCE
EMPLOYMENT
EDUCATION
TYPE OF COMMITMENT
Age Unknown
55 to 59
50 to 54
60 and Over
30 to 34
25 to 29
18 to 24
14 to 17
10 to 13
6 to 9
Under 6
40 to 44
35 to 39
45 to 49
AGE
Hearing Impaired
Past or Current Military Service*
10
Race/Ethnicity Unknown
Other Race
Hispanic
Asian / Pacific Islander
Native American / Alaskan
African American
Caucasian
0
32
7
0
*
*
253
GENDERMale
Female 150
138
Diagnosis Unknown
Other Disorders
Sexual Disorders
Schizophrenia and Psychotic Disorders
Personality Disorders
Depressive Mood Disorders
Impulse Control and Conduct DisordersDevelopmental and Age Related Disorders
Trauma and Stress Related Disorders
Anxiety and Fear Disorders
Bipolar Mood Disorders
DIAGNOSIS CATEGORY
The profiles below summarize individuals who received clinical services from the Division of Behavioral Health psychiatric programs.Individuals are counted only once based on their first treatment episode of the fiscal year. Information that was not reported is listed asunknown. An asterisk (*) in a data cell indicates the count was fewer than five (5) and suppressed to avoid disclosing identifying information.
28
30
24
8
25
22
29
22
10
23
21
28
18
10
Southwest
39,109
36,202
WEBSTER COUNTY
138
86
46
8
6
24
6
230
0
*
*
98
60
131
47
44
26
43
0
91
105
*
7
64
7
44
5
10
*
23
84
37
116
60
52
18
41
*
90
8
8
22
19
24
9
18
10
17
#Name?
Page G-113
MENTAL ILLNESS TREATMENT SERVICES -- DIVISION OF BEHAVIORAL HEALTH
FY2018 FY2017
RACE / ETHNICITY
TREATMENT ACCOMMODATION
2019 Status Report on Missouri's Substance Use and Mental Health
1624
9
198 25019
22
24
23
20
*
0
*
288235NUMBER SERVED
PLANNING REGION
PSYCHIATRIC SERVICE AREA
2018 POPULATION ESTIMATE
CENSUS 2010
FY2019 FY2018 FY2017
Individuals who received psychiatric services had the following types ofdisorders. The total number of diagnoses is larger than the numberserved because some individuals had more than one type of disorder.
200
*
*
0
6
115
66
34
*
30
0
17
285
0
*
146
*
9
74
8
49
0
0
0
76
45
100
48
41
18
43
*
76
5
8
7
20
107
6
153
20
*
80 105
22 8
FY2018 FY2017
125
110
Gender Unknown 00
000
0
133
141
274
15
18
18
16
21
0
35
FY2019
*
5
8
0
*
*
235
16
15
19
15
42
41
30
8
FY2019
33
124
*
19
95
*
0
5
200
59
51
10
13
35
9
62
9
8
146
*
*
269
0
31
126
58
Total Disorders Diagnosed 561531 461
Missouri Department of Mental Health, Division of Behavioral Health

Total Individuals Served
Housing Unknown
Other
Homeless
Independent Living
Dependent Living
HOUSING / LIVING ARRANGEMENT
Employment Status Unknown
Not in Labor Force
Unemployed
Employed
Referral Source Unknown
Other
Court / Criminal Justice
Health Care Provider
Mental Health Provider
School
Self / Family / Friend
Education Level Unknown
Bachelor or Advanced Degree
Associate Degree or Some College
High School Grad or G.E.D.
Less than High School Diploma
Commitment Type Unknown
Sexual Predatory
Criminal
Civil
Voluntary
TREATMENT REFERRAL SOURCE
EMPLOYMENT
EDUCATION
TYPE OF COMMITMENT
Age Unknown
55 to 59
50 to 54
60 and Over
30 to 34
25 to 29
18 to 24
14 to 17
10 to 13
6 to 9
Under 6
40 to 44
35 to 39
45 to 49
AGE
Hearing Impaired
Past or Current Military Service0
*
Race/Ethnicity Unknown
Other Race
Hispanic
Asian / Pacific Islander
Native American / Alaskan
African American
Caucasian
0
0
0
0
0
0
18
GENDERMale
Female 14
*
Diagnosis Unknown
Other Disorders
Sexual Disorders
Schizophrenia and Psychotic Disorders
Personality Disorders
Depressive Mood Disorders
Impulse Control and Conduct DisordersDevelopmental and Age Related Disorders
Trauma and Stress Related Disorders
Anxiety and Fear Disorders
Bipolar Mood Disorders
DIAGNOSIS CATEGORY
The profiles below summarize individuals who received clinical services from the Division of Behavioral Health psychiatric programs.Individuals are counted only once based on their first treatment episode of the fiscal year. Information that was not reported is listed asunknown. An asterisk (*) in a data cell indicates the count was fewer than five (5) and suppressed to avoid disclosing identifying information.
*
0
0
0
*
0
*
*
*
*
*
*
*
1
Northwest
2,040
2,171
WORTH COUNTY
5
7
*
*
0
0
*
16
0
0
0
8
*
13
*
*
*
0
0
5
*
*
*
*
*
*
*
0
*
*
*
*
7
*
0
*
0
0
*
*
0
*
0
6
*
*
0
*
#Name?
Page G-114
MENTAL ILLNESS TREATMENT SERVICES -- DIVISION OF BEHAVIORAL HEALTH
FY2018 FY2017
RACE / ETHNICITY
TREATMENT ACCOMMODATION
2019 Status Report on Missouri's Substance Use and Mental Health
**
*
16 16*
0
*
*
0
0
0
0
1816NUMBER SERVED
PLANNING REGION
PSYCHIATRIC SERVICE AREA
2018 POPULATION ESTIMATE
CENSUS 2010
FY2019 FY2018 FY2017
Individuals who received psychiatric services had the following types ofdisorders. The total number of diagnoses is larger than the numberserved because some individuals had more than one type of disorder.
16
0
0
0
0
7
7
*
*
0
0
0
18
0
0
5
*
*
*
*
*
0
0
0
6
*
10
*
*
*
0
0
*
*
*
0
*
8
0
13
0
0
7 *
0 *
FY2018 FY2017
*
12
Gender Unknown 00
000
0
11
5
16
*
*
*
0
*
0
0
FY2019
*
*
0
0
0
0
16
*
0
0
*
*
0
*
*
FY2019
*
*
0
*
9
0
0
0
10
*
*
0
*
*
*
*
*
*
6
0
0
16
*
*
5
5
Total Disorders Diagnosed 3523 29
Missouri Department of Mental Health, Division of Behavioral Health
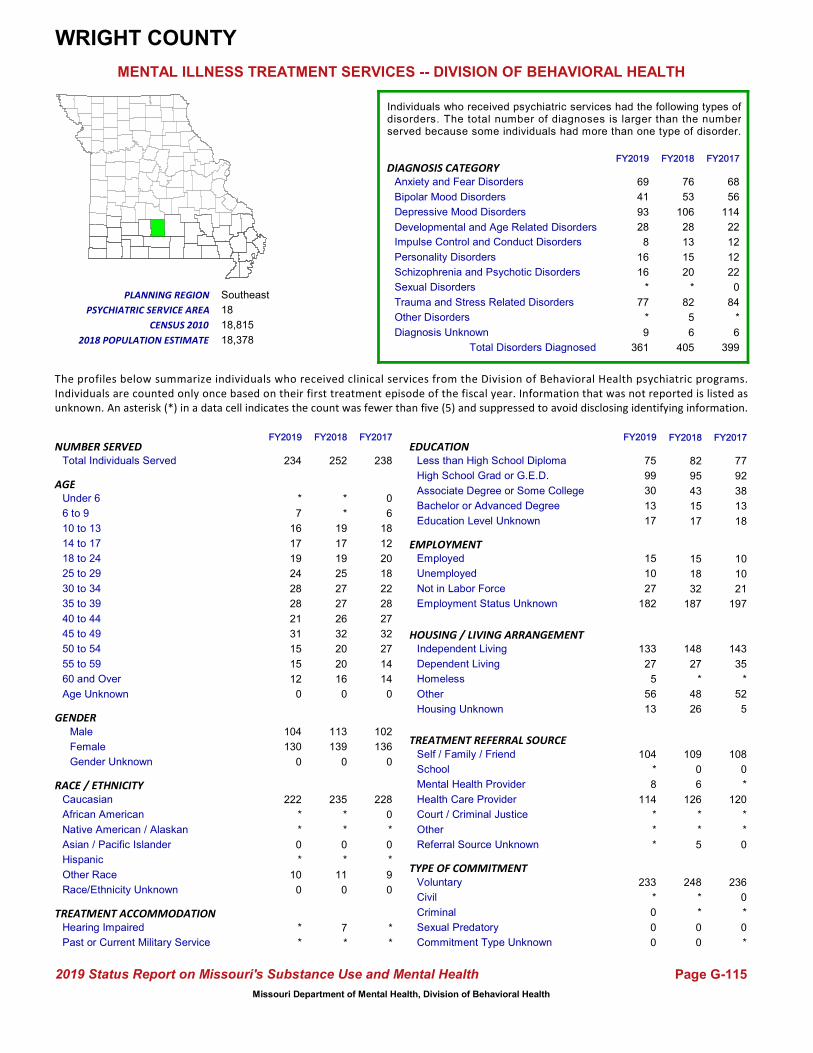
Total Individuals Served
Housing Unknown
Other
Homeless
Independent Living
Dependent Living
HOUSING / LIVING ARRANGEMENT
Employment Status Unknown
Not in Labor Force
Unemployed
Employed
Referral Source Unknown
Other
Court / Criminal Justice
Health Care Provider
Mental Health Provider
School
Self / Family / Friend
Education Level Unknown
Bachelor or Advanced Degree
Associate Degree or Some College
High School Grad or G.E.D.
Less than High School Diploma
Commitment Type Unknown
Sexual Predatory
Criminal
Civil
Voluntary
TREATMENT REFERRAL SOURCE
EMPLOYMENT
EDUCATION
TYPE OF COMMITMENT
Age Unknown
55 to 59
50 to 54
60 and Over
30 to 34
25 to 29
18 to 24
14 to 17
10 to 13
6 to 9
Under 6
40 to 44
35 to 39
45 to 49
AGE
Hearing Impaired
Past or Current Military Service*
*
Race/Ethnicity Unknown
Other Race
Hispanic
Asian / Pacific Islander
Native American / Alaskan
African American
Caucasian
0
9
*
0
*
0
228
GENDERMale
Female 136
102
Diagnosis Unknown
Other Disorders
Sexual Disorders
Schizophrenia and Psychotic Disorders
Personality Disorders
Depressive Mood Disorders
Impulse Control and Conduct DisordersDevelopmental and Age Related Disorders
Trauma and Stress Related Disorders
Anxiety and Fear Disorders
Bipolar Mood Disorders
DIAGNOSIS CATEGORY
The profiles below summarize individuals who received clinical services from the Division of Behavioral Health psychiatric programs.Individuals are counted only once based on their first treatment episode of the fiscal year. Information that was not reported is listed asunknown. An asterisk (*) in a data cell indicates the count was fewer than five (5) and suppressed to avoid disclosing identifying information.
32
28
27
0
6
18
12
20
18
22
14
27
14
18
Southeast
18,378
18,815
WRIGHT COUNTY
77
92
38
13
18
32
*
248
*
*
7
68
56
114
22
12
12
22
0
84
109
0
6
126
*
*
*
10
10
21
69
41
93
28
8
16
16
*
77
*
*
*
19
17
19
25
27
16
#Name?
Page G-115
MENTAL ILLNESS TREATMENT SERVICES -- DIVISION OF BEHAVIORAL HEALTH
FY2018 FY2017
RACE / ETHNICITY
TREATMENT ACCOMMODATION
2019 Status Report on Missouri's Substance Use and Mental Health
69
18
187 19727
26
32
20
20
5
0
0
238252NUMBER SERVED
PLANNING REGION
PSYCHIATRIC SERVICE AREA
2018 POPULATION ESTIMATE
CENSUS 2010
FY2019 FY2018 FY2017
Individuals who received psychiatric services had the following types ofdisorders. The total number of diagnoses is larger than the numberserved because some individuals had more than one type of disorder.
235
*
*
0
*
82
95
43
15
11
0
17
236
0
*
108
0
*
120
*
*
0
0
*
76
53
106
28
13
15
20
*
82
5
6
15
27
148
*
143
35
*
48 52
26 5
FY2018 FY2017
113
139
Gender Unknown 00
000
0
130
104
234
15
15
31
21
28
0
10
FY2019
*
*
*
0
*
*
222
12
28
24
19
17
16
7
*
FY2019
13
56
5
27
133
0
0
*
182
17
27
10
15
*
*
114
8
*
104
0
*
233
13
30
75
99
Total Disorders Diagnosed 399361 405
Missouri Department of Mental Health, Division of Behavioral Health

Total Individuals Served
Housing Unknown
Other
Homeless
Independent Living
Dependent Living
HOUSING / LIVING ARRANGEMENT
Employment Status Unknown
Not in Labor Force
Unemployed
Employed
Referral Source Unknown
Other
Court / Criminal Justice
Health Care Provider
Mental Health Provider
School
Self / Family / Friend
Education Level Unknown
Bachelor or Advanced Degree
Associate Degree or Some College
High School Grad or G.E.D.
Less than High School Diploma
Commitment Type Unknown
Sexual Predatory
Criminal
Civil
Voluntary
TREATMENT REFERRAL SOURCE
EMPLOYMENT
EDUCATION
TYPE OF COMMITMENT
Age Unknown
55 to 59
50 to 54
60 and Over
30 to 34
25 to 29
18 to 24
14 to 17
10 to 13
6 to 9
Under 6
40 to 44
35 to 39
45 to 49
AGE
Hearing Impaired
Past or Current Military Service72
205
Race/Ethnicity Unknown
Other Race
Hispanic
Asian / Pacific Islander
Native American / Alaskan
African American
Caucasian
*
279
66
24
5
4,893
1,627
GENDERMale
Female 3,274
3,554
Diagnosis Unknown
Other Disorders
Sexual Disorders
Schizophrenia and Psychotic Disorders
Personality Disorders
Depressive Mood Disorders
Impulse Control and Conduct DisordersDevelopmental and Age Related Disorders
Trauma and Stress Related Disorders
Anxiety and Fear Disorders
Bipolar Mood Disorders
DIAGNOSIS CATEGORY
The profiles below summarize individuals who received clinical services from the Division of Behavioral Health psychiatric programs.Individuals are counted only once based on their first treatment episode of the fiscal year. Information that was not reported is listed asunknown. An asterisk (*) in a data cell indicates the count was fewer than five (5) and suppressed to avoid disclosing identifying information.
655
567
506
28
279
343
273
483
455
490
973
881
895
24, 25
Eastern
302,838
319,294
SAINT LOUIS CITY
2,684
1,917
1,005
313
250
1,837
186
7,046
9
223
90
463
1,615
2,584
865
444
733
2,754
14
619
2,987
111
993
1,340
249
1,402
63
221
243
1,454
543
1,591
2,980
993
459
652
2,664
13
755
68
31
332
416
329
503
538
565
1,077
#Name?
Page G-116
MENTAL ILLNESS TREATMENT SERVICES -- DIVISION OF BEHAVIORAL HEALTH
FY2018 FY2017
RACE / ETHNICITY
TREATMENT ACCOMMODATION
2019 Status Report on Missouri's Substance Use and Mental Health
159450
915
4,962 4,916570
534
668
849
918
245
*
47
6,8297,330NUMBER SERVED
PLANNING REGION
PSYCHIATRIC SERVICE AREA
2018 POPULATION ESTIMATE
CENSUS 2010
FY2019 FY2018 FY2017
Individuals who received psychiatric services had the following types ofdisorders. The total number of diagnoses is larger than the numberserved because some individuals had more than one type of disorder.
1,688
5,043
6
26
74
2,808
2,055
1,038
309
344
0
1,117
6,550
29
229
2,489
61
738
1,334
471
1,730
6
*
19
482
1,615
2,810
985
461
663
2,718
13
683
68
264
278
839
4,022
537
3,753
921
392
1,465 1,525
464 239
FY2018 FY2017
3,804
3,526
Gender Unknown *0
*00
*
3,756
4,041
7,798
904
847
678
593
662
0
357
FY2019
128
167
75
24
7
5,460
1,948
1,188
609
584
564
380
451
315
23
FY2019
572
1,644
557
861
4,164
41
*
245
5,218
1,422
1,835
386
359
1,243
191
1,425
954
106
3,633
237
9
7,509
321
1,038
2,806
2,211
Total Disorders Diagnosed 10,31311,168 10,762
Missouri Department of Mental Health, Division of Behavioral Health
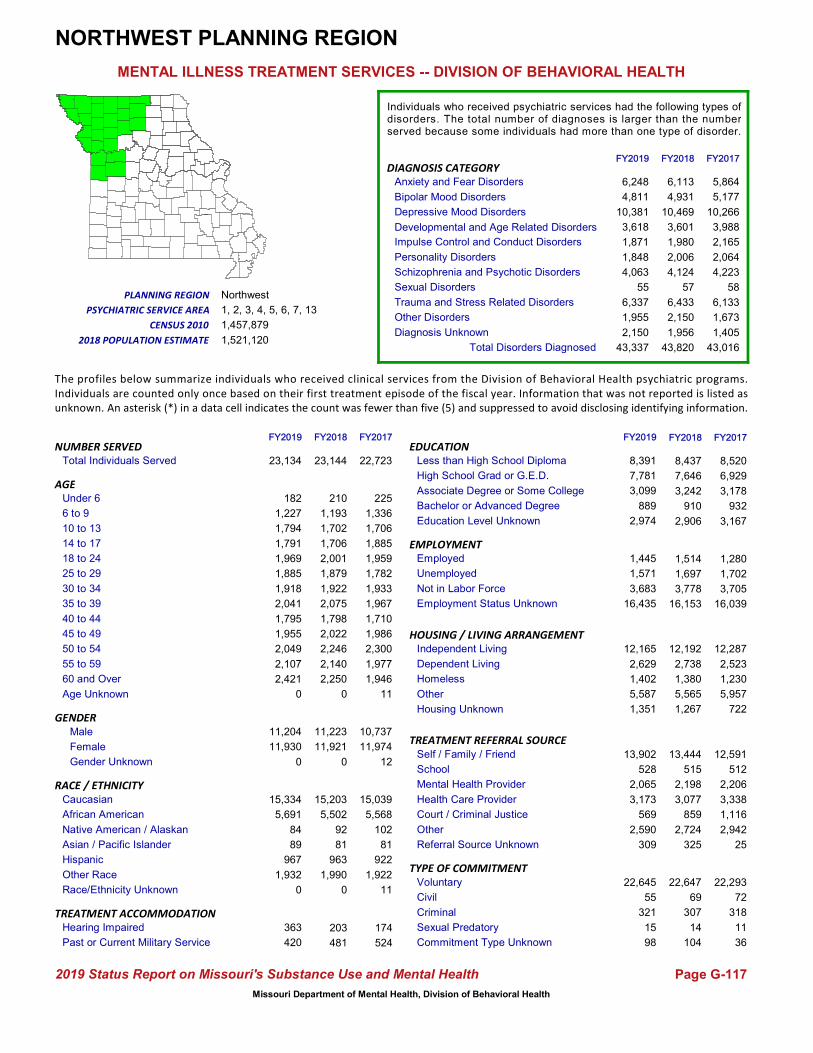
Total Individuals Served
Housing Unknown
Other
Homeless
Independent Living
Dependent Living
HOUSING / LIVING ARRANGEMENT
Employment Status Unknown
Not in Labor Force
Unemployed
Employed
Referral Source Unknown
Other
Court / Criminal Justice
Health Care Provider
Mental Health Provider
School
Self / Family / Friend
Education Level Unknown
Bachelor or Advanced Degree
Associate Degree or Some College
High School Grad or G.E.D.
Less than High School Diploma
Commitment Type Unknown
Sexual Predatory
Criminal
Civil
Voluntary
TREATMENT REFERRAL SOURCE
EMPLOYMENT
EDUCATION
TYPE OF COMMITMENT
Age Unknown
55 to 59
50 to 54
60 and Over
30 to 34
25 to 29
18 to 24
14 to 17
10 to 13
6 to 9
Under 6
40 to 44
35 to 39
45 to 49
AGE
Hearing Impaired
Past or Current Military Service174
524
Race/Ethnicity Unknown
Other Race
Hispanic
Asian / Pacific Islander
Native American / Alaskan
African American
Caucasian
11
1,922
922
81
102
5,568
15,039
GENDERMale
Female 11,974
10,737
Diagnosis Unknown
Other Disorders
Sexual Disorders
Schizophrenia and Psychotic Disorders
Personality Disorders
Depressive Mood Disorders
Impulse Control and Conduct DisordersDevelopmental and Age Related Disorders
Trauma and Stress Related Disorders
Anxiety and Fear Disorders
Bipolar Mood Disorders
DIAGNOSIS CATEGORY
The profiles below summarize individuals who received clinical services from the Division of Behavioral Health psychiatric programs.Individuals are counted only once based on their first treatment episode of the fiscal year. Information that was not reported is listed asunknown. An asterisk (*) in a data cell indicates the count was fewer than five (5) and suppressed to avoid disclosing identifying information.
1,986
1,967
1,710
225
1,336
1,706
1,885
1,959
1,782
1,933
1,946
2,300
1,977
1, 2, 3, 4, 5, 6, 7, 13
Northwest
1,521,120
1,457,879
NORTHWEST PLANNING REGION
8,520
6,929
3,178
932
1,697
3,778
481
22,647
69
307
203
5,864
5,177
10,266
3,988
2,165
2,064
4,223
58
6,133
13,444
515
2,198
3,077
859
2,724
1,673
1,280
1,702
3,705
6,248
4,811
10,381
3,618
1,871
1,848
4,063
55
6,337
1,955
210
1,193
1,702
1,706
2,001
1,879
1,922
2,250
#Name?
Page G-117
MENTAL ILLNESS TREATMENT SERVICES -- DIVISION OF BEHAVIORAL HEALTH
FY2018 FY2017
RACE / ETHNICITY
TREATMENT ACCOMMODATION
2019 Status Report on Missouri's Substance Use and Mental Health
1,4052,150
3,167
16,153 16,0392,075
1,798
2,022
2,246
2,140
325
14
104
22,72323,144NUMBER SERVED
PLANNING REGION
PSYCHIATRIC SERVICE AREA
2018 POPULATION ESTIMATE
CENSUS 2010
FY2019 FY2018 FY2017
Individuals who received psychiatric services had the following types ofdisorders. The total number of diagnoses is larger than the numberserved because some individuals had more than one type of disorder.
15,203
5,502
92
81
963
8,437
7,646
3,242
910
1,990
0
2,906
22,293
72
318
12,591
512
2,206
3,338
1,116
2,942
25
11
36
6,113
4,931
10,469
3,601
1,980
2,006
4,124
57
6,433
2,150
1,956
1,514
2,738
12,192
1,380
12,287
2,523
1,230
5,565 5,957
1,267 722
FY2018 FY2017
11,223
11,921
Gender Unknown 120
1100
0
11,930
11,204
23,134
2,107
2,049
1,955
1,795
2,041
0
1,932
FY2019
363
420
967
89
84
5,691
15,334
2,421
1,918
1,885
1,969
1,791
1,794
1,227
182
FY2019
1,351
5,587
1,402
2,629
12,165
98
15
309
16,435
2,974
3,683
1,571
1,445
2,590
569
3,173
2,065
528
13,902
321
55
22,645
889
3,099
8,391
7,781
Total Disorders Diagnosed 43,01643,337 43,820
Missouri Department of Mental Health, Division of Behavioral Health
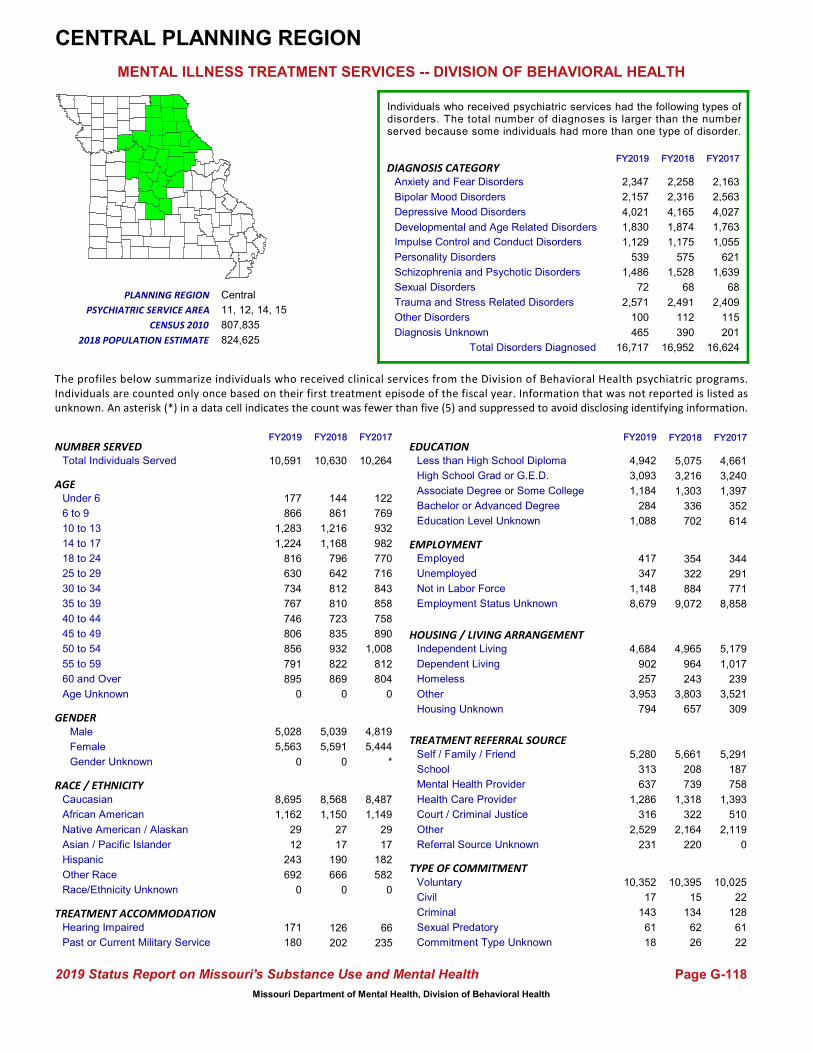
Total Individuals Served
Housing Unknown
Other
Homeless
Independent Living
Dependent Living
HOUSING / LIVING ARRANGEMENT
Employment Status Unknown
Not in Labor Force
Unemployed
Employed
Referral Source Unknown
Other
Court / Criminal Justice
Health Care Provider
Mental Health Provider
School
Self / Family / Friend
Education Level Unknown
Bachelor or Advanced Degree
Associate Degree or Some College
High School Grad or G.E.D.
Less than High School Diploma
Commitment Type Unknown
Sexual Predatory
Criminal
Civil
Voluntary
TREATMENT REFERRAL SOURCE
EMPLOYMENT
EDUCATION
TYPE OF COMMITMENT
Age Unknown
55 to 59
50 to 54
60 and Over
30 to 34
25 to 29
18 to 24
14 to 17
10 to 13
6 to 9
Under 6
40 to 44
35 to 39
45 to 49
AGE
Hearing Impaired
Past or Current Military Service66
235
Race/Ethnicity Unknown
Other Race
Hispanic
Asian / Pacific Islander
Native American / Alaskan
African American
Caucasian
0
582
182
17
29
1,149
8,487
GENDERMale
Female 5,444
4,819
Diagnosis Unknown
Other Disorders
Sexual Disorders
Schizophrenia and Psychotic Disorders
Personality Disorders
Depressive Mood Disorders
Impulse Control and Conduct DisordersDevelopmental and Age Related Disorders
Trauma and Stress Related Disorders
Anxiety and Fear Disorders
Bipolar Mood Disorders
DIAGNOSIS CATEGORY
The profiles below summarize individuals who received clinical services from the Division of Behavioral Health psychiatric programs.Individuals are counted only once based on their first treatment episode of the fiscal year. Information that was not reported is listed asunknown. An asterisk (*) in a data cell indicates the count was fewer than five (5) and suppressed to avoid disclosing identifying information.
890
858
758
122
769
932
982
770
716
843
804
1,008
812
11, 12, 14, 15
Central
824,625
807,835
CENTRAL PLANNING REGION
4,661
3,240
1,397
352
322
884
202
10,395
15
134
126
2,163
2,563
4,027
1,763
1,055
621
1,639
68
2,409
5,661
208
739
1,318
322
2,164
115
344
291
771
2,347
2,157
4,021
1,830
1,129
539
1,486
72
2,571
100
144
861
1,216
1,168
796
642
812
869
#Name?
Page G-118
MENTAL ILLNESS TREATMENT SERVICES -- DIVISION OF BEHAVIORAL HEALTH
FY2018 FY2017
RACE / ETHNICITY
TREATMENT ACCOMMODATION
2019 Status Report on Missouri's Substance Use and Mental Health
201465
614
9,072 8,858810
723
835
932
822
220
62
26
10,26410,630NUMBER SERVED
PLANNING REGION
PSYCHIATRIC SERVICE AREA
2018 POPULATION ESTIMATE
CENSUS 2010
FY2019 FY2018 FY2017
Individuals who received psychiatric services had the following types ofdisorders. The total number of diagnoses is larger than the numberserved because some individuals had more than one type of disorder.
8,568
1,150
27
17
190
5,075
3,216
1,303
336
666
0
702
10,025
22
128
5,291
187
758
1,393
510
2,119
0
61
22
2,258
2,316
4,165
1,874
1,175
575
1,528
68
2,491
112
390
354
964
4,965
243
5,179
1,017
239
3,803 3,521
657 309
FY2018 FY2017
5,039
5,591
Gender Unknown *0
000
0
5,563
5,028
10,591
791
856
806
746
767
0
692
FY2019
171
180
243
12
29
1,162
8,695
895
734
630
816
1,224
1,283
866
177
FY2019
794
3,953
257
902
4,684
18
61
231
8,679
1,088
1,148
347
417
2,529
316
1,286
637
313
5,280
143
17
10,352
284
1,184
4,942
3,093
Total Disorders Diagnosed 16,62416,717 16,952
Missouri Department of Mental Health, Division of Behavioral Health
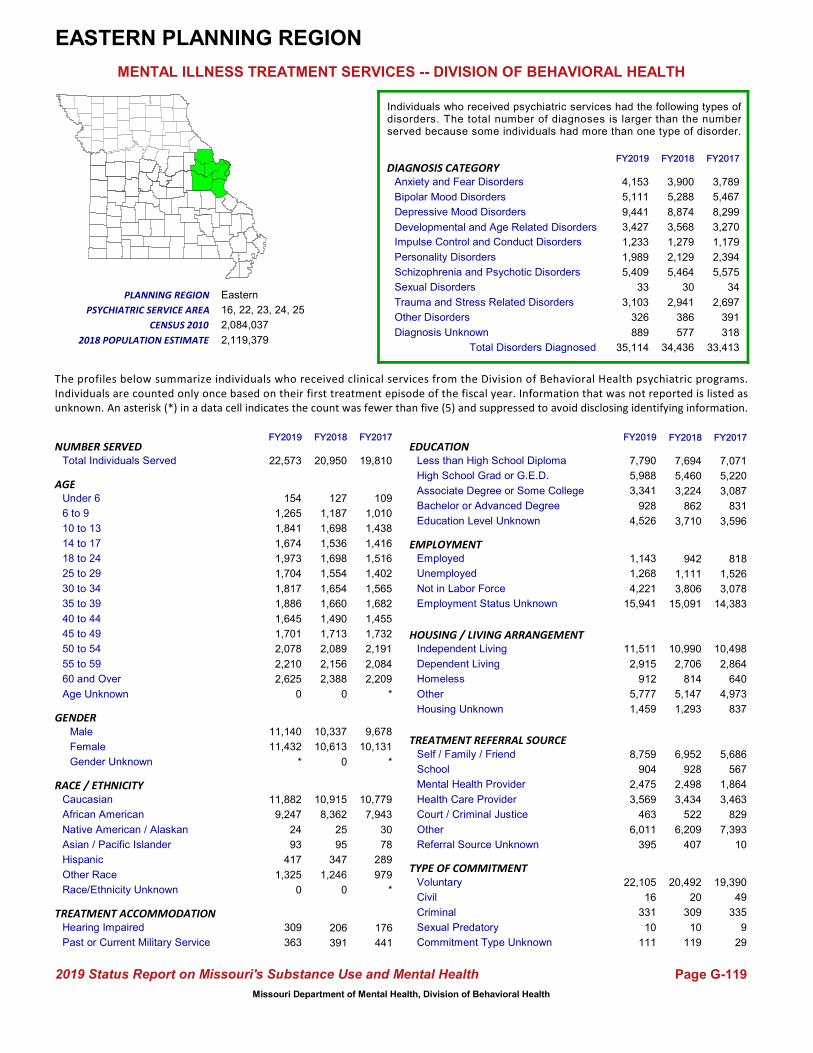
Total Individuals Served
Housing Unknown
Other
Homeless
Independent Living
Dependent Living
HOUSING / LIVING ARRANGEMENT
Employment Status Unknown
Not in Labor Force
Unemployed
Employed
Referral Source Unknown
Other
Court / Criminal Justice
Health Care Provider
Mental Health Provider
School
Self / Family / Friend
Education Level Unknown
Bachelor or Advanced Degree
Associate Degree or Some College
High School Grad or G.E.D.
Less than High School Diploma
Commitment Type Unknown
Sexual Predatory
Criminal
Civil
Voluntary
TREATMENT REFERRAL SOURCE
EMPLOYMENT
EDUCATION
TYPE OF COMMITMENT
Age Unknown
55 to 59
50 to 54
60 and Over
30 to 34
25 to 29
18 to 24
14 to 17
10 to 13
6 to 9
Under 6
40 to 44
35 to 39
45 to 49
AGE
Hearing Impaired
Past or Current Military Service176
441
Race/Ethnicity Unknown
Other Race
Hispanic
Asian / Pacific Islander
Native American / Alaskan
African American
Caucasian
*
979
289
78
30
7,943
10,779
GENDERMale
Female 10,131
9,678
Diagnosis Unknown
Other Disorders
Sexual Disorders
Schizophrenia and Psychotic Disorders
Personality Disorders
Depressive Mood Disorders
Impulse Control and Conduct DisordersDevelopmental and Age Related Disorders
Trauma and Stress Related Disorders
Anxiety and Fear Disorders
Bipolar Mood Disorders
DIAGNOSIS CATEGORY
The profiles below summarize individuals who received clinical services from the Division of Behavioral Health psychiatric programs.Individuals are counted only once based on their first treatment episode of the fiscal year. Information that was not reported is listed asunknown. An asterisk (*) in a data cell indicates the count was fewer than five (5) and suppressed to avoid disclosing identifying information.
1,732
1,682
1,455
109
1,010
1,438
1,416
1,516
1,402
1,565
2,209
2,191
2,084
16, 22, 23, 24, 25
Eastern
2,119,379
2,084,037
EASTERN PLANNING REGION
7,071
5,220
3,087
831
1,111
3,806
391
20,492
20
309
206
3,789
5,467
8,299
3,270
1,179
2,394
5,575
34
2,697
6,952
928
2,498
3,434
522
6,209
391
818
1,526
3,078
4,153
5,111
9,441
3,427
1,233
1,989
5,409
33
3,103
326
127
1,187
1,698
1,536
1,698
1,554
1,654
2,388
#Name?
Page G-119
MENTAL ILLNESS TREATMENT SERVICES -- DIVISION OF BEHAVIORAL HEALTH
FY2018 FY2017
RACE / ETHNICITY
TREATMENT ACCOMMODATION
2019 Status Report on Missouri's Substance Use and Mental Health
318889
3,596
15,091 14,3831,660
1,490
1,713
2,089
2,156
407
10
119
19,81020,950NUMBER SERVED
PLANNING REGION
PSYCHIATRIC SERVICE AREA
2018 POPULATION ESTIMATE
CENSUS 2010
FY2019 FY2018 FY2017
Individuals who received psychiatric services had the following types ofdisorders. The total number of diagnoses is larger than the numberserved because some individuals had more than one type of disorder.
10,915
8,362
25
95
347
7,694
5,460
3,224
862
1,246
0
3,710
19,390
49
335
5,686
567
1,864
3,463
829
7,393
10
9
29
3,900
5,288
8,874
3,568
1,279
2,129
5,464
30
2,941
386
577
942
2,706
10,990
814
10,498
2,864
640
5,147 4,973
1,293 837
FY2018 FY2017
10,337
10,613
Gender Unknown *0
*00
*
11,432
11,140
22,573
2,210
2,078
1,701
1,645
1,886
0
1,325
FY2019
309
363
417
93
24
9,247
11,882
2,625
1,817
1,704
1,973
1,674
1,841
1,265
154
FY2019
1,459
5,777
912
2,915
11,511
111
10
395
15,941
4,526
4,221
1,268
1,143
6,011
463
3,569
2,475
904
8,759
331
16
22,105
928
3,341
7,790
5,988
Total Disorders Diagnosed 33,41335,114 34,436
Missouri Department of Mental Health, Division of Behavioral Health
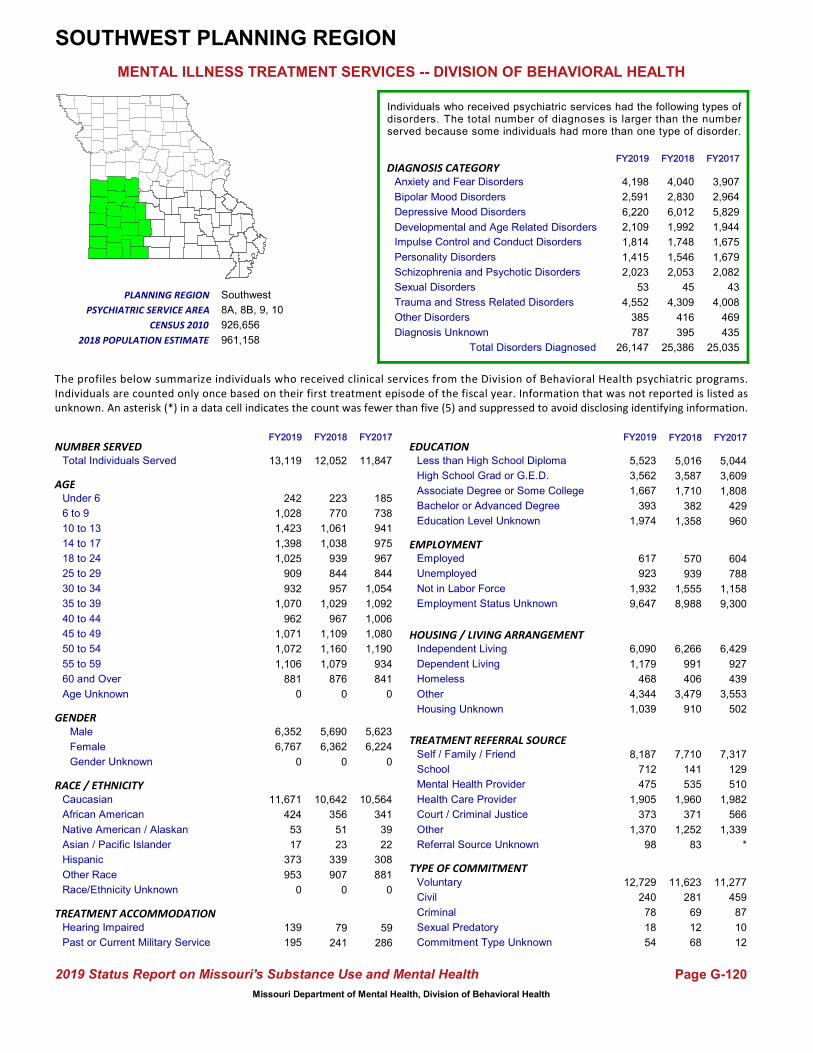
Total Individuals Served
Housing Unknown
Other
Homeless
Independent Living
Dependent Living
HOUSING / LIVING ARRANGEMENT
Employment Status Unknown
Not in Labor Force
Unemployed
Employed
Referral Source Unknown
Other
Court / Criminal Justice
Health Care Provider
Mental Health Provider
School
Self / Family / Friend
Education Level Unknown
Bachelor or Advanced Degree
Associate Degree or Some College
High School Grad or G.E.D.
Less than High School Diploma
Commitment Type Unknown
Sexual Predatory
Criminal
Civil
Voluntary
TREATMENT REFERRAL SOURCE
EMPLOYMENT
EDUCATION
TYPE OF COMMITMENT
Age Unknown
55 to 59
50 to 54
60 and Over
30 to 34
25 to 29
18 to 24
14 to 17
10 to 13
6 to 9
Under 6
40 to 44
35 to 39
45 to 49
AGE
Hearing Impaired
Past or Current Military Service59
286
Race/Ethnicity Unknown
Other Race
Hispanic
Asian / Pacific Islander
Native American / Alaskan
African American
Caucasian
0
881
308
22
39
341
10,564
GENDERMale
Female 6,224
5,623
Diagnosis Unknown
Other Disorders
Sexual Disorders
Schizophrenia and Psychotic Disorders
Personality Disorders
Depressive Mood Disorders
Impulse Control and Conduct DisordersDevelopmental and Age Related Disorders
Trauma and Stress Related Disorders
Anxiety and Fear Disorders
Bipolar Mood Disorders
DIAGNOSIS CATEGORY
The profiles below summarize individuals who received clinical services from the Division of Behavioral Health psychiatric programs.Individuals are counted only once based on their first treatment episode of the fiscal year. Information that was not reported is listed asunknown. An asterisk (*) in a data cell indicates the count was fewer than five (5) and suppressed to avoid disclosing identifying information.
1,080
1,092
1,006
185
738
941
975
967
844
1,054
841
1,190
934
8A, 8B, 9, 10
Southwest
961,158
926,656
SOUTHWEST PLANNING REGION
5,044
3,609
1,808
429
939
1,555
241
11,623
281
69
79
3,907
2,964
5,829
1,944
1,675
1,679
2,082
43
4,008
7,710
141
535
1,960
371
1,252
469
604
788
1,158
4,198
2,591
6,220
2,109
1,814
1,415
2,023
53
4,552
385
223
770
1,061
1,038
939
844
957
876
#Name?
Page G-120
MENTAL ILLNESS TREATMENT SERVICES -- DIVISION OF BEHAVIORAL HEALTH
FY2018 FY2017
RACE / ETHNICITY
TREATMENT ACCOMMODATION
2019 Status Report on Missouri's Substance Use and Mental Health
435787
960
8,988 9,3001,029
967
1,109
1,160
1,079
83
12
68
11,84712,052NUMBER SERVED
PLANNING REGION
PSYCHIATRIC SERVICE AREA
2018 POPULATION ESTIMATE
CENSUS 2010
FY2019 FY2018 FY2017
Individuals who received psychiatric services had the following types ofdisorders. The total number of diagnoses is larger than the numberserved because some individuals had more than one type of disorder.
10,642
356
51
23
339
5,016
3,587
1,710
382
907
0
1,358
11,277
459
87
7,317
129
510
1,982
566
1,339
*
10
12
4,040
2,830
6,012
1,992
1,748
1,546
2,053
45
4,309
416
395
570
991
6,266
406
6,429
927
439
3,479 3,553
910 502
FY2018 FY2017
5,690
6,362
Gender Unknown 00
000
0
6,767
6,352
13,119
1,106
1,072
1,071
962
1,070
0
953
FY2019
139
195
373
17
53
424
11,671
881
932
909
1,025
1,398
1,423
1,028
242
FY2019
1,039
4,344
468
1,179
6,090
54
18
98
9,647
1,974
1,932
923
617
1,370
373
1,905
475
712
8,187
78
240
12,729
393
1,667
5,523
3,562
Total Disorders Diagnosed 25,03526,147 25,386
Missouri Department of Mental Health, Division of Behavioral Health

Total Individuals Served
Housing Unknown
Other
Homeless
Independent Living
Dependent Living
HOUSING / LIVING ARRANGEMENT
Employment Status Unknown
Not in Labor Force
Unemployed
Employed
Referral Source Unknown
Other
Court / Criminal Justice
Health Care Provider
Mental Health Provider
School
Self / Family / Friend
Education Level Unknown
Bachelor or Advanced Degree
Associate Degree or Some College
High School Grad or G.E.D.
Less than High School Diploma
Commitment Type Unknown
Sexual Predatory
Criminal
Civil
Voluntary
TREATMENT REFERRAL SOURCE
EMPLOYMENT
EDUCATION
TYPE OF COMMITMENT
Age Unknown
55 to 59
50 to 54
60 and Over
30 to 34
25 to 29
18 to 24
14 to 17
10 to 13
6 to 9
Under 6
40 to 44
35 to 39
45 to 49
AGE
Hearing Impaired
Past or Current Military Service124
388
Race/Ethnicity Unknown
Other Race
Hispanic
Asian / Pacific Islander
Native American / Alaskan
African American
Caucasian
5
553
186
11
27
1,068
11,664
GENDERMale
Female 7,237
6,086
Diagnosis Unknown
Other Disorders
Sexual Disorders
Schizophrenia and Psychotic Disorders
Personality Disorders
Depressive Mood Disorders
Impulse Control and Conduct DisordersDevelopmental and Age Related Disorders
Trauma and Stress Related Disorders
Anxiety and Fear Disorders
Bipolar Mood Disorders
DIAGNOSIS CATEGORY
The profiles below summarize individuals who received clinical services from the Division of Behavioral Health psychiatric programs.Individuals are counted only once based on their first treatment episode of the fiscal year. Information that was not reported is listed asunknown. An asterisk (*) in a data cell indicates the count was fewer than five (5) and suppressed to avoid disclosing identifying information.
1,220
1,247
1,142
78
678
960
938
1,039
1,003
1,171
1,327
1,343
1,177
17A, 17B, 18, 19, 20, 21
Southeast
700,170
712,520
SOUTHEAST PLANNING REGION
5,136
4,304
1,489
339
990
2,090
349
13,024
13
272
242
2,900
3,084
5,639
1,715
1,141
1,082
2,105
132
2,497
6,970
203
1,076
3,078
603
1,118
129
887
916
1,925
3,127
2,855
5,953
1,803
1,202
881
2,024
149
2,620
98
101
608
975
930
1,067
1,011
1,150
1,421
#Name?
Page G-121
MENTAL ILLNESS TREATMENT SERVICES -- DIVISION OF BEHAVIORAL HEALTH
FY2018 FY2017
RACE / ETHNICITY
TREATMENT ACCOMMODATION
2019 Status Report on Missouri's Substance Use and Mental Health
642543
2,057
9,542 9,5971,295
1,135
1,257
1,287
1,271
461
173
26
13,32813,508NUMBER SERVED
PLANNING REGION
PSYCHIATRIC SERVICE AREA
2018 POPULATION ESTIMATE
CENSUS 2010
FY2019 FY2018 FY2017
Individuals who received psychiatric services had the following types ofdisorders. The total number of diagnoses is larger than the numberserved because some individuals had more than one type of disorder.
11,488
987
21
7
186
5,302
4,517
1,623
378
592
0
1,688
12,873
19
271
6,797
187
1,065
3,028
917
1,328
5
145
19
2,982
2,977
5,815
1,708
1,156
974
2,055
140
2,463
113
641
887
1,257
7,772
296
7,643
1,412
240
3,109 3,573
1,075 458
FY2018 FY2017
6,204
7,304
Gender Unknown 50
500
0
7,392
6,455
13,847
1,251
1,194
1,223
1,155
1,249
0
587
FY2019
327
286
223
5
24
1,180
12,051
1,419
1,191
1,093
1,092
1,032
1,143
696
109
FY2019
1,155
3,560
274
1,273
7,586
25
177
428
10,039
1,737
1,906
1,002
900
1,229
570
2,942
986
278
7,416
255
8
13,382
321
1,502
5,438
4,849
Total Disorders Diagnosed 21,06621,255 21,024
Missouri Department of Mental Health, Division of Behavioral Health

Total Individuals Served
Housing Unknown
Other
Homeless
Independent Living
Dependent Living
HOUSING / LIVING ARRANGEMENT
Employment Status Unknown
Not in Labor Force
Unemployed
Employed
Referral Source Unknown
Other
Court / Criminal Justice
Health Care Provider
Mental Health Provider
School
Self / Family / Friend
Education Level Unknown
Bachelor or Advanced Degree
Associate Degree or Some College
High School Grad or G.E.D.
Less than High School Diploma
Commitment Type Unknown
Sexual Predatory
Criminal
Civil
Voluntary
TREATMENT REFERRAL SOURCE
EMPLOYMENT
EDUCATION
TYPE OF COMMITMENT
Age Unknown
55 to 59
50 to 54
60 and Over
30 to 34
25 to 29
18 to 24
14 to 17
10 to 13
6 to 9
Under 6
40 to 44
35 to 39
45 to 49
AGE
Hearing Impaired
Past or Current Military Service23
89
Race/Ethnicity Unknown
Other Race
Hispanic
Asian / Pacific Islander
Native American / Alaskan
African American
Caucasian
0
183
84
*
12
230
2,256
GENDERMale
Female 1,285
1,398
Diagnosis Unknown
Other Disorders
Sexual Disorders
Schizophrenia and Psychotic Disorders
Personality Disorders
Depressive Mood Disorders
Impulse Control and Conduct DisordersDevelopmental and Age Related Disorders
Trauma and Stress Related Disorders
Anxiety and Fear Disorders
Bipolar Mood Disorders
DIAGNOSIS CATEGORY
The profiles below summarize individuals who received clinical services from the Division of Behavioral Health psychiatric programs.Individuals are counted only once based on their first treatment episode of the fiscal year. Information that was not reported is listed asunknown. An asterisk (*) in a data cell indicates the count was fewer than five (5) and suppressed to avoid disclosing identifying information.
230
228
198
56
229
249
194
208
200
245
179
265
202
1
Northwest
179,825
183,003
MENTAL HEALTH SERVICE AREA 1
1,203
753
275
65
373
667
93
2,939
17
151
25
624
657
1,159
608
405
300
558
14
898
1,231
173
385
455
412
323
63
156
220
456
543
477
1,036
475
311
241
480
12
824
48
38
197
264
221
299
302
297
213
#Name?
Page G-122
MENTAL ILLNESS TREATMENT SERVICES -- DIVISION OF BEHAVIORAL HEALTH
FY2018 FY2017
RACE / ETHNICITY
TREATMENT ACCOMMODATION
2019 Status Report on Missouri's Substance Use and Mental Health
13387
390
1,778 1,854299
237
249
276
240
152
*
23
2,6833,132NUMBER SERVED
PLANNING REGION
PSYCHIATRIC SERVICE AREA
2018 POPULATION ESTIMATE
CENSUS 2010
FY2019 FY2018 FY2017
Individuals who received psychiatric services had the following types ofdisorders. The total number of diagnoses is larger than the numberserved because some individuals had more than one type of disorder.
2,566
219
8
*
74
1,269
1,086
322
71
199
0
383
2,505
15
148
909
164
411
525
387
280
*
*
9
667
606
1,158
534
366
281
534
14
1,019
59
364
313
361
1,556
127
1,343
283
97
801 798
286 160
FY2018 FY2017
1,750
1,382
Gender Unknown 00
000
0
1,266
1,566
2,832
227
222
223
218
279
0
154
FY2019
37
81
63
6
5
209
2,456
207
255
238
272
195
280
187
29
FY2019
310
669
79
300
1,474
19
*
146
1,632
475
728
230
242
193
116
397
313
112
1,555
150
9
2,653
58
267
1,160
872
Total Disorders Diagnosed 5,2994,834 5,602
Missouri Department of Mental Health, Division of Behavioral Health

Total Individuals Served
Housing Unknown
Other
Homeless
Independent Living
Dependent Living
HOUSING / LIVING ARRANGEMENT
Employment Status Unknown
Not in Labor Force
Unemployed
Employed
Referral Source Unknown
Other
Court / Criminal Justice
Health Care Provider
Mental Health Provider
School
Self / Family / Friend
Education Level Unknown
Bachelor or Advanced Degree
Associate Degree or Some College
High School Grad or G.E.D.
Less than High School Diploma
Commitment Type Unknown
Sexual Predatory
Criminal
Civil
Voluntary
TREATMENT REFERRAL SOURCE
EMPLOYMENT
EDUCATION
TYPE OF COMMITMENT
Age Unknown
55 to 59
50 to 54
60 and Over
30 to 34
25 to 29
18 to 24
14 to 17
10 to 13
6 to 9
Under 6
40 to 44
35 to 39
45 to 49
AGE
Hearing Impaired
Past or Current Military Service104
268
Race/Ethnicity Unknown
Other Race
Hispanic
Asian / Pacific Islander
Native American / Alaskan
African American
Caucasian
10
1,297
608
53
60
4,973
6,233
GENDERMale
Female 6,440
6,175
Diagnosis Unknown
Other Disorders
Sexual Disorders
Schizophrenia and Psychotic Disorders
Personality Disorders
Depressive Mood Disorders
Impulse Control and Conduct DisordersDevelopmental and Age Related Disorders
Trauma and Stress Related Disorders
Anxiety and Fear Disorders
Bipolar Mood Disorders
DIAGNOSIS CATEGORY
The profiles below summarize individuals who received clinical services from the Division of Behavioral Health psychiatric programs.Individuals are counted only once based on their first treatment episode of the fiscal year. Information that was not reported is listed asunknown. An asterisk (*) in a data cell indicates the count was fewer than five (5) and suppressed to avoid disclosing identifying information.
1,148
1,096
1,006
71
669
855
1,001
1,073
998
1,028
1,135
1,345
1,191
2, 3, 4, 5
Northwest
700,307
674,158
MENTAL HEALTH SERVICE AREAS 2-5
4,632
3,656
1,742
507
946
2,438
245
12,024
47
130
140
2,586
2,421
5,354
1,971
1,019
778
2,712
28
3,021
6,200
192
1,526
1,900
280
2,028
1,218
732
1,074
2,665
2,813
2,315
5,472
1,816
883
768
2,646
29
3,163
1,663
81
543
791
842
963
985
1,035
1,284
#Name?
Page G-123
MENTAL ILLNESS TREATMENT SERVICES -- DIVISION OF BEHAVIORAL HEALTH
FY2018 FY2017
RACE / ETHNICITY
TREATMENT ACCOMMODATION
2019 Status Report on Missouri's Substance Use and Mental Health
1,2171,384
2,078
8,068 8,1441,114
979
1,101
1,279
1,264
138
8
52
12,62612,261NUMBER SERVED
PLANNING REGION
PSYCHIATRIC SERVICE AREA
2018 POPULATION ESTIMATE
CENSUS 2010
FY2019 FY2018 FY2017
Individuals who received psychiatric services had the following types ofdisorders. The total number of diagnoses is larger than the numberserved because some individuals had more than one type of disorder.
5,845
4,925
49
46
625
4,401
3,881
1,665
445
1,284
0
1,869
12,413
54
143
5,931
224
1,610
2,050
524
2,282
17
7
21
2,724
2,310
5,408
1,718
915
801
2,661
27
3,099
1,770
1,231
812
1,447
6,314
1,051
6,650
1,444
967
2,752 3,175
700 398
FY2018 FY2017
6,109
6,152
Gender Unknown 110
1000
0
6,261
6,273
12,534
1,234
1,190
1,100
987
1,120
0
1,284
FY2019
214
221
628
48
46
5,089
6,065
1,416
1,106
1,055
989
871
836
578
52
FY2019
652
2,860
1,128
1,431
6,463
54
8
123
8,473
1,807
2,264
974
823
1,870
265
2,068
1,427
251
6,531
137
42
12,293
442
1,658
4,474
4,153
Total Disorders Diagnosed 22,32522,952 22,664
Missouri Department of Mental Health, Division of Behavioral Health

Total Individuals Served
Housing Unknown
Other
Homeless
Independent Living
Dependent Living
HOUSING / LIVING ARRANGEMENT
Employment Status Unknown
Not in Labor Force
Unemployed
Employed
Referral Source Unknown
Other
Court / Criminal Justice
Health Care Provider
Mental Health Provider
School
Self / Family / Friend
Education Level Unknown
Bachelor or Advanced Degree
Associate Degree or Some College
High School Grad or G.E.D.
Less than High School Diploma
Commitment Type Unknown
Sexual Predatory
Criminal
Civil
Voluntary
TREATMENT REFERRAL SOURCE
EMPLOYMENT
EDUCATION
TYPE OF COMMITMENT
Age Unknown
55 to 59
50 to 54
60 and Over
30 to 34
25 to 29
18 to 24
14 to 17
10 to 13
6 to 9
Under 6
40 to 44
35 to 39
45 to 49
AGE
Hearing Impaired
Past or Current Military Service27
56
Race/Ethnicity Unknown
Other Race
Hispanic
Asian / Pacific Islander
Native American / Alaskan
African American
Caucasian
*
302
157
20
20
256
3,036
GENDERMale
Female 2,098
1,536
Diagnosis Unknown
Other Disorders
Sexual Disorders
Schizophrenia and Psychotic Disorders
Personality Disorders
Depressive Mood Disorders
Impulse Control and Conduct DisordersDevelopmental and Age Related Disorders
Trauma and Stress Related Disorders
Anxiety and Fear Disorders
Bipolar Mood Disorders
DIAGNOSIS CATEGORY
The profiles below summarize individuals who received clinical services from the Division of Behavioral Health psychiatric programs.Individuals are counted only once based on their first treatment episode of the fiscal year. Information that was not reported is listed asunknown. An asterisk (*) in a data cell indicates the count was fewer than five (5) and suppressed to avoid disclosing identifying information.
292
341
262
33
173
236
297
322
304
350
347
373
304
6
Northwest
372,233
334,755
MENTAL HEALTH SERVICE AREA 6
1,117
1,197
702
242
261
350
51
3,704
0
11
14
1,476
1,214
1,984
749
328
726
594
8
1,153
3,465
41
43
129
6
42
344
209
259
312
1,398
1,083
1,851
605
266
595
588
7
1,112
200
13
153
226
249
351
305
297
422
#Name?
Page G-124
MENTAL ILLNESS TREATMENT SERVICES -- DIVISION OF BEHAVIORAL HEALTH
FY2018 FY2017
RACE / ETHNICITY
TREATMENT ACCOMMODATION
2019 Status Report on Missouri's Substance Use and Mental Health
106164
375
2,882 2,853351
310
340
387
334
12
*
19
3,6353,738NUMBER SERVED
PLANNING REGION
PSYCHIATRIC SERVICE AREA
2018 POPULATION ESTIMATE
CENSUS 2010
FY2019 FY2018 FY2017
Individuals who received psychiatric services had the following types ofdisorders. The total number of diagnoses is larger than the numberserved because some individuals had more than one type of disorder.
3,095
239
20
26
180
1,094
1,265
728
261
350
0
390
3,616
*
14
3,330
40
47
141
27
48
*
*
*
1,404
1,133
1,999
642
264
645
600
6
1,156
263
201
245
523
2,257
92
2,204
446
86
694 788
172 100
FY2018 FY2017
1,591
2,147
Gender Unknown *0
*00
0
1,953
1,478
3,431
322
322
308
285
308
0
312
FY2019
62
38
165
23
18
252
2,826
433
248
272
300
251
234
129
19
FY2019
176
664
97
489
2,005
15
5
14
2,678
283
308
233
212
42
7
119
57
51
3,141
10
*
3,400
248
645
1,036
1,219
Total Disorders Diagnosed 8,6827,869 8,313
Missouri Department of Mental Health, Division of Behavioral Health
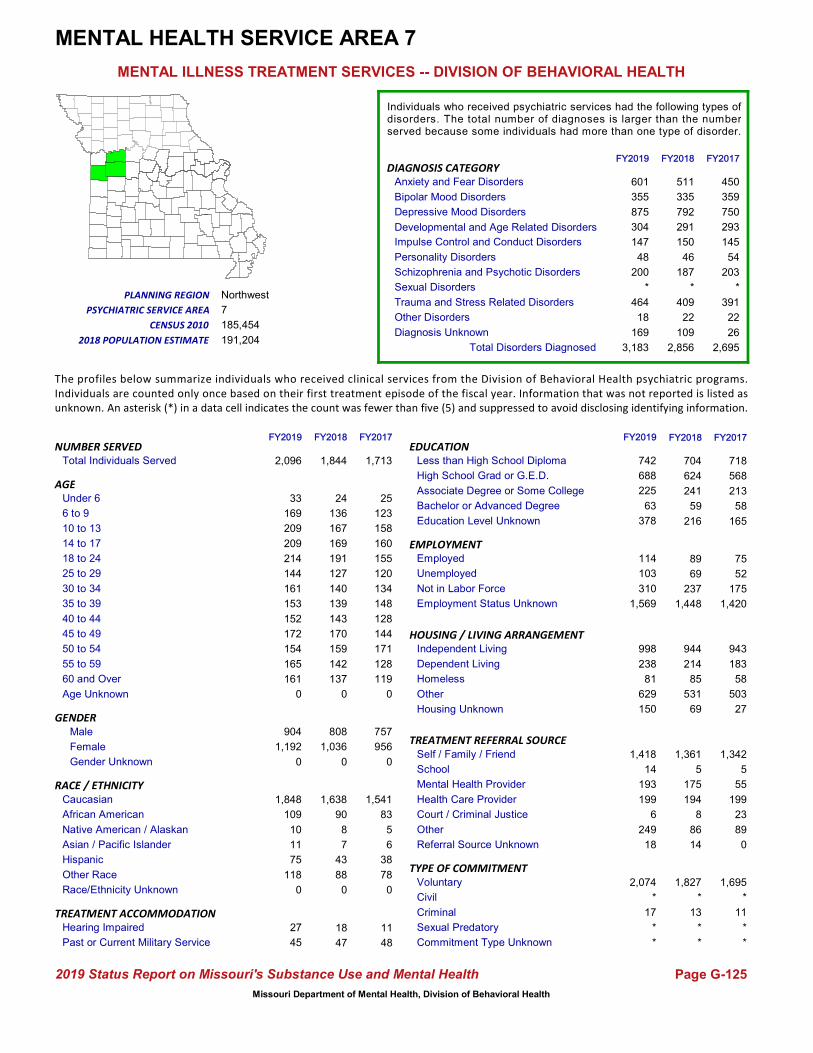
Total Individuals Served
Housing Unknown
Other
Homeless
Independent Living
Dependent Living
HOUSING / LIVING ARRANGEMENT
Employment Status Unknown
Not in Labor Force
Unemployed
Employed
Referral Source Unknown
Other
Court / Criminal Justice
Health Care Provider
Mental Health Provider
School
Self / Family / Friend
Education Level Unknown
Bachelor or Advanced Degree
Associate Degree or Some College
High School Grad or G.E.D.
Less than High School Diploma
Commitment Type Unknown
Sexual Predatory
Criminal
Civil
Voluntary
TREATMENT REFERRAL SOURCE
EMPLOYMENT
EDUCATION
TYPE OF COMMITMENT
Age Unknown
55 to 59
50 to 54
60 and Over
30 to 34
25 to 29
18 to 24
14 to 17
10 to 13
6 to 9
Under 6
40 to 44
35 to 39
45 to 49
AGE
Hearing Impaired
Past or Current Military Service11
48
Race/Ethnicity Unknown
Other Race
Hispanic
Asian / Pacific Islander
Native American / Alaskan
African American
Caucasian
0
78
38
6
5
83
1,541
GENDERMale
Female 956
757
Diagnosis Unknown
Other Disorders
Sexual Disorders
Schizophrenia and Psychotic Disorders
Personality Disorders
Depressive Mood Disorders
Impulse Control and Conduct DisordersDevelopmental and Age Related Disorders
Trauma and Stress Related Disorders
Anxiety and Fear Disorders
Bipolar Mood Disorders
DIAGNOSIS CATEGORY
The profiles below summarize individuals who received clinical services from the Division of Behavioral Health psychiatric programs.Individuals are counted only once based on their first treatment episode of the fiscal year. Information that was not reported is listed asunknown. An asterisk (*) in a data cell indicates the count was fewer than five (5) and suppressed to avoid disclosing identifying information.
144
148
128
25
123
158
160
155
120
134
119
171
128
7
Northwest
191,204
185,454
MENTAL HEALTH SERVICE AREA 7
718
568
213
58
69
237
47
1,827
*
13
18
450
359
750
293
145
54
203
*
391
1,361
5
175
194
8
86
22
75
52
175
601
355
875
304
147
48
200
*
464
18
24
136
167
169
191
127
140
137
#Name?
Page G-125
MENTAL ILLNESS TREATMENT SERVICES -- DIVISION OF BEHAVIORAL HEALTH
FY2018 FY2017
RACE / ETHNICITY
TREATMENT ACCOMMODATION
2019 Status Report on Missouri's Substance Use and Mental Health
26169
165
1,448 1,420139
143
170
159
142
14
*
*
1,7131,844NUMBER SERVED
PLANNING REGION
PSYCHIATRIC SERVICE AREA
2018 POPULATION ESTIMATE
CENSUS 2010
FY2019 FY2018 FY2017
Individuals who received psychiatric services had the following types ofdisorders. The total number of diagnoses is larger than the numberserved because some individuals had more than one type of disorder.
1,638
90
8
7
43
704
624
241
59
88
0
216
1,695
*
11
1,342
5
55
199
23
89
0
*
*
511
335
792
291
150
46
187
*
409
22
109
89
214
944
85
943
183
58
531 503
69 27
FY2018 FY2017
808
1,036
Gender Unknown 00
000
0
1,192
904
2,096
165
154
172
152
153
0
118
FY2019
27
45
75
11
10
109
1,848
161
161
144
214
209
209
169
33
FY2019
150
629
81
238
998
*
*
18
1,569
378
310
103
114
249
6
199
193
14
1,418
17
*
2,074
63
225
742
688
Total Disorders Diagnosed 2,6953,183 2,856
Missouri Department of Mental Health, Division of Behavioral Health

Total Individuals Served
Housing Unknown
Other
Homeless
Independent Living
Dependent Living
HOUSING / LIVING ARRANGEMENT
Employment Status Unknown
Not in Labor Force
Unemployed
Employed
Referral Source Unknown
Other
Court / Criminal Justice
Health Care Provider
Mental Health Provider
School
Self / Family / Friend
Education Level Unknown
Bachelor or Advanced Degree
Associate Degree or Some College
High School Grad or G.E.D.
Less than High School Diploma
Commitment Type Unknown
Sexual Predatory
Criminal
Civil
Voluntary
TREATMENT REFERRAL SOURCE
EMPLOYMENT
EDUCATION
TYPE OF COMMITMENT
Age Unknown
55 to 59
50 to 54
60 and Over
30 to 34
25 to 29
18 to 24
14 to 17
10 to 13
6 to 9
Under 6
40 to 44
35 to 39
45 to 49
AGE
Hearing Impaired
Past or Current Military Service10
25
Race/Ethnicity Unknown
Other Race
Hispanic
Asian / Pacific Islander
Native American / Alaskan
African American
Caucasian
0
58
30
*
*
8
1,280
GENDERMale
Female 724
626
Diagnosis Unknown
Other Disorders
Sexual Disorders
Schizophrenia and Psychotic Disorders
Personality Disorders
Depressive Mood Disorders
Impulse Control and Conduct DisordersDevelopmental and Age Related Disorders
Trauma and Stress Related Disorders
Anxiety and Fear Disorders
Bipolar Mood Disorders
DIAGNOSIS CATEGORY
The profiles below summarize individuals who received clinical services from the Division of Behavioral Health psychiatric programs.Individuals are counted only once based on their first treatment episode of the fiscal year. Information that was not reported is listed asunknown. An asterisk (*) in a data cell indicates the count was fewer than five (5) and suppressed to avoid disclosing identifying information.
114
100
118
15
87
109
172
93
82
90
130
127
113
8A
Southwest
81,814
82,114
MENTAL HEALTH SERVICE AREA 8A
641
394
164
47
92
145
23
1,338
16
6
8
422
370
685
271
238
261
220
6
432
708
85
79
239
60
184
49
68
49
110
385
270
654
260
242
184
181
7
458
30
21
101
129
161
96
91
98
116
#Name?
Page G-126
MENTAL ILLNESS TREATMENT SERVICES -- DIVISION OF BEHAVIORAL HEALTH
FY2018 FY2017
RACE / ETHNICITY
TREATMENT ACCOMMODATION
2019 Status Report on Missouri's Substance Use and Mental Health
6060
106
1,041 1,12598
93
119
129
113
9
*
*
1,3501,365NUMBER SERVED
PLANNING REGION
PSYCHIATRIC SERVICE AREA
2018 POPULATION ESTIMATE
CENSUS 2010
FY2019 FY2018 FY2017
Individuals who received psychiatric services had the following types ofdisorders. The total number of diagnoses is larger than the numberserved because some individuals had more than one type of disorder.
1,281
10
*
*
25
616
395
139
30
60
0
185
1,320
21
7
685
79
95
222
50
218
*
*
*
415
329
716
274
252
227
217
7
463
36
66
86
92
725
15
726
88
15
444 487
88 34
FY2018 FY2017
651
714
Gender Unknown 00
000
0
609
613
1,222
113
103
105
76
79
0
52
FY2019
23
18
21
*
*
13
1,153
96
86
79
93
124
156
103
9
FY2019
60
438
19
84
621
*
*
7
1,022
75
88
68
44
164
89
212
77
83
589
5
12
1,202
24
125
620
378
Total Disorders Diagnosed 3,0142,731 3,002
Missouri Department of Mental Health, Division of Behavioral Health

Total Individuals Served
Housing Unknown
Other
Homeless
Independent Living
Dependent Living
HOUSING / LIVING ARRANGEMENT
Employment Status Unknown
Not in Labor Force
Unemployed
Employed
Referral Source Unknown
Other
Court / Criminal Justice
Health Care Provider
Mental Health Provider
School
Self / Family / Friend
Education Level Unknown
Bachelor or Advanced Degree
Associate Degree or Some College
High School Grad or G.E.D.
Less than High School Diploma
Commitment Type Unknown
Sexual Predatory
Criminal
Civil
Voluntary
TREATMENT REFERRAL SOURCE
EMPLOYMENT
EDUCATION
TYPE OF COMMITMENT
Age Unknown
55 to 59
50 to 54
60 and Over
30 to 34
25 to 29
18 to 24
14 to 17
10 to 13
6 to 9
Under 6
40 to 44
35 to 39
45 to 49
AGE
Hearing Impaired
Past or Current Military Service7
42
Race/Ethnicity Unknown
Other Race
Hispanic
Asian / Pacific Islander
Native American / Alaskan
African American
Caucasian
0
59
22
*
5
13
1,601
GENDERMale
Female 929
753
Diagnosis Unknown
Other Disorders
Sexual Disorders
Schizophrenia and Psychotic Disorders
Personality Disorders
Depressive Mood Disorders
Impulse Control and Conduct DisordersDevelopmental and Age Related Disorders
Trauma and Stress Related Disorders
Anxiety and Fear Disorders
Bipolar Mood Disorders
DIAGNOSIS CATEGORY
The profiles below summarize individuals who received clinical services from the Division of Behavioral Health psychiatric programs.Individuals are counted only once based on their first treatment episode of the fiscal year. Information that was not reported is listed asunknown. An asterisk (*) in a data cell indicates the count was fewer than five (5) and suppressed to avoid disclosing identifying information.
148
145
137
14
97
118
124
139
120
161
144
190
145
8B
Southwest
110,987
112,950
MENTAL HEALTH SERVICE AREA 8B
752
560
253
31
69
202
41
1,740
5
8
15
499
401
800
176
172
84
232
*
401
1,182
6
161
203
19
185
12
56
67
159
606
375
927
226
185
71
249
*
459
13
17
97
143
136
152
131
129
152
#Name?
Page G-127
MENTAL ILLNESS TREATMENT SERVICES -- DIVISION OF BEHAVIORAL HEALTH
FY2018 FY2017
RACE / ETHNICITY
TREATMENT ACCOMMODATION
2019 Status Report on Missouri's Substance Use and Mental Health
22110
89
1,437 1,403180
124
150
178
179
12
*
11
1,6821,768NUMBER SERVED
PLANNING REGION
PSYCHIATRIC SERVICE AREA
2018 POPULATION ESTIMATE
CENSUS 2010
FY2019 FY2018 FY2017
Individuals who received psychiatric services had the following types ofdisorders. The total number of diagnoses is larger than the numberserved because some individuals had more than one type of disorder.
1,682
10
7
*
19
785
576
242
35
55
0
130
1,657
6
14
1,124
5
78
190
41
243
0
*
*
554
391
820
194
184
73
243
5
447
13
54
60
210
952
51
946
190
52
466 451
89 43
FY2018 FY2017
804
964
Gender Unknown 00
000
0
1,094
947
2,041
188
188
170
144
190
0
80
FY2019
24
43
37
*
11
20
1,927
185
153
138
180
186
186
117
16
FY2019
158
576
61
235
1,011
10
7
19
1,566
223
295
86
94
296
18
203
155
7
1,343
14
*
2,009
41
258
822
697
Total Disorders Diagnosed 2,8033,225 2,978
Missouri Department of Mental Health, Division of Behavioral Health
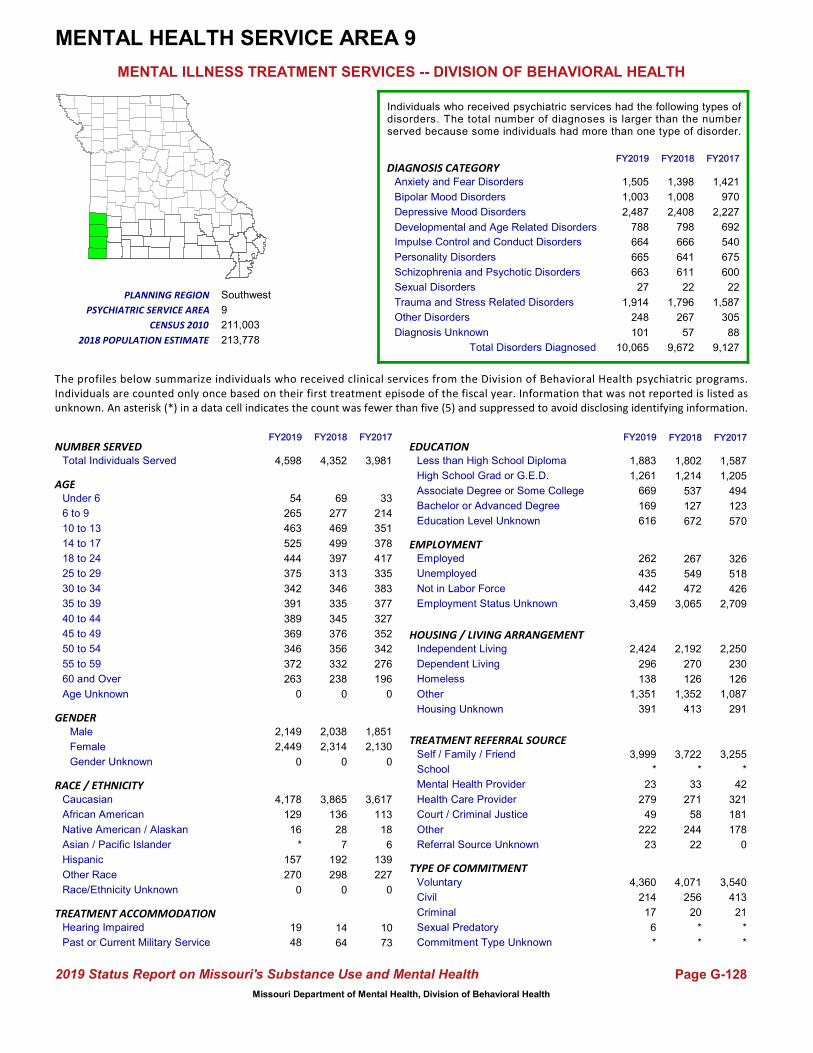
Total Individuals Served
Housing Unknown
Other
Homeless
Independent Living
Dependent Living
HOUSING / LIVING ARRANGEMENT
Employment Status Unknown
Not in Labor Force
Unemployed
Employed
Referral Source Unknown
Other
Court / Criminal Justice
Health Care Provider
Mental Health Provider
School
Self / Family / Friend
Education Level Unknown
Bachelor or Advanced Degree
Associate Degree or Some College
High School Grad or G.E.D.
Less than High School Diploma
Commitment Type Unknown
Sexual Predatory
Criminal
Civil
Voluntary
TREATMENT REFERRAL SOURCE
EMPLOYMENT
EDUCATION
TYPE OF COMMITMENT
Age Unknown
55 to 59
50 to 54
60 and Over
30 to 34
25 to 29
18 to 24
14 to 17
10 to 13
6 to 9
Under 6
40 to 44
35 to 39
45 to 49
AGE
Hearing Impaired
Past or Current Military Service10
73
Race/Ethnicity Unknown
Other Race
Hispanic
Asian / Pacific Islander
Native American / Alaskan
African American
Caucasian
0
227
139
6
18
113
3,617
GENDERMale
Female 2,130
1,851
Diagnosis Unknown
Other Disorders
Sexual Disorders
Schizophrenia and Psychotic Disorders
Personality Disorders
Depressive Mood Disorders
Impulse Control and Conduct DisordersDevelopmental and Age Related Disorders
Trauma and Stress Related Disorders
Anxiety and Fear Disorders
Bipolar Mood Disorders
DIAGNOSIS CATEGORY
The profiles below summarize individuals who received clinical services from the Division of Behavioral Health psychiatric programs.Individuals are counted only once based on their first treatment episode of the fiscal year. Information that was not reported is listed asunknown. An asterisk (*) in a data cell indicates the count was fewer than five (5) and suppressed to avoid disclosing identifying information.
352
377
327
33
214
351
378
417
335
383
196
342
276
9
Southwest
213,778
211,003
MENTAL HEALTH SERVICE AREA 9
1,587
1,205
494
123
549
472
64
4,071
256
20
14
1,421
970
2,227
692
540
675
600
22
1,587
3,722
*
33
271
58
244
305
326
518
426
1,505
1,003
2,487
788
664
665
663
27
1,914
248
69
277
469
499
397
313
346
238
#Name?
Page G-128
MENTAL ILLNESS TREATMENT SERVICES -- DIVISION OF BEHAVIORAL HEALTH
FY2018 FY2017
RACE / ETHNICITY
TREATMENT ACCOMMODATION
2019 Status Report on Missouri's Substance Use and Mental Health
88101
570
3,065 2,709335
345
376
356
332
22
*
*
3,9814,352NUMBER SERVED
PLANNING REGION
PSYCHIATRIC SERVICE AREA
2018 POPULATION ESTIMATE
CENSUS 2010
FY2019 FY2018 FY2017
Individuals who received psychiatric services had the following types ofdisorders. The total number of diagnoses is larger than the numberserved because some individuals had more than one type of disorder.
3,865
136
28
7
192
1,802
1,214
537
127
298
0
672
3,540
413
21
3,255
*
42
321
181
178
0
*
*
1,398
1,008
2,408
798
666
641
611
22
1,796
267
57
267
270
2,192
126
2,250
230
126
1,352 1,087
413 291
FY2018 FY2017
2,038
2,314
Gender Unknown 00
000
0
2,449
2,149
4,598
372
346
369
389
391
0
270
FY2019
19
48
157
*
16
129
4,178
263
342
375
444
525
463
265
54
FY2019
391
1,351
138
296
2,424
*
6
23
3,459
616
442
435
262
222
49
279
23
*
3,999
17
214
4,360
169
669
1,883
1,261
Total Disorders Diagnosed 9,12710,065 9,672
Missouri Department of Mental Health, Division of Behavioral Health

Total Individuals Served
Housing Unknown
Other
Homeless
Independent Living
Dependent Living
HOUSING / LIVING ARRANGEMENT
Employment Status Unknown
Not in Labor Force
Unemployed
Employed
Referral Source Unknown
Other
Court / Criminal Justice
Health Care Provider
Mental Health Provider
School
Self / Family / Friend
Education Level Unknown
Bachelor or Advanced Degree
Associate Degree or Some College
High School Grad or G.E.D.
Less than High School Diploma
Commitment Type Unknown
Sexual Predatory
Criminal
Civil
Voluntary
TREATMENT REFERRAL SOURCE
EMPLOYMENT
EDUCATION
TYPE OF COMMITMENT
Age Unknown
55 to 59
50 to 54
60 and Over
30 to 34
25 to 29
18 to 24
14 to 17
10 to 13
6 to 9
Under 6
40 to 44
35 to 39
45 to 49
AGE
Hearing Impaired
Past or Current Military Service32
146
Race/Ethnicity Unknown
Other Race
Hispanic
Asian / Pacific Islander
Native American / Alaskan
African American
Caucasian
0
537
117
10
14
207
4,066
GENDERMale
Female 2,441
2,393
Diagnosis Unknown
Other Disorders
Sexual Disorders
Schizophrenia and Psychotic Disorders
Personality Disorders
Depressive Mood Disorders
Impulse Control and Conduct DisordersDevelopmental and Age Related Disorders
Trauma and Stress Related Disorders
Anxiety and Fear Disorders
Bipolar Mood Disorders
DIAGNOSIS CATEGORY
The profiles below summarize individuals who received clinical services from the Division of Behavioral Health psychiatric programs.Individuals are counted only once based on their first treatment episode of the fiscal year. Information that was not reported is listed asunknown. An asterisk (*) in a data cell indicates the count was fewer than five (5) and suppressed to avoid disclosing identifying information.
466
470
424
123
340
363
301
318
307
420
371
531
400
10
Southwest
554,579
520,589
MENTAL HEALTH SERVICE AREA 10
2,064
1,450
897
228
229
736
113
4,474
*
35
42
1,565
1,223
2,117
805
725
659
1,030
11
1,588
2,098
47
262
1,247
234
639
103
154
154
463
1,702
943
2,152
835
723
495
930
15
1,721
94
116
295
320
242
294
309
384
370
#Name?
Page G-129
MENTAL ILLNESS TREATMENT SERVICES -- DIVISION OF BEHAVIORAL HEALTH
FY2018 FY2017
RACE / ETHNICITY
TREATMENT ACCOMMODATION
2019 Status Report on Missouri's Substance Use and Mental Health
265516
195
3,445 4,063416
405
464
497
455
40
*
52
4,8344,567NUMBER SERVED
PLANNING REGION
PSYCHIATRIC SERVICE AREA
2018 POPULATION ESTIMATE
CENSUS 2010
FY2019 FY2018 FY2017
Individuals who received psychiatric services had the following types ofdisorders. The total number of diagnoses is larger than the numberserved because some individuals had more than one type of disorder.
3,814
200
13
11
103
1,813
1,402
792
190
494
0
371
4,760
19
45
2,253
41
295
1,249
294
700
*
*
6
1,673
1,102
2,068
726
646
605
982
11
1,603
100
218
157
419
2,397
214
2,507
419
246
1,217 1,528
320 134
FY2018 FY2017
2,197
2,370
Gender Unknown 00
000
0
2,615
2,643
5,258
433
435
427
353
410
0
551
FY2019
73
86
158
8
24
262
4,413
337
351
317
308
563
618
543
163
FY2019
430
1,979
250
564
2,034
41
*
49
3,600
1,060
1,107
334
217
688
217
1,211
220
618
2,256
42
13
5,158
159
615
2,198
1,226
Total Disorders Diagnosed 10,09110,126 9,734
Missouri Department of Mental Health, Division of Behavioral Health

Total Individuals Served
Housing Unknown
Other
Homeless
Independent Living
Dependent Living
HOUSING / LIVING ARRANGEMENT
Employment Status Unknown
Not in Labor Force
Unemployed
Employed
Referral Source Unknown
Other
Court / Criminal Justice
Health Care Provider
Mental Health Provider
School
Self / Family / Friend
Education Level Unknown
Bachelor or Advanced Degree
Associate Degree or Some College
High School Grad or G.E.D.
Less than High School Diploma
Commitment Type Unknown
Sexual Predatory
Criminal
Civil
Voluntary
TREATMENT REFERRAL SOURCE
EMPLOYMENT
EDUCATION
TYPE OF COMMITMENT
Age Unknown
55 to 59
50 to 54
60 and Over
30 to 34
25 to 29
18 to 24
14 to 17
10 to 13
6 to 9
Under 6
40 to 44
35 to 39
45 to 49
AGE
Hearing Impaired
Past or Current Military Service18
45
Race/Ethnicity Unknown
Other Race
Hispanic
Asian / Pacific Islander
Native American / Alaskan
African American
Caucasian
0
144
61
*
9
202
2,166
GENDERMale
Female 1,430
1,091
Diagnosis Unknown
Other Disorders
Sexual Disorders
Schizophrenia and Psychotic Disorders
Personality Disorders
Depressive Mood Disorders
Impulse Control and Conduct DisordersDevelopmental and Age Related Disorders
Trauma and Stress Related Disorders
Anxiety and Fear Disorders
Bipolar Mood Disorders
DIAGNOSIS CATEGORY
The profiles below summarize individuals who received clinical services from the Division of Behavioral Health psychiatric programs.Individuals are counted only once based on their first treatment episode of the fiscal year. Information that was not reported is listed asunknown. An asterisk (*) in a data cell indicates the count was fewer than five (5) and suppressed to avoid disclosing identifying information.
229
199
187
38
214
242
211
164
160
209
184
275
210
11
Central
249,388
246,463
MENTAL HEALTH SERVICE AREA 11
1,200
761
331
76
81
223
38
2,634
*
18
32
761
481
1,076
351
256
134
369
9
644
1,768
9
207
341
60
255
31
72
81
216
758
421
1,133
381
248
131
357
10
679
26
40
224
307
284
181
157
191
207
#Name?
Page G-130
MENTAL ILLNESS TREATMENT SERVICES -- DIVISION OF BEHAVIORAL HEALTH
FY2018 FY2017
RACE / ETHNICITY
TREATMENT ACCOMMODATION
2019 Status Report on Missouri's Substance Use and Mental Health
26197
157
2,274 2,156203
169
234
250
213
20
*
*
2,5222,660NUMBER SERVED
PLANNING REGION
PSYCHIATRIC SERVICE AREA
2018 POPULATION ESTIMATE
CENSUS 2010
FY2019 FY2018 FY2017
Individuals who received psychiatric services had the following types ofdisorders. The total number of diagnoses is larger than the numberserved because some individuals had more than one type of disorder.
2,246
221
6
*
52
1,305
767
330
68
168
0
190
2,490
6
20
1,675
11
121
360
92
262
0
*
*
766
443
1,119
377
275
127
345
9
614
27
113
82
259
1,279
61
1,320
266
64
961 834
100 38
FY2018 FY2017
1,165
1,495
Gender Unknown *0
000
0
1,618
1,241
2,859
234
229
228
203
176
0
199
FY2019
50
35
94
*
11
241
2,405
237
195
173
228
333
359
207
57
FY2019
250
979
70
284
1,276
*
*
24
2,272
431
365
98
124
452
57
354
186
10
1,776
24
*
2,826
67
323
1,250
788
Total Disorders Diagnosed 4,1384,341 4,215
Missouri Department of Mental Health, Division of Behavioral Health
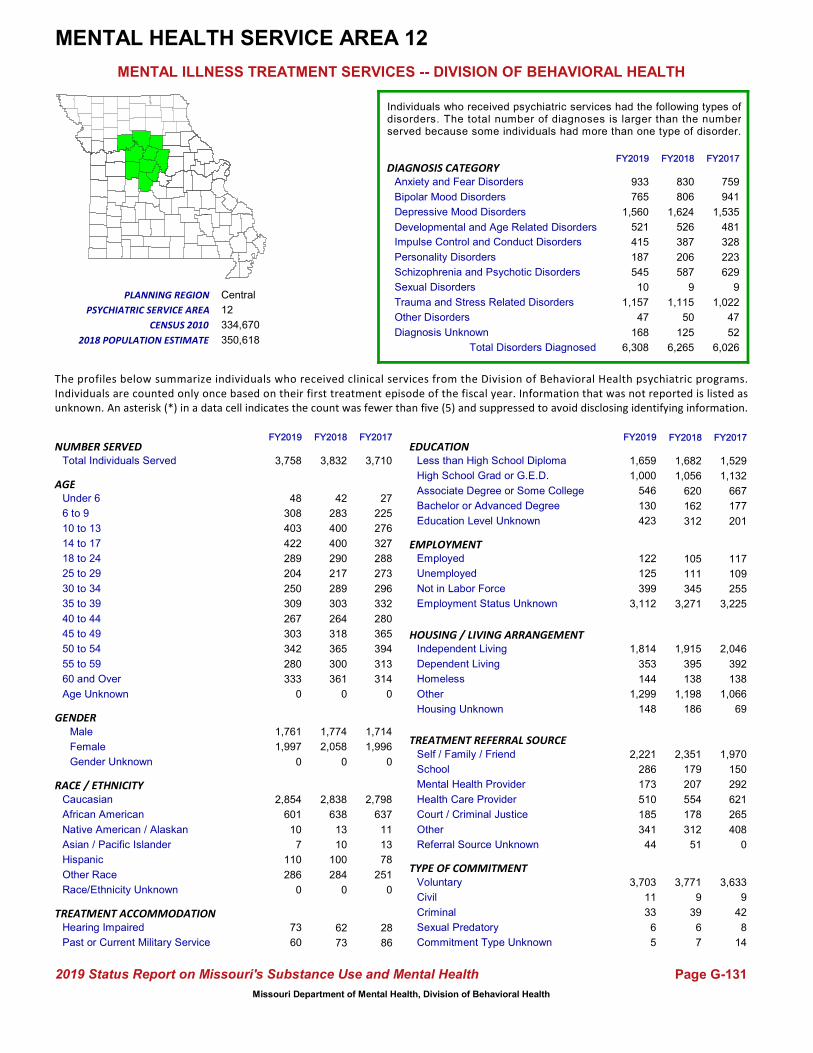
Total Individuals Served
Housing Unknown
Other
Homeless
Independent Living
Dependent Living
HOUSING / LIVING ARRANGEMENT
Employment Status Unknown
Not in Labor Force
Unemployed
Employed
Referral Source Unknown
Other
Court / Criminal Justice
Health Care Provider
Mental Health Provider
School
Self / Family / Friend
Education Level Unknown
Bachelor or Advanced Degree
Associate Degree or Some College
High School Grad or G.E.D.
Less than High School Diploma
Commitment Type Unknown
Sexual Predatory
Criminal
Civil
Voluntary
TREATMENT REFERRAL SOURCE
EMPLOYMENT
EDUCATION
TYPE OF COMMITMENT
Age Unknown
55 to 59
50 to 54
60 and Over
30 to 34
25 to 29
18 to 24
14 to 17
10 to 13
6 to 9
Under 6
40 to 44
35 to 39
45 to 49
AGE
Hearing Impaired
Past or Current Military Service28
86
Race/Ethnicity Unknown
Other Race
Hispanic
Asian / Pacific Islander
Native American / Alaskan
African American
Caucasian
0
251
78
13
11
637
2,798
GENDERMale
Female 1,996
1,714
Diagnosis Unknown
Other Disorders
Sexual Disorders
Schizophrenia and Psychotic Disorders
Personality Disorders
Depressive Mood Disorders
Impulse Control and Conduct DisordersDevelopmental and Age Related Disorders
Trauma and Stress Related Disorders
Anxiety and Fear Disorders
Bipolar Mood Disorders
DIAGNOSIS CATEGORY
The profiles below summarize individuals who received clinical services from the Division of Behavioral Health psychiatric programs.Individuals are counted only once based on their first treatment episode of the fiscal year. Information that was not reported is listed asunknown. An asterisk (*) in a data cell indicates the count was fewer than five (5) and suppressed to avoid disclosing identifying information.
365
332
280
27
225
276
327
288
273
296
314
394
313
12
Central
350,618
334,670
MENTAL HEALTH SERVICE AREA 12
1,529
1,132
667
177
111
345
73
3,771
9
39
62
759
941
1,535
481
328
223
629
9
1,022
2,351
179
207
554
178
312
47
117
109
255
933
765
1,560
521
415
187
545
10
1,157
47
42
283
400
400
290
217
289
361
#Name?
Page G-131
MENTAL ILLNESS TREATMENT SERVICES -- DIVISION OF BEHAVIORAL HEALTH
FY2018 FY2017
RACE / ETHNICITY
TREATMENT ACCOMMODATION
2019 Status Report on Missouri's Substance Use and Mental Health
52168
201
3,271 3,225303
264
318
365
300
51
6
7
3,7103,832NUMBER SERVED
PLANNING REGION
PSYCHIATRIC SERVICE AREA
2018 POPULATION ESTIMATE
CENSUS 2010
FY2019 FY2018 FY2017
Individuals who received psychiatric services had the following types ofdisorders. The total number of diagnoses is larger than the numberserved because some individuals had more than one type of disorder.
2,838
638
13
10
100
1,682
1,056
620
162
284
0
312
3,633
9
42
1,970
150
292
621
265
408
0
8
14
830
806
1,624
526
387
206
587
9
1,115
50
125
105
395
1,915
138
2,046
392
138
1,198 1,066
186 69
FY2018 FY2017
1,774
2,058
Gender Unknown 00
000
0
1,997
1,761
3,758
280
342
303
267
309
0
286
FY2019
73
60
110
7
10
601
2,854
333
250
204
289
422
403
308
48
FY2019
148
1,299
144
353
1,814
5
6
44
3,112
423
399
125
122
341
185
510
173
286
2,221
33
11
3,703
130
546
1,659
1,000
Total Disorders Diagnosed 6,0266,308 6,265
Missouri Department of Mental Health, Division of Behavioral Health

Total Individuals Served
Housing Unknown
Other
Homeless
Independent Living
Dependent Living
HOUSING / LIVING ARRANGEMENT
Employment Status Unknown
Not in Labor Force
Unemployed
Employed
Referral Source Unknown
Other
Court / Criminal Justice
Health Care Provider
Mental Health Provider
School
Self / Family / Friend
Education Level Unknown
Bachelor or Advanced Degree
Associate Degree or Some College
High School Grad or G.E.D.
Less than High School Diploma
Commitment Type Unknown
Sexual Predatory
Criminal
Civil
Voluntary
TREATMENT REFERRAL SOURCE
EMPLOYMENT
EDUCATION
TYPE OF COMMITMENT
Age Unknown
55 to 59
50 to 54
60 and Over
30 to 34
25 to 29
18 to 24
14 to 17
10 to 13
6 to 9
Under 6
40 to 44
35 to 39
45 to 49
AGE
Hearing Impaired
Past or Current Military Service9
63
Race/Ethnicity Unknown
Other Race
Hispanic
Asian / Pacific Islander
Native American / Alaskan
African American
Caucasian
0
62
35
0
5
26
1,973
GENDERMale
Female 1,195
871
Diagnosis Unknown
Other Disorders
Sexual Disorders
Schizophrenia and Psychotic Disorders
Personality Disorders
Depressive Mood Disorders
Impulse Control and Conduct DisordersDevelopmental and Age Related Disorders
Trauma and Stress Related Disorders
Anxiety and Fear Disorders
Bipolar Mood Disorders
DIAGNOSIS CATEGORY
The profiles below summarize individuals who received clinical services from the Division of Behavioral Health psychiatric programs.Individuals are counted only once based on their first treatment episode of the fiscal year. Information that was not reported is listed asunknown. An asterisk (*) in a data cell indicates the count was fewer than five (5) and suppressed to avoid disclosing identifying information.
172
154
116
40
142
208
233
201
160
176
166
146
152
13
Northwest
77,551
80,509
MENTAL HEALTH SERVICE AREA 13
850
755
246
60
48
86
45
2,153
*
*
6
728
526
1,019
367
268
206
156
6
670
1,187
104
69
399
153
245
26
108
97
97
893
581
1,147
418
264
196
149
5
774
26
54
164
254
225
197
160
153
194
#Name?
Page G-132
MENTAL ILLNESS TREATMENT SERVICES -- DIVISION OF BEHAVIORAL HEALTH
FY2018 FY2017
RACE / ETHNICITY
TREATMENT ACCOMMODATION
2019 Status Report on Missouri's Substance Use and Mental Health
4346
159
1,977 1,768172
129
162
145
160
9
0
8
2,0662,169NUMBER SERVED
PLANNING REGION
PSYCHIATRIC SERVICE AREA
2018 POPULATION ESTIMATE
CENSUS 2010
FY2019 FY2018 FY2017
Individuals who received psychiatric services had the following types ofdisorders. The total number of diagnoses is larger than the numberserved because some individuals had more than one type of disorder.
2,059
29
7
*
41
969
790
286
74
69
0
48
2,064
0
*
1,079
79
83
423
155
243
*
0
0
807
547
1,112
416
285
233
142
6
750
36
51
55
193
1,121
25
1,147
167
22
787 693
40 37
FY2018 FY2017
965
1,204
Gender Unknown 00
000
0
1,258
983
2,241
159
161
152
153
181
0
64
FY2019
23
35
36
*
5
32
2,139
204
148
176
194
265
235
164
49
FY2019
63
765
17
171
1,225
8
0
8
2,083
31
73
31
54
236
175
390
75
100
1,257
7
*
2,225
78
304
979
849
Total Disorders Diagnosed 4,0154,499 4,385
Missouri Department of Mental Health, Division of Behavioral Health

Total Individuals Served
Housing Unknown
Other
Homeless
Independent Living
Dependent Living
HOUSING / LIVING ARRANGEMENT
Employment Status Unknown
Not in Labor Force
Unemployed
Employed
Referral Source Unknown
Other
Court / Criminal Justice
Health Care Provider
Mental Health Provider
School
Self / Family / Friend
Education Level Unknown
Bachelor or Advanced Degree
Associate Degree or Some College
High School Grad or G.E.D.
Less than High School Diploma
Commitment Type Unknown
Sexual Predatory
Criminal
Civil
Voluntary
TREATMENT REFERRAL SOURCE
EMPLOYMENT
EDUCATION
TYPE OF COMMITMENT
Age Unknown
55 to 59
50 to 54
60 and Over
30 to 34
25 to 29
18 to 24
14 to 17
10 to 13
6 to 9
Under 6
40 to 44
35 to 39
45 to 49
AGE
Hearing Impaired
Past or Current Military Service*
63
Race/Ethnicity Unknown
Other Race
Hispanic
Asian / Pacific Islander
Native American / Alaskan
African American
Caucasian
0
98
18
*
7
180
1,861
GENDERMale
Female 1,080
1,068
Diagnosis Unknown
Other Disorders
Sexual Disorders
Schizophrenia and Psychotic Disorders
Personality Disorders
Depressive Mood Disorders
Impulse Control and Conduct DisordersDevelopmental and Age Related Disorders
Trauma and Stress Related Disorders
Anxiety and Fear Disorders
Bipolar Mood Disorders
DIAGNOSIS CATEGORY
The profiles below summarize individuals who received clinical services from the Division of Behavioral Health psychiatric programs.Individuals are counted only once based on their first treatment episode of the fiscal year. Information that was not reported is listed asunknown. An asterisk (*) in a data cell indicates the count was fewer than five (5) and suppressed to avoid disclosing identifying information.
167
168
140
46
201
226
236
162
142
180
151
175
154
14
Central
105,343
107,082
MENTAL HEALTH SERVICE AREA 14
1,090
745
178
47
73
141
53
2,369
0
13
10
345
690
679
505
251
80
349
*
366
496
7
191
310
52
1,333
13
90
53
123
420
640
763
580
268
78
338
5
429
14
45
231
309
286
207
136
194
164
#Name?
Page G-133
MENTAL ILLNESS TREATMENT SERVICES -- DIVISION OF BEHAVIORAL HEALTH
FY2018 FY2017
RACE / ETHNICITY
TREATMENT ACCOMMODATION
2019 Status Report on Missouri's Substance Use and Mental Health
1927
86
2,090 1,880169
155
154
169
180
13
*
15
2,1482,399NUMBER SERVED
PLANNING REGION
PSYCHIATRIC SERVICE AREA
2018 POPULATION ESTIMATE
CENSUS 2010
FY2019 FY2018 FY2017
Individuals who received psychiatric services had the following types ofdisorders. The total number of diagnoses is larger than the numberserved because some individuals had more than one type of disorder.
2,062
199
5
*
20
1,212
818
198
47
120
0
126
2,119
*
22
475
9
173
281
44
1,166
0
*
*
406
686
809
578
280
82
339
*
424
17
28
98
168
1,022
21
964
138
21
1,019 930
172 95
FY2018 FY2017
1,189
1,210
Gender Unknown 00
000
0
1,213
1,200
2,413
167
157
167
159
169
0
120
FY2019
20
49
15
*
5
192
2,095
189
172
142
190
278
335
234
54
FY2019
159
1,072
24
173
984
9
*
16
2,067
135
164
73
109
1,439
47
296
165
9
440
12
0
2,388
51
194
1,243
790
Total Disorders Diagnosed 3,3003,562 3,653
Missouri Department of Mental Health, Division of Behavioral Health

Total Individuals Served
Housing Unknown
Other
Homeless
Independent Living
Dependent Living
HOUSING / LIVING ARRANGEMENT
Employment Status Unknown
Not in Labor Force
Unemployed
Employed
Referral Source Unknown
Other
Court / Criminal Justice
Health Care Provider
Mental Health Provider
School
Self / Family / Friend
Education Level Unknown
Bachelor or Advanced Degree
Associate Degree or Some College
High School Grad or G.E.D.
Less than High School Diploma
Commitment Type Unknown
Sexual Predatory
Criminal
Civil
Voluntary
TREATMENT REFERRAL SOURCE
EMPLOYMENT
EDUCATION
TYPE OF COMMITMENT
Age Unknown
55 to 59
50 to 54
60 and Over
30 to 34
25 to 29
18 to 24
14 to 17
10 to 13
6 to 9
Under 6
40 to 44
35 to 39
45 to 49
AGE
Hearing Impaired
Past or Current Military Service17
41
Race/Ethnicity Unknown
Other Race
Hispanic
Asian / Pacific Islander
Native American / Alaskan
African American
Caucasian
0
89
25
*
*
130
1,662
GENDERMale
Female 938
946
Diagnosis Unknown
Other Disorders
Sexual Disorders
Schizophrenia and Psychotic Disorders
Personality Disorders
Depressive Mood Disorders
Impulse Control and Conduct DisordersDevelopmental and Age Related Disorders
Trauma and Stress Related Disorders
Anxiety and Fear Disorders
Bipolar Mood Disorders
DIAGNOSIS CATEGORY
The profiles below summarize individuals who received clinical services from the Division of Behavioral Health psychiatric programs.Individuals are counted only once based on their first treatment episode of the fiscal year. Information that was not reported is listed asunknown. An asterisk (*) in a data cell indicates the count was fewer than five (5) and suppressed to avoid disclosing identifying information.
129
159
151
11
129
188
208
156
141
158
155
164
135
15
Central
119,276
119,620
MENTAL HEALTH SERVICE AREA 15
842
602
221
52
57
175
38
1,621
*
64
22
298
451
737
426
220
184
292
47
377
1,046
13
134
113
32
264
24
65
48
177
236
331
565
348
198
143
246
47
306
13
17
123
200
198
118
132
138
137
#Name?
Page G-134
MENTAL ILLNESS TREATMENT SERVICES -- DIVISION OF BEHAVIORAL HEALTH
FY2018 FY2017
RACE / ETHNICITY
TREATMENT ACCOMMODATION
2019 Status Report on Missouri's Substance Use and Mental Health
10473
170
1,437 1,597135
135
129
148
129
136
49
*
1,8841,739NUMBER SERVED
PLANNING REGION
PSYCHIATRIC SERVICE AREA
2018 POPULATION ESTIMATE
CENSUS 2010
FY2019 FY2018 FY2017
Individuals who received psychiatric services had the following types ofdisorders. The total number of diagnoses is larger than the numberserved because some individuals had more than one type of disorder.
1,422
92
*
*
18
876
575
155
59
94
0
74
1,783
5
44
1,171
17
172
131
109
283
0
46
5
256
381
613
393
233
160
257
46
338
18
124
69
142
749
23
849
221
16
625 691
199 107
FY2018 FY2017
911
828
Gender Unknown 00
000
0
735
826
1,561
110
128
108
117
113
0
87
FY2019
28
36
24
*
*
128
1,341
136
117
111
109
191
186
117
18
FY2019
237
603
19
92
610
*
48
147
1,228
99
220
51
62
297
27
126
113
8
843
74
*
1,435
36
121
790
515
Total Disorders Diagnosed 3,1602,506 2,819
Missouri Department of Mental Health, Division of Behavioral Health

Total Individuals Served
Housing Unknown
Other
Homeless
Independent Living
Dependent Living
HOUSING / LIVING ARRANGEMENT
Employment Status Unknown
Not in Labor Force
Unemployed
Employed
Referral Source Unknown
Other
Court / Criminal Justice
Health Care Provider
Mental Health Provider
School
Self / Family / Friend
Education Level Unknown
Bachelor or Advanced Degree
Associate Degree or Some College
High School Grad or G.E.D.
Less than High School Diploma
Commitment Type Unknown
Sexual Predatory
Criminal
Civil
Voluntary
TREATMENT REFERRAL SOURCE
EMPLOYMENT
EDUCATION
TYPE OF COMMITMENT
Age Unknown
55 to 59
50 to 54
60 and Over
30 to 34
25 to 29
18 to 24
14 to 17
10 to 13
6 to 9
Under 6
40 to 44
35 to 39
45 to 49
AGE
Hearing Impaired
Past or Current Military Service32
94
Race/Ethnicity Unknown
Other Race
Hispanic
Asian / Pacific Islander
Native American / Alaskan
African American
Caucasian
0
315
125
16
17
337
4,952
GENDERMale
Female 2,973
2,664
Diagnosis Unknown
Other Disorders
Sexual Disorders
Schizophrenia and Psychotic Disorders
Personality Disorders
Depressive Mood Disorders
Impulse Control and Conduct DisordersDevelopmental and Age Related Disorders
Trauma and Stress Related Disorders
Anxiety and Fear Disorders
Bipolar Mood Disorders
DIAGNOSIS CATEGORY
The profiles below summarize individuals who received clinical services from the Division of Behavioral Health psychiatric programs.Individuals are counted only once based on their first treatment episode of the fiscal year. Information that was not reported is listed asunknown. An asterisk (*) in a data cell indicates the count was fewer than five (5) and suppressed to avoid disclosing identifying information.
402
431
371
52
499
698
646
435
376
434
420
442
431
16
Eastern
595,249
547,056
MENTAL HEALTH SERVICE AREA 16
1,936
1,062
611
131
606
585
74
5,564
6
21
26
1,552
1,561
2,397
1,221
346
408
750
8
998
1,325
682
134
453
29
2,961
64
364
1,001
800
1,612
1,226
2,393
1,139
318
297
654
5
1,066
42
66
567
823
653
442
368
387
411
#Name?
Page G-135
MENTAL ILLNESS TREATMENT SERVICES -- DIVISION OF BEHAVIORAL HEALTH
FY2018 FY2017
RACE / ETHNICITY
TREATMENT ACCOMMODATION
2019 Status Report on Missouri's Substance Use and Mental Health
32156
1,893
4,184 3,468397
334
368
395
425
54
*
44
5,6375,636NUMBER SERVED
PLANNING REGION
PSYCHIATRIC SERVICE AREA
2018 POPULATION ESTIMATE
CENSUS 2010
FY2019 FY2018 FY2017
Individuals who received psychiatric services had the following types ofdisorders. The total number of diagnoses is larger than the numberserved because some individuals had more than one type of disorder.
4,866
305
12
18
143
2,428
1,162
683
155
412
0
1,209
5,596
9
29
980
406
184
531
60
3,474
*
*
*
1,632
1,388
2,420
1,328
369
353
706
6
1,098
66
119
263
404
2,551
98
2,843
386
82
2,052 1,914
533 413
FY2018 FY2017
2,703
2,933
Gender Unknown 00
000
0
3,058
2,832
5,890
415
408
326
359
421
0
454
FY2019
61
67
200
16
12
357
5,051
465
396
365
505
665
883
597
85
FY2019
534
2,262
121
543
2,432
44
*
52
4,421
1,065
731
449
289
3,073
25
448
124
664
1,507
25
*
5,815
168
704
2,610
1,343
Total Disorders Diagnosed 9,3378,908 9,485
Missouri Department of Mental Health, Division of Behavioral Health

Total Individuals Served
Housing Unknown
Other
Homeless
Independent Living
Dependent Living
HOUSING / LIVING ARRANGEMENT
Employment Status Unknown
Not in Labor Force
Unemployed
Employed
Referral Source Unknown
Other
Court / Criminal Justice
Health Care Provider
Mental Health Provider
School
Self / Family / Friend
Education Level Unknown
Bachelor or Advanced Degree
Associate Degree or Some College
High School Grad or G.E.D.
Less than High School Diploma
Commitment Type Unknown
Sexual Predatory
Criminal
Civil
Voluntary
TREATMENT REFERRAL SOURCE
EMPLOYMENT
EDUCATION
TYPE OF COMMITMENT
Age Unknown
55 to 59
50 to 54
60 and Over
30 to 34
25 to 29
18 to 24
14 to 17
10 to 13
6 to 9
Under 6
40 to 44
35 to 39
45 to 49
AGE
Hearing Impaired
Past or Current Military Service9
30
Race/Ethnicity Unknown
Other Race
Hispanic
Asian / Pacific Islander
Native American / Alaskan
African American
Caucasian
0
46
22
*
5
35
1,278
GENDERMale
Female 755
610
Diagnosis Unknown
Other Disorders
Sexual Disorders
Schizophrenia and Psychotic Disorders
Personality Disorders
Depressive Mood Disorders
Impulse Control and Conduct DisordersDevelopmental and Age Related Disorders
Trauma and Stress Related Disorders
Anxiety and Fear Disorders
Bipolar Mood Disorders
DIAGNOSIS CATEGORY
The profiles below summarize individuals who received clinical services from the Division of Behavioral Health psychiatric programs.Individuals are counted only once based on their first treatment episode of the fiscal year. Information that was not reported is listed asunknown. An asterisk (*) in a data cell indicates the count was fewer than five (5) and suppressed to avoid disclosing identifying information.
110
129
116
11
117
133
136
104
92
111
72
120
114
17A
Southeast
107,604
109,907
MENTAL HEALTH SERVICE AREA 17A
652
392
156
22
43
140
25
1,378
*
8
18
401
286
616
212
182
47
139
*
390
1,010
11
59
215
8
74
14
31
62
127
438
259
645
235
200
29
146
*
385
10
29
108
179
130
98
94
94
80
#Name?
Page G-136
MENTAL ILLNESS TREATMENT SERVICES -- DIVISION OF BEHAVIORAL HEALTH
FY2018 FY2017
RACE / ETHNICITY
TREATMENT ACCOMMODATION
2019 Status Report on Missouri's Substance Use and Mental Health
1376
142
1,177 1,144118
93
129
124
114
12
0
0
1,3651,390NUMBER SERVED
PLANNING REGION
PSYCHIATRIC SERVICE AREA
2018 POPULATION ESTIMATE
CENSUS 2010
FY2019 FY2018 FY2017
Individuals who received psychiatric services had the following types ofdisorders. The total number of diagnoses is larger than the numberserved because some individuals had more than one type of disorder.
1,293
27
6
0
18
660
402
153
27
54
0
147
1,350
5
10
1,014
6
26
200
17
102
0
0
0
438
260
613
227
217
27
144
*
378
13
45
29
147
680
33
715
154
31
475 431
54 33
FY2018 FY2017
622
768
Gender Unknown 00
000
0
856
706
1,562
135
123
126
98
126
0
81
FY2019
23
23
48
0
5
35
1,441
116
113
99
112
168
193
119
34
FY2019
153
522
29
204
653
0
0
11
1,184
287
237
82
59
228
7
242
49
10
1,014
7
*
1,553
26
145
676
428
Total Disorders Diagnosed 2,3012,424 2,363
Missouri Department of Mental Health, Division of Behavioral Health
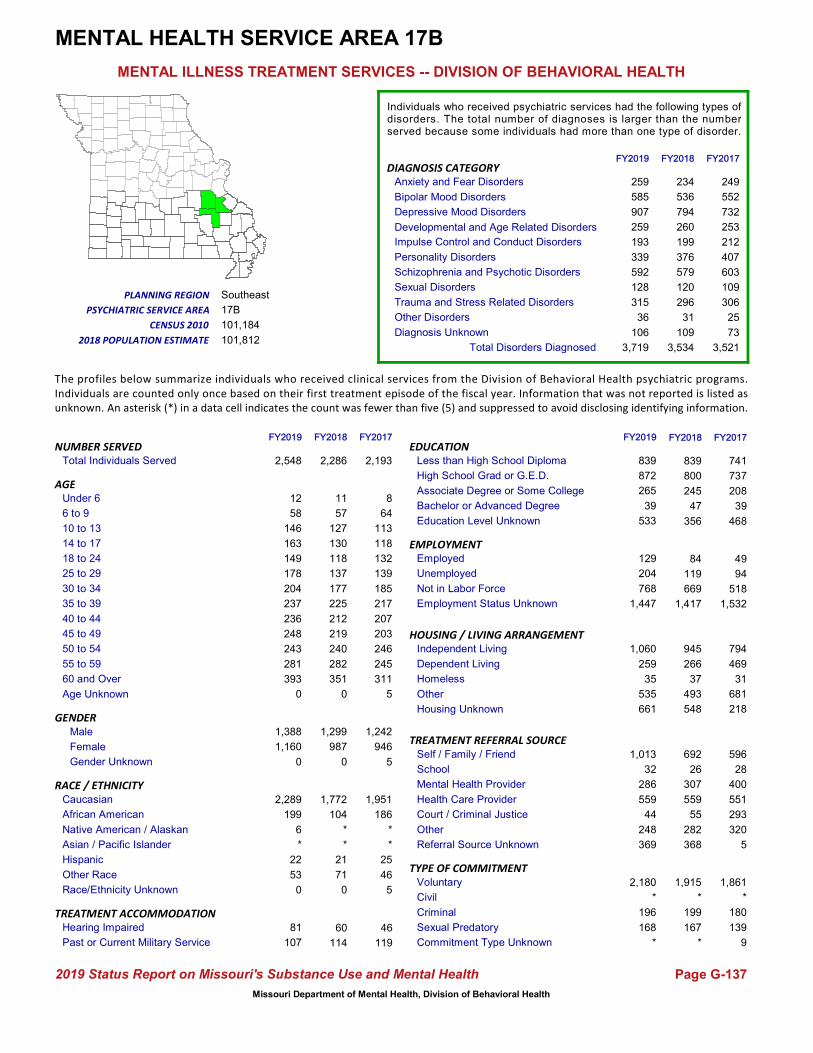
Total Individuals Served
Housing Unknown
Other
Homeless
Independent Living
Dependent Living
HOUSING / LIVING ARRANGEMENT
Employment Status Unknown
Not in Labor Force
Unemployed
Employed
Referral Source Unknown
Other
Court / Criminal Justice
Health Care Provider
Mental Health Provider
School
Self / Family / Friend
Education Level Unknown
Bachelor or Advanced Degree
Associate Degree or Some College
High School Grad or G.E.D.
Less than High School Diploma
Commitment Type Unknown
Sexual Predatory
Criminal
Civil
Voluntary
TREATMENT REFERRAL SOURCE
EMPLOYMENT
EDUCATION
TYPE OF COMMITMENT
Age Unknown
55 to 59
50 to 54
60 and Over
30 to 34
25 to 29
18 to 24
14 to 17
10 to 13
6 to 9
Under 6
40 to 44
35 to 39
45 to 49
AGE
Hearing Impaired
Past or Current Military Service46
119
Race/Ethnicity Unknown
Other Race
Hispanic
Asian / Pacific Islander
Native American / Alaskan
African American
Caucasian
5
46
25
*
*
186
1,951
GENDERMale
Female 946
1,242
Diagnosis Unknown
Other Disorders
Sexual Disorders
Schizophrenia and Psychotic Disorders
Personality Disorders
Depressive Mood Disorders
Impulse Control and Conduct DisordersDevelopmental and Age Related Disorders
Trauma and Stress Related Disorders
Anxiety and Fear Disorders
Bipolar Mood Disorders
DIAGNOSIS CATEGORY
The profiles below summarize individuals who received clinical services from the Division of Behavioral Health psychiatric programs.Individuals are counted only once based on their first treatment episode of the fiscal year. Information that was not reported is listed asunknown. An asterisk (*) in a data cell indicates the count was fewer than five (5) and suppressed to avoid disclosing identifying information.
203
217
207
8
64
113
118
132
139
185
311
246
245
17B
Southeast
101,812
101,184
MENTAL HEALTH SERVICE AREA 17B
741
737
208
39
119
669
114
1,915
*
199
60
249
552
732
253
212
407
603
109
306
692
26
307
559
55
282
25
49
94
518
259
585
907
259
193
339
592
128
315
36
11
57
127
130
118
137
177
351
#Name?
Page G-137
MENTAL ILLNESS TREATMENT SERVICES -- DIVISION OF BEHAVIORAL HEALTH
FY2018 FY2017
RACE / ETHNICITY
TREATMENT ACCOMMODATION
2019 Status Report on Missouri's Substance Use and Mental Health
73106
468
1,417 1,532225
212
219
240
282
368
167
*
2,1932,286NUMBER SERVED
PLANNING REGION
PSYCHIATRIC SERVICE AREA
2018 POPULATION ESTIMATE
CENSUS 2010
FY2019 FY2018 FY2017
Individuals who received psychiatric services had the following types ofdisorders. The total number of diagnoses is larger than the numberserved because some individuals had more than one type of disorder.
1,772
104
*
*
21
839
800
245
47
71
0
356
1,861
*
180
596
28
400
551
293
320
5
139
9
234
536
794
260
199
376
579
120
296
31
109
84
266
945
37
794
469
31
493 681
548 218
FY2018 FY2017
1,299
987
Gender Unknown 50
500
0
1,160
1,388
2,548
281
243
248
236
237
0
53
FY2019
81
107
22
*
6
199
2,289
393
204
178
149
163
146
58
12
FY2019
661
535
35
259
1,060
*
168
369
1,447
533
768
204
129
248
44
559
286
32
1,013
196
*
2,180
39
265
839
872
Total Disorders Diagnosed 3,5213,719 3,534
Missouri Department of Mental Health, Division of Behavioral Health

Total Individuals Served
Housing Unknown
Other
Homeless
Independent Living
Dependent Living
HOUSING / LIVING ARRANGEMENT
Employment Status Unknown
Not in Labor Force
Unemployed
Employed
Referral Source Unknown
Other
Court / Criminal Justice
Health Care Provider
Mental Health Provider
School
Self / Family / Friend
Education Level Unknown
Bachelor or Advanced Degree
Associate Degree or Some College
High School Grad or G.E.D.
Less than High School Diploma
Commitment Type Unknown
Sexual Predatory
Criminal
Civil
Voluntary
TREATMENT REFERRAL SOURCE
EMPLOYMENT
EDUCATION
TYPE OF COMMITMENT
Age Unknown
55 to 59
50 to 54
60 and Over
30 to 34
25 to 29
18 to 24
14 to 17
10 to 13
6 to 9
Under 6
40 to 44
35 to 39
45 to 49
AGE
Hearing Impaired
Past or Current Military Service15
59
Race/Ethnicity Unknown
Other Race
Hispanic
Asian / Pacific Islander
Native American / Alaskan
African American
Caucasian
0
54
17
*
*
7
1,782
GENDERMale
Female 1,023
824
Diagnosis Unknown
Other Disorders
Sexual Disorders
Schizophrenia and Psychotic Disorders
Personality Disorders
Depressive Mood Disorders
Impulse Control and Conduct DisordersDevelopmental and Age Related Disorders
Trauma and Stress Related Disorders
Anxiety and Fear Disorders
Bipolar Mood Disorders
DIAGNOSIS CATEGORY
The profiles below summarize individuals who received clinical services from the Division of Behavioral Health psychiatric programs.Individuals are counted only once based on their first treatment episode of the fiscal year. Information that was not reported is listed asunknown. An asterisk (*) in a data cell indicates the count was fewer than five (5) and suppressed to avoid disclosing identifying information.
179
194
169
9
91
104
88
205
196
218
100
169
125
18
Southeast
125,145
127,952
MENTAL HEALTH SERVICE AREA 18
605
649
351
67
91
247
39
1,952
*
12
30
552
293
927
208
74
83
134
*
596
984
*
34
862
27
42
18
74
73
235
585
244
879
241
70
76
108
*
531
8
11
112
115
119
219
200
239
119
#Name?
Page G-138
MENTAL ILLNESS TREATMENT SERVICES -- DIVISION OF BEHAVIORAL HEALTH
FY2018 FY2017
RACE / ETHNICITY
TREATMENT ACCOMMODATION
2019 Status Report on Missouri's Substance Use and Mental Health
5658
174
1,510 1,464223
145
168
166
134
17
*
*
1,8471,970NUMBER SERVED
PLANNING REGION
PSYCHIATRIC SERVICE AREA
2018 POPULATION ESTIMATE
CENSUS 2010
FY2019 FY2018 FY2017
Individuals who received psychiatric services had the following types ofdisorders. The total number of diagnoses is larger than the numberserved because some individuals had more than one type of disorder.
1,890
9
*
*
14
674
693
364
78
52
0
160
1,836
0
7
904
*
29
805
31
75
0
*
*
568
278
962
250
70
84
128
*
572
17
59
121
243
1,149
61
1,090
302
65
400 351
116 39
FY2018 FY2017
879
1,091
Gender Unknown 00
000
0
1,018
805
1,823
122
133
155
143
180
0
38
FY2019
28
25
11
0
*
8
1,775
113
201
189
215
116
143
105
8
FY2019
73
420
53
225
1,052
*
*
9
1,349
173
209
129
136
51
17
713
37
*
992
7
*
1,812
68
253
581
748
Total Disorders Diagnosed 2,9442,803 2,991
Missouri Department of Mental Health, Division of Behavioral Health
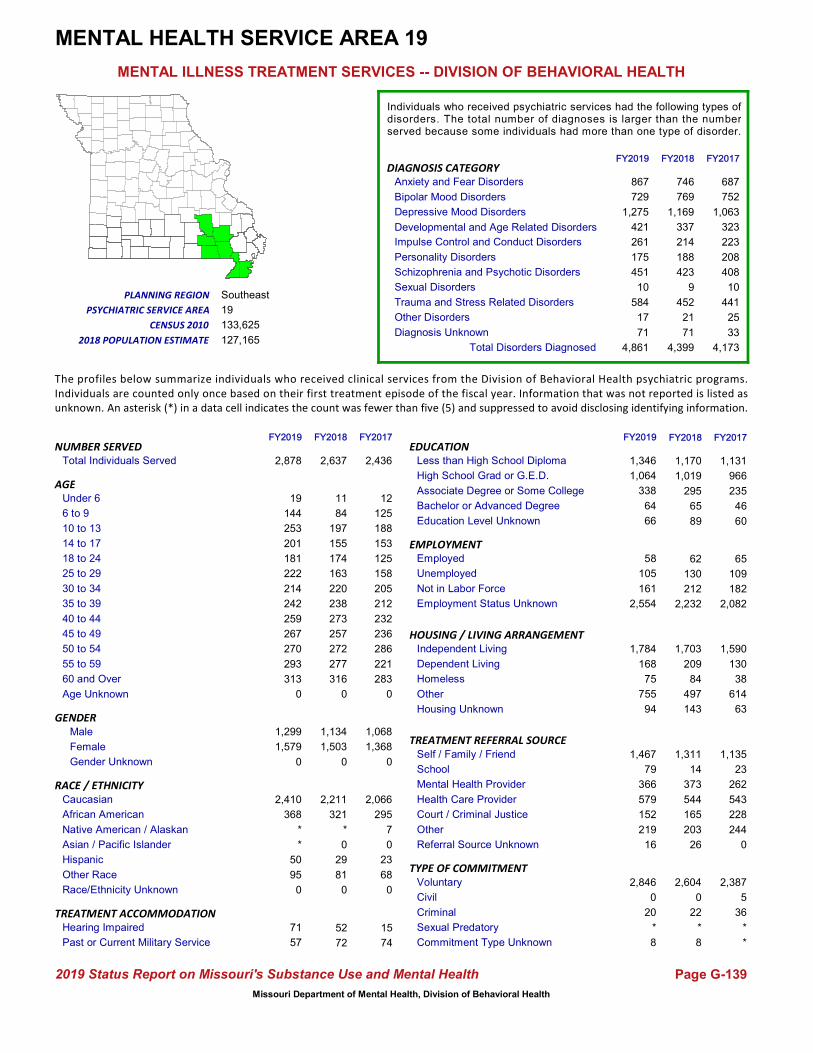
Total Individuals Served
Housing Unknown
Other
Homeless
Independent Living
Dependent Living
HOUSING / LIVING ARRANGEMENT
Employment Status Unknown
Not in Labor Force
Unemployed
Employed
Referral Source Unknown
Other
Court / Criminal Justice
Health Care Provider
Mental Health Provider
School
Self / Family / Friend
Education Level Unknown
Bachelor or Advanced Degree
Associate Degree or Some College
High School Grad or G.E.D.
Less than High School Diploma
Commitment Type Unknown
Sexual Predatory
Criminal
Civil
Voluntary
TREATMENT REFERRAL SOURCE
EMPLOYMENT
EDUCATION
TYPE OF COMMITMENT
Age Unknown
55 to 59
50 to 54
60 and Over
30 to 34
25 to 29
18 to 24
14 to 17
10 to 13
6 to 9
Under 6
40 to 44
35 to 39
45 to 49
AGE
Hearing Impaired
Past or Current Military Service15
74
Race/Ethnicity Unknown
Other Race
Hispanic
Asian / Pacific Islander
Native American / Alaskan
African American
Caucasian
0
68
23
0
7
295
2,066
GENDERMale
Female 1,368
1,068
Diagnosis Unknown
Other Disorders
Sexual Disorders
Schizophrenia and Psychotic Disorders
Personality Disorders
Depressive Mood Disorders
Impulse Control and Conduct DisordersDevelopmental and Age Related Disorders
Trauma and Stress Related Disorders
Anxiety and Fear Disorders
Bipolar Mood Disorders
DIAGNOSIS CATEGORY
The profiles below summarize individuals who received clinical services from the Division of Behavioral Health psychiatric programs.Individuals are counted only once based on their first treatment episode of the fiscal year. Information that was not reported is listed asunknown. An asterisk (*) in a data cell indicates the count was fewer than five (5) and suppressed to avoid disclosing identifying information.
236
212
232
12
125
188
153
125
158
205
283
286
221
19
Southeast
127,165
133,625
MENTAL HEALTH SERVICE AREA 19
1,131
966
235
46
130
212
72
2,604
0
22
52
687
752
1,063
323
223
208
408
10
441
1,311
14
373
544
165
203
25
65
109
182
867
729
1,275
421
261
175
451
10
584
17
11
84
197
155
174
163
220
316
#Name?
Page G-139
MENTAL ILLNESS TREATMENT SERVICES -- DIVISION OF BEHAVIORAL HEALTH
FY2018 FY2017
RACE / ETHNICITY
TREATMENT ACCOMMODATION
2019 Status Report on Missouri's Substance Use and Mental Health
3371
60
2,232 2,082238
273
257
272
277
26
*
8
2,4362,637NUMBER SERVED
PLANNING REGION
PSYCHIATRIC SERVICE AREA
2018 POPULATION ESTIMATE
CENSUS 2010
FY2019 FY2018 FY2017
Individuals who received psychiatric services had the following types ofdisorders. The total number of diagnoses is larger than the numberserved because some individuals had more than one type of disorder.
2,211
321
*
0
29
1,170
1,019
295
65
81
0
89
2,387
5
36
1,135
23
262
543
228
244
0
*
*
746
769
1,169
337
214
188
423
9
452
21
71
62
209
1,703
84
1,590
130
38
497 614
143 63
FY2018 FY2017
1,134
1,503
Gender Unknown 00
000
0
1,579
1,299
2,878
293
270
267
259
242
0
95
FY2019
71
57
50
*
*
368
2,410
313
214
222
181
201
253
144
19
FY2019
94
755
75
168
1,784
8
*
16
2,554
66
161
105
58
219
152
579
366
79
1,467
20
0
2,846
64
338
1,346
1,064
Total Disorders Diagnosed 4,1734,861 4,399
Missouri Department of Mental Health, Division of Behavioral Health
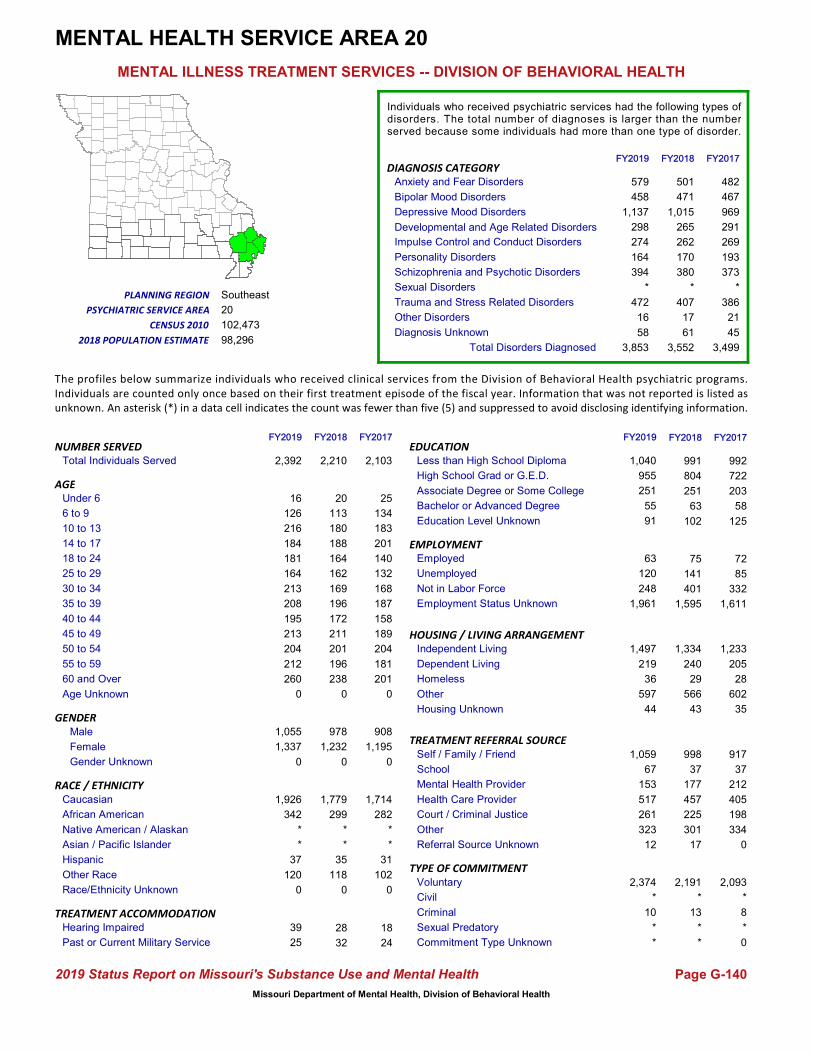
Total Individuals Served
Housing Unknown
Other
Homeless
Independent Living
Dependent Living
HOUSING / LIVING ARRANGEMENT
Employment Status Unknown
Not in Labor Force
Unemployed
Employed
Referral Source Unknown
Other
Court / Criminal Justice
Health Care Provider
Mental Health Provider
School
Self / Family / Friend
Education Level Unknown
Bachelor or Advanced Degree
Associate Degree or Some College
High School Grad or G.E.D.
Less than High School Diploma
Commitment Type Unknown
Sexual Predatory
Criminal
Civil
Voluntary
TREATMENT REFERRAL SOURCE
EMPLOYMENT
EDUCATION
TYPE OF COMMITMENT
Age Unknown
55 to 59
50 to 54
60 and Over
30 to 34
25 to 29
18 to 24
14 to 17
10 to 13
6 to 9
Under 6
40 to 44
35 to 39
45 to 49
AGE
Hearing Impaired
Past or Current Military Service18
24
Race/Ethnicity Unknown
Other Race
Hispanic
Asian / Pacific Islander
Native American / Alaskan
African American
Caucasian
0
102
31
*
*
282
1,714
GENDERMale
Female 1,195
908
Diagnosis Unknown
Other Disorders
Sexual Disorders
Schizophrenia and Psychotic Disorders
Personality Disorders
Depressive Mood Disorders
Impulse Control and Conduct DisordersDevelopmental and Age Related Disorders
Trauma and Stress Related Disorders
Anxiety and Fear Disorders
Bipolar Mood Disorders
DIAGNOSIS CATEGORY
The profiles below summarize individuals who received clinical services from the Division of Behavioral Health psychiatric programs.Individuals are counted only once based on their first treatment episode of the fiscal year. Information that was not reported is listed asunknown. An asterisk (*) in a data cell indicates the count was fewer than five (5) and suppressed to avoid disclosing identifying information.
189
187
158
25
134
183
201
140
132
168
201
204
181
20
Southeast
98,296
102,473
MENTAL HEALTH SERVICE AREA 20
992
722
203
58
141
401
32
2,191
*
13
28
482
467
969
291
269
193
373
*
386
998
37
177
457
225
301
21
72
85
332
579
458
1,137
298
274
164
394
*
472
16
20
113
180
188
164
162
169
238
#Name?
Page G-140
MENTAL ILLNESS TREATMENT SERVICES -- DIVISION OF BEHAVIORAL HEALTH
FY2018 FY2017
RACE / ETHNICITY
TREATMENT ACCOMMODATION
2019 Status Report on Missouri's Substance Use and Mental Health
4558
125
1,595 1,611196
172
211
201
196
17
*
*
2,1032,210NUMBER SERVED
PLANNING REGION
PSYCHIATRIC SERVICE AREA
2018 POPULATION ESTIMATE
CENSUS 2010
FY2019 FY2018 FY2017
Individuals who received psychiatric services had the following types ofdisorders. The total number of diagnoses is larger than the numberserved because some individuals had more than one type of disorder.
1,779
299
*
*
35
991
804
251
63
118
0
102
2,093
*
8
917
37
212
405
198
334
0
*
0
501
471
1,015
265
262
170
380
*
407
17
61
75
240
1,334
29
1,233
205
28
566 602
43 35
FY2018 FY2017
978
1,232
Gender Unknown 00
000
0
1,337
1,055
2,392
212
204
213
195
208
0
120
FY2019
39
25
37
*
*
342
1,926
260
213
164
181
184
216
126
16
FY2019
44
597
36
219
1,497
*
*
12
1,961
91
248
120
63
323
261
517
153
67
1,059
10
*
2,374
55
251
1,040
955
Total Disorders Diagnosed 3,4993,853 3,552
Missouri Department of Mental Health, Division of Behavioral Health

Total Individuals Served
Housing Unknown
Other
Homeless
Independent Living
Dependent Living
HOUSING / LIVING ARRANGEMENT
Employment Status Unknown
Not in Labor Force
Unemployed
Employed
Referral Source Unknown
Other
Court / Criminal Justice
Health Care Provider
Mental Health Provider
School
Self / Family / Friend
Education Level Unknown
Bachelor or Advanced Degree
Associate Degree or Some College
High School Grad or G.E.D.
Less than High School Diploma
Commitment Type Unknown
Sexual Predatory
Criminal
Civil
Voluntary
TREATMENT REFERRAL SOURCE
EMPLOYMENT
EDUCATION
TYPE OF COMMITMENT
Age Unknown
55 to 59
50 to 54
60 and Over
30 to 34
25 to 29
18 to 24
14 to 17
10 to 13
6 to 9
Under 6
40 to 44
35 to 39
45 to 49
AGE
Hearing Impaired
Past or Current Military Service21
82
Race/Ethnicity Unknown
Other Race
Hispanic
Asian / Pacific Islander
Native American / Alaskan
African American
Caucasian
0
237
68
*
7
263
2,873
GENDERMale
Female 1,950
1,434
Diagnosis Unknown
Other Disorders
Sexual Disorders
Schizophrenia and Psychotic Disorders
Personality Disorders
Depressive Mood Disorders
Impulse Control and Conduct DisordersDevelopmental and Age Related Disorders
Trauma and Stress Related Disorders
Anxiety and Fear Disorders
Bipolar Mood Disorders
DIAGNOSIS CATEGORY
The profiles below summarize individuals who received clinical services from the Division of Behavioral Health psychiatric programs.Individuals are counted only once based on their first treatment episode of the fiscal year. Information that was not reported is listed asunknown. An asterisk (*) in a data cell indicates the count was fewer than five (5) and suppressed to avoid disclosing identifying information.
303
308
260
13
147
239
242
333
286
284
360
318
291
21
Southeast
140,148
137,379
MENTAL HEALTH SERVICE AREA 21
1,015
838
336
107
466
421
67
2,984
*
18
54
529
734
1,332
428
181
144
448
6
378
1,975
112
126
441
123
216
26
596
493
531
399
580
1,110
349
204
98
333
*
333
11
19
134
177
208
294
255
251
317
#Name?
Page G-141
MENTAL ILLNESS TREATMENT SERVICES -- DIVISION OF BEHAVIORAL HEALTH
FY2018 FY2017
RACE / ETHNICITY
TREATMENT ACCOMMODATION
2019 Status Report on Missouri's Substance Use and Mental Health
422174
1,088
1,611 1,764295
240
273
284
268
21
0
10
3,3843,015NUMBER SERVED
PLANNING REGION
PSYCHIATRIC SERVICE AREA
2018 POPULATION ESTIMATE
CENSUS 2010
FY2019 FY2018 FY2017
Individuals who received psychiatric services had the following types ofdisorders. The total number of diagnoses is larger than the numberserved because some individuals had more than one type of disorder.
2,543
227
6
*
69
968
799
315
98
216
0
834
3,346
*
30
2,231
90
136
524
150
253
0
0
*
495
663
1,262
369
194
129
401
*
358
14
296
516
152
1,961
52
2,221
152
47
678 894
171 70
FY2018 FY2017
1,292
1,723
Gender Unknown 00
000
0
1,442
1,202
2,644
208
221
214
224
256
0
200
FY2019
85
49
55
*
5
228
2,210
224
246
241
254
200
192
144
20
FY2019
130
731
46
198
1,540
9
*
11
1,544
587
283
362
455
160
89
332
95
86
1,871
15
*
2,617
69
250
956
782
Total Disorders Diagnosed 4,6283,595 4,185
Missouri Department of Mental Health, Division of Behavioral Health

Total Individuals Served
Housing Unknown
Other
Homeless
Independent Living
Dependent Living
HOUSING / LIVING ARRANGEMENT
Employment Status Unknown
Not in Labor Force
Unemployed
Employed
Referral Source Unknown
Other
Court / Criminal Justice
Health Care Provider
Mental Health Provider
School
Self / Family / Friend
Education Level Unknown
Bachelor or Advanced Degree
Associate Degree or Some College
High School Grad or G.E.D.
Less than High School Diploma
Commitment Type Unknown
Sexual Predatory
Criminal
Civil
Voluntary
TREATMENT REFERRAL SOURCE
EMPLOYMENT
EDUCATION
TYPE OF COMMITMENT
Age Unknown
55 to 59
50 to 54
60 and Over
30 to 34
25 to 29
18 to 24
14 to 17
10 to 13
6 to 9
Under 6
40 to 44
35 to 39
45 to 49
AGE
Hearing Impaired
Past or Current Military Service7
45
Race/Ethnicity Unknown
Other Race
Hispanic
Asian / Pacific Islander
Native American / Alaskan
African American
Caucasian
0
64
27
7
*
39
1,948
GENDERMale
Female 1,207
854
Diagnosis Unknown
Other Disorders
Sexual Disorders
Schizophrenia and Psychotic Disorders
Personality Disorders
Depressive Mood Disorders
Impulse Control and Conduct DisordersDevelopmental and Age Related Disorders
Trauma and Stress Related Disorders
Anxiety and Fear Disorders
Bipolar Mood Disorders
DIAGNOSIS CATEGORY
The profiles below summarize individuals who received clinical services from the Division of Behavioral Health psychiatric programs.Individuals are counted only once based on their first treatment episode of the fiscal year. Information that was not reported is listed asunknown. An asterisk (*) in a data cell indicates the count was fewer than five (5) and suppressed to avoid disclosing identifying information.
229
239
190
*
30
51
73
146
169
203
203
274
251
22
Eastern
224,347
218,733
MENTAL HEALTH SERVICE AREA 22
616
728
491
77
125
242
43
2,059
*
9
*
1,269
771
1,330
368
123
632
374
*
461
1,056
12
125
467
65
343
207
83
133
155
1,358
711
1,432
338
126
450
346
*
572
165
6
35
58
77
183
165
213
213
#Name?
Page G-142
MENTAL ILLNESS TREATMENT SERVICES -- DIVISION OF BEHAVIORAL HEALTH
FY2018 FY2017
RACE / ETHNICITY
TREATMENT ACCOMMODATION
2019 Status Report on Missouri's Substance Use and Mental Health
1134
146
1,584 1,687226
187
216
249
256
17
0
14
2,0612,084NUMBER SERVED
PLANNING REGION
PSYCHIATRIC SERVICE AREA
2018 POPULATION ESTIMATE
CENSUS 2010
FY2019 FY2018 FY2017
Individuals who received psychiatric services had the following types ofdisorders. The total number of diagnoses is larger than the numberserved because some individuals had more than one type of disorder.
1,952
41
*
7
27
569
708
487
91
76
0
229
2,047
*
12
967
11
133
494
79
377
0
0
*
1,224
714
1,311
333
129
522
356
*
494
195
25
134
235
1,455
34
1,509
169
37
250 261
111 85
FY2018 FY2017
877
1,207
Gender Unknown 00
000
0
1,332
936
2,268
277
241
201
209
233
0
66
FY2019
*
37
19
5
*
43
2,152
238
253
212
229
64
73
32
6
FY2019
82
263
50
291
1,582
14
0
10
1,823
175
222
100
123
291
103
492
136
18
1,219
8
*
2,245
122
579
575
817
Total Disorders Diagnosed 5,5485,535 5,304
Missouri Department of Mental Health, Division of Behavioral Health

Total Individuals Served
Housing Unknown
Other
Homeless
Independent Living
Dependent Living
HOUSING / LIVING ARRANGEMENT
Employment Status Unknown
Not in Labor Force
Unemployed
Employed
Referral Source Unknown
Other
Court / Criminal Justice
Health Care Provider
Mental Health Provider
School
Self / Family / Friend
Education Level Unknown
Bachelor or Advanced Degree
Associate Degree or Some College
High School Grad or G.E.D.
Less than High School Diploma
Commitment Type Unknown
Sexual Predatory
Criminal
Civil
Voluntary
TREATMENT REFERRAL SOURCE
EMPLOYMENT
EDUCATION
TYPE OF COMMITMENT
Age Unknown
55 to 59
50 to 54
60 and Over
30 to 34
25 to 29
18 to 24
14 to 17
10 to 13
6 to 9
Under 6
40 to 44
35 to 39
45 to 49
AGE
Hearing Impaired
Past or Current Military Service65
97
Race/Ethnicity Unknown
Other Race
Hispanic
Asian / Pacific Islander
Native American / Alaskan
African American
Caucasian
0
321
71
31
5
2,674
2,252
GENDERMale
Female 2,677
2,606
Diagnosis Unknown
Other Disorders
Sexual Disorders
Schizophrenia and Psychotic Disorders
Personality Disorders
Depressive Mood Disorders
Impulse Control and Conduct DisordersDevelopmental and Age Related Disorders
Trauma and Stress Related Disorders
Anxiety and Fear Disorders
Bipolar Mood Disorders
DIAGNOSIS CATEGORY
The profiles below summarize individuals who received clinical services from the Division of Behavioral Health psychiatric programs.Individuals are counted only once based on their first treatment episode of the fiscal year. Information that was not reported is listed asunknown. An asterisk (*) in a data cell indicates the count was fewer than five (5) and suppressed to avoid disclosing identifying information.
446
445
388
26
202
346
424
452
402
438
613
594
507
23
Eastern
996,945
998,954
MENTAL HEALTH SERVICE AREA 23
1,835
1,513
980
310
130
1,142
88
5,823
*
56
88
505
1,520
1,988
816
266
621
1,697
10
619
1,584
123
1,246
1,174
179
1,503
57
150
149
669
640
1,583
2,636
957
330
590
1,745
12
710
51
24
253
401
477
570
483
489
687
#Name?
Page G-143
MENTAL ILLNESS TREATMENT SERVICES -- DIVISION OF BEHAVIORAL HEALTH
FY2018 FY2017
RACE / ETHNICITY
TREATMENT ACCOMMODATION
2019 Status Report on Missouri's Substance Use and Mental Health
116249
642
4,361 4,312467
435
461
596
557
91
6
14
5,2835,900NUMBER SERVED
PLANNING REGION
PSYCHIATRIC SERVICE AREA
2018 POPULATION ESTIMATE
CENSUS 2010
FY2019 FY2018 FY2017
Individuals who received psychiatric services had the following types ofdisorders. The total number of diagnoses is larger than the numberserved because some individuals had more than one type of disorder.
2,409
2,973
5
44
103
1,889
1,535
1,016
307
414
0
1,155
5,197
10
65
1,250
89
809
1,104
219
1,812
*
5
7
562
1,571
2,333
922
320
591
1,684
10
666
57
169
267
1,228
2,962
145
2,393
1,388
129
1,380 1,273
185 100
FY2018 FY2017
2,953
2,947
Gender Unknown 00
000
0
3,286
3,331
6,617
614
582
496
484
570
0
448
FY2019
117
92
123
48
*
3,387
2,731
734
559
543
675
565
434
321
40
FY2019
271
1,608
184
1,220
3,333
12
6
88
4,479
1,864
1,433
333
372
1,404
144
1,204
1,261
116
2,400
61
*
6,536
317
1,020
1,799
1,617
Total Disorders Diagnosed 8,2159,503 8,885
Missouri Department of Mental Health, Division of Behavioral Health
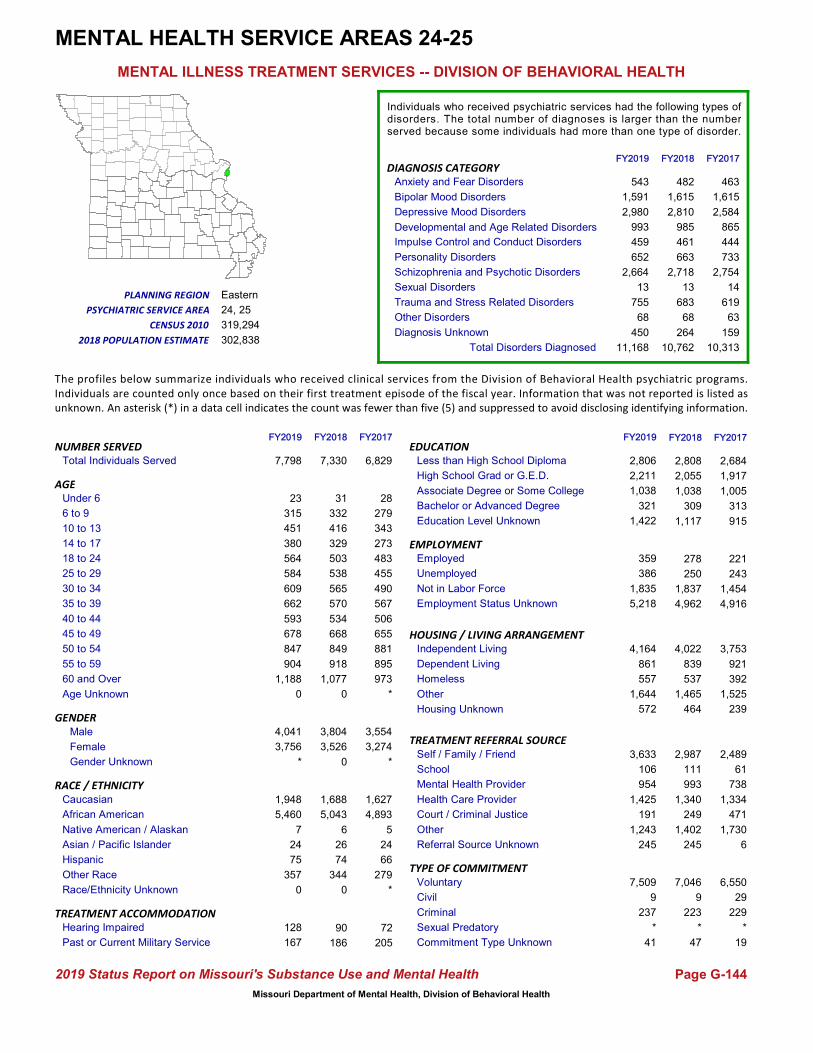
Total Individuals Served
Housing Unknown
Other
Homeless
Independent Living
Dependent Living
HOUSING / LIVING ARRANGEMENT
Employment Status Unknown
Not in Labor Force
Unemployed
Employed
Referral Source Unknown
Other
Court / Criminal Justice
Health Care Provider
Mental Health Provider
School
Self / Family / Friend
Education Level Unknown
Bachelor or Advanced Degree
Associate Degree or Some College
High School Grad or G.E.D.
Less than High School Diploma
Commitment Type Unknown
Sexual Predatory
Criminal
Civil
Voluntary
TREATMENT REFERRAL SOURCE
EMPLOYMENT
EDUCATION
TYPE OF COMMITMENT
Age Unknown
55 to 59
50 to 54
60 and Over
30 to 34
25 to 29
18 to 24
14 to 17
10 to 13
6 to 9
Under 6
40 to 44
35 to 39
45 to 49
AGE
Hearing Impaired
Past or Current Military Service72
205
Race/Ethnicity Unknown
Other Race
Hispanic
Asian / Pacific Islander
Native American / Alaskan
African American
Caucasian
*
279
66
24
5
4,893
1,627
GENDERMale
Female 3,274
3,554
Diagnosis Unknown
Other Disorders
Sexual Disorders
Schizophrenia and Psychotic Disorders
Personality Disorders
Depressive Mood Disorders
Impulse Control and Conduct DisordersDevelopmental and Age Related Disorders
Trauma and Stress Related Disorders
Anxiety and Fear Disorders
Bipolar Mood Disorders
DIAGNOSIS CATEGORY
The profiles below summarize individuals who received clinical services from the Division of Behavioral Health psychiatric programs.Individuals are counted only once based on their first treatment episode of the fiscal year. Information that was not reported is listed asunknown. An asterisk (*) in a data cell indicates the count was fewer than five (5) and suppressed to avoid disclosing identifying information.
655
567
506
28
279
343
273
483
455
490
973
881
895
24, 25
Eastern
302,838
319,294
MENTAL HEALTH SERVICE AREAS 24-25
2,684
1,917
1,005
313
250
1,837
186
7,046
9
223
90
463
1,615
2,584
865
444
733
2,754
14
619
2,987
111
993
1,340
249
1,402
63
221
243
1,454
543
1,591
2,980
993
459
652
2,664
13
755
68
31
332
416
329
503
538
565
1,077
#Name?
Page G-144
MENTAL ILLNESS TREATMENT SERVICES -- DIVISION OF BEHAVIORAL HEALTH
FY2018 FY2017
RACE / ETHNICITY
TREATMENT ACCOMMODATION
2019 Status Report on Missouri's Substance Use and Mental Health
159450
915
4,962 4,916570
534
668
849
918
245
*
47
6,8297,330NUMBER SERVED
PLANNING REGION
PSYCHIATRIC SERVICE AREA
2018 POPULATION ESTIMATE
CENSUS 2010
FY2019 FY2018 FY2017
Individuals who received psychiatric services had the following types ofdisorders. The total number of diagnoses is larger than the numberserved because some individuals had more than one type of disorder.
1,688
5,043
6
26
74
2,808
2,055
1,038
309
344
0
1,117
6,550
29
229
2,489
61
738
1,334
471
1,730
6
*
19
482
1,615
2,810
985
461
663
2,718
13
683
68
264
278
839
4,022
537
3,753
921
392
1,465 1,525
464 239
FY2018 FY2017
3,804
3,526
Gender Unknown *0
*00
*
3,756
4,041
7,798
904
847
678
593
662
0
357
FY2019
128
167
75
24
7
5,460
1,948
1,188
609
584
564
380
451
315
23
FY2019
572
1,644
557
861
4,164
41
*
245
5,218
1,422
1,835
386
359
1,243
191
1,425
954
106
3,633
237
9
7,509
321
1,038
2,806
2,211
Total Disorders Diagnosed 10,31311,168 10,762
Missouri Department of Mental Health, Division of Behavioral Health


![[XLS] · Web viewBridge Room & Board Social Workers MH Coun-Phd MH Coun-Msw MH Coun-Inst MH Inst-Non-Coun Phys-Visits Phys-Surgery Language Interpreter/Translation Service Phys-Lab](https://img.dokumen.tips/doc/110x75/5afe6f9f7f8b9a434e8f130e/xls-viewbridge-room-board-social-workers-mh-coun-phd-mh-coun-msw-mh-coun-inst.jpg)