Embed Size (px)
Citation preview

LABORATORY OF ENVIRONMENTAL SYSTEMS
DEPARTMENT OF ENVIRONMENTAL AND NATURAL RESOURCES
MANAGEMENT
SCHOOL OF ENGINEERING
UNIVERSITY OF PATRAS
TREATMENT OF INDUSTRIAL AND AGRO-INDUSTRIAL
WASTEWATER USING CONSTRUCTED WETLANDS
Ph.D. THESIS
BY
MAR-YAM SULTANA
SUPERVISOR:
Dr. CHRISTOS S. AKRATOS ASSISTANT PROFESSOR
AGRINIO, GREECE
NOVEMBER, 2014

LABORATORY OF ENVIRONMENTAL
SYSTEMS
DEPARTMENT OF ENVIRONMENTAL
AND NATURAL RESOURCES
MANAGEMENT
SCHOOL OF ENGINEERING
UNIVERSITY OF PATRAS
TREATMENT OF INDUSTRIAL AND AGRO-INDUSTRIAL
WASTEWATER USING CONSTRUCTED WETLANDS
“This thesis is submitted in fulfillment of the requirements for the degree of
Doctor of Philosophy”
By
MAR-YAM SULTANA
SUPERVISOR:
Dr. CHRISTOS S. AKRATOS ASSISTANT PROFESSOR
AGRINIO, GREECE
NOVEMBER, 2014

Treatment of Industrial and Agro-Industrial Wastewater Using Constructed Wetlands Mar-Yam Sultana
i
The thesis of Mar-Yam Sultana entitled "Treatment of industrial and agro-industrial wastewater
using constructed wetlands" examined and approved as to content and presentation.
The Examination Committee:
Chairman of the examination committee Members
Dr. Christos S. Akratos Dr. Dimitrios Vayenas
Professor
Assistant Professor (Member of the Advisory Committee)
(Supervisor)
Dr. Stavros Pavlou
Professor
(Member of the Advisory Committee)
Dr. Vassilios Tsihrintzis
Professor
(Member of the Examination Committee)
Dr. Vagelis Papadakis
Associate Professor
(Member of the Examination Committee)
Dr. Ioannis Kalavrouziotis
Associate Professor
(Member of the Examination Committee)
Dr. Athanasia Tekerlekopoulou
Lecturer
(Member of the Examination Committee)
Date of Presentation: 18 November, 2014

Treatment of Industrial and Agro-Industrial Wastewater Using Constructed Wetlands Mar-Yam Sultana
ii
Dedicated to my family

Treatment of Industrial and Agro-Industrial Wastewater Using Constructed Wetlands Mar-Yam Sultana
iii
This Ph.D. was funded by the Greek State Scholarships Foundation (IKY).

Treatment of Industrial and Agro-Industrial Wastewater Using Constructed Wetlands Mar-Yam Sultana
Acknowledgements iv
Acknowledgements
All praises are due to “Almighty Allah” who enables me to pursue higher study in my life as
well as to complete successfully the PhD research work and writing up of this PhD dissertation.
I would firstly like to acknowledge my supervisors, Prof. Dr. Dimitrios Vayenas and Assistant
Professor Dr. Christos S. Akratos, Laboratory of Environmental Systems, Department of
Environmental and Natural Resources Management, School of Engineering, University of Patras
for their excellent academic thoughtful guidance, advice, critical comments, warm
encouragement and continuous support throughout the PhD. It was a pleasure to learn from and
cooperate with two experts in their respective fields. I especially appreciate their trust in me by
giving me the opportunity to carry out my PhD research. I’m very grateful for their valuable
suggestions and directions from the start of the research work for its successful completion and
finally to write this dissertation. They significantly helped me to better structure and sharpen my
writing of manuscripts. Without their continuous and valuable supervision, this thesis would not
have been possible. There is no way to express how much it meant to me to have been a member
of the Environmental Systems Laboratory. I express my deepest gratitude to Prof. Dr. Stavros
Pavlou, Department of Chemical Engineering, University of Patras, for being a member of the
advisory committee and for also providing me encouragement and constructive feedback.
I would also like to thank my other examiners, Professor Dr. Vassilios Tsihrintzis, Dr. Vagelis
Papadakis, Associate Professor, Dr. Ioannis Kalavrouziotis, Associate Professor, Hellenic Open
University, for being members of the examination committee and their valuable comments and
suggestions on my thesis.
I want to thank all the respective teachers of the Department of Environmental and Natural
Resources Management, University of Patras for their inspiration during my research period.
Special thank to Dr. Vagelis Papadakis, Associate Professor, Dr. Maria Panitsa, Assistant
Professor and Dr. Dimitris Vlastos, Assistant Professor, Department of Environmental and
Natural Resources Management, University of Patras for providing conveyance from Patras to
Agrinio and vice versa at the beginning of the research period.

Treatment of Industrial and Agro-Industrial Wastewater Using Constructed Wetlands Mar-Yam Sultana
Acknowledgements v
I would like to acknowledge Dr. Athanasia Tekerlekopoulou, Lecturer, Department of
Environmental and Natural Resources Management, University of Patras, for her valuable help in
conducting the experiments and chemical analyses as well as her constructive comments and
suggestions. I would also like to thank her for participating in the examination committee of this
doctoral dissertation. Additionally, during my research period her enormous moral support made
me more determined to conduct my PhD work. I also want to express my deep gratitude to her
entire family for making me feel at home.
I would like to acknowledge the support of Dr. Christina Oikonomou, Dr. Konstantinos
Karanasios, Michael Michailides, PhD student, Triantafyllos Tatoulis, PhD student, Olga
Tsolcha, PhD student of the Laboratory of Environmental Systems, Department of
Environmental and Natural Resources Management. Three persons of the Laboratory of
Environmental Systems in particular deserve the proverbial flowers: Dr. Kostas Karanasios,
Michael Michailides and Triantafyllos Tatoulis for all their support. Their contribution cannot be
expressed in words. It was a pleasure to work together with them and I also feel very fortunate to
have friends like them.
I’m very much thankful to the undergraduate students Giorgos Kefalides, Christina Mourti and
Ilias Kanakakis for their contribution and time during the research work. Evaggelia Tasoula, who
was a Master student of the Laboratory of Environmental Systems, Department of Environmental
and Natural Resources Management, deserves a special word of thanks - without her support it
would have been very difficult for me to continue research and manuscript writing.
My heartfelt thanks to Areti Gianni, Artemis Damati and Miltiadis Zamparas, Department of
Environmental and Natural Resources Management. It was wonderful to share office space with
them. Their congenial behavior made my research period pleasant. I also thanks my present and
ex- colleagues from other laboratories with whom I have enjoyed my past four years.
Solicitous thanks to Ms. Sandy Coles, for English correction of my all manuscripts and this
dissertation. Her amicable attitudes made me more comfortable and relaxed during my living
time in Greece.
Treatment of Industrial and Agro-Industrial Wastewater Using Constructed Wetlands Mar-Yam Sultana
Acknowledgements vi
I want also to thank all the official staff members of the Department of Environmental and
Natural Resources Management, for making all the official documents for this dissertation.
My sincere thanks to the Foreign Language Unit, University of Patras for giving the taught
Modern Greek language Course. Especially I want to express my gratitude to Ms. Nikolitsa
Vasiliou, because of her hard work during the Greek Language Course, which has helped me to
overcome the language barrier.
I want to express my deep gratitude to Dr. Dimitra Kritikou (wife of Prof. Vayenas). Her
affectionate mind always makes me feel that I’m very close to my family. Her hospitality made
my stay in Greece lively. Her psychological support at the very beginning gave me the strength to
stay here. I wish to extend my earnest thanks to the whole family of Prof. Vayenas for making me
feel like a member of their family.
I’m also very thankful to Mrs. Anastasia Diamantidou (wife of Dr. Akratos) for helping us in
different circumstances and also for her cordial relationship.
I warmly express my deepest sense of gratitude and heartfelt thanks to my parents and parents-in-
law for their material and spiritual support, appreciated in all aspects of my life. Especially my
most gratitude to my mother for her willingness and encouragement I attained this moment. Also
I’m very much grateful to my father; his every single advice motivates me to move forward in my
life. My hearty gratitude and thanks to my elder sister, brother-in-law and my little nephew, as
they also inspired me all the time during my PhD.
Lastly, but certainly not least, many thanks to my husband, Abu Chowdhury, for his
encouragement, patience and support during the PhD, for which I am very appreciative. I can just
say thanks for everything and may Allah give him all the best in return.
Treatment of Industrial and Agro-Industrial Wastewater Using Constructed Wetlands Mar-Yam Sultana
Abstract vii
Treatment of Industrial and Agro-Industrial Wastewater Using Constructed
Wetlands
Mar-Yam Sultana
Laboratory of Environmental Systems
Department of Environmental and Natural Resources Management
School of Engineering
University of Patras
Supervisor: Dr. Christos S. Akratos, Assistant Professor
ABSTRACT
Environmental pollution from untreated wastewater disposal is one of the most serious
environmental issues. Hexavalent chromium, Cr(VI), is known to be a very toxic compound,
frequently found in polluted industrial wastewaters, and causes major environmental problems.
On the other hand, among the agro-industrial wastewaters, dairy wastewaters can also cause
serious environmental pollution due to their high organic loads. Specifically, when untreated
dairy wastewater is deposited into surface water bodies it can cause eutrophication and
environmental toxicity.
The use of constructed wetlands began 40 years ago in North America and Europe. The idea
arose from the use of wetlands as final recipients to treat effluent wastewaters. After studies on
their construction and improved operations, today constructed wetlands are used as a processing
technology in many countries for the treatment of municipal wastewater, industrial wastewater,
landfill leachates, etc. Due to their simplicity and low operational cost, constructed wetlands are
becoming more prevalent in wastewater treatment all over the world. Their range of applications
is no longer limited to municipal wastewater or industrial wastewater but has expanded to the
treatment of heavily polluted wastewaters such as agro-industrial effluents. Constructed wetlands
can tolerate high pollutant loads and toxic substances without reducing their removal ability, thus
these systems are very effective bio-reactors even in hostile environments. The potential
application of constructed wetlands in the treatment of chromium-bearing wastewaters has been
reported recently. Additionally, secondary cheese whey, a nutrient-rich wastewater which has
Treatment of Industrial and Agro-Industrial Wastewater Using Constructed Wetlands Mar-Yam Sultana
Abstract viii
high potential of polluting surface and/or groundwater, is now being treated either by
conventional or biological treatment processes. However, limited research has been conducted on
the treatment of secondary cheese whey using constructed wetlands.
The objectives of this PhD research were to evaluate a) the effect of different parameters (HRT,
temperature, physiochemical parameters) on the treatment of wastewater containing Cr(VI) and
secondary cheese whey, using pilot-scale horizontal subsurface flow (HSF) constructed wetlands,
b) a sustainable disposal technique of chromium treated reed biomass and c) the treatment
efficiency of undiluted secondary cheese whey using pilot-scale HSF constructed wetland at very
low HRT and removal of Cr(VI) by providing cheese whey as source of carbon.
In the 1st experimental period of this dissertation, the research focused on the study of integrated
chromium removal from aqueous solutions in HSF constructed wetlands. Two pilot-scale HSF
constructed wetlands (CWs) units were built and operated. One unit was planted with common
reeds (Phragmites australis) and one was kept unplanted. Influent concentrations of Cr(VI)
ranged from 0.5 to 10 mg/L. The effects of temperature and hydraulic residence time (8 - 0.5
days) on Cr(VI) removal were studied. Temperature proved to affect Cr(VI) removal in both
units. In the planted unit, maximum Cr(VI) removal efficiencies of 100% were recorded at
HRT’s of 1 day with Cr(VI) concentrations of 5, 2.5 and 1 mg/L, while a significantly lower
removal rate was recorded in the unplanted unit. Harvested reed biomass from the CWs was co-
composted with olive mill wastes. The final product had excellent physicochemical
characteristics (C/N: 14.1-14.7, germination index (GI): 145-157%, Cr: 8-10 mg/kg dry mass),
fulfills EU requirements, and can be used as a fertilizer in organic farming.
In the 2nd
experiment of the first experimental period of this research, two horizontal subsurface
flow pilot-scale constructed wetlands were built and operated for almost two years to treat
secondary cheese whey. One unit was planted with common reeds (Phragmites australis) and one
was kept unplanted. The pilot-scale wetlands operated under various hydraulic residence times
(8, 4, 2 and 1 day), temperatures (2.4 to 32.90C) and COD influent concentrations (1200 to 7200
mg/L) in order to examine their effect on secondary cheese whey treatment efficiency. Both units
successfully removed organic matter, as COD removal efficiencies of 91% and 77.23% were

Treatment of Industrial and Agro-Industrial Wastewater Using Constructed Wetlands Mar-Yam Sultana
Abstract ix
recorded for the planted and unplanted unit, respectively. Hydraulic residence time affected COD
removal efficiency only when limited to 1 day. Temperature significantly affected COD removal
only in the unplanted unit, while the planted unit's efficiency was affected only by the annual
plant growth cycle. It should be noted that COD effluent concentrations were below EU
legislation units (120 mg/L) even when the CWs operated under the shortest hydraulic residence
time ever reported in the literature (2 days) with COD influent concentrations ranging from 1200
to 3500 mg/L.
In the 2rd
experimental period, a mixed solution of cheese whey and hexavalent chromium was
treated using pilot-scale horizontal subsurface flow constructed wetlands. This study was
performed in order to assess the effect of hydraulic residence time, the initial concentrations of
both substances (i.e., Cr(VI) and cheese whey), the presence of vegetation, and surface load
throughout the treatment process. Two hydraulic residence times (HRT) (8 and 4 days) were
applied. The average electrical conductivity did not show any significance and the average pH
values also did not fluctuate. COD concentrations varied between 2000 to 3000 mg/L, and Cr(VI)
concentrations were between 0.5 and 5 mg/L. Regarding the removal of organic matter, the
planted pilot units had the highest removal rates of around 70%, compared to the unplanted units
with around 50%. The vegetation does not affect the removal of Cr(VI) whereas for COD
removal, the vegetation does not perform its proper function which leads us to conclude that
Cr(VI) influences the removal of COD.
The overall outcome of this research is a significant contribution to the treatment of Cr(VI) and
secondary cheese whey using constructed wetland technology. It could also be concluded that,
constructed wetlands can potentially remove both Cr(VI) and COD at very low HRTs (1 and 2
days, respectively), when receiving moderate pollutant concentrations (5 mg Cr(VI)/L and >5000
mg COD/L), without any seasonal effect. Moreover, by using cheese whey as the carbon source,
Cr(VI) can be successfully removed in constructed wetland systems with 4 days of HRT.
Key Words: Hexavalent chromium, cheese whey, HSF constructed wetlands, vegetation, HRT,
temperature, common reeds, composting.

Treatment of Industrial and Agro-Industrial Wastewater Using Constructed Wetlands Mar-Yam Sultana
Περίληψη x
Επεξεργασία Βιομηχανικών και Αγρο-Βιομηχανικών Λυμάτων με τη Χρήση
Τεχνητών Υγροβιότοπων
Mar-Yam Sultana
Εργαστήριο Περιβαλλοντικών Συστημάτων
Τμήμα Διαχείρισης Περιβάλλοντος και Φυσικών Πόρων
Πολυτεχνική Σχολή
Πανεπιστήμιο Πατρών
Επιβλέπων: Χρήστος Σ. Ακράτος, Επίκουρος Καθηγητής
ΠΕΡΙΛΗΨΗ
Η ρύπανση του περιβάλλοντος από τα ανεπεξέργαστα λύματα αποτελεί ένα από τα
σημαντικότερα περιβαλλοντικά ζητήματα. Το εξασθενές χρώμιο (Cr(VI)), που είναι γνωστό για
την τοξική του δράση, εντοπίζεται συχνά σε βιομηχανικά υγρά απόβλητα και προκαλεί
σημαντικά περιβαλλοντικά προβλήματα. Από την άλλη τα υγρά απόβλητα τυροκομικών
μονάδων επίσης αποτελούν σημαντική περιβαλλοντική απειλή, λόγω του υψηλού οργανικού
τους φορτίου. Ειδικότερα όταν ανεπεξέργαστα τυροκομικά υγρά απόβλητα καταλήγουν σε
επιφανειακά υδάτινα σώματα μπορούν να προκαλέσουν ευτροφισμό και τοξικά φαινόμενα.
Η χρήση των τεχνητών υγροβιότοπων ξεκίνησε πριν από περίπου 40 χρόνια στη Βόρεια Αμερική
και την Ευρώπη. Η ιδέα προήλθε από τη χρήση φυσικών υγροβιότοπων ως τελικών αποδεκτών
επεξεργασμένων υγρών αποβλήτων. Μετά από εκτεταμένη έρευνα σήμερα οι τεχνητοί
υγροβιότοποι χρησιμοποιούνται ευρέως ως τεχνολογία επεξεργασίας διαφόρων ειδών υγρών
αποβλήτων και απορροών (π.χ. αστικά, βιομηχανικά, δισταλλάγματα κλπ.). Λόγω της απλότητας
τους και του χαμηλού λειτουργικού κόστους οι τεχνητοί υγροβιότοποι αποτελούν πλέον μια
ανταγωνιστική τεχνολογία. Το εύρος των εφαρμογών τους δεν περιορίζεται πλέον μόνο στην
επεξεργασία αστικών υγρών αποβλήτων, αλλά έχει επεκταθεί και στην επεξεργασία ισχυρών
υγρών αποβλήτων, όπως των αγροτοβιομηχανικών. Οι τεχνητοί υγροβιότοποι είναι ανθεκτικοί
σε υψηλά ρυπαντικά φορτία και σε τοξικές ουσίες χωρίς να επηρεάζεται σημαντικά η λειτουργία
τους. Συνεπώς οι τεχνητοί υγροβιότοποι είναι ιδιαιτέρως αποτελεσματικοί βίο-αντιδραστήρες

Treatment of Industrial and Agro-Industrial Wastewater Using Constructed Wetlands Mar-Yam Sultana
Περίληψη xi
ακόμα και ιδιαίτερα εχθρικά περιβάλλοντα. Η δυνατότητα χρήσης τεχνητών υγροβιότοπων για
την επεξεργασία υγρών αποβλήτων με χρώμιο, μόλις πρόσφατα έχει αρχίσει να μελετάται. Επί
πλέον ο δευτερογενής ορρός γάλακτος (τυρόγαλα), που είναι ένα υγρό απόβλητο με υψηλό
περιεχόμενο θρεπτικών, κυρίως επεξεργάζεται με τη χρήση φυσικοχημικών και βιολογικών
μεθόδων, ενώ η χρήση τεχνητών υγροβιότοπων είναι περιορισμένη.
Ο κύριος σκοπός της παρούσας διατριβής ήταν η αξιολόγηση της επίδρασης διαφόρων
παραμέτρων (υδραυλικού χρόνου παραμονής-HRT, θερμοκρασίας, φυσικοχημικών παραμέτρων)
στην επεξεργασία αποβλήτων που περιέχουν Cr(VI) καθώς και του δευτερογενούς ορρού
γάλακτος με τη χρήση πιλοτικών μονάδων τεχνητών υγροβιότοπων οριζόντιας υπόγειας ροής.
Επιπλέον η παρούσα διατριβή στόχευε και στην εξεύρεση μιας βιώσιμης τεχνικής για την
επεξεργασία της φυτικής βιομάζας και στην χρήση του δευτερογενούς ορρού γάλακτος, ως πηγή
άνθρακα στην επεξεργασία του Cr(VI).
Στη διάρκεια της 1ης
πειραματικής περιόδου της παρούσας διατριβής, η έρευνα επικεντρώθηκε
στη μελέτη της ολοκληρωμένης απομάκρυνσης του χρωμίου από υδατικά διαλύματα και στην
επεξεργασία δευτερογενή ορρού γάλακτος από πιλοτικές μονάδες τεχνητών υγροβιότοπων
οριζόντιας υπόγειας ροής. Για την ολοκληρωμένη απομάκρυνση του Cr(VI) χρησιμοποιηθήκαν
δύο πιλοτικές μονάδες τεχνητών υγροβιότοπων οριζόντιας υπόγειας ροής. Η μία πιλοτική
μονάδα ήταν φυτεμένη με κοινό καλάμι (Phragmites australis), ενώ η άλλη παρέμεινε αφύτευτη.
Οι συγκεντρώσεις του Cr(VI) στα υδατικά διαλύματα κυμάνθηκαν από 0.5 έως 10 mg/L. Επίσης
εξετάστηκε η επίδραση της θερμοκρασίας και του HRT (8 - 0.5 ημέρες) στην αφαίρεση του
Cr(VI). Η θερμοκρασία αποδείχτηκε να επηρεάζει την αφαίρεση του Cr(VI) και στις 2 πιλοτικές
μονάδες. Οι αποδόσεις απομάκρυνσης του Cr(VI) στην φυτεμένη πιλοτική μονάδα έφθασαν το
100% ακόμα και για HRT της 1 ημέρας, με συγκεντρώσεις εισόδου Cr(VI) 5, 2.5 και 1 mg/L. Σε
αντίθεση, η αφύτευτη πιλοτική μονάδα κατέγραψε σημαντικά χαμηλότερες αποδόσεις
απομάκρυνσης Cr(VI). Η φυτική βιομάζα που συλλέχθηκε από την φυτεμένη πιλοτική μονάδα
κομποστοποιήθηκε μαζί με στερεά απόβλητα ελαιοτριβείου. Το τελικό προϊόν της
κομποστοποιήσης είχε εξαιρετικά φυσικοχημικά χαρακτηριστικά (C/N: 14.1-14.7, δείκτης
βλαστικότητας (GI): 145-157%, Cr: 8-10 mg/kg dry mass), τα οποία πληρούν τα όρια της
Ευρωπαϊκής Ένωσης για τη χρήση του ως λίπασμα σε οργανικές καλλιέργειες.

Treatment of Industrial and Agro-Industrial Wastewater Using Constructed Wetlands Mar-Yam Sultana
Περίληψη xii
Η δεύτερη πειραματική διάταξη της 1ης
πειραματικής περιόδου περιελάμβανε δύο όμοιες
πιλοτικές μονάδες με τις παραπάνω, που ωστόσο χρησιμοποιήθηκαν για την επεξεργασία
δευτερογενούς ορρού τυρογάλακτος. Οι πιλοτικές μονάδες λειτούργησαν υπό διαφόρους
χρόνους παραμονής (8, 4, 2 και 1 ημέρα), θερμοκρασίες (από 2.4 έως 32.90C) και συγκεντρώσεις
εισόδου COD (από 1200 έως 7200 mg/L) Οι δύο μονάδες επεξεργάστηκαν επιτυχώς το
δευτερογενή ορρό γάλακτος, αφού καταγράφηκαν για την φυτεμένη και την αφύτευτη πιλοτική
μονάδα, αποδόσεις αφαίρεσης COD της τάξης του 91% και 77.23%, αντίστοιχα. Ο υδραυλικός
χρόνος παραμονής επηρέασε την απόδοση τω δύο πιλοτικών μονάδων μόνο όταν μειώθηκε στην
1 ημέρα. Αντιθέτως, η θερμοκρασία επηρέασε μόνο την αφύτευτη πιλοτική μονάδα, ενώ η
απόδοση της φυτεμένης επηρεάστηκε μόνο από τον ετήσιο κύκλο ανάπτυξης των φυτών. Πρέπει
να τονιστεί ότι οι συγκεντρώσεις εξόδου του COD ήταν χαμηλότερες των ορίων της Ε.Ε., ακόμα
και για χρόνους παραμονής 2 ημερών (ο χαμηλότερος που έχει αναφερθεί μέχρι τώρα στη
βιβλιογραφία) με αρχικές συγκεντρώσεις εισόδου COD από 1200 έως 3500 mg/L.
Στη διάρκεια της 2ης
πειραματικής περιόδου οι τέσσερεις συνολικά πιλοτικές μονάδες που
χρησιμοποιήθηκαν στην 1η περίοδο, χρησιμοποιήθηκαν επίσης και για την επεξεργασία ενός
μεικτού διαλύματος δευτερογενή ορρού γάλακτος και Cr(VI). Στόχος των πειραμάτων που
πραγματοποιήθηκαν ήταν η αξιολόγηση της επίδρασης του χρόνου παραμονής (8 και 4 ημέρες),
των συγκεντρώσεων εισόδου του Cr(VI) (από 0.5 έως 5 mg/L) και του COD (από 2000 έως 3000
mg/L), του φυτού και του επιφανειακού φορτίου στην απόδοση των πιλοτικών μονάδων. Όσον
αφόρα την αφαίρεση της οργανικής ύλης, οι φυτεμένες πιλοτικές μονάδες κατέγραψαν
υψηλότερα ποσοστά απομάκρυνσης (περίπου 70%) σε σύγκριση με τις αφύτευτες (περίπου
50%). Σε αντίθεση, η απομάκρυνση του Cr(VI) έδειξε να μην επηρεάζεται από την παρουσία
φυτών. Τέλος, παρατηρήθηκε ότι η ύπαρξη του Cr(VI) επηρεάζει την απομάκρυνση του
οργανικού φορτίου.
Τα τελικά συμπεράσματα της παρούσας διατριβής αποτελούν μια σημαντική συνεισφορά στην
επεξεργασία υγρών αποβλήτων που περιέχουν Cr(VI) καθώς και του δευτερογενή ορρού
γάλακτος από τεχνητούς υγροβιότοπους. Επίσης μπορεί να συμπεραθεί ότι η χρήση των
τεχνητών υγροβιότοπων για την αφαίρεση Cr(VI) και COD μπορεί να επιτευχθεί ακόμη και σε
πολύ χαμηλούς χρόνους παραμονής (1 και 2 ημερών, αντίστοιχα), καθώς και σε υψηλές αρχικές
Treatment of Industrial and Agro-Industrial Wastewater Using Constructed Wetlands Mar-Yam Sultana
Περίληψη xiii
συγκεντρώσεις (5 mg Cr(VI)/L και >5000 mg COD/L, αντίστοιχα). Τέλος, η χρήση του
δευτερογενή ορρού γάλακτος ως πηγή άνθρακα στην αφαίρεση του Cr(VI), ήταν πλήρως
επιτυχημένη.
Λέξεις κλειδιά: Εξασθενές χρώμιο, ορρός γάλακτος, οριζόντιας υπόγειας ροής τεχνητοί
υγροβιότοποι, υδραυλικός χρόνος παραμονής, φύτευση, θερμοκρασία κοινά καλάμια,
κομποστοποιήση.

Treatment of Industrial and Agro-Industrial Wastewater Using Constructed Wetlands Mar-Yam Sultana
Content xiv
CONTENTS
Chapter 1: Introduction ............................................................................................................... 1
1.1) Background ......................................................................................................................... 1
1.2) Research objectives and thesis relevance ............................................................................ 6
1.3) Novelty ................................................................................................................................ 9
Chapter 2: Industrial and Agro-Industrial Wastewaters ....................................................... 11
2.1) Industrial Wastewater .................................................................................................... 11
2.1.1) Textile wastewater ..................................................................................................... 12
2.1.2) Tannery wastewater ................................................................................................... 13
2.1.3) Acid mine .................................................................................................................. 14
2.1.4) Landfill leachate ........................................................................................................ 15
2.2) Agro-Industrial Wastewater .......................................................................................... 16
2.2.1) Dairy wastewater ....................................................................................................... 16
2.2.2) Animal farm ............................................................................................................... 17
2.2.3) Olive mill wastewater ................................................................................................ 17
2.2.4) Winery wastewater .................................................................................................... 18
2.3) Chromium (Occurrence and Uses) ................................................................................ 18
2.3.1) Environmental chemistry of Cr ................................................................................. 22
2.3.2) Physical and chemical characteristics ....................................................................... 24
2.3.3) Nutrition and toxicity of Cr: Health risk to humans .................................................. 26
2.3.3.1) Toxicity of Cr to animals ................................................................................... 27
2.3.3.2) Toxicity of Cr to plants and algae ..................................................................... 28
2.3.4) Remediation or treatment .......................................................................................... 29
2.4) Cheese Manufacturing .................................................................................................... 29
2.4.1) Cheese whey .............................................................................................................. 31
2.4.2) Sources ...................................................................................................................... 32
2.4.3) Characteristics and composition of cheese whey ...................................................... 32
2.4.4) Cheese whey – pollutant characteristics .................................................................... 33
2.4.5) Remediation or treatment .......................................................................................... 34
Chapter 3: Constructed Wetlands............................................................................................. 35
3.1) Components of Constructed Wetlands .......................................................................... 37
Treatment of Industrial and Agro-Industrial Wastewater Using Constructed Wetlands Mar-Yam Sultana
Content xv
3.1.1) Water ......................................................................................................................... 37
3.1.2) Soil substrate/porous media ....................................................................................... 37
3.1.3) Wetland vegetation/macrophytes .............................................................................. 39
3.1.3.1) Role of macrophytes ............................................................................................... 40
i) Physical appearence ............................................................................................... 40
ii) Surface area for attached microbial growth .......................................................... 41
iii) Root release/creation of aerobic environment ..................................................... 42
iv) Organic compound release ................................................................................... 43
v) Nutrient uptake and storage ................................................................................... 44
3.1.4) Microorganisms ......................................................................................................... 44
3.2) Types of Constructed Wetlands ..................................................................................... 45
3.2.1) Surface Flow/ Free Water Surface flow .................................................................... 46
3.2.2) Horizontal Sub-Surface Flow .................................................................................... 48
3.2.3) Vertical Flow ............................................................................................................. 46
3.3) Design Factors ................................................................................................................. 52
3.3.1) Pretreatment ............................................................................................................... 52
3.3.2) Hydrology .................................................................................................................. 52
3.3.2.1) Hydraulic loading rate (HLR) ............................................................................ 53
3.3.2.2) Hydraulic Retention Time (HRT) ...................................................................... 53
2.3.3) Design of bed/bed area .............................................................................................. 55
3.3.4) Selection of wetland plants ........................................................................................ 56
3.3.5) Inlet structure ............................................................................................................. 59
3.3.6) Outlet Structure ......................................................................................................... 59
3.4) Removal Mechanisms of Constructed Wetlands .......................................................... 59
3.4.1) Organic matter removal ............................................................................................. 60
3.4.2) Nitrogen removal ....................................................................................................... 62
3.4.3) Phosphorus removal .................................................................................................. 64
3.4.4) Total suspended solids removal ................................................................................. 65
3.4.5) Heavy metals (Cr) removal ....................................................................................... 65
3.5) Application for Cr(VI) treatment .................................................................................. 66

Treatment of Industrial and Agro-Industrial Wastewater Using Constructed Wetlands Mar-Yam Sultana
Content xvi
3.6) Application of CWs in Agro-Industrial wastewaters Treatment .................................... 74
3.6.1) Pre-treatment stages in treatment of Dairy Wastewaters .......................................... 74
3.6.2) CW types in treatment of Dairy Wastewaters .......................................................... 74
3.6.3) Vegetation for Dairy Wastewater treatment in CW systems ..................................... 78
3.6.4) Pre-treatment stages in treatment of Animal Farm Wastewater ................................ 79
3.6.5) CW types in treatment of Animal Farm Wastewater ................................................ 79
3.6.6) Vegetation for Animal Farm Wastewater in CW systems ....................................... 82
3.6.7) Pre-treatment stages in treatment of OMW wastewater ............................................ 83
3.6.8) CW types in treatment of OMW wastewater ............................................................ 83
Chapter 4: Materials and Methods ........................................................................................... 90
4.1) First Experimental Period .............................................................................................. 90
4.1.1) Description of pilot-scale CW unit ............................................................................ 90
4.1.2) Wastewater preparation for Cr(VI) treatment ........................................................... 90
4.1.3) Wastewater preparation for secondary cheese whey ................................................. 93
4.1.4) Water quality monitoring .......................................................................................... 94
4.1.5) Assessment of evapotranspiration ............................................................................. 94
4.1.6) Reed biomass in composting ..................................................................................... 97
4. 1.6.1) Composting materials and process ................................................................... 97
4.1.6.2) Physicochemical analyses ................................................................................. 97
4.2) Second Experimental Period ........................................................................................ 100
4.2.1) Description of pilot-scale CW unit .......................................................................... 100
4.2.2) Description of the experimental setup ..................................................................... 100
4.2.3) Wastewater preparation ........................................................................................... 101
Chapter 5: Pilot-Scale HSF Constructed Wetlands Treating Cr(VI) .................................. 104
5.1) Effects of Physicochemical Parameters of Wastewater ............................................. 104
5.1.1) Temperature ............................................................................................................. 104
5.1.2) pH ............................................................................................................................ 105
5.1.3) Electrical Conductivity (EC) ................................................................................... 109
5.1.4) Dissolve Oxygen (DO) ............................................................................................ 112
5.2) Treatment Efficiency of pilot-Scale HSF Constructed Wetlands ............................. 112
5.3) Effect of HRT ................................................................................................................. 117
Treatment of Industrial and Agro-Industrial Wastewater Using Constructed Wetlands Mar-Yam Sultana
Content xvii
5.4) Cr Mass Balance ............................................................................................................ 121
5.5) Composting of Plant Biomass ...................................................................................... 124
Chapter 6: Pilot-Scale HSF Constructed Wetlands Treating Cheese Whey ....................... 127
6.1) Physicochemical Parameters ........................................................................................ 127
6.1.1) pH ............................................................................................................................ 127
6.1.2) EC ............................................................................................................................ 128
6.1.3) DO ........................................................................................................................... 128
6.2) Treatment Efficiency of Pilot-Scale HSF Constructed Wetlands ............................. 128
6.3) Effect of HRT ................................................................................................................. 132
6.4) Effect of Temperature ................................................................................................... 136
6.5) Effects of Vegetation ..................................................................................................... 137
Chapter 7: Combined Treatment of Cr(VI) and Cheese Whey in Pilot-Scale HSF
Constructed Wetlands ............................................................................................................... 139
7.1) Physicochemical Parameters ........................................................................................ 139
7.1.1) pH ............................................................................................................................ 139
7.1.2) EC ............................................................................................................................ 141
7.2) Removal Efficiency of Cr(VI) in Four Pilot-Scale HSF Constructed Wetlands with
Co-Treated Wastewaters ..................................................................................................... 141
7.2.1) Effect of vegetation on Cr(VI) removal .................................................................. 147
7.2.2) Effect of HRTs on Cr(VI) removal ......................................................................... 153
7.2.3) Comparison with experimental results of the first operational period .................... 154
7.3) Removal Efficiency of COD in Four Pilot-Scale HSF Constructed Wetlands with Co-
Treated Wastewaters ............................................................................................................ 155
7.3.1) Effect of vegetation on Cr(VI) removal .................................................................. 160
7.3.2) Effect of HRTs on Cr(VI) removal ......................................................................... 162
7.3.3) Comparison with experimental results of the first operational period .................... 167
Chapter 8: General Discussion ................................................................................................ 169
8.1) Overall discussion .......................................................................................................... 169
8.2) Application ..................................................................................................................... 174
Chapter 9: Conclusion and Future Research ......................................................................... 175
9.1) Overall Conclusions ...................................................................................................... 175
9.2) Recommendations for Future Research ...................................................................... 177

Treatment of Industrial and Agro-Industrial Wastewater Using Constructed Wetlands Mar-Yam Sultana
Content xviii
References .................................................................................................................................. 178
Appendix .................................................................................................................................... 236
Curriculum Vitae ...................................................................................................................... 246

Treatment of Industrial and Agro-Industrial Wastewater Using Constructed Wetlands Mar-Yam Sultana
List of Tables xix
List of Tables
Table 2.1 Chromium compounds with different oxidation states ............................................ 21
Table 2.2 Amount of cheese whey obtained from different type of cheese productions. ....... 32
Table 2.3 General composition of fresh whey .......................................................................... 33
Table 3.1 The major roles of macrophytes in constructed treatment wetlands ........................ 42
Table 3.2 HLR for different types of CWs ............................................................................... 54
Table 3.3 Key design and operational specifications for HF and VF CWs ............................. 56
Table 3.4 Free water surface constructed wetland (FWS CW) ................................................ 68
Table 3.5 Horizontal surface flow constructed wetland (HSF CW)......................................... 69
Table 3.6 Vertical flow constructed wetland (VF CW) ............................................................ 69
Table 3.7 Treatment of chromium-polluted wastewaters using hybrid constructed wetland
systems ..................................................................................................................................... 73
Table 3.8 Studies of dairy wastewater treatment by CWs ................................................... 76-77
Table 3.9 Studies of animal farm wastewater treatment by CWs ....................................... 80-81
Table 3.10 Studies of olive mill wastewater treatment by CWs .............................................. 84
Table 3.11 Pollutant influent and effluent concentrations compared with EU standards (EU
Directive 1991/271/EEC) ......................................................................................................... 89
Table 4.1 Description of experimental set-ups of composting ................................................. 97
Table 4.2 Concentrations of Cr(VI) and COD used in the second experimental period ........ 101
Table 5.1 Comparisons of Cr (VI) removal between different HRTs and temperature ......... 118
Table 5.2 Cr concentrations recorded in different parts of reed plants .................................. 123
Table 5.3 Physicochemical parameters during the composting period .................................. 126
Table 6.1 Physicochemical characteristics of SCW wastewater ............................................ 127
Table 6.2 Treatment of dairy wastewaters using different types of CWs .............................. 135
Table 6.3 Comparison of COD removal rates with different HRTs ....................................... 136
Table 7.1 Physicochemical characteristics of co-treated wastewaters (mixed of cheese whey
and Cr(VI) solution) ............................................................................................................... 139
Table 7.2 Comparisons of Cr(VI) removal during the two operational periods..................... 154
Table 7.3 Comparisons of COD removal in the two experimental sessions .......................... 167

Treatment of Industrial and Agro-Industrial Wastewater Using Constructed Wetlands Mar-Yam Sultana
List of Figures xx
List of Figures
Fiugre 1.1 Worldwide available water resources ...................................................................... 1
Fiugre 1.2 Global water withdrawal and waste over time ......................................................... 2
Fiugre 1.3 Ratio of treated to untreated wastewater reaching water bodies for 10 regions ...... 3
Fiugre 1.4 Generation of hazardous waste throughout the world .............................................. 5
Fiugre 2.1 Chromium speciation in water ............................................................................... 19
Fiugre 2.2 Pure chromium ....................................................................................................... 20
Fiugre 2.3 Chromium(VI) oxide .............................................................................................. 21
Fiugre 2.4 Use of Chromium and its compounds .................................................................... 22
Fiugre 2.5 Chromium circulation in the environment .............................................................. 24
Fiugre 2.6 Possible forms of Cr(VI) in solution in the presence of iron particles.................... 24
Fiugre 2.7 Distribution of Cr(VI) species as a (a) function of pH, and (b) fraction of HCrO4-
and Cr2O7-2
at pH 4 as a function of total Cr(VI) ..................................................................... 26
Fiugre 2.8 Flow sheet for the manufacture of cheese ............................................................... 30
Fiugre 2.9 Simplified cheese production inputs and outputs ................................................... 32
Fiugre 3.1 Schematic diagram of a constructed wetland and its mechanisms ......................... 36
Fiugre 3.2 Possible interactions in the root zone of wetlands for wastewater treatment ......... 36
Fiugre 3.3 Different types of substrates for CWs (a) gravel, (b) course gravel, (c) fine gravel,
(d) sands, (e) soil ...................................................................................................................... 38
Fiugre 3.4 Micrograph of gas spaces in a Typha latifolia root (scale bar, 1 mm) .................... 40
Fiugre 3.5 Biofilm on submerged parts of wetland plants ....................................................... 41
Fiugre 3.6 Release of oxygen from roots of Phragmites australis. The blue colour around the
roots is formed by radical oxygen release from the roots that oxidized the reduced form of
methylen blue ........................................................................................................................... 43
Fiugre 3.7 Classification of CWs for wastewater treatment ..................................................... 46
Fiugre 3.8 Schematic diagram of free water surface constructed wetland ............................... 47
Fiugre 3.9 Schematic diagram of horizontal surface flow constructed wetland ...................... 48
Fiugre 3.10 Substrate structure of HSF CWs ........................................................................... 49
Fiugre 3.11 Vertical flow constructed wetland ........................................................................ 51
Fiugre 3.12 Different types of wetland plants .......................................................................... 58
Fiugre 3.13 Processes occurring in a wetland .......................................................................... 60

Treatment of Industrial and Agro-Industrial Wastewater Using Constructed Wetlands Mar-Yam Sultana
List of Figures xxi
Fiugre 4.1 Pilot-scale HSF CWs for the treatment of Cr(VI) ................................................... 91
Fiugre 4.2 Pilot-scale HSF CWs for the treatment of SCW ..................................................... 91
Fiugre 4.3 Inflow perforated plastic pipe (diffuser) for both units ........................................... 92
Fiugre 4.4 Outlet structure of the CWs (a) Tube arranged at the same height as the filler material)
(b) Effluent collected point (c) 35L plastic tank for overflow wastewater collection ..................... 92
Fiugre 4.5 Influent storage tank with adjusted valve................................................................ 93
Fiugre 4.6 Time series chart for air temperature (2011-2012) ................................................. 95
Fiugre 4.7 Time series chart for precipitation (2011-2012) ..................................................... 96
Fiugre 4.8a Composting materials in Bin 1 at day 1 ................................................................ 98
Fiugre 4.8b Composting materials in Bin 2 at day 1 ................................................................ 98
Fiugre 4.9a Mature compost in Bin 1 at 102 days .................................................................... 99
Fiugre 4.9b Matured compost in Bin 2 at 102 days ................................................................. 99
Fiugre 4.10 Integrated treatment of cheese whey and Cr(VI) in HSF CWs ........................... 100
Fiugre 4.11 Time series chart for air temperature, 0C (2013) ................................................. 102
Fiugre 4.12 Time series chart for precipitation (2013) ........................................................... 103
Fiugre 5.1a pH values of influent and effluent wastewaters in the Cr-U unit ........................ 107
Fiugre 5.1b pH values of influent and effluent wastewaters in the Cr-P unit ........................ 108
Fiugre 5.2a EC value of influent and effluent wastewaters in the Cr-U unit ......................... 110
Fiugre 5.2b EC values of influent and effluent wastewaters in the Cr-P unit ........................ 111
Fiugre 5.3a Time series charts of Cr(VI) influent and effluent concentrations for Cr-U ....... 115
Fiugre 5.3b Time series charts of Cr(VI) influent and effluent concentrations for Cr-P ....... 116
Fiugre 5.4a Effect of surface load on Cr(VI) removal for Cr-U............................................. 119
Fiugre 5.4b Effect of surface load on Cr(VI) removal for Cr-P ............................................. 120
Fiugre 5.5 Harvested reed plants treated with Cr(VI) solutions ............................................. 122
Fiugre 5.6 Time series of compost and ambient temperature during composting period ...... 125
Fiugre 6.1a Time series charts for COD removal with influent and effluent concentrations in
the SCW–U ............................................................................................................................. 130
Fiugre 6.1b Time series charts for COD removal with influent and effluent concentrations in
the SCW-P .............................................................................................................................. 131
Fiugre 6.2a Correlation of surface load and removal rates for COD in the SCW-U.............. 133
Fiugre 6.2b Correlation of surface load and removal rates for COD in the SCW-P .............. 134

Treatment of Industrial and Agro-Industrial Wastewater Using Constructed Wetlands Mar-Yam Sultana
List of Figures xxii
Fiugre 7.1a Time series charts for Cr(VI) removal with influent and effluent concentrations in
the SCW-U unit ...................................................................................................................... 142
Fiugre 7.1b Time series charts for Cr(VI) removal with influent and effluent concentrations in
the SCW-P unit ....................................................................................................................... 143
Fiugre 7.2a T Time series charts for Cr(VI) removal with influent and effluent concentrations
in the Cr-U unit ....................................................................................................................... 144
Fiugre 7.2b Time series charts for Cr(VI) removal with influent and effluent concentrations in
the Cr-P unit ........................................................................................................................... 145
Fiugre 7.3 Belowground parts of reed plants ......................................................................... 148
Fiugre 7.4a Effect of surface load on Cr(VI) removal in the SCW-U unit ............................ 149
Fiugre 7.4b Effect of surface load on Cr(VI) removal in the SCW-P unit ............................. 150
Fiugre 7.5a Effect of surface load on Cr(VI) removal in the Cr-U unit ................................. 151
Fiugre 7.5b Effect of surface load on Cr(VI) removal in the Cr-P unit ................................. 152
Fiugre 7.6a Time series charts for COD removal with influent and effluent concentrations in
the SCW-U unit ...................................................................................................................... 156
Fiugre 7.6b Time series charts for COD removal with influent and effluent concentrations in
the SCW-P unit ....................................................................................................................... 157
Fiugre 7.7a Time series charts for COD removal with influent and effluent concentrations in
the Cr-U unit ........................................................................................................................... 158
Fiugre 7.7b Time series charts for COD removal with influent and effluent concentrations in
the Cr-P unit ........................................................................................................................... 159
Fiugre 7.8a Correlation charts of surface load and removal rates of COD in the SCW-U unit
................................................................................................................................................ 163
Fiugre 7.8b Correlation charts of surface load and removal rates of COD in the SCW-P unit
................................................................................................................................................ 164
Fiugre 7.9a Correlation charts of surface load and removal rates of COD in the Cr-U unit .. 165
Fiugre 7.9b Correlation charts of surface load and removal rates for COD in the Cr-P unit 166

Treatment of Industrial and Agro-Industrial Wastewater Using Constructed Wetlands Mar-Yam Sultana
Abbreviation and Acronyms xxiii
Abbreviation and Acronyms
CW Constructed wetland
Cr Chromium
Cr(VI) Hexavalent Chromium
Cr(III) Trivalent Chromium
SCW Secondary Cheese whey
FWS Free Water Surface
HSF Horizontal Surface Flow
BOD Biochemical Oxygen Demand
COD Chemical Oxygen Demand
TSS Total Suspended Solids
HRT Hydraulic Residence Time
HLR Hydraulic Loading Rate
TP Total Phosphorus
Τ Temperature
ΤΚΝ Total Kjedahl Nitrogen
EPA Environmental Protection Agency
ACD Acid Mine Drainage
OMW Olive mill Wastewater

Treatment of Industrial and Agro-Industrial Wastewater Using Constructed Wetlands Mar-Yam Sultana
Chapter 1: Introduction
CHAPTER 1: GENERAL INTRODUCTION
1.1) Background ....................................................................................................................... 1
1.2) Research objectives and thesis relevance ........................................................................ 6
1.3) Novelty ............................................................................................................................... 9

Treatment of Industrial and Agro-Industrial Wastewater Using Constructed Wetlands Mar-Yam Sultana
Chapter 1: Introduction 1
CHAPTER 1: GENERAL INTRODUCTION
1.1) Background
The environment is composed of atmosphere, earth, water and space. Without pollution, it
remains clean and enjoyable. The complex nature of the environment gets changed by
different activities of man, including industrialization, construction, transportation, etc. Such
activities, although desirable for human development and welfare, lead to environmental
degradation and the release of objectionable materials into the environment leading to loss of
quality of life.
Over half of the world’s population faces water scarcity. Almost 900 million people in the
world still do not have access to safe water and some 2.6 billion, almost half the population of
the developing world, do not have access to adequate sanitation. At least 1.8 million children
under five years old die every year due to water related diseases. Additionally, 1.2 billion
people (one fifth of the world’s population) live in areas of water scarcity (Corcoran et al.,
2010; WWDR, 2014). Figure 1.1 shows the world distribution of renewable water resources.
Figure1.1: Worldwide available water resources (WWDR, 2014).

Treatment of Industrial and Agro-Industrial Wastewater Using Constructed Wetlands Mar-Yam Sultana
Chapter 1: Introduction 2
Among the different sectors of water uses, presently agriculture uses most water; between
70% and 90% of all water in most regions (Grobicki, 2007; Corcoran et al., 2010). About 70-
90% of the world’s available fresh water is used during food production. Figure 1.2 shows the
global withdrawal, consumption and waste of water for the different sectors. Approximately
20% and 10% of total freshwater withdrawals are used by the industrial and domestic sectors,
respectively (WWDR, 2014). Of these two sectors, industry generates a substantial proportion
of wastewaters, although these figures vary considerably between countries (WWAP, 2009).
Nearly all human activities result in the production of wastewater. Globally, about 80% of
wastewater from human settlements and industrial sources is discharged into the environment
without treatment (Corcoran et al., 2010).
Figure 1.2: Global water withdrawal and waste over time (Corcoran et al., 2010).
In many developing countries more than 70% of industrial wastes are disposed untreated into
free surface water (WWAP, 2009). In many cases, industrial wastewaters not only drain
directly into rivers and lakes but also contaminate groundwater aquifers and wells. These
wastewaters also contaminate coastal ecosystems and contribute to growing marine dead
zones. 90% of all untreated wastewater is discharged directly into rivers, lakes or oceans in

Treatment of Industrial and Agro-Industrial Wastewater Using Constructed Wetlands Mar-Yam Sultana
Chapter 1: Introduction 3
many developing countries (UN Water, 2008). Figure 1.3 shows the ratio of treated and
untreated wastewaters around the world.
Figure 1.3: Ratio of treated to untreated wastewater reaching water bodies for 10 regions
(Corcoran et al., 2010).
Industrial discharge contains a wide range of contaminants and originates from numerous
sources. Untreated industrial wastewater has the potential to be a highly toxic source of
pollution. A vast array of complex organic compounds and heavy metals are used in modern
industrial processes and if they are released into the environment can cause both human health
and environmental disasters. Toxic industrial waste is generated by mining, pulp mills,
tanneries, sugar refineries, and pharmaceutical production, among others.
Normally industrial wastewaters are categorized into two types: inorganic industrial
wastewater and organic industrial wastewater. Coal and steel industries produce inorganic
wastewaters along with non-metallic minerals industries, commercial enterprises and
industries for the surface processing of metals (iron picking works and electroplating plants)
that also generate inorganic wastewaters. These wastewaters contain a large proportion of
suspended matter, which could be eliminated by sedimentation, together with chemical
Treatment of Industrial and Agro-Industrial Wastewater Using Constructed Wetlands Mar-Yam Sultana
Chapter 1: Introduction 4
flocculation through the addition of iron or aluminum salts, flocculation agents and various
organic polymers. Chemical industries and large-scale chemical works, which mainly use
organic substances for chemical reactions, generate organic industrial wastewaters.
Since the Stone Age, about 1150 million tones of heavy metals (copper, lead, cobalt, zinc,
cadmium and chromium) have been mined from the earth. During the period 1959-1990, the
production of six major non-ferrous metals (zinc, copper, lead, tin, nickel and aluminum)
increased eightfold (Sheoran and Sheoran, 2006). Nowadays, the effluents from metal-
working industries contain hazardous waste compounds (chromium, nickel, zinc, cadmium,
lead, iron and titanium). Of these, the electroplating industry is an important pollution
distributor, dry cleaning and car repair shops generate solvent waste, and printing plants
release inks and dyes. The pulp and paper industry used heavily chlorine-based substances,
and generates chloride organics and dioxins, as well as suspended solids and organic matter
containing wastes. The petrochemical industry discharges large amounts of phenols and
mineral oils. Also wastewater from different food and dairy processing plants contain high
proportion of suspended solids and organic materials. Due to the various characteristics of
industrial wastewaters, their treatment must be designed specifically for the particular type of
effluent produced.
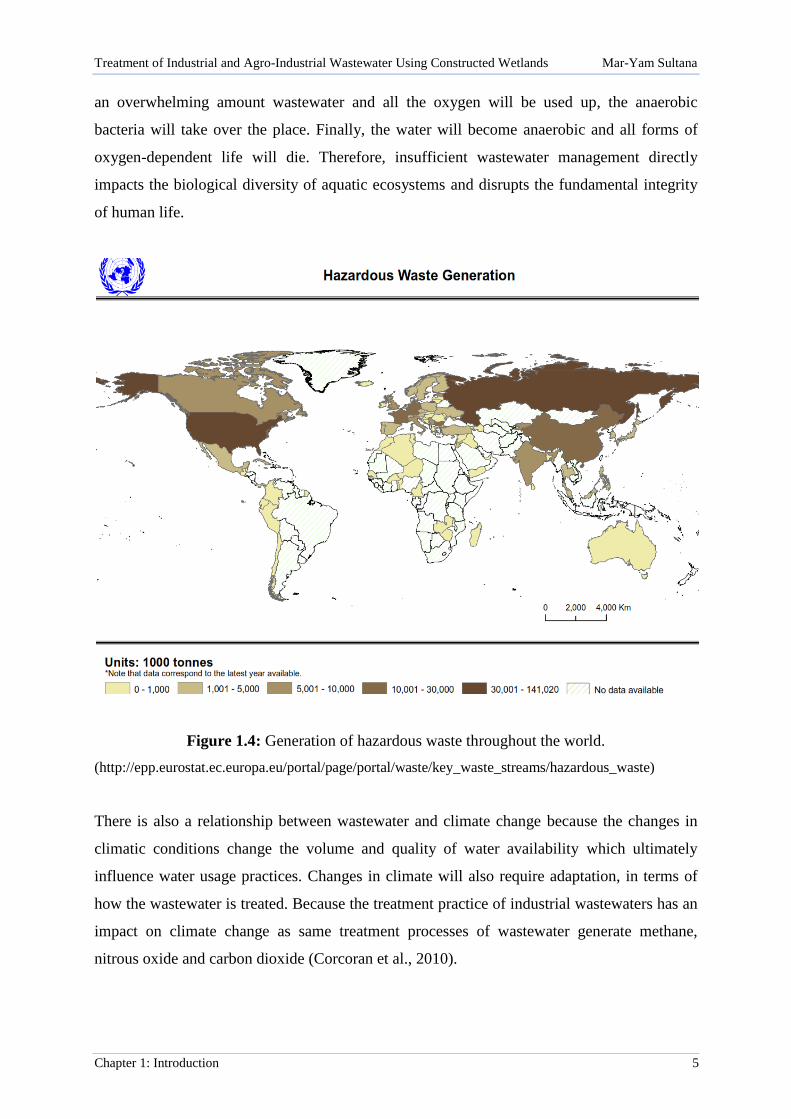
The sludge remaining after the treatment of industrial wastewaters contains many hazardous
wastes (including heavy metals) and these are often found in lake sediments and can degrade
planktonic communities and aquatic ecosystems. Heavy metals can impact human health and
wildlife in various ways. For example, lead interferes with the nervous system which leads to
disabilities in children, and heavy metal accumulation leads to the damage of human and
animal organs. Figure 1.4 shows the recent scenario of hazardous waste generation throughout
the world (UNSD/UNEP Questionnaires on Environment Statistics, Waste section; last update
March 2011).
When wastewater is mixed with fresh water, bacteria use the pollutants as an energy source
and decompose them. This pollutant decomposition occurs in a natural environment where
dissolved oxygen content is high and aerobic (oxygen-using) bacteria decompose pollutants
and produce new bacterial cells. In environments where dissolved oxygen content is low,
anaerobic (non-oxygen-using) bacteria decompose the organic waste material and release
odorous gases such as hydrogen sulphide and methane (Ferguson, 2003). Moreover, if there is
Treatment of Industrial and Agro-Industrial Wastewater Using Constructed Wetlands Mar-Yam Sultana
Chapter 1: Introduction 5
an overwhelming amount wastewater and all the oxygen will be used up, the anaerobic
bacteria will take over the place. Finally, the water will become anaerobic and all forms of
oxygen-dependent life will die. Therefore, insufficient wastewater management directly
impacts the biological diversity of aquatic ecosystems and disrupts the fundamental integrity
of human life.
Figure 1.4: Generation of hazardous waste throughout the world.
(http://epp.eurostat.ec.europa.eu/portal/page/portal/waste/key_waste_streams/hazardous_waste)
There is also a relationship between wastewater and climate change because the changes in
climatic conditions change the volume and quality of water availability which ultimately
influence water usage practices. Changes in climate will also require adaptation, in terms of
how the wastewater is treated. Because the treatment practice of industrial wastewaters has an
impact on climate change as same treatment processes of wastewater generate methane,
nitrous oxide and carbon dioxide (Corcoran et al., 2010).

Treatment of Industrial and Agro-Industrial Wastewater Using Constructed Wetlands Mar-Yam Sultana
Chapter 1: Introduction 6
Water is a limited resource, the demand for which is growing with the rise in global
population. Therefore, the treatment and reuse of wastewaters is essential. To be successful
and sustainable, wastewater management must be an integral part of rural and urban
development planning, across all sectors.
1.2) Research objectives and thesis relevance
Cr(VI) is one of the most hazardous metals and it is known to a 100-fold more toxicity than
Cr(III), for both acute and chronic exposures, because of its high water solubility, mobility
and easy reduction. Due to its toxicity, stringent regulations are imposed on the discharge of
total Cr into surface waters to below 0.05 mg/L by the EPA (Baral and Engelken, 2002) and
the EU (EC, 1998). A wide range of technologies is available for the reduction/removal of
Cr(VI) from aqueous solutions, some of which are well-established methods that have been
practiced for decades such as precipitation, filtration, chemical oxidation or reduction, ion
exchange, reverse osmosis, electrochemical treatment, membrane technologies, evaporative
recovery, and activated carbon adsorption (Owlad et al., 2009). However, these approaches
are costly and can themselves produce other waste problems. Therefore, there is a need to
develop cost-effective and more environment-friendly techniques. Biological systems, such as
bioreduction, bio-accumulation or bio-sorption using living cells, as well as aquatic plants,
have been examined for their chromium removal abilities (Fude et al., 1994; Aguilar et al.,
2008; Calheiros et al., 2009). These systems offer potential alternatives to existing
technologies that remove Cr(VI) from water and wastewater. Advances in the field of
environmental microbiology and biotechnology indicate that bacteria (Stasinakis et al., 2002;
Zouboulis et al., 2004), fungi (Sanghi et al., 2009), yeast (Chen and Wang, 2007), and algae
(Bankar et al., 2009), either as pure or mixed cultures, can remove chromium (VI) from
aqueous solutions. Until present, most microbial Cr(VI) removal was obtained by pure culture
techniques under either anaerobic or aerobic conditions depending on the species or
consortium in question (Shen and Wang, 1993). However, the main disadvantage of using
pure cultures to remove chromium compounds is related to the use of sterile conditions to
prevent external microbial contamination, thus increasing treatment costs and hindering their
wide applicability. Additionally, most of the biological methods for treatment of Cr(VI)-
containing wastewater are operated in batch mode (Chirwa and Wang, 2004) probably due to
the eventual loss of the active biomass. It seems impossible to continuously remove Cr(VI) on

Treatment of Industrial and Agro-Industrial Wastewater Using Constructed Wetlands Mar-Yam Sultana
Chapter 1: Introduction 7
a long-term basis using bioreactors, without intermittently reseeding the biomass (Chen and
Hao, 1997).
Like other agro-industries, the dairy industry produces large quantities of wastewaters which
are characterized by high organic content, i.e., high Chemical Oxygen Demand (COD) and
Biological Oxygen Demand (BOD) (Demirel et al., 2005). The dairy industry processes large
volumes of milk, and the major waste produced from processing is water. Raw milk produces
yogurt, butter, cheese, etc., by means of different processes (pasteurization, coagulation,
filtration, centrifugation, chilling, etc) (Rivas et al., 2010). Cheese production is an important
portion of the dairy industry in the European Union as more than 40% its annual milk
production is processed into cheese (EC, 2009). More than 45 million tons of cheese whey
(CW) is produced in the EU each year (Jasko, 2011). Cheese whey is the liquid by-product of
the cheese making process (Rajeshwari et al., 2000).
Every year 160 million tons of cheese whey are produced worldwide and half of the total
cheese whey production is disposed directly into the environment (Smithers, 2008; Guimaraes
et al., 2010). The disposal of cheese whey has always been a major problem for the dairy
industry. As dairy wastewaters contain large amounts of proteins, when they are discharged
directly into the environment, not only is there a significant loss of resources but also major
environmental pollution. Its direct disposal can affect the physical and chemical structure of
soil, for which crop yields decrease. In addition, when cheese whey is discharged into water
resources, it affects the aquatic ecosystems by consuming excessive oxygen, (Siso, 1996;
Panesar et al., 2007), and the nutrients it contains lead to eutrophication of the receiving
waters.
Dairy wastewaters are generally treated by using different biological methods such as
activated sludge processes, aerated lagoons, trickling filters, sequencing batch reactor (SBR),
anaerobic sludge blanket (UASB) reactor, anaerobic filters, etc. (Demirel et al., 2005;
Prazeres et al., 2012). Frequently, the post-treatment of dairy wastewaters is also done using
physicochemical treatment methods consisting of coagulation/flocculation by various
inorganic and organic natural coagulants, and membrane processes such as nanofiltration (NF)
and/or reverse osmosis (RO) (Kushwaha et al., 2011).

Treatment of Industrial and Agro-Industrial Wastewater Using Constructed Wetlands Mar-Yam Sultana
Chapter 1: Introduction 8
Recently constructed wetlands (CWs) are used to treat different kinds of wastewaters
including agro-industrial (Dunne et al., 2005; Vymazal, 2010). CWs are known from the
decade 80's and low-cost technology that has been used to treat various types of wastewaters
for nearly twenty years (Ghosh and Gopal, 2010; Hunt et al., 2003). They are an attractive
treatment option because they use solar energy, are simple to construct and operate, have low
maintenance cost and are inexpensive and sustainable compared to conventional treatment
methods (Jamieson et al., 2007). They have grown in popularity since the early 1980s (Reed
et al., 1995). In addition, due to their high pollutant removal efficiency, they can be used to
treat a wide variety of wastewaters (Sultana et al., 2014b). These systems are very cost
effective compared to the physicochemical wastewater treatment methods (Knox et al., 2006).
Various applications/experiments using CWs for Cr removal have been recorded in the last
decade, at both laboratory-scale and full-scale (Sultana et al., 2014b). These applications
either examine Cr removal from various types of wastewaters and activated sludge, or from
Cr-containing aqueous solutions. The extremely high Cr removal efficiencies (up to 100%)
achieved in these studies together with their low capital and operational costs, make CWs an
attractive alternative for Cr removal. CW is a flexible treatment method, as it can be used as a
single treatment step or as a polishing stage in an existing treatment facility depending on the
exact specification of the wastewaters concerned. Horizontal subsurface flow (HSF) CWs
were tested (Aguilar et al., 2008; Calheiros et al., 2009) and appeared rather efficient at
removing Cr(VI) as removal rates reached 100%. Other researchers have studied horizontal
subsurface flow (HSF) CWs for removing Cr.
One of the main issues concerning Cr(VI) removal using CWs is the post-treatment
management of plant biomass that contains high Cr concentrations. For the most effective
pollutant removal, the plants should be harvested at the end of each vegetation cycle. After
harvesting, the contaminated plants can either be discarded into a bare field which adds to the
environmental risk, or they can be used for some other purpose. A compatible method of
disposal for this biomass is needed and for this reason, in this dissertation, harvested CW reed
biomass was co-composted with olive mill wastes. Previous studies have examined the role of
plant species and porous media on Cr(VI) removal, but no comparative studies have been
conducted on the effects of temperature and hydraulic retention time (HRT).
Recently, CWs have also been more frequently used to treat different kinds of agro-industrial
wastewaters, including dairy. The use of CWs for treating dairy wastewaters is a relatively

Treatment of Industrial and Agro-Industrial Wastewater Using Constructed Wetlands Mar-Yam Sultana
Chapter 1: Introduction 9
recent application of biological treatments (Schaafsma et al., 2000) and a significant number
of studies have been conducted. Some of these mixed dairy wastewater with other wastewater
types such as dirty farmyard waters (Dunne et al., 2005) and municipal wastewaters (Mantovi
et al., 2002; 2003). Only two studies have used CWs to treat secondary cheese whey (SCW)
wastewater (Comino et al., 2011; Mantovi et al., 2011). HSF CWs appear to be more efficient
at treating dairy wastewater as they achieve extremely high organic matter removal
efficiencies (up to 95%). However, only a few studies have examined systematically either
the effect of temperature (Sharma et al., 2013a) or the effect of the pollutant loading rate
(Sharma et al., 2013b) on CW performance.
The objectives of this PhD research were:
Using pilot-scale HSF CWs to assess the removal of different concentrations of Cr(VI)
with different hydraulic retention times (HRT) and determine the HRT with highest
the removal rate through a series of experiments.
To propose a viable and cost effective treatment for the harvested reed biomass that is
contaminated with Cr(VI).
To examine secondary cheese whey treatment using pilot-scale HSF CWs. To assess
the effect of different COD influent concentrations and HRTs, at various temperatures
and pollutant loads, on COD removal.
To examine the use of cheese whey as a carbon source for Cr(VI) removal from HSF
CWs.
To compare the removal rates of Cr(VI) and COD during two experimental periods
and also to compare the effects of HRTs, the influent concentrations of Cr(VI) and
COD, and vegetation.
1.3) Novelty
i) Various studies have been conducted on Cr(VI) removal using CWs. These studies
examined different parameters including the role of the plant species and porous media, but to
date no comparative studies have been conducted on the effects of temperature and HRT on
Cr(VI) removal. One of the major issues regarding Cr(VI) removal using CWs is the disposal
of plant biomass that contains high Cr concentrations as there are no studies in the literature

Treatment of Industrial and Agro-Industrial Wastewater Using Constructed Wetlands Mar-Yam Sultana
Chapter 1: Introduction 10
on the compatible method of disposal of this plant material disposal. This dissertation presents
the experimental results of pilot-scale HSF CWs that removed Cr(VI) from wastewater.
Specifically, this work discusses the effect of HRT and temperature on the removal of Cr(VI)
and the disposal of the contaminated biomass by composting. For the first time, a viable and
cost effective solution for treating the contaminated reed biomass is proposed. Reed biomass
was co-composted with olive mill wastes and produced high quality compost.
ii) Published experiments using different CWs to treat dairy wastewater have achieved high
organic matter removal rates (up to 99%), although they operated with high HRTs (11 days)
and low influent COD concentrations. However, in most of these experiments the dairy
wastewaters were mixed, and thus diluted, with different dairy plant cleaning wastewaters and
pure cheese whey was not treated. Only a few studies have examined systematically either the
effect of temperature or the effect of the pollutant loading rate on CW performance for dairy
wastewater treatment but not for the treatment of pure SCW. The second part of this PhD
work presents the experimental results of HSF CWs for cheese whey wastewater treatment
and specifically the effect of temperature, vegetation, organic load and HRT on the removal
of COD were examined for the first time in pilot-scale CWs treating pure cheese whey
solution. In this research, two pilot-scale HSF CWs successfully operated under extremely
low HRTs of 2 days. In addition, an initial design guideline is proposed for CW units treating
secondary cheese whey.
iii) The final experimental results of this PhD research present an integrated treatment of
cheese whey and Cr(VI) wastewaters in CWs for the first time. HSF CWs can successfully
remove Cr(VI) with 4 days HRT and in the presence of COD.

Treatment of Industrial and Agro-Industrial Wastewater Using Constructed Wetlands Mar-Yam Sultana
Chapter 2: Industrial and Agro-Industrial Wastewaters
CHAPTER 2: INDUSTRIAL AND AGRO-INDUSTRIAL
WASTEWATERS
2.1) Industrial Wastewater .................................................................................................... 11
2.1.1) Textile Wastewaters .................................................................................................. 12
2.1.2) Tannery Wastewaters ................................................................................................ 13
2.1.3) Acid mine .................................................................................................................. 14
2.1.4) Landfill leachate ........................................................................................................ 15
2.2) Agro-Industrial Wastewaters ........................................................................................ 16
2.2.1) Dairy wastewaters ..................................................................................................... 16
2.2.2) Animal farm .............................................................................................................. 17
2.2.3) Olive mill wastewater................................................................................................ 17
2.2.4) Winery wastewater .................................................................................................... 18
2.3) Chromium (Occurrence and Uses) ................................................................................ 18
2.3.1) Environmental chemistry of Cr ................................................................................. 22
2.3.2) Physical and chemical characteristics ....................................................................... 24
2.3.3) Nutrition and toxicity of Cr: health risks to humans ................................................. 26
2.3.3.1) Toxicity of Cr to animals ..................................................................................... 27
2.3.3.2) Toxicity of Cr to plants and algae ....................................................................... 28
2.3.4) Remediation or treatment .......................................................................................... 29
2.4) Cheese Manufacturing ................................................................................................... 29
2.4.1) Cheese whey .............................................................................................................. 31
2.4.2) Sources ...................................................................................................................... 32
2.4.3) Characteristics and composition of cheese whey ...................................................... 32
2.4.4) Cheese whey – pollutant characteristics.................................................................... 33
2.4.5) Remediation or treatment .......................................................................................... 34
Treatment of Industrial and Agro-Industrial Wastewater Using Constructed Wetlands Mar-Yam Sultana
Chapter 2: Industrial and Agro-Industrial Wastewaters 11
CHAPTER 2: INDUSTRIAL AND AGRO-INDUSTRIAL
WASTEWATER
Water pollution is one of the most serious environmental problems and it is caused by a
variety of human activities such as industrial, agricultural and domestic. Untreated or
improperly treated wastewaters are the major source of surface water body pollution. Many
water born diseases and other health problems are caused by polluted waters. Sediments
carried out by runoff water from agricultural fields and discharge of untreated or partially
treated sewage and industrial effluents, disposal of fly ash or other solid wastes into a water
body all cause severe water pollution. Water pollution can be caused by pathogens, inorganic
compounds, organic material and macroscopic pollutants. Worldwide, some 780 million
people still lack access to clean drinking water sources (WHO, 2012). Over time, a series of
treatment technologies have been developed to treat wastewaters.
2.1) Industrial Wastewater
The production and use of chemical compounds has increased tremendously worldwide and
many of these compounds are biologically non-degradable. Therefore, the major concern is to
treat the wastewater before it is discharged into the environment. However, wastewaters are
not properly treated and this affects water quality (UNESCAP, 2000). Effluents discharged
from industrial and agriculture activities are high in volume and also include high
concentrations of heavy metals and organic compounds. In most of cases those effluents are
drained without proper treatment (UNESCAP, 1999).
Wastewater is categorized and defined according to its sources of origin. Wastewaters
discharged principally from residential sources and generated by such activities as food
preparation, laundry, cleaning and personal hygiene, are termed as “domestic wastewater”.
Industrial/commercial wastewaters originate and are released from manufacturing processing
industries and commercial activities such as printing, textile, steel, food and beverage
processing (Medcities and ISR EWC, 2003).
Various industries are major sources of pollution. Based on the type of industry, various
levels of pollutants can be discharged into the environment directly or indirectly through

Treatment of Industrial and Agro-Industrial Wastewater Using Constructed Wetlands Mar-Yam Sultana
Chapter 2: Industrial and Agro-Industrial Wastewaters 12
public sewer lines. Industrial wastewater can also include sanitary wastes, manufacturing
wastes and relatively uncontaminated water from heating and cooling operations (Emongor et
al., 2005). One of the major problems of wastewater is their high content of heavy metals,
solvents, dyes, pesticides, etc (Oller et al., 2011), which can have toxic effects (Nies, 1999;
Duncan et al., 2003). The main types of industrial and agro-industrial wastewaters include:
o Textile
o Tannery
o Acid mine
o Landfill leachate
o Dairy
o Animal farm
o Olive mill
o Winery
2.1.1) Textile Wastewaters
Among the waste producing industries, textile dyeing processes are the most environmental
unfriendly industrial processes, because they produce colored wastewaters that are heavily
polluted with dyes, textile auxiliaries and chemicals (Roussy et al., 2005). In the textile
industry, the presence of color in discharges is one of the major problems. The characteristics
of textile wastewater depend on the production, technology and chemicals used (Awomeso et
al., 2010). Usually textile industries consume huge quantities of water and generate large
volumes of wastewater through various steps in dyeing and finishing processes and the
released wastewater is a complex mixture of different polluting substances such as inorganic,
organic, elemental and polymeric products (Brown and Laboureur, 1983). Dye wastes are the
most predominant substances in textile wastewater and these substances not only toxic to the
biological world but also the dark color of those substances blocks sunlight that creates acute
problems in ecosystems (Choi et al., 2004).
A wide range of chemicals and dyestuffs, are required for dyeing and finishing and these are
generally organic compounds of complex structure. All of these compounds are not contained
in the final product but are found in waste and cause disposal problems (Savin and Butnaru,
2008). Major pollutants in textile wastewaters are high suspended solids (SS) (26200 mg/L),

Treatment of Industrial and Agro-Industrial Wastewater Using Constructed Wetlands Mar-Yam Sultana
Chapter 2: Industrial and Agro-Industrial Wastewaters 13
chemical oxygen demand (COD) (12000-50000 mg/L), chromium (Cr) (50 mg/L), heat,
colour (4750 mg/L), acidity, and other soluble substances; (Bisschops and Spanjers 2003;
Venceslau et al., 1994; World Bank, 2007). In addition, only 47%-87% of dyestuffs are
biodegradable (Pagga and Brown, 1986). More than 100,000 dyes are available today (of
which azo dyes represent about 70% on weight basis), and over one million tons dyes are
produced per year, of which 50% are textile dyes (Boyter, 2007).
2.1.2) Tannery Wastewaters
Tanning is the chemical process through which animal hides and skin are converted into
leather and related products. The conversion of hides into leather is usually done by many
tanning agents and the process generates a highly turbid, colored and foul smelling
wastewater. The major polluting substances of tannery effluents include sulfide, chromium
(Cr), volatile organic compounds, large quantities of solid waste and suspended solids like
animal hair and trimmings (EC, 2003). The presence of these substances in the effluent affects
humans, agricultural fields and livestock. The toxins can cause diseases in tannery workers
such as eye diseases, skin irritations, kidney failure and gastrointestinal problems (Midha and
Dey, 2008). Also, certain streams from the production process of tannery industries contain
high salinity which is a concerning factor for the environment and can jeopardize the
biological wastewater treatment (Lefebvre and Moletta, 2006).
Untreated tannery wastewaters contain high COD, Biochemical Oxygen Demand (BOD)
levels, trivalent chromium (Cr(III)), sulfides, sodium chloride (NaCl), Calcium (Ca),
Magnesium (Mg), organics and other toxic ingredients and when these untreated wastewaters
are directly released into natural water bodies, they effect ecosystem flora and fauna and
increase the health risk to human beings (Kolomaznik et al., 2008; Chattopadhyay et al.,
1999). These wastewaters contain high loads of organic matter as well as high concentrations
of sulphate, sulphide, chloride and Cr which are very difficult to treat (Reemtsma and Jekel,
1997; Reemtsma et al., 2002). In the tanning process, about 300 kg chemicals are added per
ton of hides (Verheijen et al., 1996) and after processing, about 30-35 L of processed
wastewaters are generated per kg of skin with variable pH values and high concentrations of
SS, BOD, COD, including Cr (Nandy et al., 1999).

Treatment of Industrial and Agro-Industrial Wastewater Using Constructed Wetlands Mar-Yam Sultana
Chapter 2: Industrial and Agro-Industrial Wastewaters 14
During the tanning process chromium salts are used and these generate two forms of Cr;
hexavalent chromium (Cr(VI)) and trivalent chromium (Cr(III)). Of these two forms, Cr(VI)
is highly toxic to living organisms even at low concentrations causing carcinogenic effects. It
also creates toxicity in anaerobic digestion by accumulating metal in the intracellular fraction
of biomass. Environmental protection regulations have imposed strict limits for Cr emission.
Due to the high toxicity of Cr(VI), the U.S. Environmental Protection Agency (EPA) and the
European Union (EU) regulate total Cr concentrations in surface waters to below 0.05 mg/L,
including Cr(III), Cr(VI). Thus, removal of chromium from the wastewater is very important.
2.1.3) Acid mine
Acid Mine Drainage (AMD) occurs when sulfide-bearing material is exposed to oxygen and
water, and creates hydroxide, sulfate and hydrogen ions (Durkin & Hermann 1994). The
waste rocks which contain sulfides are the main source of AMD. Pyrite (FeS2) is responsible
for the generation of acid and metal dissolution in coal and hard rock (Wildeman et al. 1991).
Mining activities expose this mineral to water and cause increased acidity, concentrations of
heavy metals, sulfate, and other total dissolved solids. AMD is a major source of water
pollution in coal mining regions. It normally contains high levels of iron, aluminum, and acid
(Hadley and Snow, 1974). Acid mine waters also contain high concentrations of dissolved
heavy metals and sulphate with a high turbidity and low pH values (around 2) (Feng et al.,
2004). Arsenic and chromium are often abundant constituents of AMD where arsenic
concentrations range from 100-500 mg/L in highly acidic AMD and 70−80% of chromium is
present as Cr(VI) (Wang et al., 2013). Due to these characteristics (low pH and high
concentrations of heavy metals and other toxic elements), surface and groundwater as well as
soils can be severely contaminated by AMD (Peppas et al., 2000).
The amount of acid generated depends on environmental parameters such as pH, temperature,
oxygen concentration of the air (if saturation <than 100%), and water phase, degree of
saturation with water, chemical activity of Fe3+
, surface area of exposed metal sulfide,
chemical activation energy for acid generation, and bacterial activity. Apart from, these the
permeability of the waste rock dump is particularly important because dumps with high
permeability have high oxygen ingress which contributes to higher chemical reaction (Akcil
and Koldas, 2006).

Treatment of Industrial and Agro-Industrial Wastewater Using Constructed Wetlands Mar-Yam Sultana
Chapter 2: Industrial and Agro-Industrial Wastewaters 15
Wastes from acid mine factories are often reddish-brown in color, which indicates high levels
of oxidized iron (Hadley and Snow, 1974). Acid generation and metal dissolution are the
primary problems associated with pollution due to mining activities. Debris from waste piles
can be transported by the wind which results in contamination of surrounding areas with
metals. Silt and sediments may run-off into nearby streams and become obstacles to water
flow. In underground mines, alkaline drainage is more common than in surface mines and it is
not as environmentally damaging as AMD (Akcil and Koldas, 2006). One feature of AMD is
that after the closure of a mine its sources may remain active for decades or even centuries
(Modis et al., 1998).
2.1.4) Landfill leachate
With the worldwide increase of population urbanization, the disposal of solid waste has
become a major issue. Despite significant progress in reducing waste volume by reuse and
recycling, the bulk of municipal waste is still disposed of in landfill sites. The most
economical method of disposing of municipal solid waste is landfilling (Ustohalova et al.,
2006). Leachates are defined as the aqueous effluent generated as a result of rainwater
percolation through wastes, biochemical processes, and the dormant water content of wastes.
When exposed to the oxygen-free (anaerobic) conditions of a landfill, biodegradable wastes,
such as paper, card and waste food, are decomposed by bacteria and produce gas and soluble
chemicals. These soluble chemicals mix with liquids in the waste (e.g. rainwater) to form
landfill leachate (URL 1). Toxicity analyses carried out using different organisms have
confirmed that landfill leachates contain potentially toxic substances (Renou et al., 2008) and
therefore, it should undergo treatment before being discharged into receiving waters.
Landfill leachate contains large amounts of organic and inorganic compounds (Bodzek et al.,
2006). Usually this waste has high BOD (e.g. 9500 mg/L) values and even higher COD
(14000 mg/L) content (Kjeldsen et al., 2002). Major inorganic compounds of leachate are:
calcium (Ca), magnesium (Mg), sodium (Na), potassium (K), ammonium (NH4+), iron (Fe),
manganese (Mn), chloride (Cl-), sulphates (SO4
-2) and bicarbonates (HCO3
-) (Kjeldsen et al.
2002).
Leachate flow rate is closely linked to precipitation, surface run-off and infiltration or
intrusion of groundwater percolating through the landfill (Renou et al., 2008). When the waste

Treatment of Industrial and Agro-Industrial Wastewater Using Constructed Wetlands Mar-Yam Sultana
Chapter 2: Industrial and Agro-Industrial Wastewaters 16
is compacted at lower depth leachate production is greater because compaction reduces the
filtration rate (Lema et al., 1988). Many factors affect the quality of leachates such as age,
precipitation, seasonal weather variation, waste type and composition (depending on the
standard of living of the surrounding population). Moreover, the composition of landfill
leachates varies depending on the age of the landfill (Baig et al., 1999).
2.2) Agro-Industrial Wastewaters
Agro-industries are one of the major contributors to the world industrial wastewater pollution
problem. Wastewaters of agro-food industries contain proteins, sugars, oils and greases and
are predominantly loaded with organic wastes and are rich in organic contents. The disposal
of these effluents into the environment contributes to surface and groundwater contamination,
causing eutrophication, ecosystem imbalance and human health risks. Environmental
regulatory authorities of worldwide are imposing stricter criteria for the discharge of
wastewaters from industries. As regulations become stricter, obviously these wastewaters
should be treated efficiently.
2.2.1) Dairy wastewaters
The dairy industry generates large quantities of wastewater, as per liter of processed milk, 0.2
to 10 L of wastewater are produced (Vourch et al., 2008). Dairy wastewaters contain high
concentrations of organic matter (e.g. fat, milk, protein, lactose, lactic acid), minerals and
detergents. Typical dairy wastewater characteristics include 4000-59000 mg/L COD, 70-800
mg/L TSS, 100-1400 mg/L TN and 25-450mg/L TP (Vourch et al., 2008).
Dairy wastewaters are mainly generated by the milk processing units where the
pasteurization, homogenization of fluid milk are processed. Large amounts of wastewaters are
also created from the production of dairy products such as butter, cheese, milk powder etc.
Large volume of water are used in cleaning processing units, resulting in wastewater which
also contains detergent, sanitizers, base, salts and organic matter, depending upon sources
(Belyea et al., 1990). Differences in production widely change the volume and strength of the
wastewater. Thus, effluent characteristics rely on the production of wastewater volume per

Treatment of Industrial and Agro-Industrial Wastewater Using Constructed Wetlands Mar-Yam Sultana
Chapter 2: Industrial and Agro-Industrial Wastewaters 17
unit (litres waste water/kg product), concentration (mg/L), and weight of waste generated per
unit of g waste/kg product (Carawan et al., 1979).
2.2.2) Animal farm
Animal farming is one of the main agriculture components worldwide and a major
environmental concern (Hunt and Poach, 2001). Animal farms as medium or small
enterprises, lack manpower, finance and technical competence in order to efficiently treat
their wastewater. Animal farm’s wastewater treatment problem is also reinforced by the fact
that these wastewaters have high organic matter and phosphorus loads (Babatunde and Zhao,
2010). Animal farm wastewaters are usually characterized by high concentrations of organic
matter (COD: 38000-85000 mg/L), nitrogen (TKN 1400-3300 mg/L; NH4+-N: 500-1300
mg/L) and TSS (28500-61000 16 mg/L) (Kim and Kwon, 2006).
2.2.3) Olive mill wastewater
Olive mills are scattered all over the Mediterranean region and produce large volumes of olive
mill wastewater (OMW) over a relatively short period of time (usually from November to
February). Wastewater from olive processing is one of the strongest industrial effluents with
high organic loads (Paraskeva and Diamadopoulos, 2006). Annually 11 million tons of olives
are processed in olive mills producing about 9 million tons of OMW (Aktas, et al., 2001).
OMW is an aqueous, dark, bad-smelling and turbid suspension having a very high organic
load (COD=15–390 g L-1
), an acidic pH (4.6–5.8) and a significant content of phytotoxic and
antibacterial phenol substances (total phenols=1.5–14 g/L) (Bubba et al., 2004). The main
problem of this wastewater is that olive oil production is seasonal, so the treatment process
should be flexible enough to operate in a non-continuous mode, otherwise the wastewater
needs to stored. Moreover, most olive mills are small enterprises, mainly family businesses,
dispersed around the olive production areas, making individual on-site treatment options
costly. If the untreated effluent of olive mill wastes is deposited, it may cause, plant leaf and
fruit abscission and inhibition of seed germination. Discharge into water bodies increases
their phosphorous content, causes colour alteration and bad odour. Finally, the disposal of
olive mill wastewater in open spaces enhances microbial fermentation with the production of
methane and a wide array of harmful or simply bad-smelling gases.

Treatment of Industrial and Agro-Industrial Wastewater Using Constructed Wetlands Mar-Yam Sultana
Chapter 2: Industrial and Agro-Industrial Wastewaters 18
2.2.4) Winery wastewater
Another agro-industrial waste is winery wastewater. Wineries, distilleries and other grape
processing industries annually generate large volumes of strongly organic wastewater
(Petruccioli et al., 2000). Winery wastewater is created from the various processes and
operations which are carried out in wine production as well as the water used to wash
equipment and bottles, and from cooling processes (Serrano et al., 2011). Large volumes of
polluted water are produced in winemaking and it varies from one winery to another,
depending on the production period and the unique style of winemaking of the different
wineries (Agustina et al., 2007).
Wastes from wineries, in addition to water, also include unspent grapes and juice, wine and
remnants from winemaking such as alcohol and sugars, and cleaning agents (Petruccioli et al.,
2002). Large suspended matter of winery wastewater contains grape skins, leaves, stems, and
seeds, while smaller suspended particles are mainly dead yeast cells and cell fragments (lees),
grit, dirt, diatomaceous earth, and bentonite (Vlyssides et al., 2005). Maximum organic
loading usually occurs from early September through early November (harvest season).
Different winemaking operations – such as cleaning of the crusher, pomace conveyors,
presses, and fermentation tanks may also produce high strength wastewaters (Conradie et al.,
2014). Winery wastewater is characterized with low pH (because of organic acids produced in
the fermentation process), with variable salinity and nutrient levels, and these characteristics
indicate that the wastewater has the potential components for environmental pollution (Mosse
et al., 2011). Winery wastewater also contains high concentrations of readily biodegradable
soluble organic matter and a variable content of suspended solids. COD concentrations vary
from 500 to 45,000 mg/L and TSS from 12 to 7300 mg/L, while BOD is about 0.4–0.9 of the
COD value (Shepherd et al., 2001; Petruccioli et al., 2002; Masi et al., 2002; Mosteo et al.,
2008). Nitrogen and phosphorus concentrations in winery wastewaters are usually low and the
pH values vary from 3.5 to 7. The main biodegradable fractions in winery wastewater are
ethanol, glucose, fructose and tartaric acid (Serrano et al., 2011).
2.3) Chromium (Occurrence and Uses)
Chromium (Cr) has an atomic number of 24 and a mass number is 51.9961 and belongs to the
first series of transition metals. Among the world’s most strategic and critical materials, Cr
Treatment of Industrial and Agro-Industrial Wastewater Using Constructed Wetlands Mar-Yam Sultana
Chapter 2: Industrial and Agro-Industrial Wastewaters 19
has a wide range of uses in the metals and chemical industries. Cr alloys increase metal
endurance to impact, corrosion, and oxidation (Jacobs and Testa, 2004). Cr can exist in
various oxidation states which ranging from 0 to 6+. The speciation and other activities of Cr
compounds depend on the various chemical and biological changes that occur in the
environment. The solubility and adsorption of Cr in soil and sediments depend on the
different forms of Cr species (Sharma, 2002). Cr can exist in different oxidation states (Fig.
2.1), but depending on the ranges of redox potentials and pH that are commonly found in
soils, the Cr(III) and Cr(VI) states prevail (Ščančar and Milačič, 2014). The two common
stable oxidation states of Cr present in the environment, i.e. trivalent chromium, Cr(III) and
hexavalent chromium, Cr(VI), have different charges, physicochemical properties as well as
chemical and biochemical reactivity (Jacobs and Testa, 2004). Cr(III) is a trace element
essential for living organisms. Moreover, Cr(III) is responsible for the control of glucose and
lipid metabolism in mammals (Anderson, 1989).
While Cr(III) is an essential microelement, Cr(VI) is considered as a carcinogenic agent
(Flora et al., 1990; IARC, 1990) and the carcinogenicity of Cr(VI)-containing compounds has
been documented by governmental organizations (EPA, 1984) and international agencies
(IARC, 1990). The toxic and carcinogenic properties of Cr(VI) compounds appear due to the
possible free diffusion of chromate (CrO42−
) ions over living cell membranes and their action
as an oxidizing agent, as well as the formation of free radicals during the reduction of Cr(VI)
to Cr(III) inside the cell (O’Brein et al., 2003; Gad, 1989).
Figure 2.1: Chromium speciation in water (Ščančar and Milačič, 2014).

Treatment of Industrial and Agro-Industrial Wastewater Using Constructed Wetlands Mar-Yam Sultana
Chapter 2: Industrial and Agro-Industrial Wastewaters 20
Three thermodynamic stable forms of chromium, Cr(0), Cr(III) and Cr(VI), are used and
available in the environment. Cr(0) (Fig. 2.2) is exclusively found in metallic form and is used
in commonly iron-based alloy components such as stainless steel (Zhitkovich, 2011).
Figure 2.2: Pure chromium
Cr(VI) has strong oxidizing capacity and exists only as pH-dependent soluble oxygenated
species governed by the following equation (Nieboer and Jusys, 1988):
H2CrO4↔ H+
+ HCrO4− log (K a1) = 0.6………………… (2.1)
HCrO4−↔ H
+ + CrO4
2-
log (K a2) = -5.9...………….….. (2.2)
HCrO4− and CrO4
2− (Fig. 2.3) are the dominant species of Cr(VI) in natural systems because
environmental pH varies only between 3 and 10 (Jacobs and Testa, 2004). The species also
depend on the solubility of Cr(VI) in solution (EPA, 2006). Different compounds of Cr(VI)
are usually soluble in water because of its great mobility through soil and water bodies,
whereas Cr(III) is insoluble and therefore less mobile. Example of Cr compounds with
different oxidation states are listed in Table 2.1.

Treatment of Industrial and Agro-Industrial Wastewater Using Constructed Wetlands Mar-Yam Sultana
Chapter 2: Industrial and Agro-Industrial Wastewaters 21
Figure 2.3: Chromium(VI) oxide
Table 2.1: Chromium compounds with different oxidation states (Zayed and Terry, 2003).
Chemical species Oxidation state Examples Remarks Elemental Cr
Cr(0)
Does not occur naturally
Divalent Cr
Cr(II)
CrBr2,CrCl2,CrF2, CrSe, Cr2Si Relatively unstable and is readily
oxidized to the trivalent state
Trivalent Cr
Cr(III)
CrB, CrB2
,CrBr3, CrCl.6H2O, CrCl3
, CrF3, CrN,
KCr(SO4)2.12H2O
Forms stable compounds and occurs
in nature in ores, such as
ferrochromite (FeCr2O4)
Tetravalent Cr Cr(IV)
Cr dioxide CrO2, Cr tetrafluoride
CrF4
Does not occur naturally and
represents an important intermediate
that influences the rate of reduction
of the Cr(V) form.
Chromium (IV) compounds are less
common.
The Cr(IV) ion and its compounds
are not very stable and because of
short half-lives, defy detection as
reaction intermediates between
Cr(VI) and Cr(III).
Pentavalent Cr Cr(V)
Tetraper–oxochromate
CrO43−, potassium perchromate
Does not occur naturally and
represents an important intermediate
that influences the rate of reduction
of the Cr(VI) form.
Chromium (V) species are derived
from the anion CrO43− and are long
lived enough to be observed directly.
However, there are relatively few
stable compounds containing Cr(V).
Hexavalent Cr Cr(VI) (NH4)2CrO4 ,BaCrO4, CaCrO4
,K2CrO4, K2Cr2O7
The second most stable state of Cr.
However, Cr(VI) rarely occurs
naturally, but is produced from
anthropogenic sources. It occurs
naturally in the rare mineral crocoite
(PbCrO4).

Treatment of Industrial and Agro-Industrial Wastewater Using Constructed Wetlands Mar-Yam Sultana
Chapter 2: Industrial and Agro-Industrial Wastewaters 22
Chromium is used in many human activities (e.g. chemical industry, production of dyes,
wood preservation, leather tanning, chrome plating, manufacturing of various alloys, and
many other applications and products) (Fig. 2.4) and causes environmental pollution.
Stainless steel is the product containing the highest Cr content (up to 20% Cr by weight)
(Zhitkovich, 2011). Cast irons may contain from 0.5% to 30% of Cr, which adds strength,
toughness and corrosion and wear resistance. Cr is also used in nonferrous alloys (nickel,
iron-nickel, cobalt, aluminum, titanium and copper). The pigmentations in paints and inks
contain large amounts of Cr. Other usages of Cr include leather tanning, metal corrosion
inhibition, drilling muds, textile dyes, catalysts, and wood water treatment. In the refractory
industry chromite is used to make bricks, mortar, and ramming and gunning mixes, which
enhances their thermal shock and slag resistance, volume stability, and strength (Bielicka et
al., 2005). Therefore, the use of Cr compounds in these industries has resulted in increased
amount of Cr in the environment (Gode and Pehlivan, 2007). These industries, release great
volumes of effluents which contain Cr ranging from 0.5 to 270,000 mg/L (Patterson, 1985).
Figure 2.4: Use of Chromium and its compounds (Bielicka et al., 2005).
2.3.1) Environmental chemistry of Cr
Chromium is the earth’s seventh most abundant element, 21st most abundant metal in the
earth’s crust and is mined as chromite (FeCr2O4) (Cervantes and Campos-Garcia, 2007,
Barnhart, 1997). Due to its acute colored compounds, it was named according to Greek word
“Chroma” (χρώμα) which means color. It is a silver coloured hard metal with a melting point
Metal corrosion
inhibitors
Catalyst
s
Inks
Medicine
s
Textile dyes
Pigments
Chemical
s Paints
In wood treatment In leather tanning
Ferrous and nonferrous alloys
Chromium
and its
compounds

Treatment of Industrial and Agro-Industrial Wastewater Using Constructed Wetlands Mar-Yam Sultana
Chapter 2: Industrial and Agro-Industrial Wastewaters 23
of 19070C. It was discovered by Louis Nicolas Vauquelin in 1797 when he produced
chromium oxide (CrO3) was produced by mixing mineral crocoite (lead chromate) with
hydrochloric acid. In 1798 metallic Cr was isolated by heating is oxide in a charcoal oven
(Vauquelin, 1798). Chromium normally is solid at room temperature, but at high temperatures
of 4000C with pressures of 200 to 300 atm, it reacts with halogen gases such as fluorine. Cr
also reacts with the other halogen gases such as chlorine, bromine, and iodine, to form a
variety of brightly colored compounds. It also dissolves in dilute hydrochloric acid and
sulfuric acid (Jacobs and Testa, 2004).
Chromium is widely diffused in nature in rocks, fresh water and seawater (Krishnamurthy and
Wilkens, 1994). The recommended guidelines for Cr(VI) in freshwater are 1 µg/L and for
Cr(III) 8 µg/L. For marine life the recommended guidelines are 1 µg/L for Cr(VI) and 50
µg/L for Cr(III), for irrigation water 8 µg/L for Cr(VI) and 5 µg/L for Cr(III) and for drinking
water is 50 µg/L for Cr(VI) (Krishnamurthy and Wilkens, 1994; Pawlisz et al., 1997).
The atmosphere assists long-range transfer of Cr to various ecosystems. Cr-containing
particles are carried by the wind for different distances before they fall, or one washed out
from the air and are deposited onto terrestrial and water surfaces. How much area is covered
by the metal depends on the meteorological factors, topography and vegetation. Wet
precipitation and dry fallout of Cr from the atmosphere also depend on the particle sizes.
Conversely, Cr transportation within the terrestrial and water systems depends highly on the
chemical forms of Cr and their affinity to chemical transformation, precipitation and
absorption/adsorption processes occurring in the environment. Cr speciation forms occurring
in soil, plants and water are shown in Fig. 2.5.

Treatment of Industrial and Agro-Industrial Wastewater Using Constructed Wetlands Mar-Yam Sultana
Chapter 2: Industrial and Agro-Industrial Wastewaters 24
Figure 2.5: Chromium circulation in the environment (Bielicka et al., 2005).
2.3.2) Physical and chemical characteristics
Chromium is extracted from chromite ore [(Fe,Mg)O(Cr, Al, Fe)2O3] and both stable species;
Cr(III) and Cr(VI) are strongly absorbed to iron hydroxide solids forming particulates of
Cr(III) and Cr(VI) in water (Matthews and Morning, 1980; Dzombak and Morel, 1990) (Fig.
2.6).
Figure 2.6: Possible forms of Cr(VI) in solution in the presence of iron particles (Parks 2005)
Soil Ocean & Sea
Cr(III) Cr(VI)
Atmosphere Cr(III), Cr(VI)
Industry
Soil
Cr(III) Cr(VI)
Plants
Cr(III) Cr(VI)
People and Animals
Cr(III) Cr(VI)
OH
O-
Cr(VI) + OH -
(Sorbed) Cr(VI) (Soluble)
OH2+
Fe(OH)3
Cr(VI)
(Fixed)

Treatment of Industrial and Agro-Industrial Wastewater Using Constructed Wetlands Mar-Yam Sultana
Chapter 2: Industrial and Agro-Industrial Wastewaters 25
Parks (2005) described the three fractions of Cr that are in association with iron hydroxide as
follows:
(1)"Soluble"; this form of Cr can pass through a 0.45 μm pore size filter,
(2)"Sorbed"; this fraction is chemically sorbed to the iron hydroxide, but that might be
rescued either in acidic or basic solution without complete dissolution of the iron hydroxide
solid,
(3) "Fixed" this fraction is associated with iron hydroxide and not released until the solid is
completely dissolved.
These fractions can occur for Cr(III) and/or Cr(VI), but Cr(VI) is more likely to remain
soluble (Parks 2005).
Cr(III) is a stable oxidation state and reacts slowly to form complexes because of its low
kinetic potential energy, but it is not a strong oxidizer (Jacobs and Testa, 2004). Although
CrO42−
is relatively stable, its high positive reduction potentiality makes it a strong oxidizing
agent. Therefore, it remains unstable in acid solutions in the presence of electron donors such
as Fe2+,
H3AsO3, and HSO3−, or organic molecules with oxidizable groups (alkanes, alkenes,
alcohols, aldehydes, ketones, carboxylic acids, mercaptans, etc.) (Wiberg, 1965; Beattie and
Haight, 1972).
The pH and oxidation-reduction (redox) potential are the two measurable parameters which
determine Cr speciation forms and their mobility. Cr(VI) generally exists in water in the form
of monomeric state (HCrO4- and CrO4
-2) or bimeric state (Cr2O7
-2). Monomeric species
deliver a yellow color to water as Cr2O7-2
is orange in color. The relative concentrations of
these species are depend on both pH and concentration of Cr(VI) (Jacobs and Testa, 2004).
Fig. 2.7 presents an example of the relation to pH and Cr(VI) concentration. Cr(VI) is a strong
oxidant and is reduced in the presence of electron donors which are generally found in a
reduced subsurface environment where ferrous iron, reduced sulfur, and some organic
materials occur. Dichromate can react with soil organic carbon to produce water, Cr(III), and
CO2, with Cr(III) likely to precipitate as a hydroxide (Eq. 2.3) (Palmer and Puls, 1994).
2 Cr2O7-2
+ 3C0 + 16H
+ -- 4Cr
3+ + 3C02 + 8H2O……………………. (2.3)

Treatment of Industrial and Agro-Industrial Wastewater Using Constructed Wetlands Mar-Yam Sultana
Chapter 2: Industrial and Agro-Industrial Wastewaters 26
(a)
0 1 2 3 4 5 6 7 8 9 10 11 12 13 14
0,0
0,1
0,2
0,3
0,4
0,5
0,6
0,7
0,8
0,9
1,0
1,1
1,2
Frac
tion
of C
r(V
I)T
otal
pH
(b)
0.0
0.1
0.2
0.3
0.4
0.5
0.6
0.7
0.8
0.9
1.0
1.1
Frac
tion
of C
r(V
I)T
otal
Cr(VI) Total(M)
10-4
10-3
10-2
10-1
100
101
102
103
104
Figure 2.7: Distribution of Cr(VI) species (a) as a function of pH and (b) Fraction of HCrO4-
and Cr2O7-2
at pH 4 as a function of total Cr(VI) (Hsu, 2011).
2.3.3) Nutrition and toxicity of Cr: health risks to humans
Chromium is a highly pollutant metal that can cause genetic mutations and cancer. As is
already stated, the toxicity of Cr depends highly on its existing form, and Cr(VI) is more toxic
than Cr(III) for plants, animals and microorganisms (Kimbrough et al., 1999).
The reduction of Cr(VI) is considered as a detoxification process when it occurs at a distance
from the target site, for toxic or genotoxic effect. However, when the reduction of Cr(VI)
occurs near the cell nucleus of target organs, it may activate chromium toxicity (Dayan and
Paine, 2001). If Cr(VI) is reduced to Cr(III) extracellularly, it is not readily transported into
H2CrO4
HCrO4-
CrO42-
Cr2O72-
Treatment of Industrial and Agro-Industrial Wastewater Using Constructed Wetlands Mar-Yam Sultana
Chapter 2: Industrial and Agro-Industrial Wastewaters 27
cells and no toxicity is observed. The balance which exists between extracellular Cr(VI) and
intracellular Cr(III), determines the ultimate amounts and rates at which Cr(VI) can enter cells
and impart its toxic effects (Cohen et al., 1993).
High Cr(VI) concentrations have significant harmful effects on human health such as lung
cancer, as well as kidney, liver, neurological and gastric damage (Kimbrough et al., 1999,
Nethercott et al., 1994; Wang et al., 1997; EPA 1998). The respiratory tract is the primary
organ which is affected by inhalation of Cr following acute exposure. Dermal exposure to
Cr(VI) can lead to dermal ulcers owing to the corrosive nature of Cr(VI) compounds (EPA,
2007). On the contrary, Cr(III) is less toxic, less harmful, and even an essential nutrient for
humans (Anderson, 1997; Katz and Salam, 1994). However excess quantities of Cr(III) also
cause damage to aquatic organisms, disrupting the food chain (Bosnic et al., 2000).
Considering the toxicity effects of Cr, the permitted discharge limit of Cr into surface and
potable waters has been set to below 0.05 mg/L by the EPA (Baral and Engelken, 2002) and
the EU (EC, 1998).
2.3.3.1) Toxicity of Cr to animals
Cr(III) is found in animal tissues (including liver, kidney and muscle) as Cr(III) may increase
insulin. Other biological effects are reported less frequency (e.g. on immune response and
lipid metabolism) (EFSA, 2009). Sometimes a trace amount of Cr is essential for human and
animal nutrition (Jeejeebhoy et al., 1977; Mertz, 1969) and it is an integral component of the
glucose tolerance factor (GTF) which is required to maintain normal glucose tolerance
(Mertz, 1969). For fat metabolism in animals Cr is considered as an important substance
(Anderson, 1989). The supplementation of Cr(III) in farm animals can decrease serum cortisol
levels in several species (Lindemann, 2007). Cr(III) might be the (or one of the) extreme
intracellular toxic form(s) of Cr(VI) (Stearns, 2000). Nguyen et al., (2008) reported that
oxidation from Cr(III) to Cr(VI) may occur in biological systems under certain circumstances.
For a long time Cr(VI) has been known as the most dangerous form of the metal because of
its high ability to enter cell membranes and its powerful oxidising properties (EFSA, 2009).
After entering the cells, Cr(VI) can be readily reduced by glutathione (GSH), cysteine and
other cellular reductants, as well as cytochrome b5 (Plant, 2003).
Treatment of Industrial and Agro-Industrial Wastewater Using Constructed Wetlands Mar-Yam Sultana
Chapter 2: Industrial and Agro-Industrial Wastewaters 28
The aquatic environment is considered as a major sink for metal pollutants. Generally surface
water is polluted after discharging of metal containing wastewaters from manufacturing
processes of different industries (Elwood, 1980). However, in water, Cr compounds are very
stable and accumulate in sediments and that become a source for Cr accumulation in aquatic
life. Cr toxicity to aquatic life depends on both biotic and abiotic factors. The biotic factors
include the genus, age and developmental stage, while the abiotic factors include temperature,
Cr concentration, Cr oxidation states, pH, alkalinity, salinity, and hardness of the water
(Velma et al., 2009). Acute toxicity of Cr(VI) for both marine and fresh water organisms
appears to range between 1 and 330 mg/L but actual values depend on species, salinity, pH,
alkalinity, and temperature of water (SCCWRP, 1974). The toxicity effects of Cr(VI) to
aquatic life including marine and freshwater fish have been recorded by various researchers
(Mishra and Mohanty, 2008; Velma et al., 2009; Svecevicius, 2006). The growth and survival
of fish in Cr-containing water depend on the dose and exposure time to Cr (Patton et al.,
2007; Farag et al., 2006).
2.3.3.2) Toxicity of Cr to plants and algae
It was reported by Pratt (1966), that plant growth might be stimulated at low concentrations of
chromium but it is not an essential element for plants (Huffman and Allaway, 1973). Yet the
solubility of Cr(VI) in water is a threat for plants (Nieboer and Richardson, 1980). Although
Cr has little influence on growth of certain plant species at lower concentrations (Shanker et
al., 2009), it is highly toxic at higher concentrations and inhibits various activities in plants
and sometimes causes total damage (Shanker et al., 2005, 2009; Vajpayee et al., 1999; Dube
et al., 2003). Toxicity symptoms of Cr(III) and Cr(VI) in plants include inhibition of
germination, root growth, seedling growth and development, induction of leaf chlorosis and
necrosis besides physiological and biochemical alterations (Oliveira, 2012; Shankar et al.,
2005). Studies have reported that Cr has toxic effects in different species, including cereals,
pulses, vegetables, forages and trees (Haas and Brusca, 1961; Shanker et al., 2004, 2005;
Ganesh et al., 2006; Jun et al., 2009; Shanker et al., 2009). Both terrestrial plants and the
aquatic plants have found to be affected by Cr(VI); however, great variation is observed in
their response (Chandra and Kulshreshtha, 2004). When soils contain 5 to 60 mg/kg
concentration of Cr(VI), plant growth is inhibited due to root damage (Anon, 1974). Cr(VI)
also causes toxicity in algae by affecting growth, photosynthesis, morphology, and enzyme
Treatment of Industrial and Agro-Industrial Wastewater Using Constructed Wetlands Mar-Yam Sultana
Chapter 2: Industrial and Agro-Industrial Wastewaters 29
activities (Gorbi and Corradi, 1993). The amount of Cr(VI) that causes toxicity in algae varies
within the range of 20 to 10,000 mg/L (Sharma, 2002).
2.3.4) Remediation or treatment
Metal compounds are not biodegradable and therefore can be regarded as long-term
environmental features. Since they can also have accumulative properties, they are the subject
of close attention.
Various treatment technologies have been developed for the removal of heavy metals
including Cr(VI) from water and wastewater. Several physicochemical methods are used to
treat wastewater to remove heavy metals, including ion exchange (Pansini et al., 1991,
Rengaraj et al., 2001), activated carbon (Perez-Candela M. et al., 1995; Mohan and Pittman,
2006; Chingombe et al., 2005; Owlad et al., 2009), chemical precipitation (Kongsricharoern
and Polprasert, 1996; Ramakrishnaiah and Prathima, 2012), adsorption (Hashem et al., 2007;
Ravikumar et al., 2005), reverse osmosis (Pérez Padilla and Tavani, 1999) and membrane
technologies (Pugazhenthi et al., 2005; Muthukrishnan and Guha, 2008; Aroua et al., 2007).
In some cases these physicchemical processes are extremely expensive especially when the
metal concentrations in the solution range from 1 to 100 mg/L (Nourbakhsh et al., 1994).
Furthermore these methods usually produce large quantities of toxic chemical sludge of which
disposal is a major problem (Benjamin, 1983; Mandi et al., 1996). On the other hand, Cr(VI)
interacts with microorganisms through enzymatic reduction, biosorption and bioaccumulation
(Tekerlekopoulou et al., 2013). Cr(VI) is mainly accumulated by bacteria, as it uses the
sulfate pathway (Vaiopoulou and Gikas, 2012). Many researchers have examined biological
Cr(VI) removal using bacteria (Stasinakis et al., 2002; Zouboulis et al., 2004), fungi (Sanghi
et al., 2009), yeast (Chen and Wang, 2007), and algae (Bankar et al., 2009). Biological
treatment of Cr(VI) is gaining ground due to its zero requirement of chemicals and its low
operating cost (Srivastava and Majumder, 2008).
2.4) Cheese Manufacturing
Cheese production is one of the most classical examples of food preservation which started in
c. 6000-7000 B.C. (Scott, 1986). Throughout the world cheeses are common in all cultures
and one of the oldest food items. In ancient times, milk was a seasonal food and cheese-

Treatment of Industrial and Agro-Industrial Wastewater Using Constructed Wetlands Mar-Yam Sultana
Chapter 2: Industrial and Agro-Industrial Wastewaters 30
making was a method of milk conservation process to avoid the waste of surplus production.
Bedouins carried milk in bags on their trips into the desert. The heat of the desert caused
acidification and coagulation of this milk with acid-producing bacteria, which undoubtedly
led to curdling and the subsequent motion in the bags produced curds which resulted in an
acidic liquid (whey) forming on top of the milk as curd sediment (Wit, 2001).
Cheese is a nutritious foods made by processing milk from cows, goats, sheep, buffalos,
camels and yaks. Cheese is produced from processed milk by coagulation of the milk protein
known as casein (Scott, 1986) and acidification (Fox et al., 2000). The common steps
followed in all cheese manufacturing include milk acidification, milk coagulation, whey
removal, packaging and storage. There are many types of cheese which depend on different
processing methods (Fox, 1999). A flowchart of cheese manufacturing and the waste flows
from each step is presented in Fig. 2.8.
Figure 2.8: Flow sheet for the manufacture of cheese (Wit, 2001).
Raw Milk
Cream
Starter
Rennet
Hot
Water
Pasteurization
Whey
Cream
Separation
Whey
Draining Curd
Brining
Resting
Pressing
Moulding
Ripening
Cheese
Whey Standardization
Mixing
Pasteurization
Setting
Draining off
(1/3 of whey)
Cutting
Stirring
Scalding
Treatment of Industrial and Agro-Industrial Wastewater Using Constructed Wetlands Mar-Yam Sultana
Chapter 2: Industrial and Agro-Industrial Wastewaters 31
At first, starter cultures are added to the milk to produce lactic acid. Then rennet is used to
coagulate the milk protein. Standardization and pasteurization takes place by using a separator
and pasteurizer in line. The curds and whey are separated and the curds are washed out and
cut into cubes. The cubes then precipitate as a curd, leaving whey as the supernatant liquid.
One third of this whey is subsequently drained out and the same amount of hot water (± 40°C)
is added as replacement. In this process (scalding process) the curd particles shrink and as a
consequence whey is squeezed during stirring. After stirring, the curd is pressed together to
separate it from the remaining whey. Then the curd blocks are milled, salt is added, and the
curds are pressed. Pressed cheese is wrapped to protect it from moisture loss and growth of
mould during storage period. Cheese is maturated in temperature and humidity controlled
stores to develop flavor and texture through regular turning, and salting or brine washing of
the cheese surface (EPA, 2000a).
2.4.1) Cheese whey
After the production of cheese or the removal of fat and casein (80% of the proteins) from
milk, the remaining green-yellowish liquid is known as whey (Smithers, 2008). It is estimated
that the worldwide production of whey is over 100 billion (100 thousand million) kilograms
per year (Smithers, 2008; OECD-FAO 2012). Approximately half of this total whey
production is produced in the European Union (EU) (EC, 2009). During the production of
casein or fresh-cultured cheese, only 8% of the total produced whey is produced directly as a
by-product from skimmed milk. Whey represents 85–95% of the milk volume and contains
about 55% of the milk nutrients comprising milk sugar (lactose), serum proteins (whey
proteins), minerals, a small amount of fat, and most of the water soluble minor nutrients from
milk such as vitamins (Farizoglu et al., 2004; Wit, 2001). The liquid effluents of dairy
industries and cheese dairies are major contributors to the worldwide industrial pollution
problem (Papachristou and Lafazanis, 1997).
Normally two types of cheese whey are produced through the processing techniques and these
are sweet whey and acid whey according to pH value. Sweet whey is produced at
approximately pH 6.5 when rennet is introduced at coagulation time of casein. The acid whey
production procedure depends on fermentation or addition of organic or mineral acids to
coagulate the casein at pH <5 (Panesar et al., 2007).

Treatment of Industrial and Agro-Industrial Wastewater Using Constructed Wetlands Mar-Yam Sultana
Chapter 2: Industrial and Agro-Industrial Wastewaters 32
2.4.2) Sources
Approximately 1 kg of cheese and 9 kg of sweet whey are obtained from 10 litres of milk
(Fig. 2.9). To produce different types of cheese for example, mozzarella, semi-hard and hard
cheeses, two different starter cultures are used (mesophilic and thermophilic) and
approximately 3-13 L of whey per kg cheese production is drained out depending on the
cheese production (Table 2.2). When the cheese whey is drained is either refined, or
processed into different products, or disposed of. Small cheese particles which are present in
the whey have to be removed by filtering.
Figure 2.9: Simplified cheese production inputs and outputs.
Table 2.2: Amount of whey drained from different type of cheese productions (Atamer et al.,
2013).
Hard cheese Semi-hard
cheese
Soft cheese Sour milk
cheese
Fresh cheese
Milk (L) (for 1
kg Cheese)
13–14 12–13 8–9 5–6 4–5
Drained whey
(L)
12–13 11–12 7–8 4–5 3–4
Drained whey
(%)
92–93 91–92 86–89 80–83 75–80
2.4.3) Characteristics and composition of cheese whey
Cheese whey is a liquid with a total solid content of about 6,5% depending on the cheese type
and the amount of water added during production. About 85-95% of the milk volume is
cheese whey and about 55% of the milk nutrients remain in this potential wastewater. It’s a
Whey
8.5 Kg
Cream
0.5 Kg
Milk
10 Kg
Cheese
1 Kg
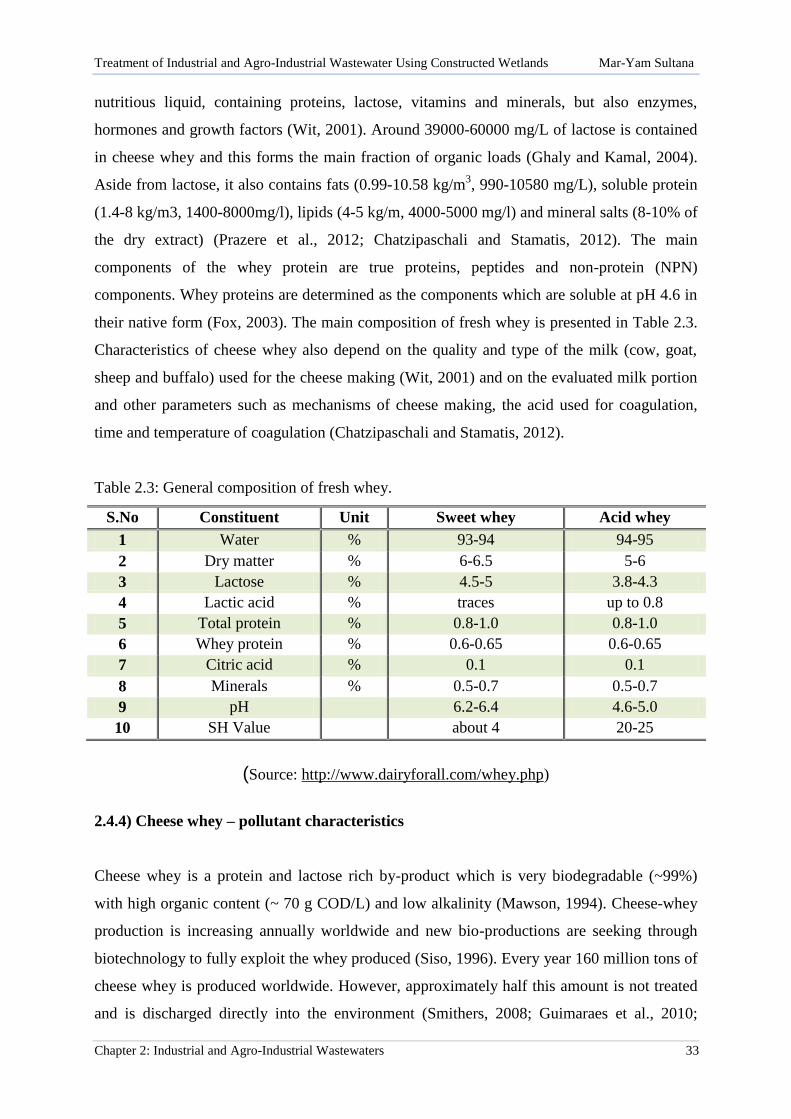
Treatment of Industrial and Agro-Industrial Wastewater Using Constructed Wetlands Mar-Yam Sultana
Chapter 2: Industrial and Agro-Industrial Wastewaters 33
nutritious liquid, containing proteins, lactose, vitamins and minerals, but also enzymes,
hormones and growth factors (Wit, 2001). Around 39000-60000 mg/L of lactose is contained
in cheese whey and this forms the main fraction of organic loads (Ghaly and Kamal, 2004).
Aside from lactose, it also contains fats (0.99-10.58 kg/m3, 990-10580 mg/L), soluble protein
(1.4-8 kg/m3, 1400-8000mg/l), lipids (4-5 kg/m, 4000-5000 mg/l) and mineral salts (8-10% of
the dry extract) (Prazere et al., 2012; Chatzipaschali and Stamatis, 2012). The main
components of the whey protein are true proteins, peptides and non-protein (NPN)
components. Whey proteins are determined as the components which are soluble at pH 4.6 in
their native form (Fox, 2003). The main composition of fresh whey is presented in Table 2.3.
Characteristics of cheese whey also depend on the quality and type of the milk (cow, goat,
sheep and buffalo) used for the cheese making (Wit, 2001) and on the evaluated milk portion
and other parameters such as mechanisms of cheese making, the acid used for coagulation,
time and temperature of coagulation (Chatzipaschali and Stamatis, 2012).
Table 2.3: General composition of fresh whey.
S.No Constituent Unit Sweet whey Acid whey
1 Water % 93-94 94-95
2 Dry matter % 6-6.5 5-6
3 Lactose % 4.5-5 3.8-4.3
4 Lactic acid % traces up to 0.8
5 Total protein % 0.8-1.0 0.8-1.0
6 Whey protein % 0.6-0.65 0.6-0.65
7 Citric acid % 0.1 0.1
8 Minerals % 0.5-0.7 0.5-0.7
9 pH 6.2-6.4 4.6-5.0
10 SH Value about 4 20-25
(Source: http://www.dairyforall.com/whey.php)
2.4.4) Cheese whey – pollutant characteristics
Cheese whey is a protein and lactose rich by-product which is very biodegradable (~99%)
with high organic content (~ 70 g COD/L) and low alkalinity (Mawson, 1994). Cheese-whey
production is increasing annually worldwide and new bio-productions are seeking through
biotechnology to fully exploit the whey produced (Siso, 1996). Every year 160 million tons of
cheese whey is produced worldwide. However, approximately half this amount is not treated
and is discharged directly into the environment (Smithers, 2008; Guimaraes et al., 2010;

Treatment of Industrial and Agro-Industrial Wastewater Using Constructed Wetlands Mar-Yam Sultana
Chapter 2: Industrial and Agro-Industrial Wastewaters 34
OECD-FAO, 2012). The disposal of cheese whey during the production of cheese has always
been a main problem in the dairy industry. When this potential wastewater is discharged
directly into the environment, this causes a significant loss of resources and serious
environmental pollution. Thus, cheese whey represents an important environmental problem
because of the high volumes produced and its high organic matter content (Prazere et al.,
2012; Chatzipaschali and Stamatis, 2012; Mawson, 1994).
Whey characterized by its high organic content, i.e. high concentration of BOD and COD of
between 27000-60000 mg/L and 50000-102000 mg/L, respectively (Prazere et al., 2012).
Lactose represents the majority of the organic load (over 90% of BOD and 97.7% of the total
COD) (Chatzipaschali and Stamatis, 2012). If protein is extracted from the whey, COD is
reduced to 10000 mg/L. Thus, cheese whey is a complex substrate that is ultimately a mixture
of easily biodegradable carbohydrates, mostly lactose, proteins and lipids (Dermirel et al.,
2005).
Its direct disposal can affect the physical and chemical structure of soils, for which crop yields
decrease. In addition, when cheese whey is discharged into water resources, it affects aquatic
life by causing eutrophication of the receiving waters (Siso, 1996, Panesar et al., 2007). The
biological treatment of cheese whey depends on its organic load. If the ratio of BOD and
COD in whey is higher than 0.5 then it is suitable to treat by biological processes. The
temperature and reaction of the wastewater also determine the efficiency of biodegradation.
2.4.5) Remediation or treatment
Dairy wastewaters including cheese whey are generally treated using various physicochemical
methods including coagulation/flocculation by various inorganic and organic natural
coagulants, and membrane processes like nanofiltration (NF) and/or reverse osmosis (RO)
(Kushwaha et al., 2011). Various biological methods are also used to treat cheese whey
including activated sludge processes, aerated lagoons, trickling filters, sequencing batch
reactors (SBR), anaerobic sludge blanket reactors (UASB), anaerobic filters, etc. (Demirel et
al., 2005; Prazeres et al., 2012; Carvalho et al., 2013; Tatoulis et al., 2014b).

Treatment of Industrial and Agro-Industrial Wastewater using Constructed Wetlands Mar-Yam Sultana
Chapter 3: Constructed Wetlands
CHAPTER 3: CONSTRUCTED WETLANDS
3.1) Components of Constructed Wetlands ......................................................................... 37
3.1.1) Water .......................................................................................................................... 37
3.1.2) Soil substrate/porous media ....................................................................................... 37
3.1.3) Wetland vegetation/macrophytes ............................................................................... 39
3.1.3.1) Role of macrophytes ............................................................................................ 40
i) Physical appearance .............................................................................................. 40
ii) Surface area for attached microbial growth .......................................................... 41
iii) Root release/creation of aerobic environment ....................................................... 42
iv) Organic compound release .................................................................................... 43
v) Nutrient uptake and storage ................................................................................... 44
3.1.4) Microorganisms ........................................................................................................ 44
3.2) Types of Constructed Wetlands ..................................................................................... 45
3.2.1) Surface Flow/ Free Water Surface Flow .................................................................... 46
3.2.2) Horizontal Sub-Surface Flow ..................................................................................... 48
3.2.3) Vertical flow ............................................................................................................... 50
3.3) Design Factors ................................................................................................................. 52
3.3.1) Pretreatment ............................................................................................................... 52
3.3.2) Hydrology................................................................................................................... 52
3.3.2.1) Hydraulic Loading Rate (HLR) ........................................................................... 53
3.3.2.2) Hydraulic Retention Time (HRT) ........................................................................ 54
3.3.3) Design of Bed/Bed Area ............................................................................................ 55
3.3.4) Selection of wetland plants ........................................................................................ 56
3.3.5) Inlet structure .............................................................................................................. 59
3.3.6) Outlet Structure .......................................................................................................... 59
3.4) Removal Mechanism of Constructed Wetlands ........................................................... 59
3.4.1) Organic matter removal .............................................................................................. 60
3.4.2) Nitrogen removal ........................................................................................................ 62
3.4.3) Phosphorus removal ................................................................................................... 64
3.4.4) Total suspended solids removal ................................................................................. 65
3.4.5) Heavy metal (Cr) removal ......................................................................................... 65
3.5) Application of CWs in Cr(VI) treatment ...................................................................... 66
3.6) Application of CWs in Agro-Industrial wastewaters Treatment ............................... 74

Treatment of Industrial and Agro-Industrial Wastewater using Constructed Wetlands Mar-Yam Sultana
Chapter 3: Constructed Wetlands
3.6.1) Pre-treatment stages in treatment of Dairy Wastewaters ........................................... 74
3.6.2) CW types in treatment of Dairy Wastewaters ............................................................ 74
3.6.3) Vegetation for Dairy Wastewater treatment in CW systems ..................................... 78
3.6.4) Pre-treatment stages in treatment of Animal Farm Wastewater ................................ 79
3.6.5) CW types in treatment of Animal Farm Wastewater ................................................. 79
3.6.6) Vegetation for Animal Farm Wastewater in CW systems ......................................... 82
3.6.7) Pre-treatment stages in treatment of OMW wastewater............................................. 83
3.6.8) CW types in treatment of OMW wastewater ............................................................. 83

Treatment of Industrial and Agro-Industrial Wastewater using Constructed Wetlands Mar-Yam Sultana
Chapter 3: Constructed Wetlands 35
CHAPTER 3: CONSTRUCTED WETLANDS
Constructed wetlands (CWs) are a low–cost technology which has been used to treat various
types of wastewaters for more than thirty years (Vymazal, 2010; Hunt et al., 2003; Kadlec and
Wallace, 2009). Compared to conventional systems, CWs appear to be rather attractive as
they use solar energy and are easily operated (Jamieson et al., 2007). Their treatment
processes can purify many wastewaters (Hunt et al., 2006). Modern CWs have been designed
to emphasize specific characteristics of wetland ecosystems for improved treatment capacity,
using various physical, chemical and biological processes for pollutant removal (Fig. 3.1).
CW removal performance depends upon the wetland design, microbial community, and the
different kinds of plants involved (Ibekwe et al., 2003). Usually the main role in pollutant
removal is attributed to the microorganisms which are attached either onto the roots of
wetland plants or on the soil substrate where they catalyze chemical changes and conduct
desirable modifications of nutrients, metallic ions and other substances. The region
surrounding each root is aerobic and called the rhizosphere. The main pollutant removal
mechanisms in CWs are three: physical, chemical and biological processes, including
filtration, sedimentation, adsorption, volatilization and bioaccumulation by plants (plant
uptake) or microorganisms. The rhizosphere is the most efficient reaction zone in CWs where
all the processes are taken place by the interaction of plants, microorganisms and pollutants
(Fig. 3.2) (DeBusk, 1999; Vymazal et al., 2006; Stottmeister et al., 2003). The treatment
process of CWs is based on the biological processes occurring in the natural ecological
system, which unite the saturated substrates and vegetation. A population of microbes
develops within the root system and the substrate, and decomposes the various pollutants to
yield stable compounds.
Kadlec and Knight (1996) describe the historical background of the use of natural and CWs
for wastewater treatment and disposal. Research studies on the use of CWs for wastewater
treatment started in Europe in the 1950s and in the United States of America (USA) in the late
1960s. Research efforts were increased in the USA throughout the 1970s and 1980s, with
significant federal involvement by the Tennessee Valley Authority (TVA) and the US
Department of Agriculture in the late 1980s and early 1990s.

Treatment of Industrial and Agro-Industrial Wastewater using Constructed Wetlands Mar-Yam Sultana
Chapter 3: Constructed Wetlands 36
Figure 3.1: Schematic diagram of a constructed wetland and its mechanisms.
Figure 3.2: Possible interactions in the root zone of wetlands for wastewater treatment
(Stottmeister et al. 2003).
CWs have the potential to treat different types of wastewaters including municipal wastewater
(Vymazal, 2005), acid mine drainage (Mays and Edwards, 2001; Machemer et al., 1993;
Yang et al., 2006), industrial wastewater (Di Luka et al., 2011; Khan et al., 2009; Maine et al.,
2006; Kongroy et al., 2012), agricultural wastewater (Bubba et al., 2004; Grafias et al., 2010;
Nahlik and Mitsch, 2006), tannery wastewater (Calheiros et al., 2007, 2008a,b, 2010, 2012;
Kucuk et al., 2003; Dotro et al., 2011b). These wastewaters usually contain high
concentrations of organic matter, nutrients and heavy metals and CWs are very cost effective

Treatment of Industrial and Agro-Industrial Wastewater using Constructed Wetlands Mar-Yam Sultana
Chapter 3: Constructed Wetlands 37
compared to conventional methods of wastewater treatment (Kadlec and Knight, 1996; Knox
et al., 2006).
3.1) Components of Constructed Wetlands
CWs are usually comprised of water, soil substrate/porous media and vegetation (EPA, 1998).
However, endemic microorganisms also play a vital role in the degradation of contaminants in
the wetland. Normally water is present on the surface of the wetland or within the roots of the
vegetation for a long period of time.
3.1.1) Water
Water is the most important component of CWs because it links all of the functions in a
wetland and the treatment efficiency of a CW depends on its characteristics (EPA, 1998).
Slight changes of hydrology (surface area and water depth) greatly influence the treatment
efficiency of the wetland because wetland sharply interacts with the atmosphere through
rainfall and evapotranspiration (the combined loss of water through evaporation from the
water surface and loss through transpiration by plants). Density of the plants growing in CWs
affects the water flow path through the wetland by creating obstacles. Water can find its
sinuous way through the plant parts; stems, leaves, roots, and rhizomes in the wetland (EPA,
2000b). When the substrates are flooded, the physical and chemical characteristics are altered.
In a saturated substrate, water replaces the atmospheric gases in the pore spaces and microbial
metabolism consumes the available oxygen. Since oxygen is consumed more rapidly,
substrates become anoxic (without oxygen). This reducing environment is important in the
removal of pollutants such as nitrogen and metals.
3.1.2) Soil substrate/porous media
The soil substrate or the porous media is an essential component of any CWs. It supports the
growth of emergent plants and microbes on their surfaces and regulates hydraulic
conductivity and nutrient adsorption (Kadlec and Knight, 1996; Calheiros et al., 2008a). The
biological and chemical transformations of the pollutants take place in the soil
substrate/porous media with the help of microorganisms and plants (EPA, 1995). Therefore,
the CW acts as primary sink for pollutants (Vymazal, 2003; Lesage et al., 2007b; Allende et
al., 2012; Vymazal and Krasa, 2003). Sometimes the permeability of different substrates

Treatment of Industrial and Agro-Industrial Wastewater using Constructed Wetlands Mar-Yam Sultana
Chapter 3: Constructed Wetlands 38
affects the movement of water in the wetland (EPA, 1998). Various types of substrates are
used in CWs such as gravel (fine and course), sand and soil (Fig. 3.3) (EPA, 1995; Korkusuz,
2005). However, mixtures of sand and gravel may improve hydraulic conditions and the
removal of contaminants (IWA specialist group, 2000; Stottmeister et al., 2003). In vertical
flow constructed wetlands (VF CWs), a grain size of 0.06 to 0.1 mm was found to be the most
effective, whereas, that for horizontal-flow systems the most effective grain size was 0.1 mm
(Stottmeister et al., 2003). In subsurface CWs the typical effective sizes of the media vary
between 2 and 128 mm and the porosity varies from 28% to 45% (EPA 2000b). The accurate
or proper use of substrate in CWs increases pollutant removal efficiency (Calheiros et al.,
2008a).
Figure 3.3: Different types of CWs substrates for (A) gravel, (B) course gravels, (C) fine
gravels, (D) sands, (E) soil.
A B
C D
E
Treatment of Industrial and Agro-Industrial Wastewater using Constructed Wetlands Mar-Yam Sultana
Chapter 3: Constructed Wetlands 39
3.1.3) Wetland vegetation/macrophytes
Plants are important components of CWs because of their significant roles in the wastewater
treatment processes (Brix, 2003). In relation to wastewater treatment, the most significant
functions of wetland plants are the physical effects associated with the presence of dense
vegetation and the increased surface area for attachment and growth of microbes (Sim, 2003).
Vascular plants (the higher plants) and non-vascular plants (algae) that have tissues are
normally used in CWs (Brix, 2003). Like all other photoautotrophic organisms, these
macrophytes use the solar energy to assimilate inorganic carbon from the atmosphere to
produce organic matter, which thereby provides the energy source for heterotrophs (bacteria
and fungi) (Brix, 1997). Photosynthesis by algae increases the dissolved oxygen content of
the water which is very significant for the treatment of pollutants in CWs. The major
anatomical appearance of wetland plants is the presence of air spaces in different parts of the
leaves, stems, rhizomes and roots (Gopal and Masing, 1990; Brix, 1998). The presence of
aerenchyma (air-filled) tissue (Fig. 3.4) and lacunae in many wetlands plants helps these
plants to grow in anaerobic or anoxic environments. Their hollow vessels are capable to
transfer oxygen from the leaves to the root zone and the surrounding root area (Armstrong et
al., 1990; Brix and Schierup, 1990). This enhances the active microbial aerobic
decomposition process and the uptake of pollutants from water. Gopal and Masing (1990)
summarized that these air spaces have been considered important reservoirs of oxygen which
is transported through interconnected channels down to the roots and other submerged organs
(Williams and Barber, 1961; Kawase and Whitmoyer, 1980).
The oxygen supply capacity of plants differs from species to species due to the differences in
vascular tissues, metabolism, and root distribution (Steinberg and Coonrod, 1994). During
low temperatures, the potential oxygen release into the root zone may decrease, because root
and rhizome respiration consumes relatively large proportions of oxygen, which diffuses
through plant shoots, and the oxygen demand for root and rhizome respiration declines at low
temperatures (Callaway and King, 1996). The metabolism function of the indigenous
microflora is a combined execution of the availability of light, oxygen, temperature, nitrogen
and phosphorus (Atlas, 1981).

Treatment of Industrial and Agro-Industrial Wastewater using Constructed Wetlands Mar-Yam Sultana
Chapter 3: Constructed Wetlands 40
Figure 3.4: Micrograph of gas spaces in a Typha latifolia root (scale bar, 1 mm)
(Vymazal and Kropfelova 2008).
3.1.3.1) Role of macrophytes
The existence of macrophytes is one of the most conspicuous features of wetlands and their
appearance distinguishes CWs from unplanted soil filters or lagoons. The macrophytes
growing in CWs have several properties in regards to the treatment process that make them an
essential component of the wetlands (Brix, 1997). The metabolism of the macrophytes (plant
uptake, oxygen release, etc.) affects the treatment processes to different extents depending on
design. The roles of wetland plants in CW systems can be divided into 5 categories:
i) Physical appearance
The physical parts of the plants stabilize the surface of the beds and slow down the water flow
which aids sediment settling and trapping substances from the water. Their presence also
provides good conditions for physical filtration, and large surface areas for attached microbial
growth. Growth of macrophytes distributes and reduces water velocity, allowing for
sedimentation of suspended solids, reduces the risk of erosion and re-suspension, and
increases contact time between effluent and plant surface area, thus, resulting in increased
pollutant removal (Vymazal and Kröpfelová, 2008; Sim, 2003). In vertical flow (VF) CWs,
the presence of macrophytes, together with an intermittent loading regime, helps to prevent
clogging of the medium (Bahlo and Wach, 1990). The movements of the plants as a resultant
of wind currents keep the surface of bed open, and the growth of roots within the medium of

Treatment of Industrial and Agro-Industrial Wastewater using Constructed Wetlands Mar-Yam Sultana
Chapter 3: Constructed Wetlands 41
wetlands helps to decompose organic matter and prevents clogging (Brix, 2003). The major
roles of macrophytes in constructed treatment wetlands are summarized in Table 3.1. Another
important effect of vegetation in wetlands is the insulation that provides by covering the
surface area during winter especially in temperate climates (Smith et al., 1996). When the
standing litter is covered by snow it provides a perfect insulation and helps keep the soil free
of frost. The litter layer helps protect the soil from freezing during winter, and also keeps the
soil cooler during spring (Haslam, 1971a, b; Brix, 1994, 1998).
ii) Surface area for attached microbial growth
The above-and below-ground biomass of macrophytes provide large surface areas for growth
of microbial biofilms (Gumbricht, 1993a, b; Chappell and Goulder, 1994). The plant tissues
are inhabited by dense communities of photosynthetic algae as well as bacteria and protozoa.
Likewise, the roots and rhizomes that are buried in the wetland also provide a substrate for
attached growth of microorganisms (Brix, 2003). Thus, biofilms occur on both the above and
below ground tissue of the macrophytes (Fig. 3.5).
As plants grow and die, the dead leaves and stems fall to the surface of the substrate and form
multiple layers of organic debris (the litter/humus component). This accumulation of partially
decomposed biomass creates highly porous substrate layers and provides large attachment
surfaces for microbial organisms. Thus, the biofilms, as well as the biofilms on all other
immersed solid surfaces in the wetland system, including dead macrophyte tissues, are
responsible for the majority of the microbial processing that occurs in wetlands and for
nitrogen reduction (Brix, 1997).
Figure 3.5: Biofilm on submerged parts of wetland plants (Brix, 2003).

Treatment of Industrial and Agro-Industrial Wastewater using Constructed Wetlands Mar-Yam Sultana
Chapter 3: Constructed Wetlands 42
Table 3.1: The major roles of macrophytes in constructed treatment wetlands.
Aerial parts of plant
• Light attenuation > reduced growth of phytoplankton
• Influence on microclimate
• Reduced wind velocity
• Aesthetic pleasing appearance of system
• Insulation of the filtration beds
Below-ground parts
Plant tissue in water Substrate for bacterial growth
• Filtering effect > filter out large debris
• Flow velocity reduction
• Promotion of sedimentation
• Decreased re-suspension
• Prevention of medium clogging
• Provide surface area for attached biofilms
• Source of carbon compounds through root exudates
• Micro-aerobic environment via root oxygen release
Roots and rhizomes in the
sediment
• Stabilize the sediment surface > less erosion
• Prevents the medium from clogging in vertical flow systems
• Release/leakage of oxygen and exudates to root
• Released oxygen:
— increased aerobic degradation
— assist to precipitation of heavy metals
— increased nitrification
— increase degradation (and nitrification)
• Uptake of nutrients
Other functions of plants in the CW
• Removal of pathogens
• Production of ornamental plants
• Production of fiber materials
• Bioenergy crops
• Increased wildlife diversity
iii) Root release/creation of aerobic environment
It is well documented that aquatic macrophytes release oxygen from roots into the rhizosphere
which influences the biogeochemical cycles in the sediments through the effects on the redox
status of the sediments (Barko et al., 1991; Sorrell and Boon, 1992). Qualitatively this is
easily visualized by the reddish colour associated with oxidized forms of iron on the surface
of the roots and experimentally by submerging a root system into a reduced solution
containing methylen blue (Fig. 3.6). Plants transfer this oxygen through the hollow plant
tissue and release it from the root systems into the rhizosphere, where aerobic degradation of
organic matter and nitrification takes place (Brix, 1997).
Phragmites spp. allocates 50% of its plant biomass to root and rhizome systems and increased
root biomass allows for greater oxygen transport into the substrate, creating a more aerobic
environment favoring nitrification reactions which account for the high nitrogen removal by

Treatment of Industrial and Agro-Industrial Wastewater using Constructed Wetlands Mar-Yam Sultana
Chapter 3: Constructed Wetlands 43
Phragmites in wetlands (Sim, 2003). For the nitrification process to occur maximum rate, a
minimum of 2 mg O2 /L is required. It is evident that the rate of nitrification is most likely the
rate limiting factor for overall nitrogen removal from a CW system (Sikora et al., 1995).
Figure 3.6: Release of oxygen from roots of Phragmites australis. The blue colour around the
roots is formed by radical oxygen release from the roots that oxidized the reduced form of
methylen blue (Brix 2003).
The rates of oxygen from roots depend on the internal oxygen concentration, the oxygen
demand of the surrounding medium and the permeability of the root-walls of the plants
(Sorrell and Armstrong, 1994). Wetland plants preserve internal oxygen through the suberized
and lignified layers in the hypodermis and outer cortex (Armstrong and Armstrong, 1988).
These layers close the radial leakage of oxygen which allows more oxygen to reach the apical
meristem (the tissue which contains meristematic cells and found in zones of the plant where
growth can take place). Thus, wetland plants attempt to limit their oxygen losses to the
rhizosphere. The oxygen leakage at the root-tips serves to oxidize and detoxify potentially
harmful reducing substances in the rhizosphere (Brix, 2003).
iv) Organic compound release
Plants release a wide variety of organic compounds from their root systems, at rates up to
25% of the total photosynthetically fixed carbon. This carbon release could be a source of

Treatment of Industrial and Agro-Industrial Wastewater using Constructed Wetlands Mar-Yam Sultana
Chapter 3: Constructed Wetlands 44
food for denitrifying microbes (Brix, 1997). Decomposing plant biomass also provides a
durable, readily available carbon source for microbial populations.
v) Nutrient uptake and storage
Aquatic plants or macrophytes of wetlands require nutrients for their growth and reproduction
and they can uptake nutrients (macro or micro-nutrients) through roots during their active
growing stage, and these nutrients are translocated to the rhizomes (Mitsch and Gosselink,
1993). As wetland plants are very productive, considerable amounts of nutrients can be bound
in the biomass. Phosphorus and nitrogen uptake capacity of emergent macrophytes is roughly
in the range 30 to 150 kg P/ha/year and 200 to 2500 kg N/ha/year (Brix and Schierup, 1989;
Gumbricht, 1993a; b; Brix, 1994). However, the amounts of nutrients which are removed by
harvesting are generally insignificant compared to the loads in wastewaters (Brix, 1994).
If the plants of wetlands are not harvested, the vast majority of the nutrients that have been
incorporated into the plant tissue will be returned to the water by decomposition processes
(Vymazal and Kropfelova 2008). Long-term storage of nutrients in the wetland systems
results from the undecomposed fraction of the litter. The huge plant biomass will also create a
deposition of refractory nutrient-containing compounds in wetlands (Kadlec and Knight,
1996).
3.1.4) Microorganisms
A fundamental characteristic of wetlands is that its functions are largely controlled by
microorganisms and their metabolism (Wetzel, 1993). The ecological food web in wetlands
requires microbes for the transformation of energy. Influent wastewater is the major food
source in a CW and provides energy, stored in organic molecules. Microbial activity is
particularly important in the transformations of nutrients into various biologically useful
forms (EPA, 2000b). Microorganisms include different bacteria, yeasts, fungi, protozoa,
algae, etc. The microbial biomass is also a major sink for organic carbon and many nutrients.
Microorganisms which naturally live in water, soil, and on the roots of wetland plants feed on
organic materials and/or nutrients, then reduce, break down or completely remove a wide
variety of contaminants from wastewaters.

Treatment of Industrial and Agro-Industrial Wastewater using Constructed Wetlands Mar-Yam Sultana
Chapter 3: Constructed Wetlands 45
Widely distributed microorganisms in nature have the capacity to utilize hydrocarbons as the
sole source of carbon (energy) for their metabolism. The microbial community on the plant
rhizosphere creates an environment which enhances the degradation of many volatile organic
compounds (Pardue et al., 2000). Microbial populations can adapt to changing conditions and
can grow rapidly in suitable environments with energy-containing materials. In addition,
when environmental conditions are no longer suitable, many microorganisms become
dormant and can remain so for years (Hilton, 1993).
Microorganisms not only contribute to the transformation of organic and inorganic
substances, but they also can alter the reduction/oxidation (redox) conditions of the substrate
and thus affect the processing capacity of the wetland (EPA, 2000b). Many microbes are
capable of functioning under both aerobic and anaerobic conditions (facultative anaerobes) in
response to changing environmental conditions. In aerobic respiration, microbes use O2 to
oxidize part of the carbon in the contaminants to carbon dioxide (CO2). The rest of the carbon
is used to produce new cell mass. Thus, the major by-products of aerobic respiration are CO2,
water, and an increased population of microorganisms (Francis, 1996; Riser-Roberts, 1992).
Transformation of organic contaminants by microbes takes place since the organisms can use
the contaminants for their own growth and reproduction. Organic contaminants give two
major benefits to organisms: they provide a source of carbon, which is one of the basic
building blocks of new cell constituents, and they provide electrons, which the organisms can
extract to obtain energy (Christensen and Elton, 1996). Energy for growth and reproduction of
microorganisms comes by catalyzing energy-producing chemical reactions that involve
breaking chemical bonds and transferring electrons away from the contaminant. The energy
obtained from these electron transfers is used along with electrons and carbon from the
contaminant to produce more cells (Christensen and Elton, 1996; Riser-Roberts, 1992).
3.2) Types of Constructed Wetlands
According to Kadlec and Knight (1996) CWs can be classified by various parameters but the
two most important criteria are the water flow regime (free water surface and sub-surface) and
the type of macrophytic growth (emergent, submerged, free floating and rooted with floating
leaves) (Fig. 3.7). Different types of CWs can be combined to create a hybrid or combined
system that combines the specific advantages of each system.

Treatment of Industrial and Agro-Industrial Wastewater using Constructed Wetlands Mar-Yam Sultana
Chapter 3: Constructed Wetlands 46
Figure 3.7: Classification of CWs for wastewater treatment.
3.2.1) Surface Flow/ Free Water Surface Flow
The surface flow (SF) also termed as Free Water Surface (FWS) (Fig. 3.7) normally consists
of basins or channels, with soil or another porous media to support the rooted vegetation, and
water of relatively shallow depth flows through the unit. The wetland is submerged and water
flows horizontally on top of the wetland soil, infiltrates the soil or is evaporated as the surface
of water is exposed to the atmosphere (EPA, 1993). The water is allowed to flow on top of the
ground surface until collected at the outlet of the wetland. This system is designed to allow a
permanent depth of water that flows horizontally across the wetland bed surface with
landscape similar to a natural wetland. The common characteristic of FWS wetlands are either
a shallow basin of soil or other medium with a controlled water level to ensure that the
sediment, aquatic plants and soil are always submerged. Only the plant stems occur above the
water level. The surface area of FWS CWs can be quite large and they are similar to swamps
and marshes with diverse ecology (Gray, 2004). FWS CWs are also a combination of open
water areas with some floating vegetation as well as emergent plants rooted in the soil (Fig.
3.8). It is quite ensure about plug-flow conditions in FWS CWs because of the shallow water
depth, low flow velocity, and presence of the plant stems (Reed et al., 1988).
Constructed
wetland
Emergent Plant
Submerged
Free floating
Rooted with
floating leaves
Sub-surface flow flow
Surface flow
Vertical Horizontal
Hybrid System

Treatment of Industrial and Agro-Industrial Wastewater using Constructed Wetlands Mar-Yam Sultana
Chapter 3: Constructed Wetlands 47
Figure 3.8: Schematic diagram of a Free Water Surface constructed wetland.
A typical FWS constructed wetland with emergent macrophytes normally contains 10 to 15
cm of flowing water in the horizontal dimension of the main basin. The depth of the basins
ranges from 40 to 60 cm and usually more than 50% of the surface is covered by densed
emergent vegetation (Vymazal, 2010). Sometimes naturally occurring species may be present
in this wetland (Kadlec, 1994). Planted macrophytes are usually not harvested and the litter
provides organic carbon for denitrification which leads to anaerobic pockets within the litter
layer (Vymazal, 2010). Aeration of the sediment in FWS takes place by halophytic plants
which act as a source of oxygen providing dissolved oxygen with their roots to a wide variety
of microorganisms.
FWS are land-intensive treatment systems. The water which enters the wetland contains
particulate and dissolved pollutants and spreads out over the large area of shallow water with
emergent or submerged vegetation. Settlable organics are rapidly removed through the
deposition and filtration process. Suspended microbial growth and their attachments are
responsible for the removal of soluble organics. These wetlands are very effective in
removing suspended solids through filtration and sedimentation (Kadlec and Knight, 1996).
Nitrogen is effectively removed by nitrification (in the water column) and subsequent
denitrification (in the litter layer). Ammonium is oxidized by nitrifying bacteria in aerobic
zones, and nitrate is converted to free nitrogen or nitrous oxide in the anoxic zones by
denitrifying bacteria. These systems are also efficient for the sustainable removal of

Treatment of Industrial and Agro-Industrial Wastewater using Constructed Wetlands Mar-Yam Sultana
Chapter 3: Constructed Wetlands 48
phosphorus, but at relatively slow rates because of limited contact between the water column
and the soil (Kadlec et al., 2000).
3.2.2) Horizontal Sub-Surface Flow
Sub-surface systems CWs may be classified according to the direction of their water flow into
horizontal (HSF) and vertical (VF) (Fig. 3.9) types. The technology of wastewater treatment
with horizontal surface flow (HSF) CWs started in Germany based on coarse media by Kathe
Seidel commencing in the 1950s and by Reinhold Kickuth in the 1970s with soil media and
high clay content (Vymazal, 2009). Since then, this technology has spread into many
European countries and is now used worldwide for treatment of different types of
wastewaters. The design typically consists of a rectangular planted bed with different species
(Phragmites spp.) and gravel or rock beds, sealed by an impermeable layer. Among the use of
treatment wetlands, HSF CWs are a widely applied concept (Vymazal, 2010).
Figure 3.9: Schematic diagram of a Horizontal Sub-Surface flow constructed wetland.
HSF CWs are shallow beds with depths of 40-60 cm, normally filled with gravel in which
different macrophytes are planted (Fig. 3.9). The flow depth through the HSF constructed
wetland is generally between 0.6 to 0.3 meters (Cooper, 1993). This system is called
horizontal sub-surface flow because the wastewater is fed into the inlet zone and flows
horizontally (i.e., the inlet and outlet are horizontally opposed) through the porous medium
under the surface of the bed, until it reaches the outlet zone where it is collected. Precise inlet

Treatment of Industrial and Agro-Industrial Wastewater using Constructed Wetlands Mar-Yam Sultana
Chapter 3: Constructed Wetlands 49
and outlet structures ensure uniform horizontal and vertical flow patterns through the gravel
bed. The water level is maintained under the surface of the gravel which is kept dry. No odour
is produced, insects cannot breed and there is no danger of human contamination from
wastewater being treated.
HSF CWs have different oxidation zones (i.e., aerobic, anoxic and anaerobic zones). The
aerobic zones occur around roots and rhizomes where oxygen leaks into the substrate (Brix,
1987; Cooper et al., 1996). The gravel bed provides a suitable environment for microbial
growth and attachment. Gravel can provide surface areas of about 225m2/m
3
(http://wholewater.com). Uniform gravels are used for the gravel bed and the size range varies
between 3 to 10 millimeters (Cooper, 1993). As gravel is used as the porous media,
subsurface flow wetlands act as filters which have larger surface areas for biofilm growth, and
pollutant removal rates are higher than any in other types of CWs. Biofilm grows to a certain
thickness which then stabilizes, but does not obstruct the wastewater flow (Cooper, 1993). In
this system, wastewaters stay beneath the surface and are in contact with the roots and
rhizomes of the plants (Fig. 3.10).
Figure 3.10: Substrate structure of HSF CWs.

Treatment of Industrial and Agro-Industrial Wastewater using Constructed Wetlands Mar-Yam Sultana
Chapter 3: Constructed Wetlands 50
The beds are normally sealed with either clay or a plastic liner/membrane to prevent leakage
at all sides. Plants play the most important roles in HSF constructed wetland by providing
substrate (roots and rhizomes) for the growth of attached bacteria, radial oxygen loss (oxygen
diffusion from roots to the rhizosphere), by nutrient uptake and insulation of the bed surface
in cold and temperate regions (Brix, 1994). The efficient reaction zone in CWs is the root
zone area (rhizosphere) where physicochemical and biological processes take place by the
interaction of plants, microorganisms and pollutants (Stottmeister et al., 2003). The plant root
zone has the most suitable environment for microbial growth as oxygen concentrations are
higher around the roots, therefore an extensive plant root zone will lead to higher biofilm
development, chemical precipitation and metal binding (Brix, 1997).
In HSF CWs bed, pollutants are removed by microbial degradation and chemical and physical
processes in a network of aerobic, anoxic, anaerobic zones and this purification process takes
place in the aerobic zone, which is situated in the rhizosphere (Vymazal 2010). In this system
water is not exposed during the treatment process therefore, minimizing energy losses through
evaporation and convection, and for this reason HSF CWs are more suitable for winter
application (Wallace et al., 2000). The main advantage of HSF CWs is that they require
smaller spaces because the contact area of water, microorganisms and substrate is large. As
the water level is lower and not exposed to the atmosphere, the risk of spread of vector
disease and odour is lower compared to the surface flow type wetlands in which wastewater is
exposed to the atmosphere.
Mainly domestic and municipal wastewaters are treated in HSF CWs around the world.
However, many other types of wastewaters, including industrial and agricultural, landfill
leachate, runoff waters and are treated by HSF CWs systems (Vymazal, 2010). Properly
designed HSF CWs have several advantages and provide high and consistent levels of
treatment efficiencies (Hammer, 1992; USDA et al., 1995a, b; Cooper et al., 1996; Kadlec
and Knight, 1996; IWA, 2000).
3.2.3) Vertical flow
Vertical Flow CWs (VF) were first developed by Seidel in Germany in the 1970s (Vymazal
and Kropfelova, 2008) and then operated in Europe (Burk and Lawrence, 1990). Brix (1992)
provides an overview of Seidel’s systems in Europe. VF CWs consist of sand or gravel beds

Treatment of Industrial and Agro-Industrial Wastewater using Constructed Wetlands Mar-Yam Sultana
Chapter 3: Constructed Wetlands 51
with planted emergent macrophytes. The wastewater is distributed on the surface of the bed
and it percolates through the porous media down to the outlet zone usually placed on the
bottom of the bed (Fig. 3.11). The bed drains completely free to allow air to refill the bed
which leads to better oxygen transfer for nitrification (Cooper et al., 1996). The wetland can
also be operated by an up-flow pattern, by inverting the position of the inlet and outlet pipes,
or in a tidal fashion, with fill and drain cycles. The temporarily saturated (in the case of tidal
flow or fill and drain wetlands) or unsaturated states of VF CWs favour oxygen regeneration
in all areas of the wetland while reduction processes such as denitrification are limited. Less-
degradable pollutants require a combination of anaerobic and aerobic processes for
biodegradation. VF CW systems are efficient at treating industrial wastewaters because
anaerobic and aerobic processes take place in these systems sequentially (Yamagiwa and Ong,
2007).
Figure 3.11: Vertical flow constructed wetland
VF CWs can efficiently remove BOD5, COD and bacteria because of their higher ability to
transform. They are considered smaller (1-2 m2/ person equivalent - PE) than HSF CWs
which need 5-10 m2/PE for secondary treatment (Cooper, 1999). VF CWs have more equal
root distribution and water-root contact, and fewer problems of bad odour and proliferation of
insects since they do not have a free water surface (Haberl et al., 1995; Cooper, 1999). The
main purpose of vegetation in VF constructed wetlands is to help maintain the hydraulic
conductivity of the bed (Vymazal and Kropfelova, 2008).
Treatment of Industrial and Agro-Industrial Wastewater using Constructed Wetlands Mar-Yam Sultana
Chapter 3: Constructed Wetlands 52
Phosphorus removal in VF CWs is very restricted, because it is not possible for the sand bed
medium to bind phosphorus for a prolonged period (Arias et al., 2001, Del Bubba et al.,
2003; Arias and Brix, 2005). This system is very effective in removing suspended solids and
organics and they can also nitrify at high loading rates even during cold winters (Brix et al.,
2002; Vymazal, 2010). VF CWs are primarily used to treat domestic or municipal
wastewaters. However, in recent years VF systems have also been used to treat other types of
wastewaters (Vymazal, 2010).
3.3) Design Factors
The successful use of constructed wetland technology for the efficient treatment of
wastewater depends mainly upon proper design and operational specifications. Quantifying
the hydraulics of CWs is crucial to understand their function and assess their efficiency in
removing pollutants. The criteria for wetland design include hydrology, substrates, plant
selection, and maintenance procedures (Kusler and Kentula, 1996).
3.3.1) Pretreatment
Pretreatment of effluents before they enter the CW system is necessary to remove coarse and
heavy solids. This is a critical first step that removes most solids (measured as Total
Suspended Solids - TSS) which settle on the bottom of the CW and are degraded by anaerobic
bacteria. Usually a simple septic tank or settling tank is used for small domestic sewage
volumes. Brix and Arias (2005) suggested using two- or three-chambered sedimentation tank
for domestic wastewater pretreatment. For municipal sewage pretreatment a combination of
screening and Imhoff tank is used and when storm water runoff is also to be treated, a grit
chamber is included. When oils and grease are contained in the wastewater, normally grease
filters are used. According to Cooper et al. (1996), a properly sized, built and maintained
septic or settling tank is expected to reduce BOD load by up to 20-30%. Pretreatment also
helps to minimize the possible problem of media clogging.
3.3.2) Hydrology
Hydrology is one of the primary factors in controlling wetland functions (Hammer, 1989).
Flow rate should be regulated to achieve satisfactory treatment. Sufficient water supply is

Treatment of Industrial and Agro-Industrial Wastewater using Constructed Wetlands Mar-Yam Sultana
Chapter 3: Constructed Wetlands 53
crucial to establish an efficient CW system (Sim, 2003). Hydrology influences plant species
composition (Bunce et al., 1999), soil characteristics, and nutrient cycles (Kadlec and Knight,
1996; DeBusk, 1999). The flow and storage volume determine the time that water spends in
the wetland system as well as the degree of mixing, thus influencing the interactions between
pollutants and the wetland ecosystem; consequently determining pollutant removal and gas
emissions. Hydrological factors in wetland design belong to the hydroperiod, hydraulic
residence time, hydraulic loading rate, losses to the atmosphere (evapotranspiration), and
overall water balance.
3.3.2.1) Hydraulic Loading Rate (HLR)
The hydraulic loading rate (HLR) refers to the loading on a water volume per unit area over a
specified time interval. Typically, hydraulic loading rates are specified in cm/d (ITRC, 2003).
HLR expressed as:
HLR = Qi/A………………… (3.1)
Where, Qi: wastewater inflow (m3/ d), and A is the wetland top surface area (m
2)
The pollutant loading rate at the inlet (LRi, kg/ m2/d
1) is defined as:
LRi= HLR×Ci…………… (3.2)
Where: Ci is the inlet concentration (mg/L).
Appropriate HLRs and HRTs are very significant parameters for wastewater treatment in
CWs. The HLR depends on the soil material (a critical parameter for subsurface flow
wetlands), flow rate, area-size and hydraulic residence time. Finally, the HLR is determined
by the required pollutant removal efficiency (WPCF, 1990). Lower HLRs or long HRTs result
in better pollutant removal. Table 3.2 presents typical loading rate for the different types of
CWs.

Treatment of Industrial and Agro-Industrial Wastewater using Constructed Wetlands Mar-Yam Sultana
Chapter 3: Constructed Wetlands 54
Table 3.2: HLRs for different types of CWs (Vymazal, 2010).
Recommended Loading Rates for FWS CWs
Parameter Loading rates Reference
BOD5 11.2 g/m2d
Wallace and Knight 2006;
EPA, 2000b TSS 7 g/m
2d
TKN 1.5 g/m2d
Recommended Loading Rates for HSF CWs
Parameter Loading rates Ref
BOD5 6 g/m2d
EPA, 2000b TSS 20 g/m
2d
Recommended rates for VF CWs
Parameter Loading rates Ref
TKN 6.5 g/m2d Platzer, 1998
BOD/COD 0.05 g/m2d Stefanakis et al., 2014
3.3.2.2) Hydraulic Retention Time (HRT)
Hydraulic residence time (HRT) is one of the key design parameters which control the
removal efficiency of contaminants and nutrients in CWs (Walker, 1998; Conn and Fiedler,
2006). HRT is determined by the mean volume of the wetland system and mean out flow
(Qo), and is expressed as:
HRT= V/Qo………………… (3.3)
Where: V is the mean volume of water in the wetland (m3), and Qo is the mean outflow
(m3/d).
From the literature it is apparent that the treatment efficiency of pollutants in a CW system is
usually improved by decreasing the hydraulic loading; the longer the HRT, the greater the
nutrient removal (Sakadevan and Bavor, 1999). Metcalf and Eddy Inc., (1991) and Watson
Treatment of Industrial and Agro-Industrial Wastewater using Constructed Wetlands Mar-Yam Sultana
Chapter 3: Constructed Wetlands 55
and Hobson (1989) suggested that the most effective HRT range is 4 to 15 days. Gersberg et
al., (1989) found that a short HRT of 3–6 days was effective in removing disease-causing
bacteria and viruses. Significantly HRT can differ depending on whether secondary or tertiary
treatment is intended. Generally, tertiary treatment requires longer retention times. Higher
reduction efficiency for mass balances of N and P can be achieved by Phragmites if water
retention time is more than 5 days (Sim, 2003).
3.3.3) Design of Bed/Bed Area
CWs are usually designed to be of minimum size and cost in order to perform the required
level of pollutant removal. Generally, HSF CWS should have a 3-4: 1 length to width ratio
and be rectangular in shape if minimal treatment area is available. A long length-width ratio is
required to ensure plug flow hydraulics (Miller and Black, 1985). The size of wetland beds
has been designed according to many models beginning with the simple “rule of thumb”, or
complex dynamic, compartmental models for the design spectrum. A simple formula (Eq. 3.4)
is given by Vymazal (2002) to determine surface area for the wetland cells. This formula has
resulted in a general “rule of thumb” for a total area of cells of 5m2/PE.
………………… 3.4
Where,
Ah = Surface area of bed, m2
Qd = Average flow, m3/d
Co = Influent BOD5, mg/L
C = Effluent BOD5, mg/L
KBOD = Rate constant, m/d
Table 3.3 summaries key design and operational specifications for the efficient performance
of HSF and VF CWs. Normally, VF systems require less land (1-3 m2/PE) compared to HF
systems (5-10 m2/PE). The dimensions of vertical flow systems vary between 1-2 m
2/PE; 1
m2/PE for BOD removal only, and 2 m
2/PE for BOD removal followed by nitrification
(Cooper and Green, 1995).

Treatment of Industrial and Agro-Industrial Wastewater using Constructed Wetlands Mar-Yam Sultana
Chapter 3: Constructed Wetlands 56
In addition to the wetland bed, the following criteria also contribute to the design of
horizontal subsurface flow wetlands:
Aspect ratio (Width: Length): 1:4
Slope of Wetland Bed: 0.5 - 1%
Minimum substrate bed depth: 0.6m
Hydraulic conductivity of substrate: 10-3
m/s to 10-2
m/s (Ellis et al., 2003).
Table 3.3: Key design and operational specifications for HF and VF CWs.
Parameter
Subsurface flow
HF VF
Flow
Horizontal, continuous
Vertical, intermittent by
batch
Bed design equation
*Ah= Qd (ln Ce-Ci)/ KBOD
**A1=5.25 P0.35
+0.9P
A = the area of a second
bed, estimated at 50%
of A1
A2= the area of a second
bed
Specific area (m2/PE)
5 -10
1 – 2
Recommended organic
loading
***8 – 12g BOD5 m2/d
**** 25g COD m2/d
Prevailing condition Anaerobic Aerobic
(*Cooper et al., 1996, **Grant and Griggs, 2001, ***Kadlec and Knight, 1996, ****Platzer,
1999.)
Where Ce (mg/L) is effluent concentration, Ci (mg/L) is influent concentration, K (-1
day) is a
temperature-dependent first order reaction rate constant, Ah (m2) is the surface area of the bed,
and KBOD (m/d) is the BOD rate constant. A1 and A2 are the area of the first and second bed
in a vertical configuration respectively.
3.3.4) Selection of wetland plants
Availability of suitable plants, expected water quality, normal and extreme water depths,
climate, maintenance requirements and ultimate goals, are among the variables that determine
the selection of plant species for CWs (Stottmeister et al., 2003). For wetland vegetation
common reed plants (Phragmites australis) are more popular in Europe (Cooper and Green,

Treatment of Industrial and Agro-Industrial Wastewater using Constructed Wetlands Mar-Yam Sultana
Chapter 3: Constructed Wetlands 57
1995). The choice of plants for treatment of wastewater in CWs is an important issue because
they must survive the potentially toxic effects of the effluent and its variability. Aquatic plants
can absorb inorganic (nutrients, metals, etc), and organic pollutants from wastewater by
mixing them into their own structure (Haberl et al., 2003), so they can be released throughout
the plant growth cycle or stored (Shetty et al., 2005). Further, they amplify the nourishment of
the residuals in the wetland (Vymazal, 2007).
Wetland plants have special features that allow them to grow in environments where water
presence is continuous. They must tolerate high organic and nutrient loadings and have well-
developed underground organs that provide large surfaces for microbial growth (Vymazal,
2011). There are variations in pollutant removal and accumulations between species but most
accumulate pollutants mainly in their belowground tissues (Peverly et al., 1995; Stoltz and
Greger, 2002; Weis and Weis, 2004). Plants which are used for CWs, can be categorized into
two types: rooted and floating forms. The rooted plants are classified into emergent, floating
and submerged (Hammer, 1989). Some studies refer that pollutant uptake depends on the
plant’s form and chemical speciation. Rooted submerged plants are more efficient for
phytoremediation due to their soil binding roots and rhizomes which help the algae, microbes
and invertebrates to colonize (Qian et al., 1999).
According to Brix and Schierup (1989), Wetzel (2001) and Cronk and Fennessy (2001),
emergent macrophytes are the dominating life form in wetlands and they can grow within a
water table range of 50 to 150 cm below the soil surface. The characteristics of these plants
include their aerial parts (i.e. leaves, stems) and extensive root and rhizome system, and they
are morphologically adapted to grow in a submerged substrate due to their large internal air
spaces that allow the movement of oxygen to the roots and rhizomes. The species of this form
include Phragmites australis (common reed), Glyceria spp. (mannagrasses), Eleocharis spp.
(spikerushes), Typha spp. (cattails), Scirpus spp. (bulrushes), Iris spp. (blue and yellow flags)
and Zizania aquatica (wild rice) (Fig. 3.12) (Kadlec and Knight, 1996). This group of plants
produces huge amount of biomass both aerial and belowground parts. These plants produce an
extensive root matrix and have a large surface area for nutrient and ion uptake due to their
horizontal and vertical growth of plant tissues.

Treatment of Industrial and Agro-Industrial Wastewater using Constructed Wetlands Mar-Yam Sultana
Chapter 3: Constructed Wetlands 58
Figure 3.12: Different types of wetland plants.
(Source: http://www.intechopen.com/books)
Submerged aquatic plants have their photosynthetic tissues entirely submerged but the
flowers of the plants are exposed to the atmosphere. Examples of these types of macrophytes
are Elodea, Myriophyllum, Ceratophyllum, Isoetes, Littorella, Lobelia (Brix, 2003). These
types of aquatic plants grow very fast. Some species rootless and float under the surface of the
water (e.g. Ceratophyllym demersum). This submerged aquatic plant can grow quickly in
medium-hard to hard water at a certain temperature and it can take up nutrients for its quick
growth (URL 2).
Many researchers have investigated the effectiveness of floating plants in treatment wetlands
(Boutwell and Hutchings, 1999; Hart et al. 2003; Hubbard et al., 2004). The floating form of
macrophytes includes free-floating and floating-leaved plants. Free-floating plants take their
nutrients from water. Examples of floating plants are Nymphaea spp. and Nuphar spp.
(waterlilies), Potamogeton natans (pondweed), and Hydrocotyle vulgaris (pennyworth),
Eichhornia crassipes (water hyacinth), Pistia stratiotes (water lettuce) and Lemna spp. and
Spirodella spp. (duckweed) (Brix and Schierup, 1990, Kadlec and Knight, 1996). Some free
floating plants have well developed submerged roots (e.g. Eichhornia, Trapa, Hydrocharis)
and some surface-floating plants have no roots (e.g. Lemnaceae, Azolla, Salvinia) (Brix,
2003).
Treatment of Industrial and Agro-Industrial Wastewater using Constructed Wetlands Mar-Yam Sultana
Chapter 3: Constructed Wetlands 59
3.3.5) Inlet structure
In CW systems it is essential to have an even distribution of wastewater over the whole bed
area. For this reason some systems have use a series of pipe with holes or gutters to distribute
the flow evenly. An open trench perpendicular to the flow direction, and simple, single point
weir boxes can be used for the inlet devices. In some cases perforated pipe is used for both
surface and subsurface CWs. Another method is to completely flood the bed as part of the
intermittent dosing cycle (Cooper and Green, 1995).
3.3.6) Outlet Structure
Outlet structures of CWs help to control uniform flow through the wetland as well as the
operating depth. The design of subsurface flow wetlands should allow controlled flooding at
15 cm to foster desirable plant growth and to control weeds. The use of an adjustable outlet
which is recommended to maintain an adequate hydraulic gradient in the bed and can also
have significant benefits in operating and maintaining the wetland.
3.4) Removal Mechanism of Constructed Wetlands
The mechanism of pollutant removal in CWs is a complex combination of physicochemical
and biological process including sedimentation, binding to substrate, plant uptake and
precipitation as insoluble forms of substances (Fig. 3.13) (Kadlec and Knight, 1996). A CW
system complex as its behaviour depends on both external (e.g. flow-rate, wastewater
composition and temperature) and internal factors (e.g. bacteria growth and development)
(Samso and Garcia, 2013). The system can efficiently remove different pollutants including
organic matter, suspended solids, nitrogen, phosphorus, trace metals and nutrients (Vymazal
et al., 1998; Hammer, 1989).
Physical processes: Sedimentation and filtration are the main physical processes occurring in
CW systems and are related to the water flow. Longer retention times increase pollutant
removal, as suspended particles are removed by sedimentation, On the other hand too long a
retention time lead to detrimental effects. Nutrients, such as phosphorous, nitrogen and other
chemicals, are also removed through sedimentation, as they attach to the setting sediments.

Treatment of Industrial and Agro-Industrial Wastewater using Constructed Wetlands Mar-Yam Sultana
Chapter 3: Constructed Wetlands 60
Figure 3.13: Processes occurring in a Constructed Wetland (ITRC, 2003).
Chemical processes: This process occurs by the precipitation of wastewater pollutants as
insoluble forms and their reaction with oxygen, soil minerals or other substrates in the
wetland. When wetlands contain ferrous iron components, a chemical transformation can
occur between the iron and incoming sulfides, and insoluble ferrous sulfide is formed which
then settles to the wetland bed. These degradation and transformation processes are caused by
the aerobic and anaerobic environment of the wetlands’ substrate.
Biological processes: Six major biological processes define CWs performance:
photosynthesis, respiration, fermentation, nitrification, denitrification and microbial removal
(Tousignant et al., 1999). Photosynthesis is performed by wetland plants and algae, adding
carbon and oxygen to the wetland. Both carbon and oxygen accelerate the nitrification process
in CWs.
3.4.1) Organic matter removal
The main processes of organic matter removal in CWs include volatilization, photochemical
oxidation, sedimentation, sorption and biodegradation (ITRC, 2003). Organic matter removal
efficiency in CWs is generally high (Kadlec and Brix, 1995; Vymazal et al., 1998). Puigagut
et al. (2007) reported that BOD5 and COD removal efficiencies vary between 75 and 93% and
64 and 82%, respectively. Particulate organic matter is removed through filtration and
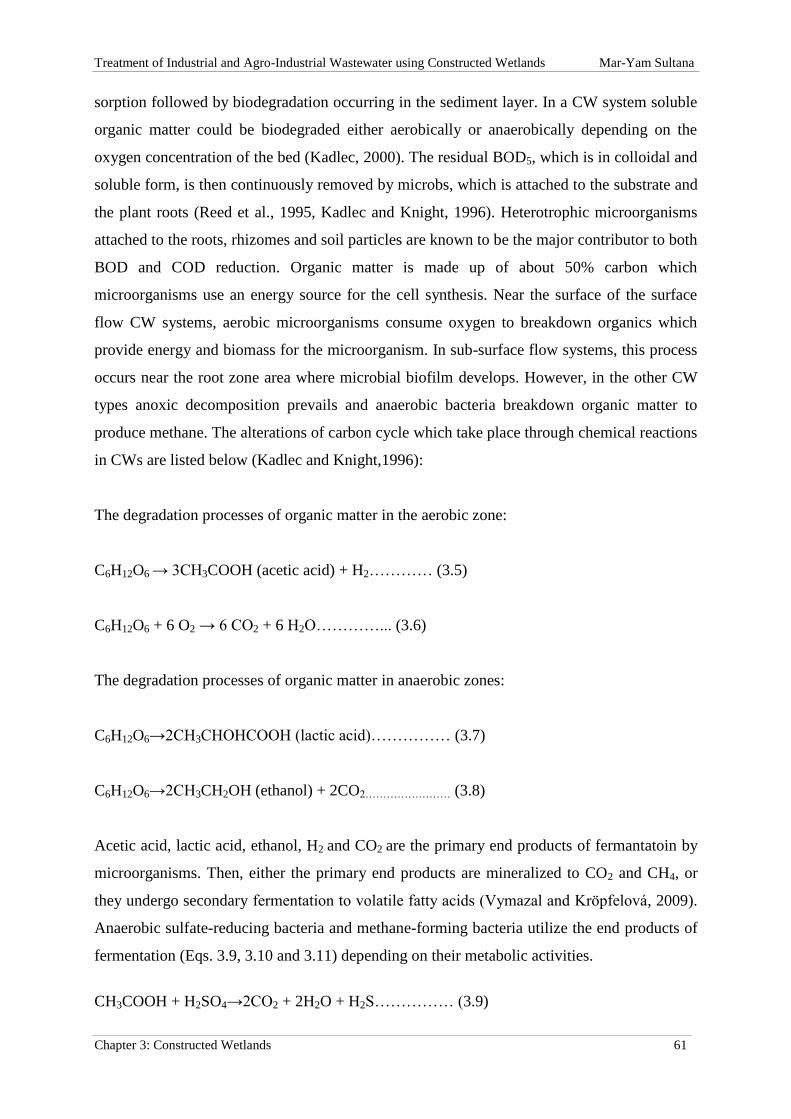
Treatment of Industrial and Agro-Industrial Wastewater using Constructed Wetlands Mar-Yam Sultana
Chapter 3: Constructed Wetlands 61
sorption followed by biodegradation occurring in the sediment layer. In a CW system soluble
organic matter could be biodegraded either aerobically or anaerobically depending on the
oxygen concentration of the bed (Kadlec, 2000). The residual BOD5, which is in colloidal and
soluble form, is then continuously removed by microbs, which is attached to the substrate and
the plant roots (Reed et al., 1995, Kadlec and Knight, 1996). Heterotrophic microorganisms
attached to the roots, rhizomes and soil particles are known to be the major contributor to both
BOD and COD reduction. Organic matter is made up of about 50% carbon which
microorganisms use an energy source for the cell synthesis. Near the surface of the surface
flow CW systems, aerobic microorganisms consume oxygen to breakdown organics which
provide energy and biomass for the microorganism. In sub-surface flow systems, this process
occurs near the root zone area where microbial biofilm develops. However, in the other CW
types anoxic decomposition prevails and anaerobic bacteria breakdown organic matter to
produce methane. The alterations of carbon cycle which take place through chemical reactions
in CWs are listed below (Kadlec and Knight,1996):
The degradation processes of organic matter in the aerobic zone:
C6H12O6 → 3CH3COOH (acetic acid) + H2………… (3.5)
C6H12O6 + 6 O2 → 6 CO2 + 6 H2O…………... (3.6)
The degradation processes of organic matter in anaerobic zones:
C6H12O6→2CH3CHOHCOOH (lactic acid)…………… (3.7)
C6H12O6→2CH3CH2OH (ethanol) + 2CO2…………………… (3.8)
Acetic acid, lactic acid, ethanol, H2 and CO2 are the primary end products of fermantatoin by
microorganisms. Then, either the primary end products are mineralized to CO2 and CH4, or
they undergo secondary fermentation to volatile fatty acids (Vymazal and Kröpfelová, 2009).
Anaerobic sulfate-reducing bacteria and methane-forming bacteria utilize the end products of
fermentation (Eqs. 3.9, 3.10 and 3.11) depending on their metabolic activities.
CH3COOH + H2SO4→2CO2 + 2H2O + H2S…………… (3.9)

Treatment of Industrial and Agro-Industrial Wastewater using Constructed Wetlands Mar-Yam Sultana
Chapter 3: Constructed Wetlands 62
CH3COOH + 4H2→2CH4 + 2H2O…………………… (3.10)
4H2 + CO2→2CH4 + 2H2O…………………… (3.11)
Elimination by the decomposition of plant mass and other natural organics in a CW system
may be limited. Therefore, it is quite difficult to achieve zero BOD5 in effluent of CW
systems. Moreover, temperature influences the concentration of BOD5 (Reed et al., 1995) and
due to seasonal plant growth carbon compounds can be added to the root zone in the form of
plant detritus and root exudates, and this may be an important carbon source in treatment
wetlands (Pinney et al., 2000).
3.4.2) Nitrogen removal
The nitrogen entering wetland systems can be measured as organic nitrogen and ammonia
(expressed as TKN), or as nitrite and nitrate (Tanner et al., 2002). Nitrogen is an essential
nutrient for all living organisms being present in different forms (Hagopian and Riley, 1998),
nevertheless nitrogen compounds are among the main pollutants of concern in wastewaters
because of their role in contributing to eutrophication, algal blooms, and depreciation of
dissolved oxygen levels in receiving water bodies. Furthermore, unionized ammonia (NH3)
and nitrite (NO2-) are toxic to fish and other aquatic organisms in low concentrations.
Nitrogen removal through CWs is mainly performed by the successive microbial pathways of
ammonification, nitrification and denitrification. In wetland systems, the initial removal of
organic nitrogen as TSS is usually rapid. Microorganisms play a crucial role in the
transformation and removal of nitrogen from wastewaters. Microbial processes convert
particulate organic nitrogen by decomposition into new biomass and ammonium. The removal
mechanisms for N in CWs include volatilization, ammonification, nitrification/denitrification,
plant uptake and matrix adsorption (Brix, 1993). However, the major removal mechanism in
most CWs is microbial nitrification and denitrification (Vymazal, 1998; Moshiri, 1993;
Cooper et al., 1996). Organic nitrogen is transformed into NH4+-N through a complex
biochemical process called ammonification. The rate of ammonification is related to the
organic matter degradation proportion and it occurs quickly in an aquatic environment.
Ammonia nitrogen exists in aqueous solution as either unionised ammonia (NH3) or the
ammonium ion depending on the pH (Vymazal, 1998) as described below:
NH3+ H2O ↔ NH4+ + OH
- ……………… (3.12)
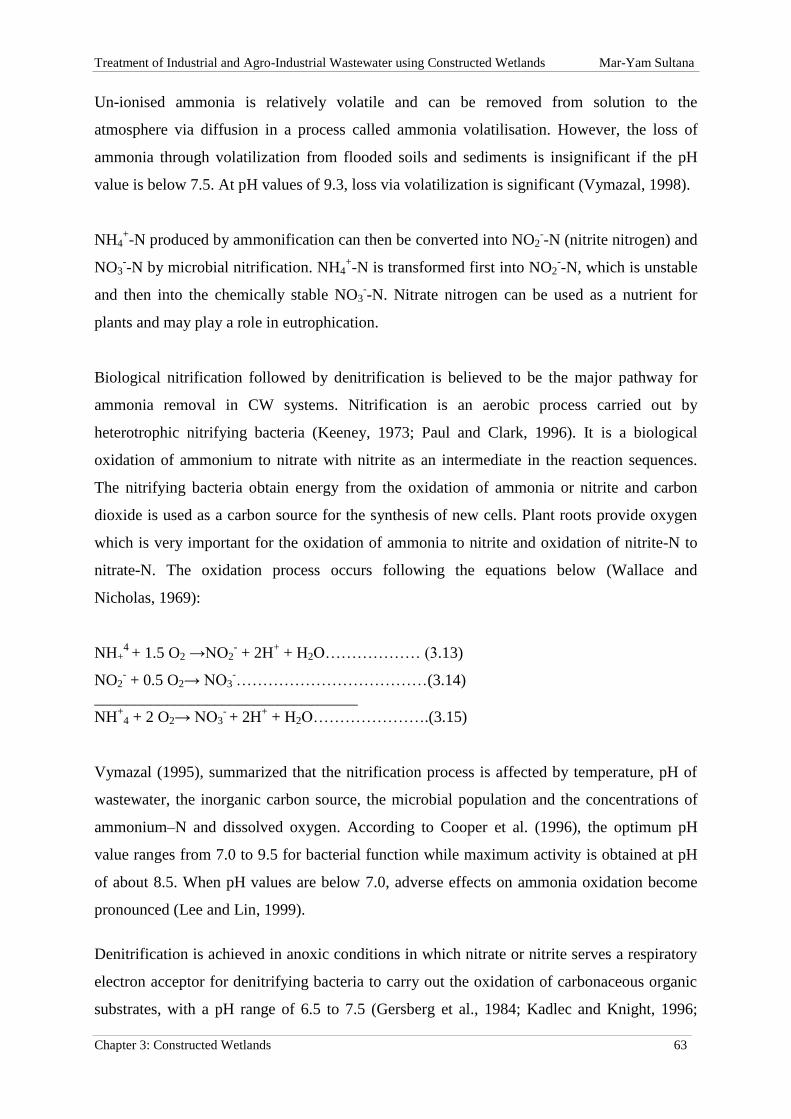
Treatment of Industrial and Agro-Industrial Wastewater using Constructed Wetlands Mar-Yam Sultana
Chapter 3: Constructed Wetlands 63
Un-ionised ammonia is relatively volatile and can be removed from solution to the
atmosphere via diffusion in a process called ammonia volatilisation. However, the loss of
ammonia through volatilization from flooded soils and sediments is insignificant if the pH
value is below 7.5. At pH values of 9.3, loss via volatilization is significant (Vymazal, 1998).
NH4+-N produced by ammonification can then be converted into NO2
--N (nitrite nitrogen) and
NO3--N by microbial nitrification. NH4
+-N is transformed first into NO2
--N, which is unstable
and then into the chemically stable NO3--N. Nitrate nitrogen can be used as a nutrient for
plants and may play a role in eutrophication.
Biological nitrification followed by denitrification is believed to be the major pathway for
ammonia removal in CW systems. Nitrification is an aerobic process carried out by
heterotrophic nitrifying bacteria (Keeney, 1973; Paul and Clark, 1996). It is a biological
oxidation of ammonium to nitrate with nitrite as an intermediate in the reaction sequences.
The nitrifying bacteria obtain energy from the oxidation of ammonia or nitrite and carbon
dioxide is used as a carbon source for the synthesis of new cells. Plant roots provide oxygen
which is very important for the oxidation of ammonia to nitrite and oxidation of nitrite-N to
nitrate-N. The oxidation process occurs following the equations below (Wallace and
Nicholas, 1969):
NH+4
+ 1.5 O2 →NO2- + 2H
+ + H2O……………… (3.13)
NO2- + 0.5 O2→ NO3
-………………………………(3.14)
_________________________________
NH+
4 + 2 O2→ NO3- + 2H
+ + H2O………………….(3.15)
Vymazal (1995), summarized that the nitrification process is affected by temperature, pH of
wastewater, the inorganic carbon source, the microbial population and the concentrations of
ammonium–N and dissolved oxygen. According to Cooper et al. (1996), the optimum pH
value ranges from 7.0 to 9.5 for bacterial function while maximum activity is obtained at pH
of about 8.5. When pH values are below 7.0, adverse effects on ammonia oxidation become
pronounced (Lee and Lin, 1999).
Denitrification is achieved in anoxic conditions in which nitrate or nitrite serves a respiratory
electron acceptor for denitrifying bacteria to carry out the oxidation of carbonaceous organic
substrates, with a pH range of 6.5 to 7.5 (Gersberg et al., 1984; Kadlec and Knight, 1996;

Treatment of Industrial and Agro-Industrial Wastewater using Constructed Wetlands Mar-Yam Sultana
Chapter 3: Constructed Wetlands 64
Brix et al., 2002). According to Cooper et al. (1996), the presence of dissolved oxygen
inhibits the enzymatic activity required for denitrification. The denitrification process can be
described as:
6 (CH2O) + 4 NO3- → 6CO2 + 2N2 +6H2O…………… (3.16)
This reaction occurs in the presence of organic substrate only under anaerobic or anoxic
conditions when nitrogen is used as an electron acceptor instead of oxygen. The
denitrification process is also dependent on temperature and pH (Vymazal, 1998). This
process proceeds very slowly at temperatures below 5°C, and the optimum pH ranges from 7
to 8. In acidic environments, nitrogen oxides such as NO (nitrogen monoxide) or N2O
(nitrogen dioxide) could also be formed (Vymazal, 1995).
3.4.3) Phosphorus removal
Phosphorus (P) in wastewater is typically present as orthophosphate, dehydrated
orthophosphate (polyphosphate) and organic phosphorus compounds (Vymazal, 1998). It is
highly mobile and present in solution as particles and detritus, or in the cells of aquatic
organisms. Like nitrogen, phosphorus is an essential macronutrient for the growth of plants
and other organisms but it is also responsible for eutrophication processes. Free
orthophosphate is a major link between organic and inorganic phosphorus cycling in wetlands
as it is the only form of phosphorus thought to be utilized directly by algae and macrophytes
(Vymazal, 1995). It occurs mainly from the use of mineral fertilizers and from manures or
slurries washed off land/soil during rainy periods.
Phosphorus removal mechanisms in CWs are adsorption, complexation and precipitation.
High removal rates are anticipated in submerged bed designs when appropriate soils are
selected as the media. A significant clay content with iron, aluminum, and calcium will
enhance phosphorus removal. Phosphorus is removed through precipitation by iron and
aluminum in acidic conditions (pH <6), and by calcium and magnesium in alkaline conditions
(pH >8) (Polprasert and Veenstra, 2000). Phosphorus removal is low in surface flow wetlands
due to limited contact of wastewater with the soil and root zones (Hammer, 1989; Vymazal et
al., 1998). CWs with gravel media have high conductivity and permit water to flow
throughout the bed. For this reason, the impermeable nature of the bed provides a limited
Treatment of Industrial and Agro-Industrial Wastewater using Constructed Wetlands Mar-Yam Sultana
Chapter 3: Constructed Wetlands 65
surface area for adsorption, ion exchange and/or chemical reaction to take place and once the
active sites are utilized, phosphorus removal ceases (Newman et al., 2000).
Some CW systems in Europe use sand instead of gravel to increase the phosphorus retention
capacity, but selecting this media results in a larger system because of the reduced hydraulic
conductivity of sand compared to gravel. If significant phosphorus removal is a requirement,
then very large land areas or alternative treatment methods will probably be required.
Phosphorus removal by wetland vegetation is low as only a small fraction of phosphorus is
removed. In order to have efficient removal of phosphorus through macrophytes it is
necessary to harvest the macrophyte biomass (Vymazal et al., 1998). Plant uptake may be
significant only in systems where the surface loading rate is low.
3.4.4) Total suspended solids removal
Suspended solids are mainly removed by physical processes such as sedimentation, filtration,
and flocculation. Suspended solids removal is very effective in SF CWs. Most of the removal
probably occurs within the first few meters of travel distance from the inlet zone. All
settleable and floatable solids are removed in wetland systems due to long hydraulic residence
times. Non settleable and colloidal solids are removed by bacterial decomposition and
adsorption to the wetland media and plant root system (Stowell et al., 1981). Filtration occurs
by impaction of particles onto the roots and stems of the macrophytes or onto the soil/gravel
particles in SSF systems. The extensive root system adds surface area to the wetland media,
which reduces water velocity and reinforces settling and filtration in the root network. For
FWS systems, most of the suspended solids are removed within the first meters, giving rise to
a ‘bank’ of sludge that can hinder the water flow. Subsurface-flow systems can clog when too
many pores become filled with particulates.
3.4.5) Heavy metal (Cr) removal 1
The removal mechanism of heavy metals in CWs is a complex combination of
physicochemical and biological process including sedimentation, binding to substrate, plant
uptake, and precipitation as insoluble forms (mainly sulphides and (oxy-) hydroxides) (Kadlec
1 Sutlana et al., (2014b)

Treatment of Industrial and Agro-Industrial Wastewater using Constructed Wetlands Mar-Yam Sultana
Chapter 3: Constructed Wetlands 66
and Knight, 1996). Normally plants receive elements in their ionic forms. Most of the metal
ions penetrate into the plant cell through specific metal ion carriers or channels. In the cells of
plants, Cr ions can form chelating compounds with chelators (e.g., organic acids, glutathione,
phytochelatin and metallothionein protein) in order to reduce metal toxicity within the cells
(Cobbett and Goldsbrough, 2000; Pilon-Smits, 2005). These chelating compounds can
conduct further sequestration in cell vascular of the roots (Pilon-Smits, 2005). Once the metal
ions enter into the roots, they are either stored in the roots or translocated into the shoots
through xylem tissue (Jabeen et al., 2009). Then metals can pass through the root cell wall or
root xylem and be transported into stem xylem with the help of proteins or chelators (Pilon-
Smits, 2005). They can then translocate from stem xylem to leaf tissue where they can
combine with chelators (Cobbett and Goldsbrough, 2000).
The organic acids of root extracts form complexes with Cr compounds and increase their
availability for plant uptake (Bartlett and James, 1988). The presence of organic acids
influences the Cr uptake in roots (Srivastava et al., 1998). The channel of Cr transportation is
a mechanism which involves essential anions carriers such as sulfate (Cervantes et al., 2001).
Both forms of Cr(VI and III) enter the root cells by the symplast method where Cr(VI) is
decreased and stored in the cortex region (Shanker et al., 2005). Though Cr transportation is
very weak in the aerial parts, its movement and accumulation depend on its chemical structure
inside the tissue (James and Barlett, 1983). Root membranes of plants can be damaged by the
hexavalent form of chromium due to its high oxidation power. Moreover, some essential
elements such as Fe, K, Mg, Mn, P and Ca, are compressed by the Cr(VI) for cells uptake
because of their similarity in ionic forms (Gardea-Torresdey et al., 2005, Pandey and Sharma,
2003).
3.5) Application of CWs in Cr(VI) treatment
Table 3.4 presents previous experiments/applications of FWS CWs for Cr (VI and III)
removal. Different types of wastewaters such as metallurgic, industrial, tannery sewage etc.,
were treated. The majority of these experiments/applications used floating plants, as their
expanded root area enhances the growth of microorganisms. In FWS CWs emergent plants
can also accumulate the contaminants in their tissues and also can provide carbon the source
for degrading the bacteria (Dunbabin and Bowner, 1992). Furthermore, they favor suspended

Treatment of Industrial and Agro-Industrial Wastewater using Constructed Wetlands Mar-Yam Sultana
Chapter 3: Constructed Wetlands 67
solid settlement and oxygen transfer into the rhizosphere (Brix, 1994, 1997; Kadlec et al.,
2000). Sen and Bhattacharyya (1994), Maine et al. (2004) and Hadad et al. (2006), have stated
that metal concentrations were higher in roots than leaves of floating plants. Maine et al.
(2009), performed experiments with three phases of vegetation in free water surface wetlands.
They found that when Eichhornia crassipes was dominant in the vegetation, contaminants
remained in the macrophytic biomass, but when both E. crassipes and T. domingensis were
used, contaminants remained in the sediments.
Table 3.5 summarizes previous experiments/applications of HSF CWs treating Cr (VI and
III). The most commonly used plants were Phragmites australis and Typha latifolia. The
roots of Phragmites australis can grow horizontally and vertically and provide a substantial
surface area for the growth of microorganisms. Fibbi et al. (2012), found that Cr accumulated
in underground and aboveground tissues but most accumulated in roots. Although restricted
amounts of Cr pass into shoots and a higher amount of Cr accumulates in roots, the affinity of
Cr to bind to the root cell walls is the cause of shoot translocation (Pendias and Pendias,
2001). Lesage et al. (2007a), used Phragmites australis for the treatment of domestic
wastewater. They pointed out that the position of the plants in the wetland has a significant
effect on pollutant removal except for Cr and Zn metals. Vymazal et al. (2007) performed
experiments in HSF CWs with two macrophytes: Phragmites australis and Phalaris
arundinacea to treat municipal sewage. They found that a negligible amount of metals are
stored in the biomass of both plants. However, emergent macrophytes accumulate relatively
small amounts of Cr compounds to submerged or free-floating vegetation. They also found
that metal concentrations were higher in the roots than leaves. Calheiros et al., (2008b) also
observed that Cr accumulation occurred chiefly in the rhizomes of Phragmites australis and a
small translocation occurred to the shoots. The phytoextraction process can be effective if a
substantial amount of Cr is translocated by the root medium to the plant shoot (Zayed and
Terry, 2003). Plants that can assemble 1000 mg Cr/kg are considered as hyper accumulators
plants (Lasat, 2002).

Treatment of Industrial and Agro-Industrial Wastewater using Constructed Wetlands Mar-Yam Sultana
Chapter 3: Constructed Wetlands 68
Table 3.4: Free water surface constructed wetlands (FWS CW) used for Cr removal.
Reference CW area,
(m2)
Wastewater
type
HRT,
(days) Porous media
Inlet concentration
of Cr (mg/L)
Plants
Removal %
Baker et al.,
2012 720
Petroleum
coke - Oil sands - Chara spp (Algae) -
Di Luca et al.,
2011 2000 Industrial 7-12
Sediment (5
layers bentonite) 0.4 Typha domingensis 90
Hadad et al,
2010 2000
Sewage and
Industrial 7-12
Muddy
sediment 0.033 Typha domingensis 85
Khan et al.,
2009 4145.71 Industrial 1.7 Sediment 0.07-0.35
T. latifolia, S. cyperniu ,
C. aquatilis , P. australis, J.
articulatus,C. demersum, L. gibba L.,
E. cressipes, P. glabrum , A. plantago
aquatica, P. stratiotes
89
Maine et al.,
2009 2000 Tool factory 7-12 Sediment 0.018
E. crassipes 88
E. crassipes + T. domingensis 7
T. domingensis 30
Maine et al.,
2006 18 Industrial 7 Soil 0.022
E. crassipes, T. domingensis,
Pontederia cordata L. 86
Aguilar et al.,
2008 450 Tannery 2 Sediment 22-31 Typhs spp., Scirpus americanus 99
Maine et al.,
2007 2000 Tool factory - Sediment 0.014
E. crassipes 62
T. domingensis 58
Srisatit and
Sengsai, 2003 5
Chromium
solution 10 Soil -
Vetiveria zizanioides (Linn) 89.29
Vetiveria nemoralis 86.30

Treatment of Industrial and Agro-Industrial Wastewater using Constructed Wetlands Mar-Yam Sultana
Chapter 3: Constructed Wetlands 69
Table 3.5: Horizontal surface flow constructed wetlands (HSF CW) used for Cr removal.
Reference CW area,
(m2)
Wastewater
type
HRT,
(days)
Porous
media
Inlet
concentration of
Cr (mg/L)
Plants
Removal %
Arroyo et al. 2010 210 Domestic 10.5 - 5.64 Typha Latifolia, Iris pseudacorus,
Salix atrocinera 55
Dotro et al., 2012 4.5 Tannery 5, 2.4 Granitic
rock 1.1, 0.08-5.9 Typha Latifolia 50-95
Dotro et al., 2011a 0.31 Tannery 1 Pea gravel 5 Typha spp. 90-99
Fibbi et al., 2012 180 Textile 2.1 Gravel 0.0008-0.0158 Phragmites Australis 72
Lesage et al., 2007a 65 Domestic 6.7 Gravel 0.113 Phragmites Australis 87
Vymazal et al.,
2007 3520
Municipal
sewage - Soil 0.0005
Phragmites Australis and Phalaris
arumdinacea 92.8
Kelvin and Tole,
2011 1750 Domestic 11 Gravel 0.5 Macro-Hydroplants 60
Kucuk et al., 2003 378 Tannery 5-11 Gravel 0.2 Phragmites Australis 43-55
Dorman et al.,
2009 568L
Coal
combustion
waste
5 Quartz Sand 0.048 Ceriodaphnia dubia 69.28
Sultana et al.,
2014a
0.86
Synthetic
8, 4, 2, 1
Fine gravel
5, 2.5, 1, 0.5
Phragmites australis
100
Table 3.6: Vertical flow constructed wetland (VF CW) used for Cr removal
Reference CW area
(m2)
Wastewater
types HRT Porous media
Inlet
concentration of
Cr (mg/L)
Plants
Removal %
Mant et al., 2006 30 L tank Tannery 6h Gravel 10-20
Penisetum purpureum 78.1
Brachiaria decumbens 68.5
Phragmites Australis 56.7
Yadav et al., 2010 0.035 m2 Synthetic solution 6-48hrs Gravel 10, 15, 20 C. indica L. 98.3
Treatment of Industrial and Agro-Industrial Wastewater using Constructed Wetlands Mar-Yam Sultana
Chapter 3: Constructed Wetlands 70
The most important parameter to achieve high Cr removal efficiencies is the selection of the
optimal CW type. While all CW types present high removal efficiencies up to 100% (Tables
3.4-3.6), VF CWs have not often been applied for Cr removal (Mant et al., 2006; Yadav et
al., 2010) and only in laboratory-scale experiments under operating conditions that do not
correspond to real-life conditions (e.g., continuous recirculation and fill and draw operation).
Therefore, it is not presently possible to safely evaluate their Cr removal efficiency. On the
other hand, FWS and HSF CWs have been extensively used in laboratory-scale experiments
and full-scale applications (Vymazal, 2005; Maine et al., 2007; Khan 2009; Hadad et al.,
2010; Di Luca et al., 2011). These two types of CWs present similar Cr removal efficiencies
(7-99% for FWS and 50-100% for HSF) for similar feed Cr concentrations (0.014 to 31 mg/L
for FWS and 0.008 to 20 mg/L for HSF), while they operated with HRTs from 1 to 12 days.
Thus, both these CW types can be successfully used for Cr removal from wastewaters.
All researchers conclude that plant vegetation plays a significant role in Cr removal; however
it is not clear if different vegetation types affect CW efficiencies. The comparative study of
Cr removal by different types of constructed wetlands in Tables 3.4 to 3.7 reveals that
Phragmites and Typha are the two most commonly used plant species. CWs planted with
both Phragmites and Typha appear to achieve high Cr removal efficiencies (43 to 100% for
Phragmites and 85 to 99% for Typha), while both plants appear to operate successfully in a
wide range of feed Cr concentrations (0.005 to 20 mg/L for Phragmites and 0.033 to 31 mg/L
for Typha). CWs planted with C. indica (Yadav et al., 2010) and Scirpus (Aguilar et al.,
2008) also achieved high removal efficiencies (up to 99%), while they received high feed Cr
concentration (22 to 31 mg/L for Scirpus and 10 to 20 mg/L for C. indica). Furthermore,
Phragmites australis presents higher Cr accumulation rates than ten other plant taxa (Table
3.4) (Khan et al., 2009). Phragmites australis was found to be more tolerant to Cr and more
effective at Cr removal than Typha latifolia in CWs treating activated sludge (Stefanakis and
Tsihrintzis 2012a). On the other hand, Mant et al. (2006) report that Penisetum purpureum
and Brachiaria decumbens are more efficient at Cr removal than Phragmites australis. The
well-developed root system of the two former plants provides greater surface area for biofilm
development, chemical precipitation and metal binding. The four plant species mentioned
above appear to tolerate high feed Cr concentrations and affect positively Cr removal. While
a number of other plant species were also used in CWs treating Cr, they cannot be safely
evaluated as feed Cr concentrations in these experiments were low, ranging from 0.014 to 1
mg/L. Based on the above findings it seems that although vegetation plays a significant role
Treatment of Industrial and Agro-Industrial Wastewater using Constructed Wetlands Mar-Yam Sultana
Chapter 3: Constructed Wetlands 71
in Cr removal in CWs, the type of vegetation used is not a crucial parameter. Therefore,
vegetation should be selected based only on availability (i.e., indigenous plants should be
prefered) and cost.
The design of constructed wetlands can influence removal efficiency. Yadav et al. (2012),
concluded that Cr removal was enhanced when CW depth was increased, due to the CW's
increased effective area and the appearance of anaerobic conditions, which also enhance Cr
removal. In another study of Yadav et al. (2010), the authors refer that deeper CWs can
accumulate more Cr than swallower CWs.
Although HRT is a significant operational parameter of CWs, its effect on Cr removal has not
been fully investigated. Concerning VF CWs, only Yadav et al. (2010) examined the effect of
three different HRTs (12, 24 and 48 hr), concluding that increased HRT leads to increased Cr
removal. However, in their experiments CWs were operated under draw and fill mode, which
does not correspond to real operational conditions. Two studies discuss the effect of HRT on
HSF CWs (Kucuk et al., 2003; Sultana et al., 2014a). Although Kucuk et al. (2003) present
experimental results using different HRTs, their discussion is mainly focused on organic
matter and nutrient removal and less on Cr removal. On the other hand, Sultana et al. (2014a)
conducted a series of comparative experiments with five different HRTs (8, 4, 2, 1 and 0.5
days), where HRTs of 1 day were proved not to limit Cr removal.
While FWS and HSF CWs have been extensively used in Cr removal, VF and hybrid (VF
combined with HSF) CW systems are less studied (Tables 3.6 and 3.7). Mant et al. (2006),
performed experiments with tannery wastewater in a 30 L tank which was planted with three
macrophytes: Penisetum purpureum, Brachiaria decumbens and Phragmites australis. It was
found that Phragmites australis accumulated a significant amount of Cr in its leaves and
stems compared to the other two species. However, some toxicity effects of Cr have been
exhibited on this plant. Penisetum purpureum also accumulated a significant amount of Cr in
its leaves and stems.
Although a significant amount of research on CWs treating Cr wastewaters has been recorded
in the literature, several issues have not been fully covered:

Treatment of Industrial and Agro-Industrial Wastewater using Constructed Wetlands Mar-Yam Sultana
Chapter 3: Constructed Wetlands 72
1. Data on the effect of HRT on CW performance is limited and exists only for VF and
HSF CWs. Furthermore, the effect of HRT should be examined simultaneously with
different influent concentrations to assess maximum Cr loads that can be treated by
each CW.
2. Cr toxicity on common plant species used in CWs has not been examined. Therefore
maximum Cr influent concentrations cannot yet be defined.
3. Another key point that has not been fully investigated is the precise contribution of
microbial activity to Cr removal. While different microbial species have been
identified in CWs treating Cr, which all need an external carbon source, no
comparative studies examining the effect of different carbon sources and wastewater
types are available. For example, co-treatment of Cr with other types of wastewaters
could enhance or limit Cr removal.

Treatment of Industrial and Agro-Industrial Wastewater using Constructed Wetlands Mar-Yam Sultana
Chapter 3: Constructed Wetlands 73
Table 3.7: Treatment of chromium polluted wastewaters using hybrid constructed wetland systems
Reference CW area (m2) Wastewater
type
HRT Porous media Inlet
concentration of
Cr (mg/L)
Plants Removal
%
Kongroy et
al., 2012
CNU SSF-1500
FWS-2300
Municipal and
Industrial
Gravel and
soil
0.016 SSF-Phragmites australis, Typha orientalis,
Vetiveria zizanioides, Cyperus alternifolius,
Eleocharis dulcis
FWS- P. australis, T. orientalis, C. alternifolius,
Ludwigia adscendens and Myriophyllum
aquaticum
44
MPI FWS- 1020 0.039 Ipomoea aquatica, Eichhornia crassi, V.
zizanioides, T. orientalis, C. zlternifolius,
Nymphaea spp.
96
Soda et al.,
2012
Main CW- 520
Experimental CW-
25
Metallurgic Main CW- 3 hrs
Experimental
CW- 1.5 hrs
0.0108 Main CW- Acorus gramineus, Cyperus
alternifolius L., Iris pseudacorus, Lythrum
anceps, Myosotis scorpioides, Phyla nodiflora
L. and Zantedeschia aethiopica
Experimental CW- Acorus gramineus, Cyperus
alternifolius L.
12

Treatment of Industrial and Agro-Industrial Wastewater using Constructed Wetlands Mar-Yam Sultana
Chapter 3: Constructed Wetlands 74
3.6) Application of CWs in Agro-Industrial wastewaters Treatment
CWs are mainly used to treat domestic and municipal wastewaters but more recent
applications of CWs include treatment of other types of wastewater, such as industrial and
agricultural wastewaters, various runoff waters and landfill leachate (Kadlec and Wallace,
2008). Agro-industry includes post-harvest activities involved in the transformation,
preservation and preparation of agricultural produce for intermediary states or final
consumption. Agro-industrial wastewaters are usually characterized by their high organic
load and their quantity and quality variations over a year (Awady and Wahaab, 1999). In this
section, the main CW applications for agro-industrial wastewater, including dairy and animal
farm wastewater wastewaters. Furthermore, special discussion is made to olive mill
wastewater (OMW) due its toxicity from high phenol concentrations. CWs are also used for
other agro-industrial wastewater treatment, including coffee processing (Rossmann et al.,
2012), winery (Grismer et al., 2003; Masi et al., 2002), vinegar (Justin et al., 2009), fish
farms (Sindilariu et al., 2009; Vymazal, 2009), molasses production (Olguın et al., 2008) and
the sea food industry (Sohsalam et al., 2008).
3.6.1) Pre-treatment stages in treatment of Dairy Wastewaters
In most cases of dairy wastewater treatment by CWs, the pre-treatment stages aim mainly at
removing suspended solids. Therefore, in the majority of experiments/applications, the pre-
treatment stages included either simple settling basins (Browne and Jenssen, 2005; Gasiunas
et al., 2005a; Munoz et al., 2006; Newman et al., 2000) or a settling stage combined with
biological treatment, such as aerobic and anaerobic lagoons (Moreira et al., 2010; Shamir et
al., 2001), or oxidation ponds (Tanner et al., 1995) (Table 3.8).
3.6.2) CW types in treatment of Dairy Wastewaters
The type of CW seems to be crucial for dairy wastewater treatment. As shown in Table 3.8,
only four research groups have focused on dairy wastewater treatment using FWS CWs
(Dunne et al., 2005; Jamieson et al., 2007; Schaafsma et al., 2000; Shamir et al., 2001), as
these wastewaters have high pollutant loads and are therefore difficult to treat. As mentioned
previously, dairy wastewater is characterized by high concentrations of organic matter. Thus

Treatment of Industrial and Agro-Industrial Wastewater using Constructed Wetlands Mar-Yam Sultana
Chapter 3: Constructed Wetlands 75
a FWS CW cannot achieve efficient pollutant removal performance, as the high organic
matter concentration creates anoxic or anaerobic conditions in the water column and reduces
the amount of oxygen available for microbial organic matter oxidization. As shown in Table
3.8, when pollutant surface loads are low in FWS CWs (Newman et al., 2000; Shamir et al.,
2001), removal efficiencies are high for organic matter (91-98%), nitrogen (80%),
phosphorus (89-92%) and TSS (96-99%). According to Schaafsma et al. (2000), organic
matter and nutrient removal efficiencies are also significant, but in some cases, nitrate and
nitrite concentrations increase in the effluent. In most experiments/applications using VF
CWs, it was observed that these wetland systems were poor at phosphorus removal. Dunne et
al. (2005), report that their VF CW system did not show any significant reduction in pollutant
concentration between the wetland’s inlet and outlet, although BOD reduction was
significant.
HSF CW systems, however, appear to be more efficient than the other two systems when
treating dairy wastewater, and 17 experiments/applications employing HSF CWs for diary
wastewater treatment have been reported. HSF CWs are far more efficient bio-reactors than
FWS CWs, as the removal efficiencies of the former are in the range of 28-99% for COD, 21-
99% for nitrogen, 2-98% for phosphorus, and 45-95% for TSS. It should be mentioned that
these removal efficiencies were achieved with pollutant surface loads 10 times higher than
those applied in FWS CWs. The most efficient CW system for dairy wastewater treatment
appears to be a hybrid system of both VF and HSF stages. Hybrid systems have been tested
by three research groups (Browne and Jenssen, 2005; Lee et al., 2010; Rousseau et al., 2004),
and each demonstrated high removal efficiencies for all pollutants (83-96% for COD, 65-
92% for nitrogen, 52-99% for phosphorus and 83-99% for TSS), even with higher pollutant
surface loads than those applied to HSF systems.

Treatment of Industrial and Agro-Industrial Wastewater using Constructed Wetlands Mar-Yam Sultana
Chapter 3: Constructed Wetlands 76
Table 3.8: Studies of dairy wastewater treatment by CWs.
Reference CW Surface Area
(m2)
Plant Species Pre-treatment Surface Load (gr/m2/day) Removed Surface Load (gr/m2/day)
C TKN TP TSS C TKN TP TSS
FWS
Dunne et al., 2005 4265 Carex riparia, Typha latifolia, Phragmites australis, Sparganium erectum, Glyceria fluitans,
Iris pseudacorus, Phalaris arundinaceae, Alisma
plantago-aquatica
Three-chambered tank
6.84 _ 0.05 2.55 6.22 _ 0.04 2.52
Jamieson et al.,
2007
100 Typha latifolia, Lemna spp. Storage tank 6.5 0.8 0.12 4.8 6.37 0.64 0.11 4.61
Schaafsma et al.,
2000
500 Typha latifolia, Scripus tabernaemontani, Litaneutria minor
Settling basin - - - - - - - -
Shamir et al.,
2001
630 Typha domingensis, Scirpus validus, Phragmites
australis
Solid separators,
anaerobic lagoons, aerobic ponds
20.36 23.2 _ 67.36 0.61 6.0 _ 24.2
Hybrid
Browne and
Jenssen, 2005
1990 Phragmites australis, Senecio sylvaticus, Urtica dioica, Typha latifolia, Sparganium erectum,
Butomus umbellatus, Cucurbita maxima
Settling tanks 1.28 0.74 0.10 1.96 1.2 0.68 0.09 1.92
Lee et al., 2010 1.87 Sotalia fluviatilis _ 173.5 _ 2 22.3 156 _ 1.6 20.1
Rousseau et al.,
2004
80 Phragmites australis _ 50-1500 50-
1500
1.5-40 20-400 45-
1350
32.5-
975
0.8-21 18.8-376
Farnet et al., 2009 160 Phragmites australis - _ _ _ _ - -
Gasiunas et al.,
2005
50-1900 Phragmites australis Septic tank, settling
in ponds
5.7-8.3 0.56-
1.97
0.17-
1.71
_ 4.5-6.6 0.2-0.8 0.12-
1.2
_
Ghosh and
Gopal, 2010
1.63 Typha angustata Secondary treatment in storage tank
8.6-34.5 1.3-4.9 OP: 0.3-1.1
0.2-0.7 5.2-20.7
0.78-2.94
OP: 0.09-
0.33
0.16-0.56
Ibekwe et al.,
2003
600 Phragmites communis, Scirpus validus Storage lagoons _ _ _ _ - - - -
Kern et al., 2000 Two beds (15 m2
and 10 m2)
Phragmites australis, Stuckenia pectinata, Carex
acutiformis, Glyceria maxima, Typha latifolia
Settling tank 26.8-45.3 _ _ _ 24.1-
40.8
_ _ _
Mantovi et al.,
2003
72 Phragmites australis Imhoff tank 110.1 5.84 1.15 62.3 101.3 2.83 0.70 56.6
Moir et al., 2005 20 - Batch reactor (SBR) - - - - - - - -
Moreira et al.,
2010
398 Lemna sp., Pontederia cordata Anaerobic/Facultative lagoon, Aerobic
lagoon
29.4 3.4 2 8.4 11.2 1.45 0.5 4.9
Munoz et al.,
2006
892 Sotalia fluviatilis Settling tank 68.5 _ 0.6 16 _ _ _ _
* data not sufficient to calculate pollutant loads

Treatment of Industrial and Agro-Industrial Wastewater using Constructed Wetlands Mar-Yam Sultana
Chapter 3: Constructed Wetlands 77
Table 3.8: continued
Reference CW Surface
Area (m2)
Plant Species Pre-treatment Surface Load (gr/m2/day) Removed Surface Load (gr/m2/day)
C TKN TP TSS C TKN TP TSS
HSF
Farnet et al.,
2009
160 Phragmites australis - _ _ _ _ - -
Gasiunas et al.,
2005b
50-1900 Phragmites australis Septic tank, settling in ponds
5.7-8.3 0.56-1.97
0.17-1.71
_ 4.5-6.6 0.2-0.8 0.12-1.2
_
Ghosh and
Gopal, 2010
1.63 Typha angustata Secondary treatment in storage tank
8.6-34.5 1.3-4.9 OP: 0.3-1.1
0.2-0.7 5.2-20.7
0.78-2.94
OP: 0.09-
0.33
0.16-0.56
Ibekwe et al.,
2003
600 Phragmites communis, Scirpus validus Storage lagoons _ _ _ _ - - - -
Kern et al., 2000 Two beds (15 m2
and 10 m2)
Phragmites australis, Stuckenia pectinata, Carex
acutiformis, Glyceria maxima, Typha latifolia
Settling tank 26.8-45.3 _ _ _ 24.1-
40.8
_ _ _
Mantovi et al.,
2003
72 Phragmites australis Imhoff tank 110.1 5.84 1.15 62.3 101.3 2.83 0.70 56.6
Moir et al., 2005 20 - Batch reactor (SBR) - - - - - - - -
Moreira et al.,
2010
398 Lemna sp., Pontederia cordata Anaerobic/Facultati
ve lagoon, Aerobic lagoon
29.4 3.4 2 8.4 11.2 1.45 0.5 4.9
Munoz et al.,
2006
892 Sotalia fluviatilis Settling tank 68.5 _ 0.6 16 _ _ _ _
Mustafa et al.,
2009
7600 Typha latifolia, Carex riparia, Glyceria maxima,
Carex riparia, Glyceria maxima, Phalaris
arundinacea, Carex riparia
_ 1.2 _ _ 0.21 1.14 _ _ 0.2
Newman and
Clausen, 1997
138.6 Typha angustifolia, Phragmites australis, Suillus
pungens, Typha latifolia, Lythrum salicaria,
Eleocharis obtusa, Litaneutria minor
Bulk tank 52.6 1.9 0.514 14.8 14.7 0.5 0.14 6.7
Newman et al.,
2000
138.6 (each cell) Typha angustifolia, Phragmites australis, Suillus
pungens
Settling basin 51.3 1.96 0.5 24.6 38.9 0.55 0.23 22.1
Smith et al., 2005 100 Typha latifolia Heated storage tank 17 _ _ _ 16.7 - - -
Tanner et al.,
1995
19 Scripus validus Oxidation pond 0.9-4.1 0.6-2.7 0.2-0.8 1.9-8.5 0.76-
3.5
0.4-1.8 0.12-
0.48
1.5-6.5

Treatment of Industrial and Agro-Industrial Wastewater using Constructed Wetlands Mar-Yam Sultana
Chapter 3: Constructed Wetlands 78
3.6.3) Vegetation for Dairy Wastewater treatment in CW systems
One of the main issues in CW treatment systems is to identify the role of the plants in
pollutant removal and to define their toxicity boundaries. In dairy wastewater treatment,
where organic loads are very high, a variety of different plant species have been used (Table
3.8). As reported by Browne and Jenssen (2005) Phragmites australis, Scirpus sylvaticus and
Urtica dioica were able to grow in CWs treating dairy wastewater and did not exhibit any
toxic effect. The exact contribution of plants in nutrient removal is a controversial issue as
almost all related studies give different removal efficiencies. Gottschall et al. (2007) report
that nutrient removal due to plant uptake was significantly lower in their study compared to
previous studies (Comin et al., 1997; Greenway and Woolley, 2000), which reported that
plant uptake is responsible for 27-66% of nitrogen removal and 47-65% of phosphorus
removal. In addition, Newman et al. (2000) report that only 3% of nitrogen removal could be
attributed to plant uptake. Mantovi et al. (2003) also attribute most nutrient removal to
biofilm biochemical oxidation and plant uptake. Tanner et al. (1995) reported that planted
wetlands showed greater removal efficiencies of N and P from dairy farm wastewaters than
unplanted wetlands. They recorded higher TP removal in the summer months due to higher
plant biomass growth and temperatures. The unplanted wetland proved to be less efficient at
removing both N and P with higher loading rates. Percentage removal of NH4+-N increased
with retention time in the planted HSF CW, whereas the unplanted wetland showed lower
performance. Plant rhizosphere aeration may stimulate aerobic decomposition processes by
increasing nitrification and subsequent gaseous losses of N through denitrification, (Hansen
and Anderson, 1981; Reddy et al., 1989) and by decreasing the relative levels of dissimilatory
nitrate reduction to ammonium (Tiedje, 1988).
Dipu et al. (2011) examined the effect of different plant species (Typha sp., Eichhornia sp.,
Salvinia sp., Pistia sp., Azolla sp. and Lemna sp.) in CW removal efficiency. Generally, the
plant vegetation appeared to neutralize pH from the initial alkaline values recorded in diary
wastewaters. Concerning organic matter removal, Dipu et al. (2011) found that Azolla sp. and
Eichhornia sp.-based CWs (83.07%) were more efficient at pollutant removal, followed by
Typha sp.-based CWs (80%), however these differences were insignificant. Ghosh and Gopal
(2010) examined plant tolerance to dairy wastewater and found that young Typha plants
yellowed when wastewater with high EC values was applied to the CWs. Ghosh and Gopal
(2010) also mentioned that plant density and height were maximum near the CW’s inlet and

Treatment of Industrial and Agro-Industrial Wastewater using Constructed Wetlands Mar-Yam Sultana
Chapter 3: Constructed Wetlands 79
attributed this to the higher nutrient concentrations, which could promote plant growth.
Ghosh and Gopal (2010) found that at 4 days HRT, plant growth was higher and pollutant
removal efficiencies were also high. According to Ibekwe et al., (2003) treated dairy
wastewater can be recycled and used for irrigation. The authors observed the existence of a
diverse bacterial community (especially Nitrosospira sp.) that oxidizes ammonia and which
could also be involved in the nitrification process in the wetlands and influence the final
quality of effluent water.
Munoz et al. (2006) suggest that artificial aeration is needed to enhance removal efficiency
and pore volumes. Schaafsma et al. (2000) propose that increasing plant density and
wastewater recirculation will promote denitrification.
3.6.4) Pre-treatment stages in treatment of Animal Farm Wastewater
Similar to dairy wastewater treatment, most of the experiments/applications on animal farm
wastewater treatment using CWs contained pre-treatment stages mainly to remove suspended
solids. Suspended solid removal is essential before the wastewaters enter the CW stage,
because high suspended solid concentrations can cause clogging of the porous media.
Additionally, their reduction also reduces the organic load (Table 3.9).
3.6.5) CW types in treatment of Animal Farm Wastewater
Experiments/applications on animal farm wastewater treatment have tested all three CW
types (Table 3.9). When pollutant surface loads were low (0.95-1.62 and 0.33-0.34 gr/m2 day
for TKN and TP, respectively) in FWS CWs (Gottschall et al., 2007; Hunt et al., 2003; Stone
et al., 2004; Yeh et al., 2009) removal efficiencies for TKN and TP were 35.8-46.7 and 8.8-
23.5% (Table 3.9). Gottschall et al. (2007) showed that TKN removal was lower than NH4+
removal. The wetland was NH4+-dominated and showed greater uptake of NH4
+ than NO3
-.
The FWS CW cells received various surface loads of COD, TN and TSS, from 8.13-87.1
gr/m2 day, 0.4-3.5 gr/m
2 day and 1299-35109 gr/m
2 day, and the removal efficiencies
recorded were 36.7-48.5%, 30-47.8% and 26.3-49.3%, respectively (Hunt et al., 2006). HSF
and VF CWs appear to be more efficient at treating animal farm wastewater as their pollutant
removal efficiencies were higher than those of FWS CWs (Table 3.9).

Treatment of Industrial and Agro-Industrial Wastewater using Constructed Wetlands Mar-Yam Sultana
Chapter 3: Constructed Wetlands 80
Table 3.9: Studies of animal farms wastewater treatment by CWs.
Reference CW area
(m2) Plant Species Pre-treatment
Surface Load (gr/m2/day) Removed Surface Load (gr/m2/day)
C TKN TP TSS C TKN TP TSS
FWS
Gottschall et al.,
2007 327 Typha latifolia, Typha angustifolia Facultative pond _
0.95-
1.62
0.33-
0.34 _ _
0.38-
0.65 0.05 _
Hunt et al., 2003 120.6 Juncus effusus, Scirpus tabernaemontani, Solanum americanum, Typha latifolia, Typha angustifolia
Anaerobic lagoon 2.74 3.5 _ _ _ _ _ _
Hunt et al., 2006 440 Typha latifolia, Schoenoplectus americanus
Two-stage anaerobic
lagoon system, storage tank
8.13-87.1 0.4-3.5 _ 3425-
35109
3.3-
34.5 0.2-1.6 _ 1370-14044
Hunt et al., 2009 241.2
Scirpus tabernaemontani, Schoenoplectus americanus,
Scirpus cyperinus, Juncus effusus, Typha latifolia,
Solanum americanum
Anaerobic lagoon 10.7-12 3.7-4.4 1-1.6 11.5-18.8
6.4-7.2 2.9-3.5 0.3-0.5 10.6-17.3
Kantawanichkul
and Somprasert,
2005
0.5 Cacomantis flabelliformis Storage tank 51.7 22.5 1.84 14 31.0 15.8 1.1 13.3
Poach et al., 2007 220 Typha latifolia, Schoenoplectus americanus Lagoon, storage
tank 7.14 1.23 1.1 24.2 4.2 0.7 0.32 15.0
Stone et al., 2004 440 Typha latifolia, Schoenoplectus americanus _ _ 2.3 1.2 _ _ 0.9 0.09 _
Trias et al., 2004 4000 _ Concrete storage,
anaerobic lagoon
1709-
1775
1068-
1533 _
1947-
2270
1542-
1633
982-
1410 _ 1900-2200
Yeh et al., 2009 440 Typha latifolia, Schoenoplectus americanus Lagoon, storage
tank 1.9-:6.1 0.7-4.0 0.8-1.6 4.4-8.2 0.9-2.7 0.3-1.8
0.16-
0.32 1.8-3.3
Zhao et al., 2004 0.09 Phragmites australis Diluted feed tank 259.4 _ OP:
12.7 949.2 192 _ OP: 6.5 132
Hybrid
Poach et al., 2003 120 Schoenoplectus spp., Typha spp., Sparganium spp.
Anaerobic lagoon,
holding tank, nitrification unit
_ 1.4-1.5 _ _ _ 0.98-
1.05 _ _

Treatment of Industrial and Agro-Industrial Wastewater using Constructed Wetlands Mar-Yam Sultana
Chapter 3: Constructed Wetlands 81
Table 3.9: Continued
Reference CW area
(m2) Plant Species Pre-treatment
Surface load (gr/m2/day) Removed surface load (gr/m2/day)
C TKN TP TSS C TKN TP TSS
HSF
Hathaway et al.
(2010) 4500
Juncus sp., Nuphar lutea, Pontederia cordata, Typha
sp., Scirpus tabernaemontani _ _ 0.007 0.004 _ - 0.005 0.001 _
Kadlec et al. (2005)
18 Scirpus tabernaemontani Settlement tank 9.7-47.3 0.7-4.54 _ _
4.85-
23.6
0.42-2.7
_ _
Knight et al. (2000)
6000 Typha spp., Scirpus spp., Phragmites australis Settling basin,
anaerobic lagoon 0.17-0.26
0.15-0.68
_ 0.21-1.85
0.12-
0.18
0.09-0.48 0.07-0.93
Lee et al., 2004 31.1 Eichhornia crassipes
Solid separation, anaerobic digestion
and aerobic oxidation
39-137
6.9- 26.2
1.5-4.7 30.3-
62.4
31.2-
110
1.03-3.9
0.7-2.1 29.4-60.5
Meers et al., 2005 0.25 Phragmites australis Sludge reactor 3.2 0.104 0.265 _ 2.24 0.08 0.21 _
Meers et al., 2008 4500
Phragmites australis, Typha latifolia, Carex
pseudocyperus, Carex acutiformis, Scirpus lacustris, Scirpus maritimus, Filipendula ulmaria, Iris
pseudacorus, Mentha aquatica, Acorus calamus,
Sparganium erectum, Alisma plantago-aquatica, Lythrum salicaria
Centrifugation,
composting, sludge reactor
0.14 0.03 0.005 _ 0.13 0.03 0.005 _
Zhao et al., 2011 0.9 Typha latifolia, Phragmites australis Secondary treated 4.2 _ 0.2016 6.1 _ _ _ _
VF
Aktas et al., 2001 n.a. Phragmites australis _ 36-474 46-79 8-174
73- 1836
21.6-
284
20.7-35.6 6.4-139
_
Babatunde and Zhao, 2010
575 Phragmites australis _ 575 _ 35 491 _ 32.8

Treatment of Industrial and Agro-Industrial Wastewater using Constructed Wetlands Mar-Yam Sultana
Chapter 3: Constructed Wetlands 82
Table 3.9 shows that removal efficiencies of organic matter and nutrients are greater in HSF
than FWS CWs. Specifically, removal efficiencies are 78-90% for COD, 22-90% for BOD,
71-98% for TP, 22-90% for TN, and 22-51% for TSS. The applied surface loads for these
pollutants were 3.2-47.3 gr/m2
day, 0.17-0.26 gr/m2
day, 0.104 gr/m2
day, 0.15-0.68 gr/m2
day, and 0.21-1.85 gr/m2
day, respectively. According to Lee et al. (2004), removal
efficiencies are higher when surface loads are lower. Meers et al. (2005), suggested that by
increasing the HRT and the plant root depth zone in HSF CWs, removal efficiencies would
increase. Results from other studies indicate that HSF CWs can effectively remove pollutants
from various animal wastewaters (Hathaway et al., 2010; Kadlec et al., 2005; Knight et al.,
2000). Babatunde and Zhao (2010), used VF CWs with tidal flow strategy, which can
promote oxygen supply. When treating wastewaters containing high organic loads, where the
oxygen supply from the plant root zone is not sufficient, tidal flow VF CWs increase DO
concentration in the biofilm and thus enhance organic matter degradation.
3.6.6) Vegetation for Animal Farm Wastewater in CW systems
A variety of plants were used in CWs treating animal farm wastewater (Table 3.9). The
selection of plant species was mainly based on the availability of the plant in the area and not
on other criteria. While planted CWs showed higher removal efficiencies, no significant
variations in removal efficiencies were recorder between the different plant species.
The experimental data of Hunt et al. (2006) showed that the increase of nitrogen loading
caused the increase of denitrification enzyme activity (DEA), thus resulting in increased
nitrogen removal efficiency. Another study of Hunt et al., (2009) demonstrated that, when
surface load was high, pollutant removal efficiencies increased in the treatment of swine
wastewaters. Hunt et al., (2009) also found that a layer, which is formed above the soil layer
by a combination of decayed plant material, heterotrophic bacteria and the suspended solids
of the swine wastewater, is characterized by very high DEA. A study by Stone et al. (2004)
revealed that FWS CWs can significantly treat TN but not TP. Poach et al. (2007) observed
that organic matter, TSS and TP removal efficiencies were not influenced by the presence of
aerobic conditions in the FWS CWs. However, aerobic conditions accelerated the
nitrification process thus increasing the removal efficiency of TN. Concerning CW soil,
Babatunde and Zhao (2010) used alum sludge, which proved to enhance treatment efficiency,
specifically phosphorus removal.

Treatment of Industrial and Agro-Industrial Wastewater using Constructed Wetlands Mar-Yam Sultana
Chapter 3: Constructed Wetlands 83
3.6.7) Pre-treatment stages in treatment of OMW wastewater
Pre-treatment stages for OMW involve advanced treatment methods including coagulation
(Bubba et al., 2004), electrochemical oxidation (Grafias et al., 2010), and biological trickling
filters (Herouvim et al., 2011) (Table 3.10). The only two experiments/applications on OMW
treatment using CWs lacking a pre-treatment stage (Kapellakis et al., 2009; Yalcuk et al.,
2010) diluted the OMW with tap water before introducing it into the CW system. Although
CWs have been used to treat a variety of wastewaters, only few attempts to treat OMW have
been published (Table 3.10). The main characteristic of all these experiments/applications is
that a pre-treatment stage is imperative to reduce the high organic and phenol loads which
can be toxic to CW vegetation.
3.6.8) CW types in treatment of OMW wastewater
OMW treatment by CWs appears to be sufficient when a HSF system, a VF system, or a
combination of them is used (Table 3.10). The only attempt to treat OMW using FWS
(Kapellakis et al., 2009) showed a significant removal efficiency for organic matter (86%),
however the organic surface load applied was the lowest reported in the literature (5-15 gr/m2
day). HSF CWs appear to be more efficient at treating OMW (Bubba et al., 2004), as removal
efficiencies were 69% for COD, 12% for nitrogen, 55% for phosphorus, 50% for TSS, and
79% for phenols. It should be mentioned that these removal efficiencies were achieved with
pollutant surface loads higher than those applied to FWS systems, but lower than those
applied to VF systems. The most efficient CW system for OMW treatment appears to be the
VF system (Bubba et al., 2004; Grafias et al., 2010; Herouvim et al., 2011; Yalcuk et al.,
2010). VF CWs show high removal efficiencies for all pollutants (72-86% for COD, 75% for
nitrogen, 88-95% for phosphorus, 79% for phenols), while the pollutant surface loads applied
were among the highest reported for all industrial and agro-industrial wastewaters. It appears
from the literature that VF CWs are more efficient at organic matter and phenol removal, but
attention should be paid to the existence of SS, which can cause porous media to clog and
thus damage the CW system. Yalcuk et al. (2010), attributes VF CW treatment ability to
more efficient oxygen transport in the porous media. The higher oxygen concentration in VF
CWs leads to increased organic matter oxidation and ammonia nitrification.

Treatment of Industrial and Agro-Industrial Wastewater using Constructed Wetlands Mar-Yam Sultana
Chapter 3: Constructed Wetlands 84
Table 3.10: Studies of olive mill wastewater treatment by CWs.
Reference CW
CW
area
(m2)
Plant Species Pre-treatment
Surface load (gr/m2/day) Removed surface load (gr/m
2/day)
C TKN TP TSS Phenols C TKN TP TSS Phenols
Aktas et
al., 2001 HSF 0.85
Phragmites
australis Coagulation 77.03 1.08 0.42 9.32 16.85 53.1 0.13 0.23 4.6 13.2
Bubba et
al., 2004 VF 0.24 -
Electrochemical
oxidation 15 _ _ _ _ 12.9 _ _ _ _
Grafias et
al., 2010 VF 0.1256
Typha
latifolia C.
alternatifolius
Diluted with tap
water 114.71 _
OP:
2.74 _ _ 82.5 _
OP:
2.6 _ _
Herouvim
et al., 2011 VF
Phragmites
australis Biological filter 6589 175 20.0 - 997 4810 131 17.6 - 748
Kapellakis
et al., 2012 FWS
Phragmites
australis Dilution 5-15 - - - -
4.3-
12.9 - - - -

Treatment of Industrial and Agro-Industrial Wastewater using Constructed Wetlands Mar-Yam Sultana
Chapter 3: Constructed Wetlands 85
As agro-industrial wastewaters have common characteristics (i.e., high organic loads, low pH
values, toxic effects) the CWs treating them present the same problems. Thus, general
suggestions can be made on the design and operation of CWs treating agro-industrial
wastewater. The following suggestions concern issues such as the pre-treatment stage, chosen
vegetation, porous media, and CW plain view, and are made based on the previous discussion
and the experimental results of published research.
Regarding the effect of hydraulic loading rates on CW performance, Ghosh and Gopal (2010)
state that it is negatively correlated with organic matter and nitrogen. The effect of hydraulic
load was significant as it could increase threefold the effluent concentration of organic matter
and nitrogen, when it was tripled. Kantawanichkul and Somprasert (2005) also found that
hydraulic load negatively affects nitrogen removal, due to DO decrease. Temperature usually
affects CWs performance, as the main pollutant mechanism of biological degradation, is
temperature dependant. Lee et al. (2010), who examined organic matter and TSS temporal
variations, found that temperature did not significantly affect their removal. This was also
observed by Akratos and Tsihrintzis (2007), who state that organic matter degradation is not
affected by temperature, as aerobic and anaerobic bacteria responsible for organic matter
degradation can function even at low temperatures (50C). Contrary to these observations,
Mustafa et al., (2009) and Newman et al. (2000), report that nitrogen and phosphorus removal
has a strong dependence on temperature. Akratos and Tsihrintzis (2007), who also reported a
strong correlation between nitrogen removal and temperature, claim that this phenomenon
could be attributed to plant uptake and to the fact that nitrified bacteria increase their
performance in temperatures above 150C.
The majority of the experiments/applications presented in this discussion either included a
pre-treatment stage or used diluted wastewater in order to eliminate toxic effects on CW
vegetation. From the published research it is deduced that CWs were used mainly as
polishing treatment stages for agro-industrial wastewater treatment. Bearing in mind that the
main advantage of CWs is their low operational cost, they should be coupled with other low-
cost treatment technologies (e.g., biological trickling filters, coagulation-floculation).
Biological trickling filters have been successfully used in combination with CWs for OMW
treatment (Herouvim et al., 2011; Michailides et al., 2011). The necessity for a pre-treatment
stage is apparent as effluent pollutant concentrations remain above EU recommended limits
(Table 3.11), thus prohibiting its direct disposal or use for irrigation. Effluent concentrations

Treatment of Industrial and Agro-Industrial Wastewater using Constructed Wetlands Mar-Yam Sultana
Chapter 3: Constructed Wetlands 86
below EU limits were reported only in cases where influent concentrations were very low
(Gasiunas et al., 2005; Ghosh and Gopal, 2010; Hunt et al., 2009; Jamieson et al., 2007; Kern
et al., 2000; Mantovi et al., 2003; Mustafa et al., 2009; Schaafsma et al., 2000). This
treatment inefficiency could be overcome if CWs were coupled with advanced pre-treatment
stages, which would not only remove SS but would also reduce organic matter and other
pollutant loads. A variety of low cost physicochemical and biological treatment methods have
been successfully tested in agro-industrial wastewater treatment, so the combination of one of
these methods with CWs could be an integrated and viable solution for agro-industrial
wastewater treatment.
Concerning vegetation in CW systems treating agro-industrial wastewater, although
numerous plant species have been tested, no specific species has been proved to be superior
over the others for pollutant removal. The main concern is to select a species resistant to the
toxic wastewaters involved and which is indigenous to the geographical area. Application of
different species indicate that the most tolerant plant species is Phragmites sp. (the common
reed), as it appears resistant to the toxic effects of diary, animal farm and olive mill
wastewaters and demonstrates high pollution removal efficiencies. Furthermore, it can be
found free-growing in most areas. Another issue concerning vegetation is the density of the
initial plants sown. Research results show that increased plant density increases pollutant
removal in the treatment of agro-industrial wastewaters. Initially dense vegetation could also
minimize the adjustment period and possible toxic effects. Therefore, in CWs treating agro-
industrial wastewater, the initial planting density should increase from 4 plants/m2
(Akratos
and Tsihrintzis, 2007) to 6 or 8 plants/m2 depending on the toxicity of the wastewater
concerned. As the plants themselves are responsible for only a small percentage of nutrient
removal (around 3%) (Gottschall et al., 2007; Newman et al., 2000), there is no need for their
periodic removal. On the contrary, this action would cause a decrease in pollutant removal
efficiency, as the oxygen levels in the CW would decrease. The CW should only be replanted
when the initial vegetation turns yellow and dies. Removal of dead plants avoids increasing
nutrient concentrations in the CW caused by the deposition of decaying plant biomass.
During the operation of many CWs treating agro-industrial wastewater, plant density was
recorded to be higher near the CW inlet. This is attributed to higher nutrient concentrations at
and around this point. This phenomenon confirms that horizontal flow CWs (FWS and HSF)
function as plug-flow reactors and therefore the biochemical processes occurring are more
intense near the inlet. This phenomenon could be exploited to increase CW efficiency in two

Treatment of Industrial and Agro-Industrial Wastewater using Constructed Wetlands Mar-Yam Sultana
Chapter 3: Constructed Wetlands 87
ways. The first is to change the design of the CW plain view from the common rectangular
shape to trapezoidal. This change would increase the CW area near the inlet where nutrient
availability is higher, plant density is higher and biochemical processes are more intense.
This trapezoidal design was tested by Kotti et al. (2010), who used FWS CWs for municipal
wastewater treatment and found that the trapezoidal CW was c. 8% more efficient at pollutant
removal than the rectangular CW. The second way is to use multiple inlet points along the
units. In this way nutrient availability increases along the length of CW, therefore increasing
both plant density and pollutant removal. This scenario was tested by Stefanakis et al. (2011),
who used three different inlet points and two different schemes (33:33:33 and 60:25:15).
Their results showed that a gradual wastewater inflow from multiple inlet points (60:25:15)
increased pollutant removal efficiencies.
Another CW design issue is the origin of the soil (FWS) or porous media (HSF and VF) used
in the treatment of agro-industrial wastewaters. Most studies have not examined thoroughly
the effect of CW substrate; however one attempt was made to use zeolite as the substrate
(Stefanakis and Tsihrintzis, 2012a). Zeolite, which is a natural absorbent, has also been used
as a substrate of post-treatment filters (Stefanakis and Tsihrintzis, 2012a; b) that increase
organic matter and ammonia removal. Other substrate materials having been tested include
bauxite, flying ash, river gravel, and quarry gravel (Akratos and Tsihrintzis, 2007; Arias et
al., 2001; Drizo et al., 1999; Stefanakis and Tsihrintzis, 2012a; b). From the literature it can
be concluded that substrate origin and chemical composition is critical, as minerals with
reactive Fe and Al or calcareous materials, which promote Ca phosphate precipitation are
rather efficient at phosphorus removal, and materials with high cation-exchange ability will
promote ammonium removal. The major problem in CW application is porous media
clogging, especially when treating wastewaters containing high TSS concentrations, such as
agro-industrial wastewaters. Future research should focus on testing materials that would
increase CW porosity and thus limit the clogging effect. These materials could include the
plastic materials which are already used in biological trickling filters (Michailides et al.,
2011), where biofilm density is higher than in CWs.
Finally the selection of the optimal CW type is a crucial issue for agro-industrial wastewater
treatment. From the previous discussion it appears that the use of subsurface flow CWs (HSF
and VF) is preferable for such heavily polluted wastewaters, since these systems are more
efficient bioreactors. Thus, the most effective treatment systems include both HSF and VF

Treatment of Industrial and Agro-Industrial Wastewater using Constructed Wetlands Mar-Yam Sultana
Chapter 3: Constructed Wetlands 88
treatment stages. Although dissolved oxygen concentration levels in FWS CWs are higher
than those in HSF and VF systems, its use in treating wastewaters with high pollutant loads is
not common, as it requires higher HRTs than HSF and VF CWs. This problem was overcome
by Stefanakis and Tsihrintzis (2009) who combined FWS and HSF only by raising the water
level in a HSF system. This new CW type achieved similar removal rates to the HSF system
despite receiving 15-20% increased pollutant loads.

Treatment of Industrial and Agro-Industrial Wastewater using Constructed Wetlands Mar-Yam Sultana
Chapter 3: Constructed Wetlands 89
Table 3.11: Pollutant influent and effluent concentrations compared with EU standards (EU Directive 1991/271/EEC).
Influent concentration (mg/L) Effluent concentration (mg/L)
Reference
N-
NH4+
N-
NO3-
N-
NH4+
N-
NO3-
COD TKN TP COD TKN TP
EU standards 120 TN:
10 2
Dairy
Jamieson et al., 2007 1747 237 188 3.7 37 34 19 14 0.6 17
Schaafsma et al., 2000 1900 164 72 5.5 53 53 3.3 32 9.9 2.7
Shamir et al., 2001 285 296 196 <2 - 277 247 128 <2 -
Ghosh and Gopal, 150 20 40 4.5 4 15 3.2 0.2 0.14 2.2 2010
Kern et al., 2000 682 97 74 0.6 10.4 89 63 25 32 4.7
Mantovi et al., 2003 1219 65 22 0.5 13 98 33 25 0.5 5
Moir et al., 2005 2000 - 0.3 - 5.3 210 - 0.1 2.3 6.4
Moreira et al., 2010 254 29 18 - 17 158 17 11 - 13
Mustafa et al., 2009 1500 - 40 3.4 - 75 - 0.4 1 -
Newman et al., 2000 2700 102 7.7 0.3 26 611 74 52 0.1 14
Tanner et al., 1995 - 38 - - 11 - 23 - - 7.5
Animal farm
Hunt et al., 2006 796 171 139 0.6 - 471 87 66 0.6 -
Kantawanichkul and 1034 - 448 - - 310 - 134 - - Somprasert, 2005
Poach et al., 2007 445 66 - - 71 280 30 - - 65
Stone et al., 2004 - 116 86 - 56 - 70 53 - 48
Trias et al., 2004 3220 1333 1072 - - 2200 333 313 - -
Zhao et al., 2004 2500 - 90 2 40 625 - 60 - 19
Hathaway et al., 2010 - 20-120 - - 20-50 - 5-15 - - 10-30
Kadlec et al., 2005 2240 135 118 0 - 658 34 14 7.5 -
Knight et al., 2000 - 907 366 - - - 248 221 - -
Lee et al., 2004 1160 200 185 3.7 40 190 156 144 1.7 21
Meers et al., 2005 3167 104 4.4 101 265 950 26 0.6 9.3 53
Meers et al., 2008 1700 360 - - 58 115 7.8 - - 0.8
OMW
Bubba et al., 2004 129100 90 - - - 95100 560 - - -
Herouvim et al., 2011 14000 506 123 - 95 3500 99 36 - 12
Yalcuk et al., 2010 2880 - 0.9 - 68 750 - 0.5 - 3.5

Treatment of Industrial and Agro-Industrial Wastewater using Constructed Wetlands Mar-Yam Sultana
Chapter 4: Materials and Methods
CHAPTER 4: MATERIALS AND METHODS
4.1) First Experimental Period ............................................................................. 90
4.1.1) Description of pilot-scale CW unit.................................................................................. 90
4.1.2) Wastewater preparation for Cr(VI) treatment ................................................................. 90
4.1.3) Wastewater preparation for secondary cheese whey ....................................................... 93
4.1.4) Monitoring of Wastewater Parameters ............................................................................ 94
4.1.5) Assessment of evapotranspiration ................................................................................... 94
4.1.6) Reed biomass in composting ........................................................................................... 97
4. 1.6.1) Composting materials and process .................................................................. 97
4.1.6.2) Physicochemical analyses ................................................................................. 97
4.2) Second Experimental Period ....................................................................... 100
4.2.1) Description of pilot-scale CW unit................................................................................ 100
4.2.2) Description of the experimental setup ........................................................................... 100
4.2.3) Wastewater preparation ................................................................................................. 101

Treatment of Industrial and Agro-Industrial Wastewater using Constructed Wetlands Mar-Yam Sultana
Chapter 4: Materials and Methods 90
CHAPTER 4: MATERIALS AND METHODS
4.1) First Experimental Period
4.1.1) Description of pilot-scale CW unit
Four pilot-scale HSF CWs were constructed using plastic trapezoidal tanks (units) with
dimensions 1.26 m long, 0.68 m wide (upper base), 0.73 m deep, and a total volume of 0.62
m3. The experiment was carried out in the Department of Environmental and Natural
Resources Management, located in Agrinio, Greece. Two units were used for Cr(VI) removal
(Fig. 4.1) and the other two for SCW treatment (Fig. 4.2). All units were filled with fine
gravel (D50=6mm) and placed in an open-air facility. Two pilot-scale units were planted (Cr-
P, SCW-P) with common reeds (Phragmites australis) and the other two were kept unplanted
(Cr-U, SCW-U). Cr-P and SCW-P were planted at the beginning of the experiments using
reeds obtained from local streams. Six stems of Phragmites australis (7 reeds/m2) were
planted in each unit. Wastewater inflow was through a perforated plastic pipe (diffuser)
placed across the width of the tank at the upstream side (Fig. 4.3). The outlet structure of the
units was an orifice (1/4 inch diameter) at the base of the downstream end of each unit, which
was connected to a U pipe (Fig. 4.4a, b). Overflow wastewater was collected in a 35L plastic
tank for proper disposal (Fig. 4.4c).
4.1.2) Wastewater preparation for Cr(VI) treatment
Tap water enriched with Cr(VI) was introduced into two CW units (Cr-P and Cr-U). The
Cr(VI) concentrations ranged from 0.5 to 10 mg/L. Five different HRTs (i.e., 8, 4, 2, 1 and 0.5
days) were applied to examine the effect of HRT on CW pollutant removal efficiency. The
void volume of clean tanks was estimated by draining the tanks and measuring the water
volume of each tank. Water volume and mean porosity for Cr-P were 108 L and 28%,
respectively, and for Cr-U, 112 L and 29%, respectively. Wastewater was introduced into the
units from the influent storage tanks using valves that were properly adjusted to give the
desired discharge (Fig. 4.5).

Treatment of Industrial and Agro-Industrial Wastewater using Constructed Wetlands Mar-Yam Sultana
Chapter 4: Materials and Methods 91
Figure 4.1: Pilot-scale HSF CWs for the treatment of Cr(VI).
Figure 4.2: Pilot-scale HSF CWs for the treatment of SCW.

Treatment of Industrial and Agro-Industrial Wastewater using Constructed Wetlands Mar-Yam Sultana
Chapter 4: Materials and Methods 92
Figure 4.3: Perforated inflow pipes (diffuser) in both units (Cr-U and Cr-P).
Figure 4.4: Outlet of the CWs: (a) Tube positioned at the same height as the filler material),
(b) Effluent collection point, (c) 35L plastic tank for overflow wastewater collection.
a b
c

Treatment of Industrial and Agro-Industrial Wastewater using Constructed Wetlands Mar-Yam Sultana
Chapter 4: Materials and Methods 93
Figure 4.5: Influent storage tank with adjustable valve.
4.1.3) Wastewater preparation for secondary cheese whey
Void volume was estimated by draining the tanks and measuring the water volume of each
tank. Water volume and mean porosity for SCW-P were 104 L and 25%, respectively, and for
SCW-U 114 L and 27%, respectively. A series of HRTs (i.e., 8, 4, 2 and 1 day) were studied
to examine the effect of HRT on the pilot-scale HSF CWs in removing COD. Influent COD
concentrations ranged from 1200 to 7200 mg/L in order to examine the effect of pollutant
load on COD removal.
Cheese whey: The secondary cheese whey used as the influent source in this experiment was
obtained from the factory of Papathanasiou S.A., ―Dairy and Cheese products of Trixonidas
highland, Agrinio, Greece. Fresh secondary cheese whey was collected regularly from the
factory and transported to the laboratory where it was refrigerated at 4°C to avoid any
acidification or change in its chemical composition. The COD concentrations of the
secondary cheese whey ranged from 40,000 to 50,000 g/L. A full-scale biological filter was
recently constructed and operated in order to treat the factory’s wastewaters (Tatoulis et al.,
2014a). The pilot-scale CWs were examined as a post-treatment stage to the effluent from the
biological filter. Therefore, the secondary cheese whey was diluted with tap water before
being introduced into the pilot-scale CW units, in order to adjust COD influent concentrations
to the biological filter’s effluent concentrations (1000 to 5000 mg/L).

Treatment of Industrial and Agro-Industrial Wastewater using Constructed Wetlands Mar-Yam Sultana
Chapter 4: Materials and Methods 94
4.1.4) Monitoring of Wastewater Parameters
Samples were collected with a frequency equal to the HRT and were taken from the influent
and the effluent points of each unit. Physicochemical parameters such as pH, electrical
conductivity (EC) and dissolved oxygen (DO) were measured in-situ for both points. pH and
EC were measured using a CONSORT C 835 multi-parameter analyzer, and DO was
measured using a HANNA HI-9143 Microprocessor D.O. meter. In the laboratory the
samples were analyzed for Cr(VI) following the 3500-Cr D Colorimetric method with
detection limit of 0.013 mg/L (APHA, 1998). COD was monitored by the absorbance of the
sample after dichromate digestion at 1500C for 2 h in the presence of silver and mercury
sulfates (closed reflux method, APHA et al., 1989). The absorbances were measured using a
HANNA C99 Multiparameter Bench Photometer (digested in HANNA instruments C9800
REACTOR). Meteorological data were obtained from the National Observatory of Athens
meteorological station in Agrinio. For the two-year duration of the experiment (2011-2012),
the mean experimental temperature was 20.6oC and the mean precipitation was 1390 mm
(Figs. 4.6 and 4.7).
4.1.5) Assessment of evapotranspiration
Evapotranspiration (ET) was assessed on a daily basis. Each morning the outlet storage tanks
were emptied and the volume of the treated wastewater was measured. Additionally, the
volume of the wastewater introduced into the units was also measured on a daily basis.
Influent and effluent volumes as well as precipitation levels were then used to assess ET.
During days with high temperatures and solar radiation, ET exceeded wastewater influent
volumes, leading to a reduction in the units’ water level, as ET values reached 15.5 L/d.

Treatment of Industrial and Agro-Industrial Wastewater using Constructed Wetlands Mar-Yam Sultana
Chapter 4: Materials and Methods 95
0 45 90 135
180
225
270
315
360
405
450
495
540
585
630
0
2
4
6
8
10
12
14
16
18
20
22
24
26
28
30
32
34
36
Tem
per
atu
re (
oC
)
Days
Figure 4.6: Time series chart for air temperature (2011-2012).

Treatment of Industrial and Agro-Industrial Wastewater using Constructed Wetlands Mar-Yam Sultana
Chapter 4: Materials and Methods 96
0 45 90 135
180
225
270
315
360
405
450
495
540
585
630
0
5
10
15
20
25
30
35
40
45
50
55
60
R
ain
fall
Dep
th (
mm
)
Days
Figure 4.7: Time series chart for precipitation (2011-2012).

Treatment of Industrial and Agro-Industrial Wastewater using Constructed Wetlands Mar-Yam Sultana
Chapter 4: Materials and Methods 97
4.1.6) Reed biomass in composting
4. 1.6.1) Composting materials and process
Olive pomace (OP), olive leaves (OL) and Cr treated reed plants (RP) were used for this
study. Two trapezoidal bins with dimensions 1.26 m long, 0.68 m wide (upper base), 0.73 m
deep and a total volume of 0.62 m3 were used for the composting experiments. Table 4.1
presents the experimental set-ups, where in bin 1, RP mass was higher than in bin 2. Figures
4.8a & b show the first day of composting after mixing of all the materials in both bins.
During composting, aeration was achieved by mechanical turning, which took place daily for
the first three days, every four days during the thermophillic phase, and once a week during
the maturation phase. Moisture contents were maintained above 45% as moisture contents
between 45-60%, by weight, are ideal for the composting process (Gajalakshmi and Abbasi
2008). The composting mixture was kept in the bins for 66 days. It was then removed from
the bins and stored in a protected area for up to 102 days to mature (Fig. 4.9).
Table 4.1: Description of experimental set-ups of composting.
Bin
(B)
Olive
pomace
Olive
leaf
Reed
plant
Seed
compost
(kg)
Wetting
agent
Initial
mass
(kg)
Initial
vol
(L)
Final
mass
(kg)
Final
vol (L)
B1 3.5 2.0 0.5 35.66 Water 194.49 435 139.72 263
B2 3.75 2.0 0.25 36.23 Water 204.78 435 144.83 270
4.1.6.2) Physicochemical analyses
During the experiments both compost and ambient temperature were monitored daily.
Compost temperature was measured using a temperature probe positioned in the middle of
each bin at a depth of 0.25 m. Compost samples were taken from each bin every six days and
analyzed for moisture content, pH, electrical conductivity (EC) and volatile solids (VS).
Moisture content was determined by drying the sample at 1050C for 24 h in an oven. To
measure volatile solids, the oven dried sample was burned at 6000C for four hrs (APHA et al.,
1998). pH and EC were measured in aqueous extract (using 1:10w/v). The remaining sample
portion was air dried, ground, sieved (0.5 mm), and then used to determine nitrogen (TKN),
total organic carbon (TOC), total phosphorus (TP), potassium (K), and sodium (Na), and
perform phytotoxicity tests. TKN was measured following the methods of Bremner and
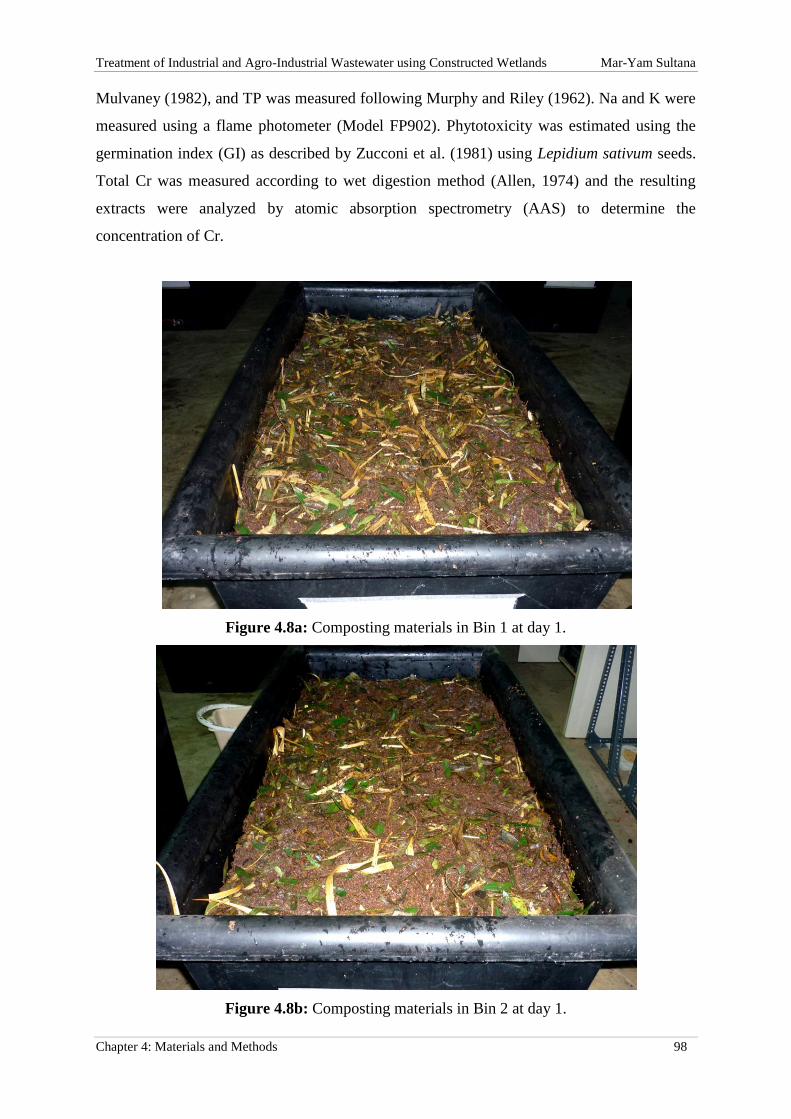
Treatment of Industrial and Agro-Industrial Wastewater using Constructed Wetlands Mar-Yam Sultana
Chapter 4: Materials and Methods 98
Mulvaney (1982), and TP was measured following Murphy and Riley (1962). Na and K were
measured using a flame photometer (Model FP902). Phytotoxicity was estimated using the
germination index (GI) as described by Zucconi et al. (1981) using Lepidium sativum seeds.
Total Cr was measured according to wet digestion method (Allen, 1974) and the resulting
extracts were analyzed by atomic absorption spectrometry (AAS) to determine the
concentration of Cr.
Figure 4.8a: Composting materials in Bin 1 at day 1.
Figure 4.8b: Composting materials in Bin 2 at day 1.

Treatment of Industrial and Agro-Industrial Wastewater using Constructed Wetlands Mar-Yam Sultana
Chapter 4: Materials and Methods 99
Figure 4.9a: Matured compost in Bin 1 at 102 days.
Figure 4.9b: Matured compost in Bin 2 at 102 days.
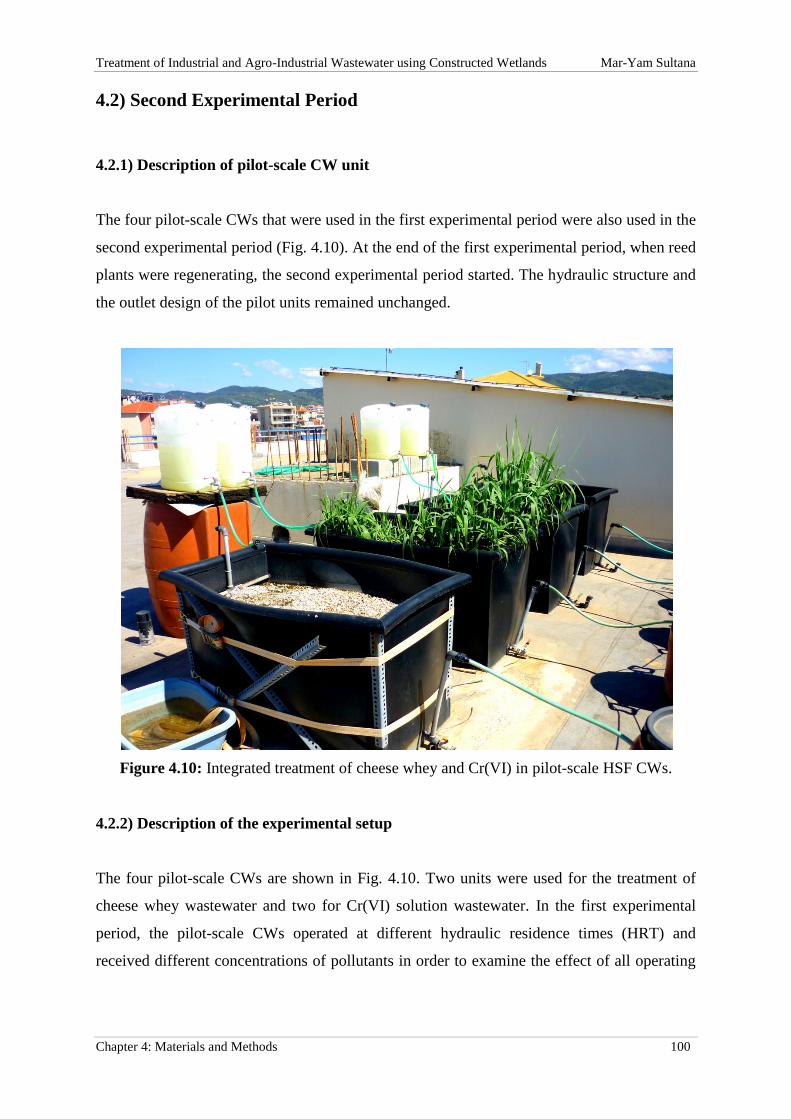
Treatment of Industrial and Agro-Industrial Wastewater using Constructed Wetlands Mar-Yam Sultana
Chapter 4: Materials and Methods 100
4.2) Second Experimental Period
4.2.1) Description of pilot-scale CW unit
The four pilot-scale CWs that were used in the first experimental period were also used in the
second experimental period (Fig. 4.10). At the end of the first experimental period, when reed
plants were regenerating, the second experimental period started. The hydraulic structure and
the outlet design of the pilot units remained unchanged.
Figure 4.10: Integrated treatment of cheese whey and Cr(VI) in pilot-scale HSF CWs.
4.2.2) Description of the experimental setup
The four pilot-scale CWs are shown in Fig. 4.10. Two units were used for the treatment of
cheese whey wastewater and two for Cr(VI) solution wastewater. In the first experimental
period, the pilot-scale CWs operated at different hydraulic residence times (HRT) and
received different concentrations of pollutants in order to examine the effect of all operating

Treatment of Industrial and Agro-Industrial Wastewater using Constructed Wetlands Mar-Yam Sultana
Chapter 4: Materials and Methods 101
parameters on the removal rates of COD and Cr(VI). In the second experimental session, the
four pilot-scale CWs were used to co-treat mixed cheese whey and Cr(VI) wastewaters.
Section 4.1 describes the first experimental period, i.e. residence times and inlet
concentrations of COD in the pilot units (SCW-P - planted and SCW-U - unplanted).
Similarly, hydraulic residence times and inlet concentrations of Cr(VI) in the pilot-scale units
(Cr-P - planted and Cr-U - unplanted) were discussed in Section 4.1.
In the second experimental period, co-treatment of cheese whey and Cr(VI) wastewaters was
performed in the four pilot-scale constructed wetlands. Cheese whey was used as the carbon
source in the treatment of Cr(VI). Inlet concentrations of COD and Cr(VI) are presented in
Table 4.2. The same HRTs and inlet concentrations were used in both experiments to allow
comparison of all results. For the second experimental period (i.e. 2013), the mean
temperature was 22.4oC and total precipitation was 667 mm (Figs. 4.11 and 4.12).
Table 4.2: Concentrations of Cr(VI) and COD used in the second experimental period.
HRT (days) Inlet concentration of
COD mg/L
Inlet concentration of
Cr mg/L
SCW-P, SCW-U
8 3000 5
4 2500 2.5, 0.5
Cr-P, Cr-U
8 2500 5
4 2000 2.5
4.2.3) Wastewater preparation
Fresh SCW was collected regularly from Papathanasiou S.A. It was transported to the
laboratory and refrigerated at 4°C. The COD concentration in the SCW ranged between
45000 to 50000 mg/L. The SCW was then diluted with tap water and Cr(VI) was added to
prepare a combined wastewater. This mixed wastewater was introduced into the pilot-scale
CW units as influent by adjusting the different concentrations of COD and Cr(VI) (COD
ranged from 2500 to 3000 mg/L and the concentrations of Cr(VI) were 0.5, 2.5 and 5 mg/L.

Treatment of Industrial and Agro-Industrial Wastewater using Constructed Wetlands Mar-Yam Sultana
Chapter 4: Materials and Methods 102
0 30 60 90 120 150 180 210 240
0
2
4
6
8
10
12
14
16
18
20
22
24
26
28
30
32
34
36
38
40
T
emp
erat
ure
(o C
)
Days
Figure 4.11: Time series chart for air temperature (2013).

Treatment of Industrial and Agro-Industrial Wastewater using Constructed Wetlands Mar-Yam Sultana
Chapter 4: Materials and Methods 103
0 30 60 90 120 150 180 210 240
0
5
10
15
20
25
30
35
40
45
50
55
60
R
ain
fall
Dep
th (
mm
)
Days
Figure 4.12: Time series chart for precipitation (2013).

Treatment of Industrial and Agro-Industrial Wastewater Using Constructed Wetlands Mar-Yam Sultana
Chapter 5: Pilot-Scale HSF Constructed Wetlands Treating Cr(VI)
CHAPTER 5: PILOT-SCALE HSF CONSTRUCTED WETLANDS
TREATING Cr(VI)
5.1) Effects of Physicochemical Parameters of Wastewater ................................................... 104
5.1.1) Temperature .................................................................................................................. 104
5.1.2) pH .................................................................................................................................. 105
5.1.3) Electrical Conductivity (EC) ......................................................................................... 109
5.1.4) Dissolve Oxygen (DO) .................................................................................................. 112
5.2) Treatment Efficiency of pilot-Scale HSF Constructed Wetlands .................................. 112
5.3) Effect of HRT ...................................................................................................................... 117
5.4) Cr Mass Balance ................................................................................................................. 121
5.5) Composting of Plant Biomass ............................................................................................ 124

Treatment of Industrial and Agro-Industrial Wastewater Using Constructed Wetlands Mar-Yam Sultana
Chapter 5: Pilot-Scale HSF Constructed Wetlands Treating Cr(VI) 104
CHAPTER 5: PILOT-SCALE HSF CONSTRUCTED WETLANDS
TREATING Cr(VI)
5.1) Effects of Physicochemical Parameters of Wastewater
Two pilot scale units (Cr-P and Cr-U) were used for Cr(VI) treatment and operated continuously
for two years under different HRTs, and different Cr(VI) influent concentrations. During the
operation period, physicochemical parameters (i.e., temperature, pH, Electrical Conductivity-EC
and Dissolved Oxygen-DO) were measured at the influent and effluent points of both pilot-scale
units. Although the parameters did not show any significant variations between the units, their
effects are briefly discussed in the following section.
5.1.1) Temperature
Temperature variations followed seasonal changes. As the Cr(VI) solutions used to feed Cr-P and
Cr-U were prepared using only tap water, temperatures at the inlet points of both units did not
present great temporal variations and ranged from 20 to 250C. On the other hand, wastewater
temperature at the outlet points ranged between 2.5 to 32.9oC, showing seasonal dependence.
However, temperature did not show significant variation between the units (p value=0.095).
Srisatit and Sengsai (2003) reported lower effluent temperature in planted wetlands than
unplanted wetlands and argued that the vegetations of the planted wetland blocked the sunlight.
During the first year of operation of the pilot-scale units, with an HRT of 8 days, Cr(VI) removal
efficiency did not show great variations between the two units (Michailides et al., 2013).
Moreover, with the exception of the initial commissioning phase, Cr-U showed high
concentrations of Cr(VI) in the effluent (mean value 3.84 mg/L) which were not affected by
temperature fluctuations.
To statistically assess the effect of temperature on Cr(VI) removal efficiency with HRTs of 8
days, the data were divided into two sets, one above and one below 150C. This temperature value

Treatment of Industrial and Agro-Industrial Wastewater Using Constructed Wetlands Mar-Yam Sultana
Chapter 5: Pilot-Scale HSF Constructed Wetlands Treating Cr(VI) 105
was selected because below it neither the bacteria responsible for nitrogen removal nor the
vegetation functions properly (Akratos and Tsihrintzis, 2007). Cr-U showed extremely low
removal efficiencies (15% for temperatures >15oC and 7% for temperatures <15
0C) in this
period, which proved significantly different (p value = 0.0<0.05). Although the Cr-P units
showed higher removal efficiencies in the same period (95% for temperatures >150C and 80% for
temperatures <150C) they were also affected by temperature (p value = 0.004<0.05). Although
temperature affected Cr(VI) removal efficiency in both units, it could not be attributed to the
same phenomenon. Cr(VI) in Cr-P is mainly removed, as already mentioned, through plant
accumulation. Thus, the effect of temperature on Cr-P performance is mainly caused by the
reeds’ annual growth cycle, as in low temperatures common reeds limit their growth and usually
decay. Nevertheless, even at low temperatures Cr(VI) removal efficiencies remained high (80%).
On the other hand, temperature affects Cr-U performance as low temperatures limit microbial
activity.
5.1.2) pH
Hydrogen ion activity (i.e. pH) is a key factor that influences metal chemistry and mobility and
has a significant impact on the uptake of heavy metals (Zeng et al., 2011). The solubility,
mobility and bioavailability of metals increase when the pH decreases (Gambrell, 1994).
Hydroxide minerals of metals are less soluble under pH conditions of natural water. As
hydroxide ion activity is directly related to pH, the solubility of metal hydroxide minerals
increases with decreasing pH, and they become potentially available for biological processes as
pH decreases (Salomons, 1995). During the operational period pH values were monitored at the
inlet and outlet points of both the Cr-P and Cr-U units. Figure 5.1a presents the pH time series
chart for the Cr-U unit. pH does not present any significant variations during the operational
period for the Cr-U unit. The mean influent and effluent pH values in the Cr-U unit were
identical (pH 7.46), while maximum and minimum influent values of pH in Cr-U were 7.96 and
7.04, respectively and at the Cr-U outlet pH maximum and minimum values were 7.91 and 5.77,
respectively. As stated above, metal mobility is influenced by pH value. Heavy metals are co-
precipitated in ferrous-iron oxides and the oxiferric hydroxide surfaces are positively charged in
acidic pH conditions and negatively charged in alkaline pH conditions (Sheoran and Sheoran,

Treatment of Industrial and Agro-Industrial Wastewater Using Constructed Wetlands Mar-Yam Sultana
Chapter 5: Pilot-Scale HSF Constructed Wetlands Treating Cr(VI) 106
2006). Thus to enhance the adsorption and removal of metal oxyanions, iron-coprecipitation
should occur under acidic pH conditions (Brix, 1993). Furthermore, as pH increases there is
competition between OH- and chromate ions (CrO4
2-) and these become the dominant species at
higher pH values (<6), however adsorption ceases at pH >9 (Baral et al., 2006). Kongroy et al.
(2012) stated that Cr accumulation in sediment could be due to precipitation under high pH
condition (pH= 8-9). Lesage et al. (2007b) reported that too low and too high pH value is
unfavourable for metal sorption. Mant et al. (2006) came to same conclusion about pH though
they did not mention the pH value. As in this study the mean pH value of the Cr-U unit was
found to be 7.46, it could be concluded that this pH value may enhance the precipitation of
Cr(VI) in the unplanted unit.
Figure 5.1b presents the pH time series chart for the Cr-P unit. The mean influent pH value was
7.49 and the mean effluent pH value was 6.76. pH values showed no dependence on HRT as they
remained stable throughout the operation period. At the effluent point of CW-P unit, the
maximum and minimum values of pH were recorded as 7.38 and 5.32, respectively.
Peng et al. (2009) stated that lower pH values can increase the bioavailability of metals in
sediment. It is also reported that metal mobility is high when pH ranges between 5 to 6.7, and
moderate when pH values reach 7 (Valerie et al., 2004). pH not only influences metal
bioavailability (Zeng et al., 2011) but also influences plant growth in substrate (Calheiros et al.,
2007). According to EPA (2000b), the optimum pH range is 3.7 to 8 for reed plant development
in CWs. However, in this study, the pH value of the Cr-P unit varied between 7.38 and 5.32
which was suitable for plant growth and also for bioavailability of Cr(VI). At this pH range the
ionic forms of Cr(VI) are more soluble and mobile in water (Baral et al., 2006) and when these
ionic forms become soluble, they become more available for bioaccumulation (Cooper et al.,
1996). The same pH range was also recorded by other authors (Qian et al., 2012; Dotro et al.,
2011a;b; Fibbi et al., 2012; Kongroy et al., 2012). Furthermore, the pH data were statistically
analyzed to assess variations between the planted and unplanted units. The results indicates that
there were no significant variations of pH value between the units as the p value was 0.100 >
0.05.

Treatment of Industrial and Agro-Industrial Wastewater Using Constructed Wetlands Mar-Yam Sultana
Chapter 5: Pilot-Scale HSF Constructed Wetlands Treating Cr(VI) 107
0 45 90 135 180 225 270 315 360 405 450 495 540 585 630
6,0
6,5
7,0
7,5
8,0
8,5
9,0
9,5
10,0
Influent
Effluent
HRT alterations
Plant Harvesting
Win
ter
AutumnSummerSpringWinterAutumnSummerS
pri
ng
1 d
ay
HR
T
12
h H
RT
1 d
ay
HR
T
2 day HRT
p
H
Days
8 days HRT
4 d
ay
s H
RT
2 d
ay
HR
T
1 d
ay
HR
T1
2 h
HR
T
Figure 5.1a: pH values of influent and effluent wastewaters in the Cr-U unit.
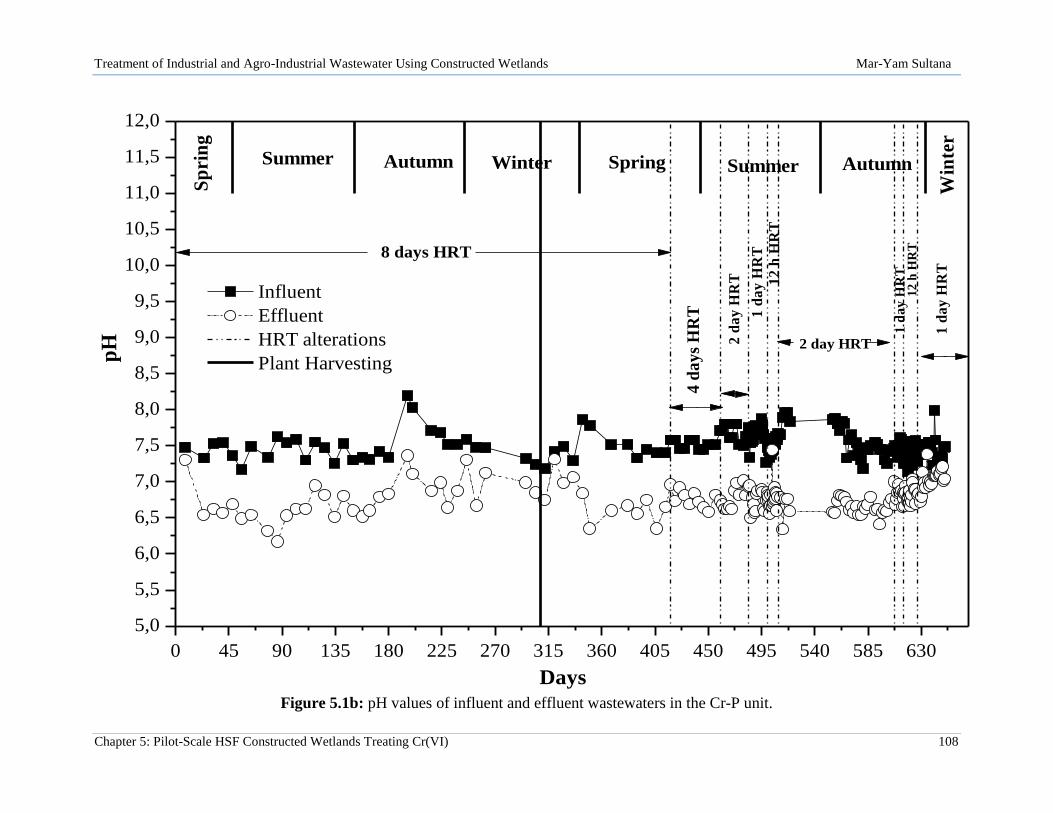
Treatment of Industrial and Agro-Industrial Wastewater Using Constructed Wetlands Mar-Yam Sultana
Chapter 5: Pilot-Scale HSF Constructed Wetlands Treating Cr(VI) 108
0 45 90 135 180 225 270 315 360 405 450 495 540 585 630
5,0
5,5
6,0
6,5
7,0
7,5
8,0
8,5
9,0
9,5
10,0
10,5
11,0
11,5
12,0
Influent
Effluent
HRT alterations
Plant Harvesting
p
H
Days
8 days HRT
4 d
ay
s H
RT
2 d
ay
HR
T
1 d
ay
HR
T
12
h H
RT
2 day HRT
1 d
ay
HR
T1
2 h
HR
T
1 d
ay
HR
TW
inte
r
AutumnSummerSpringWinterAutumnSummer
Sp
rin
g
Figure 5.1b: pH values of influent and effluent wastewaters in the Cr-P unit.

Treatment of Industrial and Agro-Industrial Wastewater Using Constructed Wetlands Mar-Yam Sultana
Chapter 5: Pilot-Scale HSF Constructed Wetlands Treating Cr(VI) 109
5.1.3) Electrical Conductivity (EC)
Electrical conductivity is an essential parameter for wetlands because it measures a solution’s
ability to carry an electrical current and quantifies the amount of dissolved salts in the
wastewaters. This value was monitored for both pilot-scale units to assess its role in Cr(VI)
removal. Figure 5.2a shows the EC chart for the Cr-U unit with different HRTs during the
operational period. The mean EC in the CW-U unit was almost same for both influent and
effluent points with the value 357 of µS/cm. Maximum and minimum values of EC at influent of
CW-U unit were 685 and 265 µS/cm, respectively. At the effluent point, the maximum and
minimum values of EC were 784 and 235 µS/cm, respectively. However, yearly performance of
EC in the CW-U unit did not show any variation. The EC values recorded were rather low,
because of the use of aqueous solutions and not real wastewaters. The EC chart for the Cr-P unit
is presented in Fig. 5.2b. Mean EC values showed an increasing trend in the Cr-P unit with a
mean influent value of 356 µS/cm and a mean effluent of 442 µS/cm.
Many authors (Dotro et al., 2012; Kongroy et al., 2012; Kelvin and Tole 2011; Maine et al.,
2007) have reported high EC values in the influents as all of them used real wastewaters
including tannery, metallurgic factory, tool factory and storm runoff wastewaters. However,
Kelvin and Tole (2011) also observed an increased trend of EC in their study. Overall EC values
of both units were assessed statistically and the results indicate that there was no significant
variation of EC concentrations between the units (p value= 0.111> 0.050).

Treatment of Industrial and Agro-Industrial Wastewater Using Constructed Wetlands Mar-Yam Sultana
Chapter 5: Pilot-Scale HSF Constructed Wetlands Treating Cr(VI) 110
0 45 90 135 180 225 270 315 360 405 450 495 540 585 630
200
300
400
500
600
700
800
Influent
Effluent
HRT alterations
Plant Harvesting
1 d
ay
HR
T
EC
(µ
S/c
m)
Days
8 days HRT
4 d
ay
s H
RT
2 d
ay
s H
RT
1 d
ay
HR
T1
2 h
HR
T
2 days HRT
12
h H
RT
1 d
ay
HR
T
Sp
rin
g
Summer Autumn Winter Spring Summer Autumn
Win
ter
Figure 5.2a: EC value of influent and effluent wastewaters in the Cr-U unit.

Treatment of Industrial and Agro-Industrial Wastewater Using Constructed Wetlands Mar-Yam Sultana
Chapter 5: Pilot-Scale HSF Constructed Wetlands Treating Cr(VI) 111
0 45 90 135 180 225 270 315 360 405 450 495 540 585 630
100
200
300
400
500
600
700
800
900
1000
1100
1200
1300
1400E
C (
µS
/cm
)
Days
8 days HRT
4 d
ay
s H
RT
2 d
ay
s H
RT
1 d
ay
HR
T
12
h H
RT
2 day HRT
1 d
ay
HR
T1
2 h
HR
T
1 d
ay
HR
T
Sp
rin
g
Summer Autumn Winter Spring Summer Autumn
Win
ter
Influent
Effluent
HRT alterations
Plant Harvesting
Figure 5.2b: EC values of influent and effluent wastewaters in the Cr-P unit.

Treatment of Industrial and Agro-Industrial Wastewater Using Constructed Wetlands Mar-Yam Sultana
Chapter 5: Pilot-Scale HSF Constructed Wetlands Treating Cr(VI) 112
5.1.4) Dissolve Oxygen (DO)
Dissolves oxygen (DO) is an important parameter to in CWs since the amount of dissolved
oxygen in the water is directly related to aerobic bacteria in the system. Sufficient DO is essential
to support plant, aquatic and microbial life in CWs. Very low or very high concentrations of DO
can be harmful to aquatic life. The DO concentration at the inlet and outlet of both wetlands did
not show any significant variation in this study. The mean DO values recorded at the inlet and
outlet point of CW-U unit were around 6.22 and 4.22, respectively. In the CW-P unit, the mean
influent and effluent concentrations of DO were 6.43 and 4.33 mg/L, respectively. The overall
variations of DO concentration in the pilot-scale units were analyzed statistically and the results
showed that the variations of DO concentration between the units were not significant (p
value=0.435 >0.05).
DO concentrations have no significant influence on Cr(VI) reduction (Jakobs, 2012; Han, 1999).
Dotro et al. (2011a), stated that oxygen availability has no impact on Cr removal in an abiotic
system when the DO remains at 7.4 mg/L. Willow and Cohen (2003), also state that DO in water
has little influence on heavy metal removal. However, Maine et al. (2006) also recorded a similar
DO value to the one recorded here.
5.2) Treatment Efficiency of pilot-Scale HSF Constructed Wetlands 1
Figures 5.3a % b present time series charts for influent and effluent concentrations of Cr(VI) for
both the planted and unplanted units. Effluent concentrations were corrected for rainfall and ET
volumes have been removed. Effluent concentration correction was necessary as on days with
high rainfall, the effluent concentrations were lower due to dilution by rainwater, leading to an
overestimation of removal efficiency. During the treatment periods with high temperatures and
high solar radiation (e.g. summer), the water level decreased due to high ET rates, leading to
underestimation of removal efficiency.
1 Data presented in Sultana et al., 2014a

Treatment of Industrial and Agro-Industrial Wastewater Using Constructed Wetlands Mar-Yam Sultana
Chapter 5: Pilot-Scale HSF Constructed Wetlands Treating Cr(VI) 113
During the first year of operation, the two CW units showed significant differences in Cr(VI)
removal, with the exception of the first one hundred days. During these first 100 days, both units
showed a similar fluctuation in removal efficiency that was attributed to the CW commissioning
phase (Michailides et al., 2013). In the first year of treatment, the wetlands were treated with
mean Cr(VI) influent concentrations of 5.61 and 5.47 mg/L for CW-P and CW-U, respectively
and an HRT of 8 days was used. The mean Cr(VI) effluent concentrations were recorded 0.86
and 3.84 mg/L for CW-P and CW-U, respectively and the mean removal efficiency of Cr was
recorded as 85% and 26% for CW-P and CW-U, respectively. From the results of the first year, it
is clear that Cr(VI) removal in CW-P was higher than in CW-U with 8 days of HRT. Therefore,
the difference in removal efficiencies between the two units could only be attributed to the
presence of the reed vegetation.
For the most effective pollutant removal from the wetlands, the plants should be harvested in
winter when the life cycle of reed is complete. Following plant harvesting (Fig. 5.3b), the effluent
concentrations of the CW-P increased, reinforcing the assumption that the main Cr(VI) removal
mechanism is plant biomass accumulation. With the exception of the initial 100 days, the Cr-U
showed high effluent concentrations most of the year. These high effluent concentrations were
not affected by temperature fluctuations thus implying that microbial accumulation of Cr(VI) is
minimal and that during the initial 50 days of operation, Cr(VI) was mainly removed via porous
media absorption. The ability of reeds to accumulate Cr(VI) in their roots and transfer it to stems
and leaves has been proved in previous experiments by Aguilar et al. (2008).
After the regeneration of reed plants, in the second year, both the wetlands were treated with
different concentrations of Cr(VI) with different HRTs. Throughout the operation period the two
units showed significant differences in Cr(VI) removal, with the exception of the first 40 days of
the second year as the plants were regrowing (Fig. 5.3b). During these 40 days both units showed
a similar fluctuation in removal efficiency. These differences in Cr(VI) removal efficiencies are
not due to temperature fluctuations, as the environmental temperature rose in the same period.
However, both Cr-P and Cr-U present clear differences in Cr(VI) removal, as the mean removal
rate in Cr-P was 87.47%, but only 21% in Cr-U.

Treatment of Industrial and Agro-Industrial Wastewater Using Constructed Wetlands Mar-Yam Sultana
Chapter 5: Pilot-Scale HSF Constructed Wetlands Treating Cr(VI) 114
Figure 5.3a shows that Cr(VI) concentrations decreased slightly in the Cr-U unit. In this unit, the
main mechanisms of Cr(VI) removal were probably accumulation by microorganisms and
absorption by the porous media. Although the removal rate was low, it may also be explained as
some chromium hydroxide precipitation is dependent on pH. When pH is decreases precipitation
of chromium hydroxide increases within a certain range of pH (5.5-8) (Karale et al., 2007; Alves
et al., 1993). This limited Cr(VI) removal in the Cr-U unit can also be attributed to the fact that
microorganisms received water contaminated with Cr(VI) and not wastewater. The contaminated
water has lower concentrations of organic carbon and nutrients and therefore limits the growth of
microorganisms due to the lack of sufficient carbon and nutrients. Furthermore, the porous media
used in these pilot-scale units was river gravel which does not have high absorption ability.
On the contrary, the Cr-P unit removed almost all the Cr(VI), as its removal efficiency was close
to 100% for most of the operating period (Fig. 5.3b). In this unit, Cr(VI) removal efficiency
showed variations in specific time periods. In the winter period when the plants were
regenerating, Cr(VI) removal efficiency in the Cr-P unit showed a fluctuation but still showed
better performance than Cr-U. This reinforces the argument that the main removal mechanism of
Cr(VI) is accumulation in reed plants throughout the year. The other period where CW-P showed
lower Cr(VI) removal efficiency, was when the HRTs were changed. This is because the Cr-P
unit required an adjustment period when higher Cr(VI) loads were introduced. Otherwise a high
removal efficiency of Cr(VI) was observed throughout the experimental period in the Cr-P unit
which suggests that the Cr(VI) removal was performed by the plants. In addition to this,
hydroponic gravel bed systems contain an extensive variety of micro-environments near the plant
root surfaces and within the biofilms that form on root surfaces and gravel (Williams, 1993).
Nevertheless, if no biofilm develops on the plant roots, roots still serve as ground for metal
binding, due to the presence of organic ligands such as carboxyl, hydroxyl, and phenolic
functional groups (Mant et al., 2006). Although the Cr-P was subjected to several variations of
HRT and Cr(VI) feed concentration, the plants did not show any signs of injury and continued to
grow normally.

Treatment of Industrial and Agro-Industrial Wastewater Using Constructed Wetlands Mar-Yam Sultana
Chapter 5: Pilot-Scale HSF Constructed Wetlands Treating Cr(VI) 115
0 45 90 135 180 225 270 315 360 405 450 495 540 585 630
-1
0
1
2
3
4
5
6
7
8
9
10
11
12
13
14
15
Con
cen
trat
ion
(m
g/L
)
Influent
Effluent
HRT alterations
Plant Harvesting
Days
Sp
rin
gSummer Autumn Winter Spring Summer Autumn
Win
ter
8 days HRT
4 d
ays
HR
T
2 d
ays
HR
T
1 d
ay H
RT
12 h
HR
T
2 days HRT
1 d
ay H
RT 12
h H
RT
1 d
ay H
RT
Figure 5.3a: Time series charts of Cr(VI) influent and effluent concentrations for Cr-U.

Treatment of Industrial and Agro-Industrial Wastewater Using Constructed Wetlands Mar-Yam Sultana
Chapter 5: Pilot-Scale HSF Constructed Wetlands Treating Cr(VI) 116
0 45 90 135 180 225 270 315 360 405 450 495 540 585 630
-1
0
1
2
3
4
5
6
7
8
9
10
11
12
13
14
15
Influent
Effluent
HRT alterations
Plant Harvesting
C
once
ntr
atio
n (
mg/
L)
Days
Sp
rin
gSummer Autumn Winter Spring Summer Autumn
Win
ter
8 days HRT
4 d
ays
HR
T
2 d
ay
s H
RT
1 d
ay
HR
T 12
h H
RT
2 days HRT
1 d
ay H
RT 12
h H
RT
1 d
ay
HR
T
Figure 5.3b: Time series charts of Cr(VI) influent and effluent concentrations for Cr-P.

Treatment of Industrial and Agro-Industrial Wastewater Using Constructed Wetlands Mar-Yam Sultana
Chapter 5: Pilot-Scale HSF Constructed Wetlands Treating Cr(VI) 117
A number of studies have been done on the removal of Cr from different wastewaters using HSF
CWs planted with reeds. Different authors used different Cr concentrations either with a single
species or with mixed vegetation. Concerning the use of different chromium concentrations,
Arroyo et al. (2010) used the highest concentration (5.64 mg/L) with a long HRT and different
plant species, where they recorded 55% Cr removal efficiency. Whereas, using a single species,
with almost the same Cr concentrations and a much lower HRT (1 day), the highest Cr removal
efficiency was recorded by Sultana et al., (2014a). Dotro et al. (2011b) also used the same
concentration with a longer HRT and Typha spp., and achieved 90-99% removal rates of Cr(VI).
Fibbi et al. (2012), Lesage et al. (2007a) and Kucuk et al. (2003), used single vegetation of
common reeds but with very low concentrations of Cr (0.0008-0.0158, 0.113, 0.2 mg/L,
respectively) and HRTs of not less than 2 days. Among these research groups, Lesage et al.
(2007a), recorded the highest removal efficiency of 87%. However, they did not discuss effects
of HRT on Cr removal.
5.3) Effect of HRT
Four different HRTs were applied to both CW units throughout the operational period (Figs. 5.3a
& b). During the first year an HRT of 8 days was used to avoid plant stress from the high Cr(VI)
loads. After the first year of operation, the HRT was adjusted from 8 days to 4, then to 2, and
finally to 1 day. HRTs of 12hrs were also tested however, removal efficiencies of both units
showed great variations probably due to the diurnal cycles of the plant vegetation. Pollutant
surface loading rate (SLR) and HRT are very significant parameters for wastewater treatment
efficiency in CWs. The mean influent SLR ranged from 0.03 to 0.55 gr/m2/d for Cr-U and from
0.03 to 0.52 gr/m2/d for Cr-P. Figures 5.4a & b presents correlation charts for influent Cr(VI)
surface load and Cr(VI) removal efficiency. Cr-P showed a slight increase in Cr(VI) removal
efficiency with SLR, while Cr(VI) removal efficiency in Cr-U decreased slightly with SLR.
Nevertheless, removal efficiency in both units did not vary significantly with SLR when influent
concentrations ranged from 0.5 to 10 mg/L.
Figure 5.3a & b present the effect of different HRTs on influent (5, 2.5, 1 and 0.5 mg/L) and
effluent concentration of Cr(VI). Maximum Cr(VI) removal in CW-P was found to be 100 % (i.e.
effluent concentration was 0 mg/L) with HRT of 8, 4, 2 and 1 day and Cr(VI) concentration of 5

Treatment of Industrial and Agro-Industrial Wastewater Using Constructed Wetlands Mar-Yam Sultana
Chapter 5: Pilot-Scale HSF Constructed Wetlands Treating Cr(VI) 118
mg/L, while the lowest removal rate of 44.78% was observed in the Cr-P unit with HRTs of 8
days. In the Cr-U unit, the maximum removal rate was recorded 50.24% at 8 days of HRT
(during the regeneration period). The removal rate of Cr(VI) in Cr-P at the lowest HRT (1 day)
was also 100% with the highest Cr(VI) concentration of 5 mg/L. However, the Cr-U unit showed
only 9.17 % of removal of Cr(VI) with the same initial influent concentration. Only a slight
difference was found between inlet and outlet of the Cr-U. From this description, it is clear that
there was a significant variation between two pilot-scale wetlands due to the HRT.
One-way ANOVA statistical analyses were performed to examine if the Cr(VI) removal
efficiencies showed statistically significant differences with different HRTs. Statistical analysis
was not performed on the data of the first operational period, however the differences between
the planted and unplanted units were obvious. The data of the second year used for the ANOVA
analysis were taken from periods during which temperatures were not significantly different (p
value =0.095>0.05) and Cr(VI) feed concentrations were almost identical, thus exhibiting only
the effect of HRT (Table 5.1). Mean removal values (under steady state conditions) and
temperatures for HRTs of 8, 4, 2 and 1 days at higher (21.8-28oC) and lower (16.7-18.3
oC)
temperatures are presented in Table 5.1. It should be noted that effluent concentrations were
always below the permitted limits of 0.05 mg/L (EC, 1998).
Table 5.1: Comparisons of Cr (VI) removal between different HRTs and temperatures.
Time period HRT
(d)
Cr(VI) Feed
concentration
(mg/L)
Temperature 0C
Cr(VI) removal (%)
CW-U unit CW-P unit
Mean SD Mean SD Mean SD
High temperatures
29/4-9/5/12 8 4.8 21.8 1.0 16.8 17.7 100 0
22/5-10/6/12 4 5.1 23.3 2.3 16.9 10.9 100 0
11/6-24/6/12 2 4.9 28.0 1.5 31.9 14.2 100 0
27/6-4/7/12 1 5.0 27.9 0.4 37.1 10.9 100 0
Low temperatures
25/10-2/11/12 2 1.0 18.3 2.6 9.2 29.9 100 0
3/11-8/11/12 1 0.9 16.7 2.3 45.9 2.5 100 0

Treatment of Industrial and Agro-Industrial Wastewater Using Constructed Wetlands Mar-Yam Sultana
Chapter 5: Pilot-Scale HSF Constructed Wetlands Treating Cr(VI) 119
0,0 0,1 0,2 0,3 0,4 0,5 0,6 0,7
-80
-70
-60
-50
-40
-30
-20
-10
0
10
20
30
40
50
60
70
80
90
100
R
emo
va
l (%
)
Surface load (gr/m2/day)
Figure 5.4a: Effect of surface load on Cr(VI) removal for Cr-U

Treatment of Industrial and Agro-Industrial Wastewater Using Constructed Wetlands Mar-Yam Sultana
Chapter 5: Pilot-Scale HSF Constructed Wetlands Treating Cr(VI) 120
0,0 0,1 0,2 0,3 0,4 0,5 0,6 0,7
10
20
30
40
50
60
70
80
90
100
110
Rem
oval
(%
)
Surface load (gr/m2/day)
Figure 5.4b: Effect of surface load on Cr(VI) removal for Cr-P.

Treatment of Industrial and Agro-Industrial Wastewater Using Constructed Wetlands Mar-Yam Sultana
Chapter 5: Pilot-Scale HSF Constructed Wetlands Treating Cr(VI) 121
For the high temperature season, Cr(VI) removal did not differ significantly in the Cr-U (p value
= 0.061>0.05) and Cr-P units (all removal rates were 100%). For the low temperature period,
Cr(VI) removal efficiencies for CW-U were significantly different (p value =0.009>0.05), while
for the Cr-P unit there were no significant differences as all removal rates of Cr(VI) were 100%.
It is clear that the Cr-P units have stable Cr(VI) removal efficiencies that depend only on plant
function and decrease only for a short period of the year (from plant harvesting to regeneration
period). The stable Cr(VI) removal efficiency demonstrated by the CWs throughout most of the
year even though the planted unit operated with low HRTs (of 1 day), makes CWs a promising
treatment technology for Cr(VI) removal. As Cr-P removal efficiencies with HRTs of 1 day were
high, an HRT of 12 hours was also tested. However, results were not satisfactory as Cr(VI)
removal efficiency exhibited significant variations during the same day. After the summer when
the reed plants had aged, the Cr(VI) influent concentration was decreased to 2.5 mg/L, and HRTs
of 2, 1 and 0.5 days were tested. In this experiment the CW-P unit also showed 100% efficiency
for HRTs of 2 and 1 day with Cr(VI) concentrations of 2.5 mg/L, while the CW-U unit showed
only 69.23% and 12.04% removal efficiency for HRTs of 2 and 1 day, respectively. As the life
cycle of reeds completes at the end of the autumn the same experiment was also carried out with
a low concentration of Cr(VI) (1 mg/L) for HRTs of 2 and 1 day. In this case, the Cr-P unit again
demonstrated 100% removal efficiency, whereas the Cr-U unit showed very low removal
efficiencies.
5.4) Cr Mass Balance
During the two year operation of the pilot-scale units, plant biomass was removed from the Cr-P
unit twice. Specifically, above ground plant biomass was harvested in January (Fig. 5.5). After
harvesting, the leaves and stems were separated and dried in order to estimate their Cr content.
The total dry mass of leaves and stems was 3 and 4 kg, respectively. To ensure plant regeneration
during the spring root biomass was not removed. Nevertheless, in several studies it is reported
that for common reeds the ratio of root mass to above ground mass ranges from 1:1.8-1:9.9
(EPA, 1998; Cronk and Fennessy, 2001). Thus, root mass should range from 7.2 kg to 39.6 kg.
To estimate total Cr concentration in the roots, a single reed root was removed in each harvest.
Table 5.2 presents the Cr concentrations recorded in different parts of the reed plants from the

Treatment of Industrial and Agro-Industrial Wastewater Using Constructed Wetlands Mar-Yam Sultana
Chapter 5: Pilot-Scale HSF Constructed Wetlands Treating Cr(VI) 122
first and second years of experiments and from the literature. It can be seen that Cr concentrations
show great variations in common reeds; however the Cr concentrations in the present study are
among the highest reported to date. The accumulation of Cr(VI) in the different plant parts was,
in decreasing order, root> leaves> stems (Table 5.2) as also reported in previous studies (Lesage
et al., 2007b; Mant et al., 2006; Fibbi et al., 2012). Upward translocation depends on the metal
pollutant, the plant species and other environmental factors (Yadav et al., 2010; Kongroy et al.,
2012). Wetland plants, including common reeds, are capable of reducing Cr(VI) to Cr(III), either
inside their tissue after digestion of Cr(VI) or outside by the release of root exudates (Fibbi et al.,
2012). The mechanism of metal partitioning is a strategy plants use to manage the effects of toxic
ions in their roots and prevent any effects on leaves, photosynthesis or other metabolic activities
(Sune et al., 2007). In this study, the Cr(VI) concentrations in reeds were found to be 820 mg/kg
in the roots, 750 mg/kg in the leaves, and 540 mg/kg in the stems.
Figure: 5.5 Harvested reed plants treated with Cr(VI) solutions.

Treatment of Industrial and Agro-Industrial Wastewater Using Constructed Wetlands Mar-Yam Sultana
Chapter 5: Pilot-Scale HSF Constructed Wetlands Treating Cr(VI) 123
Table 5.2: Cr concentrations recorded in different parts of reed plants.
Reference
Cr concentration (mg/kg d.m.)
Roots Leaves Stems Shoots Whole
plant
Khan et al., 2009 2.3 - - 1 -
Lesage et al., 2007b 17.75 0.725 1.075 - -
Calheiros et al., 2008b 1647-4825 109-627 369-883 - -
Mant et al., 2006 406.2 12.863 15.505 - -
Liu et al., 2010 22.2 - - 12.7 -
Fibbi et al., 2012 - 0.66-4.62 1.12-2.83 - -
Kongoy et al., 2012 - - - - 11.3
Laing et al., 2009 - 0.28-1.21 0.29-0.72 - -
Vymazal et al., 2007 - - - 0.4-15 -
Sultana et al., 2014a
(Present experimental
results)
820 750 540 - -
During the two years of operation, the Cr-P and Cr-U units received 24 and 25.6 m3 wastewater,
respectively. The total Cr(VI) mass introduced into these units was 77.6 gr for Cr-P and 84.5 gr
for Cr-U. This difference occurs due to the different volumes of wastewater introduced into each
unit. Cr(VI) removal varied in the two units as Cr-P achieved higher removal efficiencies
removing 69 gr of Cr, while the Cr-U removed only 21.5 gr of Cr. Thus, the Cr-P unit removed
70% more Cr(VI) than the Cr-U unit. In the Cr-U Cr(VI) was removed either by absorption by
porous media or by biological processes. On the other hand, Cr-P removal mechanisms include
porous media absorption and biological accumulation together with plant accumulation. As the
exact Cr mass removed in Cr-P by porous media absorption and biological accumulation could
not be assessed, it can be assumed that this value is at least equal to the Cr mass removed in the
Cr-U. Thus, plant accumulation in CW-P removed a maximum of 47.5 gr Cr. Total Cr content in
above ground biomass was estimated at 4.5 gr /kg dry matter. On the other hand, total Cr content
in roots should range from 5.9 gr/kg d.m to 32.5 gr/kg dry matter (EPA, 1998; Cronk and
Fennessy, 2001). As Cr(III) effluent concentrations in the pilot-scale operation were below
detectable units, it can be assumed that the remaining Cr mass removed from the Cr-P, was either
absorbed into the porous media or removed through biological accumulation.
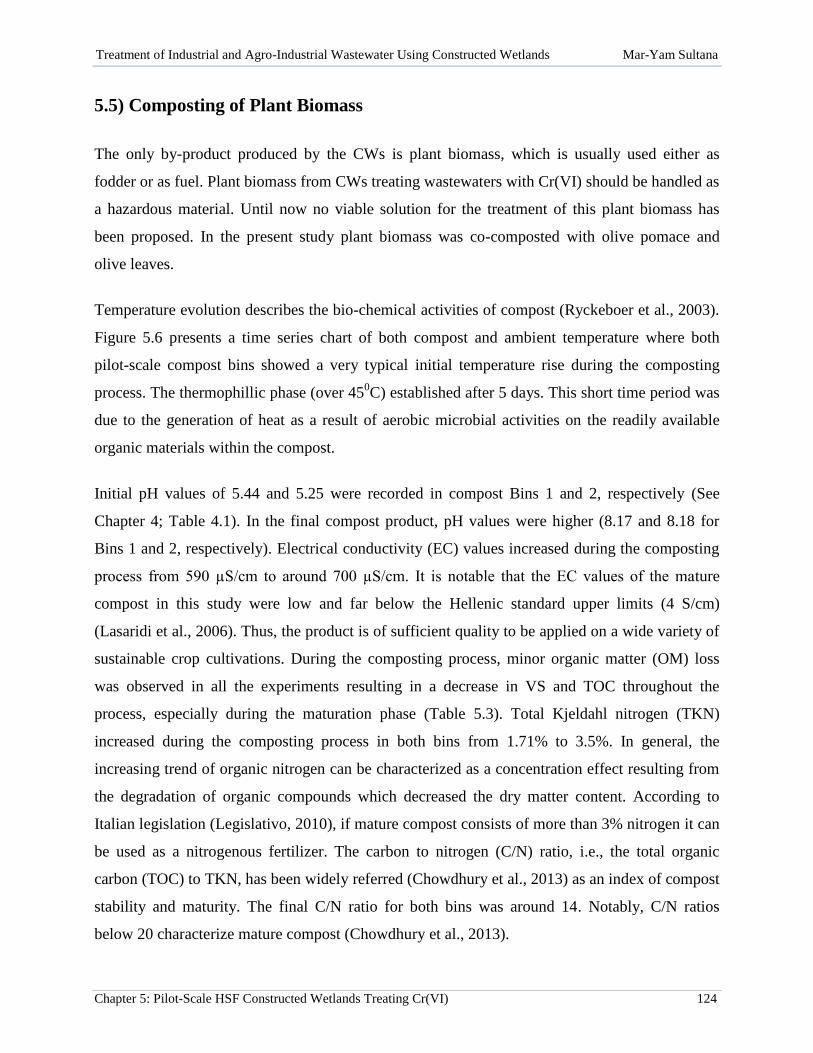
Treatment of Industrial and Agro-Industrial Wastewater Using Constructed Wetlands Mar-Yam Sultana
Chapter 5: Pilot-Scale HSF Constructed Wetlands Treating Cr(VI) 124
5.5) Composting of Plant Biomass
The only by-product produced by the CWs is plant biomass, which is usually used either as
fodder or as fuel. Plant biomass from CWs treating wastewaters with Cr(VI) should be handled as
a hazardous material. Until now no viable solution for the treatment of this plant biomass has
been proposed. In the present study plant biomass was co-composted with olive pomace and
olive leaves.
Temperature evolution describes the bio-chemical activities of compost (Ryckeboer et al., 2003).
Figure 5.6 presents a time series chart of both compost and ambient temperature where both
pilot-scale compost bins showed a very typical initial temperature rise during the composting
process. The thermophillic phase (over 450C) established after 5 days. This short time period was
due to the generation of heat as a result of aerobic microbial activities on the readily available
organic materials within the compost.
Initial pH values of 5.44 and 5.25 were recorded in compost Bins 1 and 2, respectively (See
Chapter 4; Table 4.1). In the final compost product, pH values were higher (8.17 and 8.18 for
Bins 1 and 2, respectively). Electrical conductivity (EC) values increased during the composting
process from 590 µS/cm to around 700 µS/cm. It is notable that the EC values of the mature
compost in this study were low and far below the Hellenic standard upper limits (4 S/cm)
(Lasaridi et al., 2006). Thus, the product is of sufficient quality to be applied on a wide variety of
sustainable crop cultivations. During the composting process, minor organic matter (OM) loss
was observed in all the experiments resulting in a decrease in VS and TOC throughout the
process, especially during the maturation phase (Table 5.3). Total Kjeldahl nitrogen (TKN)
increased during the composting process in both bins from 1.71% to 3.5%. In general, the
increasing trend of organic nitrogen can be characterized as a concentration effect resulting from
the degradation of organic compounds which decreased the dry matter content. According to
Italian legislation (Legislativo, 2010), if mature compost consists of more than 3% nitrogen it can
be used as a nitrogenous fertilizer. The carbon to nitrogen (C/N) ratio, i.e., the total organic
carbon (TOC) to TKN, has been widely referred (Chowdhury et al., 2013) as an index of compost
stability and maturity. The final C/N ratio for both bins was around 14. Notably, C/N ratios
below 20 characterize mature compost (Chowdhury et al., 2013).
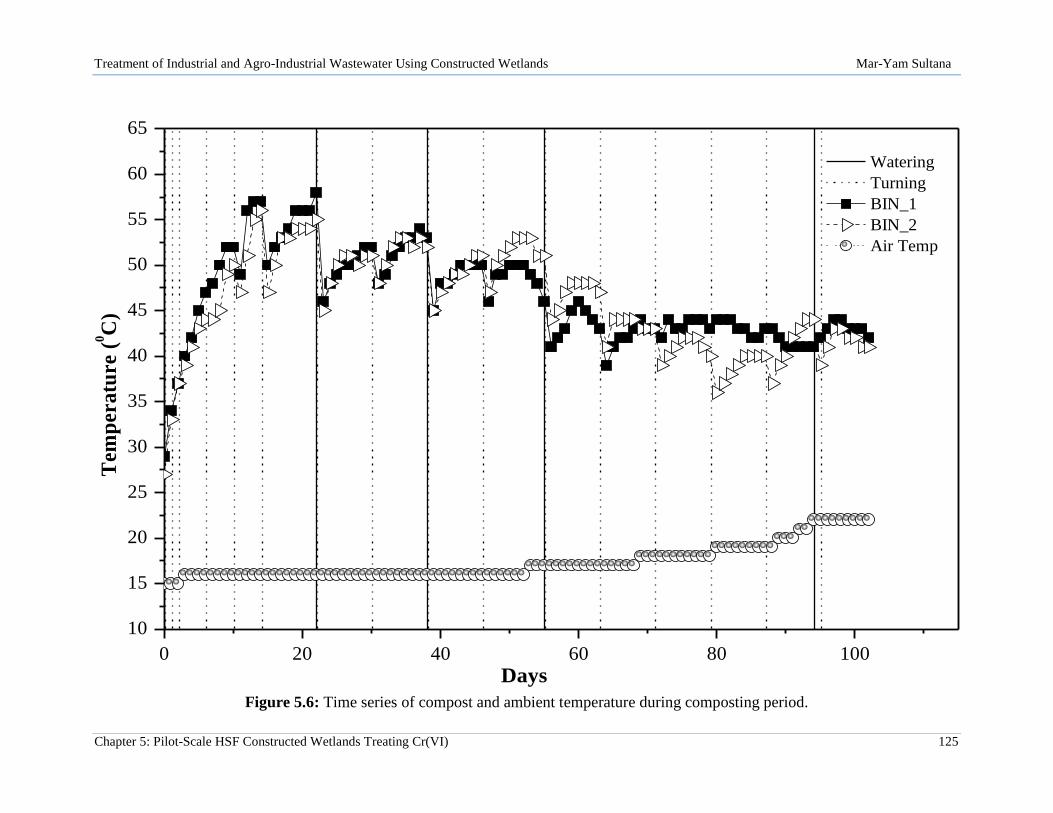
Treatment of Industrial and Agro-Industrial Wastewater Using Constructed Wetlands Mar-Yam Sultana
Chapter 5: Pilot-Scale HSF Constructed Wetlands Treating Cr(VI) 125
0 20 40 60 80 100
10
15
20
25
30
35
40
45
50
55
60
65
T
emp
era
ture
(0C
)
Days
Watering
Turning
BIN_1
BIN_2
Air Temp
Figure 5.6: Time series of compost and ambient temperature during composting period.

Treatment of Industrial and Agro-Industrial Wastewater Using Constructed Wetlands Mar-Yam Sultana
Chapter 5: Pilot-Scale HSF Constructed Wetlands Treating Cr(VI) 126
Total Cr concentration in both bins did not show fluctuations during the composting process. The
limited differences between Cr concentrations at day 0 and at the end of thermophillic and
maturation stage could be attributed to the fact that the samples at day 0 were not well
homogenized. Although the two bins received different amounts of reed biomass, Cr
concentrations in the compost did not present great differences. Furthermore, in final compost
total Cr content was (10 mg/kg dry mass) well below the EU limits (70 mg/kg dry mass) for
organic farming applications (EU, 2004). The mature compost produced in both bins was also
rich in other nutrients (Table 5.3). Due to the presence of high nutrient content these composts
could be used to replenish soils that have been exhausted by intensive cultivation as well as soils
suitable for greenhouse cultivations (Hachicha et al., 2006).
One of the key factors used to assess compost maturity is the phytotoxicity test. The GI values
(Table 5.3) obtained from both bins at the initial stage (day 1) indicated that the initial
composting materials were phytotoxic in nature (72 and 75%, for bins 1 and 2, respectively).
During the composting process a clear decreasing trend in phytotoxicity was observed, as GI
values in the final compost were 157% and 144% in Bins 1 and 2, respectively. The GI values
indicate that the mature compost of the present study is not phytotoxic and therefore it could be
used as a high quality organic soil amender.
Table 5.3: Physicochemical parameters of compost during the composting period.
Initial day End of thermophillic phase End of maturation
Bin(B) 1 2 1 2 1 2
MC (%) 51.9 52.6 50.8 48.7 50.45 48.12
pH 5.44 5.25 7.91 7.81 8.17 8.16
EC (µS/cm) 595 589 625 645 714 637
VS (%) 96.7 97 94.7 94.7 94 94
OM (%) 95.82 96.26 90.99 91.05 88.8 88.1
TOC (%) 55.58 55.83 52.78 52.81 51.5 51.1
TKN (%) 1.71 1.71 3.16 3.02 3.6 3.5
C/N 32.54 32.69 16.68 17.46 14.1 14.7
P (%) 0.09 0.07 0.15 0.16 0.17 0.2
Na (%) 0.07 0.07 0.11 0.14 0.13 0.14
K (%) 0.021 0.02 0.032 0.033 0.037 0.036
GI (%) 75.21 72.09 119.42 129.79 157.48 144.69
MC: Moisture Content, EC: Electrical Conductivity, VS: Volatile Solid, TOC: Total Organic Carbon, TKN: Total
Kjedhal Nitrogen, C/N: Carbon Nitrogen ratio, P: Phosphorus, Na: Sodium, K: Potassium, GI: Germination Index

Treatment of Industrial and Agro-Industrial Wastewater Using Constructed Wetlands Mar-Yam Sultana
Chapter 6: Pilot-Scale HSF Constructed Wetlands Treating Cheese Whey
CHAPTER 6: PILOT-SCALE HSF CONSTRUCTED WETLANDS
TREATING CHEESE WHEY
6.1) Physicochemical Parameters ............................................................................................. 127
6.1.1) pH .................................................................................................................................. 127
6.1.2) EC .................................................................................................................................. 128
6.1.3) DO ................................................................................................................................. 128
6.2) Treatment Efficiency of Pilot-Scale HSF Constructed Wetlands .................................. 128
6.3) Effect of HRT ...................................................................................................................... 132
6.4) Effect of Temperature ........................................................................................................ 136
6.5) Effects of Vegetation ........................................................................................................... 137

Treatment of Industrial and Agro-Industrial Wastewater Using Constructed Wetlands Mar-Yam Sultana
Chapter 6: Pilot-Scale HSF Constructed Wetlands Treating Cheese Whey 127
CHAPTER 6: PILOT-SCALE HSF CONSTRUCTED WETLANDS
TREATING CHEESE WHEY1
6.1) Physicochemical Parameters
Two pilot-scale units (SCW-U and SCW-P) were used to treat secondary cheese-whey (SCW) at
different concentrations of COD with different HRTs. Two identical pilot-scale constructed
wetlands were used and the experiment was run for two years. The main physicochemical
characteristics of diluted cheese whey as influent and the effluents of wastewater (temperature,
pH, electrical conductivity-EC and dissolved oxygen-DO) were monitored and analyzed during
the experiment. Apart from EC, the other parameters did not show any significant variations
between the units, as briefly discussed below. Table 6.1 shows the physicochemical
characteristics of the SCW wastewater.
Table 6.1: Physicochemical characteristics of the SCW wastewater.
CW Position pH EC DO
Mean SD Max Min Mean SD Max Min Mean SD Max Min
CW-U Inlet 5.41 1.1 7.03 3.4 901 321.3 2051 463 4.3 0.3 4.97 3.85
Outlet 6.35 0.3 6.85 4.2 1885 621.1 4070 683 4.25 0.27 4.98 4
CW-P Inlet 5.29 1.1 7.04 3.5 894 315.7 2073 452 4.35 0.46 5.74 4.01
Outlet 6.26 0.2 6.71 5.9 1907 382.7 2090 723 4.6 0.38 5.17 4
6.1.1) pH
Casein precipitation in cheese processing leads to the formation of two types of whey depending
on the pH: acidic whey (pH<5) and sweet whey (pH=6–7) (Panesar et al., 2007). Acidic pH helps
maintain a filamentous biomass (Ghaly, 1996). The low buffering capacity of cheese whey is the
main reason for rapid acidification in biological treatments (Castelló et al., 2009). Secondary
cheese whey has acidic characteristics with pH values within the range of 3–6 (Carvalho et al.,
2013). In this study the pH was found to be almost neutral due to the use of tap water during the
1 Data presented in Sultana et al. (2014c)
Treatment of Industrial and Agro-Industrial Wastewater Using Constructed Wetlands Mar-Yam Sultana
Chapter 6: Pilot-Scale HSF Constructed Wetlands Treating Cheese Whey 128
dilution of SCW. The average influent pH values in the SCW-U and SCW-P units were 5.41 and
5.29, respectively. Mean effluent pH values were 6.35 and 6.26 for SCW-U and SCW-P,
respectively (Table 6.1).
6.1.2) EC
Highly acidic solutions usually have has high EC values (Chegini et al., 2014). For this study, the
mean influent EC values were 901 and 894 µS/cm for SCW-U and SCW-P, respectively, and the
mean effluent EC values were 1885 μS/cm and 1907 μS/cm in SCW-U and SCW-P, respectively.
This slight increase of EC values in the SCW-P could be attributed to the dilution of salts
contained either in the porous media or in plant detritus (Mashauri et al., 2000). Additionally,
warm water holds more ions in solution than cold water. Therefore, the seasonal increase in
ambient temperature increases ET rates, resulting in increased ion concentrations and increased
EC.
6.1.3) DO
A sufficient amount of available free oxygen is essential for good water quality. When
wastewater contains high amounts of organic compounds, microorganisms use more oxygen and
decrease the DO concentration. In this study, DO concentrations did not show any significant
variations between the pilot-scale CW units, as the mean influent concentrations recorded were
4.35 and 4.25 mg/L for SCW-P and SCW-U, and the mean effluent concentrations were 4.35 and
4.60 mg/L for SCW-P and SCW-U, respectively. However, the presence of plants in the wetlands
leads to high DO concentrations during the day as photosynthesis occurs. It should be mentioned
that DO concentrations were always above 3 mg/L in both CW units, indicating the existence of
aerobic conditions.
6.2) Treatment Efficiency of Pilot-Scale HSF Constructed Wetlands
Figure 6.1 presents time series charts for influent and effluent concentrations of COD for both
units. Figure 6.1 also shows plant harvesting events and changes in HRT (vertical solid and
Treatment of Industrial and Agro-Industrial Wastewater Using Constructed Wetlands Mar-Yam Sultana
Chapter 6: Pilot-Scale HSF Constructed Wetlands Treating Cheese Whey 129
dashed lines, respectively). Effluent concentrations were corrected as rainfall and ET volumes
were removed. During the first year, the pilot-scale CWs were operated with HRTs of 8 days, to
avoid plant stress and ensure CW adjustment and mean influent COD concentrations were 2487
and 2650 mg/L for the SCW-P and SCW-U units respectively. Mean COD removal efficiencies
were 76.4% and 71% for SCW-P and SCW-U, respectively. Both SCW-P and SCW-U units
showed similar fluctuations in COD removal efficiency at the beginning of the experiment due to
the CWs commissioning phase (Kadlec and Wallace, 2009), and also during autumn and winter,
when ambient temperatures decreased. Intense fluctuations of COD removal efficiencies were
observed in both units when HRTs were altered. Nevertheless, steady-state conditions quickly
reestablished in both units.
During the second year of operation both CW units were operated under different HRTs (i.e., 8,
4, 2 and 1 day) to assess the effect of HRT on COD removal. Furthermore, the effect of COD
influent concentration was also investigated by using two different influent concentrations (2500
and 5000 mg/L). Mean COD removal efficiencies of 91% and 76% were recorded in SCW-P and
SCW-U, respectively, and both units achieved COD removal efficiencies of up to 100%. SCW-U
presented the highest COD removal efficiencies when the COD influent concentration was 2500
mg/L and HRT was 4 days (94.24%) and 8 days (96.84%) (Fig. 6.1a). SCW-U effluent
concentrations increased mainly when ambient temperatures were low and at low HRTs (2 and 1
day) (Fig. 6.1a).
In the SCW-P unit, COD removal remained high for the majority of the operation period and
decreased only after plant harvesting (Fig. 6.1b). However, the reed plants re-generated quickly
after harvesting and the removal efficiency in the planted unit increased to 100% in less than two
months (Fig 6.1a). SCW-P presented high COD removal efficiencies for almost all the HRTs
applied, while it decreased only when HRT was limited to 1 day (Fig. 6.1b). It should be
mentioned that under steady-state conditions the effluent values always satisfied the permitted
EU discharge limit (120 mg/L) for surface waters (Directive 91/271/EEC). SCW-P performance
was also affected by influent concentration, as COD removal efficiency decreased when COD
influent concentration exceeded 3500 mg/L, resulting in effluent concentrations that exceeded
legislation limits.
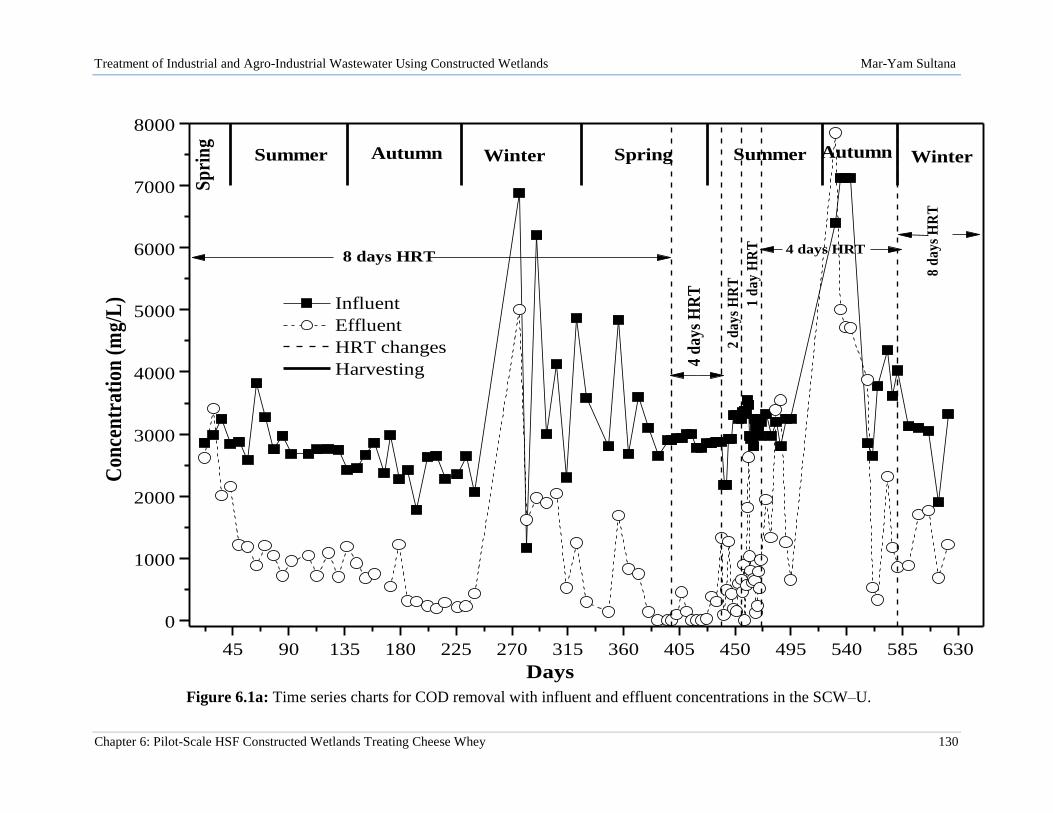
Treatment of Industrial and Agro-Industrial Wastewater Using Constructed Wetlands Mar-Yam Sultana
Chapter 6: Pilot-Scale HSF Constructed Wetlands Treating Cheese Whey 130
45 90 135 180 225 270 315 360 405 450 495 540 585 630
0
1000
2000
3000
4000
5000
6000
7000
8000C
once
ntr
atio
n (
mg/
L) Influent
Effluent
HRT changes
Harvesting
Days
8 days HRT
4 d
ays
HR
T
2 d
ay
s H
RT
1 d
ay
HR
T 4 days HRT
8 d
ay
s H
RT
Sp
rin
g
Summer Autumn Winter Spring Summer Autumn Winter
Figure 6.1a: Time series charts for COD removal with influent and effluent concentrations in the SCW–U.

Treatment of Industrial and Agro-Industrial Wastewater Using Constructed Wetlands Mar-Yam Sultana
Chapter 6: Pilot-Scale HSF Constructed Wetlands Treating Cheese Whey 131
45 90 135 180 225 270 315 360 405 450 495 540 585 630
0
1000
2000
3000
4000
5000
6000
7000
8000C
once
ntr
atio
n (
mg/
L) Influent
Effluent
HRT changes
Harvesting
Days
8 days HRT
4 d
ay
s H
RT
2 d
ay
s H
RT
1 d
ay
HR
T
4 days HRT
8 d
ay
s H
RT
WinterAutumnSummerSpringWinterAutumnSummer
Sp
rin
g
Figure 6.1b: Time series charts for COD removal with influent and effluent concentrations in the SCW-P.

Treatment of Industrial and Agro-Industrial Wastewater Using Constructed Wetlands Mar-Yam Sultana
Chapter 6: Pilot-Scale HSF Constructed Wetlands Treating Cheese Whey 132
Organic matter in CWs is removed either by settlement and filtration (particulate organic matter)
or by aerobic and anaerobic degradation (soluble organic matter) (Akratos and Tsihrintzis, 2007;
Cooper et al., 1996; Stefanakis et al., 2014). As the SCW was diluted with tap water before being
introduced into the pilot-scale units, the particulate organic matter fraction was limited.
Therefore, the removal of organic matter by suspended solids settlement was also limited. It can
thus be concluded that organic matter in both pilot-scale CWs was removed through microbial
activity. Since DO concentrations were constantly above 3 mg/L (Table 6.1) aerobic degradation
was the main removal mechanism for organic matter in the present pilot-scale CWs.
6.3) Effect of HRT
To assess the effects of HRT on COD removal, four different HRTs were applied in the pilot-
scale units (8, 4, 2 and 1 day). Furthermore, COD influent concentrations varied from 1200 to
7200 mg/L and also affected COD removal efficiencies. The use of different HRTs and COD
influent concentrations affected pollutant surface load rate (SLR), which ranged from 19.39 to
770 gr/m2/d for SCW-U and from 11.34 to 620 gr/m
2/d for SCW-P. The removed organic load
ranged from 5.63 to 357.8 gr/m2/d (mean value 92.8 gr/m
2/d) for SCW-U and from 2.19 to
362.63 gr/m2/d (mean value: 120.1 gr/m
2/d) for SCW-P. Figure 6.2 presents correlation charts for
influent COD surface load and removal efficiency. SCW-P showed a slight decrease in COD
removal efficiency with increased SLR, while COD removal efficiency in SCW-U increased
slightly with SLR (Fig. 6.2a). However, in both units, removal efficiency did not vary
significantly with SLR when influent concentrations ranged 1200 to 7200 mg/L. Regardless of
the SLR, more than 60% of COD was removed in the SCW-U, while in SCW-P, COD removal
was very high (>90%) with same load. It should be noted that the CWs units used in this
experiment achieved extremely high COD removal efficiencies (up to 100%), while receiving
among the highest COD influent concentrations (from 1200 to 7200 mg/L) and operating under
the lowest HRT (2 days) ever reported in the literature (Table 6.2).

Treatment of Industrial and Agro-Industrial Wastewater Using Constructed Wetlands Mar-Yam Sultana
Chapter 6: Pilot-Scale HSF Constructed Wetlands Treating Cheese Whey 133
0 100 200 300 400 500 600 700 800
-60
-40
-20
0
20
40
60
80
100
120
R
emov
al %
Surface load (gr/m2/day)
Figure 6.2a: Correlation of surface load and removal rates for COD in the SCW-U.

Treatment of Industrial and Agro-Industrial Wastewater Using Constructed Wetlands Mar-Yam Sultana
Chapter 6: Pilot-Scale HSF Constructed Wetlands Treating Cheese Whey 134
0 100 200 300 400 500 600 700 800
0
20
40
60
80
100
120
Rem
oval
(%
)
Surface load (gr/m2/day)

Treatment of Industrial and Agro-Industrial Wastewater Using Constructed Wetlands Mar-Yam Sultana
Chapter 6: Pilot-Scale HSF Constructed Wetlands Treating Cheese Whey 135
Figure 6.2b: Correlation of surface load and removal rates for COD in the SCW-P.
Table 6.2: Treatment of dairy wastewaters using different types of CWs.
Reference CW area
(m2)
Wastewater
type
HRT
(days)
CW
type
Inlet concentration of
organic matter, mg/L
Plants
Removal %
COD BOD COD BOD
Dipu et al., 2010 - Dairy 5-15 FWS 2920 1300 Typha spp., Eichhornia sp., Salvinia
sp., Pistia sp.
72 77
Idris et al., 2012 1.28 Dairy
processing
factory
- HSF - 24.4 Arundo donax, Phragmites australis - 65
Mantovi et al., 2003 75 Dairy and
domestic
sewage
11 HSF 1200 450 Phragmites australis >90 >90
Jamieson et al.,
2007
100 Livestock 90 FWS - 1747 Typha latifolia, Lemna spp. - 98
Tanner et al., 1995 19 Farm 7, 5.5, 3, 2 HSF - 57-200 Schoenoplectus validus - 50-80
Schaafsma et al.,
2000
500 Dairy farm 42 FWS - 1913.9 Typha latifolia, Scirpus
tabernaemontani,
Litaneutria minor
- 97
Dunne et al., 2005 4265 Dairy farmyard - FWS - 2500 Carex riparia, Typha latifolia,
Phragmites australis, Sparganium
erectum, Glyceria fluitans,
Iris pseudacorus, Phalaris
arundinaceae, Alisma plantago-
aquatica
- 99
Sharma et al., 2013a 500 Milking parlor - Hybrid SSF 1395-1637 3749-4988 Phragmites australis >89 >89
Comino et al., 2011 703.9 Cheese factory 4-15 Hybrid 2000 1000 Phragmites australis 80 80
Mantovi et al., 2011 2700 Cheese factory - HSF 938 595 Typha latifolia >95 >95
Sultana et al., 2014c
(Present study)
0.86 Cheese whey 2-8 HSF 1200-7200 - Phragmites australis 91
Treatment of Industrial and Agro-Industrial Wastewater Using Constructed Wetlands Mar-Yam Sultana
Chapter 6: Pilot-Scale HSF Constructed Wetlands Treating Cheese Whey 136
Table 6.3: Comparison of COD removal rates with different HRTs.
Time period HRT
(days)
COD feed
concentration
(mg/L)
Ambient
temperature
(oC)
COD removal (%)
SCW-U unit SCW-P unit
Mean SD Mean SD Mean SD
26/04/12-09/05/12 8 2900 21.8 1.0 100 1.57 100 2.99
23/05/12-10/06/12 4 2950 23.3 2.3 94.24 17.85 100 1.22
13/06/12-25/06/12 2 2925 28.0 1.5 85.6 13.1 100 1.02
27/06/12-04/07/12 1 3250 27.9 0.4 76.28 23.89 76 11.38
One-way ANOVA analysis was performed to statistically assess the effect of HRT on CW
efficiency. The data used for this comparison were taken from periods where temperature values
were not significantly different (p value = 0.876>0.05). The concentration of COD feed was
almost identical, thus indicating only the effect of HRT (Table 6.3). One-way ANOVA results
showed that for HRTs of 8 to 2 days no significant differences in COD removal were observed
for SCW-P (p value ranged from 0.986 to 0.999>0.05) and SCW-U (p ranged from 0.215 to
0.969>0.05) units. However, HRTs of 1 day significantly affect COD removal efficiency as “p”
values were below 0.05 for SCW-P (p value = 0.000) and SCW-U (p value = 0.003-0.009). Thus,
an HRT of 1 day limits organic matter removal as COD removal efficiency was decreased to
approximately 70% in both pilot-scale units. Nevertheless, the CW pilot-scale units proved to be
rather efficient at organic matter removal with very low HRTs (down to 2 days).
6.4) Effect of Temperature
Temperature has been shown to affect organic matter removal in CWs as it influences both
microbial activity and plant function (Akratos and Tsihrintzis, 2007; Taylor et al., 2011). The
effect of temperature on COD removal was assessed statistically as experimental data for HRTs
of 4 days were divided into two groups: one above and one below 150C, as this temperature value
is reported to be crucial for microorganism and vegetation performance (Akratos and Tsihrintzis,
2007). Both units showed different COD removal efficiencies for temperatures above (95% for
SCW-U and 97.6% for SCW-P) and below (60.8% for SCW-U and 90.3 for SCW-P) 15oC. One-
way ANOVA analysis showed that although organic matter removal was significantly affected by

Treatment of Industrial and Agro-Industrial Wastewater Using Constructed Wetlands Mar-Yam Sultana
Chapter 6: Pilot-Scale HSF Constructed Wetlands Treating Cheese Whey 137
temperature in SCW-U (p value =0.00<0.05), it was not significantly affected in the SCW-P unit
(p value =0.378>0.05).
The significant effect of temperature on COD removal in the SCW-U unit occurred because
microbial activity was limited in this unit. On the other hand, COD removal efficiency in SCW-P
was not significantly affected by temperature, proving that plants have the capacity to enhance
COD removal all year round as the rhizosphere not only stimulates the microbial community but
also provides increased surface area for microbial growth and activity (Gerberg et al., 1986).
Comino et al. (2011) used constructed wetlands to treat cheese whey wastewater and reported
that low temperatures did not affect organic matter removal. On the contrary, other studies (Kern
2003; Sharma et al., 2013a) report that COD removal efficiency was significantly affected by
temperature. However, it should be noted that these studies were conducted in areas with cold
climates (below 5oC). In the present research, COD removal in SCW-P was limited only
following plant harvesting, thus indicating that the reed vegetation was crucial for efficient CW
operation. Therefore, the experimental results revealed that plants play a key role in maintaining
high COD removal rates even at low temperatures or in cold seasons.
6.5) Effects of Vegetation
Vegetation plays an important role on CW performance as it provides large surface areas for
microbial growth and transports oxygen from the leaves to the roots, which is then used by the
microorganisms to oxidize organic compounds (Vymazal and Kropfelova, 2009). Although
vegetation effect on COD removal in HSF CW has been studied by many research groups
(Tanner, 2001; Vymazal and Kropfelova, 2009; Kaseva 2004; Akratos and Tsihrintzis, 2007;
Brisson and Chazarenc, 2009), the precise contribution of plant vegetation remains a
controversial issue.
The planted and unplanted pilot-scale units presented different organic matter removal
performances, as mean COD removal efficiencies were 83% for SCW-P and 70% for SCW-U.
To examine the effect of vegetation on COD removal, a paired t-test was performed to determine
statistical significance at the 95% confidence level. Results revealed that vegetation significantly

Treatment of Industrial and Agro-Industrial Wastewater Using Constructed Wetlands Mar-Yam Sultana
Chapter 6: Pilot-Scale HSF Constructed Wetlands Treating Cheese Whey 138
affected COD removal as the confidence interval was (7, 18), indicating that COD removal
efficiencies between SCW-P and SCW-U were significantly different. The effects of vegetation
were also observed during the autumn of the second year, when the units were operated again
under 4 days HRT receiving wastewater with COD influent concentrations of approximately
2500 mg/L. During this period, COD removal efficiency in SCW-P was limited to 80% compared
to the 100% removal efficiency achieved in the spring of the same year. This phenomenon could
only be attributed to plant senescence. The effect of vegetation on COD removal could be
attributed to enhanced oxygen release from the root zone, as secondary cheese whey mainly
contains easily biodegradable organic substances.
Based on the above results, some initial design guidelines can be given for CW units treating
secondary cheese whey: a) constructed wetlands treating secondary cheese whey should operate
with HRTs not less than 2 days in order to successfully remove organic matter, b) COD influent
concentrations also should be taken into consideration and should not exceed 3500 mg/L in order
to avoid effluent concentrations above legislation limits. If the constructed wetland receives
higher COD influent concentrations, then it should be operated with HRTs greater than 8 days,
and c) a CW treating secondary cheese whey could safely remove 120 gr/m2/d of COD. The use
of the removed organic matter load as design guideline is safer, as it avoids the limitation of the
different characteristics of secondary cheese whey.

Treatment of Industrial and Agro-Industrial Wastewater Using Constructed Wetlands Mar-Yam Sultana
Chapter 7: Combined Treatment of Cr(VI) and Cheese Whey in Pilot-Scale HSF Constructed Wetlands
CHAPTER 7: COMBINED TREATMENT OF CR(VI) AND CHEESE
WHEY IN PILOT-SCALE HSF CONSTRUCTED WETLANDS
7.1) Physicochemical Parameters ............................................................................................. 139
7.1.1) pH .................................................................................................................................. 139
7.1.2) EC .................................................................................................................................. 141
7.2) Removal Efficiency of Cr(VI) in Four Pilot-Scale HSF Constructed Wetlands with Co-
Treated Wastewaters ................................................................................................................. 141
7.2.1) Effect of vegetation on Cr(VI) removal ........................................................................ 147
7.2.2) Effect of HRTs on Cr(VI) removal ............................................................................... 153
7.2.3) Comparison with experimental results of the first operational period .......................... 154
7.3) Removal Efficiency of COD in Four Pilot-Scale HSF Constructed Wetlands with Co-
Treated Wastewaters ................................................................................................................. 155
7.3.1) Effect of vegetation on COD removal ........................................................................... 160
7.3.2) Effect of HRTs on COD removal .................................................................................. 162
7.3.3) Comparison with experimental results of the first operational period .......................... 167

Treatment of Industrial and Agro-Industrial Wastewater Using Constructed Wetlands Mar-Yam Sultana
Chapter 7: Combined Treatment of Cr(VI) and Cheese Whey in Pilot-Scale HSF Constructed Wetlands 139
CHAPTER 7: COMBINED TREATMENT OF CR (VI) AND CHEESE
WHEY IN PILOT-SCALE HSF CONSTRUCTED WETLANDS
7.1) Physicochemical Parameters
Integrated treatment of cheese whey and Cr(VI) wastewaters was performed in four pilot-scale
constructed wetlands. The physicochemical parameters of all the units did not show any
significant variations (Table 7.1). The temperature of the effluent ranged from 5 to 33°C,
depending on the season.
Table 7.1: Physicochemical characteristics of co-treated wastewaters (mixed) cheese whey and
Cr(VI) solution.
pH EC
Mean SD Max. Min. Mean SD Max. Min.
SCW-U Inlet 6.95 0.519 7.66 4.39 660 69 790 527
Outlet 6.50 0.45 7.40 6.15 1054 422 1969 370
SCW-P Inlet 6.90 0.53 7.39 4.16 651 80 810 517
Outlet 6.39 0.49 7.45 6.00 724.5 456 1820 208
Cr-U Inlet 7.04 0.45 7.53 6.25 618 410 1320 331
Outlet 6.98 0.42 7.62 5.74 470.5 351 1708 205
Cr-P Inlet 7.04 0.44 7.60 6.05 612 426 1369 340
Outlet 6.66 0.469 7.59 6.02 564 452.44 1886 450
7.1.1) pH
pH is the most important factor governing metal speciation, solubility, transport and
bioavailability of metals in aqueous solutions. The effect of pH on heavy metal availability in
plants has been reported by many researchers and it is accepted that when pH decreases, the
solubility of cationic forms of metals in the soil increases and they become more readily available

Treatment of Industrial and Agro-Industrial Wastewater Using Constructed Wetlands Mar-Yam Sultana
Chapter 7: Combined Treatment of Cr(VI) and Cheese Whey in Pilot-Scale HSF Constructed Wetlands 140
to plants (Evans et al., 1995). pH affects both solubility of metal hydroxide minerals and
adsorption-desorption processes. Presence of organic matter in aqueous solutions plays an
important role in metal binding, as organic carbon compounds influence metal leaching. Fotovat
et al. (1996), reported that heavy metals solubility may be influenced by the presence of OC.
However, the pilot units used to treat SCW during the first operational period, did not show any
significant variation in pH in the second experimental period with an average value of pH 6.9 in
the influent and 6.39 in the effluent for the SCW-P unit. The mean pH was 6.95 in the influent
and 6.5 in the effluent of the SCW-U unit (Table 7.1). During the first experimental period, these
two units were treated only with SCW and the mean pH value recorded was almost near to
neutral. In the second experimental period, the pH values of SCW-U and SCW-P were also found
to be near neutral as tap water was used to dilute the SCW. No significant variations were
recorded in the Cr-P with average influent and effluent values of 7.04 at influent and 6.66
respectively. For Cr-U, the mean pH was 7.04 in the influent and 6.98 in the effluent (Table 7.1).
In the first experimental period, the latter two units were used to treat only Cr(VI) solution and
the pH was found near to neutral (around 7). However, in the second experimental period,
influent and effluent pH values were also found to be near neutral. These pH values could
promote Cr(VI) adsorption/precipitation on the gravel bed system, as when pH increases OH-
compete with chromate ions (CrO42-
). OH- ions become the dominant specie at higher pH values
(>6), but adsorption ceases at pH >9 (Baral et al., 2006). Moreover, Kongroy et al. (2012)
reported that Cr accumulation in sediment could be due to precipitation under high pH condition
(pH= 8-9).
Several researchers have reported that there is no significant effect of pH in the presence of
organic matter on the adsorption of Cr(VI) (Rai et al., 1989; Zachara et al., 1989). Organic matter
has a relatively high proportion of negatively charged binding sites. pH can influence the
effectiveness of the cation exchange capacity of sediments because the negatively charged
binding sites will be occupied by a high number of sodium or hydrogen cations (Knight et al.,
1999). Moreover, when organic matter mineralization occurs, it increases CO2 levels in water
which in turn decreases the pH value at effluent (Maine et al., 2007). Abdulla et al. (2010) found
that COD removal was optimum when the pH ranged 6.6 to 8. Song et al. (2003) also observed
that COD removal rates decrease when pH is lower than 5.0 or higher than 8.5. Maine et al.

Treatment of Industrial and Agro-Industrial Wastewater Using Constructed Wetlands Mar-Yam Sultana
Chapter 7: Combined Treatment of Cr(VI) and Cheese Whey in Pilot-Scale HSF Constructed Wetlands 141
(2006), Qian et al. (2012) and Calheiros et al. (2007), also found similar pH ranges as these found
in this study. Therefore, may be concluded that this pH value also enhanced the removal rate of
COD in CWs.
7.1.2) EC
The pilot-scale CWs units that were used to treat cheese whey during the first experiment, did not
show any significant variation in EC in the second experiment. The mean influent value of EC
was 651 µS/cm and the mean effluent value was 724.5 µS/cm in the planted pilot-scale
constructed wetland (SCW-P). The average electrical conductivity in the un-planted pilot-scale
constructed wetland (SCW-U) was 660 µS/cm at the influent and 1054 µS/cm at the effluent
point. This variation in EC value is occurred probably because of high ET, which leads to
wastewater condensation.
The Cr-P pilot units used to treat Cr(VI) in the first experimental period, did not show any
significant variation in EC. In the second operation period, the same unit (Cr-P) also did not show
any significant variation in EC as a mean influent value of 612 µS/cm was recorded and the
average effluent value was 564 µS/cm. The average EC recorded in the Cr-U was 618 µS/cm at
the influent and 470.5 µS/cm at the effluent point in the second experimental period (Table 7.1).
The EC values recorded here were lower than those of other studies as a synthetic wastewater
solution was used which was diluted with tap water, whereas in other studies (Dotro et al., 2012;
Maine et al., 2006) real wastewater was used.
7.2) Removal Efficiency of Cr(VI) in Four Pilot-Scale HSF Constructed
Wetlands with Co-Treated Wastewaters
Figures 7.1a and b present time series charts of influent and effluent concentrations of Cr(VI) for
SCW-U and SCW-P. The effluent concentrations were corrected by removing rainfall and ET
(See Section 4.1.5). The SCW-U and SCW-P units, did not show any difference in Cr(VI)
removal as the average removal rate is 100% almost all year round. It should be noted that during
the first operational period, these two pilot-scale units treated only diluted SCW. Therefore, they
showed great adaptability to co-treating both cheese whey and Cr(VI).

Treatment of Industrial and Agro-Industrial Wastewater Using Constructed Wetlands Mar-Yam Sultana
Chapter 7: Combined Treatment of Cr(VI) and Cheese Whey in Pilot-Scale HSF Constructed Wetlands 142
0 30 60 90 120 150 180 210 240
0
1
2
3
4
5
6
C
on
cen
tra
tio
n (
mg
/L)
Days
Influent
Effluent
HRT alteration
Spring Summer Autumn
8 days HRT
4 days HRT
Figure 7.1a: Time series charts for Cr(VI) removal with influent and effluent concentrations in the SCW-U unit.
Treatment of Industrial and Agro-Industrial Wastewater Using Constructed Wetlands Mar-Yam Sultana
Chapter 7: Combined Treatment of Cr(VI) and Cheese Whey in Pilot-Scale HSF Constructed Wetlands 143
0 30 60 90 120 150 180 210 240
0
1
2
3
4
5
6
Influent
Effluent
HRT alteration
Co
nce
ntr
ati
on
(m
g/L
)
Days
Spring Summer Autumn
8 days HRT
4 days HRT
Figure: 7.1b Time series charts for Cr(VI) removal with influent and effluent concentrations in the SCW-P unit.

Treatment of Industrial and Agro-Industrial Wastewater Using Constructed Wetlands Mar-Yam Sultana
Chapter 7: Combined Treatment of Cr(VI) and Cheese Whey in Pilot-Scale HSF Constructed Wetlands 144
0 30 60 90 120 150 180 210 240
0
1
2
3
4
5
6
Influent
Effluent
HRT alteration
Co
nce
ntr
ati
on
(m
g/L
)
Days
8 days HRT
4 days HRT
AutumnSummerSpring
Figure 7.2a: Time series charts for Cr(VI) removal with influent and effluent concentrations in the Cr-U unit.
Treatment of Industrial and Agro-Industrial Wastewater Using Constructed Wetlands Mar-Yam Sultana
Chapter 7: Combined Treatment of Cr(VI) and Cheese Whey in Pilot-Scale HSF Constructed Wetlands 145
0 30 60 90 120 150 180 210 240
0
1
2
3
4
5
6
Influent
Effluent
HRT alteration
Co
nce
ntr
ati
on
(m
g/L
)
Days
Spring Summer Autumn
8 days HRT
4 days HRT
Figure 7.2b: Time series charts for Cr(VI) removal with influent and effluent concentrations in the Cr-P unit.

Treatment of Industrial and Agro-Industrial Wastewater Using Constructed Wetlands Mar-Yam Sultana
Chapter 7: Combined Treatment of Cr(VI) and Cheese Whey in Pilot-Scale HSF Constructed Wetlands 146
The performance of a CW depends on the complete development of the root-rhizome area and the
microbial activity in the system. Plants emit oxygen from their roots into the rhizosphere which is
very significant in CWs as it permits the aerobic degradation of substances and nitrification
(Brix, 1994). Different retention mechanisms depend on the oxygen concentration of the wetland
but metals are retained in its vegetation (Maine et al., 2006). Maine et al. (2005), reported that
when oxygen concentration ranged between 0-10.6 mg/L in their pilot-scale study, metals co-
precipitated with iron and were retained in the wetland’s sediment. On the other hand, in their
full-scale study (Maine et al., 2006) observed that when the oxygen concentration ranged
between 0-7.1 mg/L, metal precipitation was prevented. The extensive root systems of
macrophytes release oxygen into the rhizosphere and enhance the precipitation of Fe to form
iron-plaque (Otte et al., 1995). Metal accumulation in the iron-plaque is due to the metal binding
affinity to iron oxyhydroxides (Otte et al., 1995). Therefore, metals like Cr(VI) may either be
directly sorbed by the plants from the wastewater solution or co-precipitated with Fe onto plants
roots.
According to above description, the similar behavior was also observed in the other two pilot
units (Cr-P and Cr-U) in removing Cr(VI) (Figs. 7.2a & b), where the average removal rate was
100% for both units. In the first experimental period, the Cr-P unit showed the high efficiency
while the removal rate in Cr-U was lower. In the second experimental period when SCW was
introduced into the Cr-U, the removal efficiency of Cr(VI) was almost 100% all the year round.
However, Cr(VI) removal was not only due to absorption by plant biomass but also due to
microbial activity, since the microorganisms developed adequately due to the presence of
nutrients in the SCW. Moreover the acidic nature of the SCW (Carvalho et al., 2013) promoted
the growth of filamentous biomass (Ghaly, 1996). Most microorganisms grow best at neutral pH
(7.0) (Hamad, 2012). Bacterial metabolic activity increases when pH range is between 3.5 and
5.5 (Cimino and Caristi, 1990) but Beaubien & Jolicoeur (1984) reported that bacterial growth of
generally occurs in neutral to slightly acidic conditions. In this study the mean pH value was
found to be near neutral, therefore the pH promoted microbial growth and participated in Cr(VI)
removal mechanisms. The gravel bed system also assisted Cr(VI) removal by various
mechanisms including co-precipitation, sorption and ion exchange (Marchand et al., 2010).

Treatment of Industrial and Agro-Industrial Wastewater Using Constructed Wetlands Mar-Yam Sultana
Chapter 7: Combined Treatment of Cr(VI) and Cheese Whey in Pilot-Scale HSF Constructed Wetlands 147
Additionally, Dotro et al. (2009) state that gravel media dominates Cr removal through sorption
to iron oxides and co-precipitation of iron phases with available Cr.
7.2.1) Effect of vegetation on Cr(VI) removal
CW vegetation plays an important role in Cr removal as it (a) releases root exudates which may
directly or indirectly impact metal mobility and toxicity; (b) provides large surface area for
microbial growth, (c) accumulates Cr in its tissues (Cheng et al., 2002; Southichak et al., 2006;
Zhang et al., 2010). The presence of vegetation in CWs is very important for the treatment of
Cr(VI) because it can also slow down the flow rates in the wetland, so that metals have more time
to be absorbed and precipitated (Maine et al., 2007). The main removal processes of Cr(VI) by
plants are adsorption, chelation and ion exchange. Zayed and Terry (2003) and Yadav et al.
(2005), stated that Cr ions have the ability to bind or precipitate in the cell walls of plant tissue
which also limits their translocation. Hence, vegetation is essential for the treatment of Cr in
CWs.
Of the four pilot-scale HSF CWs used in this experiment, Cr-U and Cr-P had already been used
to treat Cr(VI), while SCW-U and SCW-P had been used for SCW treatment. During the second
operational period the CWs were used to co-treat Cr(VI) and SCW. SCW was used due to its
nutritional value as it contains lactose, proteins, calcium, nitrogen and phosphorus
(Chatzipaschali and Stamatis 2012; Prazeres et al., 2012). Therefore, due to the use of this mixed
wastewater of SCW and Cr(VI), rapid growth of plants and increased microbial activity were
anticipated. As the Cr(VI) removal rate was 100% in both planted units all year round, reed
plants seemed the best vegetation for this integrated experiment since they survived until the end
of the studied period without showing any symptoms of toxicity. Choo et al. (2006), reported that
metal ions can be strongly absorbed by root cells via plasmalemma and also adsorbed by cell
walls via passive diffusion in the roots of aquatic plants. Organic acids deriving from root
extracts also form complexes with Cr and could lead to increased plant uptake (Bartlett and
James 1988; Srivastava et al., 1998). The channel of Cr transportation is a working mechanism
which involves essential anion carriers, such as sulfate (Cervantes et al., 2001).

Treatment of Industrial and Agro-Industrial Wastewater Using Constructed Wetlands Mar-Yam Sultana
Chapter 7: Combined Treatment of Cr(VI) and Cheese Whey in Pilot-Scale HSF Constructed Wetlands 148
As microorganisms are also an imperative part of CW function, it can be assumed that they had
an affect on the mobilization and bioavailability of Cr(VI) throughout the experiment period. As
the aerial parts of the reed plants grew vigorously during the treatment period, the belowground
part also grew and filled the wetland units (Fig. 7.3). The root zone is the most active microbe-
metal interaction zone in CWs. Extensive root systems also support symbiotic root-colonizing
bacteria and fungi and ultimately play a protective role by mitigating metal toxicity (Marchand et
al., 2010). They also increase the efficiency of phytoremediation by accumulating metals in the
plant tissues (de Souza et al., 1999; Marchand et al., 2010). Moreover, the continuous feeding of
the pilot units with mixed wastewater boosted plant growth and ratified the microorganisms for
their proper function.
Figure 7.3: Belowground parts of reed plants.
Treatment of Industrial and Agro-Industrial Wastewater Using Constructed Wetlands Mar-Yam Sultana
Chapter 7: Combined Treatment of Cr(VI) and Cheese Whey in Pilot-Scale HSF Constructed Wetlands 149
0,00 0,05 0,10 0,15 0,20
0
10
20
30
40
50
60
70
80
90
100
110
120
R
emo
va
l (%
)
Surface load (gr/m2/day)
Figure 7.4a: Effect of surface load on Cr(VI) removal in the SCW-U unit.
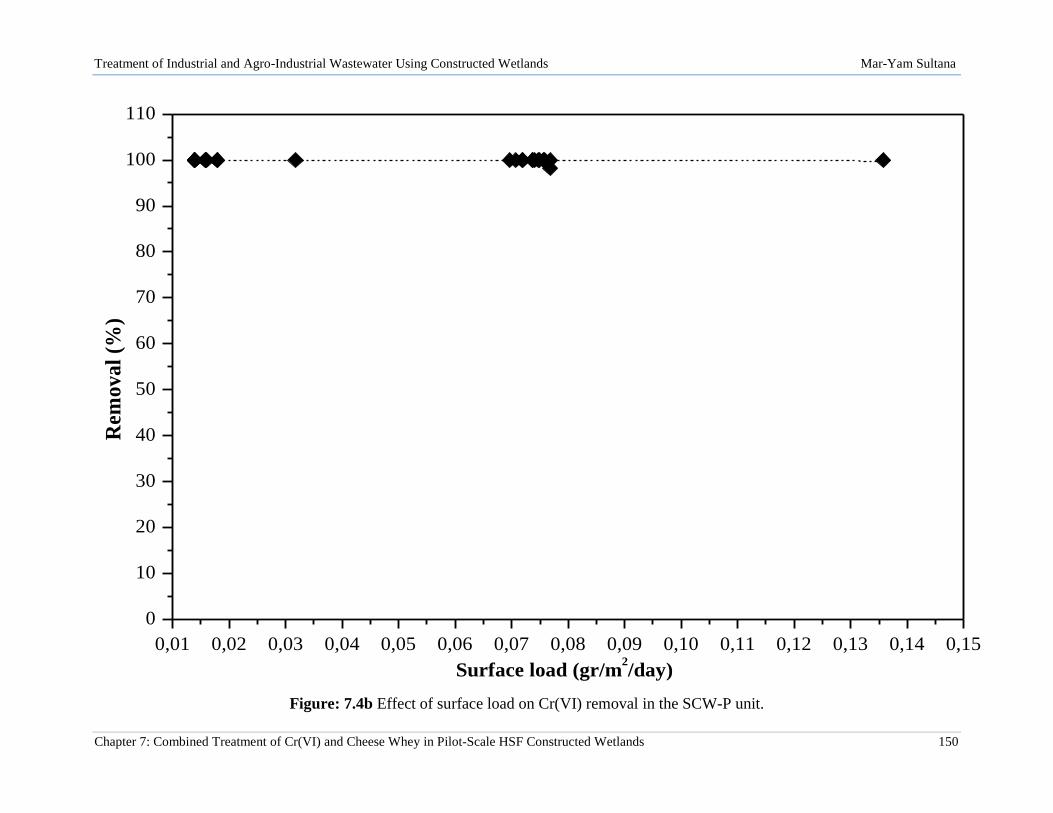
Treatment of Industrial and Agro-Industrial Wastewater Using Constructed Wetlands Mar-Yam Sultana
Chapter 7: Combined Treatment of Cr(VI) and Cheese Whey in Pilot-Scale HSF Constructed Wetlands 150
0,01 0,02 0,03 0,04 0,05 0,06 0,07 0,08 0,09 0,10 0,11 0,12 0,13 0,14 0,15
0
10
20
30
40
50
60
70
80
90
100
110R
emo
va
l (%
)
Surface load (gr/m2/day)
Figure: 7.4b Effect of surface load on Cr(VI) removal in the SCW-P unit.

Treatment of Industrial and Agro-Industrial Wastewater Using Constructed Wetlands Mar-Yam Sultana
Chapter 7: Combined Treatment of Cr(VI) and Cheese Whey in Pilot-Scale HSF Constructed Wetlands 151
0,05 0,06 0,07 0,08 0,09 0,10 0,11 0,12 0,13 0,14
0
10
20
30
40
50
60
70
80
90
100
110R
emo
va
l (%
)
Surface load (gr/m2/day)
Figure 7.5a: Effect of surface load on Cr(VI) removal in the Cr-U unit.

Treatment of Industrial and Agro-Industrial Wastewater Using Constructed Wetlands Mar-Yam Sultana
Chapter 7: Combined Treatment of Cr(VI) and Cheese Whey in Pilot-Scale HSF Constructed Wetlands 152
0,05 0,06 0,07 0,08 0,09 0,10 0,11 0,12 0,13 0,14 0,15
0
10
20
30
40
50
60
70
80
90
100
110R
emo
va
l (%
)
Surface load (gr/m2/day)
Figure 7.5b: Effect of surface load on Cr(VI) removal in the Cr-P unit
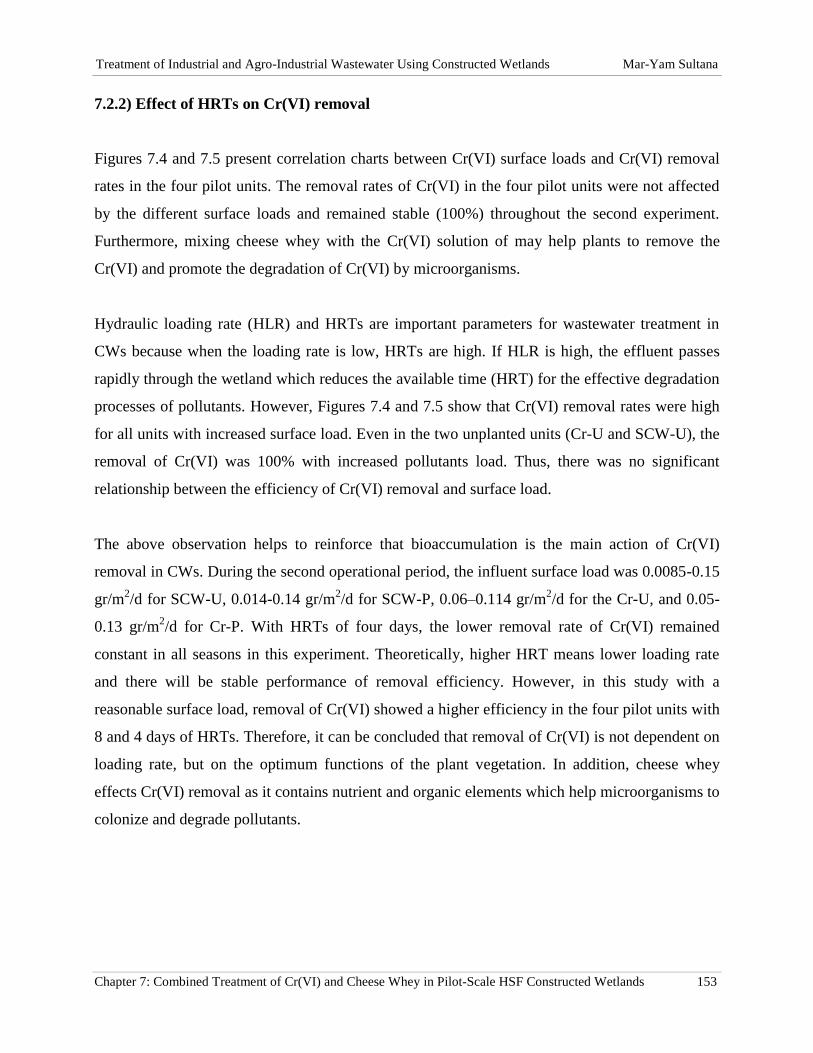
Treatment of Industrial and Agro-Industrial Wastewater Using Constructed Wetlands Mar-Yam Sultana
Chapter 7: Combined Treatment of Cr(VI) and Cheese Whey in Pilot-Scale HSF Constructed Wetlands 153
7.2.2) Effect of HRTs on Cr(VI) removal
Figures 7.4 and 7.5 present correlation charts between Cr(VI) surface loads and Cr(VI) removal
rates in the four pilot units. The removal rates of Cr(VI) in the four pilot units were not affected
by the different surface loads and remained stable (100%) throughout the second experiment.
Furthermore, mixing cheese whey with the Cr(VI) solution of may help plants to remove the
Cr(VI) and promote the degradation of Cr(VI) by microorganisms.
Hydraulic loading rate (HLR) and HRTs are important parameters for wastewater treatment in
CWs because when the loading rate is low, HRTs are high. If HLR is high, the effluent passes
rapidly through the wetland which reduces the available time (HRT) for the effective degradation
processes of pollutants. However, Figures 7.4 and 7.5 show that Cr(VI) removal rates were high
for all units with increased surface load. Even in the two unplanted units (Cr-U and SCW-U), the
removal of Cr(VI) was 100% with increased pollutants load. Thus, there was no significant
relationship between the efficiency of Cr(VI) removal and surface load.
The above observation helps to reinforce that bioaccumulation is the main action of Cr(VI)
removal in CWs. During the second operational period, the influent surface load was 0.0085-0.15
gr/m2/d for SCW-U, 0.014-0.14 gr/m
2/d for SCW-P, 0.06–0.114 gr/m
2/d for the Cr-U, and 0.05-
0.13 gr/m2/d for Cr-P. With HRTs of four days, the lower removal rate of Cr(VI) remained
constant in all seasons in this experiment. Theoretically, higher HRT means lower loading rate
and there will be stable performance of removal efficiency. However, in this study with a
reasonable surface load, removal of Cr(VI) showed a higher efficiency in the four pilot units with
8 and 4 days of HRTs. Therefore, it can be concluded that removal of Cr(VI) is not dependent on
loading rate, but on the optimum functions of the plant vegetation. In addition, cheese whey
effects Cr(VI) removal as it contains nutrient and organic elements which help microorganisms to
colonize and degrade pollutants.

Treatment of Industrial and Agro-Industrial Wastewater Using Constructed Wetlands Mar-Yam Sultana
Chapter 7: Combined Treatment of Cr(VI) and Cheese Whey in Pilot-Scale HSF Constructed Wetlands 154
7.2.3) Comparison with experimental results of the first operational period
To compare the removal rates of Cr(VI) of the two experimental sessions, the time periods were
selected when the average temperature (p value = 0.229> 0.05), HRTs, and influent
concentrations of Cr(VI) were almost identical. One-way ANOVA analysis was performed for
the Cr-P and Cr-U pilot units, to investigate whether the removal efficiencies of Cr(VI) in the
units show statistically significant differences between the two experimental sessions. Table 7.2
presents means and standard deviations for temperature and Cr(VI) removal rates, and the other
operational parameters (HRTs and influent concentrations) for both units (Cr-P and Cr-U) in both
sessions.
Table 7.2: Comparisons of Cr(VI) removal during the two operational periods.
Time periods Temperature
(0C)
HRTs
(Days)
Influent
concentrations
(mg/L)
Removal (%)
Cr-P
28/4 -15/6/2011 19.46 ± 3.31 8 5 77 ± 14.96
20/4 – 15/6/2013 20.17 ± 3.23 8 5 100 ± 0
Cr-U
28/4 -15/6/2011 19.46 ± 3.31 8 5 35.18 ± 10.51
20/4 – 15/6/2013 20.17 ± 3.23 8 5 99.29 ± 1.16
One-way ANOVA results showed that the removal rate of Cr(VI) between the two sessions is
statistically significant (p value = 0.000 <0.05) for the Cr-P. This difference may be because the
time period chosen for the first operational period was the initial period (first 90 days) of the
operation. Usually during these early days of treatment in CWs, the performance is not stable.
After this adaptation stage, the Cr-P consistently showed 100% Cr(VI) removal efficiency. The
Cr-U unit also showed statistically significant differences in Cr (VI) removal between the two
sessions (p value = 0.000 <0.05). This supports the view that the main removal mechanism of
Cr(VI) during the second operational period in the Cr-U unit was microbial activity and not
adsorption by plant biomass.

Treatment of Industrial and Agro-Industrial Wastewater Using Constructed Wetlands Mar-Yam Sultana
Chapter 7: Combined Treatment of Cr(VI) and Cheese Whey in Pilot-Scale HSF Constructed Wetlands 155
7.3) Removal Efficiency of COD in Four Pilot-Scale HSF Constructed
Wetlands with Co-Treated Wastewaters
Figure 7.6a &b present time series charts for COD influent and effluent concentrations in the
SCW-U and SCW-P units. The effluent concentrations were corrected by removing precipitation
and ET rates from the original effluent concentrations. The average COD removal efficiency was
70.7% for the SCW-P and 48.27% for the SCW-U. SCW-P showed over 50% removal rate of
COD when the input COD concentration ranged between 2000 mg/L and 5000 mg/L for both
HRTs (8 and 4 days) (Figure 7.6a). Both the SCW-P and SCW-U units, presented slightly higher
COD removal rates (74.8% for the SCW-P and 51.5% for the SCW-U) during the first
operational period. These differences in COD removal could be attributed to the possible toxic
effects of Cr(VI) to the microorganisms that removed the organic matter.
Figures 7.7a & b present time series charts for COD influent and effluent concentration in the Cr-
P and Cr-U units. The mean COD removal efficiency was 65.6% for the Cr-P and 58.2% for the
Cr-U. Cr-P and Cr-U presented lower COD removal rates compared to SCW-P and SCW-U. The
Cr-P unit showed high Cr(VI) removal efficiency in the first experimental period with high
concentrations of Cr(VI) and plant growth, however removal efficiencies were higher in the
second experimental period. In the second period, when SCW was mixed with the Cr(VI)
solution, the Cr-P unit showed a slight improvement in growth of vegetation and moderate COD
removal. In the first experimental period the Cr-U and Cr-P units received only the Cr(VI)
without nutrients or any other substances. In the second experimental period when these two
units received SCW-containing wastewater, the Cr-P unit showed slight improvement in plant
growth (by visual observation) which boosted microorganism growth and in the pollutant
degradation process. The microorganisms used the organic carbons in the SCW as a source of
energy to remove COD from the wastewater.

Treatment of Industrial and Agro-Industrial Wastewater Using Constructed Wetlands Mar-Yam Sultana
Chapter 7: Combined Treatment of Cr(VI) and Cheese Whey in Pilot-Scale HSF Constructed Wetlands 156
0 30 60 90 120 150 180 210 240
0
500
1000
1500
2000
2500
3000
3500
4000
4500
5000
5500
6000
Co
nce
ntr
ati
on
(m
g/L
)
Days
Influent
Effluent
HRT alteration
Spring Summer Autumn
8 days HRT 4 days HRT
Figure 7.6a: Time series charts for COD removal with influent and effluent concentrations in the SCW-U unit.

Treatment of Industrial and Agro-Industrial Wastewater Using Constructed Wetlands Mar-Yam Sultana
Chapter 7: Combined Treatment of Cr(VI) and Cheese Whey in Pilot-Scale HSF Constructed Wetlands 157
0 30 60 90 120 150 180 210 240
0
500
1000
1500
2000
2500
3000
3500
4000
4500
5000
5500
6000
Influent CW
Effluent CW
HRT alteration
Co
nce
ntr
ati
on
(m
g/L
)
Days
Spring Summer Autumn
8 days HRT 4 days HRT
Figure 7.6b: Time series charts for COD removal with influent and effluent concentrations in the SCW-P unit.
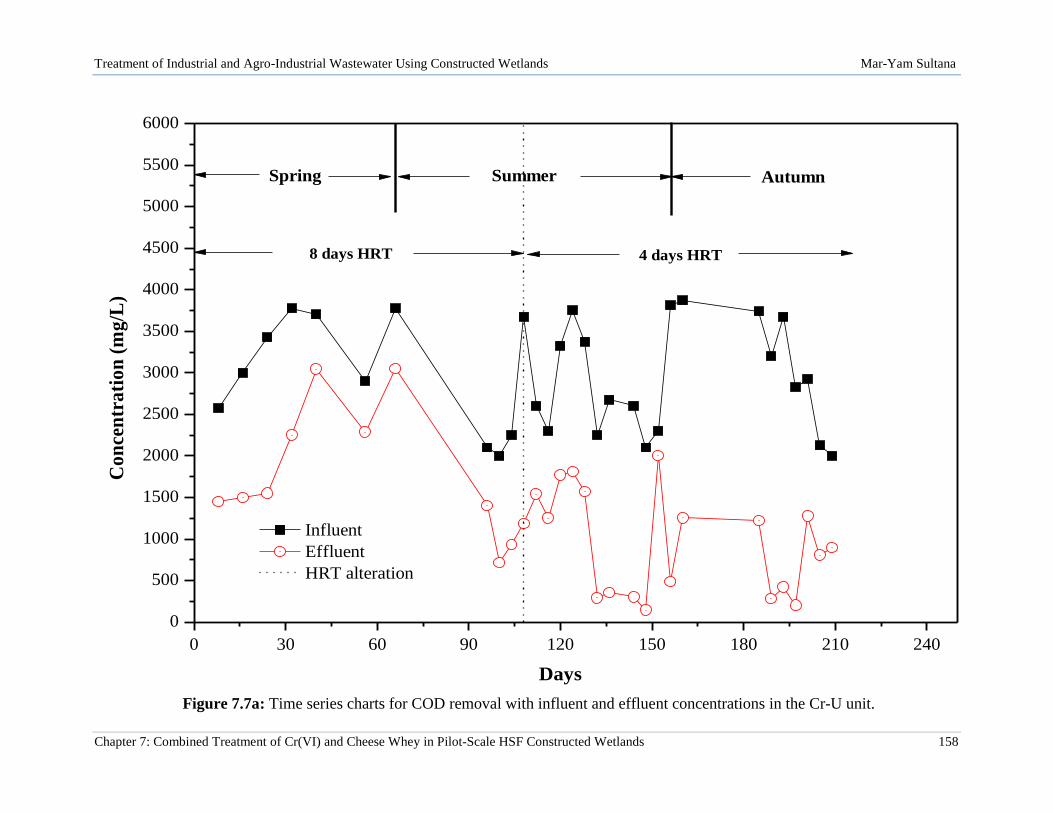
Treatment of Industrial and Agro-Industrial Wastewater Using Constructed Wetlands Mar-Yam Sultana
Chapter 7: Combined Treatment of Cr(VI) and Cheese Whey in Pilot-Scale HSF Constructed Wetlands 158
0 30 60 90 120 150 180 210 240
0
500
1000
1500
2000
2500
3000
3500
4000
4500
5000
5500
6000
Influent
Effluent
HRT alteration
Co
nce
ntr
ati
on
(m
g/L
)
Days
Spring Summer Autumn
8 days HRT 4 days HRT
Figure 7.7a: Time series charts for COD removal with influent and effluent concentrations in the Cr-U unit.

Treatment of Industrial and Agro-Industrial Wastewater Using Constructed Wetlands Mar-Yam Sultana
Chapter 7: Combined Treatment of Cr(VI) and Cheese Whey in Pilot-Scale HSF Constructed Wetlands 159
0 30 60 90 120 150 180 210 240
0
500
1000
1500
2000
2500
3000
3500
4000
4500
5000
5500
6000
Influent
Effluent
HRT alteration
Co
nce
ntr
ati
on
(m
g/L
)
Days
Spring Summer Autumn
8 days HRT 4 days HRT
Figure 7.7b: Time series charts for COD removal with influent and effluent concentrations in the Cr-P unit.

Treatment of Industrial and Agro-Industrial Wastewater Using Constructed Wetlands Mar-Yam Sultana
Chapter 7: Combined Treatment of Cr(VI) and Cheese Whey in Pilot-Scale HSF Constructed Wetlands 160
However, in the Cr-U unit which was treated only with Cr(VI) in the first experimental period, a
moderate removal of COD (58.2%) was observed. One possible explanation for this could be
that, here SCW was introduced for the first time and it favoured the growth of microorganisms in
the gravel bed which increased COD removal. It has been reported that organic matter
concentrations at wetland inlet points are involved with enhanced biofilm growth because of the
greater abundance of nutrients at this point (Caselles-Osorio and García, 2006). The addition of
Cr containing solution and cheese whey in wetlands, microorganisms needed to adapt the mixed
wastewater as the media became an organic source of carbon. Moreover, Cr(VI) produced
different toxic substances with organic exudates of plant roots for bioaccumulation which
affect the growth of bacteria and increased the organic matter in the wetland. Several studies have
reported that when the concentration of wastewater, and consequently of Cr(VI) increases (=5
mg/L and >5 mg/L), the maximum biomass concentration of microorganisms decreases, thus
demonstrating the toxic effect of this metal on cell metabolism (Magro et al., 2012; URL 3;
Stasinakis et al., 2003). According to the literature, the critical concentration of Cr(VI) that
affects substrate removal, ranges from 5 to 50 mg/L (Stasinakis et al., 2003). In this experiment,
the shock load of Cr(VI) (5 mg/L) was introduced at the beginning of the experiment and was
later reduced. However, Magro et al. (2012) and Stasinakis et al. (2003) started their experiments
with low concentrations of Cr(VI) (around 1 mg/L) that they gradually increased. Thus, the
results of this experiment could be explained by the dependency of Cr toxicity (Stasinakis et al.,
2003).
7.3.1) Effect of vegetation on COD removal
The removal mechanism of COD in the CW system was the biofilm attached to the support
media (gravel and rhizomes). The vegetation in the wetland transports oxygen from the leaves to
the roots, which is then used by the microorganisms to oxidize organic compounds (Vymazal and
Kropfelova, 2009). Depending on the dissolved oxygen availability within the wetland bed,
organic matter degradation takes place under anaerobic conditions. The presence of vegetation
contributes to the aerobic degradation of organic matter through increasing the oxygen
concentration in the root zone area.

Treatment of Industrial and Agro-Industrial Wastewater Using Constructed Wetlands Mar-Yam Sultana
Chapter 7: Combined Treatment of Cr(VI) and Cheese Whey in Pilot-Scale HSF Constructed Wetlands 161
To assess the effect of vegetation on COD removal, one-way ANOVA statistical analysis was
performed where the concentration of COD was high with different concentration of Cr(VI) for
all units. The removal rate of COD for the SCW-P and SCW-U units was not significantly
different as the p value was 0.353>0.05 while the mean removal rates were 65.53 ± 23.78% and
70.66 ± 18.31% for SCW-P and SCW-U, respectively. For Cr-P and Cr-U units, a one-way
ANOVA statistical analysis also was performed to evaluate the removal rate of COD. The result
for these two units also did not show any statistically significant difference in COD removal (p
value =0.189>0.05). The mean removal rate of COD was 58.20 ± 23.94% for Cr-U and 65.60 ±
18.86% for Cr-P. Analysis of the results showed that there was no significant variation in COD
removal between the planted and unplanted units even in the presence of Cr(VI), as COD
removal in all units was around 65%. However, in the first experimental period, the SCW-P and
SCW-U units showed significantly high COD removal rates (almost 100%) when treated only
with SCW wastewater. In the second experimental period, Cr(VI) was added to the SCW
wastewater and the SCW-P and SCW-U units showed lower COD removal rates even with
moderate Cr(VI) loadings. In the Cr-P and Cr-U units, a reasonable COD removal rate was
observed when SCW was first introduced into these two units. The presence of reed plants might
significantly favour the removal of organic matter in the two planted units, although the main
mechanism of organic matter removal is the activity of aerobic and anaerobic bacteria (Vymazal,
2002).
Plants enhance the treatment processes of wastewater in CWs in a number of ways, such as
settlement of suspended solids, providing large surface area for microorganism growth,
increasing uptake of nutrients and trace elements and providing oxygen release (Kadlec et al.,
2000; EPA, 2000b; Brix, 1994, 1997). However, the superior role of plants in CWs is not always
evident, and seems to depend on several parameters, such as the operational period, type of
vegetation and characteristics of the wastewater. Calheiros et al. (2007) found no difference
between planted and unplanted units in the removal of COD from tannery wastewater. Dotro et
al. (2012) and Maine et al. (2006), achieved a significant COD removal rate of around 70% when
treating tannery wastewater. The findings from this study showed that the application of CW
systems to the treatment of integrated wastewater might be an attractive approach but long-term
operation is required to ascertain for the role of vegetation in this system.

Treatment of Industrial and Agro-Industrial Wastewater Using Constructed Wetlands Mar-Yam Sultana
Chapter 7: Combined Treatment of Cr(VI) and Cheese Whey in Pilot-Scale HSF Constructed Wetlands 162
7.3.2) Effect of HRTs on COD removal
To assess the effect of HRT on COD removal, two different HRTs were applied in the pilot units,
i.e. 8 and 4 days. In addition, two different COD concentrations were used as influent (2000 to
3000 mg/L) in order to examine the removal of COD. The different HRTs and influent
concentrations of COD affected the rate of surface load (SLR), which ranged from 34.2 to 128.3
gr/m2/d for SCW-P, from 38.5 to 120.2 gr/m
2/d SCW-U, from 31.6 to 122.8 gr/m
2/d for SCW-P
and 24.2 to 87.8 gr/m2/d SCW-U.
Figures 7.8 and 7.9 show the correlation charts of surface load and COD removal performance
for the four pilot units. COD removal rates showed an increasing trend with COD surface loading
in the units. However, the removal efficiency of COD did not differ significantly when the
concentration range of influent was 2000 to 2500 mg/L. In the presence of Cr(VI) in both pilot
units (Cr-P and Cr-U), significant amount of COD removal was observed with moderate surface
loading (Fig. 7.9a & b). On the other hand, with the same influent range, above 60% COD
removal was observed in the SCW-P and SCW-U pilot units (Fig. 7.8a & b). The removal of
COD in planted wetlands occurred because of the presence of vegetation, whereas in the
unplanted wetlands the removal of COD is thought to be due to microbial degradation. In this
experiment, Cr(VI) was used in combination with SCW. In the presence of Cr(VI), significant
amount of COD removal was recorded in all units with moderate surface loading of COD at both
HRTs (8 and 4 days). Thus, it could be concluded that HSF CWs can treat the combined
wastewater by removing organic matter at low residence times, i.e. up to 4 days, even in the
presence of heavy metals such as Cr(VI). Sin et al. (2000), reported that up to 2 mg/L of Cr ions
had no significant effect on the COD removal efficiency of a sequential batch reactor, but may
have a significant effect on the COD removal efficiency of an activated sludge process operated
with a short HRT (2 days). They also observed a reduction in COD adsorption in the presence of
heavy metal ions at HRTs of 2.5 days and less but at 5 days of HRTs, the retention of organic
matters within the reactor was sufficient for biological assimilation and organic adsorption.

Treatment of Industrial and Agro-Industrial Wastewater Using Constructed Wetlands Mar-Yam Sultana
Chapter 7: Combined Treatment of Cr(VI) and Cheese Whey in Pilot-Scale HSF Constructed Wetlands 163
0 20 40 60 80 100 120 140
-20
-10
0
10
20
30
40
50
60
70
80
90
100R
emo
va
l (%
)
Surface load (gr/m2/day)
Figure 7.8a: Correlation charts of surface load and removal rates of COD in the SCW-U unit.

Treatment of Industrial and Agro-Industrial Wastewater Using Constructed Wetlands Mar-Yam Sultana
Chapter 7: Combined Treatment of Cr(VI) and Cheese Whey in Pilot-Scale HSF Constructed Wetlands 164
-10 0 10 20 30 40 50 60 70 80 90 100 110 120 130 140
-10
0
10
20
30
40
50
60
70
80
90
100R
emo
va
l (%
)
Surface load (gr/m2/day)
Figure 7.8b: Correlation charts of surface load and removal rates of COD in the SCW-P unit.

Treatment of Industrial and Agro-Industrial Wastewater Using Constructed Wetlands Mar-Yam Sultana
Chapter 7: Combined Treatment of Cr(VI) and Cheese Whey in Pilot-Scale HSF Constructed Wetlands 165
-10 0 10 20 30 40 50 60 70 80 90 100 110 120 130 140
-20
-10
0
10
20
30
40
50
60
70
80
90
100R
emo
va
l (%
)
Surface load (gr/m2/day)
Figure 7.9a: Correlation charts of surface load and removal rates of COD in the Cr-U unit.
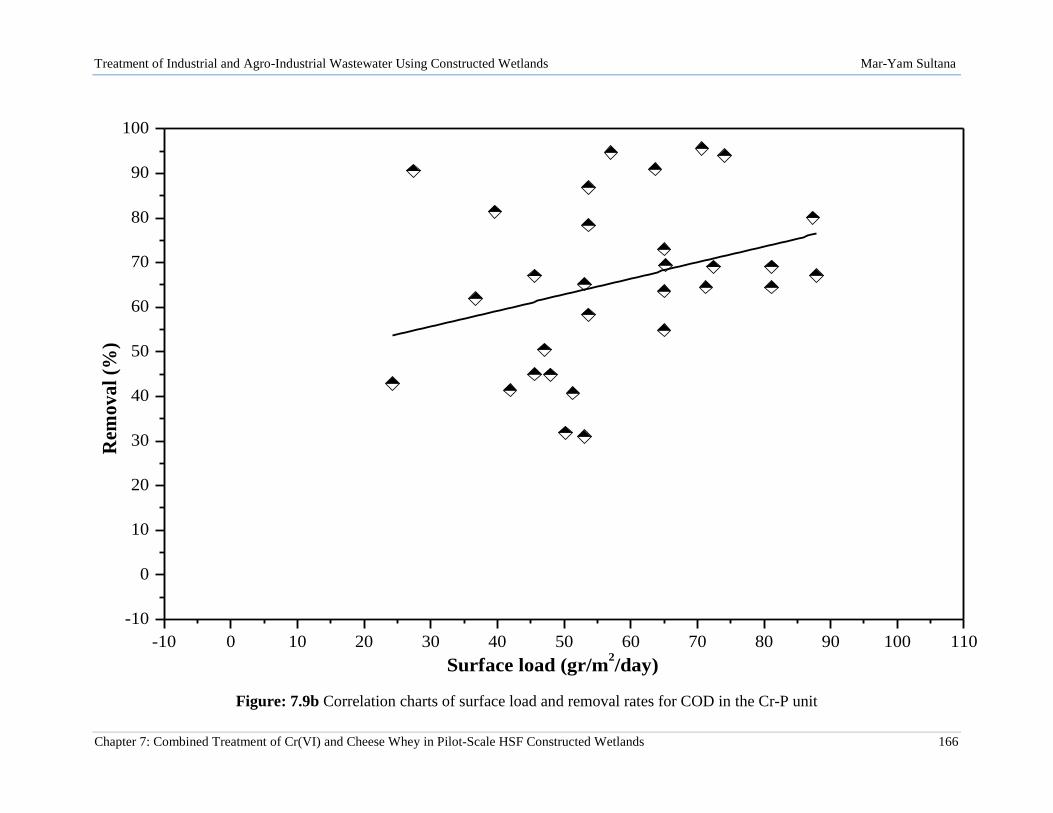
Treatment of Industrial and Agro-Industrial Wastewater Using Constructed Wetlands Mar-Yam Sultana
Chapter 7: Combined Treatment of Cr(VI) and Cheese Whey in Pilot-Scale HSF Constructed Wetlands 166
-10 0 10 20 30 40 50 60 70 80 90 100 110
-10
0
10
20
30
40
50
60
70
80
90
100R
emo
va
l (%
)
Surface load (gr/m2/day)
Figure: 7.9b Correlation charts of surface load and removal rates for COD in the Cr-P unit

Treatment of Industrial and Agro-Industrial Wastewater Using Constructed Wetlands Mar-Yam Sultana
Chapter 7: Combined Treatment of Cr(VI) and Cheese Whey in Pilot-Scale HSF Constructed Wetlands 167
7.3.3) Comparison with experimental results of the first operational period
To compare COD removal rates between the two operational periods, specific time periods were
selected when the average temperature (p value = 0.229> 0.05), the hydraulic residence time and
the inlet concentration of COD were almost identical. One-way ANOVA statistical analysis was
performed for SCW-P and SCW-U, to investigate whether removal efficiencies of COD in the
two pilot units show statistically significant differences between the two operational periods.
Table 7.3 presents means and standard deviations for temperature and COD removal rates and the
values of the other operational parameters (residence time, inlet concentration) for the two units
in both sessions.
Table 7.3: Comparison of COD removal in the two experimental sessions.
Time period Temperature
(0C)
HRTs
(Days)
Influent
concentrations
(mg/L)
Removal
(%)
SCW-P
28/4 -15/6/2011 19.46 ± 3.31 8 2500 49.33 ± 10.06
20/4 – 15/6/2013 20.17 ± 3.23 8 2500 55.75 ± 27.31
SCW-U
28/4 -15/6/2011 19.46 ± 3.31 8 2500 48.57 ± 29.55
20/4 – 15/6/2013 20.17 ± 3.23 8 2500 49.03 ± 22.58
The ANOVA results showed that the COD removal between the two sessions did not show
statistically significant differences (p value =0.576> 0.05) for SCW-P pilot unit. Similarly, SCW-
U also did not show any statistical significant differences in COD removal between the two
sessions (p value = 0.976> 0.05). This result suggests that the combined wastewater of cheese
whey and Cr(VI) can be treated in CWs and could that removal rates of organic matter are
substantial even in the presence of Cr(VI).
Statistically, there was no significant variation between the two experimental periods, but the
removal rate of COD reduced from 91% to 70% in the SCW-P unit and remained the same (65%)
in the SCW-U. This reduction in COD removal rate might be due to the addition of Cr(VI) to the

Treatment of Industrial and Agro-Industrial Wastewater Using Constructed Wetlands Mar-Yam Sultana
Chapter 7: Combined Treatment of Cr(VI) and Cheese Whey in Pilot-Scale HSF Constructed Wetlands 168
SCW solution. As a result, the effluent COD values were relatively high but the removal rates
remained satisfactory in the systems fed with integrated wastewater. However, during the first
experimental period, these two units were very efficient in treating diluted (Sultana et al., 2014c).
The toxicity of Cr(VI) could affect the COD removal efficiency. An increased concentration of
Cr(VI) ≥5 mg/L decreases the COD removal efficiency according to Stasinakis et al. (2003).
Stasinakis et al. (2003), also reported that 1 to 3 mg/L of Cr(VI) did not have any significant
impact on COD removal, but reductions in removal were observed when Cr(VI) concentrations
were greater than 5 mg/L. In this case, the reduction in COD removal was less than 10 % at
concentrations of 5 mg Cr(VI)/L. No change on the COD removal was observed under shock
loading conditions with a concentration of 5 mg/L of Cr(VI) (Stasinakis et al., 2003). Ertugrul et
al. (2006), also observed little to no impact on microorganisms during the first day of shock
loading with 5 mg/L and 10 mg/L Cr(VI). Shock loading of 5 mg/L and 10 mg/L Cr(VI) also
decreased COD removal efficiency in the second day, and the CWs required 3 and 5 days,
respectively, to recover to a steady state condition (Ertugrul et al., 2006). As the concentration of
Cr(VI) increased, a more pronounced effect of Cr(VI) on microorganisms was observed in their
study.
Heavy metals like Cr(VI) are highly toxic substances and have toxic effects on microorganisms,
because they tend to adhere to microorganisms and produce complexes with bacteria (Sin et al.,
2000). Metal ion complexion with heavy metals effects the growth of bacteria and can lead to
their death. Suthirak and Sherrard (1981) and Dilek et al. (1998), observed that Cr and Ni inhibit
microbial activity and negatively affect COD removal efficiency at concentrations above 10
mg/L. Thus, results showed that wastewater containing trace levels of heavy metal ions within
the effluent discharge limits may affect COD removal efficiency at short HRTs. Moreover, at
trace amounts, heavy metal ions act as a stronger competitor and reduce COD adsorption on the
bioflocs (Sin et al., 2000).

Treatment of Industrial and Agro-Industrial Wastewater Using Constructed Wetlands Mar-Yam Sultana
Chapter 8: General Discussion and Applications
CHAPTER 8: GENERAL DISCUSSION AND APPLICATION
8.1) Overall discussion ......................................................................................................... 169
8.2) Application ..................................................................................................................... 174

Treatment of Industrial and Agro-Industrial Wastewater Using Constructed Wetlands Mar-Yam Sultana
Chapter 8: General Discussion and Applications 169
CHAPTER 8: GENERAL DISCUSSION AND APPLICATIONS
8.1) Overall discussion
Over the last years, constructed wetlands (CWs) have been shown to successfully treat both
Cr(VI) and SCW. Although significant research has been conducted certain important issues
such as the effects of HRT, vegetation and temperature have not been thoroughly studied. The
main objectives of this PhD included the investigation of the effect of these parameters (i.e.
HRT, vegetation and temperature) on Cr(VI) and COD removal from industrial and agro-
industrial wastewater. The optimum goal was to operate CWs with the lowest possible HRTs,
while maintaining Cr(VI) and COD concentrations under legislation limits, and to provide a
sustainable treatment solution for the toxic by-products (i.e. reed biomass).
Based on the experimental results it can be concluded that Cr(VI) uptake by the plant biomass
was the main removal mechanism as the planted unit (Cr-P) recorded full Cr(VI) removal
(100%) for most of the operation period. These high removal efficiencies of Cr-P decreased
only when the plant biomass was harvested. Although the ability of common reeds to remove
Cr(VI) has been reported previously (Khan et al., 2009; Mant et al., 2006; Fibbi et al., 2012;
Maine et al., 2009; Calheiros et al., 2008b), for the first time planted and unplanted CW units
showed such high differences in Cr(VI) removal with the highest Cr(VI) influent
concentrations. As previously reported (Khan et al., 2009; Lesage et al., 2007b; Calheiros et
al., 2008b; Mant et al., 2006; Liu et al., 2010), Cr(VI) was found to accumulate mainly in
reed’s root zone. The high Cr(VI) accumulation by reed roots is attributed to the mechanism
responsible for metal uptake, by which plants receive the ionic forms of metals through their
root cells and the metal ions then enter into the root system. The ion can be stored in the root
tissue or translocated into the shoots through xylem tissue (Jabeen et al., 2009).
To maintain stable Cr(VI) removal throughout the year, plant biomass should be only
harvested once every year. This plant biomass is considered a toxic waste due to its high Cr
content. Until now, no viable, cost-effective treatment solutions for this reed biomass have
been recorded. In the frames of this research, harvested plant biomass was co-composted with
olive mill wastes leading to a final compost with high quality physicochemical characteristics,
which meets the EU limits for organic farming use.

Treatment of Industrial and Agro-Industrial Wastewater Using Constructed Wetlands Mar-Yam Sultana
Chapter 8: General Discussion and Applications 170
On the other hand, the main Cr(VI) removal mechanisms in the unplanted unit (Cr-U) were
probably the accumulation of Cr ions by microorganisms, adsorption to the porous media or
the precipitation of Cr hydroxide. Cr(VI) precipitation was probably limited due to the neutral
pH values. Baral et al. (2006) and Dotro et al. (2011b), mentioned that with increased pH
values (above acidic limits), the solubility and precipitation of chromium hydroxide
decreased.
The effect of HRT on Cr(VI) removal was thoroughly investigated for the first time in the
present dissertation. Kucuk et al. (2003), used different HRTs in HSF CWs treating
wastewater containing Cr (VI), although the discussion on the effect of HRT on Cr(VI)
removal is limited. While a wide range of HRTs (i.e. from 8 days to 1 day) were used in this
study, HRT seems to not have a significant effect on Cr(VI) especially in the planted unit (Cr-
P) where the main removal mechanism was plant accumulation. Cr(VI) removal was only
limited when an HRT of 12hr was applied, probably affected by the plants diurnal cycle.
However, it is notable that planted CWs in this study achieved complete Cr(VI) removal
when operated under the lowest HRT (1 day) ever reported. Thus, the main drawback of CWs
(i.e. high area requirements) can be overcomed. The present CWs not only operated
successfully under low HRTs but also while receiving high Cr(VI) feed concentrations. Thus,
pollutant loading rates of the presented study were among the highest reported in the
literature, and extremely high Cr(VI) removal rates (up to 100%) were achieved.
CWs used for secondary cheese whey (SCW) treatment in the present study proved to be
rather successful at COD removal, as the planted unit (SCW-P) recorded the highest COD
removal rates (up to 100%) during the whole operation period. COD removal was limited
only after plant harvesting. However, the plants re-generated quickly after harvesting and the
COD removal efficiency in the planted unit increased to 100%. The main mechanism of COD
removal was microbiological degradation, as also reported in previous studies (Liu et al,
2006; Kadlec and Wallace, 2009, Vymazal and Kröpfelová, 2009). The huge surface area of
the plant root system helped the microorganisms to flourish and they used the organic carbon
for their energy source. Aerobic microorganisms near the rhizosphere consumed the plant-
released oxygen and used it to breakdown organic compounds (Kadlec and Knight 1996;
Vymazal and Kröpfelová, 2009). Moreover, anaerobic bacteria also contributed to the
degradation of organic compounds by the multi-step process (Vymazal et al., 1998; Vymazal
and Kröpfelová, 2009). The removal of COD in the SCW-U unit was probably caused by the

Treatment of Industrial and Agro-Industrial Wastewater Using Constructed Wetlands Mar-Yam Sultana
Chapter 8: General Discussion and Applications 171
combination of aerobic and anaerobic degradation (Kadlec and Brix, 1995; Vymazal et al.,
1998; Vymazal and Kröpfelová, 2009).
To assess effects of HRT on COD removal, four different HRTs were applied in both pilot-
scale units and SCW-P presented high COD removal efficiencies for all applied HRTs (8, 4
and 2 days). However, when HRT was limited to 1 day and the removal efficiency of COD in
both units was significantly affected. Thus, it can be concluded that an HRT of 1 day does
limit organic matter removal in a CW. SCW-U presented the highest COD removal
efficiencies with moderate influent COD concentrations at 4 and 8 days of HRT, but removal
decreased when ambient temperatures were low and at low HRTs (2 and 1 day). There is a
lack of scientific data regarding the effect of HRT on the removal of COD from SCW in
CWs. However, general studies on COD removal in CWs and effects of HRT have been
conducted (Akratos and Tsihrintzis 2007; Ghosh and Gopal 2010; Toet et al., 2005). These
studies have demonstrated the effect of HRT in HSF CWs and revealed that higher HRTs
improve effluent quality. Toet et al. (2005), reported that HRTs have no significant influence
on organic matter removal, while Akratos and Tsihrintzis (2007) reported that HRTs above 8
days are adequate for relatively high organic matter removal efficiencies. In this study, the
HRT of 2 days resulted in maximum removal of COD in the SCW-P unit and maintained the
stability of the treatment efficiency throughout the monitoring period. Normally, higher HRT
implies lower loading rate and more contact time, thus more stability in efficiency. However,
in this study, the lower HRT supported the development of aerobic conditions in the planted
unit and the removal of COD from the CW system was accomplished by a successful
combination of physical and microbial processes (IWA, 2000).
The effect of temperature on COD removal was assessed statistically for HRTs of 4 days and
both units showed different COD removal efficiencies for temperatures above and below
15oC. The significant effect of temperature on COD removal in the SCW-U was due to the
limited microbial activity at low ambient temperature. On the other hand, COD removal
efficiency in the SCW-P was not significantly affected by temperature which proved that
plants had the capacity to enhance COD removal all year round as the rhizosphere enhances
microbial growth and activity (Gerberg et al., 1986). Comino et al. (2011) reported that low
temperatures did not affect organic matter removal. On the contrary, Kern (2003) and Sharma
et al. (2013a) reported that COD removal efficiency was significantly affected by
temperature. In this research, COD removal in the SCW-P only decreased when plants were

Treatment of Industrial and Agro-Industrial Wastewater Using Constructed Wetlands Mar-Yam Sultana
Chapter 8: General Discussion and Applications 172
harvested which indicates that the annual growth cycles of the reeds were crucial for CW
operation, and also revealed that plants played the key role in maintaining high COD removal
rates even at low temperatures or in cold seasons.
After two years of operation (first experimental period), the four pilot-scale CW units were
used to co-treat (second experimental period) Cr(VI) and SCW for approximately six months.
In this second experimental period, the Cr(VI) removal efficiency in all planted and unplanted
pilot-scale HSF CW units (SCW-U, SCW-P, Cr-U and Cr-P) was 100% all year round, and
did not show any significant differences in Cr(VI) removal. Thus, the main removal
mechanism of Cr(VI) was not plant accumulation but microbial activity. During the first
operational period, the SCW-U, SCW-P units only treated diluted SCW, therefore, in second
experimental period they showed great adaptability to co-treat the cheese whey and Cr(VI).
However, Cr-U and Cr-P had already been used to treat Cr(VI) in the first experimental
period, and SCW was introduced in the second. Due to the use of this mixed wastewater of
SCW and Cr(VI), rapid plant growth enhanced microbial activity and hence Cr(VI) removal.
The second experimental period was designed to investigate the possible use of SCW as a
carbon source for Cr(VI) removal. The results showed that SCW proved to be beneficial for
the treatment of Cr(VI) in HSF CWs. In the first experimental period, the Cr(VI) removal
efficiency in Cr-U was not as high as in the Cr-P unit. However, when SCW was introduced,
both units showed the highest (100%) possible removal efficiencies. In the first experimental
period, tap water was used to dilute the wastewater. Tap water does not contain organic
carbon and thus limited the growth of microorganisms. In the second experimental period,
cheese whey was mixed with Cr(VI) solution in all the units and the microorganisms obtained
energy from the organic carbon contained in the SCW to remove Cr(VI) from all the units.
For the two different HRTs (8 and 4 days), the removal rates of Cr(VI) in the four pilot units
were not affected by the different surface loads, and remained stable (100%) removal
throughout the experiment. This is the first time that SCW was used in a CW system to treat
Cr(VI), therefore comparisons with other studies cannot be made. However, landfill leachate
and activated sludge which are also very good potential sources of organic carbon, have been
used in the treatment of heavy metals in different studies (Kamarudzaman et al., 2011;
Stasinakis et al., 2003; URL 3) and they also recorded a high removal efficiency of heavy
metals including Cr(VI). Sochacki et al. (2014), also used peat as an internal carbon source in
a CW system and achieved high removal of heavy metals.

Treatment of Industrial and Agro-Industrial Wastewater Using Constructed Wetlands Mar-Yam Sultana
Chapter 8: General Discussion and Applications 173
The high Cr(VI) removal efficiencies observed in all units suggest that Cr(VI) removal
mechanisms should be associated with microbial populations and the CW media composition
because a sustainable amount of COD was removed which proves that all units contained
significant populations of microorganisms on the gravel bed. It has been reported that bacteria
growing in biofilms produce exopolymers that can act as molecular sieves or adsorbents
(Ragusa et al., 2004). Moreover, Dotro et al. (2009) reported that iron and organic-bound
phases dominate the Cr(VI) removal mechanisms. Therefore, it can be concluded that removal
of Cr(VI) in the unplanted units were most likely due to chemical precipitation or sorption by
microorganisms or to the gravel bed.
The COD removal efficiencies in the four HSF CW units differed between the units. The low
removal efficiency of COD might be due to the sub-lethal effect of Cr(VI) on
microorganisms. Chua et al. (1999), studied the sub-lethal effects of heavy metals on
activated sludge microorganisms and found that in the presence of Cr and at 5 days of HRT,
the overall COD removal efficiency showed no significant change, rather the sorption
capacity of biomass for dissolved COD which was reduced by 12%. They also described that
heavy metals affected the COD adsorption capacity of the activated sludge system.
Additionally, metal ions acted as a strong competitor against the organic compounds for
active sites on the bioflocs instead of acting as a toxic microbial inhibitor which finally
hampers the organic adsorption and affects the COD removal efficiency under shorter HRTs.
The decreased COD removal rate of SCW-P in the second experimental period compared to
the first experimental period could be attributed to: (a) when pilot units were fed with SCW
and Cr(VI) mixed wastewater, the microorganisms had to adapt to the mixed wastewater; (b)
microorganisms have the affinity to adhere with metal ions, so the bioflocs of microbes might
be occupied by Cr ions and these ions acted as a strong competitor against organic
compounds which finally hampered the adsorption of organic substances and affected the
COD removal particularly at shorter HRTs (Chua et al., 1999; Sin et al., 2000); (c) Cr(VI)
produced different toxic substances or metal ion complexes with organic exudates of plant
roots for bioaccumulation that affect the growth of bacteria and increase organic matter in the
wetland (Cervantes et al., 2001).

Treatment of Industrial and Agro-Industrial Wastewater Using Constructed Wetlands Mar-Yam Sultana
Chapter 8: General Discussion and Applications 174
Although statistical analyses did not show any significant variations between the two
experimental periods, COD removal rates decreased from 91% to 70% in the SCW-P unit,
while for the SCW-U, the removal rate was similar (65%). Sochacki et al. (2014), referred
that the disadvantage of using external carbon sources is that they increase effluent COD
values. It has been observed in other studies that Cr and Ni inhibit microbial activity and
negatively affect COD removal efficiency at concentrations above 10 mg/L (Suthirak and
Sherrard, 1981; Dilek et al., 1998). Therefore, it could be concluded that wastewaters
containing trace levels of heavy metal ions within the effluent discharge limits, may have an
effect on COD removal efficiency at short HRTs.
8.2) Application
The application of a constructed wetland system for the treatment of Cr(VI) and SCW was
shown to be feasible. Performance of the pilot-scale HSF CWs at the end of the research
revealed that it can be successfully applied to treat any industrial wastewater containing
Cr(VI), and the treatment would be efficient even with HRTs of 1 day and with optimum
load. Based on the present experimental results a CW treating Cr(VI) could receive a
hydraulic load up to 0.13 m3/d while a CW treating SCW could receive up to 0.06 m
3/d,
which corresponds to 80 kg of processed milk.
Common reeds (Phragmites australis) proved to be efficient vegetation for the treatment of
Cr(VI) in a CW system and mainly contributed to the removal of Cr(VI) and COD from
wastewater. They also showed no toxic effect from Cr(VI), even at the highest concentrations.
Composting of Cr(VI) treated reed plant biomass proved to be a suitable solution for the
disposal of plant biomass from a CW system. The compost was stable and therefore safe and
could be applied to organic food crops.
Cheese whey could be used as a carbon source in the treatment of Cr(VI) using a CW system.
Practically, it might be possible by collecting the two wastewaters from different sources and
mixing them in a tank before introducing them into the CW treatment system. Moreover,
transport of the liquids to the mixing tank and into the CW area may be an issue.

Treatment of Industrial and Agro-Industrial Wastewater Using Constructed Wetlands Mar-Yam Sultana
Chapter 9: Conclusions and Recommendations
CHAPTER 9: CONCLUSIONS AND RECOMMENDATIONS
9.1) Overall Conclusions ...................................................................................................... 175
9.2) Recommendations for Future Research ..................................................................... 177
Treatment of Industrial and Agro-Industrial Wastewater Using Constructed Wetlands Mar-Yam Sultana
Chapter 9: Conclusions and Recommendations 175
CHAPTER 9: CONCLUSIONS AND RECOMMENDATIONS
9.1) Overall Conclusions
HSF CWs proved to be successful in treating aqueous Cr(VI) solution, SCW wastewater and
a combined wastewater of Cr(VI) and SCW, as they achieved high removal efficiencies for
both Cr(VI) and COD.
Concerning the treatment of aqueous Cr(VI) solutions by HSF CWs, based on two years of
experiments, it can be concluded that:
The planted CW unit removed Cr(VI) rather efficiently with mean removal rates of 88%.
The unplanted unit showed significantly lower Cr(VI)removal efficiencies (21%). These
differences in Cr(VI) removal can be attributed to the role of the plant vegetation.
Under steady state conditions, effluent concentrations in the Cr-P unit were always below
the permitted legislation limit of 0.05 mg/L.
The only period during which Cr(VI) removal efficiency of the planted units decreased
was that following plant harvesting. This decrease was temporary and Cr(VI) removal
efficiency rose again when plant biomass increased.
Removal efficiency in the planted unit was not affected by HRT, as Cr(VI) removal
efficiencies were high and rather stable even with HRTs as low as 1 day.
HRTs below 1 day cannot be applied successfully in CWs, as CW pollutant removal
efficiency is affected by diurnal cycles of the plant vegetation.
A viable disposal method for plant biomass obtained from CWs treating Cr(VI)
wastewaters was presented for the first time. Plant biomass was co-composted with olive
mill wastes and produced a final product that meets EU regulations for organic farming
applications.

Treatment of Industrial and Agro-Industrial Wastewater Using Constructed Wetlands Mar-Yam Sultana
Chapter 9: Conclusions and Recommendations 176
Secondary cheese whey (SCW) was treated using HSF CWs. Following two years
experiments it could be concluded that:
Both pilot-scale CW units (planted and unplanted) proved to be rather effective in SCW
treatment, as they achieved high COD removal efficiencies of (91% and 77.23% for SCW-P
and SCW-U, respectively. These high COD removal rates, even in the SCW-U unit, reveal
that organic matter was mainly removed by biological processes. Nevertheless, the plant
vegetation significantly affected COD removal, proving the positive effect of vegetation on
CW operation.
Under steady-state conditions effluent concentrations in SCW-P were always below the
permitted legislation limits (120 mg/L), when COD influent concentrations were below 3500
mg/L.
Ambient temperature negatively affected only the SCW-U unit, while the SCW-P appeared
to be affected only by the annual plant growth cycle.
Both CW units demonstrated satisfactory COD removal efficiencies even when operated
under HRTs of 2 days, which is at present the lowest HRT reported in the literature. HRTs of
1 day proved to be insufficient for COD removal in both units.
In the second experimental period, the four HSF pilot-scale CWs treated a mixed wastewater
of Cr(VI) and SCW for six months. From these experiments it can be concluded that:
In all four pilot-scale CWs units, Cr(VI) was removed with a success rate of 100%
with an HRT of 4 days.
The average COD removal rate was 77% in the planted units, indicating the important
role of vegetation in the wetland. The average removal rate of COD was 56% in the
unplanted unit.
HRTs of 4 and 8 days were sufficient to remove Cr(VI) and COD from the combined
wastewater of Cr(VI) and SCW.

Treatment of Industrial and Agro-Industrial Wastewater Using Constructed Wetlands Mar-Yam Sultana
Chapter 9: Conclusions and Recommendations 177
Comparing the data from two experimental periods, results indicate that removal of
Cr(VI) was not only due to the adsorption/absorption by the plant biomass but also the
action of microorganisms.
Regarding COD removal, the results were not affected by the two different period
which may suggests that that the combined wastewater of cheese whey and Cr(VI) can
be treated in CWs and could that removal rates of organic matter are substantial even
in the presence of Cr(VI).
9.2) Recommendations for Future Research
Although significant results were drawn from the pilot-scale HSF CW operation, a series of
factors should also be examined in order to safely use HSF CWs to treat Cr(VI) and SCW.
Therefore, future research should focus on:
Evaluating the toxicity of chromium on plant species which are commonly used in
CWs.
Assessing the role of microorganisms on Cr(VI) and COD removal in CWs with
different HRTs.
Conducting additional experiments for the co-treatment of Cr(VI) and SCW to
determine optimal operational conditions (i.e., HRT, influent concentrations), as in
this research, COD effluent concentration exceeded legislation limits.
To further improve CW performance on agro-industrial wastewater treatment. Specific
design and operation parameters should be examined, including vegetation density,
step feeding, and special porous media.

Treatment of Industrial and Agro-Industrial Wastewater Using Constructed Wetlands Mar-Yam Sultana
References
REFERENCES

Treatment of Industrial and Agro-Industrial Wastewater Using Constructed Wetlands Mar-Yam Sultana
References 178
REFERENCES
Abdulla, H.M., Kamal, E.M., Mohamed, A.H., El-Bassuony, A.D., 2010. Chromium Removal
from Tannery Wastewater using Chemical and Biological Techniques aiming Zero
Discharge of Pollution, Proceeding Of Fifth Scientific Environmental Conference,
2010, Zagazig Uni., 171 – 183.
Aguilar, J.R.P., Cabriales, J.J.P., Vega, M.M., 2008. Identification and characterization of
sulfur-oxidizing bacteria in an artificial wetland that treats wastewater from a tannery.
International Journal of Phytoremediation, 10: 359-370; doi:
10.1080/15226510802100390.
Agustina, T.E., Ang, H.M., Pareek, V.K., 2007. Treatment of winery wastewater using a
photocatalytic/photolytic reactor. Chemical Engineering Journal, 135: 151-156; doi:
10.1016/j.cej.2007.07.063.
Akcil, A. and Koldas, S., 2006. Acid Mine Drainage (AMD): causes, treatment and case
studies. Journal of Cleaner Production, 14: 1139–1145.
Akratos, C.S. and Tsihrintzis, V.A., 2007. Effect of temperature, HRT, vegetation and porous
media on removal efficiency of pilot-scale horizontal subsurface flow constructed
wetlands. Ecological Engineering, 29: 173-191.
Aktas, E.S., Imre, S., Ersoy, L., 2001. Characterization and lime treatment of olive mill
wastewater. Water Research, 35: 2336-2340; doi: 10.1016/S0043-1354(00)00490-5.
Allen S.E., (Editor) 1974. Chemical analysis of ecological materials. Blackwell Scientific
Publication, Oxford.
Allende, K.L., Fletcher, T.D., Sun, G., 2012. The effect of substrate media on the removal of
arsenic, boron and iron from an acidic wastewater in planted column reactors.Chemical
Engineering Journal, 179:119–130; doi: 10.1016/j.cej.2011.10.069.

Treatment of Industrial and Agro-Industrial Wastewater Using Constructed Wetlands Mar-Yam Sultana
References 179
Alves, M.M., González Beça, C.G., Carvalho, R.G. de, Castanheira, J.M., Pereira, M.C.S.,
Vasconcelos, L.A.T., 1993. Chromium removal in tannery wastewaters “polishing” by
Pinus sylvestris bark. Water Research, 27: 1333–1338; doi: 10.1016/0043-
1354(93)90220-C.
Anderson, R.A., 1989. Essentiality of chromium in humans. Science of The Total
Environment, 86:75-81; doi: 10.1016/0048-9697(89)90196-4.
Anderson, R.A., 1997. Chromium as an essential nutrient for humans. Regulatory Toxicology
and Pharmacology, 26: 35–4; doi: 10.1006/rtph.1997.1136.
Anon, 1974. Medical and Biological effects of pollutants: chromium. National Academy
Press, Washington.
APHA, 1998. American Public Health Association, AWWA, American Water Works
Association), Standard Methods for the Examination of Water and Wastewater, (20th
Edition), Washington, D.C.
APHA, AWWA, and WPCF 1989. Standard Methods for the Examination of Water and
Wastewater. American Public Health Association, American Water Works Association
and Water Pollution Control Federation, 17th edn,Washington, DC.
Arias C.A., Bubba M.D., Brix H., 2001, Phosphorus removal by sands for use as media in
subsurface flow constructed reed beds, Water Resources, 5: 1159-1168.
Arias, C.A., Brix, H., 2005. Phosphorus removal in constructed wetlands: Can suitable
alternative media be identified? Water Science and Technology, 51: 267–273.
Armstrong, J. and Armstrong, W., 1988. Phragmites australis: A preliminary study of soil-
oxidizing sites and internal gas transport pathways. New Phytologist, 108, 373-382.
Armstrong, W., Armstrong, J., Beckett, P.M., 1990. Measurement and modelling of oxygen
release from roots of Phragmites australis, in: P.F. Cooper, and B.C. Findlater, eds.,

Treatment of Industrial and Agro-Industrial Wastewater Using Constructed Wetlands Mar-Yam Sultana
References 180
Constructed Wetlands in Water Pollution Control, Pergamon Press, Oxford, UK, pp. 41-
51.
Aroua, M.K., Zuki, F.M., Sulaiman, N.M., 2007. Removal of chromium ions from aqueous
solutions by polymerenhanced ultrafiltration. Journal of Hazardous Materials, 147: 752–
758. doi:10.1016/j.jhazmat.2007.01.120.
Arroyo, P., Ansola, G., de Luis, E., 2010. Effectiveness of a Full-Scale Constructed Wetland
for the Removal of Metals from Domestic Wastewater. Water Air and Soil Pollution,
210: 473–481.
Atamer, Z., Samtlebe, M., Neve, H., Heller, K.J., Hinrichs, J., 2013. Review: elimination of
bacteriophages in whey and whey Products. Frontiers in Microbiology, 4: 1-9; doi:
10.3389/fmicb.2013.00191.
Atlas, R.M., 1981. Microbial degradation of petroleum hydrocarbons: An environmental
perspective. Microbiological Reviews, 45,180–209.
Awomeso, J.A., Taiwo, A.M., Gbadebo, A.M., Adenowo, J.A., 2010. Studies on the pollution
of water body by textile industry effluents in Lagos, Nigeria. Journal of Applied
Sciences in Environmental Sanitation, 5: 353–359.
Babatunde, A.O. and Zhao, Y.Q., 2010. Two strategies for improving animal farm wastewater
treatment in reed beds. Environmental Technology, 31: 1343-1348;
doi:10.1080/09593331003720623.
Bahlo, K.E. and Wachs, F.G., 1990. Purification of domestic sewage with and without faeces
by vertical intermittent filtration in reed and rush beds, in: Constructed Wetlands in
Water Pollution Control, P.F. Cooper and B.C. Findlater, eds., Pergamon Press, Oxford,
UK, pp. 215-221.
Baig, S., Coulomb, I., Courant, P., Liechti, P., 1999. Treatment of landfill leachates:
Lapeyrouse and Satrod case studies. Ozone: Science & Engineering, 21: 1–22; doi:
10.1080/01919519908547255.

Treatment of Industrial and Agro-Industrial Wastewater Using Constructed Wetlands Mar-Yam Sultana
References 181
Baker, L.F., Ciborowski, J.J.H., MacKinnon, M.D., 2012. Petroleum coke and soft tailings
sediment in constructed wetlands may contribute to the uptake of trace metals by algae
and aquatic invertebrates. Science of the Total Environment, 414: 177–186.
Bankar, A.V., Kumar, A.R., Zinjarde, S.S., 2009. Removal of chromium(VI) ions from
aqueous solution by adsorption onto two marine isolates of Yarrowia lipolytica. Journal
of Hazardous Materials, 170: 487-494; doi: 10.1016/j.jhazmat.2009.04.070.
Baral A. and Engelken, R.D., 2002. Chromium-based regulations and greening in metal
finishing industries in the USA. Environmental Science & Policy, 5: 121-133; doi:
10.1016/S1462-9011(02)00028-X.
Baral, S.S., Dasa, S.N., Rath, P., 2006. Hexavalent chromium removal from aqueous solution
by adsorption on treated sawdust. Biochemical Engineering Journal, 31: 216-222; doi:
10.1016/j.bej.2006.08.003.
Barko, J.W., Gunnison, D., Carpenter, S.R., 1991. Sediment interactions with submersed
macrophyte growth and community dynamics. Aquatic Botany, 41: 41-65; doi:
10.1016/0304-3770(91)90038-7
Barlett, R.J. and James, B.R., 1988. Mobility and bioavailability of Chromium in soils. In:
Nriagu J.O., Nieboer E. (Eds), Chromium in Natural and Human Environment, John
Wiley and Sons Inc., New York, pp 267-304.
Barnhart, J., 1997. Occurrences, uses, and properties of chromium. Regulatory, Toxicology
and Pharmacology, 26: S3–S7.
Beattie, J.K. and Haight, G.P., 1972. Chromium(VI) Oxidations of Inorganic Substrates.
Interscience, New York.
Beaubien, A. and Jolicoeur, C., 1984. The toxicity of various heavy metal salts, alcohols and
surfactants to microorganisms in a biodegradation process: a flow microcalorimetry
investigation. In: In: Liu D, Dutka BJ (eds) Toxicity Screening Procedures Using
Bacterial Systems, Marcel Dekker, New York, pp. 261-281.
Treatment of Industrial and Agro-Industrial Wastewater Using Constructed Wetlands Mar-Yam Sultana
References 182
Belyea, R.L., Williams, J.E., Gieseka, L., Clevenger, T.E., Brown, J.R., 1990. Evaluation of
Dairy waste water solids as a feed Ingredient. Journal of Dairy Science, 73: 1864-1871;
doi: http://dx.doi.org/10.3168/jds.S0022-0302(90)78867-4.
Benjamin, M. M., 1983. Adsorption and surface precipitation of metals on amorphous iron
oxyhydroxide. Environmental Science and Technology, 17: 686–692; doi:
10.1021/es00117a012.
Bielicka, A., Bojanowska, I., Wisniewski, A., 2005. Two Faces of Chromium-Pollutant and
Bioelement. Polish Journal of Environmental Studies, 14: 5-10.
Bisschops, I. and Spanjers, H., 2003. Literature review on textile wastewater characterization.
Environmental Technology, 24: 1399-1411
Bodzek, M., Lobos-Moysa, E., Zamorowska, M., 2006. Removal of organic-compounds from
municipal landfill leachate in a membrane bioreactor. Desalination, 198:16-23; doi:
10.1016/j.desal.2006.09.004.
Bosnic, M., Buljan, J., Daniels, R.P., 2000. Pollutants in tannery effluents. United Nations
Industrial Development Organization, Regional Programme for Pollution Control in the
Tanning Industry in South-East Asia. US/RAS/92/120.
Boutwell, J. and Hutchings, J., 1999. Nutrient uptake research using vegetated floating
platforms, Las Vegas Wash Delta, Lake Mead National Recreation Area, Lake Mead,
Nevada. Bureau of Reclamation Technical Memorandum, No. 8220-99-03, 7 May,
1999.
Boyter, H. A., 2007. Environmental legislations USA. In Environmental aspects of textile
dyeing, Edited by: Christie, R. M. Cambridge, England: Woodhead.
Bremner, J.M. and Mulvaney, C.S., 1982. Nitrogen-total, principles of Kjeldahl methods (p
599-616). In: Page, A.L., Miller, R.H., Keeney, D.R. (Eds.), Methods of soil analysis
chemical and mineralogical properties, second ed. Agronomy No 9 (part 2) ASA Inc.,
Madison Wisconsin, USA, p. 1159.

Treatment of Industrial and Agro-Industrial Wastewater Using Constructed Wetlands Mar-Yam Sultana
References 183
Brisson, J. and Chazarenc, F., 2009. Maximizing pollutant removal in constructed wetlands:
should we pay more attention to macrophyte species selection? Science of The Total
Environment, 407: 3923–3930.
Brix 1997. Do macrophytes play a role in constructed treatment wetlands? Water Science and
Technology. 35: 11-17.
Brix, H. and Schierup, H.H., 1989. The use of aquatic macrophytes in water-pollution control.
Ambio, 18: 100-107.
Brix, H., 1987. Treatment of wastewater in the rhizosphere of wetland plants – the root zone
method. Water Science and Technology, 19: 107-118.
Brix, H., 1992. Constructed wetlands for municipal wastewater treatment in Europe,
Proceedings: Wetland Systems in Water Pollution Control. University of New South
Wales, Sydney, Australia.
Brix, H., 1993. Wastewater Treatment in Constructed Wetlands: System Design, Removal
Processes, and Treatment Performance. Constructed Wetlands for Water Quality
Improvement. G. A. Moshiri. Florida, America, CRC Press, pp 9-22.
Brix, H., 1994. Functions of macrophytes in constructed wetlands. Water Science &
Technology, 29: 71-78.
Brix, H., 1998. Denmark, in: Constructed Wetlands for Wastewater Treatment in Europe, J.
Vymazal, H. Brix, P.F. Cooper, M.B. Green, and R. Haberl, eds., Backhuys Publishers,
Leiden, The Netherlands, pp. 123-156.
Brix, H., 2003. Plants used in constructed wetlands and their functions, Technical articles, 1st
international seminar on the use of aquatic macrophytes for wastewater treatment in
constructed wetlands,May, 8 – 10.
Brix, H. and Schierup, H.H., 1990. Soil oxygenation in constructed reed beds: the role of
macrophyte and soil-atmosphere interface oxygen transport, in: P.F. Cooper, and B.C.
Treatment of Industrial and Agro-Industrial Wastewater Using Constructed Wetlands Mar-Yam Sultana
References 184
Findlater, eds., Constructed Wetlands in Water Pollution Control, Pergamon Press,
Oxford, UK, pp. 53-66.
Brix, H., Arias, C.A., Johansen, N.H., 2002. BOD and nitrogen removal from municipal
wastewater in an experimental two stage vertical flow constructed wetland system with
recycling. In: Proceedings of the Eighth International Conference on Wetland Systems
for Water Pollution Control, Arusha, Tanzania, 16–19 September, pp. 400–410.
Brix, H. and Arias, C.A. 2005. The use of vertical flow constructed wetlands for on-site
treatment of domestic wastewater: new Danish guidelines. Ecological Engineering, 25:
491-500.
Brown, D. and Laboureur, P., 1983. The aerobic biodegradability of primary aromatic amines.
Chemosphere 12: 405–414.
Browne, W. and Jenssen, P.D., 2005. Exceeding tertiary standards with a pond/reed bed
system in Norway. Water Science & Technology, 51: 299-306.
Bubba, M.D., Checckini, L., Pifferi, C., Zanieri, L., Lepri, L., 2004. Olive mill waste water
treatment by a pilot scale subsurface horizontal flow constructed wetland, Annali di
Chimica, Societa Chimica Italiana, 94: 875-887.
Bunce, R.G.H., Smart, S.M., van de Poll, H.M., Watkins, J.W., Scott, W.A., 1999. Measuring
change in British vegetation. ECOFACT Vol. 2. ITE Merlewood.
Calheiros C.S.C., Silva, G., Quiterio, P.V.B., Crispim, L.F.C., Brix, H., Moura, S.C., Castro,
Paula M.L., 2012. Toxicity of High Salinity Tannery Wastewater and Effects on
Constructed Wetland Plants. International Journal of Phytoremediation, 14:669–680;
doi: 10.1080/15226514.2011.619233.
Calheiros, C.S.C., Rangel, A.O.S.S., Castro, P.M.L., 2007. Constructed wetland systems
vegetated with different plants applied to the treatment of tannery wastewater. Water
Research, 41: 1790–1798; doi: 10.1016/j.watres.2007.01.012.

Treatment of Industrial and Agro-Industrial Wastewater Using Constructed Wetlands Mar-Yam Sultana
References 185
Calheiros, C.S.C., Rangel, A.O.S.S., Castro, P.M.L., 2008a. Evaluation of different substrates
to support the growth of Typha latifolia in constructed wetlands treating tannery
wastewater over long-term operation. Bioresource Technology, 99: 6866–6877; doi:
10.1016/j.biortech.2008.01.043.
Calheiros, C.S.C., Rangel, A.O.S.S., Castro, P.M.L., 2008b. The Effects of Tannery
Wastewater on the Development of Different Plant Species and Chromium
Accumulation in Phragmites australis, Archives of Environmental Contamination and
Toxicology, 55: 404–414.
Calheiros, C.S.C., Rangel, A.O.S.S., Castro, P.M.L., 2009. Treatment of industrial wastewater
with two-stage constructed wetlands planted with Typha latifolia and Phragmites
australis. Bioresource Technology, 100: 3205–3213; doi:
10.1016/j.biortech.2009.02.017.
Calheiros, C.S.C., Teixeira, A., Pires, C., Franco, A.R., Duque, A.F., Crispim, L.F. C., Moura,
S.C., Castro, P.M.L., 2010. Bacterial community dynamics in horizontal flow
constructed wetlands with different plants for high salinity industrial wastewater
polishing. Water research, 44: 5032-5038; doi: 10.1016/j.watres.2010.07.017.
Callaway, R.M. and King, L., 1996. Oxygenation of the soil rhizosphere by Typhn latifolia
and its facilitative effects on other species. Ecology 77: 1189-1 195
Carawan, R. E., Jones, V.A., Hanseen, A.P., 1979. Wastewater characterization in a
Multiproduct Dairy. Journal of Dairy Science, 62: 1243-1251; doi:
http://dx.doi.org/10.3168/jds.S0022-0302(79)83407-4.
Carvalho, F., Prazeres, A.R., Rivas, J., 2013. Review, Cheese whey wastewater:
Characterization and treatment. Science of the Total Environment, 445–446: 385–396;
doi: 10.1016/j.scitotenv.2012.12.038.
Caselles-Osorio, A. and Garcia, J., 2006. Performance of experimental horizontal subsurface
flow constructed wetlands fed with dissolved or particulate organic matter. Water
Research, 40: 3603–3611.

Treatment of Industrial and Agro-Industrial Wastewater Using Constructed Wetlands Mar-Yam Sultana
References 186
Castello, E., Santos, C.G., Iglesias, T., Paulino, G., Wenzel, J., Borzacconi L, Etchebehere,
C., 2009. Feasibility of biohydrogen production from cheese whey using a UASB
reactor: links between microbial community and reactor performance. International
Journal of Hydrogen Energy, 34: 5674–5682.
Cervantes, C. and Campos-Garcia, J., 2007. Reduction and Efflux of Chromate by Bacteria.
Molecular Microbiology of Heavy Metals. Springer-Verlag, Berlin Heidelberg, pp. 407-
419.
Cervantes, C., Garcia, J. C., Devars, S., Corona, F.G., Tavera, H.L., Torres-Guzman, J.C.,
Moreno-Sánchez, R., 2001. Interactions of chromium with micro-organisms and plants.
FEMS Microbiology Review, 25: 335– 347.
Chandra, P. and Kulshreshtha, K., 2004. Chromium accumulation and toxicity in aquatic
vascular plants. The Botanical Review, 70:313–327; doi: 10.1663/0006-
8101(2004)070[0313:CAATIA]2.0.CO;2.
Chappell, K.R. and Goulder, R., 1994. Seasonal variation of epiphytic extracellular enzyme
activity on two freshwater plants, Phragmites australis and Elodea canadensis.
Archives in Hydrobiology, 132: 237-253.
Chattopadhyay, B., Gupta, R., Chatterjee, A., Mukhopadhyay, S.K., 1999. Characterization
and eco-toxicity of tannery wastes envisaging environmental impact
assessment. Journal of The American Leather Chemists Association, 94:337–346.
Chatzipaschali, A. A. and Stamatis, A. G., 2012. Biotechnological Utilization with a Focus on
Anaerobic Treatment of Cheese Whey: Current Status and Prospects. Energies, 5: 3492-
3525; doi:10.3390/en5093492.
Chegini, G., HamidiSepehr, A., Dizaji, M.F., Mirnezami, S.V., 2014. Study of physical and
chemical properties of spray drying whey powder. International Journal of Recycling of
Organic Waste in Agriculture, 3:62; doi 10.1007/s40093-014-0062-2.

Treatment of Industrial and Agro-Industrial Wastewater Using Constructed Wetlands Mar-Yam Sultana
References 187
Chen, C. and Wang, J., 2007. Influence of metal ionic characteristics on their biosorption
capacity by Saccharomyces cerevisia. Applied Microbiology and Biotechnology, 74:
911-917; doi: 10.1007/s00253-006-0739-1.
Chen, J.M. and Hao, O.J., 1997. Biological removal of aqueous hexavalent chromium.
Journal of Chemical Technology and Biotechnology, 69: 70–76.
Cheng, S., Grosse, W., Karrenbrock, F. and Thoennessen, M. 2002. Efficiency of constructed
wetlands in decontamination of water polluted by heavy metals. Ecological
Engineering, 18: 317–325.
Chingombe, P., Saha, B., Wakeman, R.J., 2005. Surface modification and characterisation of
a coal-based activated carbon. Carbon, 43: 3132–3143; doi:10.1016/j.
carbon.2005.06.021.
Chirwa, N.E.M. and Wang, Y.T., 2004. Modeling hexavalent chromium removal in a Bacillus
sp. fixed-film bioreactor. Biotechnology and Bioengineering, 87: 874–883; doi:
10.1002/bit.20196.
Choi, J.W., Song, H.K., Lee, W., Koo, K.K., Han, C., Na, B.K., 2004. Reduction of COD and
colour of acid and reactive dyestuff wastewater using ozone. Korean Journal of
Chemical Engineering, 21: 398-403.
Choo, T. P., Lee, C.K., Low, K.S., Hishamuddin, O. 2006. Accumulation of chromium (VI)
from aqueous solutions using water lilies (Nymphaea spontanea).Chemosphere, 62:
961–967.
Chowdhury, A.K.M.M.B., Akratos, C. S., Vayenas, D.V., Pavlou, S., 2013. Olive mill waste
composting: a review. International Biodeterioration & Biodegradation 85: 108-119.
Chua, H., Yu, P.H.F., Sin, S.N. and Cheung, M.W.L. 1999. SubLethal Effects of Heavy
Metals on Activated Sludge Microorganisms. Chemosphere, 39: 2681–2692.
Christensen, J.S. and Elton, J., 1996. Augmented Bioremediation. Dept of Civil Engineering,
Virginia Tech, CE 4594: Soil and Groundwater pollution from BTEX.

Treatment of Industrial and Agro-Industrial Wastewater Using Constructed Wetlands Mar-Yam Sultana
References 188
Comin, F.A., Romero, J.A., Astorga, V., Garcia, G., 1997. Nitrogen removal and cycling in
restored wetlands used as filters of nutrients for agricultural runoff. Water Science &
Technology 35: 255-261.
Cimino, G. and Caristi, C., 1990. Acute Toxicity of Heavy Metals to Aerobic Digestion of
Waste Cheese Whey. Biological Wastes, 33:201-210; doi: 10.1016/0269-
7483(90)90005-D.
Cobbett, C.S., Goldsbrough, P.B., 2000. Mechanisms of metal resistance: phytochelatins and
metallothioneins. In: Raskin, I., Ensley, B. D. (Eds.), Phytoremediation of Toxic
Metals: Using Plants to Clean up the Environment. Wiley, New York, pp. 247-270.
Cohen, M.D., Kargacin, B., Klein, B., Costa, M., 1993. Mechanisms of chromium
carcinogenicity and toxicity. Critical Reviews in Toxicology 23: 255-281; doi:
10.3109/10408449309105012.
Comino, E., Riggio, V., Rosso, M., 2011. Mountain cheese factory wastewater treatment with
the use of a hybrid constructed wetland. Ecological Engineering, 37: 1673–1680.
Conn, R.M. and Fiedler, F.R., 2006. Increasing hydraulic residence time in constructed
stormwater treatment wetlands with designed bottom topography. Water Environment
Research, 78: 2514–2523; doi: 10.2175/106143006X101944.
Conradie, A., Sigge, G.O., Cloete, T.E., 2014. Influence of Winemaking Practices on the
Characteristics of Winery Wastewater and Water Usage of Wineries. South African
Journal of Enology and Viticulture, 35, 1, 2014.
Cooper P. F., 1993. The use of reed bed systems to treat domestic sewage: the European
design and operations guidelines for reed bed treatment systems. In: Constructed
Wetlands for Water Quality Improvement. G. A. Moshiri Ed., Lewis, Boca Raton, pp.
203-217.
Cooper, P., 1999. A review of design and performance of VF and hybrid reed bed treatment
system. Water Science and Technology, 40: 1-9; doi: 10.1016/S0273-1223(99)00414-X.

Treatment of Industrial and Agro-Industrial Wastewater Using Constructed Wetlands Mar-Yam Sultana
References 189
Cooper, P. and Green, B., 1995. Reed bed treatment systems for sewage treatment in the
United Kingdom-The first 10 years experience. Water Science and Technology, 32(3),
317-327; doi: 10.1016/0273-1223(95)00632-X.
Cooper, P.F., Job, G.D., Green, M.B., and Shutes, R.B.E., 1996. Reed Beds and Constructed
Wetlands for Wastewater Treatment, WRc Publications, Medmenham, Marlow, UK;
pp 184.
Corcoran, E., Nellemann, C., Baker, E., Bos, R., Osborn, D., Savelli, H., 2010. Sick Water?
The central role of wastewater management in sustainable development. A Rapid
Response Assessment. United Nations Environment Programme, UN-HABITAT,
GRID-Arendal. www.grida.no; ISBN: 978-82-7701-075-5
Cronk, J.K. and Fennessy, M.S., 2001. Wetland Plants. Biology and Ecology. Lewis
Publishers, Boca Raton, Florida.
Dayan, A.D. and Paine, A. J., 2001. Mechanisms of chromium toxicity, carcinogenicity and
allergenicity: Review of the literature from 1985 to 2000. Human and Experimental
Toxicology 20: 439-451; doi: 10.1191/096032701682693062.
de Souza, M. P., Huang, C. P. A., Chee, N., Terry, N., 1999. Rhizosphere bacteria enhance
the accumulation of selenium and mercury in wetland plants. Planta, 209: 259-263.
DeBusk, W.F., 1999. Wastewater Treatment Wetlands: Contaminant Removal Processes.Soil
and Water Science Department, University of Florida. SL155.
Del Bubba, M., Arias, C.A., Brix, H., 2003. Phosphorus absorption maximum of sands for use
as media in subsurface flow constructed reed beds as measured by the Langmuir
isotherm. Water Research, 37, 3390–3400.
Demirel, B., Yenigun, O., Onay, T.T., 2005. Anaerobic treatment of dairy wastewaters: a
review. Process Biochemistry, 40: 2583–2595; doi: 10.1016/j.procbio.2004.12.015.
Treatment of Industrial and Agro-Industrial Wastewater Using Constructed Wetlands Mar-Yam Sultana
References 190
Di Luca, G.A., Maine, M.A., Mufarrege, M.M., Hadad, H.R., Sanchez, G.C., Bonetto, C.A.,
2011. Metal retention and distribution in the sediment of a constructed wetland for
Industrial wastewater treatment. Ecological Engineering, 37: 1267– 1275; doi:
10.1016/j.ecoleng.2011.03.003.
Dilek, F.B., Gokcay, C.F., Yetis, U., 1998. Combined effects of Ni(II) and Cr(VI) on
activated sludge. Water Research, 32: 303-312; DOI: 10.1016/S0043-1354(97)00225-X.
Dipu, S., Anju, A., Kumar, V., Thanga, S.G., 2010. Phytoremediation of dairy effluent by
constructed wetland technology using wetland macrophytes. Global Journal of
Environmental Research, 4: 90-100.
Dipu, S., Kumar, A.A., Thanga, V.S.G., 2011. Phytoremediation of dairy effluent by
constructed wetland technology. Environmentalist 31, 263-278.
Dorman, L., Castle, J.W., Rodgers J.H. Jr., 2009. Performance of a pilot-scale constructed
wetland system for treating simulated ash basin water. Chemosphere 75, 939–947.
Dotro G., Larsen D., Paul P., 2011a. Preliminary Evaluation of Biological and Physical
Chemical Chromium Removal Mechanisms in Gravel Media Used in Constructed
Wetlands. Water Air Soil Pollution, 215: 507-515.
Dotro, G., Larsen, D., & Palazolo, P., 2011b. Treatment of chromium-bearing wastewaters
with constructed wetlands. Water and Environment Journal, 25: 241–249;
doi:10.1111/j.1747-6593.2010.00216.x.
Dotro, G., Castro, S., Tujchneider, O., Piovano, N., Paris, M., Faggi, A., Palazolo, P., Larsen,
D., Fitch, M., 2012. Performance of pilot-scale constructed wetlands for secondary
treatment of chromium-bearing tannery wastewaters. Journal of Hazardous Materials,
239-240: 142-151.
Dotro, G., Palazolo, P., Larsen, D., 2009. Chromium fate in constructed wetlands treating
tannery wastewaters. Water Environment Research, 81: 617–625.

Treatment of Industrial and Agro-Industrial Wastewater Using Constructed Wetlands Mar-Yam Sultana
References 191
Drizo, A., Frost, C.A., Grace, J., Smith, K.A., 1999. Physico-chemical screening of
phosphate-removing substrates for use in constructed wetland systems. Water Research,
33: 3595-3602.
Dube, B.K., Kamlesh, T., Chatterjee, J., Chatterjee, C., 2003. Excess chromium alters uptake
and translocation of certain nutrients in citrullus. Chemosphere 53:1147–1153.
Dunbabin, J.S. and Bowmer, K.H., 1992. Potential use of constructed wetlands for treatment
of industrial wastewaters containing metals. Science of the Total Environmental, 111:
151–168.
Duncan, J.R., Stoll, A., Wilhelmi, B., Zhao, M., Van Hille, R., 2003. The use of algal and
yeast biomass to accumulate toxic and valuable heavy metals from wastewater. Final
report to the water research commission: Rhodes University.
Dunne, E.J, Culleton, N., Donovan, G. O, Harrington, R., Olsen, A.E. 2005. An integrated
constructed wetland to treat contaminants and nutrients from dairy farmyard dirty water;
Ecological Engineering 24: 221–234.
Durkin, T.V. and Herrmann, J.G., 1994. Focusing on the Problem of Mining Wastes: An
Introduction to Acid Mine Drainage. IN Managing Environmental Problems at Inactive
and Abandoned Mine Sites. US EPA Seminar Publication.
Dzombak, D.A. and Morel, F.M.M., 1990. Surface Complexation Modeling: Hydrous Ferric
Oxide. John Wiley & Sons, Inc.
EC, 1998. The council of the European Union, establishing criteria and procedures for the
acceptance of waste at landfills pursuant to Article 16 of an Annex II to Directive
1999/31/EC (2003/33/EC).
EC-Official Journal of the European Communities, 1998. December 12, L330/32

Treatment of Industrial and Agro-Industrial Wastewater Using Constructed Wetlands Mar-Yam Sultana
References 192
EC (European Commission), 2003. Integrated Pollution Prevention and Control (IPPC):
Reference Document on Best Available Techniques for the Tanning of Hides and Skins.
European IPPC Bureau, Seville, Spain.
EC, 2009. Communication from the European Commission to the Council 2009/385/EC of 22
July 2009 on Dairy Market Situation 2009
EFSA 2009, European Food Safety Authority, Safety and efficacy of chromium methionine
(Availa®Cr) as feed additive for all species, The EFSA Journal, 1043: 1-69.
Ellis, J. B., Shutes, R.B.E., Revitt, D.M., 2003. Guidance Manual for Constructed Wetlands.
R&D Technical Report P2-159/TR2; Urban Pollution Research Centre, Middlesex
University, London; Environment Agency, Rio House, Waterside Drive, Aztec West,
Almondsbury, BRISTOL, BS32 4UD
Elwood, J.W., Beuchamp, J.J., Allen, C.P., 1980. Chromium levels in fish from a lake
chronically contaminated with chromate from cooling towers. International Journal of
Environmental Studies, 14: 289–298; doi: 10.1080/00207238008737408.
Emongor, V., Nkegbe, E., Kealotswe, B., Koorapetse, I., Sankwasa, S., Keikanetswe, S.,
2005. Pollution Indicators in Gaborone Industrial Effluent. Journal of Applied Sciences,
5: 147-150.
EPA 2000b. A Handbook of Constructed Wetlands, A Guide to Creating Wetlands for:
Agricultural Wastewater, Domestic Wastewater, Coal Mine Drainage, Stormwater in
the Mid-Atlantic Region. Volume 1: General Considerations. United Sates
Environmental Protection Agency, Washington DC, New York, USA.
EPA, 1984. Locating and Estimating Air Emissions from Sources of Chromium, Office of Air
Quality Planning and Standards, US Environmental Protection Agency, Research
Triangle Park, NC.
EPA, 1993. Constructed wetlands for wastewater treatment and wildlife habitat. 17 Case
studies, EPA 832-R-93-005.
Treatment of Industrial and Agro-Industrial Wastewater Using Constructed Wetlands Mar-Yam Sultana
References 193
EPA, 1995. A Handbook of Constructed Wetlands, A Guide To Creating Wetlands For:
Agricultural Wastewater, Domestic Wastewater, Coal Mine Drainage, Stormwater In
The Mid-Atlantic Region, Volume1, General Considerations. EPA: 903b95004a. United
Sates Environmental Protection Agency, USA.
EPA, 1998. Toxicological review of hexavalent chromium (CAS No. 18540-29-9),
www.epa.gov/iris/toxreviews/0144tr.pdf.
EPA, 2000a, Environmental Protection Agency, Process Descriptions for the Food and Drink
sector, IPPC Technical Guidance Note, First Series, UK.
EPA, 2006. Environmental Protection Agency, Metal Speciation Equilibrium Model for
Surface and Ground Water,MINTEQA2.
EPA, 2007. Chromium Toxicological Overview. Version 1, Institute of Environment and
Health Cranfield University 2007.
Ertugrul, T., Berktay, A., Nas, B., 2006. Influence of salt and Cr(VI) Shock Loadings on
Oxygen Utilization and COD Removal in SBR. Environmental Engineering Science,
23: 1055-1064; doi: 10.1089/ees.2006.23.1055.
EU (European Union directive) "Council Directive 91/271/EEC of 21 May 1991 concerning
urban waste-water treatment (91/271/EEC)"
EU, 2004. Heavy metals and organic compounds from wastes used as organic fertilisers, Ref.
Nr.: TEND/AML/2001/07/20.
Evans, L. J., Spiers, G. A., Zhao, G., 1995. Chemical Aspects of Heavy Metal Solubility with
Reference to Sewage Sludge-Amended Soils. International Journal of Environmental
and Analytical Chemistry, 59: 291-302; doi: 10.1080/03067319508041335.
Farag, A.M., May, T., Marty, G.D., Easton, M., Harper, D.D., Little, E.E., Cleveland, L.,
2006. The effect of chronic chromium exposure on the health of Chinook salmon
(Oncorhynchus tshawytscha). Aquatic Toxicology, 76: 246–257.
Treatment of Industrial and Agro-Industrial Wastewater Using Constructed Wetlands Mar-Yam Sultana
References 194
Farizoglu, B., Keskinler, B., Yildiz, E., Nuhoglu, A., 2004. Cheese whey treatment
performance of an aerobic jet loop membrane bioreactor. Process Biochemistry, 39:
2283–2291; doi: 10.1016/j.procbio.2003.11.028
Farnet, A.M., Prudent, P., Ziarelli, F., Domeizel, M., Gros, R., 2009. Solid-state 13C NMR to
assess organic matter transformation in a subsurface wetland under cheese-dairy farm
effluents. Bioresources Technology, 100: 4899-4902.
Feng, D., van Deventer, J.S.J., Aldrich, C., 2004. Removal of pollutants from acid mine
wastewater using metallurgical by-product slags. Separation and Purification
Technology, 40: 61–67; doi: 10.1016/j.seppur.2004.01.003.
Fibbi, D., Doumett, S., Lepri, L., Checchini, L., Gonnelli, C., Coppini, E., Del Bubba, M.,
2012. Distribution and mass balance of hexavalent and trivalent chromium a subsurface,
horizontal flow (SF-h) constructed wetland operating as post-treatment of textile
wastewater for water reuse. Journal of Hazardous Materials, 199–200: 209–216.
Flora, S. D., Bagnasco, M., Serra, D., Zanacchi, P., 1990. Genotoxicity of chromium
compounds. A review. Mutation Research/Reviews in Genetic Toxicology, 238: 99-
172; doi: 10.1016/0165-1110(90)90007-X.
Fotovat, A., Naidu, R., Oades, J. M., 1996. The Effect of Major Cations and Ionic Strength on
Desorption of Native Heavy Metals in Acidic and Sodic Soils. The 1st International
Conference on Contaminants in the Soil Environment, Adelaide, 1996, pp. 193-194.
Fox, P.F., 1999. Cheese: Chemistry, Physics And Microbiology. Volume 2, Major Cheese
Groups, Second Edition, A Chapman & Hall Food Science Book, An Aspen
Publication® Aspen Publishers, Inc. Gaithersburg, Maryland.
Fox, P.F., 2003. Milk proteins: general and historic aspects, in Advanced Dairy Chemistry –1,
Proteins, 3rd
Edition (ed. P.F. Fox and P.L.H. McSweeney), Kluwer Academic/Plenum
Publishers, New York, USA (2003); pp 5-55.

Treatment of Industrial and Agro-Industrial Wastewater Using Constructed Wetlands Mar-Yam Sultana
References 195
Fox, P.F., Guinee, T.P., Logan, T.M. and Sweeney.P.L.H., 2000. Fundamentals of cheese
science. Aspen Publisher, Inc. Gaithersburg, MD.
Francis, A.S., 1996. Augmented Bioremediation. CE 4594: Soil and Groundwater pollution.
Virginia Tech, USA.
Gad, C.S., 1989. Acute and chronic systematic chromium toxicity. Science of The Total
Environment, 86: 149–157.
Gajalakshmi, S. and Abbasi, S.A., 2008. Solid waste management by composting: state of the
art. Critical Reviews on Environmental Science & Technology 38, 311-400.
Gambrell, R.P. 1994 Trace and toxic metals in wetlands - a review. Journal of Environmental
Quality, 23: 883-891.
Ganesh, S.K., Sundaramoorthy, P., Chidambaram, A.L.A., 2006. Chromium toxicity effect on
blackgram, soybean and paddy. Pollution Research 25:257–261.
Gardea-Torresdey, J.L, de la Rosa, G., Peralta-Videa, J. R., Montes, M., Cruz-Jimenez, G.,
Cano-Aguilera, I., 2005. Differential uptake and transport of trivalent and hexavalent
chromium by tumbleweed (Salsola kali). Archives of Environmental Contamination and
Toxicology, 48: 225–232.
Gasiunas, V., Strusevicius, Z., Struseviciene, M.S., 2005. Pollutant removal by horizontal
subsurface flow constructed wetlands in Lithuania. Journal of Environmental Science
and Health, 40: 1467-1478.
Gersberg, R., Brenner, R., Lyon, S., Elkins, B., 1984. Survival of Bacteria and Viruses in
Municipal Wastewaters Applied to Artificial Wetlands. Graduate School of Public
Health, Santiago State University. Magnolia publishing, pp 237-245.
Gersberg, R.M, Elkins, B.V, Lyon, S.R, Goldman, C.R., 1986. Role of aquatic plants in
wastewater treatment by artificial wetlands. Water Research, 20: 363–368.

Treatment of Industrial and Agro-Industrial Wastewater Using Constructed Wetlands Mar-Yam Sultana
References 196
Gersberg, R.M. Gearheart, R.A. Ives, M., 1989. Pathogen removal in constructed wetlands.
In: Hammer D.A., editor. Constructed Wetlands for Wastewater Treatment; Municipal,
Industrial and Agricultural. Chelsea, MI: Lewis; pp 431.
Ghaly, A.E. and Kamal, M.A., 2004. Submerged yeast fermentation of acid cheese whey for
protein production and pollution potential reduction. Water Research, 38: 631-644; doi:
10.1016/j.watres.2003.10.019.
Ghaly, A.E., 1996. A comparative study of anaerobic digestion of acid cheese whey and
wairy wanure in a two-stage reactor. Bioresource Technology, 58: 61–72.
Ghosh, D. and Gopal, B., 2010. Effect of hydraulic retention time on the treatment of
secondary effluent in a subsurface flow constructed wetland. Ecological Engineering
36, 1044-1051; doi: 10.1016/j.ecoleng.2010.04.017.
Gode, F. and Pehlivan, E., 2007. Sorption of Cr(III) onto chelating bDAEG–sporopollenin
and CEP–sporopollenin resins. Bioresource Technology, 98: 904–911; doi:
10.1016/j.biortech.2006.02.043.
Gopal, B. and Masing, V., 1990. Biology and ecology, in: Wetlands and Shallow Continental
Water Bodies, B.C. Patten (ed.), SPB Academic Publishing bv, The Hague, The
Netherlands, pp. 91-239.
Gorbi, G. and Corradi, M.G., 1993. Chromium toxicity on two linked trophic levels. I. Effects
of contaminated algae on Daphnia magna. Ecotoxicology and environmental safety, 25:
64-71.
Gottschall, R., Boutin, C., Crolla, A., Kinsley, C., Champagne, P., 2007. The role of plants in
the removal of nutrients at a constructed wetland treating agricultural (dairy) wastewater
Ontario, Canada. Ecological Engineering, 29: 154-163.
Grafias, P., Xekoukoulotakis, N.P., Mantzavinos, D., Diamadopoulos, E., 2010. Pilot
treatment of olive pomace leachate by vertical-flow constructed wetland and
Treatment of Industrial and Agro-Industrial Wastewater Using Constructed Wetlands Mar-Yam Sultana
References 197
electrochemical oxidation: An efficient hybrid process. Water Research 44: 2773–2780;
doi: 10.1016/j.watres.2010.02.015.
Grant, N. and Griggs, J., 2001. Reed beds for the treatment of domestic wastewater, Biolding
research Establishment, CRC Press Ltd, London.
Gray, N.F., 2004. Biology of Wastewater Treatment. Series on Environmental Science and
Management, Vol 4. 2nd
edition. Imperial College Press, pp 1421.
Greenway, M. and Woolley, A., 2000. Changes in plant biomass and nutrient removal over 3
years in a constructed free water surface flow wetland in Cairns Australia, 7th
International Conference on Wetland Systems for Water Pollution Control. Lake Buena
Vista, Florida, pp. 707-718.
Grobicki, A., 2007. The future of water use in industry, in Proceedings of the Symposium on
Water Productivity in the Industry of the Future in UNIDO Technology Foresight
Summit.
Guimarães, P.M.R., Teixeira, J.A., Domingues, L., 2010. Fermentation of lactose to bio-
ethanol by yeasts as part of integrated solutions for the valorisation of cheese whey.
Biotechnology Advances, 28: 375–384; doi: 10.1016/j.biotechadv.2010.02.002.
Gumbricht, T., 1993a. Nutrient removal capacity in submersed macrophyte pond systems in a
temperate climate. Ecological Engineering, 2: 49-61.
Gumbricht, T., 1993b. Nutrient removal processes in freshwater submersed macrophyte
systems. Ecological Engineering, 2: 1-30.
Haas, A.R.C., Brusca, J.N., 1961. Effect of chromium on citrus and avocado grown in nutrient
solution. California Agriculture, 15:10–11.
Haberl, R., Grego, S., Langergraber, G., Kadlec, R.H., Cicalini, A.R., Dias, S.M., Novais,
J.M., Aubert, S., Gerth, A., Thomas, H. and Hebner, A., 2003. Constructed wetlands for

Treatment of Industrial and Agro-Industrial Wastewater Using Constructed Wetlands Mar-Yam Sultana
References 198
the treatment of organic pollutants. Journal of Soils and Sediments, 3: 109-124; doi:
http://dx.doi.org/10.1065/jss2003.03.70.
Haberl,R., Perfler,R., Mayer,H., 1995. Constructed Wetlands in Europe. Water Science and
Technology, 32: 305-315; DOI: 10.1016/0273-1223(95)00631-1.
Hachicha, S., Chtourou, M., Medhioub, K., Ammar, E., 2006. Compost of poultry manure and
olive mill wastes as an alternative fertilizer, Agro Sustain. Dev. 26 (2006) 135-142.
Hadad, H.R., Maine, M.A., Bonetto, C.A., 2006. Macrophyte growth in a pilot-scale
constructed wetland for industrial wastewater treatment. Chemosphere, 63: 1744–1753.
Hadad, H.R., Mufarrege, M.M., Pinciroli, M., Di Luca, G.A., Maine, M.A., 2010.
Morphological response of Typha domingensis to an industrial effluent containing
heavy metals in a constructed wetland. Archives of Environmental Contamination and
Toxicology, 58: 666–675; doi: 10.1007/s00244-009-9454-0.
Hadley, R., and Snow, D., 1974. eds.Water Resources and Problems Related to Mining.
American Water Resource Association, MN. 1974.
Hagopian, D.S. and Riley, J.G., 1998. A closer look at the bacteriology of nitrification.
Aquacultural Engineering, 18: 223-244.
Hamad, S.H., 2012. Factors Affecting the Growth of Microorganisms in Food, in Progress in
Food Preservation (eds R. Bhat, A. Karim Alias and G. Paliyath), Wiley-Blackwell,
Oxford, UK. doi: 10.1002/9781119962045.ch20.
Hammer, D.A., 1989. Constructed Wetlands for Wastewater Treatment: Municipal,
Industrial,and Agricultural. Lewis Publishers, Chelsea, MI. pp 831.
Hammer, D.A., 1992. Designing constructed wetland systems to treat agricultural nonpoint
source pollution. Ecological Engineering, 1: 49-82.

Treatment of Industrial and Agro-Industrial Wastewater Using Constructed Wetlands Mar-Yam Sultana
References 199
Han I.S., 1999. Cr(VI) Reduction by Dissolved Fe(II) in Low-Buffered Aqueous Systems.
Environmental Engineering Research, 4: 239-250.
Hansen, J.I. and Anderson, F.O., 1981. Effects of Phragmites australis roots and rhizomes on
redox potentials, nitrification and bacterial numbers in the sediment., 9th Nordic
Symposium, , Malma, Sweden, pp. 72-88.
Hart, B., Cody, R., Truong, P., 2003. Hydroponic vertiver treatment of post seotic tank
effluent. Proceeding-The Third International Conference on Vertiver (ICV3), October
6-9, 2003.
Hashem, A., Akasha, R. A., Ghith, A., Hussein, D.A., 2007. Adsorbent based on agricultural
wastes for heavy metal and dye removal. A review. Energy Education Science and
Technology, 19: 69–86.
Haslam, S.M., 1971a. Community regulation in Phragmites communis Trin. I. Monodominant
stands. Journal of Ecology, 59: 65-73.
Haslam, S.M., 1971b. The development and establishment of young plants of Phragmites
communis Trin., Annals of Botany, 35: 1059-1072.
Hathaway, J.M., Cook, M.J., Evans, R.O., 2010. Nutrient removal capability of a constructed
wetland receiving groundwater contaminated by swine lagoon seepage. American
Society of Agricultural and Biological Engineers, 53: 1-9.
Herouvim, E., Akratos, C.S., Tekerlekopoulou, A.G., Vayenas, D.V., 2011. Treatment of
olive mill wastewater in pilot-scale vertical flow constructed wetlands. Ecological
Engineering, 37: 931-939.
Hilton, B. L. 1993. Performance evaluation of a closed ecological life support system
(CELSS) employing constructed wetlands. In Constructed Wetlands for Water Quality
Improvement, G. A. Moshiri (ed.). CRC Press, Boca Raton, FL, pp 117-125.

Treatment of Industrial and Agro-Industrial Wastewater Using Constructed Wetlands Mar-Yam Sultana
References 200
Hsu, L., 2011. Evaluation of Chromium remediation in groundwater: Investigations using
microbial fuel cells and electrokinetic systems. PhD thesis, Faculty of the USC graduate
school, University of Southern California.
Hubbard, R.K., Gascho, G.J., Newton, G.L., 2004. Use of floating vegetation to remove
nutrients from swine lagoon wastewater. Transactions of the ASCE, 47: 1963–1972.
Huffman, E.W.D. and Allaway, W.H., 1973. Chromium in plants-distribution in tissues,
organelles, and extracts and availability of bean leaf Cr to animals. Journal of
Agricultural and Food Chemistry, 21: 982-986.
Hunt, P.G. and Poach, M.E., 2001. State of the art for animal wastewater treatment in
constructed wetlands. Water science Technology 44: 19-25.
Hunt, P.G., Matheny, T.A., Szogi, A.A., 2003. Denitrification in constructed wetlands used
for treatment of swine wastewater. Journal of Environmental Quality 32: 727-735; doi:
10.2134/jeq2003.0727.
Hunt, P.G., Poach, M.E., Matheny, T.A., Reddy, G.B., Stone, K.C., 2006. Denitrification in
marsh-pond-marsh constructed wetlands treating swine wastewater at different loading
rates. Soil Science Society of America Journal 70: 487-493;
doi:10.2136/sssaj2005.0075
Hunt, P.G., Stone, K.C., Matheny, T.A., Poach, M.E., Vanotti, M.B., Ducey, T.F., 2009.
Denitrification of nitrified and non-nitrified swine lagoon wastewater in the suspended
sludge layer of treatment wetlands. Ecological Engineering, 35: 1514-1522.
Ibekwe, A.M., Grieve, C.M., Lyon, S.R., 2003. Characterization of microbial communities
and composition in constructed dairy wetland wastewater effluent. Applied
Environmental Microbiology 69: 5060-5069; doi: 10.1128/AEM.69.9.5060-5069.2003.
Idris, S.M., Jones, P.L., Salzman, S.A., Croatto, G., Allinson, G., 2012. Evaluation of the
giant reed (Arundo donax) in horizontal subsurface flow wetlands for the treatment of

Treatment of Industrial and Agro-Industrial Wastewater Using Constructed Wetlands Mar-Yam Sultana
References 201
dairy processing factory wastewater. Environmental Science and Pollution Research,
19: 3525–3537; doi: 10.1007/s11356-012-0914-0.
IARC, 1990. International Agency for Research on Cancer, IARC; Monographs of the
Evaluation of the Carcinogenic Risk of Chemicals to Humans: Chromium, Nickel and
Welding, IARC, Lyon, p. 49.
ITRC, 2003. Technical and Regulatory Guidance for Constructed Treatment Wetlands,
Technical/Regulatory Guideline; The Interstate Technology & Regulatory Council:
Wetlands Team; pp128.
IWA Specialist Group, 2000. Constructed wetlands for pollution control. IWA Scientific and
Technical Report no. 8.
IWA, 2000. Constructed wetlands for pollution control. Processes, performance, design and
operation. Scientific and Technical Report No. 8. TJ International (Ltd), Padstow,
Cornwall, UK, pp 156.
Jabeen, R., Ahmad, A., Iqbal, M., 2009. Phytoremediation of heavy metals: physiological and
molecular mechanisms. The Botanical Review, 75: 339-364; doi: 10.1007/s12229-009-
9036-x.
Jacobs, A.J., and Testa, S.M., 2004. Overview of chromium(VI) in the environment:
background and history. J. Guertin, A.J. Jacobs, C.P. Avakian (Eds.), Chromium(VI)
Handbook, CRC Press Inc., Boca Raton, FL (2004) pp. 1–21.
Jakobs, J.A., 2012. Probability of Soil Environment Contamination by Chromium compounds
in Underground CP Systems Utilizing High Silicon Cromium Cast Iron Anodes"
www.anotec.com Article # 40 "HSCI and the Environment".
www.anotec.com/articles/ArticleFiles/Art-40-Soil-&-Environment-Contamination-
Chromium-L110.pdf
James, B.R. and Barlett, R.J., 1983. Behavior of chromium in soils VII. Adsorption and
reduction of hexavalent forms. Journal of Environmental Quality, 12: 177–181.

Treatment of Industrial and Agro-Industrial Wastewater Using Constructed Wetlands Mar-Yam Sultana
References 202
Jamieson, R., Gordon, R., Wheeler, N., Smith, E., Stratton, G., Madani, A., 2007.
Determination of first order rate constants for wetland treating livestock wastewater in
cold climates. Journal of Environmental Engineering and Science 6: 65-72;
doi: 10.1139/s06-028.
Jasko, J., Skripsts, E., Dubrovskis, V., Zabarovskis, E., Kotelenecs, V., 2011. Biogas
production from cheese whey in two phase anaerobic digestion. Engineering for rural
development, Jelgava, 26.-27.05.2011.
Jeejeebhoy, K.N., Chu, R.C., Marliss, E.B., Greenberg, G.R., Brucerobertson, A., 1977.
Chromium deficiency, glucose-intolerance, and neuropathy reversed by chromium
supplementation, in a patient receiving long-germ total parenteral nutrition. The
American Journal of Clinical Nutrition, 30:531-538.
Jun, R., Ling, T., Guanghua, Z., 2009. Effects of chromium on seed germination, root
elongation and coleoptile growth in six pulses. International Journal of Environmental
Science & Technology, 6:571–578; doi: 10.1007/BF03326097.
Kadlec, R. H. and Knight, R.L. 1996. Treatment Wetlands. Lewis Publishers, CRC Press, Inc.
Boca Raton, Fla.
Kadlec, R. H., 1994. Overview: surface flow constructed wetlands, in: Proc. 4th
International
Conference of Wetland Systems for Water Pollution Control, ICWS Secretariat,
Guangzhou, P.R.China, pp. 1-12.
Kadlec, R., Knight, R., Vymazal, J., Brix, H., Cooper, P., Haberl, R., 2000. Constructed
wetlands for pollution control: processes, performance, design and operation. Rep. No.
8, IWA Publishing, London, UK.
Kadlec, R. and Wallace, S., 2009. Treatment Wetlands, 2nd ed. CRC Press.
Kadlec, R.H. and Brix, H., 1995. Wetland Systems for Water Pollution Control. Water
Science and Technology, Vol: 32 (3), Oxford, pp 376.

Treatment of Industrial and Agro-Industrial Wastewater Using Constructed Wetlands Mar-Yam Sultana
References 203
Kadlec, R.H., 2000. The inadequacy of first-order treatment wetland models. Ecological
Engineering, 15: 105-119; doi: 10.1016/S0925-8574(99)00039-7.
Kadlec, R.H., Tanner, C.C., Hally, V.M., Gibbs, M.M., 2005. Nitrogen spiraling in
subsurface-flow constructed wetlands: Implications for treatment response. Ecological
Engineering, 25: 365–381; doi:10.1016/j.ecoleng.2005.06.009.
Kamarudzaman, A.N., Aziz, R.A., Jalil, M.F.A., 2011. Removal of Heavy Metals from
Landfill Leachate Using Horizontal and Vertical subsurface Flow Constructed Wetland
Planted with Limnocharis flava. International Journal of Civil & Environmental
Engineering, 11: 85-91
Kantawanichkul, S. and Somprasert, S., 2005. Using a compact combined constructed
wetland system to treat agricultural wastewater with high nitrogen. Water Science and
Technology, 51: 47-53.
Kapellakis, I.E., Paranychianakis, V., Tsagkarakis, K.P., Angelakis, A.N., 2009. Treatment of
olive mill wastewater with constructed wetlands, Asset Management of Medium and
Small Wastewater Utilities, Alexandroupolis pp. 267-278.
Kapellakis, I.E., Paranychianakis, V., Tsagkarakis, K.P., Angelakis, A.N., 2012. Treatment of
olive mill wastewater with constructed wetlands. Water (Switzerland), 4: 260-271.
Karale, R.S., Wadkar, D.V., Nangare, P.B., 2007. Removal and Recovery of Hexavalent
Chromium from Industrial Waste Water by Precipitation with Due Consideration to
Cost Optimization. Journal of Environmental Research And Development, 2: 209-216.
Kaseva, M.E., 2004. Performance of a sub-surface flow constructed wetland in polishing pre-
treated wastewater — a tropical case study. Water Research, 38: 681–687.
Katz, S.A. and Salem, H., 1994.The biological and environmental chemistry of chromium.
New York: VCH Publishers.

Treatment of Industrial and Agro-Industrial Wastewater Using Constructed Wetlands Mar-Yam Sultana
References 204
Kawase, M., and Whitmoyer, R.E., 1980. Aerenchyma development in waterlogged plants.
American Journal of Botany, 67: 18-22.
Keeney, D.R., 1973. The nitrogen cycle in sediment-water system, Journal of Environmental
Quality, 2: 15-29; doi:10.2134/jeq1973.00472425000200010002x.
Kelvin, K. and Tole, M., 2011. The Efficacy of a tropical constructed wetland for treating
wastewater during the dry Season: The Kenyan Experience. Water Air and Soil
Pollution, 215: 137–143.
Kern, J., Idler, C., Carlow, G., 2000. Removal of fecal coliforms and organic matter from
dairy farm wastewater in a constructed wetland under changing climate conditions.
Journal of Environmental Science and Health, 35: 1445-1461.
Khan, S., Ahmad I., Shah M. T., Rehman S., Khaliq, A., 2009. Use of constructed wetland for
the removal of heavy metals from industrial wastewater. Journal of Environmental
Management, 90: 3451–3457; doi: 10.1016/j.jenvman. 2009.05.026.
Kim, B.U. and Kwon, J.H., 2006. Treatment of high concentration swine wastewater by
anaerobic digestion and an aquatic plant system. Environmental Engineering Research.
11: 134-142; doi: 10.4491/eer.2006.11.3.134.
Kimbrough, D.E., Cohen, Y., Winer, A.M., 1999. A Critical Assessment of Chromium in the
Critical Reviews in Environmental Science and Technology, 29: 1–46; doi:
10.1080/10643389991259164.
Kjeldsen, P., Barlaz, M. A., Rooker, A. P., Baun, A., Ledin, A., Christensen, T.H., 2002.
Present and Long-Term Composition of MSW Landfill Leachate: A Review'. Critical
Reviews in Environmental Science and Technology, 32: 297-336;
doi:10.1080/10643380290813462.
Knight, R.L., Kadlec, R.H., Ohlendorf, H.M. 1999. The use of treatment wetlands for
petroleum industry effluents. Environmental Science and Technology, 33: 973–980;
doi: 10.1021/es980740w.

Treatment of Industrial and Agro-Industrial Wastewater Using Constructed Wetlands Mar-Yam Sultana
References 205
Knight, R.L., Payne, V.W.E.J., Borer, R.E., Clarke, R.A.J., Pries, J.H., 2000. Constructed
wetlands for livestock wastewater management. Ecological Engineering, 15: 41-55.
Knox, A.S., Paller, M.H., Nelson, E.A., Specht, W.L., Halverson, N.V., Gladden, J.B., 2006.
Metal distribution and stability in constructed wetland sediment. Journal of
Environmental Quality, 35: 1948–1959; doi:10.2134/jeq2006.0017.
Kolomaznik, K., Adamek, M., Andel, I., Uhlirova, M., 2008. Leather waste—potential threat
to human health, and a new technology of its treatment. Journal of Hazardous Materials
160:514–520; doi: 10.1016/j.jhazmat.2008.03.070.
Kongroy P., Tantemsapya, N., Lin, Y.F., Jing, S.R., Wirojanagud, W., 2012. Spatial
Distribution of Metals in the Constructed Wetlands. International Journal of
Phytoremediation, 14:128–141; doi: 10.1080/15226514.2011.573825.
Kongsricharoern, N. and Polprasert, C., 1996. Chromium removal by a bipolar electro-
chemical precipitation process, Water Science and Technology, 34: 109–116;
doi.org/10.1016/S0273-1223(96)00793-7.
Korkusuz, E.A., 2005. Manual of Practice on Constructed Wetlands for Wastewater
Treatment and Reuse in Mediterranean Countries. Report, MED-REUNET II Support
Programme (EC Project No: INCO-CT-2003-502453). Agbar Foundation, Spain.
</http://medreunet.org//>.
Kotti, I.P., Gikas, G.D., Tsihrintzis, V.A., 2010. Effect of operational and design parameters
on removal efficiency of pilot-scale FWS constructed wetlands and comparison with
HSF systems. Ecological Engineering, 36: 862-875.
Krishnamurthy, S. and Wilkens, M.M., 1994. Environmental chemistry of Cr. Northeastern
Geology. 16: 14–17.
Kucuk, O.S., Sengul, F., Kapdan, I.K., 2003. Removal of ammonia from tannery effluents in a
reed bed constructed wetland. Water Science & Technology, 48: 179–186.

Treatment of Industrial and Agro-Industrial Wastewater Using Constructed Wetlands Mar-Yam Sultana
References 206
Kushwaha, J.P, Srivastava, V.C., Mall, I. D, 2011. An Overview of Various Technologies for
the Treatment of Dairy Wastewaters. Critical Reviews in Food Science and Nutrition,
51:442–452; doi: 10.1080/10408391003663879.
Kusler, J.A. and Kentula, M.E. 1996. Wetland restoration and creation - the status of the
science, Island Press. Washington, D.C. pp 594.
Laing, G.D., Moortel, A.M.K.V.de, Moors, W., Grauwe, P.D., Meers, E., Tack, F.M.G.,
Verloo, M.G., 2009. Factors affecting metal concentrations in reed plants (Phragmites
australis) of intertidal marshes in the Scheldt estuary. Ecological Engineering, 35: 310-
318.
Lasaridi, K., Protopapa, I., Kotsou, M., Pilidis, G., Manios, T., Kyriacou, A., 2006. Quality
assessment of composts in the Greek market: the need for standards and quality
assurance. Journal of Environmental Management 80, 58-65.
Lasat, M.M., 2002. Phytoextraction of Toxic Metals: A Review of Biological Mechanisms.
Journal of Environmental Quality, 3: 109–120.
Lee, C.C. and Lin, S.D., 1999. Handbook of Environmental Engineering Calculations. Vol: I,
McGraww-Hill, New York.
Lee, C.Y., Lee, C.C., Lee, F.Y., Tseng, S.S., Liao, C.J., 2004. Performance of subsurface flow
constructed wetland taking pretreated swine effluent under heavy loads. Bioresources
Technology, 92: 173-179.
Lee, M.S., Drizo, A., Rizzo, D.M., Druschel, G., Hayden, N., Twohig, E., 2010. Evaluating
the efficiency and temporal variation of pilot-scale constructed wetlands and steel slag
phosphorus removing filters for treating dairy wastewater. Water Research, 44: 4077-
4086.
Lefebvre, O. and Moletta, R., 2006. Treatment of organic pollution in industrial saline
wastewater: A literature review. Water Research, 40: 3671–3682.

Treatment of Industrial and Agro-Industrial Wastewater Using Constructed Wetlands Mar-Yam Sultana
References 207
Legislativo, D., 2010. Riordino e revisione della disciplina in materia di fertilizzanti, a norma
dell’articolo, In: Legge, d. (Ed.), 88. Gazzetta Ufficiale.
Lema, J.M., Mendez, R., Blazquez, R., 1988. Characteristics of landfill leachates and
alternatives for their treatment: a review. Water Air Soil Pollution, 40: 223–250.
Lesage, E., Rousseau, D.P.L., Meers, E., Tack, F.M.G., De Paw, N., 2007a. Accumulation of
metals in a horizontal subsurface flow constructed wetland treating domestic wastewater
in Flanders, Belgium. Science of the Total Environment, 380: 102–115.
Lesage, C. Mundia, D.P.L. Rousseau, A.M.K. Van de Moortel, G. du Laing, E. Meers,
F.M.G. Tack, N. De Pauw, M.G. Verloo, 2007b. Sorption of Co, Cu, Ni and Zn from
industrial effluents by the submerged aquatic macrophyte Myriophyllum spicatum L.,
Ecologocal Engineering, 30: 320–325; doi: 10.1016/j.ecoleng.2007.04.007
Lindemann, M.D. 2007. Use of chromium as an animal feed supplement. In: Vincent J. B
(Ed). The nutritional biochemistry of chromium(III). pp. 85-118, Elsevier, Amsterdam.
Liu, J.G., Li, G.H., Shao, W.C., Xu, J.K., Wang, D.K., 2010. Variations in Uptake and
Translocation of Copper, Chromium and Nickel among Nineteen Wetland Plant
Species. Pedosphere 20: 96–103; doi: 10.1016/S1002-0160(09)60288-5.
Liu, Y., Wang, S., Huang, J., Yan, L., Wang, F., 2006. Study on constructed wetlands for
longtime running. Journal of Ecology and Environment, 15: 1156-1159.
Machemer, S.D., Reynolds, J.S., Laudon, L.S., Wildeman, T.R., 1993. Balance of S in a
constructed wetland built to treat acid mine drainage, Idaho Springs, Colorado, U.S.A.
Applied Geochemistry, 8: 587–603; doi: 10.1016/0883-2927(93)90015-9.
Magro, C.D., Deon, M.C., Rossi, A.D., Reinehr, C.O., Hemkemeier, M., Colla, L.M., 2012.
Chromium (VI) biosorption and removal of chemical oxygen demand by Spirulina
platensis from wastewater-supplemented culture medium. Journal of Environmental
Science and Health, Part A, 47: 1818–1824; doi: 10.1080/10934529.2012.689539.

Treatment of Industrial and Agro-Industrial Wastewater Using Constructed Wetlands Mar-Yam Sultana
References 208
Maine, M.A., Sune, N., Hadad, H., Sanchez, G., Bonetto, C., 2005. Phosphate and metal
retention in a small-scale constructed wetland for wastewater treatment. In: Golterman,
H., Serrano, L. (Eds.), Phosphate in Sediment. Proceedings 4th International
Symposium. Backhuys, Leiden; pp 21-32.
Maine, M.A., Sune, N., Hadad, H., Sanchez, G., Bonetto, C., 2006. Nutrient and metal
removal in a constructed wetland for wastewater treatment from a metallurgic industry.
Ecological engineering 26: 341–347; doi: 10.1016/j.ecoleng.2005.12.004.
Maine, M.A., Sune, N., Hadad, H., Sanchez, G., Bonetto, C., 2007. Removal efficiency of a
constructed wetland for wastewater treatment according to vegetation dominance.
Chemosphere, 68: 1105–1113.
Maine, M.A., Sune, N., Hadad, H., Sanchez, G., Bonetto, C., 2009. Influence of the
vegetation on the removal of heavy metals and nutrients in a constructed wetland.
Journal of Environmental Management, 90: 355-363.
Maine, M.A., Sune, N., Lagger, S. C., 2004. Chromium bioaccumulation: comparison of the
capacity of two floating aquatic macrophytes. Water Research, 38: 1494–1501.
Mandi, L., Houhowm, B., Asmama, S., Schwartzbrod, J., 1996. Wastewater treatment by reed
beds: an experimental approach. Water Research, 30: 2009–2016; doi: 10.1016/0043-
1354(96)00032-2.
Mant, C., Costa, S., Williams, J., Tambourgi, E., 2006. Phytoremediation of chromium by
model constructed wetland. Bioresource Technology, 97: 1767–1772.
Mantovi, P., Marmiroli, M., Maestri, E., Tagliavini, S., Piccinini, S., 2003. Application of
horizontal sub-surface flow constructed wetland on treatment of dairy parlor
wastewater. Bioresource Technology, 88: 85–94; doi: 10.1016/S0960-8524(02)00291-2.
Mantovi, P., Piccinini, S., Marmiroli, M., Maestri, E., 2002. Treating dairy parlor wastewater
using sub-surface flow constructed wetlands, in: Nehring, K.W., Brauning, S.E. (Eds.),
Wetlands and Remediation II. Battelle Press, Columbus, Ohio, pp. 205–212.

Treatment of Industrial and Agro-Industrial Wastewater Using Constructed Wetlands Mar-Yam Sultana
References 209
Mantovi, P., Piccinini, S., Marmiroli, M., Marmiroli, N., 2011. Constructed wetlands are
suitable to treat wastewater from Italian cheese productions. Water Practice and
Technology, 6; doi:10.2166/wpt.2011.045.
Marchand, L., Mench, M., Jacob D. L., Otte, M. L., 2010. Metal and metalloid removal in
constructed wetlands, with emphasis on the importance of plants and standardized
measurements: A review. Environmental Pollution, 158: 3447-3461; DOI:
10.1016/j.envpol.2010.08.018.
Mashauri, D.A., Mulungu, D.M.M., Abdulhussein, B.S., 2000. Constructed wetland at the
University of Dar es Salaam. Water Research, 34: 1135-1144; DOI: 10.1016/S0043-
1354(99)00238-9.
Masi, F., Conte, G., Martinuzzi, N., Pucci, B., 2002. Winery high organic content wastewaters
treated by constructed wetland in mediterranean climate. Proceedings of the IWA 8th
International Conference on Wetland Systems for Water Pollution Control, Arusha,
Tanzania, September (2002).
Matthews, N.A. and Morning, J.L., 1980. Metals and Minerals. [1], 193-205. Washington
D.C. U.S. Bureau of mines, mineral yearbook 1978-79. Ref Type: Serial (Book,
Monograph).
Mawson, A.J., 1994. Bioconversions for whey utilization and waste abatement. Bioresource
Technology, 47:195–203; doi: 10.1016/0960-8524(94)90180-5.
Mays P. A. and Edwards, G. S., 2001. Comparison of heavy metal accumulation in a natural
wetland and constructed wetlands receiving acid mine drainage. Ecological Engineering
16: 487-500; doi: 10.1016/S0925-8574(00)00112-9.
Medcities and ISR EWC, 2003. Guidelines for Municipal Solid Waste Management in the
Mediterranean Region. Barcelona, Medcities. ENG
Treatment of Industrial and Agro-Industrial Wastewater Using Constructed Wetlands Mar-Yam Sultana
References 210
Meers, E., Rousseau, D.P.L., Blomme, N., Lesage, E., Du Laing, G., Tack, F.M.G., Verloo,
M.G., 2005. Tertiary treatment of the liquid fraction of pig manure with Phragmites
australis. Water Air Soil Pollution, 160: 15-26.
Meers, E., Tack, F.M.G., Tolpe, I., Michels, E., 2008. Application of a full-scale constructed
wetland for tertiary treatment of piggery manure: Monitoring results. Water Air Soil
Pollution, 193: 15-24.
Mertz, W., 1969. Chromium occurrence and function in biological systems. Physiological
Reviews, 49:163-167.
Metcalf and Eddy Inc., 1991. Wastewater engineering: collection, treatment and disposal, 3rd
edition, McGraw, New York.
Michailides, M., Panagopoulos, P., Akratos, C.S., Tekerlekopoulou, A.G., Vayenas, D.V.,
2011. A full-scale system for aerobic biological treatment of olive mill wastewater.
Journal of Chemical Technology and Biotechnology, 86: 888-892.
Michailides, M.K., Sultana, M.Y., Tekerlekopoulou, A.G., Akratos, C.S., Vayenas, D.V.,
2013.Biological Cr(VI) removal using bio-filters and constructed wetlands, Water
Science and Technology, 68: 2228-2233.
Midha, V. and Dey, A., 2008. Biological Treatment of Tannery Wastewater For Sulfide
Removal. International Journal of Chemical Sciences,6: 472-486.
Miller, I.W.G. and Black, S., 1985. Design and use of artificial wetlands. In: Ecological
considerations in wetland treatment of municipal wastewaters. Van Nostrand Reinhold
Co. NY. Pp 26-37.
Mishra, A.K. and Mohanty, B., 2008. Acute toxicity impacts of hexavalent chromium on
behavior and histopathology of gill, kidney and liver of the freshwater fish, Channa
punctatus (Bloch). Environmental Toxicology and Pharmacology, 26: 136–141; doi:
10.1016/j.etap.2008.02.010.

Treatment of Industrial and Agro-Industrial Wastewater Using Constructed Wetlands Mar-Yam Sultana
References 211
Mitsch, W.J. and Gosselink, J.G. 1993. Wetlands, 2nd
Edition. Van Nostar and Reinhold, New
York.
Modis, K., Adam, K., Panagopoulos, K., Komtopoulos, A., 1998. Development and
Validation of a geostatistical model for prediction of acid mine drainage in underground
sulphide mines. Transactions-Institution of Mining and Metallurgy. Section A. Mining
Industry, 107: A102–A107.
Mohan, D. and Pittman, C.U. Jr., 2006. Activated carbons and low cost adsorbents for
remediation of tri- and Cr (VI) from water. Journal of Hazardous Materials, 137 (2),
762–81; doi:10.1016/j.jhazmat.2006.06.060.
Moir, S.E., Svoboda, I., Sym, G., Clark, J., McGechan, M.B., Castle, K., 2005. An
experimental plant for testing methods of treating dilute farm effluents and dirty water.
Biosystems Engineering, 90: 349-355.
Moreira, V.R., LeBlanc, B.D., Achberger, E.C., Frederick, D.G., Leonardi, C., 2010. Design
and evaluation of a sequential biological treatment system for dairy parlor wastewater in
southeastern Louisiana. Applied Engineering in Agriculture, 26: 125-136.
Moshiri, G.A., 1993. Constructed Wetlands for Water Quality Improvement, CRC
Press/Lewis Publishers, Boca Raton, Florida.
Mosse, K.P.M., Patti, A.F., Christen, E.W., Cavagnaro, T.R., 2011. Review: Winery
wastewater quality and treatment options in Australia. Australian Journal of Grape and
Wine Research, 17: 111-121; doi: 10.1111/j.1755-0238.2011.00132.x.
Mosteo, R., Sarasa, J., Ormad, M., Ovelleiro, J., 2008. Sequential solar photo-Fenton-
biological system for the treatment of winery wastewaters. Journal of Agricultural and
Food Chemistry, 56: 7333–7338.
Munoz, P., Drizo, A., Hession, W.C., 2006. Flow patterns of dairy wastewater constructed
wetlands in a cold climate. Water Research ,40: 3209-3218.

Treatment of Industrial and Agro-Industrial Wastewater Using Constructed Wetlands Mar-Yam Sultana
References 212
Murphy, J. and Riley, J.R., 1962. A modified single solution method for determination of
phosphate in natural waters. Analytica Chimica Acta 27, 31-36.
Mustafa, A., Scholz, M., Harrington, R., Carroll, P., 2009. Long-term performance of a
representative integrated constructed wetland treating farmyard runoff. Ecological
Engineering, 35: 779-790.
Muthukrishnan, M. and Guha, B.K., 2008. Effect of pH on rejection of Cr(VI) by
Nanofiltration. Desalination, 219: 171–178.
Nahlik, A.M. and Mitsch, W.J., 2006. Tropical treatment wetlands dominated by free-floating
macrophytes for water quality improvement in Costa Rica. Ecological engineering, 28:
246–257; doi: 10.1016/j.ecoleng.2006.07.006.
Nandy, T., Kaul, S.N., Shastry, S., Manivel, W., Deshpande, C.V., 1999. Wastewater
management in cluster of tanneries in Tamil Nadu through implementation of common
effluent treatment plants. Journal of Scientific and Industrial Research, 58: 475-516.
Nethercott, J., Paustenbach, D., Adams, R., Fowler, J., Marks, J., Morton, C., Taylor, J.,
Horowitz, S., Finley, B., 1994. A study of chromium induced allergic contact dermatitis
with 54 volunteers: Implications for environmental risk assessment. Occupational and
Environmental Medicine, 51: 371–380.
Newman, J., Clausen, J., Neafsey, J., 2000. Seasonal Performance of a Wetland Constructed
to Process Diary Milk house Wastewater in Connecticut. Ecological Engineering, 14:
181-198.
Newman, J.M. and Clausen, J.C., 1997. Seasonal effectiveness of a constructed wetland for
processing milkhouse wastewater. Wetlands, 17: 375-382.
Nguyen, A., Mulyani, I., Levina, A. and Lay, P.A. 2008. Reactivity of chromium(III)
nutritional supplements in biological media: an X-ray absorption spectroscopic study.
Inorganic Chemistry, 47: 4299-4309; doi: 10.1021/ic7024389.

Treatment of Industrial and Agro-Industrial Wastewater Using Constructed Wetlands Mar-Yam Sultana
References 213
Nieboer, E and Richardson. D.H.S., 1980. The replacement of the nondescript term ‘heavy
metals’ by a biologically and chemically significant classification of metal ions.
Environmental Pollution, Series B, Chemical and Physical, 1: 3-26.
Nieboer, E. and Jusys, A.A., 1988. Biologic chemistry of chromium. In: Niragu JO, Nieboer
E (eds) Chromium in Natural and Human Environments. Wiley, New York, pp 81–105.
Nies, D.H., 1999. Microbial heavy-metal resistance. Applied Microbiology and
Biotechnology, 51: 730–50.
Nourbakhsh, M., Sag, Y., Ozer, D., Aksu, Z., Katsal, T., Calgar, A., 1994. A comparative
study of various biosorbents for removal of chromium (VI) ions from industrial
wastewater. Process Biochemistry 29: 1–5.
O’Brein, T.J., Ceryak, S., Patierno S.R., 2003. Complexities of chromium carcinogenesis: role
of cellular response, repair and recovery mechanisms. Mutation Research, 533: 3-36.
OECD-FAO, 2012. Agricultural Outlook 2008–2017. Highlights. Paris. Available online:
http://www.agri-outlook.org/dataoecd/54/15/40715381.pdf (accessed on 5 September
2012).
Oliveira, H., 2012. Chromium as an Environmental Pollutant: Insights on Induced Plant
Toxicity, Review Article. Journal of Botany, 2012; Article ID 375843, 8 pages;
http://dx.doi.org/10.1155/2012/375843.
Oller, I., Malato, S., Sánchez-Pérez, J.A., 2011. Combination of Advanced Oxidation
Processes and biological treatments forwastewater decontamination—A review. Science
of the Total Environment, 409: 4141–4166.
Otte, M.L., Kearns, C.C., Doyle, M.O., 1995. Accumulation of arsenic and zinc in the
rhizosphere of wetland plants. Bulletin of Environmental Contamination and
Toxicology, 55: 154-161; doi: 10.1007/BF00212403.

Treatment of Industrial and Agro-Industrial Wastewater Using Constructed Wetlands Mar-Yam Sultana
References 214
Owlad M., Aroua M.K., Daud W.A.W., Baroutian S., 2009. Removal of hexavalent
chromium contaminated water and waste water: A review. Water Air Soil Pollution,
200, 59-77.
Pagga, U. and Brown, D., 1986. The degradation of dyestuffs: Part II Behaviour of dyestuffs
in aerobic biodegradation tests. Chemosphere, 15: 479–491.
Palmer, C.D. and Puls, R.W., 1994. Natural Attenuation of Hexavalent Chromium in
Groundwater and Soils. EPA Ground Water Issue, EPA 540-5-94-505, pp 12.
Pandey, N. and Sharma, C.P., 2003. Chromium interference in iron nutrition and water
relations of cabbage. Environmental and Experimental Botany, 49: 195–200.
Panesar, P.S., Kennedy, J.F., Gandhi, D.N., Bunko, K., 2007. Bioutilisation of whey for lactic
acid production. Food Chemistry, 105: 1–14; doi: 10.1016/j.foodchem.2007.03.035.
Pansini, M., Colella, C., Gennaro, M. D., 1991. Chromium removal from wastewater by ion-
exchange using zeolite, Desalination, 83:145–157.
Papachristou, E. and Lafazanis, C.T, 1997. Application of membrane technology in the
pretreatment of cheese dairies wastes and co-treatment in a municipal conventional
biological unit. Water Science and Technology, 32: 361–367, doi: 10.1016/S0273-
1223(97)00409-5.
Paraskeva, P. and Diamadopoulos, E., 2006. Technologies for olive mill wastewater (OMW)
treatment: a review. Journal of Chemical Technology and Biotechnology, 81: 1475–
1485; doi: 10.1002/jctb.1553.
Pardue, J.H., Kassenga, G., Shin, W.S. 2000. Design approaches for chlorinated VOC
treatment wetland. In Wetlands And Remediation: An International Conference, ed. J.L.
Means and R.E. Hinchee, Columbus, Ohio: Battelle Press, pp 301–308.

Treatment of Industrial and Agro-Industrial Wastewater Using Constructed Wetlands Mar-Yam Sultana
References 215
Parks, J. L., 2005. Sorption of boron and chromium onto solids of environmental significance:
implications for sampling and removal in water treatment; PhD Thesis, Faculty of the
Virginia Polytechnic Institute and State University, Blacksburg, Virginia.
Patterson, J. W., 1985. Industrial wastewater treatment technology (2nd ed.). Butterworth-
Heinemann, London, England.
Patton, G., Dauble, D., McKinstry, C., 2007. Evaluation of early life stage fall chinook
salmon exposed to hexavalent chromium from a contaminated groundwater source.
Environmental Monitoring and Assessment, 133: 285–294; doi: 10.1007/s10661-006-
9583-0.
Paul, E.A. and Clark, F.E., 1996. Soil Microbiology and Biochemistry, 2ed, Academic Press,
San Diego, California.
Pawlisz, A.V., Kent, R.A., Schneider, U.A., Jefferson, C., 1997. Canadian water quality
guidelines for Cr. Environmental Toxicology and Water Quality, 12: 123–161;
doi: 10.1002/(SICI)1098-2256(1997)12:2<123::AIDTOX4>3.0.CO;2-A.
Pendias, K. A., Pendias, H., 2001. Trace elements in soils. 3rd
Ed. Boca Raton, London, New
York, CRC Press.; pp 413.
Peng, J.F., Song, Y.H., Yuan, P., Cui, X.Y., Qiu G.L., 2009. The remediation of heavy metals
contaminated sediment. Journal of Hazardous Materials, 161:633 640; doi:
10.1016/j.jhazmat.2008.04.061.
Peppas, A., Komnitsas, K., Halikia, I., 2000. Use of organic covers for acid mine drainage
control. Minerals Engineering, 13:563–574.
Pérez Padilla, A. and Tavani, E.L., 1999. Treatment of an industrial effluent by reverse
osmosis. Desalination, 126: 219-226.
Perez-Candela, M., Martin-Martinez, J.M., Torregrosa-Macia, R., 1995. Chromium (VI)
removal with active carbon. Water Research, 29: 2174–2180.

Treatment of Industrial and Agro-Industrial Wastewater Using Constructed Wetlands Mar-Yam Sultana
References 216
Petruccioli, M., Duarte, J.C., Eusebio, A., Federici, F., 2002. Aerobic treatment of winery
wastewater using a jet-loop activated sludge reactor. Process Biochemistry, 37: 821–
829; doi: 10.1016/S0032-9592(01)00280-1
Petruccioli, M., Duarte, J.C., Federici, F., 2000. High rate aerobic treatment of winery
wastewater using bioreactors with free and immobilized activated sludge. Journal of
Bioscience and Bioengineering 90: 381–386; doi: 10.1016/S1389-1723(01)80005-0
Peverly, J.H., Surface, J.M., Wang T., 1995. Growth and trace metal absorption by
Phragmites australis in wetlands constructed for landfill leachate treatment. Ecological
Engineering, 5: 21-35.
Pilon-Smits, E., 2005. Phytoremediation. Annual Review of Plant Biology 56, 15-39.
Pinney, M.L., Westerhoff, P.K., Baker, L., 2000. Transformations in dissolved organic carbon
through constructed wetlands. Water Resource 34: 1897–1911.
Plant, N. 2003. Molecular Toxicology. Garland Science/BIOS Scientific Publishers.
Platzer, C., 1999. Design recommendations for subsurface flow constructed wetlands for
nitrification and denitrification. Water Science and Technology 40: 257-263; doi:
10.1016/S0273-1223(99)00420-5.
Platzer, C.H.R., 1998. Design recommendations for subsurface flow constructed wetlands for
nitrification and denitrification. In: Proceedings – 6th
International Conference On
Wetland Systems for Water Pollution Control. Sep 27th
to Oct 2nd
1998, Sáo Pedro,
Brazil.
Poach, M.E., Hunt, P.G., Reddy, G.B., Stone, K.C., Johnson, M.H., Grubbs, A., 2007. Effect
of intermittent drainage on swine wastewater treatment by marsh-pond-marsh
constructed wetlands. Ecological Engineering, 30: 43-50.

Treatment of Industrial and Agro-Industrial Wastewater Using Constructed Wetlands Mar-Yam Sultana
References 217
Poach, M.E., Hunt, P.G., Vanotti, M.B., Stone, K.C., Matheny, T.A., Johnson, M.H., Sadler,
E.J., 2003. Improved nitrogen treatment by constructed wetlands receiving partially
nitrified liquid swine manure. Ecological Engineering, 20: 183-197.
Polprasert, C. and Veenstra, S., 2000. Sustainable Wastewater Treatment I: Natural Treatment
System, IHE Lecture Notes, The Netherlands.
Pratt, P. F., 1966. Chromium. In H. D. Chapman (ed.), Diagnostic criteria for plants and soils.
Quality Printing Co. Inc., Abilene, TX, pp 136-141.
Prazeres, A.R., Carvalho, F., Rivas, J., 2012. Cheese whey management: A review, Journal of
Environmental Management, 110: 48-68; doi: 10.1016/j.jenvman.2012.05.018.
Pugazhenthi, G., Sachan, S., Kishore, N., Kumar, A., 2005. Separation of chromium (VI)
using modified ultrafiltration charged carbon membrane and its mathematical modeling.
Journal of Membrane Science, 254: 229–239; doi: 10.1016/j.memsci.2005.01.011.
Puigagut, J., Vilaseňor, J., Salas, J.J., Béceras, E., García, J., 2007. Subsurface-flow
constructed wetlands in Spain for the sanitation of small communities: a comparative
study. Ecological Engineering, 30: 312–319; doi: 10.1016/j.ecoleng.2007.04.005.
Qian J.H., Zayed A., Zhu Y.L., Yu M., Terry N., 1999. Phytoaccumulation of trace elements
by wetland plants: III. Uptake and accumulation of ten trace elements by twelve plant
species. Journal of Environmental Quality, 28: 1448-1455.
Qian, Y., Gallagher, F.J., Feng, H., Wu, M., 2012. A geochemical study of toxic metal
translocation in an urban brownfield wetland. Environmental Pollution, 166: 23-30;
doi:10.1016/j.envpol.2012.02.027
Ragusa, S.R., McNevin, D., Qasem, S., Mitchell, C. 2004 Indicators of Biofilm Development
and Activity in Constructed Wetlands Microcosms. Water Research, 38: 2865–2873.
Rai, D., Eary, L.E., Zachara, J.M., 1989. Environmental chemistry of chromium. The Science
of the Total Environment 86: 15-23.

Treatment of Industrial and Agro-Industrial Wastewater Using Constructed Wetlands Mar-Yam Sultana
References 218
Rajeshwari, K.V., Balakrishnan, M., Kansal, A., Lata, K., Kishore, V.V.N., 2000. State-of-
the-art of anaerobic digestion technology for industrial wastewater treatment.
Renewable and Sustainable Energy Reviews, 4: 135-156; doi: 10.1016/S1364-
0321(99)00014-3.
Ramakrishnaiah, C.R. and Prathima. B., 2012. Hexavalent Chromium Removal From
Industrial Watse Water By Chemical Precipitation Method. International Journal of
Engineering Research and Applications, 2: 599-603.
Ravikumar, K., Deebika, B., Balu, K., 2005. Decolourization of aqueous dye solutions by a
novel adsorbent: Application of statistical designs and surface plots for the optimization
and regression analysis. Journal of Hazardous Materials, 122: 75–83; doi:
10.1016/j.jhazmat.2005.03.008.
Reddy, K.R, Patrick, W.H., Lindau, C.W., 1989. Nitrification-denitrification at the plant root-
sediment interface in wetlands. Limnology and Oceanography 34, 1004-1013.
Reed, S.C., Crites, R.W., Middlebrooks, E.J., 1995. Natural Systems for Waste Management
and Treatment. McGraw-Hill, New York, pp 433.
Reed, S.C., Middlebrooks, E.J., Crites, R.W., 1988. Natural Systems for Waste Management
and Treatment, 1st ed., McGraw-Hill Book Company, New York.
Reemtsma, T. and Jekel, M., 1997. Dissolved organics in tannery wastewater and their
alteration by a combined anaerobic and aerobic treatment, Water Reseach. 31: 1035–
1046; doi: 10.1016/S0043-1354(96)00382-X.
Reemtsma, T., Zywicki, B., Stueber, M., Kloepfer, A., Jekel, M., 2002. Removal of sulfur-
organic polar micropollutants in a membrane bioreactor treating industrial wastewater.
Environmental Science and Technology, 36: 1102–1106.
Rengaraj, S., Kyeong-Ho,Y., Seung-Hyeon, M., 2001. Removal of chromium from water and
wastewater by ion-exchange resins. Journal of Hazardous Materials, 87: 273–287; doi:
10.1016/S0304-3894(01)00291-6.

Treatment of Industrial and Agro-Industrial Wastewater Using Constructed Wetlands Mar-Yam Sultana
References 219
Renou, S., Givaudan, J.G., Poulain, S., Dirassouyan, F., Moulin, P., 2008. Landfill leachate
treatment: Review and opportunity. Journal of Hazardous Materials, 150: 468–493.
Riser-Roberts, E., 1992. Bioremediation of Petroleum Contaminated Sites, CRC Press, Boca
Raton, Florida.
Rivas, J., Prazeres, A.R., Carvalho, F., Beltran, F., 2010. Treatment of cheese whey
wastewater: combined coagulation– flocculation and aerobic biodegradation. Journal of
Agricultural and Food Chemistry, 58: 7871– 7877; doi: 10.1021/jf100602j.
Rousseau, D., Vanrolleghem, P.L, P.A., Pauw, N.D., 2004. Constructed wetlands in Flanders:
a performance analysis. Ecological Engineering, 23: 151-163.
Roussy, J., Vooren, M. V., Dempsey, B. A., Guibal, E., 2005. Influence of Chitosan
Characteristics on the Coagulation and the Flocculation of Bentonite Suspensions.
Water Research, 39: 3247-3258.
Ryckeboer, J., Mergaert, J., Vaes, K., Klammer, S., De Clercw, D., Coosemans, J., Insam, H.,
Swings, J., 2003. A survey of bacteria and fungi occurring during composting and self-
heating processes. Annals of Microbiology, 53: 349-410.
Sakadevan, K. and Bavor, H.J., 1999. Nutrient removal mechanisms in constructed wetlands
and sustainable water management. Water Science and Technology, 40: 121–128.
Salomons, W., 1995. Environmental impact of metals derived from mining activities:
Processes, predictions, prevention. Journal of Geochemical Exploration, 52: 5-23.
Samso, R. and Garcia, J., 2013. BIO_PORE, a mathematical model to simulate biofilm
growth and water quality improvement in porous media: Application and calibration for
constructed wetlands. Ecological Engineering, 54: 116-127.
Sanghi, R., Sankararamakrishnan, N., Dave, B.C., 2009. Fungal bioremediation of chromates:
Conformational changes of biomass during sequestration, binding and reduction of

Treatment of Industrial and Agro-Industrial Wastewater Using Constructed Wetlands Mar-Yam Sultana
References 220
hexavalent chromium ions. Journal of Hazardous Materials, 169: 1074-1080; doi:
10.1016/j.jhazmat.2009.04.056.
Savin, I.I. and Butnaru, R., 2008. Wastewater characteristics in textile finishing
mills. Environmental Engineering and Management Journal, 7: 859-864.
Ščančar, J. and Milačič, R., 2014. A critical overview of Cr speciation analysis based on high
performance liquid chromatography and spectrometric techniques. Journal of Analytical
Atomic Spectrometry, 29: 427-443; doi: 10.1039/C3JA50198A.
SCCWRP, 1974. Southern California Coastal Water Research Project (SCCWRP),
TOXICITY STUDIES OF CHROMIUM. Annual Report, PART I: Biology
Program;www.sccwrp.org//BrowseAllAnnualReports/1974AnnualReport.aspx.
Schaafsma, J.A., Baldwin, A.H., Streb, C.A., 2000. An evaluation of a constructed wetland to
treat wastewater from a dairy farm in Maryland, USA. Ecological Engineering, 14: 199-
206.
Scott R., 1986. Cheesemaking practice. Elsevier Appl. Sci. Publ. New York.
Sen, A. K. and Bhattacharyya, M., 1994. Studies of uptake and toxic effects of Ni(II) on
Salvinia natans. Water Air and Soil Pollution, 78: 141–152.
Serrano, L., de la Varga, D., Ruiz, I., Soto, M., 2011. Winery wastewater treatment in a
hybrid constructed wetland. Ecological Engineering, 37: 744-753; doi:
10.1016/j.ecoleng.2010.06.038.
Shamir, E., Thompson, T.L., Karpiscak, M.M., Freitas, R.J., Zauderer, J., 2001. Nitrogen
accumulation in a constructed wetland for dairy wastewater treatment. Journal of the
American Water Resources Association, 37: 317-325.
Shanker, A.K., Cervantes, C., Loza-Tavera, H., Avudainayagam, S., 2005. Chromium toxicity
in plants. Environment International, 31: 739–753; doi: 10.1016/j.envint.2005.02.003.
Treatment of Industrial and Agro-Industrial Wastewater Using Constructed Wetlands Mar-Yam Sultana
References 221
Shanker, A.K., Djanaguiraman, M,. Venkateswarlu, B., 2009. Chromium interactions in
plants: Current status and future strategies. Metallomics, 1: 375–383; doi:
10.1039/B904571F.
Shanker, A.K., Djanaguiraman, M., Sudhagar, R., Chandrashekar, C.N., Pathmanabhan, G.,
2004. Differential antioxidative response of ascorbate glutathione pathway enzymes and
metabolites to chromium speciation stress in green gram (Vigna radiata (L.) R.Wilczek.
cv CO 4) roots. Plant Science, 166:1035–1043; doi: 10.1016/j.plantsci.2003.12.015.
Sharma, K., 2002. Microbial Cr(VI) reduction: role of electron donors, acceptors and
mechanisms, with special emphasis on clostridium spp. PhD thesis, University of
Florida.
Sharma, P.K., Takashi, I., Kato, K., Ietsugu, H., Tomita, K., Nagasawa, T., 2013a. Seasonal
efficiency of a hybrid sub-surface flow constructed wetland system in treating milking
parlor wastewater at northern Hokkaido. Ecological Engineering, 53: 257–266; doi:
10.1016/j.ecoleng.2012.12.054.
Sharma, P.K., Takashi, I., Kato, K., Ietsugu, H., Tomita, K., Nagasawa, T., 2013b. Effects of
load fluctuations on treatment potential of a hybrid sub-surface flow constructed
wetland treating milking parlor waste water. Ecological Engineering, 57: 216–225; doi:
10.1016/j.ecoleng.2013.04.031.
Shen, H. and Wang, Y.T., 1993. Characterization of enzymatic reduction of hexavalent
chromium by Escherichia coli ATCC 33456. Applied and Environmental Microbiology,
59: 3771–3777.
Sheoran, A.S. and Sheoran, V., 2006. Heavy metal removal mechanism of acid mine drainage
in wetlands: A critical review. Minerals Engineering, 19: 105–116; doi:
10.1016/j.mineng.2005.08.006.
Shepherd, H.L., Grismer, M.E., Tchobanoglous, G., 2001. Treatment of high-strength winery
wastewater using a subsurface-flow constructed wetland. Water Environment Research,
73: 394–403.

Treatment of Industrial and Agro-Industrial Wastewater Using Constructed Wetlands Mar-Yam Sultana
References 222
Shetty, U.S., Sonwane, K. D., Kuchekar, S. R., 2005. Water Hyacinth (Eichornia crassipes)
as a Natural Tool for Pollution Control. Annali di Chimica, 95: 721-725.
Sienkiewicz, T. and Riedel, C.-L., 1990. Whey and Whey Utilization. Th. Mann, Germany.
Sikora, F.J., Zhu, T., Behrend, L.L., Steinberg, S.L., and Coonrod, H.S., 1995. Ammonium
removal in constructed wetlands with recirculating subsurface flow: removal rates and
mechanisms. Water Science and Technology, 32: 193-202; DOI: 10.1016/0273-
1223(95)00620-6.
Sim, C.H. 2003. The use of constructed wetlands for wastewater treatment. Wetlands
International - Malaysia Office. pp 24.
Sin, S. N., Chua, H., Lo, W., Yu, P. H. F., 2000. Effects of Trace Levels of Copper,
Chromium, and Zinc Ions on the Performance of Activated Sludge. Applied
Biochemistry and Biotechnology, 84-86: 487-500; doi: 10.1007/978-1-4612-1392-5_40.
Siso, M.I.G., 1996. The biotechnological utilization of cheese-whey: A review. Biosource
Technology, 57: 1-11; doi: 10.1016/0960-8524(96)00036-3.
Smith, E., Gordon, R., Madani, A., Stratton, G., 2005. Cold climate hydrological flow
characteristics of constructed wetlands. Canadian Biosystems Engineering, 47: 1-7.
Smith, I.D., Bis, G.N., Lemon, E.R., Rozema, L.R., 1996. A thermal analysis of a sub-surface,
vertical flow constructed wetland, in: Proceeding of 5th International Conference of
Wetland Systems for Water pollution Control, Universitat fur Bodenkultur, Vienna,
Austria, Chapter I/1.
Smithers, G.W. 2008. Whey and whey proteins—From “gutter-to-gold”. International Dairy
Journal, 18: 695–704; doi: 10.1016/j.idairyj.2008.03.008.
Sochacki, A., Surmacz-Gorska, J., Faure, O., Guy, B., 2014. Polishing of synthetic
electroplating wastewater in microcosm upflow constructed wetlands: Effect of

Treatment of Industrial and Agro-Industrial Wastewater Using Constructed Wetlands Mar-Yam Sultana
References 223
operating conditions. Chemical Engineering Journal 237: 250-258; doi:
10.1016/j.cej.2013.10.015.
Soda, S., Hamada, T., Yamaoka, Y., Ike, M., Nakazato, H., Saeki, Y., Kasamatsu, T., Sakurai,
Y., 2012. Constructed wetlands for advanced treatment of wastewater with a complex
matrix from a metal-processing plant: Bioconcentration and translocation factors of
various metals in Acorus gramineus and Cyperus alternifolius. Ecological Engineering,
39: 63–70.
Song, Z., Edwards, S.R., Howland, K., Burns, R.G., 2003. Analysis of a Retan Agent Used in
the Tanning Process and Its Determination in Tannery Wastewater. Analytical
Chemistry, 75: 1285-1293; doi: 10.1021/ac020461y.
Sorrell, B.K. and Armstrong, W., 1994. On the difficulties of measuring oxygen release by
root systems of wetland plants. Journal of Ecology, 82: 177-183.
Sorrell, B.K. and Boon, P.I., 1992. Biogeochemistry of billabong sediments. II Seasonal
variations in methane production. Freshwater Biology, 27: 435-445;
doi: 10.1111/j.1365-2427.1992.tb00552.x.
Southichak, B., Nakano, K., Nomura, M., Chiba, N., Nishimura, O., 2006. Phragmites
australis: a novel biosorbent for the removal of heavy metals from aqueous solution.
Water Research, 40: 2295-2302.
Srisatit, T. and Sengsai, W., 2003. Chromium Removal Efficiency by Vetiveria zizanioides
and Vetiveria nemoralis in Constructed Wetlands for Tannery Post-Treatment
Wastewater. Proceedings of Third International Vetiver Conference Guangzhou, China,
October 6-9 2003, http://www.vetiver.org/TVN_ICV3_proceedings.htm.
Srivastava, N.K. and Majumder, C.B., 2008. Novel biofiltration methods for the treatment of
heavy metals from industrial wastewater. Journal of Hazardous Materials 151: 1–8; doi:
10.1016/j.jhazmat.2007.09.101.

Treatment of Industrial and Agro-Industrial Wastewater Using Constructed Wetlands Mar-Yam Sultana
References 224
Srivastava, S., Prakash, S., Srivastava, M. M., 1998. Fate of trivalent chromium in presence of
organic acids: a hydroponic study on the tomato plant. Chemical Speciation and
Bioavailability, 10: 147-150; doi: 10.3184/095422998782775763.
Stasinakis, A.S., Mamais D., Thomaidis N.S., Lekkas T.D., 2002. Effect of chromium(VI) on
bacterial kinetics of heterotrophic biomass of activated sludge. Water Research, 36:
3341-3349; doi: 10.1016/S0043-1354(02)00018-0.
Stasinakis, A.S., Thomaidis, N.S., Mamais, D., Papanikolaou, E.C., Tsakon, A., Lekkas, T.D.,
2003. Effects of Chromium (VI) Addition on the Activated Sludge Process. Water
Research, 37: 2140–2148; doi: 10.1016/S0043-1354(02)00623-1.
Stearns, D.M. 2000. Is chromium a trace essential element? Biofactors, 11:149-162.
Stefanakis, A., Akratos, C.S., Tsihrintzis, V.A., 2014. Vertical Flow Constructed Wetlands:
Eco-engineering Systems for Wastewater and Sludge Treatment. Publisher Elsevier
Science, pp 384; ISBN: 9780124046870.
Stefanakis, A.I. and Tsihrintzis, V.A. 2012a. Effects of loading, resting period, temperature,
porous media, vegetation and aeration on performance of pilot-scale vertical flow
constructed wetlands. Chemical Engineering Journal, 181–182: 416–430.
Stefanakis, A.I. and Tsihrintzis, V.A., 2009. Effect of outlet water level raising and effluent
recirculation on removal efficiency of pilot-scale, horizontal subsurface flow
constructed wetlands. Desalination, 248: 961-976.
Stefanakis, A.I. and Tsihrintzis, V.A., 2012b. Use of zeolite and bauxite as filter media
treating the effluent of Vertical Flow Constructed Wetlands. Microporous Mesoporous
Materials, 155: 106-116.
Stefanakis, A.I., Akratos, C.S., Tsihrintzis, V.A., 2011. Effect of wastewater step-feeding on
removal efficiency of pilot-scale horizontal subsurface flow constructed
wetlands.Ecological Engineering, 37: 431-443.

Treatment of Industrial and Agro-Industrial Wastewater Using Constructed Wetlands Mar-Yam Sultana
References 225
Steinberg, S.L. and Coonrod, H.S., 1994. Oxidation of the root zone by aquatic plants
growing in gravel–nutrient solution culture. Journal of Environmental Quality, 23: 907–
913; doi:10.2134/jeq1994.00472425002300050009x.
Stoltz E. and Greger M. 2002. Accumulation properties of As, Cd, Cu, Pb and Zn by four
wetland plant species growing on submerged mine tailings. Environmental and
Experimental Botany, 47: 271-280.
Stone, K.C., Poach, M.E., Hunt, P.G., Reddy, G.B., 2004. Marsh-pond-marsh constructed
wetland design analysis for swine lagoon wastewater treatment. Ecological Engineering,
23: 127-133.
Stottmeister, U., Wieίner, A., Kuschk, P., Kappelmeyer, U., K¨astner, M., Bederski, O.,
M¨uller, R.A., Moormann, H., 2003. Effects of plants and microorganisms in
constructed wetlands for wastewater treatment. Biotechnology Advances, 22: 93–117;
doi: 10.1016/j.biotechadv.2003.08.010.
Stowell, R., Ludwig, R., Colt, J., Tchobanoglous, G., 1981. Concepts in Aquatic Treatment
Design. Journal of the Environmental Engineering Division, 107: 919-940.
Sultana, M.Y., Chowdhury, A.K.M.M.B., Michailides, M.K., Akratos C.S., Tekerlekopoulou,
A.G., Vayenas, D.V., 2014a. Integrated Cr(VI) removal using constructed wetlands and
composting. Journal of Hazardous Materials, In Press; doi:
10.1016/j.jhazmat.2014.06.046.
Sultana, M.Y., Akratos C.S., Pavlou,
S., Vayenas,
D.V., 2014b. Chromium removal in
constructed wetlands: A review. International Biodeterioration & Biodegradation, 96:
181-190; doi: http://dx.doi.org/10.1016/j.ibiod.2014.08.009.
Sultana, M.Y., Mourti, C., Tekerlekopoulou, A.G., Tatoulis, T., Akratos C.S., Vayenas, D.V.,
2014c. Effect of hydraulic retention time, temperature, and organic load on a horizontal
subsurface flow constructed wetland treating cheese whey wastewater. Submitted.

Treatment of Industrial and Agro-Industrial Wastewater Using Constructed Wetlands Mar-Yam Sultana
References 226
Sune, N., Sanchez, G., Caffaratti, S., Maine, M.A., 2007. Cadmium and chromium removal
kinetics from solution by two aquatic macrophytes, Environmental Pollution 145:467-
473.
Suthirak, S., and Sherrard, J.H., 1981. Activated sludge Nickel toxicity studies. Journal
(Water Pollution Control Federation) 53: 1314–1332.
Svecevicius, G., 2006. Acute Toxicity of Hexavalent Chromium to European Freshwater Fish.
Bulletin of Environmental Contamination and Toxicology, 77: 741–747, doi:
10.1007/s00128-006-1126-4.
Tanner C.C., Kadlec R.H., Gibbs M.M., Sukias J.P.S., Nguyen M.L., 2002. Nitrogen
processing gradients in subsurface-flow treatment wetlands – influence of wastewater
characteristics. Ecological Engineering, 18: 499-520.
Tanner, C.C., 2001. Plants as ecosystems engineers in subsurface-flow treatment wetlands.
Water Science and Technology, 44: 9–17.
Tanner, C.C., Clayton, J.S., Upsdell, M.P., 1995. Effect of loading rate and planting on
treatment of dairy farm wastewaters in constructed wetlands - I. removal of oxygen
demand, suspended solids and faecal coliforms. Water Research, 29: 17-26.
Tatoulis, T.I., Tekerlekopoulou, A.G., Akratos, C.S., Vayenas, D.V., 2014a. Genesis and
diaspora of the dairy process: Aerobic biological treatment of its wastewaters,
Proceedings of IWA Regional Symposium on Water, Wastewater, and Environment:
Traditions and Culture, 21-24 March, Patras.
Tatoulis, T. I., Tekerlekopoulou, A.G., Akratos, C.S., Pavlou, S., Vayenas, D.V., 2014b.
Aerobic biological treatment of second cheese whey in suspended and attached growth
reactors. In Press; doi: 10.1002/jctb.4515.
Taylor, C.R., Hook, P.B., Stein, O.R., Zabinski, C.A., 2011. Seasonal effects of 19 plant
species on COD removal in subsurface treatment wetland microcosms, Ecological
Engineering, 37: 703–710.
Treatment of Industrial and Agro-Industrial Wastewater Using Constructed Wetlands Mar-Yam Sultana
References 227
Tekerlekopoulou, A.G., Tsiflikiotou, M., Akritidou, L., Viennas, A., Tsiamis, G., Pavlou, S.,
Bourtzis, K., Vayenas, D.V., 2013. Modelling of biological Cr(VI) removal in draw-fill
reactors using microorganisms in suspended and attached growth systems. Water
Research, 47: 623 – 636, doi: 10.1016/j.watres.2012.10.034.
Tiedje, J.M., 1988. Ecology of denitrification and dissimilatory nitrate reduction to
ammonium, in: Zehnder AJB (Ed.), Biology of Anaerobic Microorganisms. John Wiley
& Sons, New York, pp. 179-244.
Toet, S., Van Logtestijn, R.S.P., Kampf, R., Schreijer, M., Verhoeven, J.T.A., 2005. The
effect of hydraulic retention time on the removal of pollutants from sewage treatment
plant effluent in a surface-flow wetland system. Wetlands 25, 375–391.
Tousignant, E., Fankhauser, O., Hurd, S., 1999. Manual for the Design, Construction and
Operations of Constructed Wetlands for Rural Applications in Ontario; Funded by the
Canadapt Program of the Agricultural Adaptation Council, Ontario November, 1999,
Stantec Consulting Ltd, Research and Technology Transfer Group, Alfred College
(University of Guelph) South Nation Conservation.
Trias, M., Hu, Z., Mortula, M.M., Gordon, R.J., Gagnon, G.A., 2004. Impact of seasonal
variation on treatment of swine wastewater. Environmental Technology, 25: 775-781.
UN Water. 2008. Tackling a global crisis: International Year of Sanitation 2008.
http://www.wsscc.org/fileadmin/files/pdf/publication/IYS_2008tackling_a_global_crisi
s.pdf (Accessed February 2010).
UNESCAP, 1999. Integrating environmental consideration intoeconomic policy making
process: background readings,vol 1. Institional arrangement and mechanism at national
level (ST/ESCAP/1944).
UNESCAP, 2000. Integrating environmental consideration into economic policy making:
institutional issues. (ST/ESCAP/1990).

Treatment of Industrial and Agro-Industrial Wastewater Using Constructed Wetlands Mar-Yam Sultana
References 228
UNSD/UNEP Questionnaires on Environment Statistics, Waste section. Eurostat
Environmental Data Centre on
Wast(http://epp.eurostat.ec.europa.eu/portal/page/portal/waste/key_waste_streams/hazar
dous_waste). OECD Environmental Data Compendium, Waste section.
USDA, NRCS (Natural Resources Conservation Service) and US EPA, 1995a. Handbook of
constructed wetlands. A guide to creating wetlands for: agricultural wastewater,
domestic wastewater, coal mine drainage, storm water in the Mid-Atlantic Region.
Volume 1: general considerations. US EPA, Washington, D.C., USA, pp 55.
USDA, NRCS and US EPA, 1995b. Handbook of constructed wetlands. A guide to creating
wetlands for: agricultural wastewater, domestic wastewater, coal mine drainage,
stormwater in the Mid-Atlantic Region. Volume 3: agricultural wastewater. US EPA,
Washington, D.C., USA, pp 35.
Ustohalova, V., Ricken, T., Widmann, R., 2006. Estimation of landfill emission lifespan using
process oriented modeling. Waste Management, 26: 442-450; doi:
10.1016/j.wasman.2005.11.012.
Vaiopoulou, E. and Gikas, P., 2012. Effects of chromium on activated sludge and on the
performance of wastewater treatment plants: A review. Water Research 46: 549 – 570;
doi: 10.1016/j.watres.2011.11.024.
Vajpayee, P., Sharma, S.C., Tripathi, R.D., Rai, U.N., Yunus, M., 1999. Bioaccumulation of
chromium and toxicity to photosynthetic pigments, nitrate reductase activity and protein
content of Nelumbo nucifera Gaertn. Chemosphere, 39: 2159–2169; DOI:
10.1016/S0045-6535(99)00095-8.
Valerie, C., Rudy, S., Jiska, V., 2004. Assessment of acid neutralizing capacity and potential
mobilization of trace metals from land-disposed dredged sediments. Science of the
Total Environment, 333: 233-247.
Vauquelin, L.N. (Ed.), 1798. Memoir on a new metallic acid which exists in the red lead of
Sibiria.

Treatment of Industrial and Agro-Industrial Wastewater Using Constructed Wetlands Mar-Yam Sultana
References 229
Velma, V., Vutukuru, S.S., Tchounwou, P.B., 2009. Ecotoxicology of Hexavalent Chromium
in Freshwater Fish: A Critical Review. Reviews on environmental health, 24: 129–145.
Venceslau, M.C., Tom, S., Simon, J.J., 1994. Characterization of textile wastewaters a
review. Environmental Technology, 15: 917-929.
Verheijen, L.A.H.M., Weirsema, D., Hwshoffpol, L.W., Dewit, J., 1996. Live Stock and the
Environment: Finding a Balance Management of Waste from Animal Product
Processing. International Agriculture Centre, Wageningen, The Netherlands.
Vlyssides, A.G., Barampouti, E.M., Mai, S., 2005. Wastewater characteristics from Greek
wineries and distilleries, Water Science and Technology, 51: 53–60.
Vourch, M., Balannec, B., Chaufer, B., Dorange, G., 2008. Treatment of dairy industry
wastewater by reverse osmosis for water reuse. Desalination 219: 190-202;
doi:10.1016/j.desal.2007.05.013.
Vymazal J., 2005. Removal of heavy metals in a horizontal sub-surface flow constructed
wetland. Journal of Environmental Science and Health Part A: Toxic/Hazardous
Substances and Environmental Engineering, 40:1369-1379; doi: 10.1081/ESE-
200055858.
Vymazal J., 2010. Constructed Wetlands for Wastewater Treatment. Water, 2: 530-549;
doi:10.3390/w2030530.
Vymazal, J. and Krasa, P., 2003. Distribution of Mn, Al, Cu, and Zn in a constructed wetland
receiving municipal sewage. Water Science Technology, 48: 299–305.
Vymazal, J. and Kropfelova, L., 2008. Wastewater Treatment in Constructed Wetlands with
Horizontal Sub-Surface Flow. Springer, © 2008 Springer Science + Business Media
B.V.; ISBN 978-1-4020-8579-6; e-ISBN 978-1-4020-8580-2.
Vymazal, J., 1995. Algae and Element Cycling in Wetlands. CRC Press/Lewis Publisher,
Boca Raton, Florida.
Treatment of Industrial and Agro-Industrial Wastewater Using Constructed Wetlands Mar-Yam Sultana
References 230
Vymazal, J., 1998. Czech Republic, in: Constructed Wetlands for Wastewater Treatment in
Europe, J. Vymazal, H. Brix, P.F. Cooper, M.B. Green and R. Haberl, eds., Backhuys
Publishers, Leiden, The Netherlands, pp. 95-121.
Vymazal, J., 2002. The use of sub-surface constructed wetlands for wastewater treatment in
the Czech Republic: 10 years experience. Ecological Engineering, 18: 633–646; doi:
10.1016/S0925-8574(02)00025-3.
Vymazal, J., 2003. Distribution of iron, cadmium, nickel and lead in a constructed wetland
receiving municipal sewage, in: J. Vymazal (Ed.), Wetlands-Nutrients, Metals and Mass
Cycling, Backhuys Publishers, Leiden, The Netherlands, 2003.
Vymazal, J., 2007. Removal of nutrients in various types of constructed wetlands. Science of
The Total Environment 380: 48-65; doi: 10.1016/j.scitotenv.2006.09.014.
Vymazal, J., 2009. Wetland wastewater treatment system: Twenty years of experience in the
Czech Republic. Water Management, May, pp 113-118.
Vymazal, J., 2010. Constructed Wetlands for Wastewater Treatment. Water, 2: 530-549;
doi:10.3390/w2030530.
Vymazal, J., 2011. Plants used in constructed wetlands with horizontal subsurface flow: a
review. Hydrobiologia, 1-24.
Vymazal, J., Brix, H., Cooper, P.F., Haberl, R., Perfl er, R., Laber, J., 1998. Removal
mechanisms and types of constructed wetlands. In: Vymazal, J., Brix, H., Cooper, P.F.,
Green, M.B., Haberl, R. [Eds]. Constructed Wetlands for Wastewater Treatment in
Europe. Backhuys Publishers, Leiden, The Netherlands, pp. 17-66.
Vymazal, J., Greenway, M., Tonderski, K., Brix, H., Mander, Ü., 2006. Constructed
wastewater treatment. In: J.T.A. Verhoeven, B. Beltman, R. Bobbink and D.F.
Whigham (eds.), Wetlands as a Natural Resource, Volume 1. Wetlands and Natural
Resource Management, Springer Verlag, pp. 69-96.
Treatment of Industrial and Agro-Industrial Wastewater Using Constructed Wetlands Mar-Yam Sultana
References 231
Vymazal, J., Svehla, J., Kropfelova, L., Chrastny, V., 2007. Trace metals in Phragmites
australis and Phalaris arundinacea growing in constructed and natural wetlands.
Science of The Total Environment, 380: 154-162.
Vymazal, J. and Kropfelova, L., 2009. Removal of organics in constructed wetlands with
horizontal sub-surface flow: A review of the field experience. Science of The Total
Environment, 407:3911–3922; doi: 10.1016/j.scitotenv.2008.08.032
Walker, D.J., 1998. Modeling residence time in stormwater ponds. 10: 247–262.
Wallace S., Parkin G., Cross C., 2000. Cold climate wetlands: design & performance.
Presented at the Wetlands for Wastewater Recycling Conference, Baltimore MD.
Environmental Concern, Inc. St. Michaels Maryland.
Wallace, W. and Nicholas, D.J.D., 1969. The biochemistry of nitrifying microorganisms.
Biological Reviews 44: 359-391.
Wang, Z., Bush, R.T., Sullivan, L.A., Liu, J., 2013. Simultaneous Redox Conversion of
Chromium(VI) and Arsenic(III)under Acidic Conditions. Environmental Science and
Technology, 47, 6486−6492.
Wang, W.X., Griscom, S.B., Fisher, N.S., 1997. Bioavailability of Cr (III) and Cr(VI) to
marine mussels from solute and particulate pathways. Environmental Science and
Technology 31: 603-611; doi: 10.1021/es960574x.
Watson J.T. and Hobson J.A., 1989. Hydraulic design considerations and control structures
for constructed wetlands for wastewater treatment. In: HAMMER D.A. (ed.):
Constructed wetlands for wastewater treatment, Lewis Publishers, Chelsea, USA.
Weis, J.S. and Weis, P., 2004. Metal uptake, transport and release by wetland plants:
implications for phytoremediation and restoration. Environment International, 30: 685-
700.
Treatment of Industrial and Agro-Industrial Wastewater Using Constructed Wetlands Mar-Yam Sultana
References 232
Wetzel, R. G., 1993. Constructed wetlands: scientific foundations are critical. pp 3-7; in
Constructed Wetlands for Water Quality Improvement, G.-A. Moshiri (ed.). CRC Press,
Boca Raton, FL
Wetzel, R.G., 2001. Limnology. Lake and River Ecosystems. Academic Press, San Diego.
WHO, 2012. Progress on drinking water and sanitation: 2012 update; WHO/UNICEF Joint
Monitoring Programme for Water Supply and Sanitation.
Wiberg, K.B. 1965. Oxidation of chromic acid and chromyl compounds. In: Wieberg K.B.
(ed) Oxidation in Organic Chemistry. Academic Press, New York.
Wildeman, T., Gusek, J., Dietz, J., Morea, S., 1991. Handbook for Constructed Wetlands
Receiving Acid Mine Drainage. US EPA, Cincinnati, OH.
Williams, J.B., 1993. Microbial factors affecting the design and operation of a gravel bed
hydroponic sewage treatment system. Ph.D. thesis. Department of Civil Engineering,
University of Portsmouth.
Williams, W.T. and Barber, D.A., 1961. The functional significance of aerenchyma in plants.
Symposia of the Society for Experimental Biology, 15: 132-144.
Willow, M.A. and Cohen, R.R.H., 2003. pH, dissolved oxygen, and adsorption effects on
metal removal in anaerobic bioreactors. Journal of Environmental Quality, 32:1212-
1221; doi: 10.2134/jeq2003.1212
Wit, J.N.de., 2001. Lecturer’s Handbook on whey and whey products, European Whey
Products Association (EWPA) 14, Rue Montoyer1000 Brussels, Belgium.
World Bank, 2007. Environmental, Health, and Safety Guidelines for Textile Manufacturing,
International Finance Corporation, World Bank Group, On line at:
http://www.ifc.org/ifcext/sustainability.nsf/Attachments.

Treatment of Industrial and Agro-Industrial Wastewater Using Constructed Wetlands Mar-Yam Sultana
References 233
WPCF, 1990. Federation, Water Pollution Control, 1990: Natural Systems for Wastewater
Treatment: Manual of Practice; FD-16 Water Pollution Control Federation (WPCF),
Alexandria, VA, USA.
WWAP. 2009. The United Nations World Water Development Report 3: Water in a Changing
World. Paris: UNESCO, and London: Earthscan.
http://unesdoc.unesco.org/images/0018/001819/181993e.pdf.
WWDR, 2014. WWAP (United Nations World Water Assessment Programme), 2014; The
United Nations World Water Development Report 2014: Water and Energy; Paris,
UNESCO.
Yadav, A.K., Dash, P., Mohanty, A., Abbassi, R., Mishra, B.K., 2012. Performance
assessment of innovative constructed wetland-microbial fuel cell for electricity
production and dye removal, Ecological Engineering, 47: 126–131.
Yadav, A.K., Kumar, N., Sreekrishnan, T.R., Satya, S., Bishnoi, N.R., 2010. Removal of
chromium and nickel from aqueous solution in constructed wetland: mass balance,
adsorption–desorption and FTIR study. Chemical Engineering Journal, 160: 122–128.
Yadav, S., Shukla, O.P., Rai, U.N., 2005. Chromium pollution and bioremediation. Arch.
EnviroNews Newslett. ISEB, India 11 (1), 3–4.
Yalcuk, A., Pakdil, N.B., Turan, S.Y., 2010. Performance evaluation on the treatment of
olivemill waste water in vertical subsurface flow, constructed wetlands. Desalination,
262: 209-214.
Yamagiwa, K. and Ong, S.A., 2007. Upflow constructed wetland for on-site industrial
wastewater treatment. Research paper, International conference proceedings,
International Forum on Water Environmental Governance in Asia, pp.87-91
Yang, B.C., Lan, Y., Yang, C.S., Liao, W.B., Chang, H., Shu, W.S., 2006. Long-term
efficiency and stability of wetlands for treating wastewater of a lead/zinc mine and the

Treatment of Industrial and Agro-Industrial Wastewater Using Constructed Wetlands Mar-Yam Sultana
References 234
concurrent ecosystem development. Environmental Pollution, 143: 499-512; doi:
10.1016/j.envpol.2005.11.045.
Yeh, T.Y., Chou, C.C., Pan, C.T., 2009. Heavy metal removal within pilot-scale constructed
wetlands receiving river water contaminated by confined swine operations.
Desalination, 249: 368-373.
Zachara, J.M., Ainsworth, C.C., Cowan, C.E., Resch, C.T., 1989. Adsorption of chromate by
subsurface soil horizons. Soil Science Society of America Journal 53: 418-428.
Zayed, A.M. and Terry, N., 2003. Chromium in the environment: factors affecting biological
remediation. Plant Soil, 249: 139-156.
Zeng, F., Ali, S., Zhang, H., Ouyang, Y., Qiu, B., Wu, F., Zhang, G., 2011. The influence of
pH and organic matter content in paddy soil on heavy metal availability and their uptake
by rice plants. Environmental Pollution, 159: 84-91.
Zhang, C.B., Wang, J., Liu, W.L., Zhu, S.X., Liu, D., Chang, S.X., Chang, J., Ge, Y., 2010.
Effects of plant diversity on nutrient retention and enzyme activities in a fullscale
constructed wetland. Bioresource Technology 101: 1686-1692.
Zhao , Y.Q., Babatunde, A.O., Hu, Y.S., Kumar, J.L.G., Zhao, X.H., 2011. Pilot field-scale
demonstration of a novel alum sludge-based constructed wetland system for enhanced
wastewater treatment. Process Biochemistry, 46: 278-283.
Zhao, Y.Q., Sun, G., Allen, S.J., 2004. Anti-sized reed bed system for animal wastewater
treatment: a comparative study. Water Research, 38: 2907-2917.
Zhitkovich, A., 2011. Chromium in Drinking Water: Sources, Metabolism, and Cancer Risks,
Chemical Research in Toxicology, 24:1617–1629. doi: 10.1021/tx200251t.
Zouboulis A.I., Loukidou M.X., Matis K.A., 2004. Biosorption of toxic metals from aqueous
solutions by bacteria strains isolated from metal-polluted soils. Process Biochemistry,
39: 909-916; doi: 10.1016/S0032-9592(03)00200-0.

Treatment of Industrial and Agro-Industrial Wastewater Using Constructed Wetlands Mar-Yam Sultana
References 235
Zucconi, F., Forte, M., Monaco, A., De Bertoldi, M., 1981. Biological evaluation of compost
maturity. BioCycle, 22: 27-29.
WEBSITES
URL 1: http://www.aquastress.net
URL 2: http://www.aquaticplantcentral.com
URL 3: home.eng.iastate.edu/~tge/ce421-521/jenny.pdf

Treatment of Industrial and Agro-Industrial Wastewater using Constructed Wetlands Mar-Yam Sultana
Appendix
APPENDIX

Treatment of Industrial and Agro-Industrial Wastewater using Constructed Wetlands Mar-Yam Sultana
Appendix 236
APPENDIX
Measurement Procedure of Hexavalent Chromium, Cr(VI):
The concentration of Cr(VI) was calculated by «3500- Cr D Colorimetric method» according
to Standard Methods for the Examination of Water and Wastewater (APHA, 1989).
Instruments:
1. Spectrophotometer (BOECO, Germany, S-20 Spectrophotometer) (Figure 1.)
2. Pipettes.
3. Cups boiling.
4. Magnets 4.
Figure 1: Spectrophotometer (BOECO, Germany, S-20 Spectrophotometer).
Solutions - Reagents
1. Concentrated H2SO4.
2. Diphenyl Carbazide [50ml pure acetone (assay> 99.5%) and 0.25g dust Diphenyl
Carbazide, poured in the bottle that wrapped well in foil, and stirred until the powder
was dissolved (the solution should be clear). The date of reagent making have been
written and kept in the refrigerator for 4 days only)

Treatment of Industrial and Agro-Industrial Wastewater using Constructed Wetlands Mar-Yam Sultana
Appendix 237
Procedure of Analysis:
Samples were filtered in vacuum pump with filters of 0.45mm Milliporefilters (GN-6
Metricel Grid 47mm, Pall Corporation). Then 1mL of filtered samples was added in a beaker
that contained 49ml of deionized water for making of 1:50 dilution ratio. Placed in stirring
and thereafter 1ml diphenyl-carbazide was added and 2-3 drops of H2SO4. The sample
covered with aluminum foil and stirred for 5-7 min for the development and configuration of
color. The spectrophotometric measurement of the absorbance of the sample became at
540nm.
Manufacture standard calibration curve for measurement of the Cr(VI):
Stock Solution of Cr(VI) for Concentration of 500mg/L
500mg/L = 500mg/1L H2O= 0.5gr/1L H2O
Atomic weight of K2Cr2O7 = 294.1846 gr.
In, 294.1846gr of K2Cr2O7 → 103.9922gr of Cr X=1.4145gr K2Cr2O7
X; gr of K2Cr2O7 → 0.5 gr of Cr in K2Cr2O7
Therefore, In 1L → 0.5gr Cr Z=0.05 gr Cr
0.1L → Z; Cr
In, 294.1846gr of K2Cr2O7 → 103.9922gr of Cr X=0.14145gr K2Cr2O7
X; gr of K2Cr2O7 → 0.05 gr of Cr in K2Cr2O7
So, the stock solution was prepared by adding, 0.14145gr of K2Cr2O7 in 100ml Milli- Qwater.
Standard Solution of Cr(VI) for Concentration of 5mg/L:
500 mg/L 5 mg/L
5 mg/L

Treatment of Industrial and Agro-Industrial Wastewater using Constructed Wetlands Mar-Yam Sultana
Appendix 238
C1× V1 = C2× V2
500mg/L ×V1 = 5 mg/L ×100mL
V1 = 1mL Cr (100mL – 1mL = 99mL H2O)
Therefore, the standard solution was prepared by adding 1mL of the stock in 100mL Milli-
Qwater.
After preparing the Stock and the Standard solution and the corresponding selected range of
concentrations of the standard solutions were prepared, the range was from 0.04mg/L to 4
mg/L.
The Equation was for the preparation of standard solutions:
C1× V1 = C2× V2
Where, C1= 5 mg/L
V1= 50 mL
For, C2 = 0.04 mg/L
C1 × V1 = C2 ×V2
5 × V1 = 0.04 × 50 V1 = 0.4mL
Therefore, 0.4ml of the Standard solution was added add in 49.6mL Milli- Qwater and stirred.
For, C2 = 0.08 mg/L
C1 × V1 = C2 ×V2
5 × V1 = 0.08 × 50 V1 = 0.8mL
Therefore, 0.8mL of the Standard solution was added in 49.6mL Milli- Qwater and stirred.
For, C2 = 0.16mg/L
C1 × V1 = C2 ×V2
5 × V1 = 0.16 × 50 V1 = 1.6mL
Therefore,, 1.6mL of the Standard solution was added in 48.4mL Milli- Qwater.
For, C2 = 0.2mg/L

Treatment of Industrial and Agro-Industrial Wastewater using Constructed Wetlands Mar-Yam Sultana
Appendix 239
C1 × V1 = C2 ×V2
5 × V1 = 0.2 × 50 V1 = 2mL
Therefore, 2mL of the Standard solution was added in 48mL Milli- Qwater.
For, C2 = 0.32mg/L
C1 × V1 = C2 ×V2
5 × V1 = 0.32 × 50 V1 = 3.2mL
Therefore, 3.2mL of the Standard solution was added in 46.8mL Milli- Qwater.
For, C2 = 0.5mg/L
C1 × V1 = C2 ×V2
5 × V1 = 0.5 × 50 V1 = 5mL
Therefore, 5mL of the Standard solution was added in 45mL Milli- Qwater.
For, C2 = 0.64mg/L
C1 × V1 = C2 ×V2
5 × V1 = 0.64 × 50 V1 = 6.4mL
Therefore, 6.4mL of the Standard solution was added in 43.6mL Milli- Qwater.
For, C2 = 0.9mg/L
C1 × V1 = C2 ×V2
5 * V1 = 0.9 * 50 V1 = 9mL
Therefore, 9ml of the Standard solution was added in 41mL Milli- Qwater.
For, C2 = 1mg/L
C1 × V1 = C2 ×V2
5 × V1 = 1 × 50 V1 = 10mL
Therefore, 10ml of the Standard solution was added in 40mL Milli- Qwater.
For, C2 = 1.3mg/L

Treatment of Industrial and Agro-Industrial Wastewater using Constructed Wetlands Mar-Yam Sultana
Appendix 240
C1 × V1 = C2 ×V2
5 × V1 = 1.3 × 50 V1 = 13mL
Therefore, 13ml of the Standard solution was added in 37mL Milli- Qwater.
For, C2 = 1.4mg/L
C1 × V1 = C2 ×V2
5 × V1 = 1.4 × 50 V1 = 14mL
Therefore, 14ml of the Standard solution was added in 36mL Milli- Qwater.
For, C2 = 1.6mg/L
C1 × V1 = C2 ×V2
5 × V1 = 1.6 × 50 V1 = 16mL
Therefore, 16ml of the Standard solution was added in 34mL Milli- Qwater.
For, C2 = 2.24mg/L
C1 × V1 = C2 ×V2
5 × V1 = 2.24 × 50 V1 = 22.4mL
Therefore, 22.4ml of the Standard solution was added in 27.6mL Milli- Qwater.
For, C2 = 3.52mg/L
C1 × V1 = C2 ×V2
5 × V1 = 3.52 × 50 V1 = 35.2mL
Therefore, 35.2ml of the Standard solution was added in 14.8mL Milli- Qwater.
For, C2 = 4mg/L
C1 × V1 = C2 ×V2
5 × V1 = 4 × 50 V1 = 40ml
Therefore, 40ml of the Standard solution was added in 10mL Milli- Qwater.
Then the graph was constructed where, in “y” axis represented the concentrations and the “x”
axis represented the absorbance.
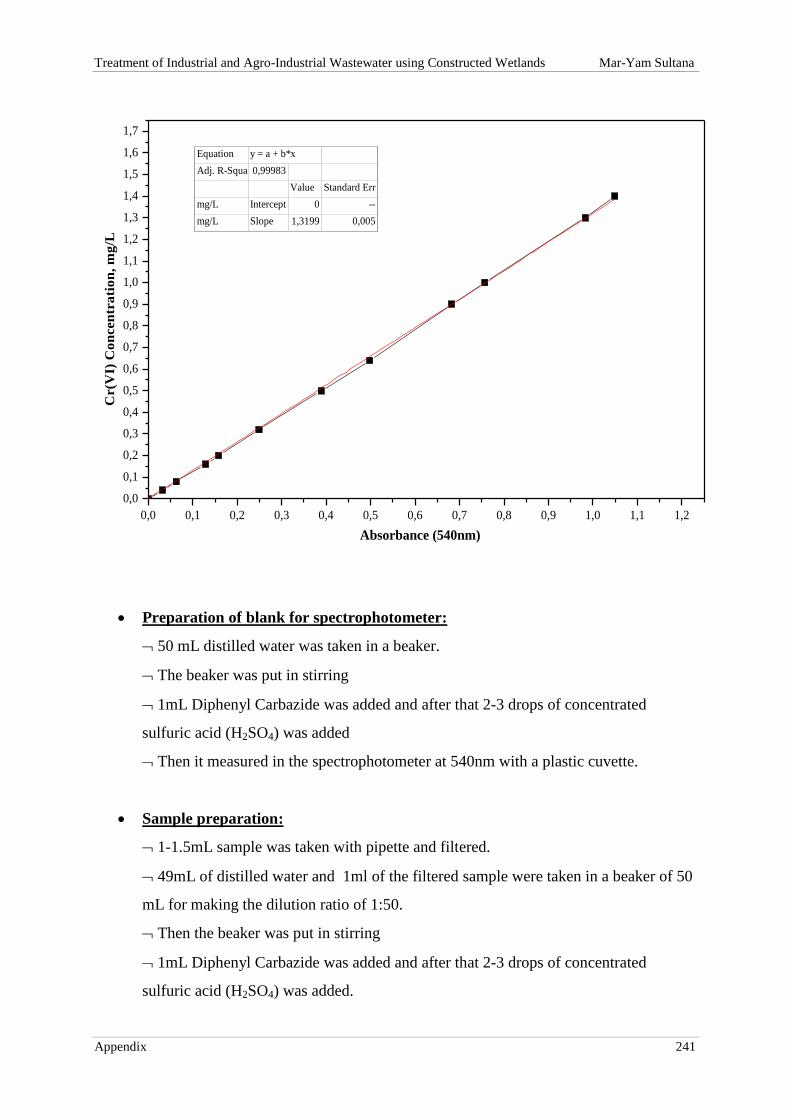
Treatment of Industrial and Agro-Industrial Wastewater using Constructed Wetlands Mar-Yam Sultana
Appendix 241
0,0 0,1 0,2 0,3 0,4 0,5 0,6 0,7 0,8 0,9 1,0 1,1 1,2
0,0
0,1
0,2
0,3
0,4
0,5
0,6
0,7
0,8
0,9
1,0
1,1
1,2
1,3
1,4
1,5
1,6
1,7
C
r(V
I) C
on
cen
tra
tio
n, m
g/L
Absorbance (540nm)
Equation y = a + b*x
Adj. R-Squa 0,99983
Value Standard Err
mg/L Intercept 0 --
mg/L Slope 1,3199 0,005
Preparation of blank for spectrophotometer:
50 mL distilled water was taken in a beaker.
The beaker was put in stirring
1mL Diphenyl Carbazide was added and after that 2-3 drops of concentrated
sulfuric acid (H2SO4) was added
Then it measured in the spectrophotometer at 540nm with a plastic cuvette.
Sample preparation:
1-1.5mL sample was taken with pipette and filtered.
49mL of distilled water and 1ml of the filtered sample were taken in a beaker of 50
mL for making the dilution ratio of 1:50.
Then the beaker was put in stirring
1mL Diphenyl Carbazide was added and after that 2-3 drops of concentrated
sulfuric acid (H2SO4) was added.

Treatment of Industrial and Agro-Industrial Wastewater using Constructed Wetlands Mar-Yam Sultana
Appendix 242
Covered the beaker with foil and waited for 5-7 minutes.
When the sample was turned in purple colour then it measured in the
spectrophotometer at 540nm with a plastic cuvette.
Calculation:
The concentrations of samples were calculated by following equation:
Cr (VI) (mg/L) = Absorption × Dilution ratio × Slope

Treatment of Industrial and Agro-Industrial Wastewater using Constructed Wetlands Mar-Yam Sultana
Appendix 243
Measurement Procedure of dissolved Chemical Oxygen Demand (d-COD):
The determination of chemical oxygen demand, was performed according to the method
"Closed Reflux" described in Standard Methods for the examination of water and wastewater
(APHA et al. 1989).
The COD represents the amount of oxygen consumed in the chemical oxidation of organic
compounds, which contained both the wastewater and natural waters. The oxidation is done
with potassium dichromate in an acidic environment and the results are expressed in mg/L of
water.
Apparatus Required:
Instruments:
1. Digester (HANNA instruments C9800 REACTOR).
2. Photometer (HANNA C99 Multiparameter Bench Photometer for Laboratories).
3. Bottles for digestion.
Reagents:
1. Digest Solution of K2Cr2O7*
2. Catalyst**(concentrated sulfuric acid 96%, H2SO4 with Silver sulfate,Ag2SO4).
According to the Standard Methods for the examination of water and wastewater (APHA et
al. 1989), the digestion solution for “Closed Reflux” method was prepared by following
procedure:
*Digest solution:
• 500 mL distilled water.
• 10.216 gr K2Cr2O7 (having been dried at 150 ° C for 2h).
• 167 mL H2SO4.
• 33.3 gr HgSO4.
• Diluted with distilled water to a volume of 1000 mL.
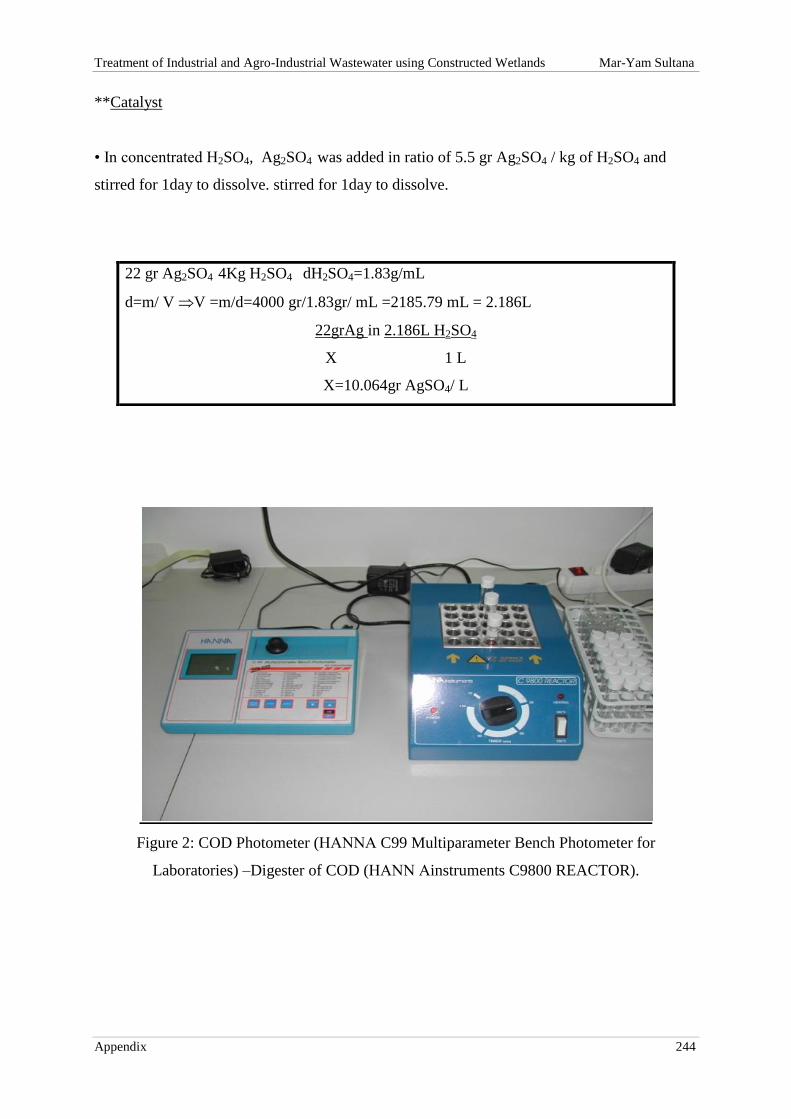
Treatment of Industrial and Agro-Industrial Wastewater using Constructed Wetlands Mar-Yam Sultana
Appendix 244
**Catalyst
• In concentrated H2SO4, Ag2SO4 was added in ratio of 5.5 gr Ag2SO4 / kg of H2SO4 and
stirred for 1day to dissolve. stirred for 1day to dissolve.
Figure 2: COD Photometer (ΗΑΝΝΑ C99 Multiparameter Bench Photometer for
Laboratories) –Digester of COD (ΗΑΝΝ Αinstruments C9800 REACTOR).
22 gr Ag2SO4 4Kg H2SO4 dH2SO4=1.83g/mL
d=m/ V V =m/d=4000 gr/1.83gr/ mL =2185.79 mL = 2.186L
22grAg in 2.186L H2SO4
X 1 L
X=10.064gr AgSO4/ L

Treatment of Industrial and Agro-Industrial Wastewater using Constructed Wetlands Mar-Yam Sultana
Appendix 245
Analysis procedure:
• 2 mL of solution at appropriate dilution was added in two vials and a third vial was filled
with distilled water.
• Then in the three vials, 1.2mL of digestion solution and 2.8 mL catalyst were added.
• The vials were then put in vortex.
• After vortex, the vials placed in the digester (150 ° C) for 2 hours.
• After two hours, the bottles removed and opened the lids to do "chuff", reclosed, and waited
for 10 min. to cool.
• Again the vials were put for vortex.
• After 2 hour the samples were measured in absorption photometer of COD (Figure 2),
Programme 31 (3 consecutive measurements around, read direct).
Calculation:
The COD concentrations of samples were calculated by following equation:
Dissolved COD, (mg/L) = Absorbance × Dilution ratio

Treatment of Industrial and Agro-industrial Wastewater Using Constructed Wetlands Mar-Yam Sultana
Short Curriculum Vitae 246
Short Curriculum Vitae of
Mar-Yam Sultana
Father’s Name : Prof. Dr. M. Abdul Karim
Mother’s Name : Sayeeda Begum
Date of Birth : 10 September, 1984
Nationality : Bangladeshi
Permanent Address : Village: Parialpur, Post Office: Setabganj-5216,
Police Station: Bochaganj, District: Dinajpur,
BANGLADESH
Present Address : Laboratory of Environmental Systems,
School of Engineering,
Department of Environmental and Natural
Resources Management, University of Patras,
G. Seferi 2, Agrinio, T.K. 30100, GREECE.
Email: [email protected],
EDUCATIONAL QUALIFICATION:
PhD Candidate (2011-2014) : Laboratory of Environmental Systems,
School of Engineering,
Department of Environmental and Natural
Resources Management, University of Patras,
G. Seferi 2, Agrinio, T.K. 30100, GREECE
Thesis title: Treatment of Industrial and Agro-Industrial Wastewater Using Constructed
Wetlands
Master of Science (Jan 2007-June 2008) : MS in Irrigation and Water Management*
Department of Irrigation and Water Management,
Faculty of Agricultural Engineering
Bangladesh Agricultural University,
Mymensingh-2202, BANGLADESH
Treatment of Industrial and Agro-industrial Wastewater Using Constructed Wetlands Mar-Yam Sultana
Short Curriculum Vitae 247
* MS Thesis Title: Performance Improvement of a Traditional Pedal Pump.
Bachelor of Science (July 2002-June 2006) : B.Sc. in Agricultural Engineering
Faculty of Agricultural Engineering
Bangladesh Agricultural University,
Mymensingh-2202, BANGLADESH
PUBLICATION IN INTERNATIONAL JOURNALS
1. M.K. Michailides, M.Y. Sultana, A.G. Tekerlekopoulou, C.S. Akratos, D.V. Vayenas,
2013. Biological Cr(VI) removal using bio-filters and constructed wetlands, Water
Science Technology, 68: 2228-2233.
2. M.Y. Sultana, A.K.M.M.B. Chowdhury, M.K. Michailides, C.S. Akratos, A.G.,
Tekerlekopoulou, D.V., Vayenas, 2014. Integrated Cr(VI) removal using constructed
wetlands and composting, Journal of Hazardous Materials, In press.
3. M.Y. Sultana, C.S. Akratos, S. Pavlou and D. V. Vayenas, 2014. Chromium removal in
constructed wetlands: A review. International Biodeterioration and Biodegradation, 96:
181-190.
4. M. K. Michailides, T. Tatoulis, M.Y. Sultana, A. Tekerlekopoulou, I. Konstantinou, C.
S. Akratos, S. Pavlou, D.V. Vayenas. 2014. Start-up of a free water surface constructed
wetland for treating olive mill wastewater. Journal of Chemical Industry (Hemijska
industrija). doi:10.2298/HEMIND140820076M.
5. M.Y. Sultana, C. Mourti, T. Tatoulis, C.S., Akratos, A.G. Tekerlekopoulou, D.V.,
Vayenas, 2014. Effect of hydraulic retention time, temperature, and organic load on a
horizontal subsurface flow constructed wetland treating cheese whey wastewater.
Submitted.
Treatment of Industrial and Agro-industrial Wastewater Using Constructed Wetlands Mar-Yam Sultana
Short Curriculum Vitae 248
PUBLICATION IN NATIONAL JOURNALS
M. Y. Sultana; A. Khair and K. M. Hasanuzzaman 2008. Improvement of Performances of the
Traditional Pedal Pump. Journal of Environmental Science and Natural Resources, 1: 73-78.
PUBLICATION IN INTERNATIONAL CONFERENCES
1. M.K. Michailides, M.Y. Sultana, A.G. Tekerlekopoulou, C.S. Akratos and D.V.
Vayenas. (2013). Biological Cr(VI) removal using bio-filters and constructed
wetlands, Proceedings of International conference on Asset management for
enhancing energy efficiency in water and wastewater systems, 24-26 April, 2013,
Marbella, Spain.
2. M.Y. Sultana, M.K. Michailides, C.S. Akratos, A.G. Tekerlekopoulou and D.V.
Vayenas (2013). Effect of hydraulic residence time on Cr(VI) removal using
constructed wetlands. Proceedings of the 13th International Conference on
Environmental Science and Technology, 5-7 September 2013, Athens, Greece.
3. M.Y. Sultana, M.K. Michailides, C.S. Akratos, A.G. Tekerlekopoulou and D.V.
Vayenas (2013). Constructed wetlands pilot-scale units for the co-treatment of Cr(VI)
and secondary cheese-whey. Proceedings 4th
Conference of Decentralized Wastewater
Treatment Plants, 25-27 October 2013, Volos.
4. M.K. Michailides, M.Y. Sultana, C.S. Akratos, A.G. Tekerlekopoulou and D.V.
Vayenas (2014). Integrated chromium waste treatment. Proceedings of 4th
Environmental Conference of Macedonia, 14-16 March, Thessaloniki.
5. M.Y. Sultana, T. Tatoulis, C. S. Akratos, A.G. Tekerlekopoulou and D.V. Vayenas
2014. Effect of operational parameters on the performance of a horizontal subsurface
flow constructed wetland treating secondary cheese whey and Cr(VI) wastewater.
Proceedings of 2nd International Conference on Advances in Civil, Structural and
Environmental Engineering - ACSEE’ 14, Zurich 25-26 October, Switzerland.

Treatment of Industrial and Agro-industrial Wastewater Using Constructed Wetlands Mar-Yam Sultana
Short Curriculum Vitae 249
Research Experience:
Worked as Scientific Officer under the approval of Bangladesh Agricultural University
Research System (BAURES) funded by Japanese Government (NIAES), research project
entitled “Rice Paddy Flux Observation in Bengal Lowland (Project#2005/29/NIAES)”
Department of Environment Science, Bangladesh Agricultural University, Mymensingh from
August, 2008-July, 2010.
References:
1. Professor Dr. Dimtrios V. Vayenas
Environmental Systems Laboratory
Department of Environmental and Natural Resources Management
University of Patras, G. Seferi 2, Agrinio 30100
GREECE
Email: [email protected]
Tel: +302641074117
2. Dr. Christos S. Akratos
Assistant Professor
Environmental Systems Laboratory
Department of Environmental and Natural Resources Management
University of Patras, G. Seferi 2, Agrinio 30100
GREECE
Email: [email protected]
Tel: +302641074209


