Embed Size (px)
Citation preview

Treatment Episode Data Set --Discharges (TEDS-D), 2007
United States Department of Health andHuman Services. Substance Abuse andMental Health Services Administration.Office of Applied Studies
Codebook
is sponsored by
Terms of Use
These data are distributed under the following terms of use. By continuing past this page, you
signify your agreement to comply with the requirements as stated below:
Privacy of Research Subjects
Any intentional identification of a research subject (whether an individual or an organization) or
unauthorized disclosure of his or her confidential information violates the promise of
confidentiality given to the providers of the information. Disclosure of confidential information
may also be punishable under federal law. Therefore, users of data agree:
To use these datasets solely for research or statistical purposes and not for re-
identification of specific research subjects.
To make no use of the identity of any research subject discovered inadvertently and to report any such discovery to CBHSQ and SAMHDA ([email protected])
Citing Data
You agree to reference the recommended bibliographic citation in any of your publications that
use SAMHDA data. Authors of publications that use SAMHDA data are required to send
citations of their published works for inclusion in a database of related publications.
Disclaimer
You acknowledge that SAMHSA will bear no responsibility for your use of the data or for your
interpretations or inferences based upon such uses.
Violations
If CBHSQ determines that this terms of use agreement has been violated, then possible sanctions
could include:
Report of the violation to the Research Integrity Officer, Institutional Review Board, or
Human Subjects Review Committee of the user's institution. A range of sanctions are
available to institutions including revocation of tenure and termination.
If the confidentiality of human subjects has been violated, then report of the violation
may be made to the Federal Office for Human Research Protections. This may result in
an investigation of the user's institution, which can result in institution-wide sanctions
including the suspension of all research grants.
Report of the violation of federal law to the United States Attorney General for possible
prosecution.
Court awarded payments of damages to any individual(s)/organization(s) harmed by the
breach of confidential data.
Definitions
CBHSQ
Center for Behavioral Health Statistics and Quality
Promise of confidentiality
A promise to a respondent or research participant that the information the respondent
provides will not be disseminated in identifiable form without the permission of the
respondent; that the fact that the respondent participated in the study will not be
disclosed; and that disseminated information will include no linkages to the identity of
the respondent. Such a promise encompasses traditional notions of both confidentiality
and anonymity. In most cases, federal law protects the confidentiality of the respondent's
identity as referenced in the Promise of Confidentiality. Under this condition, names and
other identifying information regarding respondents would be confidential.
Research subject
A person or organization that participates in a research study. A research subject may
also be called a respondent. A respondent is generally a survey respondent or informant,
experimental or observational subject, focus group participant, or any other person
providing information to a study.
SAMHDA
Substance Abuse and Mental Health Data Archive
SAMHSA
Substance Abuse and Mental Health Services Administration

Information about Copyrighted Content
Some instruments administered as part of this study may contain in whole or substantially in part contents from copyrighted instruments. Reproductions of the instruments are provided as documentation for the analysis of the data associated with this collection. Restrictions on "fair use" apply to all copyrighted content. More information about the reproduction of copyrighted works by educators and librarians is available from the United States Copyright Office.
NOTICE WARNING CONCERNING COPYRIGHT RESTRICTIONS
The copyright law of the United States (Title 17, United States Code) governs the making of photocopies or other reproductions of copyrighted material. Under certain conditions specified in the law, libraries and archives are authorized to furnish a photocopy or other reproduction. One of these specified conditions is that the photocopy or reproduction is not to be "used for any purpose other than private study, scholarship, or research." If a user makes a request for, or later uses, a photocopy or reproduction for purposes in excess of "fair use," that user may be liable for copyright infringement.

TREATMENT EPISODE DATA SET – DISCHARGES CODEBOOK, 2007 Introduction This codebook is for the Treatment Episode Data Set – Discharges (TEDS-D) for discharges from substance abuse treatment occurring in 2007. TEDS-D provides information on treatment completion, length of stay in treatment, and demographic and substance abuse characteristics of approximately 1.5 million discharges from alcohol or drug treatment in facilities that report to individual state administrative data systems. The TEDS system is comprised of two major components, the Admissions Data Set and the Discharges Data Set. The TEDS-Admissions (TEDS-A) file is an established program; data were first reported for TEDS-A in 1992. The TEDS-D is more recently begun, with the first data reported in 2000. TEDS includes treatment data that are routinely collected by states to monitor their individual substance abuse treatment systems. Selected data items from the individual state data files are converted to a standardized format that is consistent across states. These standardized data constitute TEDS. The TEDS-A is comprised of a Minimum Data Set collected by all states, and a Supplemental Data Set collected by some states. The Minimum Data Set consists of 19 items that include:
• Demographic information; • Primary, secondary, and tertiary substances and their route of administration, frequency
of use, and age at first use; • Source of referral to treatment; • Number of prior treatment episodes; and • Service type, including planned use of medication-assisted (i.e., with methadone or
buprenorphine) opioid therapy. The 15 Supplemental Data Set items include psychiatric, social, and economic measures. Variables included in the discharge record include the same variables as the admissions data. Additionally, TEDS-D includes the following:
• Type of service at discharge; • Length of stay; and • Reason for discharge or discontinuation of service.
A full list of the variables can be viewed in the Variable Information and Frequency section of this codebook.
This codebook provides background and descriptive information for the TEDS-D public-use files, limitations of the data, and frequencies. References detailing the data collected in each state with the TEDS data elements, including state-by-state descriptions of exceptions or anomalies in
- 27301 -
- 1 -

reporting practices, are available. Users may refer to the TEDS Crosswalks available from SAMHSA. The crosswalks are frequently updated as new information becomes available. Since 1992, the Office of Applied Studies (OAS) of the Substance Abuse and Mental Health Services Administration (SAMHSA), U.S. Department of Health and Human Services (DHHS) has funded and been responsible for TEDS. It coordinates and manages the collection of TEDS data from the states. In 2010, the OAS was renamed to the Center for Behavioral Health Statistics and Quality (CBHSQ). The unit of analysis is treatment admissions to state-licensed or certified substance abuse treatment centers that receive federal public funding. Descriptive and analytical reports from TEDS are developed to provide national and state-level data on the number and types of clients treated and the characteristics of facilities providing services. Data Collection The Treatment Episode Data Set State Instruction Manual - Discharge Data is available from the SAMHSA Web site and provides complete instructions on how the TEDS-D data are processed and submitted by the states. Confidentiality Protection Several measures were taken to protect the confidentiality of the TEDS-D records. Variables that potentially identify an individual in their raw form underwent routine top- or bottom-coding in order to prevent high and low codes from distinguishing a respondent’s record. For example, AGE as a continuous variable has the potential to identify both the youngest and oldest participants in a public release file. Hence, AGE was recoded into 11 categories for the public-use file to reduce disclosure risk. The lowest category for age combines the ages of 12-14. Similarly, ages of 55 and older were top-coded. All the variables recoded are documented in Appendix B. Disclosure analysis is used to identify records that remained unique after routine measures were taken to protect confidentiality. Disclosure analysis is used to discern combinations of indirect identifiers that potentially link an individual to a record. Particular attention was given to the analytic importance of geographic data and of subgroup populations. Consequently, data swapping was applied to the TEDS in order to satisfy stringent confidentiality standards while preserving the analytic value of the public-use file. The original location of a record in TEDS-D cannot be known for certain due to the use of data swapping. This method has several benefits over other disclosure protection options: (1) the overall impact to the data is typically small; (2) nearly all of the data are left intact; (3) data for special populations (e.g., minorities, pregnant women) are no more impacted than other data; (4) the procedures typically do not affect any analytic uses of the file; and (5) the procedures allow greater detail to remain on the public use file (e.g., the original ethnicity codes).
- 27301 -
- 2 -

Universe The universe for TEDS-D is discharges in calendar year 2007 that were received and processed through October 10, 2011. These discharges were linked to either new admissions or transfers to treatment in another service type. Coverage The TEDS attempts to include all admissions to providers receiving public funding. Because each state or jurisdiction decides the TEDS eligibility of a provider, there is no independent check on the actual sources of funding. Although SAMHSA requests submission of TEDS data on all admissions to any publicly-funded treatment facility, reporting in some state agencies is structured so that only clients treated with public funds are included in the TEDS. The number of clients in these facilities whose treatment is not publicly-funded is unknown.1 Data Limitations The TEDS, while comprising a significant proportion of all admissions to substance abuse treatment, does not include all such admissions. The TEDS is a compilation of facility data from state administrative systems. The scope of facilities included in the TEDS is affected by differences in state licensure, certification, accreditation, and disbursement of public funds. For example, some state substance abuse agencies regulate private facilities and individual practitioners, while others do not. In some states, hospital-based substance abuse treatment facilities are not licensed through the state substance abuse agency. Some state substance abuse agencies track treatment in correctional facilities (state prisons and local jails), while others do not. In general, facilities reporting TEDS data receive state alcohol and/or drug agency funds (including Federal Block Grant funds) for the provision of alcohol and/or drug treatment services. Most states are able to report all admissions to all eligible facilities, although some report only admissions financed by public funds. States may report data from facilities that do not receive public funds, but generally do not because of the difficulty in obtaining data from these facilities. The TEDS generally does not include data on facilities operated by Federal agencies, including the Bureau of Prisons, the Department of Defense, and the Department of Veterans Affairs. However, some facilities operated by the Indian Health Service are included. The primary goal of TEDS is to monitor the characteristics of treatment episodes for substance abusers. Implicit in the concept of treatment is a planned, continuing treatment regimen. Thus the TEDS does not include early intervention programs; these are considered to be prevention
1 Substance Abuse and Mental Health Services Administration, Office of Applied Studies. Treatment Episode Data Set (TEDS): 1992-1997. National Admissions to Substance Abuse Treatment Services. DASIS Series: S-7, DHHS Publication No. (SMA) 99-3324, Rockville, MD, 1999, 115.
- 27301 -
- 3 -
programs. Crisis intervention facilities such as sobering-up stations and hospital emergency departments are not included in the TEDS. The TEDS is a large and powerful data set. Like all data sets, however, care must be taken that interpretation does not extend beyond the limitations of the data. Limitations fall into two broad categories: those related to the scope of the data collection system, and those related to the difficulties of aggregating data from highly diverse state data collection systems.2 Limitations to be kept in mind while analyzing TEDS data include:
• The TEDS is an admission-based system, and therefore TEDS admissions and discharges do not represent individuals. For example, an individual admitted to and discharged from treatment twice within a calendar year would be counted as two admissions and two discharges.
• The data presented in this report provide information on treatment in specific service types, derived from linked pairs of admission/discharge records. The data do not necessarily represent complete treatment episodes, which may include stays in multiple types of service and would require analysis of series of linked pairs of records.
• The primary, secondary, and tertiary substances of abuse reported to the TEDS are those substances that led to the treatment episode, and not necessarily a complete enumeration of all drugs used at the time of admission.
• The way an admission is defined may vary from state to state such that the absolute number of admissions is not a valid measure for comparing states.
• States continually review the quality of their data processing. As systematic errors are identified, revisions may be enacted in historical TEDS data files. While this system improves the data set over time, reported historical statistics may change slightly from year to year.
• States vary in the extent to which coercion plays a role in referral to treatment. This
variation derives from criminal justice practices and differing concentrations of abuser subpopulations.
• Public funding constraints may direct states to selectively target special populations, for example, pregnant women or adolescents.
2 Substance Abuse and Mental Health Services Administration, Office of Applied Studies. Treatment Episode Data Set (TEDS): 2005. Discharges from Substance Abuse Treatment Services. DASIS Series: S-41, DHHS Publication No. (SMA) 08-4312, Rockville, MD, 1999, 6.
- 27301 -
- 4 -
- 27301 -
- 5 -
• Some states have no Opioid Treatment Programs (OTPs) that provide medication-assisted therapy using methadone and/or buprenorphine. See the TEDS state-by-state crosswalk for information regarding data collected by each state.
Created Variables The TEDS files contain several variables created from the original variables submitted by the states. For example, a variable was created to indicate whether each drug was included as a primary, secondary, or tertiary drug of abuse. These are called flag variables and labeled according to the drug, such as alcflg for alcohol flag variable, cokeflg for cocaine flag, etc. A variable that facilitates comparison of each state to all other states is included in the Survey Documentation and Analysis (SDA) online data analysis files for TEDS. These created variables are referred to as geographic state indicator variables and labeled according to state name such as AKSTATE for Alaska and ALSTATE for Alabama. These variables are useful for examining characteristics of treatment in one state compared to the rest of the nation. The state indicator variables are not included in the downloadable data files for TEDS because they approximately double the size of the files, which are large at the outset due to the number of TEDS records. Therefore, sample SPSS programming syntax is provided below in order to create and append the state indicator variable to downloaded files: Contents of Public-Use Files The TEDS public-use file contains discharge data for 44 states plus Puerto Rico. The following states did not report usable data for the year 2007: Alabama, Georgia, Mississippi, New Mexico, Pennsylvania, and West Virginia. The District of Columbia did not report usable data for 2007 either. The TEDS Discharge public-use files are provided in ASCII rectangular format with SAS, SPSS and Stata data definition statements. SAS Transport (CPORT), SPSS System, Stata System, and ASCII Tab-delimited files are also available. Supplemental files containing optional commands
* Compute TEDS state indicator for Alaska (STFIPS=2). do if (STFIPS eq 2). compute AKSTATE=1. else. compute AKSTATE=2. end if. variable labels AKSTATE "ALASKA STATE INDICATOR". value labels AKSTATE 1 "ALASKA" 2 "ALL OTHER STATES". format AKSTATE (f1.0).
are available for the SAS Transport and Stata System files. A separate codebook is provided for each year’s data file. The number of observations and variables for 2007 are as follows: Filename: da27301-0001.txt Number of observations: 1,607,375 Number of variables: 64 Records per case: 1 Logical record length: 125 User Responsibility Users are reminded that the data are to be used solely for statistical analysis and reporting of aggregated information and not for investigation or identification of specific individuals or organizations. Publications Substance Abuse and Mental Health Services Administration, Office of Applied Studies. Treatment Episode Data Set (TEDS): 2007. Discharges from Substance Abuse Treatment Services. DASIS Series: S-51. DHHS Publication No. (SMA) 10-4479. Rockville MD, 2010.
The Center for Behavioral Health Statistics and Quality has other published TEDS reports on the SAMHSA Web site.
- 27301 -
- 6 -

Treatment Episode Data Set -- Discharges (TEDS-D), 2007
Variable Description and Frequencies
Note: Frequencies displayed for the variables are not weighted.They are purely descriptive andmay not be representative of thestudy population. Please review any sampling or weightinginformation available with the study.
Summary statistics (minimum, maximum, mean, median, andstandard deviation) may not be available for every variable inthe codebook. Conversely, a listing of frequencies in table formatmay not be present for every variable in the codebook either.However, all variables in the dataset are present and displaysufficient information about each variable. These decisions aremade intentionally and are at the discretion of the archiveproducing this codebook.
- 27301 -
- 7 -
Treatment Episode Data Set -- Discharges (TEDS-D), 2007
Variable Groups
Variable Groups Containing Variables
PageVariable Group LabelVariable Group Name
8IDENTIFICATIONIDENTIFICATION
8CLIENT CHARACTERISTICSCLIENTCHARACTERISTICS
9GEOGRAPHICGEOGRAPHIC
9TREATMENT SERVICE CHARACTERISTICSTREATMENTSERVICECHARACTERISTICS
9REFERRAL SOURCESREFERRALSOURCES
9PRIOR SUBSTANCE ABUSE TREATMENTPRIOR SUBSTANCEABUSETREATMENT
9SUBSTANCES OF ABUSE: ORIGINAL VARIABLESSUBSTANCES OFABUSE: ORIGINALVARIABLES
10SUBSTANCES OF ABUSE: CREATED VARIABLESSUBSTANCES OFABUSE: CREATEDVARIABLES
10MENTAL HEALTHMENTAL HEALTH
10INSURANCE/PAYMENTINSURANCE/PAYMENT
IDENTIFICATIONIDENTIFICATION
Variables within this Variable Group
PageVariable LabelVariable
11CASE IDENTIFICATION NUMBERCASEID
11YEAR OF DISCHARGEDISYR
CLIENT CHARACTERISTICSCLIENT CHARACTERISTICS
Variables within this Variable Group
PageVariable LabelVariable
11AGE (RECODED)AGE
12SEXGENDER
12RACERACE
13ETHNICITY (HISPANIC ORIGIN)ETHNIC
14MARITAL STATUSMARSTAT
15EDUCATIONEDUC
15EMPLOYMENT STATUSEMPLOY
16DETAILED 'NOT IN LABOR FORCE' CATEGORYDETNLF
16PREGNANT AT TIME OF ADMISSIONPREG
17VETERAN STATUSVET
17LIVING ARRANGEMENTSLIVARAG
- 27301 -
- 8 -
Variables within this Variable Group
PageVariable LabelVariable
18SOURCE OF INCOME/SUPPORTPRIMINC
GEOGRAPHICGEOGRAPHIC
Variables within this Variable Group
PageVariable LabelVariable
18CENSUS STATE FIPS CODESTFIPS
19FIPS 2000 CBSA CODECBSA
27FIPS 1990 MSA CODEPMSA
34CENSUS REGIONREGION
34CENSUS DIVISIONDIVISION
TREATMENT SERVICE CHARACTERISTICSTREATMENT SERVICECHARACTERISTICS
Variables within this Variable Group
PageVariable LabelVariable
36SERVICE SETTING AT DISCHARGESERVSETD
37MEDICATION-ASSISTED OPIOID THERAPYMETHUSE
37DAYS WAITING TO ENTER TREATMENTDAYWAIT
38REASON FOR DISCHARGEREASON
39LENGTH OF STAYLOS
REFERRAL SOURCESREFERRAL SOURCES
Variables within this Variable Group
PageVariable LabelVariable
40PRINCIPAL SOURCE OF REFERRALPSOURCE
42DETAILED CRIMINAL JUSTICE REFERRALDETCRIM
PRIOR SUBSTANCE ABUSE TREATMENTPRIOR SUBSTANCE ABUSETREATMENT
Variables within this Variable Group
PageVariable LabelVariable
42NUMBER OF PRIOR TREATMENT EPISODESNOPRIOR
SUBSTANCES OF ABUSE: ORIGINAL VARIABLESSUBSTANCES OF ABUSE:ORIGINAL VARIABLES
Variables within this Variable Group
PageVariable LabelVariable
43SUBSTANCE PROBLEM CODE (PRIMARY)SUB1
45USUAL ROUTE OF ADMINISTRATION (PRIMARY)ROUTE1
45FREQUENCY OF USE (PRIMARY)FREQ1
46AGE AT FIRST USE (PRIMARY)FRSTUSE1
46SUBSTANCE PROBLEM CODE (SECONDARY)SUB2
48USUAL ROUTE OF ADMINISTRATION (SECONDARY)ROUTE2
- 27301 -
- 9 -
Variables within this Variable Group
PageVariable LabelVariable
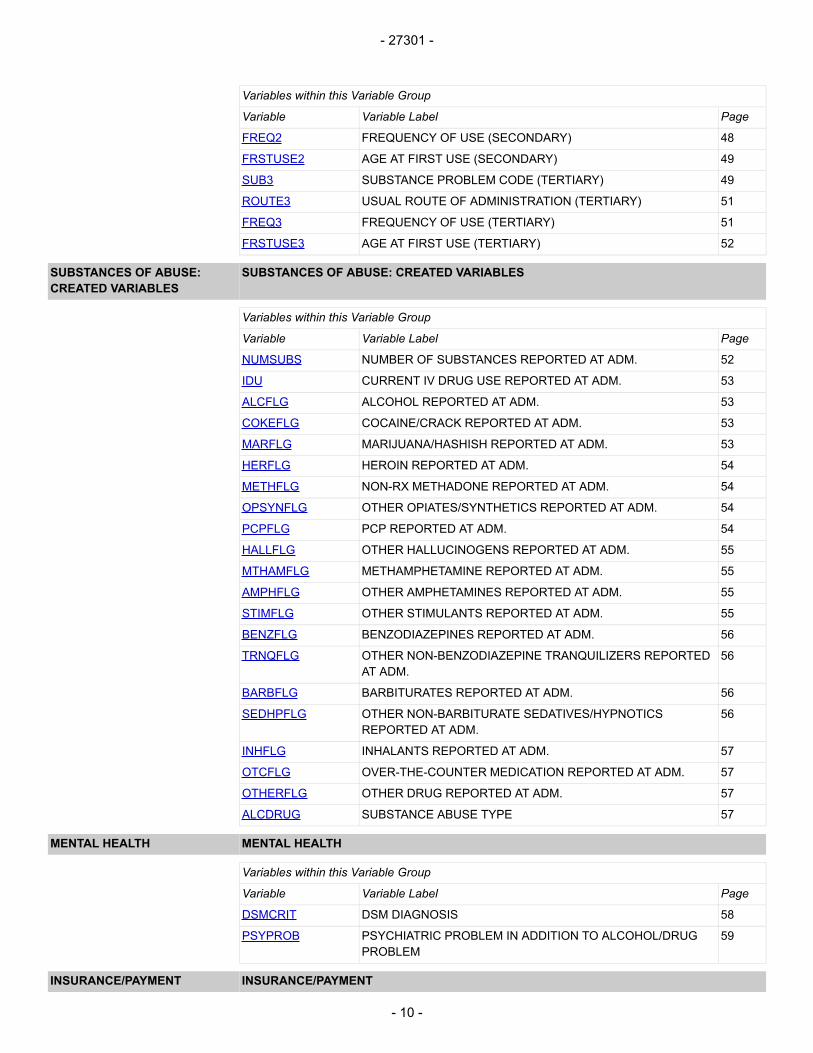
48FREQUENCY OF USE (SECONDARY)FREQ2
49AGE AT FIRST USE (SECONDARY)FRSTUSE2
49SUBSTANCE PROBLEM CODE (TERTIARY)SUB3
51USUAL ROUTE OF ADMINISTRATION (TERTIARY)ROUTE3
51FREQUENCY OF USE (TERTIARY)FREQ3
52AGE AT FIRST USE (TERTIARY)FRSTUSE3
SUBSTANCES OF ABUSE: CREATED VARIABLESSUBSTANCES OF ABUSE:CREATED VARIABLES
Variables within this Variable Group
PageVariable LabelVariable
52NUMBER OF SUBSTANCES REPORTED AT ADM.NUMSUBS
53CURRENT IV DRUG USE REPORTED AT ADM.IDU
53ALCOHOL REPORTED AT ADM.ALCFLG
53COCAINE/CRACK REPORTED AT ADM.COKEFLG
53MARIJUANA/HASHISH REPORTED AT ADM.MARFLG
54HEROIN REPORTED AT ADM.HERFLG
54NON-RX METHADONE REPORTED AT ADM.METHFLG
54OTHER OPIATES/SYNTHETICS REPORTED AT ADM.OPSYNFLG
54PCP REPORTED AT ADM.PCPFLG
55OTHER HALLUCINOGENS REPORTED AT ADM.HALLFLG
55METHAMPHETAMINE REPORTED AT ADM.MTHAMFLG
55OTHER AMPHETAMINES REPORTED AT ADM.AMPHFLG
55OTHER STIMULANTS REPORTED AT ADM.STIMFLG
56BENZODIAZEPINES REPORTED AT ADM.BENZFLG
56OTHER NON-BENZODIAZEPINE TRANQUILIZERS REPORTEDAT ADM.
TRNQFLG
56BARBITURATES REPORTED AT ADM.BARBFLG
56OTHER NON-BARBITURATE SEDATIVES/HYPNOTICSREPORTED AT ADM.
SEDHPFLG
57INHALANTS REPORTED AT ADM.INHFLG
57OVER-THE-COUNTER MEDICATION REPORTED AT ADM.OTCFLG
57OTHER DRUG REPORTED AT ADM.OTHERFLG
57SUBSTANCE ABUSE TYPEALCDRUG
MENTAL HEALTHMENTAL HEALTH
Variables within this Variable Group
PageVariable LabelVariable
58DSM DIAGNOSISDSMCRIT
59PSYCHIATRIC PROBLEM IN ADDITION TO ALCOHOL/DRUGPROBLEM
PSYPROB
INSURANCE/PAYMENTINSURANCE/PAYMENT
- 27301 -
- 10 -
Variables within this Variable Group
PageVariable LabelVariable
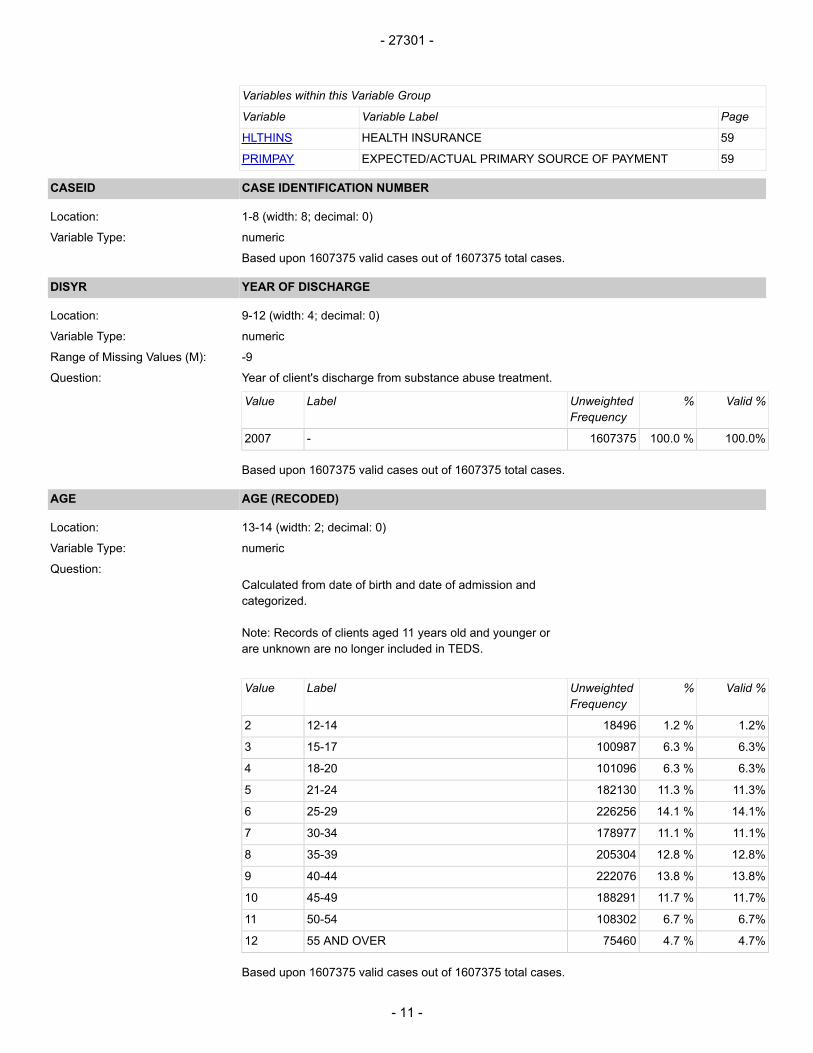
59HEALTH INSURANCEHLTHINS
59EXPECTED/ACTUAL PRIMARY SOURCE OF PAYMENTPRIMPAY
CASE IDENTIFICATION NUMBERCASEID
1-8 (width: 8; decimal: 0)Location:
numericVariable Type:
Based upon 1607375 valid cases out of 1607375 total cases.
YEAR OF DISCHARGEDISYR
9-12 (width: 4; decimal: 0)Location:
numericVariable Type:
-9Range of Missing Values (M):
Year of client's discharge from substance abuse treatment.Question:
Valid %%UnweightedFrequency
LabelValue
100.0%100.0 %1607375-2007
Based upon 1607375 valid cases out of 1607375 total cases.
AGE (RECODED)AGE
13-14 (width: 2; decimal: 0)Location:
numericVariable Type:
Calculated from date of birth and date of admission andQuestion:
categorized.
Note: Records of clients aged 11 years old and younger orare unknown are no longer included in TEDS.
Valid %%UnweightedFrequency
LabelValue
1.2%1.2 %1849612-142
6.3%6.3 %10098715-173
6.3%6.3 %10109618-204
11.3%11.3 %18213021-245
14.1%14.1 %22625625-296
11.1%11.1 %17897730-347
12.8%12.8 %20530435-398
13.8%13.8 %22207640-449
11.7%11.7 %18829145-4910
6.7%6.7 %10830250-5411
4.7%4.7 %7546055 AND OVER12
Based upon 1607375 valid cases out of 1607375 total cases.
- 27301 -
- 11 -

SEXGENDER
15-16 (width: 2; decimal: 0)Location:
numericVariable Type:
-9Range of Missing Values (M):
Identifies client's gender.Question:
Valid %%UnweightedFrequency
LabelValue
67.8%67.7 %1088920MALE1
32.2%32.2 %518121FEMALE2
-0.0 %334MISSING/UNKNOWN/NOTCOLLECTED/INVALID-9 (M)
Based upon 1607041 valid cases out of 1607375 total cases.
RACERACE
17-18 (width: 2; decimal: 0)Location:
numericVariable Type:
-9Range of Missing Values (M):
Specifies the client's race:Question:
- ALASKA NATIVE (ALEUT, ESKIMO, INDIAN): Origins in any ofthe original people of Alaska.
- AMERICAN INDIAN (OTHER THAN ALASKA NATIVE): Origins inany of the original people of North America and SouthAmerica (including Central America) and who maintaincultural identification through tribal affiliation orcommunity attachment.
- ASIAN OR PACIFIC ISLANDER: Origins in any of the originalpeople of the Far East, the Indian subcontinent, SoutheastAsia, or the Pacific Islands.
- BLACK OR AFRICAN AMERICAN: Origins in any of the blackracial groups of Africa.
- WHITE: Origins in any of the original people of Europe,North Africa, or the Middle East.
- ASIAN: Origins in any of the original people of the FarEast, the Indian subcontinent, or Southeast Asia, includingfor example, Cambodia, China, India, Japan, Korea, Malaysia,Philippine Islands, Thailand, and Vietnam.
- OTHER SINGLE RACE: Use this category for instancesin which the client is not classified in any categoryabove or whose origin group, because of area custom,is regarded as a racial class distinct from the abovecategories. (Do not use this category for clientsindicating multiple races.)
- TWO OR MORE RACES: Use this code when the State data system
- 27301 -
- 12 -
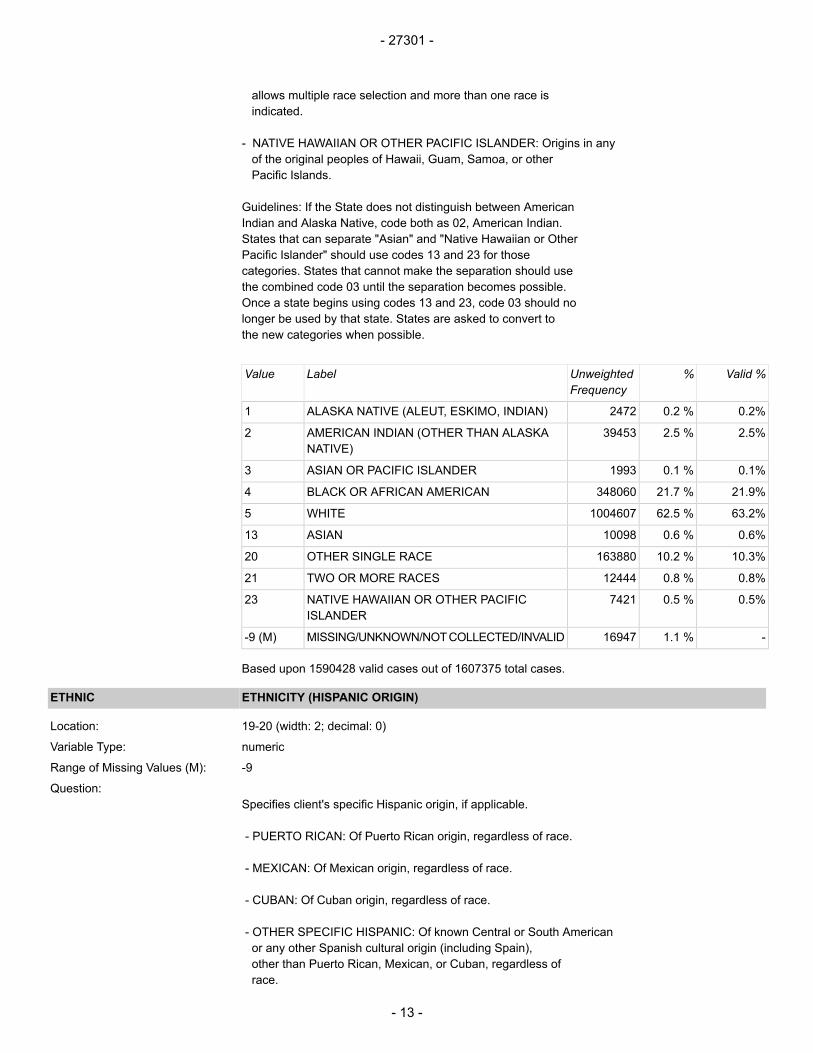
allows multiple race selection and more than one race isindicated.
- NATIVE HAWAIIAN OR OTHER PACIFIC ISLANDER: Origins in anyof the original peoples of Hawaii, Guam, Samoa, or otherPacific Islands.
Guidelines: If the State does not distinguish between AmericanIndian and Alaska Native, code both as 02, American Indian.States that can separate "Asian" and "Native Hawaiian or OtherPacific Islander" should use codes 13 and 23 for thosecategories. States that cannot make the separation should usethe combined code 03 until the separation becomes possible.Once a state begins using codes 13 and 23, code 03 should nolonger be used by that state. States are asked to convert tothe new categories when possible.
Valid %%UnweightedFrequency
LabelValue
0.2%0.2 %2472ALASKA NATIVE (ALEUT, ESKIMO, INDIAN)1
2.5%2.5 %39453AMERICAN INDIAN (OTHER THAN ALASKANATIVE)
2
0.1%0.1 %1993ASIAN OR PACIFIC ISLANDER3
21.9%21.7 %348060BLACK OR AFRICAN AMERICAN4
63.2%62.5 %1004607WHITE5
0.6%0.6 %10098ASIAN13
10.3%10.2 %163880OTHER SINGLE RACE20
0.8%0.8 %12444TWO OR MORE RACES21
0.5%0.5 %7421NATIVE HAWAIIAN OR OTHER PACIFICISLANDER
23
-1.1 %16947MISSING/UNKNOWN/NOTCOLLECTED/INVALID-9 (M)
Based upon 1590428 valid cases out of 1607375 total cases.
ETHNICITY (HISPANIC ORIGIN)ETHNIC
19-20 (width: 2; decimal: 0)Location:
numericVariable Type:
-9Range of Missing Values (M):
Specifies client's specific Hispanic origin, if applicable.Question:
- PUERTO RICAN: Of Puerto Rican origin, regardless of race.
- MEXICAN: Of Mexican origin, regardless of race.
- CUBAN: Of Cuban origin, regardless of race.
- OTHER SPECIFIC HISPANIC: Of known Central or South Americanor any other Spanish cultural origin (including Spain),other than Puerto Rican, Mexican, or Cuban, regardless ofrace.
- 27301 -
- 13 -

- NOT OF HISPANIC ORIGIN:
- HISPANIC, SPECIFIC ORIGIN NOT SPECIFIED: Of Hispanic origin,but specific origin not known or not specified.
Guidelines: If a state does not collect specific Hispanicdetail, code ethnicity for Hispanics as 06, "Hispanic,specific origin not specified."
Valid %%UnweightedFrequency
LabelValue
4.0%3.9 %62998PUERTO RICAN1
6.4%6.4 %102178MEXICAN2
0.2%0.2 %3762CUBAN3
2.7%2.7 %43213OTHER SPECIFIC HISPANIC4
85.4%84.5 %1358366NOT OF HISPANIC ORIGIN5
1.3%1.3 %20950HISPANIC, SPECIFIC ORIGIN NOT SPECIFIED6
-1.0 %15908MISSING/UNKNOWN/NOTCOLLECTED/INVALID-9 (M)
Based upon 1591467 valid cases out of 1607375 total cases.
MARITAL STATUSMARSTAT
21-22 (width: 2; decimal: 0)Location:
numericVariable Type:
-9Range of Missing Values (M):
Describes the client's marital status. The followingQuestion:
categories are compatible with the U.S. Census.
- NEVER MARRIED: Includes clients whose only marriage wasannulled.
- NOW MARRIED: Includes those living together as married.
- SEPARATED: Includes those separated legally or otherwiseabsent from spouse because of marital discord.
- DIVORCED, WIDOWED
Valid %%UnweightedFrequency
LabelValue
59.9%44.8 %719542NEVER MARRIED1
16.2%12.1 %194776NOW MARRIED2
5.9%4.4 %71297SEPARATED3
18.0%13.5 %216292DIVORCED, WIDOWED4
-25.2 %405468MISSING/UNKNOWN/NOTCOLLECTED/INVALID-9 (M)
Based upon 1201907 valid cases out of 1607375 total cases.
- 27301 -
- 14 -

EDUCATIONEDUC
23-24 (width: 2; decimal: 0)Location:
numericVariable Type:
-9Range of Missing Values (M):
Specifies the highest school grade (number of school years)Question:
completed by the client.
Guidelines: States that use specific categories for designatingeducation level should map their categories to a logical "numberof years of school completed." The mapping should be recorded inthe State Crosswalk. For example, a state category of "AssociateDegree" should be mapped to 14; "Bachelor Degree" would be mappedto 16, etc.
Valid %%UnweightedFrequency
LabelValue
8.6%8.5 %1362038 YEARS OR LESS1
28.8%28.3 %4541249-112
40.8%40.0 %643510123
17.0%16.7 %26891613-154
4.8%4.7 %7515116 OR MORE5
-1.8 %29471MISSING/UNKNOWN/NOTCOLLECTED/INVALID-9 (M)
Based upon 1577904 valid cases out of 1607375 total cases.
EMPLOYMENT STATUSEMPLOY
25-26 (width: 2; decimal: 0)Location:
numericVariable Type:
-9Range of Missing Values (M):
Designates the client's employment status at the time ofQuestion:
admission or transfer:
- FULL TIME: Working 35 hours or more each week; includingactive duty members of the uniformed services.
- PART TIME: Working fewer than 35 hours each week.
- UNEMPLOYED: Looking for work during the past 30 days oron layoff from a job.
- NOT IN LABOR FORCE: Not looking for work during the past30 days or a student, homemaker, disabled, retired, oran inmate of an institution. Clients in this categoryare further defined in the Supplemental Data Set item"Detailed Not in Labor Force" (DETNLF).
Guidelines: Seasonal workers are coded in this category basedon their employment status at time of admission. For example,if they are employed full time at the time of admission, they
- 27301 -
- 15 -

are coded as 01. If they are not in labor force at time ofadmission, they are coded 04.
Valid %%UnweightedFrequency
LabelValue
20.0%19.6 %314969FULL TIME1
7.2%7.1 %114113PART TIME2
31.4%30.7 %494175UNEMPLOYED3
41.4%40.6 %652206NOT IN LABOR FORCE4
-2.0 %31912MISSING/UNKNOWN/NOTCOLLECTED/INVALID-9 (M)
Based upon 1575463 valid cases out of 1607375 total cases.
DETAILED 'NOT IN LABOR FORCE' CATEGORYDETNLF
27-28 (width: 2; decimal: 0)Location:
numericVariable Type:
-9Range of Missing Values (M):
This field gives more detailed information about those clients who are coded as "not in the laborforce" in the Minimum Data Set field for "Employment Status" (EMPLOY).
Question:
Valid %%UnweightedFrequency
LabelValue
2.7%0.9 %13730HOMEMAKER1
15.1%4.8 %76766STUDENT2
17.9%5.7 %91015RETIRED, DISABLED3
5.7%1.8 %29005INMATE OF INSTITUTION5
58.6%18.5 %297868OTHER6
-68.4 %1098991MISSING/UNKNOWN/NOTCOLLECTED/INVALID-9 (M)
Based upon 508384 valid cases out of 1607375 total cases.
PREGNANT AT TIME OF ADMISSIONPREG
29-30 (width: 2; decimal: 0)Location:
numericVariable Type:
-9Range of Missing Values (M):
Specifies whether the client was pregnant at the time ofQuestion:
admission.
Guidelines: All male respondents were recoded to missingfor this variable due to the item being not applicable.
Valid %%UnweightedFrequency
LabelValue
4.2%1.3 %20779YES1
95.8%29.2 %468749NO2
-69.5 %1117847MISSING/UNKNOWN/NOTCOLLECTED/INVALID-9 (M)
- 27301 -
- 16 -
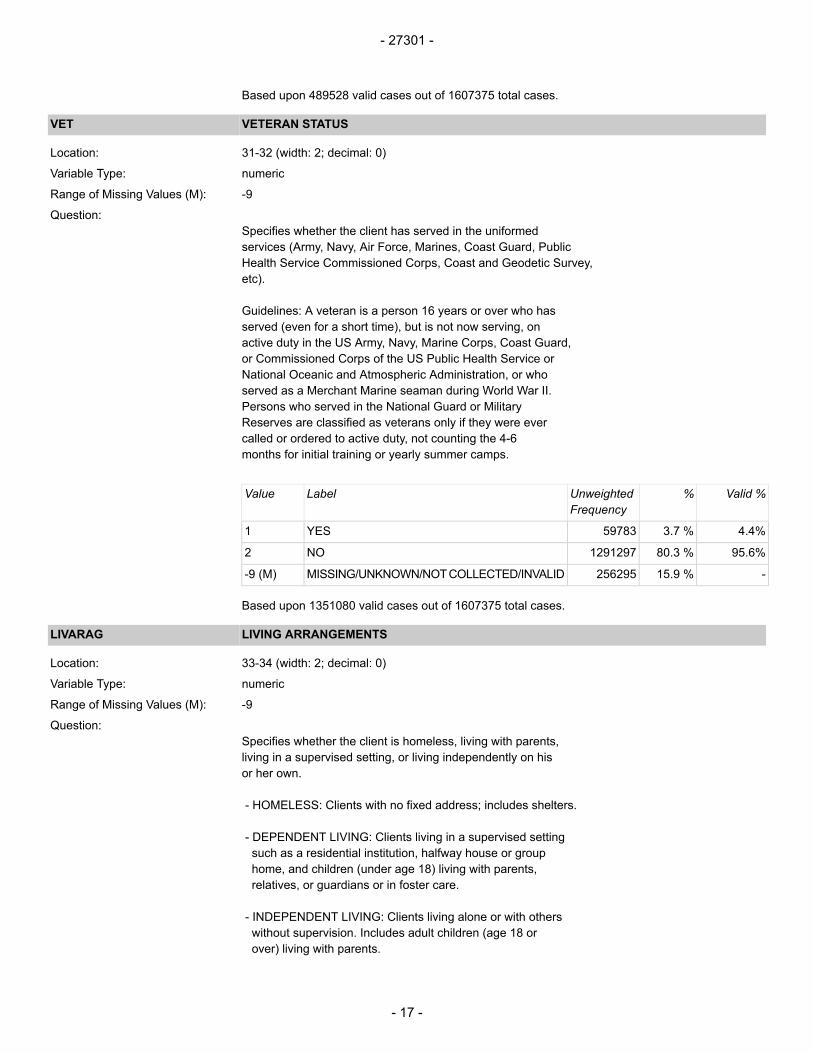
Based upon 489528 valid cases out of 1607375 total cases.
VETERAN STATUSVET
31-32 (width: 2; decimal: 0)Location:
numericVariable Type:
-9Range of Missing Values (M):
Specifies whether the client has served in the uniformedQuestion:
services (Army, Navy, Air Force, Marines, Coast Guard, PublicHealth Service Commissioned Corps, Coast and Geodetic Survey,etc).
Guidelines: A veteran is a person 16 years or over who hasserved (even for a short time), but is not now serving, onactive duty in the US Army, Navy, Marine Corps, Coast Guard,or Commissioned Corps of the US Public Health Service orNational Oceanic and Atmospheric Administration, or whoserved as a Merchant Marine seaman during World War II.Persons who served in the National Guard or MilitaryReserves are classified as veterans only if they were evercalled or ordered to active duty, not counting the 4-6months for initial training or yearly summer camps.
Valid %%UnweightedFrequency
LabelValue
4.4%3.7 %59783YES1
95.6%80.3 %1291297NO2
-15.9 %256295MISSING/UNKNOWN/NOTCOLLECTED/INVALID-9 (M)
Based upon 1351080 valid cases out of 1607375 total cases.
LIVING ARRANGEMENTSLIVARAG
33-34 (width: 2; decimal: 0)Location:
numericVariable Type:
-9Range of Missing Values (M):
Specifies whether the client is homeless, living with parents,Question:
living in a supervised setting, or living independently on hisor her own.
- HOMELESS: Clients with no fixed address; includes shelters.
- DEPENDENT LIVING: Clients living in a supervised settingsuch as a residential institution, halfway house or grouphome, and children (under age 18) living with parents,relatives, or guardians or in foster care.
- INDEPENDENT LIVING: Clients living alone or with otherswithout supervision. Includes adult children (age 18 orover) living with parents.
- 27301 -
- 17 -

Valid %%UnweightedFrequency
LabelValue
14.5%14.1 %226977HOMELESS1
23.0%22.3 %358620DEPENDENT LIVING2
62.5%60.8 %976597INDEPENDENT LIVING3
-2.8 %45181MISSING/UNKNOWN/NOTCOLLECTED/INVALID-9 (M)
Based upon 1562194 valid cases out of 1607375 total cases.
SOURCE OF INCOME/SUPPORTPRIMINC
35-36 (width: 2; decimal: 0)Location:
numericVariable Type:
-9Range of Missing Values (M):
Identifies the client's principal source of financial support. For children under 18, this field indicatesthe parent's primary source of income/support.
Question:
Valid %%UnweightedFrequency
LabelValue
32.6%19.4 %311961WAGES/SALARY1
7.4%4.4 %70585PUBLIC ASSISTANCE2
5.1%3.0 %48446RETIREMENT/PENSION, DISABILITY3
22.0%13.1 %210807OTHER20
33.0%19.7 %316204NONE21
-40.4 %649372MISSING/UNKNOWN/NOTCOLLECTED/INVALID-9 (M)
Based upon 958003 valid cases out of 1607375 total cases.
CENSUS STATE FIPS CODESTFIPS
37-38 (width: 2; decimal: 0)Location:
numericVariable Type:
-9Range of Missing Values (M):
State FIPS codes consistent with those used by the U.S. Bureau of the Census.Question:
Valid %%UnweightedFrequency
LabelValue
0.1%0.1 %2212ALASKA2
1.1%1.1 %18204ARIZONA4
1.0%1.0 %15543ARKANSAS5
12.5%12.5 %200662CALIFORNIA6
3.4%3.4 %55255COLORADO8
2.1%2.1 %34268CONNECTICUT9
0.5%0.5 %7319DELAWARE10
2.2%2.2 %36071FLORIDA12
0.5%0.5 %7812HAWAII15
0.2%0.2 %3466IDAHO16
4.8%4.8 %77474ILLINOIS17
1.1%1.1 %17213INDIANA18
- 27301 -
- 18 -
Valid %%UnweightedFrequency
LabelValue
1.5%1.5 %23676IOWA19
0.8%0.8 %12298KANSAS20
0.6%0.6 %10062KENTUCKY21
1.4%1.4 %23181LOUISIANA22
0.8%0.8 %12604MAINE23
4.0%4.0 %64598MARYLAND24
4.6%4.6 %74331MASSACHUSETTS25
3.8%3.8 %61179MICHIGAN26
2.8%2.8 %44243MINNESOTA27
2.3%2.3 %37389MISSOURI29
0.5%0.5 %8724MONTANA30
0.6%0.6 %10400NEBRASKA31
0.6%0.6 %9552NEVADA32
0.3%0.3 %5609NEW HAMPSHIRE33
3.3%3.3 %53413NEW JERSEY34
17.8%17.8 %285619NEW YORK36
1.2%1.2 %18554NORTH CAROLINA37
0.1%0.1 %1716NORTH DAKOTA38
4.5%4.5 %72746OHIO39
1.0%1.0 %16604OKLAHOMA40
2.9%2.9 %47046OREGON41
0.6%0.6 %9717RHODE ISLAND44
1.8%1.8 %29138SOUTH CAROLINA45
1.0%1.0 %16505SOUTH DAKOTA46
0.8%0.8 %13484TENNESSEE47
2.8%2.8 %44917TEXAS48
0.9%0.9 %15137UTAH49
0.3%0.3 %4702VERMONT50
1.1%1.1 %17982VIRGINIA51
3.8%3.8 %61487WASHINGTON53
1.2%1.2 %19507WISCONSIN55
0.2%0.2 %3200WYOMING56
0.2%0.2 %2556PUERTO RICO72
Based upon 1607375 valid cases out of 1607375 total cases.
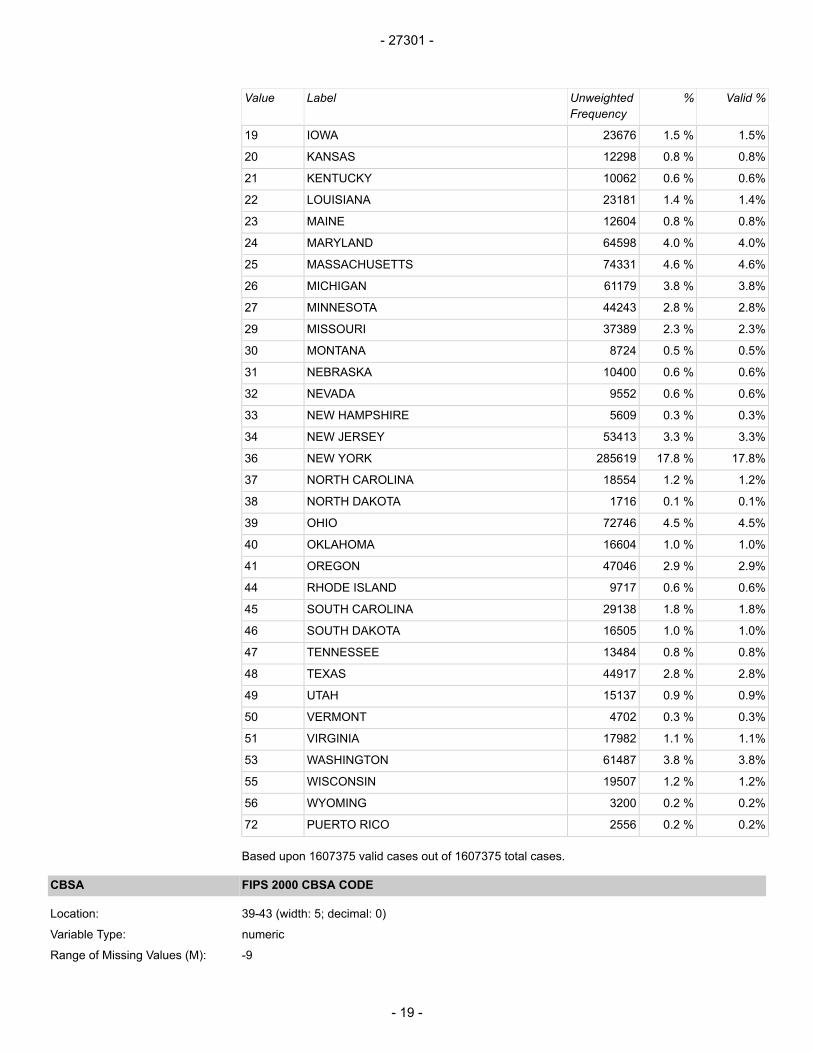
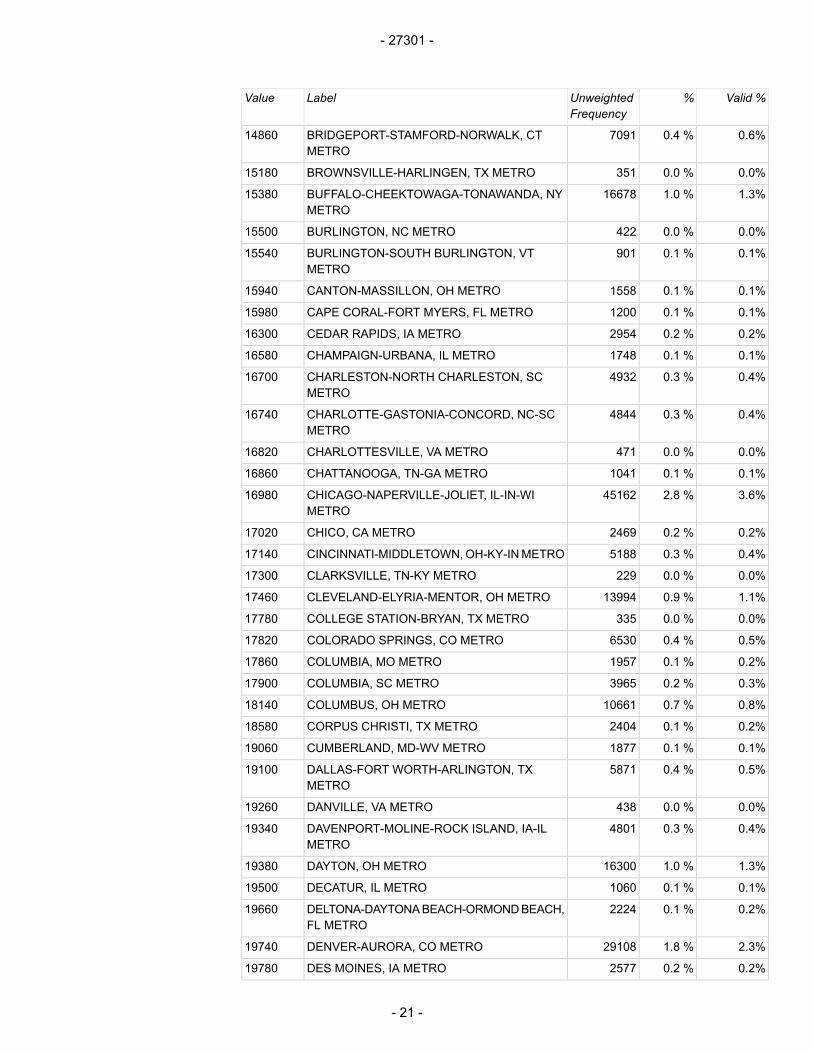
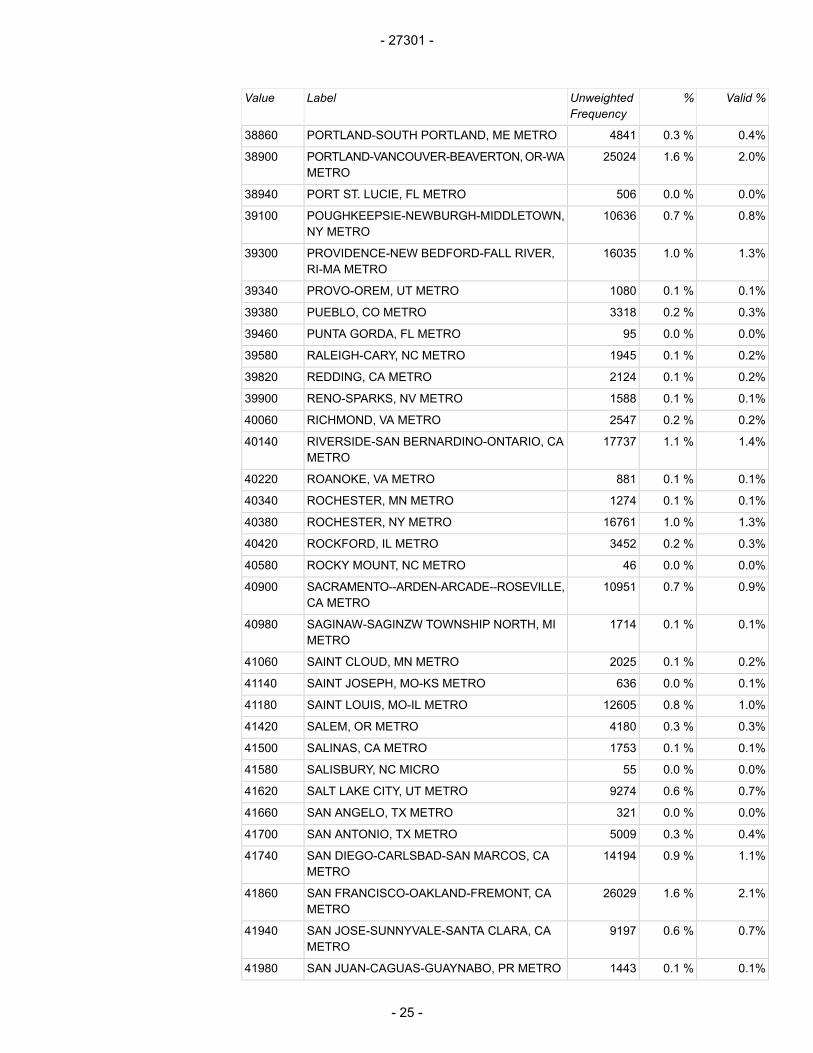
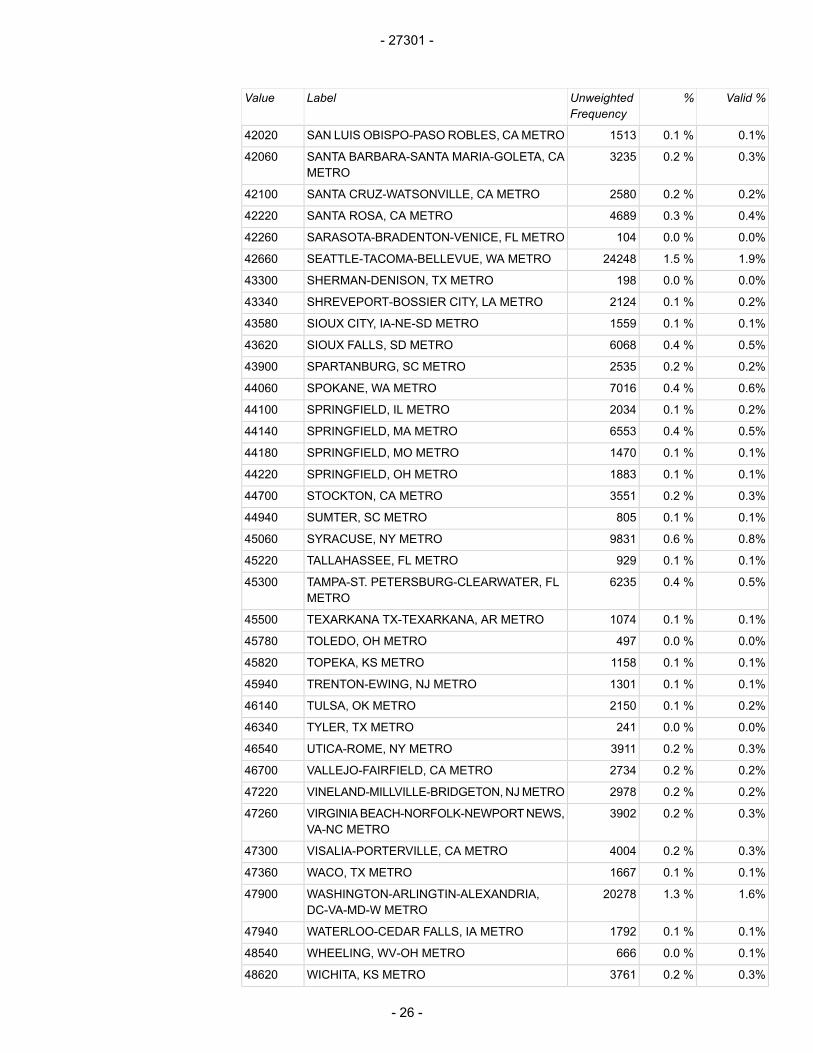
FIPS 2000 CBSA CODECBSA
39-43 (width: 5; decimal: 0)Location:
numericVariable Type:
-9Range of Missing Values (M):
- 27301 -
- 19 -

The term "Core Based Statistical Area" (CBSA) is a collective term for both metro and micro areas.Metropolitan andmicropolitan statistical areas (metro andmicro areas) are geographic entities defined
Question:
by the U.S. Office of Management and Budget (OMB) for use by Federal statistical agencies incollecting, tabulating, and publishing Federal statistics. A metro area contains a core urban area of50,000 or more population, and a micro area contains an urban core of at least 10,000 (but less than50,000) population. Each metro or micro area consists of one or more counties and includes thecounties containing the core urban area, as well as any adjacent counties that have a high degreeof social and economic integration (as measured by commuting to work) with the urban core.
Valid %%UnweightedFrequency
LabelValue
0.1%0.1 %1371ABILENE, TX METRO10180
0.0%0.0 %53AGUADILLA-ISABELA-SAN SEBASTIAN, PRMETRO
10380
0.5%0.4 %5931AKRON, OH METRO10420
1.4%1.1 %17478ALBANY-SCHENECTADY-TROY, NY METRO10580
0.2%0.1 %2344ALEXANDRIA, LA METRO10780
0.0%0.0 %430ALLEGAN, MI MICRO10880
0.1%0.0 %692ALLENTOWN-BETHLEHEM-EASTON, PA-NJMETRO
10900
0.0%0.0 %401AMARILLO, TX METRO11100
0.0%0.0 %497ANCHORAGE, AK METRO11260
0.1%0.0 %636ANDERSON, IN METRO11300
0.1%0.1 %1324ANDERSON, SC METRO11340
0.1%0.1 %1226ANN ARBOR, MI METRO11460
0.1%0.1 %1208ASHEVILLE, NC METRO11700
0.1%0.1 %978ASHTABULA, OH MICRO11780
0.2%0.2 %2861ATLANTIC CITY, NJ METRO12100
0.1%0.0 %743AUGUSTA-RICHMOND COUNTY, GA-SCMETRO
12260
0.2%0.2 %2561AUSTIN-ROUND ROCK, TX METRO12420
0.2%0.2 %2989BAKERSFIELD, CA METRO12540
2.8%2.2 %34964BALTIMORE-TOWSON, MD METRO12580
0.4%0.3 %5510BARNSTABLE TOWN, MA METRO12700
0.4%0.3 %5065BATON ROUGE, LA METRO12940
0.1%0.1 %945BATTLE CREEK, MI METRO12980
0.0%0.0 %374BAY CITY, MI METRO13020
0.2%0.1 %1952BEAUMONT-PORT ARTHUR, TX METRO13140
0.2%0.2 %2518BELLINGHAM, WA METRO13380
0.2%0.1 %1986BILLINGS, MT METRO13740
0.2%0.2 %3057BINGHAMTON, NY METRO13780
0.1%0.1 %812BLOOMINGTON-NORMAL, IL METRO14060
0.1%0.0 %684BOISE CITY-NAMPA, ID METRO14260
3.4%2.6 %42550BOSTON-CAMBRIDGE-QUNICY,MA-NHMETRO14460
0.1%0.1 %1599BOULDER, CO METRO14500
0.2%0.1 %2181BREMERTON-SILVERDALE, WA METRO14740
- 27301 -
- 20 -
Valid %%UnweightedFrequency
LabelValue
0.6%0.4 %7091BRIDGEPORT-STAMFORD-NORWALK, CTMETRO
14860
0.0%0.0 %351BROWNSVILLE-HARLINGEN, TX METRO15180
1.3%1.0 %16678BUFFALO-CHEEKTOWAGA-TONAWANDA, NYMETRO
15380
0.0%0.0 %422BURLINGTON, NC METRO15500
0.1%0.1 %901BURLINGTON-SOUTH BURLINGTON, VTMETRO
15540
0.1%0.1 %1558CANTON-MASSILLON, OH METRO15940
0.1%0.1 %1200CAPE CORAL-FORT MYERS, FL METRO15980
0.2%0.2 %2954CEDAR RAPIDS, IA METRO16300
0.1%0.1 %1748CHAMPAIGN-URBANA, IL METRO16580
0.4%0.3 %4932CHARLESTON-NORTH CHARLESTON, SCMETRO
16700
0.4%0.3 %4844CHARLOTTE-GASTONIA-CONCORD, NC-SCMETRO
16740
0.0%0.0 %471CHARLOTTESVILLE, VA METRO16820
0.1%0.1 %1041CHATTANOOGA, TN-GA METRO16860
3.6%2.8 %45162CHICAGO-NAPERVILLE-JOLIET, IL-IN-WIMETRO
16980
0.2%0.2 %2469CHICO, CA METRO17020
0.4%0.3 %5188CINCINNATI-MIDDLETOWN,OH-KY-INMETRO17140
0.0%0.0 %229CLARKSVILLE, TN-KY METRO17300
1.1%0.9 %13994CLEVELAND-ELYRIA-MENTOR, OH METRO17460
0.0%0.0 %335COLLEGE STATION-BRYAN, TX METRO17780
0.5%0.4 %6530COLORADO SPRINGS, CO METRO17820
0.2%0.1 %1957COLUMBIA, MO METRO17860
0.3%0.2 %3965COLUMBIA, SC METRO17900
0.8%0.7 %10661COLUMBUS, OH METRO18140
0.2%0.1 %2404CORPUS CHRISTI, TX METRO18580
0.1%0.1 %1877CUMBERLAND, MD-WV METRO19060
0.5%0.4 %5871DALLAS-FORT WORTH-ARLINGTON, TXMETRO
19100
0.0%0.0 %438DANVILLE, VA METRO19260
0.4%0.3 %4801DAVENPORT-MOLINE-ROCK ISLAND, IA-ILMETRO
19340
1.3%1.0 %16300DAYTON, OH METRO19380
0.1%0.1 %1060DECATUR, IL METRO19500
0.2%0.1 %2224DELTONA-DAYTONABEACH-ORMONDBEACH,FL METRO
19660
2.3%1.8 %29108DENVER-AURORA, CO METRO19740
0.2%0.2 %2577DES MOINES, IA METRO19780
- 27301 -
- 21 -

Valid %%UnweightedFrequency
LabelValue
2.1%1.6 %26229DETROIT-WARREN-LIVONIA, MI METRO19820
0.1%0.1 %931DOVER, DE METRO20100
0.1%0.1 %1837DULUTH, MN-WI METRO20260
0.1%0.1 %1289DURHAM, NC METRO20500
0.1%0.0 %658EAST LIVERPOOL-SALEM, OH MICRO20620
0.1%0.1 %1766EL PASO, TX METRO21340
0.4%0.3 %5070EUGENE-SPRINGFIELD, OR METRO21660
0.0%0.0 %12EVANSVILLE, IN-KY METRO21780
0.0%0.0 %599FARGO, ND-MN METRO22020
0.1%0.0 %740FAYETTEVILLE, NC METRO22180
0.1%0.1 %1456FAYETTEVILLE-SPRINGDALE-ROGERS,AR-MOMETRO
22220
0.2%0.2 %3124FLINT, MI METRO22420
0.0%0.0 %485FLORENCE, SC METRO22500
0.2%0.1 %2006FORT COLLINS-LOVELAND, CO METRO22660
0.1%0.1 %1795FORT SMITH, AR-OK METRO22900
0.0%0.0 %101FORT WALTON BEACH-CRESTVIEW-DESTIN,FL METRO
23020
0.6%0.5 %8009FRESNO, CA METRO23420
0.0%0.0 %392GAINESVILLE, FL METRO23540
0.1%0.1 %1376GLENS FALLS, NY METRO24020
0.0%0.0 %112GOLDSBORO, NC METRO24140
0.2%0.2 %2562GRAND JUNCTION, CO METRO24300
0.3%0.3 %4396GRAND RAPIDS-WYOMING, MI METRO24340
0.2%0.2 %2983GREELEY, CO METRO24540
0.1%0.1 %879GREENSBORO-HIGH POINT, NC METRO24660
0.1%0.1 %924GREENVILLE, NC METRO24780
0.3%0.2 %4017GREENVILLE, SC METRO24860
0.1%0.1 %1856HAGERSTOWN-MARTINSBURG, MD-WVMETRO
25180
1.2%0.9 %14707HARTFORD-WEST HARTFORD-EASTHARTFORD, CT METRO
25540
0.1%0.0 %735HICKORY-MORGANTON-LENOIR, NC METRO25860
0.1%0.1 %940HOLLAND-GRAND HAVEN, MI METRO26100
0.4%0.3 %5140HONOLULU, HI METRO26180
0.1%0.1 %1175HOUMA-BAYOUCANE-THIBODAUX, LAMETRO26380
0.8%0.6 %9792HOUSTON-BAYTOWN-SUGAR LAND, TXMETRO
26420
0.0%0.0 %452HUNTINGTON-ASHLAND, WV-KY-OH METRO26580
0.1%0.0 %642INDIANAPOLIS, IN METRO26900
0.2%0.1 %2347IOWA CITY, IA METRO26980
- 27301 -
- 22 -

Valid %%UnweightedFrequency
LabelValue
0.1%0.1 %1393JACKSON, MI METRO27100
0.1%0.1 %1166JACKSON, TN METRO27180
0.2%0.2 %2910JACKSONVILLE, FL METRO27260
0.0%0.0 %572JACKSONVILLE, NC METRO27340
0.1%0.1 %990JAMESTOWN-DUNKIRK-FREDONIA,NYMICRO27460
0.2%0.2 %2474JOHNSON, CITYTN METRO27740
0.1%0.1 %1289JOPLIN, MO METRO27900
0.2%0.1 %2007KALAMAZOO-PORTAGE, MI METRO28020
0.1%0.1 %1310KANKAKEE-BRADLEY, IL METRO28100
0.6%0.5 %7838KANSAS CITY, MO-KS METRO28140
0.2%0.1 %2341KENNEWICK-RICHLAND-PASCO, WA METRO28420
0.0%0.0 %369KILLEEN-TEMPLE-FORT HOOD, TX METRO28660
0.1%0.1 %1658KNOXVILLE, TN METRO28940
0.0%0.0 %49LA CROSSE, WI-MN METRO29100
0.1%0.1 %1602LAFAYETTE, LA METRO29180
0.1%0.1 %1495LAKE CHARLES, LA METRO29340
0.0%0.0 %243LAKELAND-WINTER HAVEN, FL METRO29460
0.2%0.1 %2110LANSING-EAST LANSING, MI METRO29620
0.0%0.0 %519LAREDO, TX METRO29700
0.4%0.3 %5147LAS VEGAS-PARADISE, NV METRO29820
0.1%0.0 %739LAWTON, OK METRO30020
0.1%0.1 %1133LEXINGTON-FAYETTE, KY METRO30460
0.0%0.0 %109LEXINGTON-THOMASVILLE, NC MICRO30540
0.0%0.0 %594LIMA, OH METRO30620
0.3%0.2 %3476LINCOLN, NE METRO30700
0.3%0.2 %3270LITTLE ROCK-NORTH LITTLE ROCK, ARMETRO
30780
0.1%0.0 %680LONGVIEW, TX METRO30980
4.4%3.4 %55024LOS ANGELES-LONG BEACH-SANTA ANA, CAMETRO
31100
0.2%0.2 %2738LOUISVILLE, KY-IN METRO31140
0.2%0.1 %2097LUBBOCK, TX METRO31180
0.0%0.0 %568LYNCHBURG, VA METRO31340
0.1%0.1 %864MADERA, CA METRO31460
0.2%0.1 %2017MANCHESTER-NASHUA, NH METRO31700
0.1%0.0 %796MANSFIELD, OH METRO31900
0.0%0.0 %90MAYAGUEZ, PR METRO32420
0.0%0.0 %496MCALLEN-EDINBURG-PHARR, TX METRO32580
0.2%0.2 %2628MEDFORD, OR METRO32780
0.2%0.2 %2668MEMPHIS, TN-MS-AR METRO32820
0.1%0.0 %791MERCED, CA METRO32900
- 27301 -
- 23 -

Valid %%UnweightedFrequency
LabelValue
0.7%0.5 %8258MIAMI-FORT LAUDERDALE-MIAMI BEACH, FLMETRO
33100
0.0%0.0 %206MIDLAND, TX METRO33260
0.0%0.0 %21MILWAUKEE-WAUKESHA-WEST ALLIS, WIMETRO
33340
2.1%1.6 %25984MINNEAPOLIS-ST. PAUL-BLOOMINGTON,MN-WI METRO
33460
0.3%0.3 %4101MODESTO, CA METRO33700
0.1%0.1 %1869MONROE, LA METRO33740
0.0%0.0 %446MONROE, MI METRO33780
0.1%0.1 %1600MUSKEGON-NORTON SHORES, MI METRO34740
0.1%0.1 %858MYRTLE BEACH-CONWAY-NORTH MYRTLEBEACH, SC METRO
34820
0.0%0.0 %256NAPA, CA METRO34900
0.0%0.0 %464NAPLES-MARCO ISLAND, FL METRO34940
0.2%0.1 %2335NASHVILLE-DAVIDSON--MURFREESBORO,TNMETRO
34980
0.4%0.3 %5185NEW HAVEN-MILFORD, CT METRO35300
0.2%0.2 %2473NEWORLEANS-METAIRIE-KENNER,LAMETRO35380
16.6%13.0 %209340NEW YORK-NEWARK-EDISON, NY-NJ-PAMETRO
35620
0.1%0.1 %1047NILES-BENTON HARBOR, MI METRO35660
0.3%0.2 %3247NORWICH-NEW LONDON, CT METRO35980
0.0%0.0 %152OCALA, FL METRO36100
0.1%0.1 %958OCEAN CITY, NJ METRO36140
0.1%0.0 %695ODESSA, TX METRO36220
0.2%0.1 %2188OGDEN-CLEARFIELD, UT METRO36260
0.5%0.4 %5866OKLAHOMA CITY, OK METRO36420
0.1%0.1 %1833OLYMPIA, WA METRO36500
0.3%0.2 %4005OMAHA-COUNCIL BLUFFS, NE-IA METRO36540
0.2%0.2 %2771ORLANDO, FL METRO36740
0.2%0.2 %3105OXNARD-VENTURA-THOUSAND OAKSVENTURA, CA METRO
37100
0.1%0.0 %654PALM BAY-MELBOURNE-TITUSVILLE, FLMETRO
37340
0.1%0.1 %1023PANAMA CITY-LYNN HAVEN, FL METRO37460
0.0%0.0 %39PARKERSBURG-MARIETTA, WV-OH METRO37620
0.1%0.1 %1710PENSACOLA-FERRYPASS-BRENT, FLMETRO37860
0.2%0.2 %2966PEORIA, IL METRO37900
0.9%0.7 %11564PHILADELPHIA-CAMDEN-WILMINGTON,PA-NJ-DE-M METRO
37980
0.0%0.0 %549PONCE, PR METRO38660
- 27301 -
- 24 -
Valid %%UnweightedFrequency
LabelValue
0.4%0.3 %4841PORTLAND-SOUTH PORTLAND, ME METRO38860
2.0%1.6 %25024PORTLAND-VANCOUVER-BEAVERTON,OR-WAMETRO
38900
0.0%0.0 %506PORT ST. LUCIE, FL METRO38940
0.8%0.7 %10636POUGHKEEPSIE-NEWBURGH-MIDDLETOWN,NY METRO
39100
1.3%1.0 %16035PROVIDENCE-NEW BEDFORD-FALL RIVER,RI-MA METRO
39300
0.1%0.1 %1080PROVO-OREM, UT METRO39340
0.3%0.2 %3318PUEBLO, CO METRO39380
0.0%0.0 %95PUNTA GORDA, FL METRO39460
0.2%0.1 %1945RALEIGH-CARY, NC METRO39580
0.2%0.1 %2124REDDING, CA METRO39820
0.1%0.1 %1588RENO-SPARKS, NV METRO39900
0.2%0.2 %2547RICHMOND, VA METRO40060
1.4%1.1 %17737RIVERSIDE-SAN BERNARDINO-ONTARIO, CAMETRO
40140
0.1%0.1 %881ROANOKE, VA METRO40220
0.1%0.1 %1274ROCHESTER, MN METRO40340
1.3%1.0 %16761ROCHESTER, NY METRO40380
0.3%0.2 %3452ROCKFORD, IL METRO40420
0.0%0.0 %46ROCKY MOUNT, NC METRO40580
0.9%0.7 %10951SACRAMENTO--ARDEN-ARCADE--ROSEVILLE,CA METRO
40900
0.1%0.1 %1714SAGINAW-SAGINZW TOWNSHIP NORTH, MIMETRO
40980
0.2%0.1 %2025SAINT CLOUD, MN METRO41060
0.1%0.0 %636SAINT JOSEPH, MO-KS METRO41140
1.0%0.8 %12605SAINT LOUIS, MO-IL METRO41180
0.3%0.3 %4180SALEM, OR METRO41420
0.1%0.1 %1753SALINAS, CA METRO41500
0.0%0.0 %55SALISBURY, NC MICRO41580
0.7%0.6 %9274SALT LAKE CITY, UT METRO41620
0.0%0.0 %321SAN ANGELO, TX METRO41660
0.4%0.3 %5009SAN ANTONIO, TX METRO41700
1.1%0.9 %14194SAN DIEGO-CARLSBAD-SAN MARCOS, CAMETRO
41740
2.1%1.6 %26029SAN FRANCISCO-OAKLAND-FREMONT, CAMETRO
41860
0.7%0.6 %9197SAN JOSE-SUNNYVALE-SANTA CLARA, CAMETRO
41940
0.1%0.1 %1443SAN JUAN-CAGUAS-GUAYNABO, PR METRO41980
- 27301 -
- 25 -
Valid %%UnweightedFrequency
LabelValue
0.1%0.1 %1513SAN LUIS OBISPO-PASOROBLES, CAMETRO42020
0.3%0.2 %3235SANTA BARBARA-SANTA MARIA-GOLETA, CAMETRO
42060
0.2%0.2 %2580SANTA CRUZ-WATSONVILLE, CA METRO42100
0.4%0.3 %4689SANTA ROSA, CA METRO42220
0.0%0.0 %104SARASOTA-BRADENTON-VENICE, FL METRO42260
1.9%1.5 %24248SEATTLE-TACOMA-BELLEVUE, WA METRO42660
0.0%0.0 %198SHERMAN-DENISON, TX METRO43300
0.2%0.1 %2124SHREVEPORT-BOSSIER CITY, LA METRO43340
0.1%0.1 %1559SIOUX CITY, IA-NE-SD METRO43580
0.5%0.4 %6068SIOUX FALLS, SD METRO43620
0.2%0.2 %2535SPARTANBURG, SC METRO43900
0.6%0.4 %7016SPOKANE, WA METRO44060
0.2%0.1 %2034SPRINGFIELD, IL METRO44100
0.5%0.4 %6553SPRINGFIELD, MA METRO44140
0.1%0.1 %1470SPRINGFIELD, MO METRO44180
0.1%0.1 %1883SPRINGFIELD, OH METRO44220
0.3%0.2 %3551STOCKTON, CA METRO44700
0.1%0.1 %805SUMTER, SC METRO44940
0.8%0.6 %9831SYRACUSE, NY METRO45060
0.1%0.1 %929TALLAHASSEE, FL METRO45220
0.5%0.4 %6235TAMPA-ST. PETERSBURG-CLEARWATER, FLMETRO
45300
0.1%0.1 %1074TEXARKANA TX-TEXARKANA, AR METRO45500
0.0%0.0 %497TOLEDO, OH METRO45780
0.1%0.1 %1158TOPEKA, KS METRO45820
0.1%0.1 %1301TRENTON-EWING, NJ METRO45940
0.2%0.1 %2150TULSA, OK METRO46140
0.0%0.0 %241TYLER, TX METRO46340
0.3%0.2 %3911UTICA-ROME, NY METRO46540
0.2%0.2 %2734VALLEJO-FAIRFIELD, CA METRO46700
0.2%0.2 %2978VINELAND-MILLVILLE-BRIDGETON,NJMETRO47220
0.3%0.2 %3902VIRGINIABEACH-NORFOLK-NEWPORTNEWS,VA-NC METRO
47260
0.3%0.2 %4004VISALIA-PORTERVILLE, CA METRO47300
0.1%0.1 %1667WACO, TX METRO47360
1.6%1.3 %20278WASHINGTON-ARLINGTIN-ALEXANDRIA,DC-VA-MD-W METRO
47900
0.1%0.1 %1792WATERLOO-CEDAR FALLS, IA METRO47940
0.1%0.0 %666WHEELING, WV-OH METRO48540
0.3%0.2 %3761WICHITA, KS METRO48620
- 27301 -
- 26 -
Valid %%UnweightedFrequency
LabelValue
0.0%0.0 %335WICHITA FALLS, TX METRO48660
0.1%0.1 %879WILMINGTON, NC METRO48900
0.2%0.1 %1984WINSTON-SALEM, NC METRO49180
0.8%0.6 %9731WORCESTER, MA METRO49340
0.4%0.3 %5475YAKIMA, WA METRO49420
0.1%0.1 %1198YOUNGSTOWN-WARREN-BOARDMAN,OH-PAMETRO
49660
0.1%0.1 %1116YUBA CITY-MARYSVILLE, CA METRO49700
-21.7 %349284UNDESIGNATEDAREA/MISSING/UNKNOWN/NOTCOLLECTED/INVALID
-9 (M)
Based upon 1258091 valid cases out of 1607375 total cases.
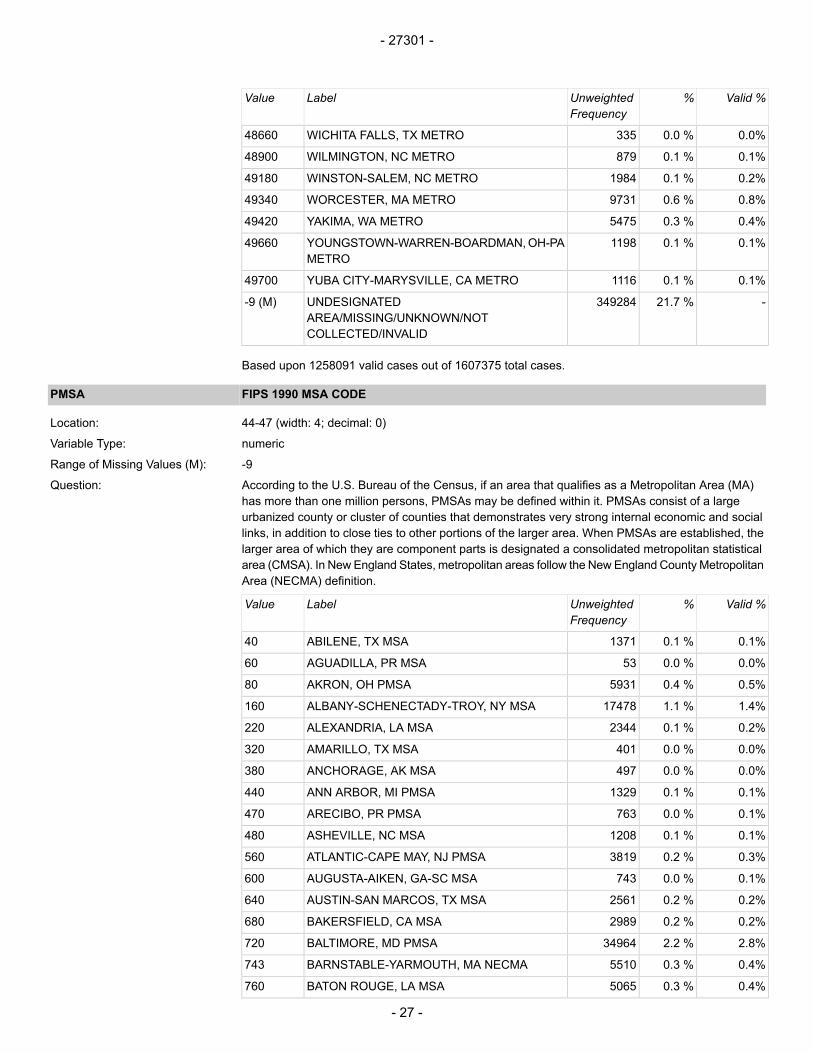
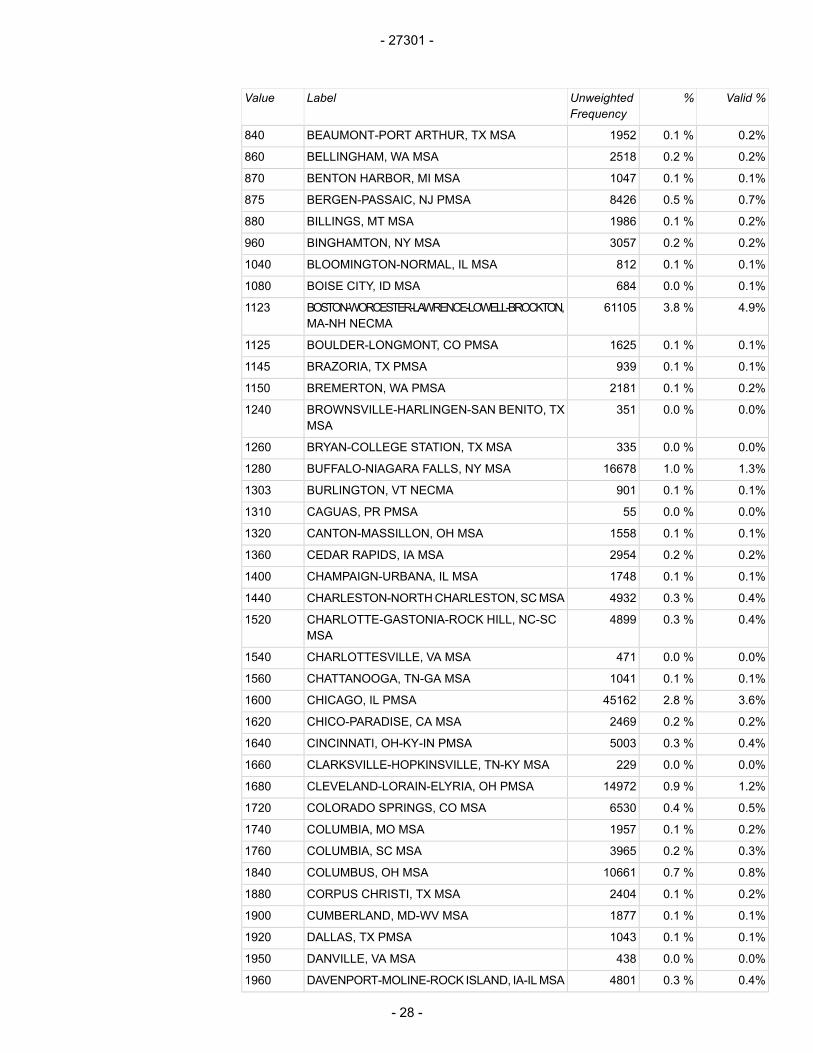
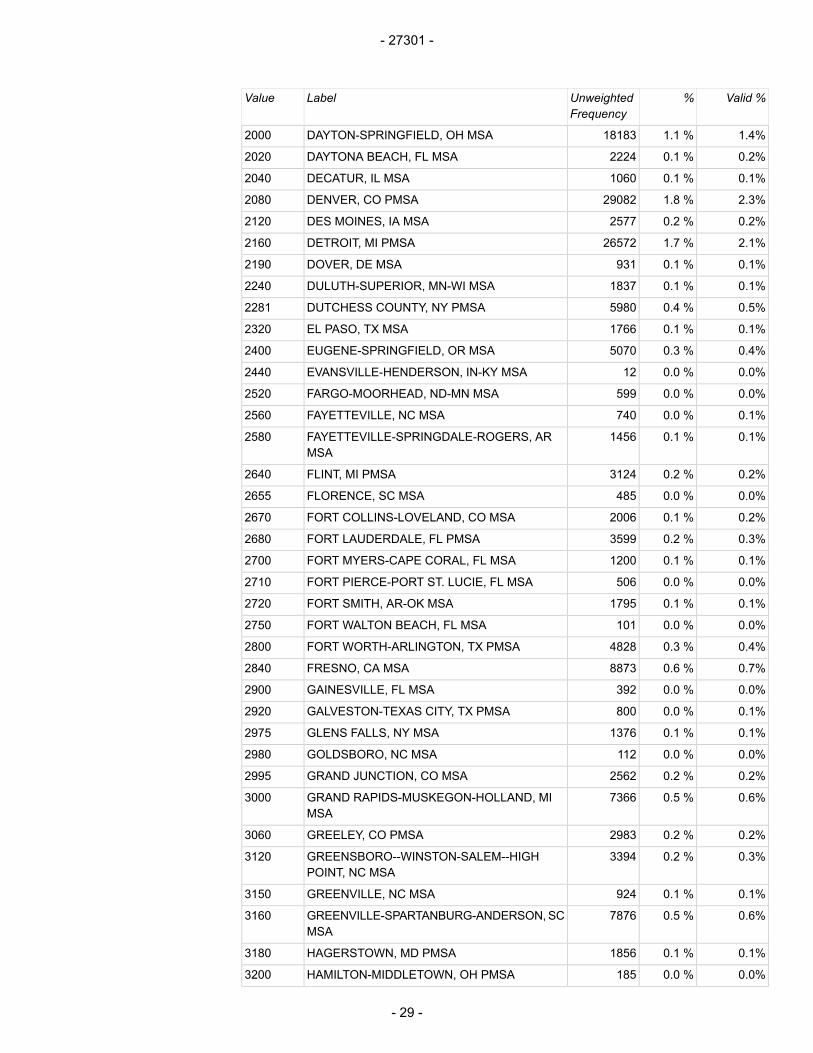
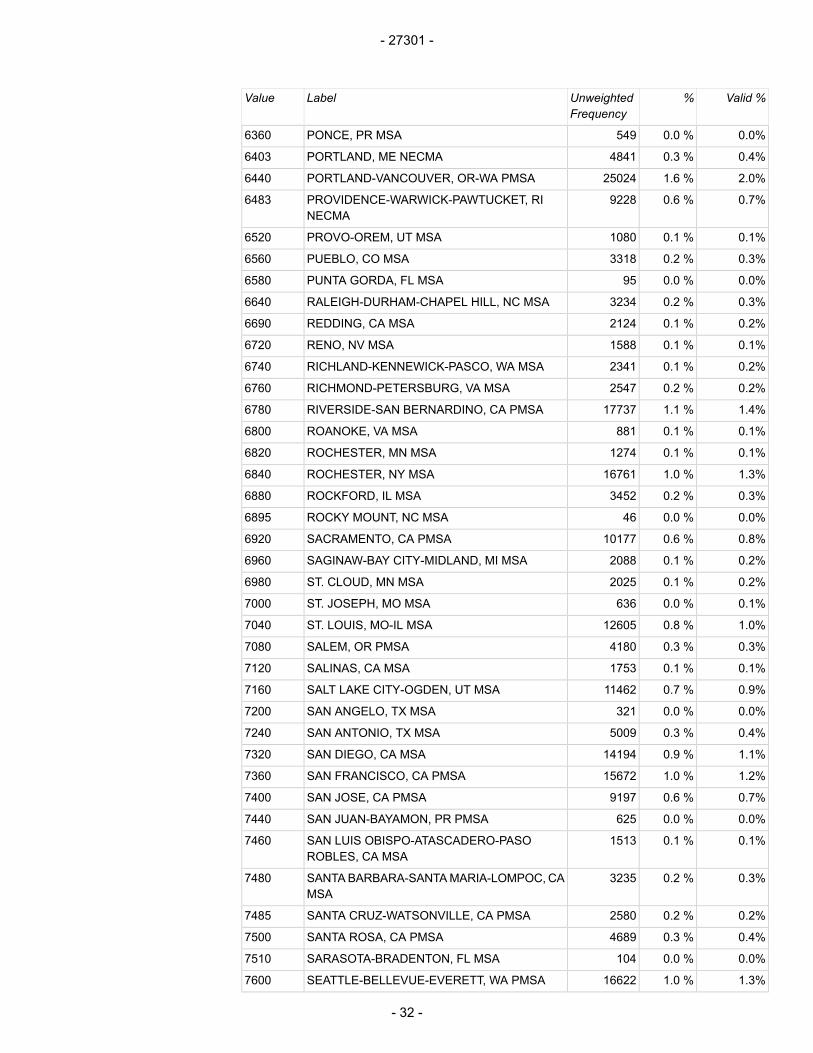
FIPS 1990 MSA CODEPMSA
44-47 (width: 4; decimal: 0)Location:
numericVariable Type:
-9Range of Missing Values (M):
According to the U.S. Bureau of the Census, if an area that qualifies as a Metropolitan Area (MA)has more than one million persons, PMSAs may be defined within it. PMSAs consist of a large
Question:
urbanized county or cluster of counties that demonstrates very strong internal economic and sociallinks, in addition to close ties to other portions of the larger area. When PMSAs are established, thelarger area of which they are component parts is designated a consolidated metropolitan statisticalarea (CMSA). In New England States, metropolitan areas follow the New England County MetropolitanArea (NECMA) definition.
Valid %%UnweightedFrequency
LabelValue
0.1%0.1 %1371ABILENE, TX MSA40
0.0%0.0 %53AGUADILLA, PR MSA60
0.5%0.4 %5931AKRON, OH PMSA80
1.4%1.1 %17478ALBANY-SCHENECTADY-TROY, NY MSA160
0.2%0.1 %2344ALEXANDRIA, LA MSA220
0.0%0.0 %401AMARILLO, TX MSA320
0.0%0.0 %497ANCHORAGE, AK MSA380
0.1%0.1 %1329ANN ARBOR, MI PMSA440
0.1%0.0 %763ARECIBO, PR PMSA470
0.1%0.1 %1208ASHEVILLE, NC MSA480
0.3%0.2 %3819ATLANTIC-CAPE MAY, NJ PMSA560
0.1%0.0 %743AUGUSTA-AIKEN, GA-SC MSA600
0.2%0.2 %2561AUSTIN-SAN MARCOS, TX MSA640
0.2%0.2 %2989BAKERSFIELD, CA MSA680
2.8%2.2 %34964BALTIMORE, MD PMSA720
0.4%0.3 %5510BARNSTABLE-YARMOUTH, MA NECMA743
0.4%0.3 %5065BATON ROUGE, LA MSA760
- 27301 -
- 27 -
Valid %%UnweightedFrequency
LabelValue
0.2%0.1 %1952BEAUMONT-PORT ARTHUR, TX MSA840
0.2%0.2 %2518BELLINGHAM, WA MSA860
0.1%0.1 %1047BENTON HARBOR, MI MSA870
0.7%0.5 %8426BERGEN-PASSAIC, NJ PMSA875
0.2%0.1 %1986BILLINGS, MT MSA880
0.2%0.2 %3057BINGHAMTON, NY MSA960
0.1%0.1 %812BLOOMINGTON-NORMAL, IL MSA1040
0.1%0.0 %684BOISE CITY, ID MSA1080
4.9%3.8 %61105BOSTON-WORCESTER-LAWRENCE-LOWELL-BROCKTON,MA-NH NECMA
1123
0.1%0.1 %1625BOULDER-LONGMONT, CO PMSA1125
0.1%0.1 %939BRAZORIA, TX PMSA1145
0.2%0.1 %2181BREMERTON, WA PMSA1150
0.0%0.0 %351BROWNSVILLE-HARLINGEN-SAN BENITO, TXMSA
1240
0.0%0.0 %335BRYAN-COLLEGE STATION, TX MSA1260
1.3%1.0 %16678BUFFALO-NIAGARA FALLS, NY MSA1280
0.1%0.1 %901BURLINGTON, VT NECMA1303
0.0%0.0 %55CAGUAS, PR PMSA1310
0.1%0.1 %1558CANTON-MASSILLON, OH MSA1320
0.2%0.2 %2954CEDAR RAPIDS, IA MSA1360
0.1%0.1 %1748CHAMPAIGN-URBANA, IL MSA1400
0.4%0.3 %4932CHARLESTON-NORTHCHARLESTON,SCMSA1440
0.4%0.3 %4899CHARLOTTE-GASTONIA-ROCK HILL, NC-SCMSA
1520
0.0%0.0 %471CHARLOTTESVILLE, VA MSA1540
0.1%0.1 %1041CHATTANOOGA, TN-GA MSA1560
3.6%2.8 %45162CHICAGO, IL PMSA1600
0.2%0.2 %2469CHICO-PARADISE, CA MSA1620
0.4%0.3 %5003CINCINNATI, OH-KY-IN PMSA1640
0.0%0.0 %229CLARKSVILLE-HOPKINSVILLE, TN-KY MSA1660
1.2%0.9 %14972CLEVELAND-LORAIN-ELYRIA, OH PMSA1680
0.5%0.4 %6530COLORADO SPRINGS, CO MSA1720
0.2%0.1 %1957COLUMBIA, MO MSA1740
0.3%0.2 %3965COLUMBIA, SC MSA1760
0.8%0.7 %10661COLUMBUS, OH MSA1840
0.2%0.1 %2404CORPUS CHRISTI, TX MSA1880
0.1%0.1 %1877CUMBERLAND, MD-WV MSA1900
0.1%0.1 %1043DALLAS, TX PMSA1920
0.0%0.0 %438DANVILLE, VA MSA1950
0.4%0.3 %4801DAVENPORT-MOLINE-ROCK ISLAND, IA-ILMSA1960
- 27301 -
- 28 -
Valid %%UnweightedFrequency
LabelValue
1.4%1.1 %18183DAYTON-SPRINGFIELD, OH MSA2000
0.2%0.1 %2224DAYTONA BEACH, FL MSA2020
0.1%0.1 %1060DECATUR, IL MSA2040
2.3%1.8 %29082DENVER, CO PMSA2080
0.2%0.2 %2577DES MOINES, IA MSA2120
2.1%1.7 %26572DETROIT, MI PMSA2160
0.1%0.1 %931DOVER, DE MSA2190
0.1%0.1 %1837DULUTH-SUPERIOR, MN-WI MSA2240
0.5%0.4 %5980DUTCHESS COUNTY, NY PMSA2281
0.1%0.1 %1766EL PASO, TX MSA2320
0.4%0.3 %5070EUGENE-SPRINGFIELD, OR MSA2400
0.0%0.0 %12EVANSVILLE-HENDERSON, IN-KY MSA2440
0.0%0.0 %599FARGO-MOORHEAD, ND-MN MSA2520
0.1%0.0 %740FAYETTEVILLE, NC MSA2560
0.1%0.1 %1456FAYETTEVILLE-SPRINGDALE-ROGERS, ARMSA
2580
0.2%0.2 %3124FLINT, MI PMSA2640
0.0%0.0 %485FLORENCE, SC MSA2655
0.2%0.1 %2006FORT COLLINS-LOVELAND, CO MSA2670
0.3%0.2 %3599FORT LAUDERDALE, FL PMSA2680
0.1%0.1 %1200FORT MYERS-CAPE CORAL, FL MSA2700
0.0%0.0 %506FORT PIERCE-PORT ST. LUCIE, FL MSA2710
0.1%0.1 %1795FORT SMITH, AR-OK MSA2720
0.0%0.0 %101FORT WALTON BEACH, FL MSA2750
0.4%0.3 %4828FORT WORTH-ARLINGTON, TX PMSA2800
0.7%0.6 %8873FRESNO, CA MSA2840
0.0%0.0 %392GAINESVILLE, FL MSA2900
0.1%0.0 %800GALVESTON-TEXAS CITY, TX PMSA2920
0.1%0.1 %1376GLENS FALLS, NY MSA2975
0.0%0.0 %112GOLDSBORO, NC MSA2980
0.2%0.2 %2562GRAND JUNCTION, CO MSA2995
0.6%0.5 %7366GRAND RAPIDS-MUSKEGON-HOLLAND, MIMSA
3000
0.2%0.2 %2983GREELEY, CO PMSA3060
0.3%0.2 %3394GREENSBORO--WINSTON-SALEM--HIGHPOINT, NC MSA
3120
0.1%0.1 %924GREENVILLE, NC MSA3150
0.6%0.5 %7876GREENVILLE-SPARTANBURG-ANDERSON,SCMSA
3160
0.1%0.1 %1856HAGERSTOWN, MD PMSA3180
0.0%0.0 %185HAMILTON-MIDDLETOWN, OH PMSA3200
- 27301 -
- 29 -

Valid %%UnweightedFrequency
LabelValue
1.2%0.9 %14707HARTFORD, CT NECMA3283
0.1%0.0 %735HICKORY-MORGANTON, NC MSA3290
0.4%0.3 %5140HONOLULU, HI MSA3320
0.1%0.1 %1175HOUMA, LA MSA3350
0.6%0.5 %8053HOUSTON, TX PMSA3360
0.0%0.0 %452HUNTINGTON-ASHLAND, WV-KY-OH MSA3400
0.1%0.1 %1278INDIANAPOLIS, IN MSA3480
0.2%0.1 %2347IOWA CITY, IA MSA3500
0.1%0.1 %1393JACKSON, MI MSA3520
0.1%0.1 %1166JACKSON, TN MSA3580
0.2%0.2 %2910JACKSONVILLE, FL MSA3600
0.0%0.0 %572JACKSONVILLE, NC MSA3605
0.1%0.1 %990JAMESTOWN, NY MSA3610
0.2%0.1 %2037JERSEY CITY, NJ PMSA3640
0.2%0.2 %2474JOHNSONCITY-KINGSPORT-BRISTOL, TN-VAMSA
3660
0.1%0.1 %1289JOPLIN, MO MSA3710
0.2%0.2 %2952KALAMAZOO-BATTLE CREEK, MI MSA3720
0.1%0.1 %1310KANKAKEE, IL PMSA3740
0.6%0.5 %7838KANSAS CITY, MO-KS MSA3760
0.0%0.0 %369KILLEEN-TEMPLE, TX MSA3810
0.1%0.1 %1658KNOXVILLE, TN MSA3840
0.0%0.0 %49LA CROSSE, WI-MN MSA3870
0.1%0.1 %1602LAFAYETTE, LA MSA3880
0.1%0.1 %1495LAKE CHARLES, LA MSA3960
0.0%0.0 %243LAKELAND-WINTER HAVEN, FL MSA3980
0.2%0.1 %2110LANSING-EAST LANSING, MI MSA4040
0.0%0.0 %519LAREDO, TX MSA4080
0.4%0.3 %5147LAS VEGAS, NV-AZ MSA4120
0.1%0.0 %739LAWTON, OK MSA4200
0.1%0.1 %1133LEXINGTON, KY MSA4280
0.0%0.0 %594LIMA, OH MSA4320
0.3%0.2 %3476LINCOLN, NE MSA4360
0.3%0.2 %3270LITTLE ROCK-NORTH LITTLE ROCK, AR MSA4400
0.1%0.0 %680LONGVIEW-MARSHALL, TX MSA4420
3.4%2.7 %42740LOS ANGELES-LONG BEACH, CA PMSA4480
0.2%0.2 %2738LOUISVILLE, KY-IN MSA4520
0.2%0.1 %2097LUBBOCK, TX MSA4600
0.0%0.0 %568LYNCHBURG, VA MSA4640
0.1%0.0 %796MANSFIELD, OH MSA4800
- 27301 -
- 30 -

Valid %%UnweightedFrequency
LabelValue
0.0%0.0 %90MAYAGUEZ, PR MSA4840
0.0%0.0 %496MCALLEN-EDINBURG-MISSION, TX MSA4880
0.2%0.2 %2628MEDFORD-ASHLAND, OR MSA4890
0.1%0.0 %654MELBOURNE-TITUSVILLE-PALM BAY, FL MSA4900
0.2%0.2 %2668MEMPHIS, TN-AR-MS MSA4920
0.1%0.0 %791MERCED, CA MSA4940
0.2%0.2 %2592MIAMI, FL PMSA5000
0.4%0.3 %4749MIDDLESEX-SOMERSET-HUNTERDON, NJPMSA
5015
0.0%0.0 %21MILWAUKEE-WAUKESHA, WI PMSA5080
2.1%1.6 %25984MINNEAPOLIS-ST. PAUL, MN-WI MSA5120
0.3%0.3 %4101MODESTO, CA MSA5170
0.6%0.5 %7361MONMOUTH-OCEAN, NJ PMSA5190
0.1%0.1 %1869MONROE, LA MSA5200
0.1%0.1 %858MYRTLE BEACH, SC MSA5330
0.0%0.0 %464NAPLES, FL MSA5345
0.2%0.1 %2335NASHVILLE, TN MSA5360
2.4%1.9 %29952NASSAU-SUFFOLK, NY PMSA5380
1.0%0.8 %12276NEWHAVEN-BRIDGEPORT-STAMFORD-WATERBURY-DANBURY,CT NECMA
5483
0.3%0.2 %3247NEW LONDON-NORWICH, CT NECMA5523
0.2%0.2 %2473NEW ORLEANS, LA MSA5560
11.3%8.8 %141665NEW YORK, NY PMSA5600
1.3%1.0 %15842NEWARK, NJ PMSA5640
0.4%0.3 %4656NEWBURGH, NY-PA PMSA5660
0.3%0.2 %3902NORFOLK-VIRGINIABEACH-NEWPORTNEWS,VA-NC MSA
5720
0.8%0.6 %10357OAKLAND, CA PMSA5775
0.0%0.0 %152OCALA, FL MSA5790
0.1%0.1 %901ODESSA-MIDLAND, TX MSA5800
0.5%0.4 %5866OKLAHOMA CITY, OK MSA5880
0.1%0.1 %1833OLYMPIA, WA PMSA5910
0.3%0.2 %4005OMAHA, NE-IA MSA5920
1.0%0.8 %12284ORANGE COUNTY, CA PMSA5945
0.2%0.2 %2771ORLANDO, FL MSA5960
0.1%0.1 %1023PANAMA CITY, FL MSA6015
0.0%0.0 %39PARKERSBURG-MARIETTA, WV-OH MSA6020
0.1%0.1 %1710PENSACOLA, FL MSA6080
0.2%0.2 %2966PEORIA-PEKIN, IL MSA6120
0.5%0.4 %6538PHILADELPHIA, PA-NJ PMSA6160
- 27301 -
- 31 -
Valid %%UnweightedFrequency
LabelValue
0.0%0.0 %549PONCE, PR MSA6360
0.4%0.3 %4841PORTLAND, ME NECMA6403
2.0%1.6 %25024PORTLAND-VANCOUVER, OR-WA PMSA6440
0.7%0.6 %9228PROVIDENCE-WARWICK-PAWTUCKET, RINECMA
6483
0.1%0.1 %1080PROVO-OREM, UT MSA6520
0.3%0.2 %3318PUEBLO, CO MSA6560
0.0%0.0 %95PUNTA GORDA, FL MSA6580
0.3%0.2 %3234RALEIGH-DURHAM-CHAPEL HILL, NC MSA6640
0.2%0.1 %2124REDDING, CA MSA6690
0.1%0.1 %1588RENO, NV MSA6720
0.2%0.1 %2341RICHLAND-KENNEWICK-PASCO, WA MSA6740
0.2%0.2 %2547RICHMOND-PETERSBURG, VA MSA6760
1.4%1.1 %17737RIVERSIDE-SAN BERNARDINO, CA PMSA6780
0.1%0.1 %881ROANOKE, VA MSA6800
0.1%0.1 %1274ROCHESTER, MN MSA6820
1.3%1.0 %16761ROCHESTER, NY MSA6840
0.3%0.2 %3452ROCKFORD, IL MSA6880
0.0%0.0 %46ROCKY MOUNT, NC MSA6895
0.8%0.6 %10177SACRAMENTO, CA PMSA6920
0.2%0.1 %2088SAGINAW-BAY CITY-MIDLAND, MI MSA6960
0.2%0.1 %2025ST. CLOUD, MN MSA6980
0.1%0.0 %636ST. JOSEPH, MO MSA7000
1.0%0.8 %12605ST. LOUIS, MO-IL MSA7040
0.3%0.3 %4180SALEM, OR PMSA7080
0.1%0.1 %1753SALINAS, CA MSA7120
0.9%0.7 %11462SALT LAKE CITY-OGDEN, UT MSA7160
0.0%0.0 %321SAN ANGELO, TX MSA7200
0.4%0.3 %5009SAN ANTONIO, TX MSA7240
1.1%0.9 %14194SAN DIEGO, CA MSA7320
1.2%1.0 %15672SAN FRANCISCO, CA PMSA7360
0.7%0.6 %9197SAN JOSE, CA PMSA7400
0.0%0.0 %625SAN JUAN-BAYAMON, PR PMSA7440
0.1%0.1 %1513SAN LUIS OBISPO-ATASCADERO-PASOROBLES, CA MSA
7460
0.3%0.2 %3235SANTABARBARA-SANTAMARIA-LOMPOC,CAMSA
7480
0.2%0.2 %2580SANTA CRUZ-WATSONVILLE, CA PMSA7485
0.4%0.3 %4689SANTA ROSA, CA PMSA7500
0.0%0.0 %104SARASOTA-BRADENTON, FL MSA7510
1.3%1.0 %16622SEATTLE-BELLEVUE-EVERETT, WA PMSA7600
- 27301 -
- 32 -

Valid %%UnweightedFrequency
LabelValue
0.0%0.0 %198SHERMAN-DENISON, TX MSA7640
0.2%0.1 %2124SHREVEPORT-BOSSIER CITY, LA MSA7680
0.1%0.1 %1559SIOUX CITY, IA-NE MSA7720
0.5%0.4 %6068SIOUX FALLS, SD MSA7760
0.6%0.4 %7016SPOKANE, WA MSA7840
0.2%0.1 %2034SPRINGFIELD, IL MSA7880
0.1%0.1 %1470SPRINGFIELD, MO MSA7920
0.5%0.4 %6553SPRINGFIELD, MA NECMA8003
0.3%0.2 %3551STOCKTON-LODI, CA MSA8120
0.1%0.1 %805SUMTER, SC MSA8140
0.8%0.6 %9831SYRACUSE, NY MSA8160
0.6%0.5 %7626TACOMA, WA PMSA8200
0.1%0.1 %929TALLAHASSEE, FL MSA8240
0.5%0.4 %6235TAMPA-ST. PETERSBURG-CLEARWATER, FLMSA
8280
0.1%0.1 %1074TEXARKANA, TX-TEXARKANA, AR MSA8360
0.0%0.0 %497TOLEDO, OH MSA8400
0.1%0.1 %1158TOPEKA, KS MSA8440
0.1%0.1 %1301TRENTON, NJ PMSA8480
0.2%0.1 %2150TULSA, OK MSA8560
0.0%0.0 %241TYLER, TX MSA8640
0.3%0.2 %3911UTICA-ROME, NY MSA8680
0.2%0.2 %2990VALLEJO-FAIRFIELD-NAPA, CA PMSA8720
0.2%0.2 %3105VENTURA, CA PMSA8735
0.2%0.2 %2978VINELAND-MILLVILLE-BRIDGETON, NJ PMSA8760
0.3%0.2 %4004VISALIA-TULARE-PORTERVILLE, CA MSA8780
0.1%0.1 %1667WACO, TX MSA8800
1.6%1.3 %20278WASHINGTON, DC-MD-VA-WV PMSA8840
0.1%0.1 %1792WATERLOO-CEDAR FALLS, IA MSA8920
0.2%0.1 %2067WEST PALM BEACH-BOCA RATON, FL MSA8960
0.1%0.0 %666WHEELING, WV-OH MSA9000
0.3%0.2 %3761WICHITA, KS MSA9040
0.0%0.0 %335WICHITA FALLS, TX MSA9080
0.4%0.3 %5026WILMINGTON-NEWARK, DE-MD PMSA9160
0.1%0.1 %879WILMINGTON, NC MSA9200
0.4%0.3 %5475YAKIMA, WA MSA9260
0.1%0.0 %774YOLO, CA PMSA9270
0.1%0.1 %1856YOUNGSTOWN-WARREN, OH MSA9320
0.1%0.1 %1116YUBA CITY, CA MSA9340
- 27301 -
- 33 -
Valid %%UnweightedFrequency
LabelValue
-21.7 %349284UNDESIGNATEDAREA/MISSING/UNKNOWN/NOTCOLLECTED/INVALID
-9 (M)
Based upon 1258091 valid cases out of 1607375 total cases.
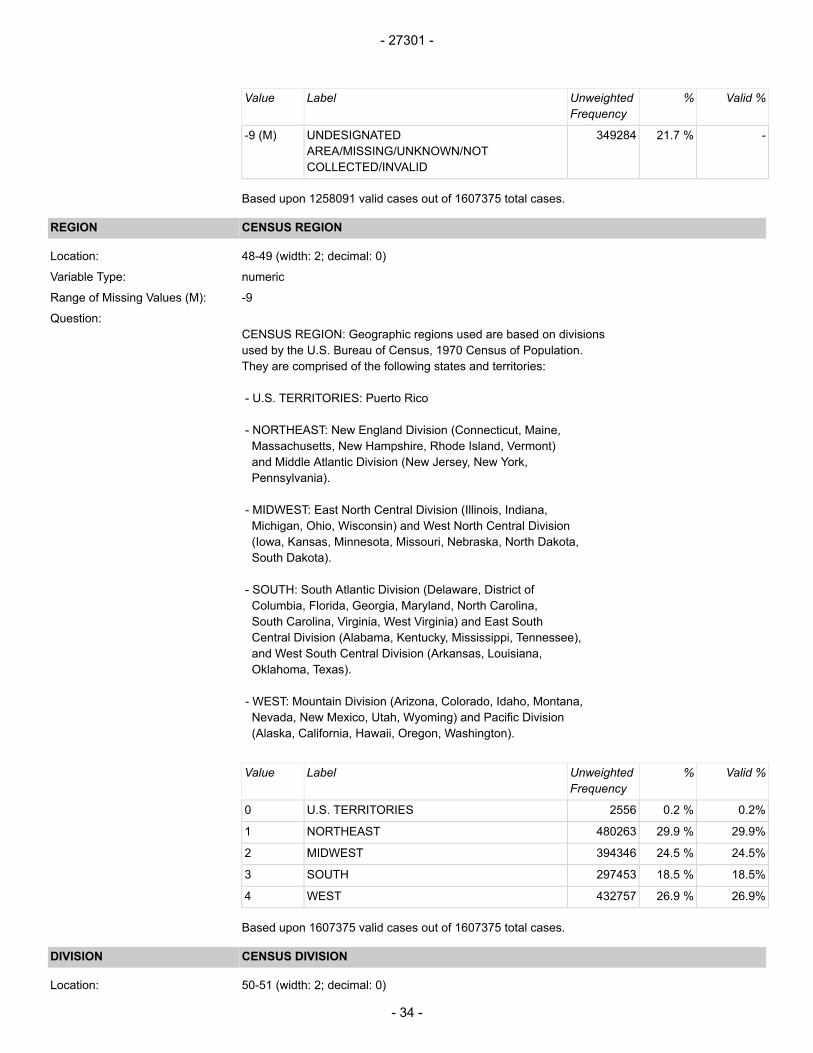
CENSUS REGIONREGION
48-49 (width: 2; decimal: 0)Location:
numericVariable Type:
-9Range of Missing Values (M):
CENSUS REGION: Geographic regions used are based on divisionsQuestion:
used by the U.S. Bureau of Census, 1970 Census of Population.They are comprised of the following states and territories:
- U.S. TERRITORIES: Puerto Rico
- NORTHEAST: New England Division (Connecticut, Maine,Massachusetts, New Hampshire, Rhode Island, Vermont)and Middle Atlantic Division (New Jersey, New York,Pennsylvania).
- MIDWEST: East North Central Division (Illinois, Indiana,Michigan, Ohio, Wisconsin) and West North Central Division(Iowa, Kansas, Minnesota, Missouri, Nebraska, North Dakota,South Dakota).
- SOUTH: South Atlantic Division (Delaware, District ofColumbia, Florida, Georgia, Maryland, North Carolina,South Carolina, Virginia, West Virginia) and East SouthCentral Division (Alabama, Kentucky, Mississippi, Tennessee),and West South Central Division (Arkansas, Louisiana,Oklahoma, Texas).
- WEST: Mountain Division (Arizona, Colorado, Idaho, Montana,Nevada, New Mexico, Utah, Wyoming) and Pacific Division(Alaska, California, Hawaii, Oregon, Washington).
Valid %%UnweightedFrequency
LabelValue
0.2%0.2 %2556U.S. TERRITORIES0
29.9%29.9 %480263NORTHEAST1
24.5%24.5 %394346MIDWEST2
18.5%18.5 %297453SOUTH3
26.9%26.9 %432757WEST4
Based upon 1607375 valid cases out of 1607375 total cases.
CENSUS DIVISIONDIVISION
50-51 (width: 2; decimal: 0)Location:
- 27301 -
- 34 -
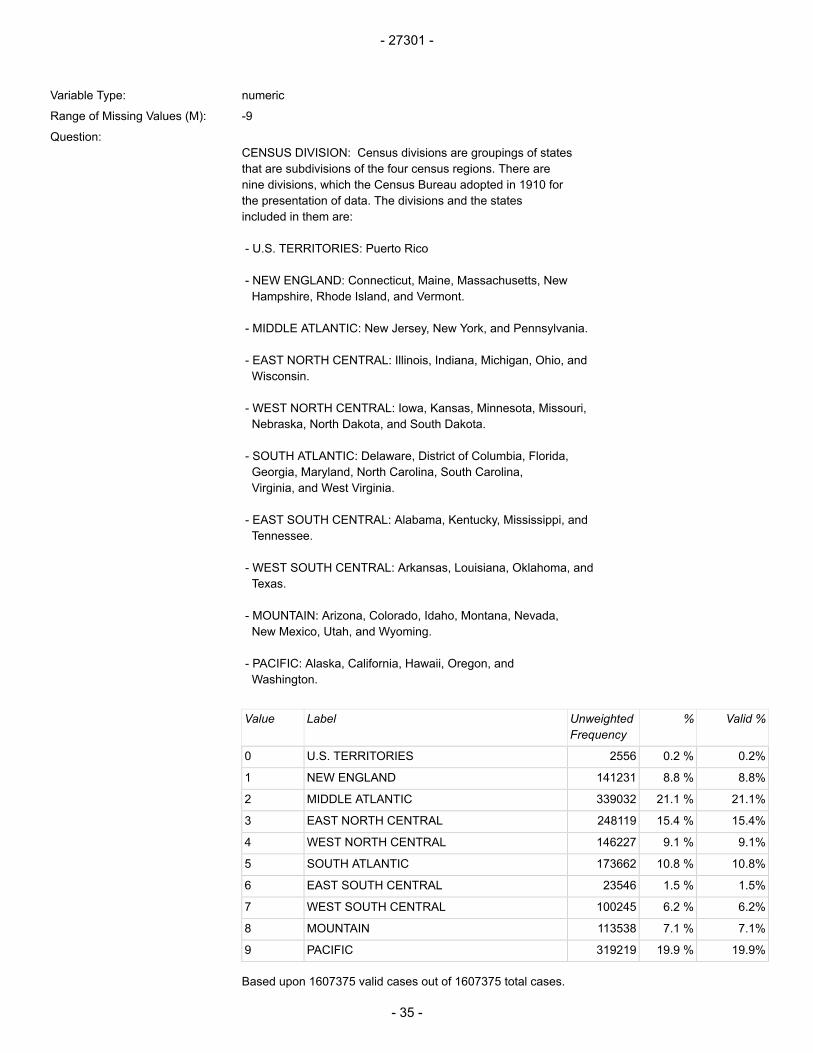
numericVariable Type:
-9Range of Missing Values (M):
CENSUS DIVISION: Census divisions are groupings of statesQuestion:
that are subdivisions of the four census regions. There arenine divisions, which the Census Bureau adopted in 1910 forthe presentation of data. The divisions and the statesincluded in them are:
- U.S. TERRITORIES: Puerto Rico
- NEW ENGLAND: Connecticut, Maine, Massachusetts, NewHampshire, Rhode Island, and Vermont.
- MIDDLE ATLANTIC: New Jersey, New York, and Pennsylvania.
- EAST NORTH CENTRAL: Illinois, Indiana, Michigan, Ohio, andWisconsin.
- WEST NORTH CENTRAL: Iowa, Kansas, Minnesota, Missouri,Nebraska, North Dakota, and South Dakota.
- SOUTH ATLANTIC: Delaware, District of Columbia, Florida,Georgia, Maryland, North Carolina, South Carolina,Virginia, and West Virginia.
- EAST SOUTH CENTRAL: Alabama, Kentucky, Mississippi, andTennessee.
- WEST SOUTH CENTRAL: Arkansas, Louisiana, Oklahoma, andTexas.
- MOUNTAIN: Arizona, Colorado, Idaho, Montana, Nevada,New Mexico, Utah, and Wyoming.
- PACIFIC: Alaska, California, Hawaii, Oregon, andWashington.
Valid %%UnweightedFrequency
LabelValue
0.2%0.2 %2556U.S. TERRITORIES0
8.8%8.8 %141231NEW ENGLAND1
21.1%21.1 %339032MIDDLE ATLANTIC2
15.4%15.4 %248119EAST NORTH CENTRAL3
9.1%9.1 %146227WEST NORTH CENTRAL4
10.8%10.8 %173662SOUTH ATLANTIC5
1.5%1.5 %23546EAST SOUTH CENTRAL6
6.2%6.2 %100245WEST SOUTH CENTRAL7
7.1%7.1 %113538MOUNTAIN8
19.9%19.9 %319219PACIFIC9
Based upon 1607375 valid cases out of 1607375 total cases.
- 27301 -
- 35 -

SERVICE SETTING AT DISCHARGESERVSETD
52-53 (width: 2; decimal: 0)Location:
numericVariable Type:
-9Range of Missing Values (M):
Describes the type of service the client was receiving priorQuestion:
to discharge.
- DETOXIFICATION, 24-HOUR SERVICE, HOSPITAL INPATIENT:24 hour per day medical acute care services in hospitalsetting for detoxification for persons with severe medicalcomplications associated with withdrawal.
- DETOXIFICATION, 24-HOUR SERVICE, FREE-STANDING RESIDENTIAL:24 hour per day services in non-hospital setting providingfor safe withdrawal and transition to ongoing treatment.
- REHABILITATION/RESIDENTIAL - HOSPITAL (OTHER THAN DETOX):24 hour per day medical care in a hospital facility inconjunction with treatment services for alcohol and otherdrug abuse and dependency.
- REHABILITAITON/RESIDENTIAL - SHORT TERM (30 DAYS OR FEWER):Typically, 30 days or less of non-acute care in a settingwith treatment services for alcohol and other drug abuseand dependency.
- REHABILITATION/RESIDENTIAL - LONG TERM (MORE THAN 30 DAYS):Typically, more than 30 days of non-acute care in a settingwith treatment services for alcohol and other drug abuseand dependency; this may include transitional livingarrangements such as halfway houses.
- AMBULATORY - INTENSIVE OUTPATIENT:As a minimum, the client must receive treatment lasting twoor more hours per day for three or more days per week.(Includes partial hospitalization)
- AMBULATORY - NON-INTENSIVE OUTPATIENT:Ambulatory treatment services including individual, family,and/or group services; these may include pharmacologicaltherapies.
- AMBULATORY - DETOXIFICATION:Outpatient treatment services providing for safewithdrawal in an ambulatory setting (pharmacologicalor non-pharmacological).
Valid %%UnweightedFrequency
LabelValue
4.4%4.4 %71484DETOX, 24 HR, HOSPITAL INPATIENT1
16.0%16.0 %257119DETOX, 24HR, FREE-STANDINGRESIDENTIAL2
0.4%0.4 %6174REHAB/RES, HOSPITAL (NON-DETOX)3
- 27301 -
- 36 -
Valid %%UnweightedFrequency
LabelValue
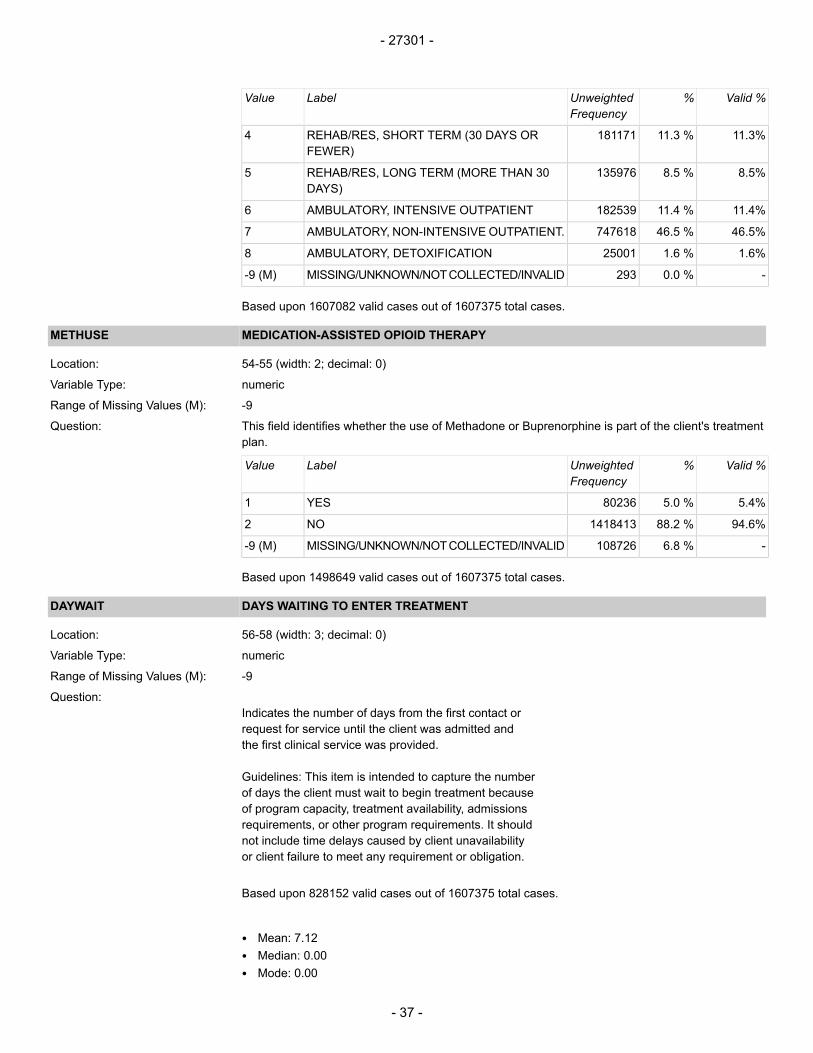
11.3%11.3 %181171REHAB/RES, SHORT TERM (30 DAYS ORFEWER)
4
8.5%8.5 %135976REHAB/RES, LONG TERM (MORE THAN 30DAYS)
5
11.4%11.4 %182539AMBULATORY, INTENSIVE OUTPATIENT6
46.5%46.5 %747618AMBULATORY, NON-INTENSIVE OUTPATIENT.7
1.6%1.6 %25001AMBULATORY, DETOXIFICATION8
-0.0 %293MISSING/UNKNOWN/NOTCOLLECTED/INVALID-9 (M)
Based upon 1607082 valid cases out of 1607375 total cases.
MEDICATION-ASSISTED OPIOID THERAPYMETHUSE
54-55 (width: 2; decimal: 0)Location:
numericVariable Type:
-9Range of Missing Values (M):
This field identifies whether the use of Methadone or Buprenorphine is part of the client's treatmentplan.
Question:
Valid %%UnweightedFrequency
LabelValue
5.4%5.0 %80236YES1
94.6%88.2 %1418413NO2
-6.8 %108726MISSING/UNKNOWN/NOTCOLLECTED/INVALID-9 (M)
Based upon 1498649 valid cases out of 1607375 total cases.
DAYS WAITING TO ENTER TREATMENTDAYWAIT
56-58 (width: 3; decimal: 0)Location:
numericVariable Type:
-9Range of Missing Values (M):
Indicates the number of days from the first contact orQuestion:
request for service until the client was admitted andthe first clinical service was provided.
Guidelines: This item is intended to capture the numberof days the client must wait to begin treatment becauseof program capacity, treatment availability, admissionsrequirements, or other program requirements. It shouldnot include time delays caused by client unavailabilityor client failure to meet any requirement or obligation.
Based upon 828152 valid cases out of 1607375 total cases.
• Mean: 7.12• Median: 0.00• Mode: 0.00
- 27301 -
- 37 -
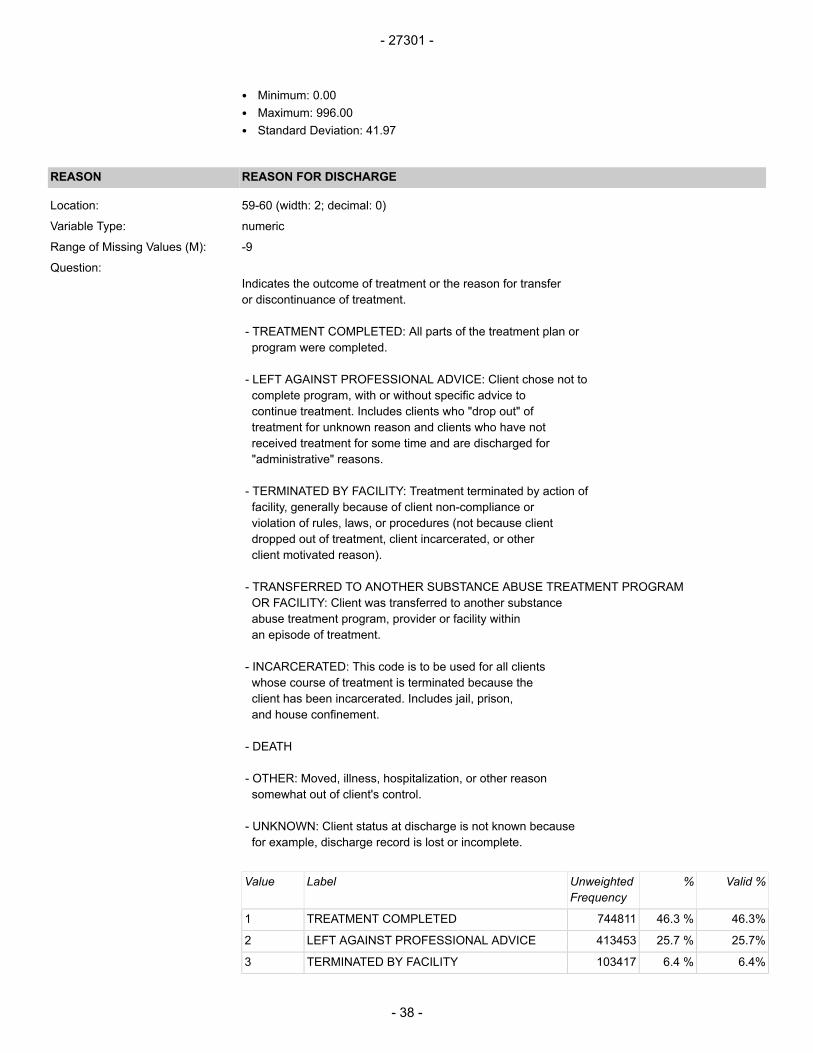
• Minimum: 0.00• Maximum: 996.00• Standard Deviation: 41.97
REASON FOR DISCHARGEREASON
59-60 (width: 2; decimal: 0)Location:
numericVariable Type:
-9Range of Missing Values (M):
Indicates the outcome of treatment or the reason for transferQuestion:
or discontinuance of treatment.
- TREATMENT COMPLETED: All parts of the treatment plan orprogram were completed.
- LEFT AGAINST PROFESSIONAL ADVICE: Client chose not tocomplete program, with or without specific advice tocontinue treatment. Includes clients who "drop out" oftreatment for unknown reason and clients who have notreceived treatment for some time and are discharged for"administrative" reasons.
- TERMINATED BY FACILITY: Treatment terminated by action offacility, generally because of client non-compliance orviolation of rules, laws, or procedures (not because clientdropped out of treatment, client incarcerated, or otherclient motivated reason).
- TRANSFERRED TO ANOTHER SUBSTANCE ABUSE TREATMENT PROGRAMOR FACILITY: Client was transferred to another substanceabuse treatment program, provider or facility withinan episode of treatment.
- INCARCERATED: This code is to be used for all clientswhose course of treatment is terminated because theclient has been incarcerated. Includes jail, prison,and house confinement.
- DEATH
- OTHER: Moved, illness, hospitalization, or other reasonsomewhat out of client's control.
- UNKNOWN: Client status at discharge is not known becausefor example, discharge record is lost or incomplete.
Valid %%UnweightedFrequency
LabelValue
46.3%46.3 %744811TREATMENT COMPLETED1
25.7%25.7 %413453LEFT AGAINST PROFESSIONAL ADVICE2
6.4%6.4 %103417TERMINATED BY FACILITY3
- 27301 -
- 38 -

Valid %%UnweightedFrequency
LabelValue
13.9%13.9 %223364TRANSFERRED TO ANOTHER TREATMENTPROGRAM OR FACILITY
4
2.1%2.1 %33187INCARCERATED5
0.2%0.2 %3720DEATH6
5.3%5.3 %85299OTHER7
-0.0 %124MISSING/UNKNOWN/NOTCOLLECTED/INVALID-9 (M)
Based upon 1607251 valid cases out of 1607375 total cases.
LENGTH OF STAYLOS
61-63 (width: 3; decimal: 0)Location:
numericVariable Type:
-9Range of Missing Values (M):
Describes the length of the treatment episode (in days).Question:
Length of stay was computed using the date of admission andthe date of last contact. One day is added to all outpatientdischarges, so that the first day and last day of outpatienttreatment are counted.
- 1 to 30: Data values in the 1-30 range represent theactual computed number of days the client spent intreatment
- 31: Length of stay is between 31 and 45 days.
- 32: Length of stay is between 46 and 60 days.
- 33: Length of stay is between 61 and 90 days.
- 34: Length of stay is between 91 and 120 days.
- 35: Length of stay is between 121 and 180 days.
- 36: Length of stay is between 181 and 365 days.
- 37: Length of stay is greater than 365 days.
Valid %%UnweightedFrequency
LabelValue
4.1%4.1 %66348-1
3.9%3.9 %63063-2
4.1%4.1 %66473-3
3.7%3.7 %59379-4
3.4%3.4 %54508-5
2.6%2.6 %41840-6
2.1%2.1 %33528-7
1.7%1.7 %27502-8
- 27301 -
- 39 -

Valid %%UnweightedFrequency
LabelValue
1.0%1.0 %16625-9
1.0%1.0 %15631-10
0.8%0.8 %12129-11
0.7%0.7 %11294-12
0.9%0.9 %14596-13
1.1%1.1 %18260-14
1.1%1.1 %18328-15
0.7%0.7 %11579-16
0.6%0.6 %10312-17
0.6%0.6 %9717-18
0.6%0.6 %9398-19
0.8%0.8 %13499-20
1.2%1.2 %19547-21
1.0%1.0 %16735-22
0.7%0.7 %11156-23
0.6%0.6 %10022-24
0.6%0.6 %10342-25
0.7%0.7 %10695-26
1.2%1.2 %18706-27
1.9%1.9 %30678-28
1.3%1.3 %21031-29
1.1%1.1 %17898-30
8.0%8.0 %12813431 TO 45 DAYS31
6.1%6.1 %9866846 TO 60 DAYS32
9.7%9.7 %15553361 TO 90 DAYS33
7.7%7.7 %12301591 TO 120 DAYS34
8.9%8.9 %143222121 TO 180 DAYS35
9.7%9.7 %155538181 TO 365 DAYS36
3.9%3.9 %62441MORE THAN A YEAR37
-0.0 %5MISSING/UNKNOWN/NOTCOLLECTED/INVALID-9 (M)
Based upon 1607370 valid cases out of 1607375 total cases.
PRINCIPAL SOURCE OF REFERRALPSOURCE
64-65 (width: 2; decimal: 0)Location:
numericVariable Type:
-9Range of Missing Values (M):
Describes the person or agency referring the client to theQuestion:
alcohol or drug abuse treatment program:
- INDIVIDUAL (INCLUDES SELF-REFERRAL): Includes the client,
- 27301 -
- 40 -
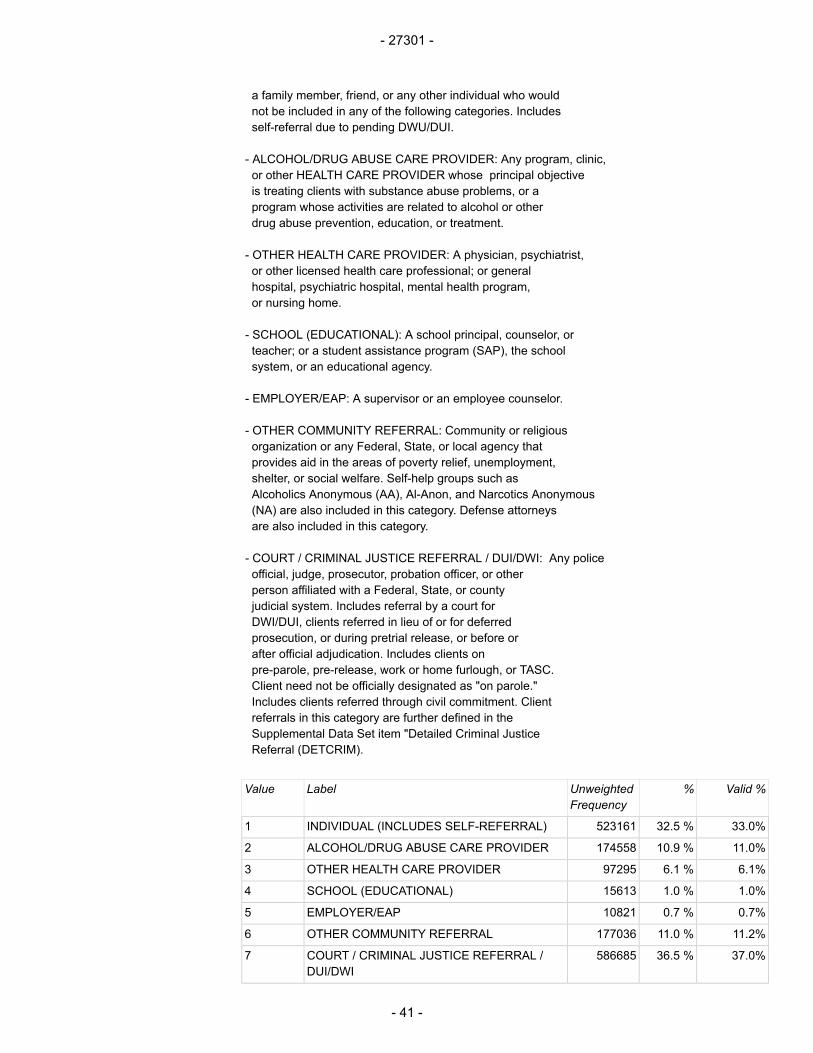
a family member, friend, or any other individual who wouldnot be included in any of the following categories. Includesself-referral due to pending DWU/DUI.
- ALCOHOL/DRUG ABUSE CARE PROVIDER: Any program, clinic,or other HEALTH CARE PROVIDER whose principal objectiveis treating clients with substance abuse problems, or aprogram whose activities are related to alcohol or otherdrug abuse prevention, education, or treatment.
- OTHER HEALTH CARE PROVIDER: A physician, psychiatrist,or other licensed health care professional; or generalhospital, psychiatric hospital, mental health program,or nursing home.
- SCHOOL (EDUCATIONAL): A school principal, counselor, orteacher; or a student assistance program (SAP), the schoolsystem, or an educational agency.
- EMPLOYER/EAP: A supervisor or an employee counselor.
- OTHER COMMUNITY REFERRAL: Community or religiousorganization or any Federal, State, or local agency thatprovides aid in the areas of poverty relief, unemployment,shelter, or social welfare. Self-help groups such asAlcoholics Anonymous (AA), Al-Anon, and Narcotics Anonymous(NA) are also included in this category. Defense attorneysare also included in this category.
- COURT / CRIMINAL JUSTICE REFERRAL / DUI/DWI: Any policeofficial, judge, prosecutor, probation officer, or otherperson affiliated with a Federal, State, or countyjudicial system. Includes referral by a court forDWI/DUI, clients referred in lieu of or for deferredprosecution, or during pretrial release, or before orafter official adjudication. Includes clients onpre-parole, pre-release, work or home furlough, or TASC.Client need not be officially designated as "on parole."Includes clients referred through civil commitment. Clientreferrals in this category are further defined in theSupplemental Data Set item "Detailed Criminal JusticeReferral (DETCRIM).
Valid %%UnweightedFrequency
LabelValue
33.0%32.5 %523161INDIVIDUAL (INCLUDES SELF-REFERRAL)1
11.0%10.9 %174558ALCOHOL/DRUG ABUSE CARE PROVIDER2
6.1%6.1 %97295OTHER HEALTH CARE PROVIDER3
1.0%1.0 %15613SCHOOL (EDUCATIONAL)4
0.7%0.7 %10821EMPLOYER/EAP5
11.2%11.0 %177036OTHER COMMUNITY REFERRAL6
37.0%36.5 %586685COURT / CRIMINAL JUSTICE REFERRAL /DUI/DWI
7
- 27301 -
- 41 -
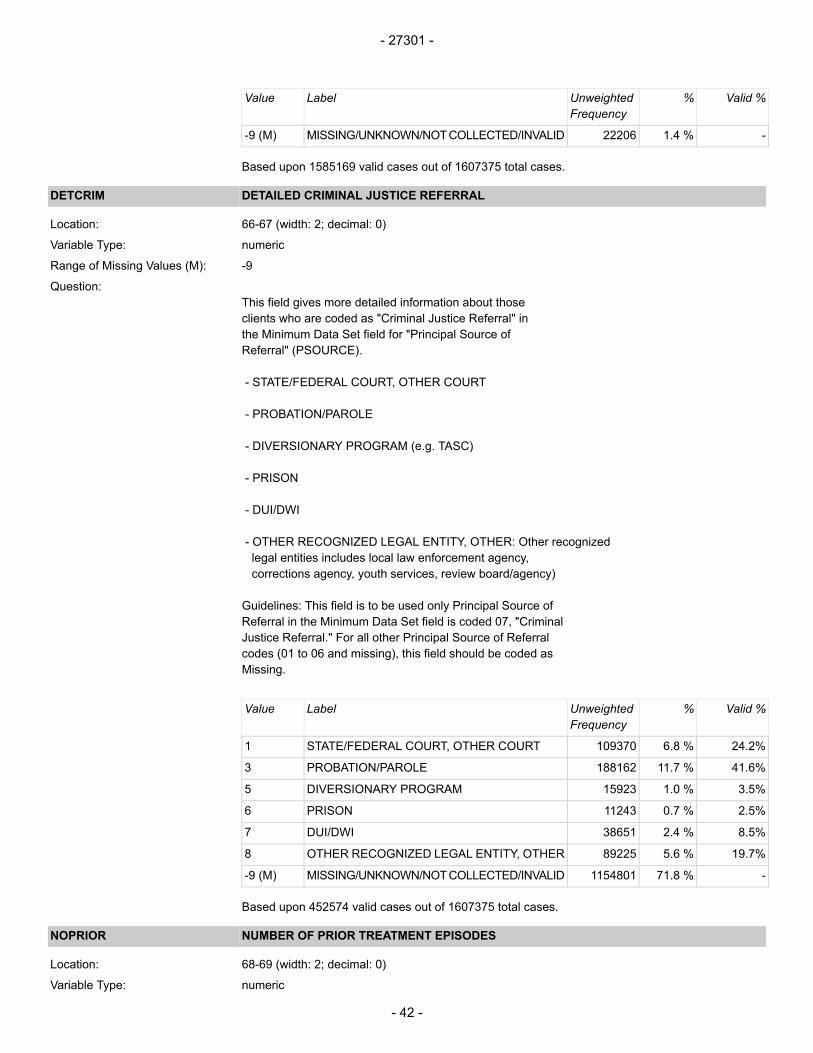
Valid %%UnweightedFrequency
LabelValue
-1.4 %22206MISSING/UNKNOWN/NOTCOLLECTED/INVALID-9 (M)
Based upon 1585169 valid cases out of 1607375 total cases.
DETAILED CRIMINAL JUSTICE REFERRALDETCRIM
66-67 (width: 2; decimal: 0)Location:
numericVariable Type:
-9Range of Missing Values (M):
This field gives more detailed information about thoseQuestion:
clients who are coded as "Criminal Justice Referral" inthe Minimum Data Set field for "Principal Source ofReferral" (PSOURCE).
- STATE/FEDERAL COURT, OTHER COURT
- PROBATION/PAROLE
- DIVERSIONARY PROGRAM (e.g. TASC)
- PRISON
- DUI/DWI
- OTHER RECOGNIZED LEGAL ENTITY, OTHER: Other recognizedlegal entities includes local law enforcement agency,corrections agency, youth services, review board/agency)
Guidelines: This field is to be used only Principal Source ofReferral in the Minimum Data Set field is coded 07, "CriminalJustice Referral." For all other Principal Source of Referralcodes (01 to 06 and missing), this field should be coded asMissing.
Valid %%UnweightedFrequency
LabelValue
24.2%6.8 %109370STATE/FEDERAL COURT, OTHER COURT1
41.6%11.7 %188162PROBATION/PAROLE3
3.5%1.0 %15923DIVERSIONARY PROGRAM5
2.5%0.7 %11243PRISON6
8.5%2.4 %38651DUI/DWI7
19.7%5.6 %89225OTHER RECOGNIZED LEGAL ENTITY, OTHER8
-71.8 %1154801MISSING/UNKNOWN/NOTCOLLECTED/INVALID-9 (M)
Based upon 452574 valid cases out of 1607375 total cases.
NUMBER OF PRIOR TREATMENT EPISODESNOPRIOR
68-69 (width: 2; decimal: 0)Location:
numericVariable Type:
- 27301 -
- 42 -
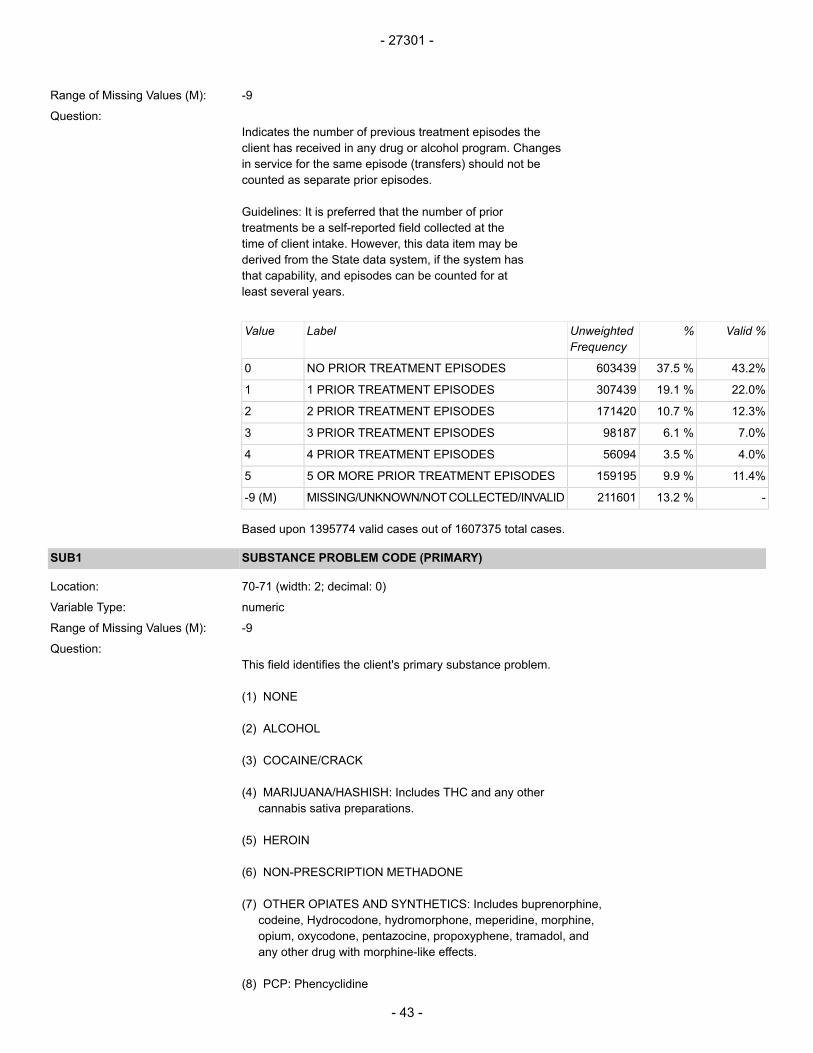
-9Range of Missing Values (M):
Indicates the number of previous treatment episodes theQuestion:
client has received in any drug or alcohol program. Changesin service for the same episode (transfers) should not becounted as separate prior episodes.
Guidelines: It is preferred that the number of priortreatments be a self-reported field collected at thetime of client intake. However, this data item may bederived from the State data system, if the system hasthat capability, and episodes can be counted for atleast several years.
Valid %%UnweightedFrequency
LabelValue
43.2%37.5 %603439NO PRIOR TREATMENT EPISODES0
22.0%19.1 %3074391 PRIOR TREATMENT EPISODES1
12.3%10.7 %1714202 PRIOR TREATMENT EPISODES2
7.0%6.1 %981873 PRIOR TREATMENT EPISODES3
4.0%3.5 %560944 PRIOR TREATMENT EPISODES4
11.4%9.9 %1591955 OR MORE PRIOR TREATMENT EPISODES5
-13.2 %211601MISSING/UNKNOWN/NOTCOLLECTED/INVALID-9 (M)
Based upon 1395774 valid cases out of 1607375 total cases.
SUBSTANCE PROBLEM CODE (PRIMARY)SUB1
70-71 (width: 2; decimal: 0)Location:
numericVariable Type:
-9Range of Missing Values (M):
This field identifies the client's primary substance problem.Question:
(1) NONE
(2) ALCOHOL
(3) COCAINE/CRACK
(4) MARIJUANA/HASHISH: Includes THC and any othercannabis sativa preparations.
(5) HEROIN
(6) NON-PRESCRIPTION METHADONE
(7) OTHER OPIATES AND SYNTHETICS: Includes buprenorphine,codeine, Hydrocodone, hydromorphone, meperidine, morphine,opium, oxycodone, pentazocine, propoxyphene, tramadol, andany other drug with morphine-like effects.
(8) PCP: Phencyclidine
- 27301 -
- 43 -
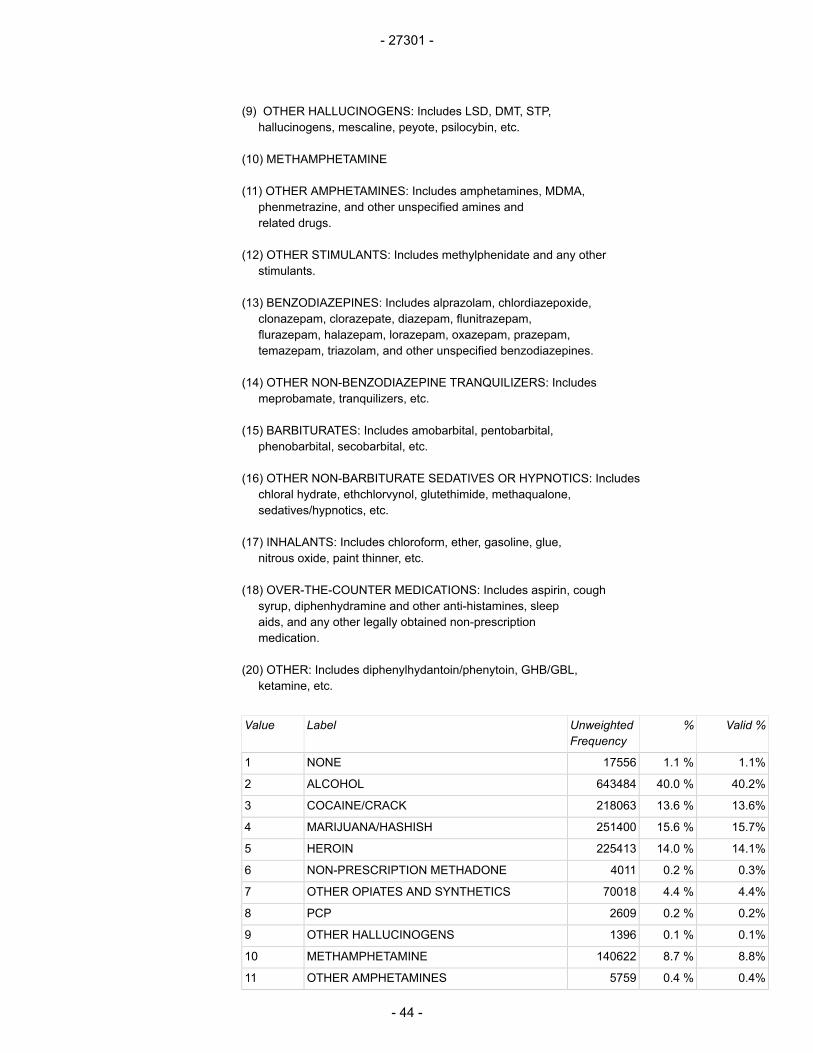
(9) OTHER HALLUCINOGENS: Includes LSD, DMT, STP,hallucinogens, mescaline, peyote, psilocybin, etc.
(10) METHAMPHETAMINE
(11) OTHER AMPHETAMINES: Includes amphetamines, MDMA,phenmetrazine, and other unspecified amines andrelated drugs.
(12) OTHER STIMULANTS: Includes methylphenidate and any otherstimulants.
(13) BENZODIAZEPINES: Includes alprazolam, chlordiazepoxide,clonazepam, clorazepate, diazepam, flunitrazepam,flurazepam, halazepam, lorazepam, oxazepam, prazepam,temazepam, triazolam, and other unspecified benzodiazepines.
(14) OTHER NON-BENZODIAZEPINE TRANQUILIZERS: Includesmeprobamate, tranquilizers, etc.
(15) BARBITURATES: Includes amobarbital, pentobarbital,phenobarbital, secobarbital, etc.
(16) OTHER NON-BARBITURATE SEDATIVES OR HYPNOTICS: Includeschloral hydrate, ethchlorvynol, glutethimide, methaqualone,sedatives/hypnotics, etc.
(17) INHALANTS: Includes chloroform, ether, gasoline, glue,nitrous oxide, paint thinner, etc.
(18) OVER-THE-COUNTER MEDICATIONS: Includes aspirin, coughsyrup, diphenhydramine and other anti-histamines, sleepaids, and any other legally obtained non-prescriptionmedication.
(20) OTHER: Includes diphenylhydantoin/phenytoin, GHB/GBL,ketamine, etc.
Valid %%UnweightedFrequency
LabelValue
1.1%1.1 %17556NONE1
40.2%40.0 %643484ALCOHOL2
13.6%13.6 %218063COCAINE/CRACK3
15.7%15.6 %251400MARIJUANA/HASHISH4
14.1%14.0 %225413HEROIN5
0.3%0.2 %4011NON-PRESCRIPTION METHADONE6
4.4%4.4 %70018OTHER OPIATES AND SYNTHETICS7
0.2%0.2 %2609PCP8
0.1%0.1 %1396OTHER HALLUCINOGENS9
8.8%8.7 %140622METHAMPHETAMINE10
0.4%0.4 %5759OTHER AMPHETAMINES11
- 27301 -
- 44 -
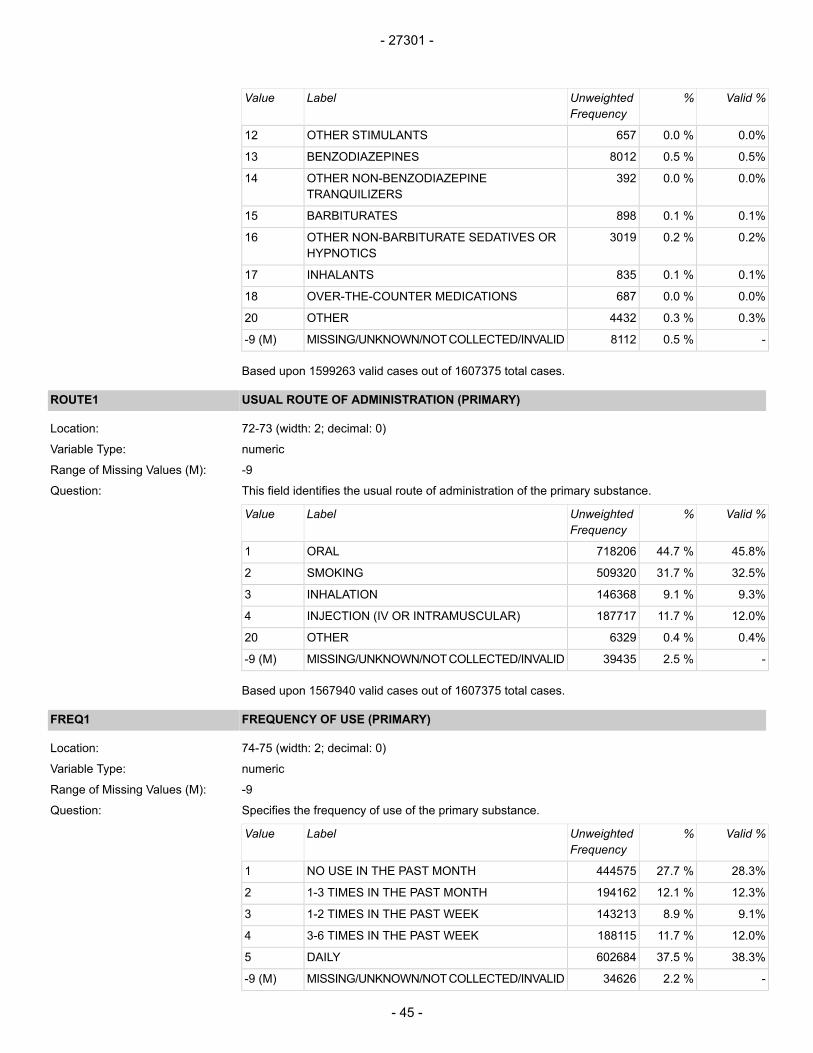
Valid %%UnweightedFrequency
LabelValue
0.0%0.0 %657OTHER STIMULANTS12
0.5%0.5 %8012BENZODIAZEPINES13
0.0%0.0 %392OTHER NON-BENZODIAZEPINETRANQUILIZERS
14
0.1%0.1 %898BARBITURATES15
0.2%0.2 %3019OTHER NON-BARBITURATE SEDATIVES ORHYPNOTICS
16
0.1%0.1 %835INHALANTS17
0.0%0.0 %687OVER-THE-COUNTER MEDICATIONS18
0.3%0.3 %4432OTHER20
-0.5 %8112MISSING/UNKNOWN/NOTCOLLECTED/INVALID-9 (M)
Based upon 1599263 valid cases out of 1607375 total cases.
USUAL ROUTE OF ADMINISTRATION (PRIMARY)ROUTE1
72-73 (width: 2; decimal: 0)Location:
numericVariable Type:
-9Range of Missing Values (M):
This field identifies the usual route of administration of the primary substance.Question:
Valid %%UnweightedFrequency
LabelValue
45.8%44.7 %718206ORAL1
32.5%31.7 %509320SMOKING2
9.3%9.1 %146368INHALATION3
12.0%11.7 %187717INJECTION (IV OR INTRAMUSCULAR)4
0.4%0.4 %6329OTHER20
-2.5 %39435MISSING/UNKNOWN/NOTCOLLECTED/INVALID-9 (M)
Based upon 1567940 valid cases out of 1607375 total cases.
FREQUENCY OF USE (PRIMARY)FREQ1
74-75 (width: 2; decimal: 0)Location:
numericVariable Type:
-9Range of Missing Values (M):
Specifies the frequency of use of the primary substance.Question:
Valid %%UnweightedFrequency
LabelValue
28.3%27.7 %444575NO USE IN THE PAST MONTH1
12.3%12.1 %1941621-3 TIMES IN THE PAST MONTH2
9.1%8.9 %1432131-2 TIMES IN THE PAST WEEK3
12.0%11.7 %1881153-6 TIMES IN THE PAST WEEK4
38.3%37.5 %602684DAILY5
-2.2 %34626MISSING/UNKNOWN/NOTCOLLECTED/INVALID-9 (M)
- 27301 -
- 45 -

Based upon 1572749 valid cases out of 1607375 total cases.
AGE AT FIRST USE (PRIMARY)FRSTUSE1
76-77 (width: 2; decimal: 0)Location:
numericVariable Type:
-9Range of Missing Values (M):
For drugs other than alcohol, this field identifies the age at which the client first used the substanceidentified as the primary substance. For alcohol, this field records the age of the first intoxication.
Question:
Valid %%UnweightedFrequency
LabelValue
7.4%7.3 %11694411 AND UNDER1
22.6%22.1 %35451412-142
28.3%27.7 %44523715-173
17.0%16.7 %26773118-204
9.4%9.2 %14730621-245
6.7%6.5 %10479525-296
3.8%3.7 %6007530-347
2.4%2.3 %3716135-398
1.3%1.3 %2069940-449
0.7%0.6 %1031545-4910
0.3%0.2 %401450-5411
0.1%0.1 %209355 AND OVER12
-2.3 %36491MISSING/UNKNOWN/NOTCOLLECTED/INVALID-9 (M)
Based upon 1570884 valid cases out of 1607375 total cases.
SUBSTANCE PROBLEM CODE (SECONDARY)SUB2
78-79 (width: 2; decimal: 0)Location:
numericVariable Type:
-9Range of Missing Values (M):
This field identifies the client's secondary substance problem.Question:
(1) NONE
(2) ALCOHOL
(3) COCAINE/CRACK
(4) MARIJUANA/HASHISH: Includes THC and any othercannabis sativa preparations.
(5) HEROIN
(6) NON-PRESCRIPTION METHADONE
(7) OTHER OPIATES AND SYNTHETICS: Includes buprenorphine,codeine, Hydrocodone, hydromorphone, meperidine, morphine,
- 27301 -
- 46 -
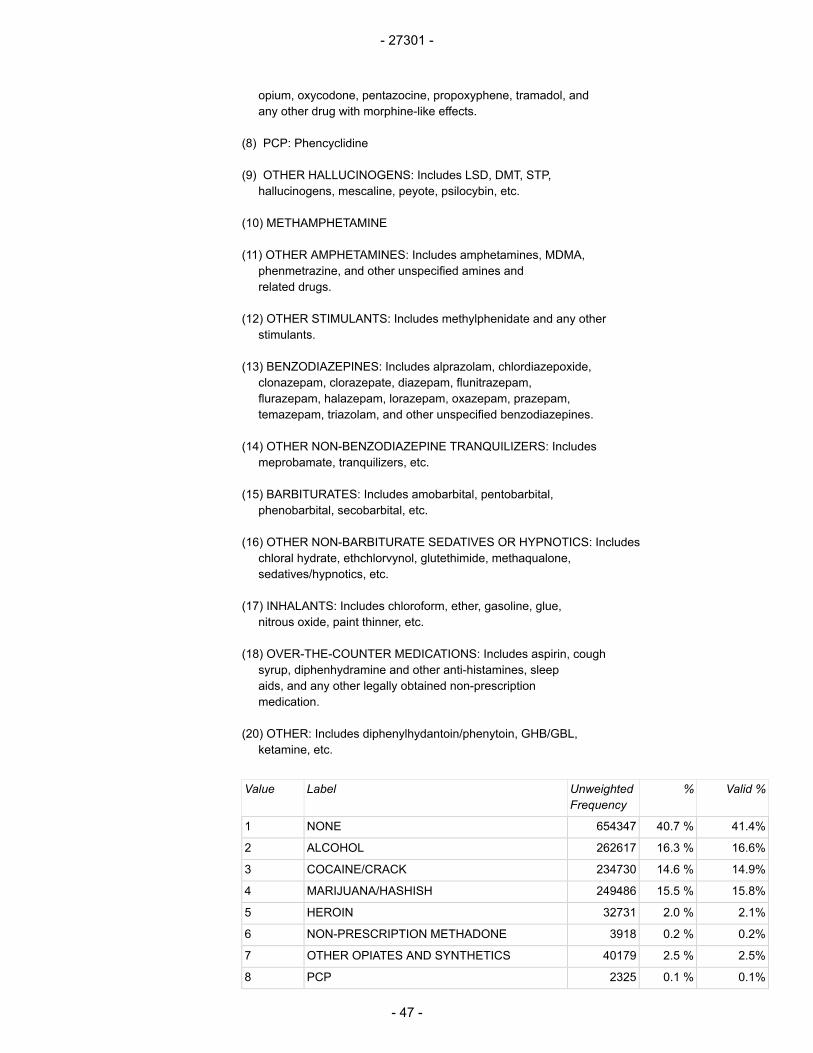
opium, oxycodone, pentazocine, propoxyphene, tramadol, andany other drug with morphine-like effects.
(8) PCP: Phencyclidine
(9) OTHER HALLUCINOGENS: Includes LSD, DMT, STP,hallucinogens, mescaline, peyote, psilocybin, etc.
(10) METHAMPHETAMINE
(11) OTHER AMPHETAMINES: Includes amphetamines, MDMA,phenmetrazine, and other unspecified amines andrelated drugs.
(12) OTHER STIMULANTS: Includes methylphenidate and any otherstimulants.
(13) BENZODIAZEPINES: Includes alprazolam, chlordiazepoxide,clonazepam, clorazepate, diazepam, flunitrazepam,flurazepam, halazepam, lorazepam, oxazepam, prazepam,temazepam, triazolam, and other unspecified benzodiazepines.
(14) OTHER NON-BENZODIAZEPINE TRANQUILIZERS: Includesmeprobamate, tranquilizers, etc.
(15) BARBITURATES: Includes amobarbital, pentobarbital,phenobarbital, secobarbital, etc.
(16) OTHER NON-BARBITURATE SEDATIVES OR HYPNOTICS: Includeschloral hydrate, ethchlorvynol, glutethimide, methaqualone,sedatives/hypnotics, etc.
(17) INHALANTS: Includes chloroform, ether, gasoline, glue,nitrous oxide, paint thinner, etc.
(18) OVER-THE-COUNTER MEDICATIONS: Includes aspirin, coughsyrup, diphenhydramine and other anti-histamines, sleepaids, and any other legally obtained non-prescriptionmedication.
(20) OTHER: Includes diphenylhydantoin/phenytoin, GHB/GBL,ketamine, etc.
Valid %%UnweightedFrequency
LabelValue
41.4%40.7 %654347NONE1
16.6%16.3 %262617ALCOHOL2
14.9%14.6 %234730COCAINE/CRACK3
15.8%15.5 %249486MARIJUANA/HASHISH4
2.1%2.0 %32731HEROIN5
0.2%0.2 %3918NON-PRESCRIPTION METHADONE6
2.5%2.5 %40179OTHER OPIATES AND SYNTHETICS7
0.1%0.1 %2325PCP8
- 27301 -
- 47 -

Valid %%UnweightedFrequency
LabelValue
0.2%0.2 %3136OTHER HALLUCINOGENS9
3.0%2.9 %46851METHAMPHETAMINE10
0.4%0.4 %6402OTHER AMPHETAMINES11
0.1%0.1 %1295OTHER STIMULANTS12
1.4%1.3 %21332BENZODIAZEPINES13
0.0%0.0 %733OTHER NON-BENZODIAZEPINETRANQUILIZERS
14
0.1%0.1 %1272BARBITURATES15
0.4%0.4 %6018OTHER NON-BARBITURATE SEDATIVES ORHYPNOTICS
16
0.0%0.0 %757INHALANTS17
0.1%0.1 %1032OVER-THE-COUNTER MEDICATIONS18
0.7%0.6 %10326OTHER20
-1.7 %27888MISSING/UNKNOWN/NOTCOLLECTED/INVALID-9 (M)
Based upon 1579487 valid cases out of 1607375 total cases.
USUAL ROUTE OF ADMINISTRATION (SECONDARY)ROUTE2
80-81 (width: 2; decimal: 0)Location:
numericVariable Type:
-9Range of Missing Values (M):
This field identifies the usual route of administration of the secondary substance.Question:
Valid %%UnweightedFrequency
LabelValue
37.3%21.3 %343049ORAL1
44.7%25.6 %411589SMOKING2
10.8%6.2 %99423INHALATION3
6.6%3.8 %60597INJECTION (IV OR INTRAMUSCULAR)4
0.6%0.3 %5344OTHER20
-42.8 %687373MISSING/UNKNOWN/NOTCOLLECTED/INVALID-9 (M)
Based upon 920002 valid cases out of 1607375 total cases.
FREQUENCY OF USE (SECONDARY)FREQ2
82-83 (width: 2; decimal: 0)Location:
numericVariable Type:
-9Range of Missing Values (M):
Specifies the frequency of use of the secondary substance.Question:
Valid %%UnweightedFrequency
LabelValue
36.2%20.7 %332614NO USE IN THE PAST MONTH1
16.0%9.1 %1468411-3 TIMES IN THE PAST MONTH2
10.9%6.2 %998071-2 TIMES IN THE PAST WEEK3
- 27301 -
- 48 -

Valid %%UnweightedFrequency
LabelValue
10.8%6.2 %996053-6 TIMES IN THE PAST WEEK4
26.2%15.0 %240663DAILY5
-42.8 %687845MISSING/UNKNOWN/NOTCOLLECTED/INVALID-9 (M)
Based upon 919530 valid cases out of 1607375 total cases.
AGE AT FIRST USE (SECONDARY)FRSTUSE2
84-85 (width: 2; decimal: 0)Location:
numericVariable Type:
-9Range of Missing Values (M):
For drugs other than alcohol, this field identifies the age at which the client first used the substanceidentified as the secondary substance. For alcohol, this field records the age of the first intoxication.
Question:
Valid %%UnweightedFrequency
LabelValue
7.3%4.1 %6576511 AND UNDER1
23.9%13.4 %21464512-142
28.5%15.9 %25609115-173
15.8%8.8 %14190318-204
8.8%4.9 %7884121-245
6.6%3.7 %5940125-296
3.8%2.1 %3413130-347
2.5%1.4 %2216435-398
1.5%0.8 %1363940-449
0.8%0.5 %731845-4910
0.4%0.2 %321450-5411
0.2%0.1 %152655 AND OVER12
-44.1 %708737MISSING/UNKNOWN/NOTCOLLECTED/INVALID-9 (M)
Based upon 898638 valid cases out of 1607375 total cases.
SUBSTANCE PROBLEM CODE (TERTIARY)SUB3
86-87 (width: 2; decimal: 0)Location:
numericVariable Type:
-9Range of Missing Values (M):
This field identifies the client's tertiary substance problem.Question:
(1) NONE
(2) ALCOHOL
(3) COCAINE/CRACK
(4) MARIJUANA/HASHISH: Includes THC and any othercannabis sativa preparations.
- 27301 -
- 49 -
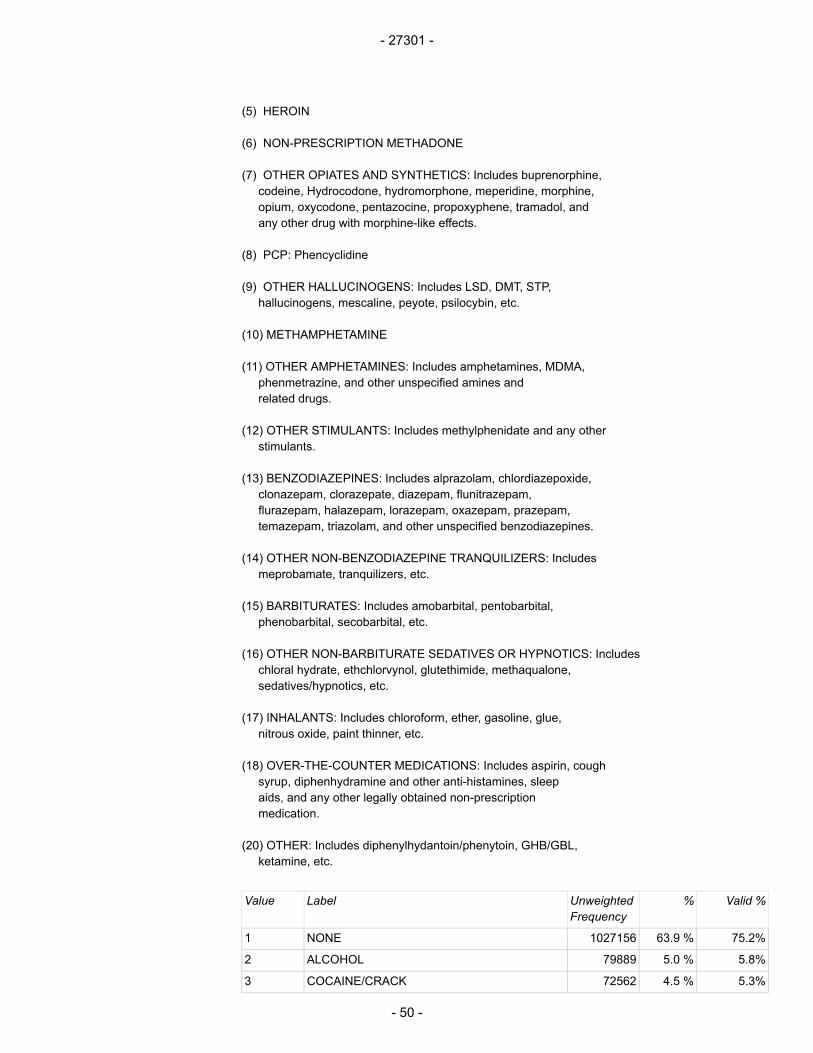
(5) HEROIN
(6) NON-PRESCRIPTION METHADONE
(7) OTHER OPIATES AND SYNTHETICS: Includes buprenorphine,codeine, Hydrocodone, hydromorphone, meperidine, morphine,opium, oxycodone, pentazocine, propoxyphene, tramadol, andany other drug with morphine-like effects.
(8) PCP: Phencyclidine
(9) OTHER HALLUCINOGENS: Includes LSD, DMT, STP,hallucinogens, mescaline, peyote, psilocybin, etc.
(10) METHAMPHETAMINE
(11) OTHER AMPHETAMINES: Includes amphetamines, MDMA,phenmetrazine, and other unspecified amines andrelated drugs.
(12) OTHER STIMULANTS: Includes methylphenidate and any otherstimulants.
(13) BENZODIAZEPINES: Includes alprazolam, chlordiazepoxide,clonazepam, clorazepate, diazepam, flunitrazepam,flurazepam, halazepam, lorazepam, oxazepam, prazepam,temazepam, triazolam, and other unspecified benzodiazepines.
(14) OTHER NON-BENZODIAZEPINE TRANQUILIZERS: Includesmeprobamate, tranquilizers, etc.
(15) BARBITURATES: Includes amobarbital, pentobarbital,phenobarbital, secobarbital, etc.
(16) OTHER NON-BARBITURATE SEDATIVES OR HYPNOTICS: Includeschloral hydrate, ethchlorvynol, glutethimide, methaqualone,sedatives/hypnotics, etc.
(17) INHALANTS: Includes chloroform, ether, gasoline, glue,nitrous oxide, paint thinner, etc.
(18) OVER-THE-COUNTER MEDICATIONS: Includes aspirin, coughsyrup, diphenhydramine and other anti-histamines, sleepaids, and any other legally obtained non-prescriptionmedication.
(20) OTHER: Includes diphenylhydantoin/phenytoin, GHB/GBL,ketamine, etc.
Valid %%UnweightedFrequency
LabelValue
75.2%63.9 %1027156NONE1
5.8%5.0 %79889ALCOHOL2
5.3%4.5 %72562COCAINE/CRACK3
- 27301 -
- 50 -
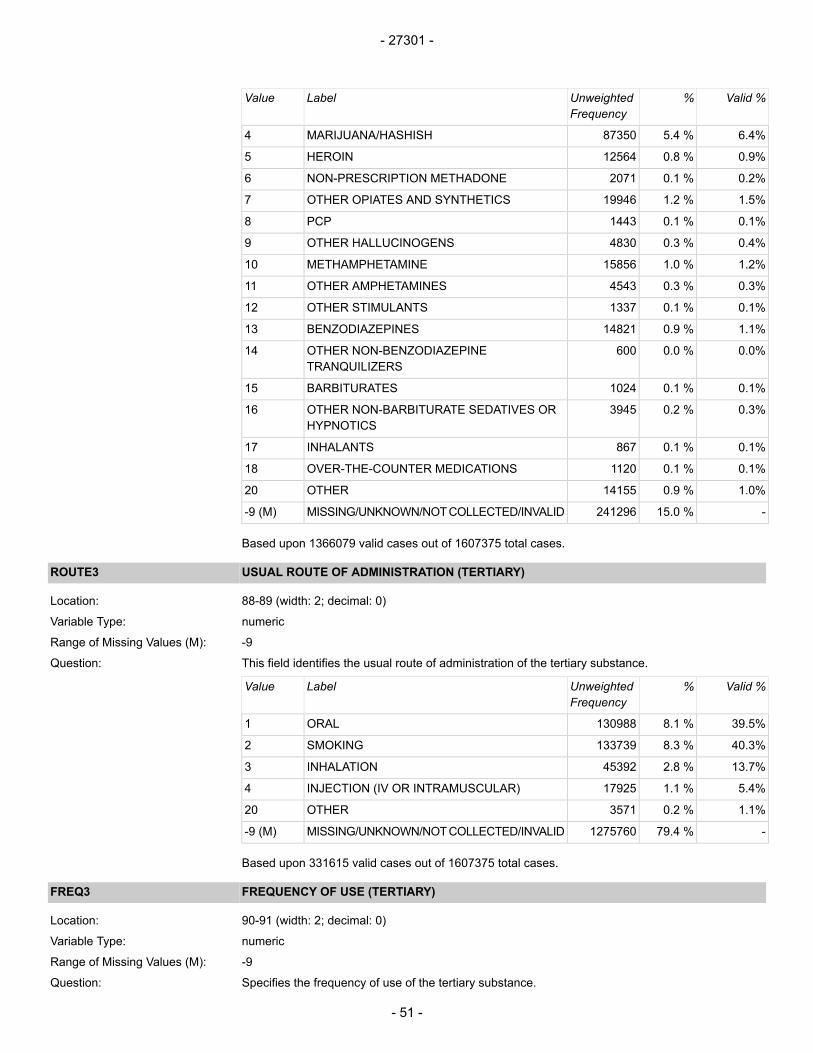
Valid %%UnweightedFrequency
LabelValue
6.4%5.4 %87350MARIJUANA/HASHISH4
0.9%0.8 %12564HEROIN5
0.2%0.1 %2071NON-PRESCRIPTION METHADONE6
1.5%1.2 %19946OTHER OPIATES AND SYNTHETICS7
0.1%0.1 %1443PCP8
0.4%0.3 %4830OTHER HALLUCINOGENS9
1.2%1.0 %15856METHAMPHETAMINE10
0.3%0.3 %4543OTHER AMPHETAMINES11
0.1%0.1 %1337OTHER STIMULANTS12
1.1%0.9 %14821BENZODIAZEPINES13
0.0%0.0 %600OTHER NON-BENZODIAZEPINETRANQUILIZERS
14
0.1%0.1 %1024BARBITURATES15
0.3%0.2 %3945OTHER NON-BARBITURATE SEDATIVES ORHYPNOTICS
16
0.1%0.1 %867INHALANTS17
0.1%0.1 %1120OVER-THE-COUNTER MEDICATIONS18
1.0%0.9 %14155OTHER20
-15.0 %241296MISSING/UNKNOWN/NOTCOLLECTED/INVALID-9 (M)
Based upon 1366079 valid cases out of 1607375 total cases.
USUAL ROUTE OF ADMINISTRATION (TERTIARY)ROUTE3
88-89 (width: 2; decimal: 0)Location:
numericVariable Type:
-9Range of Missing Values (M):
This field identifies the usual route of administration of the tertiary substance.Question:
Valid %%UnweightedFrequency
LabelValue
39.5%8.1 %130988ORAL1
40.3%8.3 %133739SMOKING2
13.7%2.8 %45392INHALATION3
5.4%1.1 %17925INJECTION (IV OR INTRAMUSCULAR)4
1.1%0.2 %3571OTHER20
-79.4 %1275760MISSING/UNKNOWN/NOTCOLLECTED/INVALID-9 (M)
Based upon 331615 valid cases out of 1607375 total cases.
FREQUENCY OF USE (TERTIARY)FREQ3
90-91 (width: 2; decimal: 0)Location:
numericVariable Type:
-9Range of Missing Values (M):
Specifies the frequency of use of the tertiary substance.Question:
- 27301 -
- 51 -

Valid %%UnweightedFrequency
LabelValue
41.6%8.7 %139869NO USE IN THE PAST MONTH1
15.6%3.3 %523821-3 TIMES IN THE PAST MONTH2
9.9%2.1 %334291-2 TIMES IN THE PAST WEEK3
9.0%1.9 %302753-6 TIMES IN THE PAST WEEK4
24.0%5.0 %80625DAILY5
-79.1 %1270795MISSING/UNKNOWN/NOTCOLLECTED/INVALID-9 (M)
Based upon 336580 valid cases out of 1607375 total cases.
AGE AT FIRST USE (TERTIARY)FRSTUSE3
92-93 (width: 2; decimal: 0)Location:
numericVariable Type:
-9Range of Missing Values (M):
For drugs other than alcohol, this field identifies the age at which the client first used the substanceidentified as the tertiary substance. For alcohol, this field records the age of the first intoxication.
Question:
Valid %%UnweightedFrequency
LabelValue
8.9%1.8 %2945711 AND UNDER1
24.4%5.0 %8089012-142
28.7%5.9 %9482515-173
15.8%3.2 %5218418-204
8.0%1.7 %2655221-245
6.0%1.2 %1973925-296
3.4%0.7 %1139930-347
2.3%0.5 %747435-398
1.4%0.3 %462240-449
0.7%0.1 %235145-4910
0.3%0.1 %101750-5411
0.1%0.0 %34255 AND OVER12
-79.4 %1276523MISSING/UNKNOWN/NOTCOLLECTED/INVALID-9 (M)
Based upon 330852 valid cases out of 1607375 total cases.
NUMBER OF SUBSTANCES REPORTED AT ADM.NUMSUBS
94-95 (width: 2; decimal: 0)Location:
numericVariable Type:
Calculates the number of substances (maximum of 3) reported at admission from primary, secondary,and tertiary substances of abuse (SUB1, SUB2 and SUB3).
Question:
Valid %%UnweightedFrequency
Value
1.5%1.5 %243150
40.7%40.7 %6534431
37.1%37.1 %5965242
- 27301 -
- 52 -

Valid %%UnweightedFrequency
Value
20.7%20.7 %3330933
Based upon 1607375 valid cases out of 1607375 total cases.
CURRENT IV DRUG USE REPORTED AT ADM.IDU
96-97 (width: 2; decimal: 0)Location:
numericVariable Type:
-9 , -8Range of Missing Values (M):
Flags record if injection was reported as primary, secondary, or tertiary route of administration.Question:
Valid %%UnweightedFrequency
LabelValue
86.0%84.7 %1361492NO IDU REPORTED0
14.0%13.8 %221568IDU REPORTED1
-1.5 %24315NO SUBSTANCES REPORTED-8 (M)
Based upon 1583060 valid cases out of 1607375 total cases.
ALCOHOL REPORTED AT ADM.ALCFLG
98-98 (width: 1; decimal: 0)Location:
numericVariable Type:
Flags record if alcohol was reported as the primary, secondary, or tertiary substance of abuse at thetime of admission.
Question:
Valid %%UnweightedFrequency
LabelValue
38.7%38.7 %622558SUBSTANCE NOT REPORTED0
61.3%61.3 %984817SUBSTANCE REPORTED1
Based upon 1607375 valid cases out of 1607375 total cases.
COCAINE/CRACK REPORTED AT ADM.COKEFLG
99-99 (width: 1; decimal: 0)Location:
numericVariable Type:
Flags record if cocaine or crack was reported as the primary, secondary, or tertiary substance ofabuse at the time of admission.
Question:
Valid %%UnweightedFrequency
LabelValue
68.2%68.2 %1096079SUBSTANCE NOT REPORTED0
31.8%31.8 %511296SUBSTANCE REPORTED1
Based upon 1607375 valid cases out of 1607375 total cases.
MARIJUANA/HASHISH REPORTED AT ADM.MARFLG
100-100 (width: 1; decimal: 0)Location:
numericVariable Type:
- 27301 -
- 53 -

Flags record if marijuana or hashish were reported as the primary, secondary, or tertiary substanceof abuse at the time of admission.
Question:
Valid %%UnweightedFrequency
LabelValue
63.4%63.4 %1019763SUBSTANCE NOT REPORTED0
36.6%36.6 %587612SUBSTANCE REPORTED1
Based upon 1607375 valid cases out of 1607375 total cases.
HEROIN REPORTED AT ADM.HERFLG
101-101 (width: 1; decimal: 0)Location:
numericVariable Type:
Flags record if heroin was reported as the primary, secondary, or tertiary substance of abuse at thetime of admission.
Question:
Valid %%UnweightedFrequency
LabelValue
83.2%83.2 %1336795SUBSTANCE NOT REPORTED0
16.8%16.8 %270580SUBSTANCE REPORTED1
Based upon 1607375 valid cases out of 1607375 total cases.
NON-RX METHADONE REPORTED AT ADM.METHFLG
102-102 (width: 1; decimal: 0)Location:
numericVariable Type:
Flags record if non-prescription methadone was reported as the primary, secondary, or tertiarysubstance of abuse at the time of admission.
Question:
Valid %%UnweightedFrequency
LabelValue
99.4%99.4 %1597386SUBSTANCE NOT REPORTED0
0.6%0.6 %9989SUBSTANCE REPORTED1
Based upon 1607375 valid cases out of 1607375 total cases.
OTHER OPIATES/SYNTHETICS REPORTED AT ADM.OPSYNFLG
103-103 (width: 1; decimal: 0)Location:
numericVariable Type:
Flags record if other opiates or synthetics were reported as the primary, secondary, or tertiarysubstance of abuse at the time of admission.
Question:
Valid %%UnweightedFrequency
LabelValue
92.1%92.1 %1480558SUBSTANCE NOT REPORTED0
7.9%7.9 %126817SUBSTANCE REPORTED1
Based upon 1607375 valid cases out of 1607375 total cases.
PCP REPORTED AT ADM.PCPFLG
104-104 (width: 1; decimal: 0)Location:
numericVariable Type:
- 27301 -
- 54 -
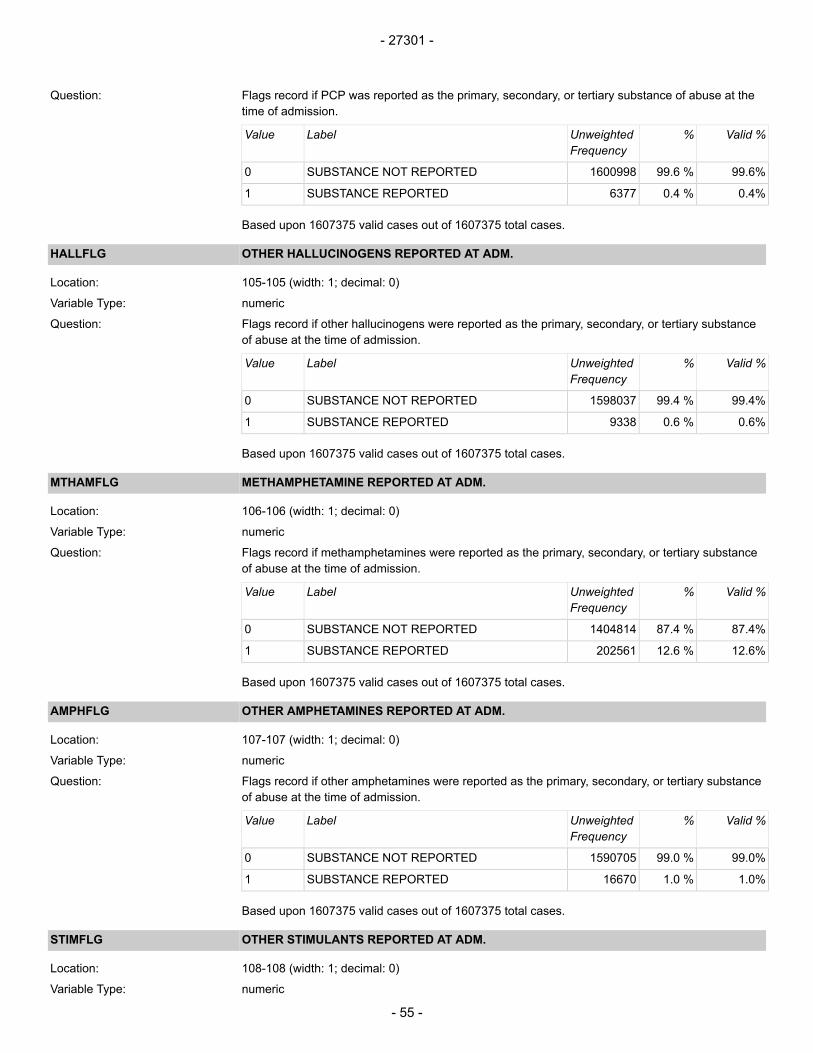
Flags record if PCP was reported as the primary, secondary, or tertiary substance of abuse at thetime of admission.
Question:
Valid %%UnweightedFrequency
LabelValue
99.6%99.6 %1600998SUBSTANCE NOT REPORTED0
0.4%0.4 %6377SUBSTANCE REPORTED1
Based upon 1607375 valid cases out of 1607375 total cases.
OTHER HALLUCINOGENS REPORTED AT ADM.HALLFLG
105-105 (width: 1; decimal: 0)Location:
numericVariable Type:
Flags record if other hallucinogens were reported as the primary, secondary, or tertiary substanceof abuse at the time of admission.
Question:
Valid %%UnweightedFrequency
LabelValue
99.4%99.4 %1598037SUBSTANCE NOT REPORTED0
0.6%0.6 %9338SUBSTANCE REPORTED1
Based upon 1607375 valid cases out of 1607375 total cases.
METHAMPHETAMINE REPORTED AT ADM.MTHAMFLG
106-106 (width: 1; decimal: 0)Location:
numericVariable Type:
Flags record if methamphetamines were reported as the primary, secondary, or tertiary substanceof abuse at the time of admission.
Question:
Valid %%UnweightedFrequency
LabelValue
87.4%87.4 %1404814SUBSTANCE NOT REPORTED0
12.6%12.6 %202561SUBSTANCE REPORTED1
Based upon 1607375 valid cases out of 1607375 total cases.
OTHER AMPHETAMINES REPORTED AT ADM.AMPHFLG
107-107 (width: 1; decimal: 0)Location:
numericVariable Type:
Flags record if other amphetamines were reported as the primary, secondary, or tertiary substanceof abuse at the time of admission.
Question:
Valid %%UnweightedFrequency
LabelValue
99.0%99.0 %1590705SUBSTANCE NOT REPORTED0
1.0%1.0 %16670SUBSTANCE REPORTED1
Based upon 1607375 valid cases out of 1607375 total cases.
OTHER STIMULANTS REPORTED AT ADM.STIMFLG
108-108 (width: 1; decimal: 0)Location:
numericVariable Type:
- 27301 -
- 55 -

Flags record if other stimulants were reported as the primary, secondary, or tertiary substance ofabuse at the time of admission.
Question:
Valid %%UnweightedFrequency
LabelValue
99.8%99.8 %1604088SUBSTANCE NOT REPORTED0
0.2%0.2 %3287SUBSTANCE REPORTED1
Based upon 1607375 valid cases out of 1607375 total cases.
BENZODIAZEPINES REPORTED AT ADM.BENZFLG
109-109 (width: 1; decimal: 0)Location:
numericVariable Type:
Flags record if benzodiazepines were reported as the primary, secondary, or tertiary substance ofabuse at the time of admission.
Question:
Valid %%UnweightedFrequency
LabelValue
97.3%97.3 %1563642SUBSTANCE NOT REPORTED0
2.7%2.7 %43733SUBSTANCE REPORTED1
Based upon 1607375 valid cases out of 1607375 total cases.
OTHER NON-BENZODIAZEPINE TRANQUILIZERS REPORTED AT ADM.TRNQFLG
110-110 (width: 1; decimal: 0)Location:
numericVariable Type:
Flags record if other non-benzodiazepine tranquilizers were reported as the primary, secondary, ortertiary substance of abuse at the time of admission.
Question:
Valid %%UnweightedFrequency
LabelValue
99.9%99.9 %1605650SUBSTANCE NOT REPORTED0
0.1%0.1 %1725SUBSTANCE REPORTED1
Based upon 1607375 valid cases out of 1607375 total cases.
BARBITURATES REPORTED AT ADM.BARBFLG
111-111 (width: 1; decimal: 0)Location:
numericVariable Type:
Flags record if barbiturates were reported as the primary, secondary, or tertiary substance of abuseat the time of admission.
Question:
Valid %%UnweightedFrequency
LabelValue
99.8%99.8 %1604182SUBSTANCE NOT REPORTED0
0.2%0.2 %3193SUBSTANCE REPORTED1
Based upon 1607375 valid cases out of 1607375 total cases.
OTHER NON-BARBITURATE SEDATIVES/HYPNOTICS REPORTED AT ADM.SEDHPFLG
112-112 (width: 1; decimal: 0)Location:
numericVariable Type:
- 27301 -
- 56 -
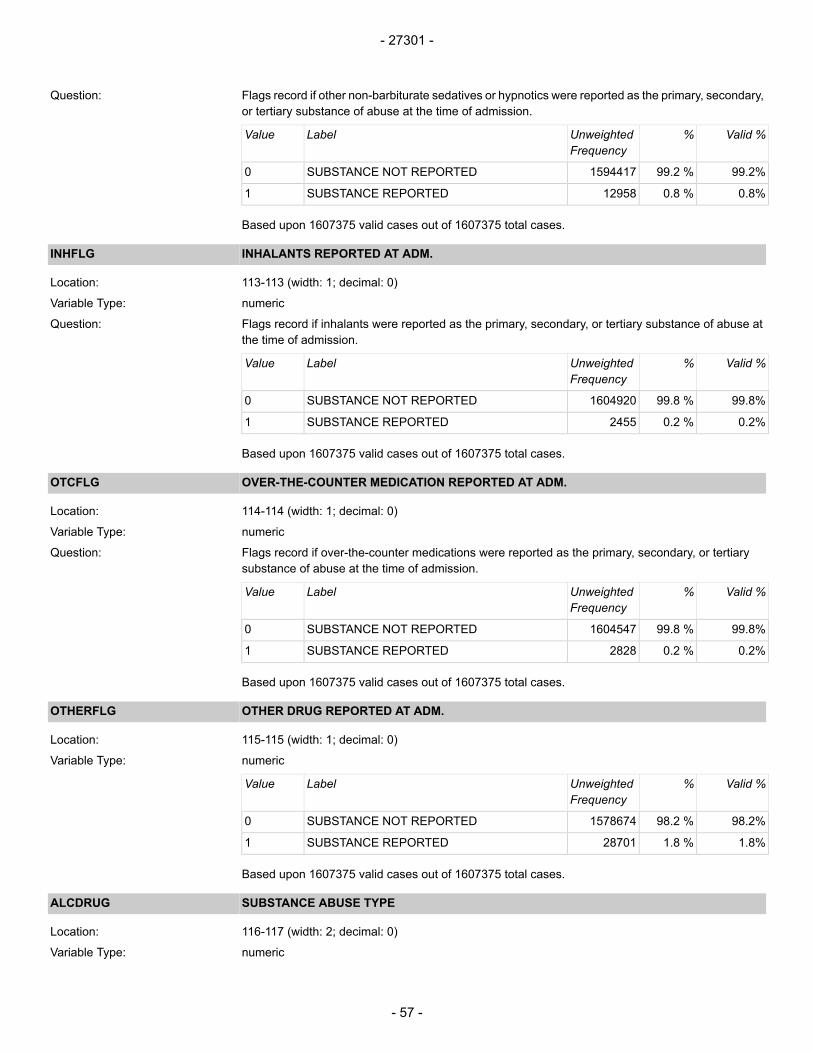
Flags record if other non-barbiturate sedatives or hypnotics were reported as the primary, secondary,or tertiary substance of abuse at the time of admission.
Question:
Valid %%UnweightedFrequency
LabelValue
99.2%99.2 %1594417SUBSTANCE NOT REPORTED0
0.8%0.8 %12958SUBSTANCE REPORTED1
Based upon 1607375 valid cases out of 1607375 total cases.
INHALANTS REPORTED AT ADM.INHFLG
113-113 (width: 1; decimal: 0)Location:
numericVariable Type:
Flags record if inhalants were reported as the primary, secondary, or tertiary substance of abuse atthe time of admission.
Question:
Valid %%UnweightedFrequency
LabelValue
99.8%99.8 %1604920SUBSTANCE NOT REPORTED0
0.2%0.2 %2455SUBSTANCE REPORTED1
Based upon 1607375 valid cases out of 1607375 total cases.
OVER-THE-COUNTER MEDICATION REPORTED AT ADM.OTCFLG
114-114 (width: 1; decimal: 0)Location:
numericVariable Type:
Flags record if over-the-counter medications were reported as the primary, secondary, or tertiarysubstance of abuse at the time of admission.
Question:
Valid %%UnweightedFrequency
LabelValue
99.8%99.8 %1604547SUBSTANCE NOT REPORTED0
0.2%0.2 %2828SUBSTANCE REPORTED1
Based upon 1607375 valid cases out of 1607375 total cases.
OTHER DRUG REPORTED AT ADM.OTHERFLG
115-115 (width: 1; decimal: 0)Location:
numericVariable Type:
Valid %%UnweightedFrequency
LabelValue
98.2%98.2 %1578674SUBSTANCE NOT REPORTED0
1.8%1.8 %28701SUBSTANCE REPORTED1
Based upon 1607375 valid cases out of 1607375 total cases.
SUBSTANCE ABUSE TYPEALCDRUG
116-117 (width: 2; decimal: 0)Location:
numericVariable Type:
- 27301 -
- 57 -
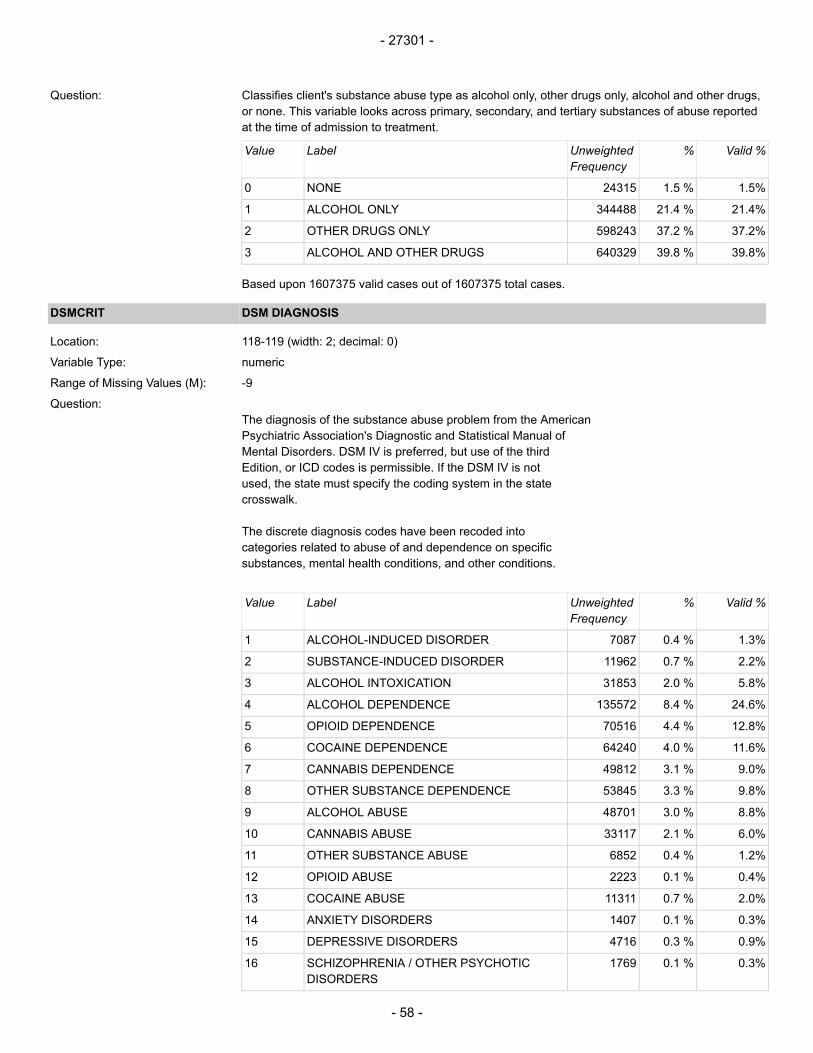
Classifies client's substance abuse type as alcohol only, other drugs only, alcohol and other drugs,or none. This variable looks across primary, secondary, and tertiary substances of abuse reportedat the time of admission to treatment.
Question:
Valid %%UnweightedFrequency
LabelValue
1.5%1.5 %24315NONE0
21.4%21.4 %344488ALCOHOL ONLY1
37.2%37.2 %598243OTHER DRUGS ONLY2
39.8%39.8 %640329ALCOHOL AND OTHER DRUGS3
Based upon 1607375 valid cases out of 1607375 total cases.
DSM DIAGNOSISDSMCRIT
118-119 (width: 2; decimal: 0)Location:
numericVariable Type:
-9Range of Missing Values (M):
The diagnosis of the substance abuse problem from the AmericanQuestion:
Psychiatric Association's Diagnostic and Statistical Manual ofMental Disorders. DSM IV is preferred, but use of the thirdEdition, or ICD codes is permissible. If the DSM IV is notused, the state must specify the coding system in the statecrosswalk.
The discrete diagnosis codes have been recoded intocategories related to abuse of and dependence on specificsubstances, mental health conditions, and other conditions.
Valid %%UnweightedFrequency
LabelValue
1.3%0.4 %7087ALCOHOL-INDUCED DISORDER1
2.2%0.7 %11962SUBSTANCE-INDUCED DISORDER2
5.8%2.0 %31853ALCOHOL INTOXICATION3
24.6%8.4 %135572ALCOHOL DEPENDENCE4
12.8%4.4 %70516OPIOID DEPENDENCE5
11.6%4.0 %64240COCAINE DEPENDENCE6
9.0%3.1 %49812CANNABIS DEPENDENCE7
9.8%3.3 %53845OTHER SUBSTANCE DEPENDENCE8
8.8%3.0 %48701ALCOHOL ABUSE9
6.0%2.1 %33117CANNABIS ABUSE10
1.2%0.4 %6852OTHER SUBSTANCE ABUSE11
0.4%0.1 %2223OPIOID ABUSE12
2.0%0.7 %11311COCAINE ABUSE13
0.3%0.1 %1407ANXIETY DISORDERS14
0.9%0.3 %4716DEPRESSIVE DISORDERS15
0.3%0.1 %1769SCHIZOPHRENIA / OTHER PSYCHOTICDISORDERS
16
- 27301 -
- 58 -
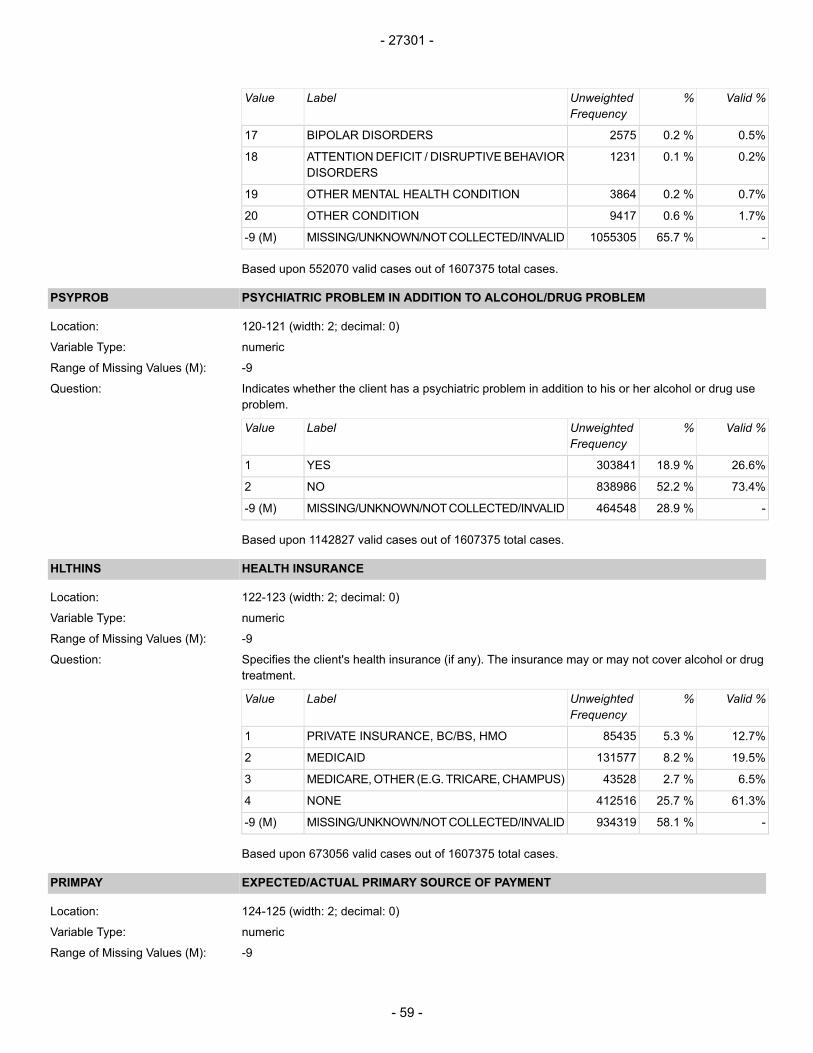
Valid %%UnweightedFrequency
LabelValue
0.5%0.2 %2575BIPOLAR DISORDERS17
0.2%0.1 %1231ATTENTIONDEFICIT / DISRUPTIVE BEHAVIORDISORDERS
18
0.7%0.2 %3864OTHER MENTAL HEALTH CONDITION19
1.7%0.6 %9417OTHER CONDITION20
-65.7 %1055305MISSING/UNKNOWN/NOTCOLLECTED/INVALID-9 (M)
Based upon 552070 valid cases out of 1607375 total cases.
PSYCHIATRIC PROBLEM IN ADDITION TO ALCOHOL/DRUG PROBLEMPSYPROB
120-121 (width: 2; decimal: 0)Location:
numericVariable Type:
-9Range of Missing Values (M):
Indicates whether the client has a psychiatric problem in addition to his or her alcohol or drug useproblem.
Question:
Valid %%UnweightedFrequency
LabelValue
26.6%18.9 %303841YES1
73.4%52.2 %838986NO2
-28.9 %464548MISSING/UNKNOWN/NOTCOLLECTED/INVALID-9 (M)
Based upon 1142827 valid cases out of 1607375 total cases.
HEALTH INSURANCEHLTHINS
122-123 (width: 2; decimal: 0)Location:
numericVariable Type:
-9Range of Missing Values (M):
Specifies the client's health insurance (if any). The insurance may or may not cover alcohol or drugtreatment.
Question:
Valid %%UnweightedFrequency
LabelValue
12.7%5.3 %85435PRIVATE INSURANCE, BC/BS, HMO1
19.5%8.2 %131577MEDICAID2
6.5%2.7 %43528MEDICARE,OTHER (E.G. TRICARE,CHAMPUS)3
61.3%25.7 %412516NONE4
-58.1 %934319MISSING/UNKNOWN/NOTCOLLECTED/INVALID-9 (M)
Based upon 673056 valid cases out of 1607375 total cases.
EXPECTED/ACTUAL PRIMARY SOURCE OF PAYMENTPRIMPAY
124-125 (width: 2; decimal: 0)Location:
numericVariable Type:
-9Range of Missing Values (M):
- 27301 -
- 59 -

Identifies the primary source of payment for this treatmentQuestion:
episode.
Guidelines: States operating under a split payment feearrangement between multiple payment sources are to defaultto the payment source with the largest percentage. Whenpayment percentages are equal, the State can select eithersource.
Valid %%UnweightedFrequency
LabelValue
20.8%6.0 %96465SELF-PAY1
5.0%1.5 %23456BLUE CROSS/BLUE SHIELD, OTHER HEALTHINSURANCE COMPANIES
2
0.7%0.2 %3033MEDICARE, WORKER'S COMPENSATION3
14.8%4.3 %68766MEDICAID4
36.9%10.7 %171604OTHER GOVERNMENT PAYMENTS5
13.6%3.9 %63357NO CHARGE (FREE, CHARITY, SPECIALRESEARCH, TEACHING)
8
8.2%2.4 %38081OTHER9
-71.1 %1142613MISSING/UNKNOWN/NOTCOLLECTED/INVALID-9 (M)
Based upon 464762 valid cases out of 1607375 total cases.
- 27301 -
- 60 -

APPENDIX
- 27301 -
- 61 -

- 27301 -
- 62 -
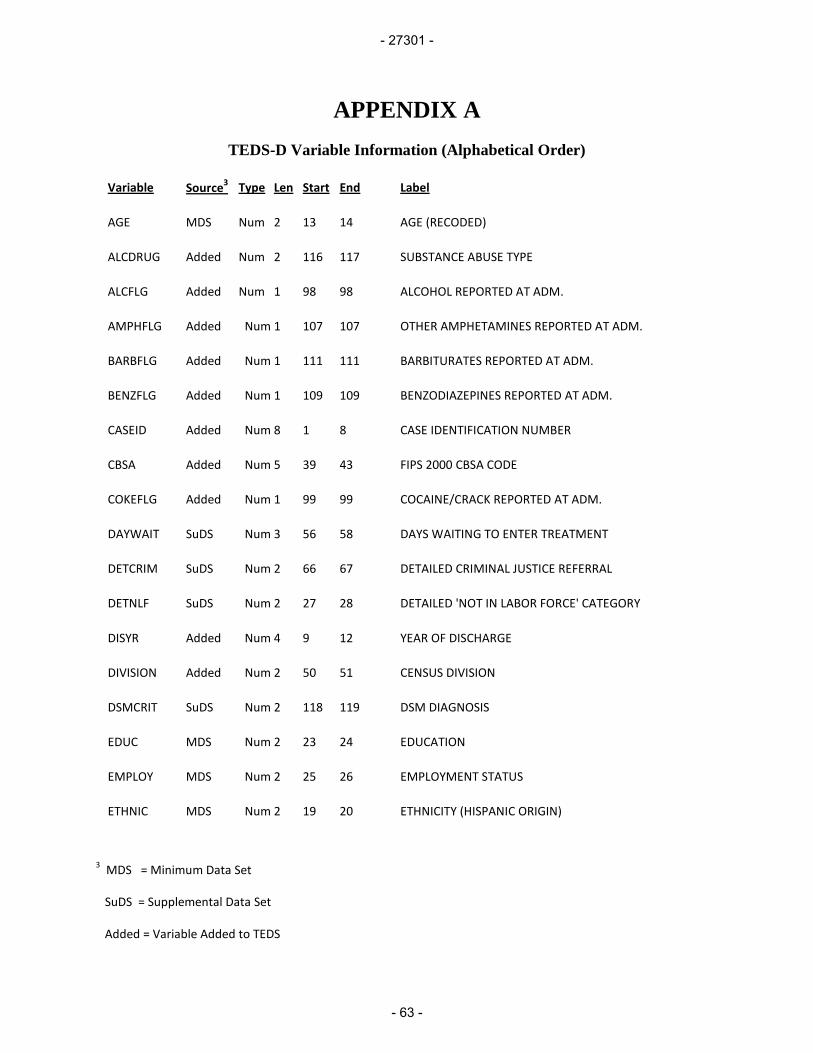
APPENDIX A TEDS-D Variable Information (Alphabetical Order)
Variable Source3 Type Len Start End Label
AGE MDS Num 2 13 14 AGE (RECODED)
ALCDRUG Added Num 2 116 117 SUBSTANCE ABUSE TYPE
ALCFLG Added Num 1 98 98 ALCOHOL REPORTED AT ADM.
AMPHFLG Added Num 1 107 107 OTHER AMPHETAMINES REPORTED AT ADM.
BARBFLG Added Num 1 111 111 BARBITURATES REPORTED AT ADM.
BENZFLG Added Num 1 109 109 BENZODIAZEPINES REPORTED AT ADM.
CASEID Added Num 8 1 8 CASE IDENTIFICATION NUMBER
CBSA Added Num 5 39 43 FIPS 2000 CBSA CODE
COKEFLG Added Num 1 99 99 COCAINE/CRACK REPORTED AT ADM.
DAYWAIT SuDS Num 3 56 58 DAYS WAITING TO ENTER TREATMENT
DETCRIM SuDS Num 2 66 67 DETAILED CRIMINAL JUSTICE REFERRAL
DETNLF SuDS Num 2 27 28 DETAILED 'NOT IN LABOR FORCE' CATEGORY
DISYR Added Num 4 9 12 YEAR OF DISCHARGE
DIVISION Added Num 2 50 51 CENSUS DIVISION
DSMCRIT SuDS Num 2 118 119 DSM DIAGNOSIS
EDUC MDS Num 2 23 24 EDUCATION
EMPLOY MDS Num 2 25 26 EMPLOYMENT STATUS
ETHNIC MDS Num 2 19 20 ETHNICITY (HISPANIC ORIGIN)
3 MDS = Minimum Data Set
SuDS = Supplemental Data Set
Added = Variable Added to TEDS
- 27301 -
- 63 -
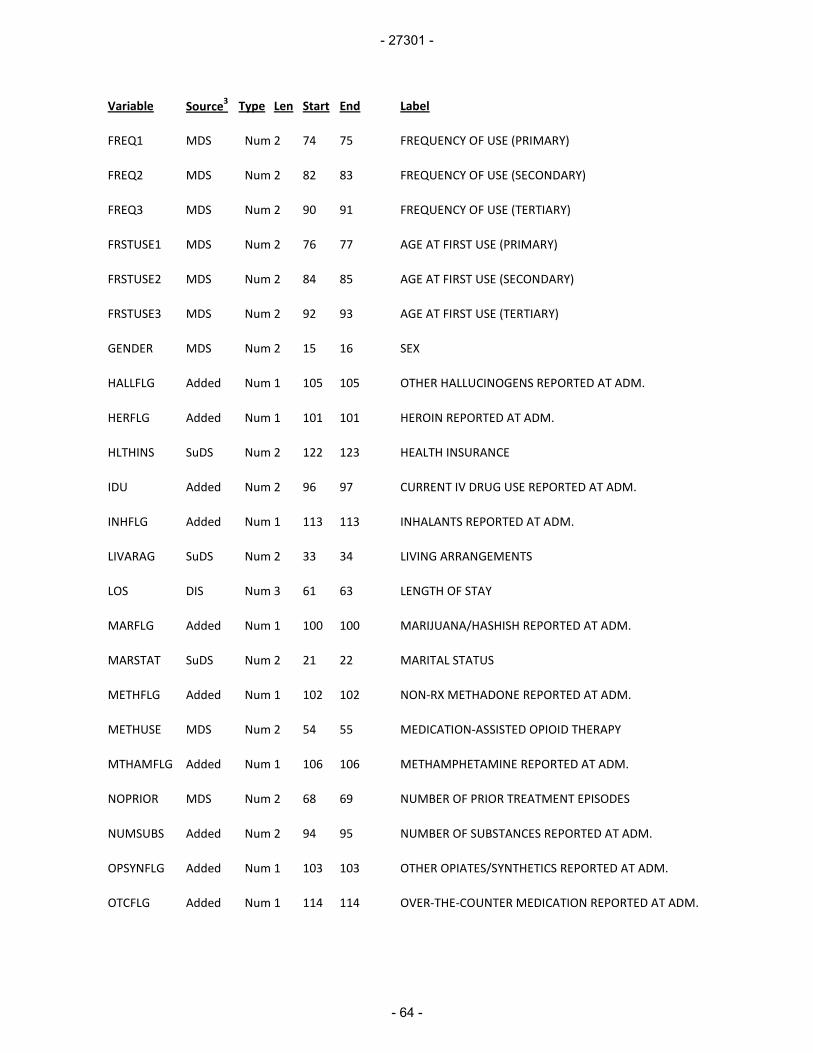
Variable Source3 Type Len Start End Label
FREQ1 MDS Num 2 74 75 FREQUENCY OF USE (PRIMARY)
FREQ2 MDS Num 2 82 83 FREQUENCY OF USE (SECONDARY)
FREQ3 MDS Num 2 90 91 FREQUENCY OF USE (TERTIARY)
FRSTUSE1 MDS Num 2 76 77 AGE AT FIRST USE (PRIMARY)
FRSTUSE2 MDS Num 2 84 85 AGE AT FIRST USE (SECONDARY)
FRSTUSE3 MDS Num 2 92 93 AGE AT FIRST USE (TERTIARY)
GENDER MDS Num 2 15 16 SEX
HALLFLG Added Num 1 105 105 OTHER HALLUCINOGENS REPORTED AT ADM.
HERFLG Added Num 1 101 101 HEROIN REPORTED AT ADM.
HLTHINS SuDS Num 2 122 123 HEALTH INSURANCE
IDU Added Num 2 96 97 CURRENT IV DRUG USE REPORTED AT ADM.
INHFLG Added Num 1 113 113 INHALANTS REPORTED AT ADM.
LIVARAG SuDS Num 2 33 34 LIVING ARRANGEMENTS
LOS DIS Num 3 61 63 LENGTH OF STAY
MARFLG Added Num 1 100 100 MARIJUANA/HASHISH REPORTED AT ADM.
MARSTAT SuDS Num 2 21 22 MARITAL STATUS
METHFLG Added Num 1 102 102 NON-RX METHADONE REPORTED AT ADM.
METHUSE MDS Num 2 54 55 MEDICATION-ASSISTED OPIOID THERAPY
MTHAMFLG Added Num 1 106 106 METHAMPHETAMINE REPORTED AT ADM.
NOPRIOR MDS Num 2 68 69 NUMBER OF PRIOR TREATMENT EPISODES
NUMSUBS Added Num 2 94 95 NUMBER OF SUBSTANCES REPORTED AT ADM.
OPSYNFLG Added Num 1 103 103 OTHER OPIATES/SYNTHETICS REPORTED AT ADM.
OTCFLG Added Num 1 114 114 OVER-THE-COUNTER MEDICATION REPORTED AT ADM.
- 27301 -
- 64 -
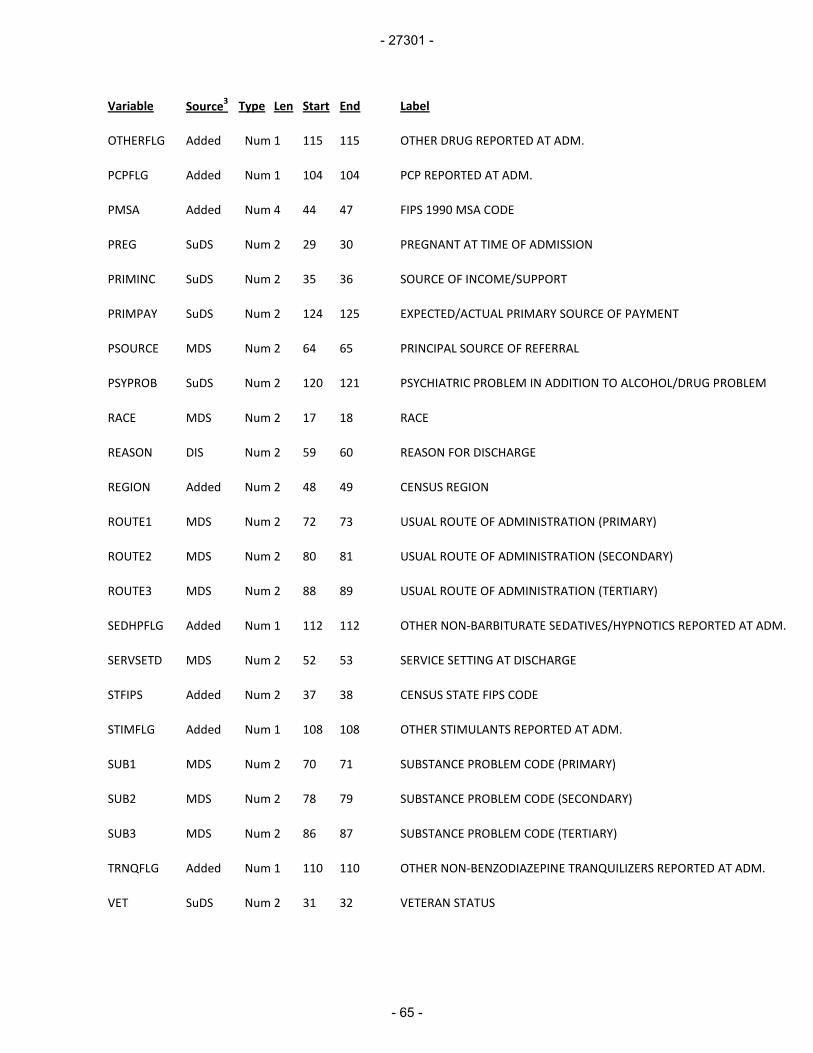
Variable Source3 Type Len Start End Label
OTHERFLG Added Num 1 115 115 OTHER DRUG REPORTED AT ADM.
PCPFLG Added Num 1 104 104 PCP REPORTED AT ADM.
PMSA Added Num 4 44 47 FIPS 1990 MSA CODE
PREG SuDS Num 2 29 30 PREGNANT AT TIME OF ADMISSION
PRIMINC SuDS Num 2 35 36 SOURCE OF INCOME/SUPPORT
PRIMPAY SuDS Num 2 124 125 EXPECTED/ACTUAL PRIMARY SOURCE OF PAYMENT
PSOURCE MDS Num 2 64 65 PRINCIPAL SOURCE OF REFERRAL
PSYPROB SuDS Num 2 120 121 PSYCHIATRIC PROBLEM IN ADDITION TO ALCOHOL/DRUG PROBLEM
RACE MDS Num 2 17 18 RACE
REASON DIS Num 2 59 60 REASON FOR DISCHARGE
REGION Added Num 2 48 49 CENSUS REGION
ROUTE1 MDS Num 2 72 73 USUAL ROUTE OF ADMINISTRATION (PRIMARY)
ROUTE2 MDS Num 2 80 81 USUAL ROUTE OF ADMINISTRATION (SECONDARY)
ROUTE3 MDS Num 2 88 89 USUAL ROUTE OF ADMINISTRATION (TERTIARY)
SEDHPFLG Added Num 1 112 112 OTHER NON-BARBITURATE SEDATIVES/HYPNOTICS REPORTED AT ADM.
SERVSETD MDS Num 2 52 53 SERVICE SETTING AT DISCHARGE
STFIPS Added Num 2 37 38 CENSUS STATE FIPS CODE
STIMFLG Added Num 1 108 108 OTHER STIMULANTS REPORTED AT ADM.
SUB1 MDS Num 2 70 71 SUBSTANCE PROBLEM CODE (PRIMARY)
SUB2 MDS Num 2 78 79 SUBSTANCE PROBLEM CODE (SECONDARY)
SUB3 MDS Num 2 86 87 SUBSTANCE PROBLEM CODE (TERTIARY)
TRNQFLG Added Num 1 110 110 OTHER NON-BENZODIAZEPINE TRANQUILIZERS REPORTED AT ADM.
VET SuDS Num 2 31 32 VETERAN STATUS
- 27301 -
- 65 -

- 27301 -
- 66 -

APPENDIX B Variable Recode Table
Variable Original Codes (original percentage) Recodes AGE Age (Recoded)
Continuous (12-99)
2 12-14 3 15-17 4 18-20 5 21-24 6 25-29 7 30-34 8 35-39 9 40-44 10 45-49 11 50-54 12 55 and Over
MARSTAT Marital Status
1 Never Married (59.9%) 2 Now Married (16.2%) 3 Separated (5.9%) 4 Divorced (16.5%) 5 Widowed (1.5%)
1 Never Married 2 Now Married 3 Separated 4 Divorced, Widowed
EDUC Education
Continuous 0-25
1 8 Years or Less 2 9-11 3 12 4 13-15 5 16 or More
- 27301 -
- 67 -

Variable Original Codes (original percentage) Recodes DETNLF Detailed ‘Not in Labor’ Force
1 Homemaker (2.7%) 2 Student (15.1%) 3 Retired (2.0%) 4 Disabled (16.0%) 5 Inmate of Institution (5.7%) 6 Other (58.6%)
1 Homemaker 2 Student 3 Retired, Disabled 5 Inmate of Institution 6 Other
PRIMINC Source of Income / Support
1 Wages/Salary (32.5%) 2 Public Assistance (7.4%) 3 Retirement/Pension (<1%) 4 Disability (4.3%) 20 Other (22.0%) 21 None (33.0%)
1 Wages/Salary 2 Public Assistance 3 Retirement/Pension, Disability 20 Other 21 None
PMSA FIPS 1990 MSA Code CBSA FIPS 2000 CBSA Code
Census PMSA, CBSA geographic codes Codes for undesignated area and missing data combined into a single specification. When either PMSA or CBSA describes a population less than 100,000, or one of the codes falls into the combined missing category, records are recoded into: “UNDESIGNATED AREA /MISSING/ UNKNOWN/NOT COLLECTED/ INVALID”
DETCRIM Detailed Criminal Justice Referral
1 State/Federal Court (12.2%) 2 Other Court (11.9%) 3 Probation/Parole (41.6%) 4 Other Recognized Legal Entity (5.7%) 5 Diversionary Program (3.5%) 6 Prison (2.5%) 7 DUI/DWI (8.5%) 8 Other (14.0%)
1 State/Federal Court, Other Court 3 Probation/Parole 5 Diversionary Program 6 Prison 7 DUI/DWI 8 Other Recognized Legal Entity, Other
- 27301 -
- 68 -
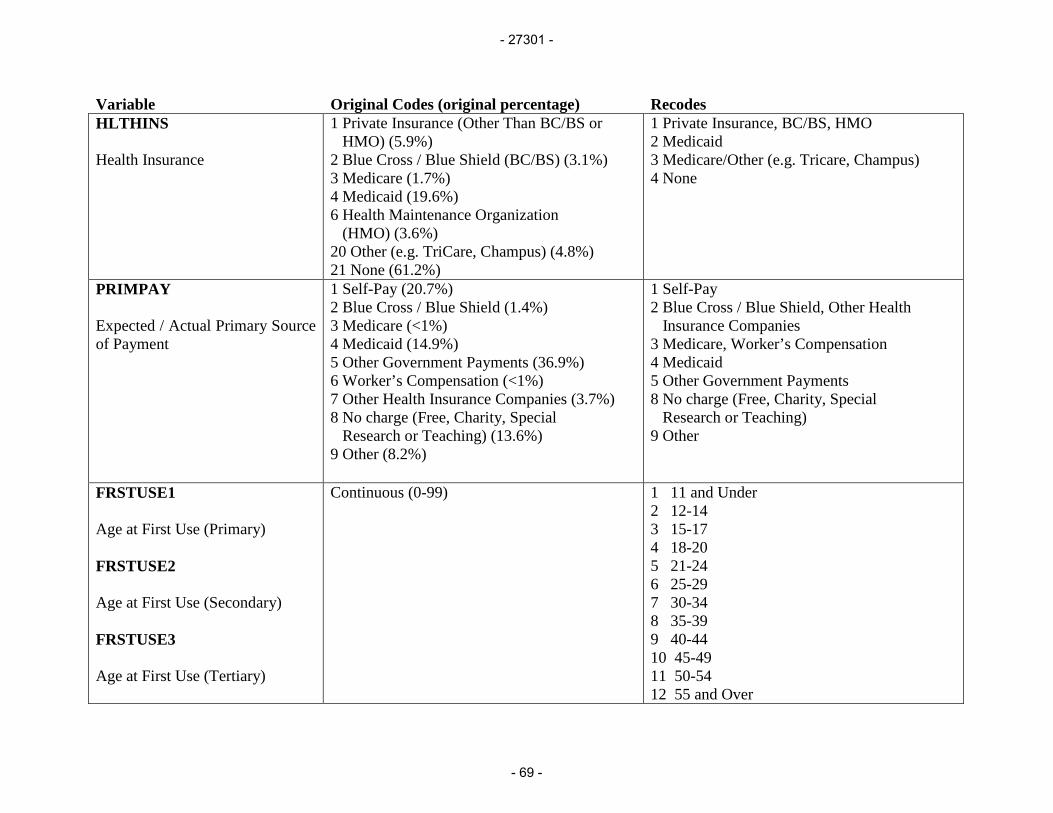
Variable Original Codes (original percentage) Recodes HLTHINS Health Insurance
1 Private Insurance (Other Than BC/BS or HMO) (5.9%) 2 Blue Cross / Blue Shield (BC/BS) (3.1%) 3 Medicare (1.7%) 4 Medicaid (19.6%) 6 Health Maintenance Organization (HMO) (3.6%) 20 Other (e.g. TriCare, Champus) (4.8%) 21 None (61.2%)
1 Private Insurance, BC/BS, HMO 2 Medicaid 3 Medicare/Other (e.g. Tricare, Champus) 4 None
PRIMPAY Expected / Actual Primary Source of Payment
1 Self-Pay (20.7%) 2 Blue Cross / Blue Shield (1.4%) 3 Medicare (<1%) 4 Medicaid (14.9%) 5 Other Government Payments (36.9%) 6 Worker’s Compensation (<1%) 7 Other Health Insurance Companies (3.7%) 8 No charge (Free, Charity, Special Research or Teaching) (13.6%) 9 Other (8.2%)
1 Self-Pay 2 Blue Cross / Blue Shield, Other Health Insurance Companies 3 Medicare, Worker’s Compensation 4 Medicaid 5 Other Government Payments 8 No charge (Free, Charity, Special Research or Teaching) 9 Other
FRSTUSE1 Age at First Use (Primary) FRSTUSE2 Age at First Use (Secondary) FRSTUSE3 Age at First Use (Tertiary)
Continuous (0-99)
1 11 and Under 2 12-14 3 15-17 4 18-20 5 21-24 6 25-29 7 30-34 8 35-39 9 40-44 10 45-49 11 50-54 12 55 and Over
- 27301 -
- 69 -
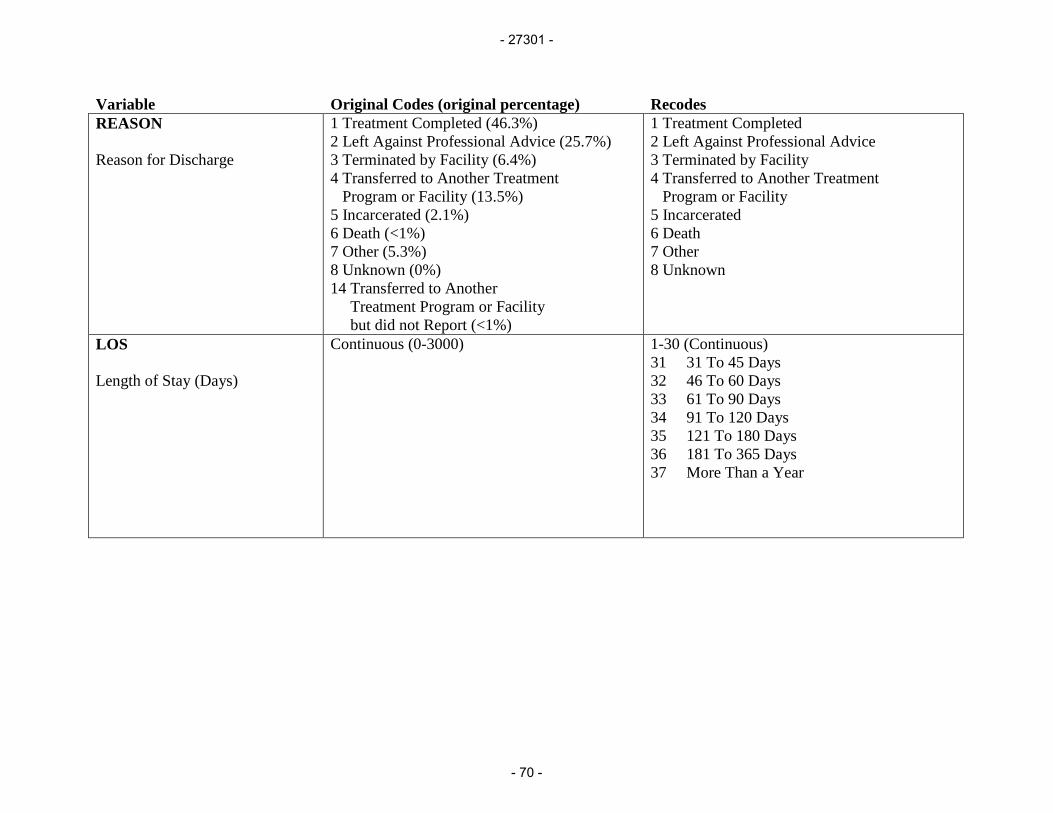
Variable Original Codes (original percentage) Recodes REASON Reason for Discharge
1 Treatment Completed (46.3%) 2 Left Against Professional Advice (25.7%) 3 Terminated by Facility (6.4%) 4 Transferred to Another Treatment Program or Facility (13.5%) 5 Incarcerated (2.1%) 6 Death (<1%) 7 Other (5.3%) 8 Unknown (0%) 14 Transferred to Another Treatment Program or Facility but did not Report (<1%)
1 Treatment Completed 2 Left Against Professional Advice 3 Terminated by Facility 4 Transferred to Another Treatment Program or Facility 5 Incarcerated 6 Death 7 Other 8 Unknown
LOS Length of Stay (Days)
Continuous (0-3000) 1-30 (Continuous) 31 31 To 45 Days 32 46 To 60 Days 33 61 To 90 Days 34 91 To 120 Days 35 121 To 180 Days 36 181 To 365 Days 37 More Than a Year
- 27301 -
- 70 -
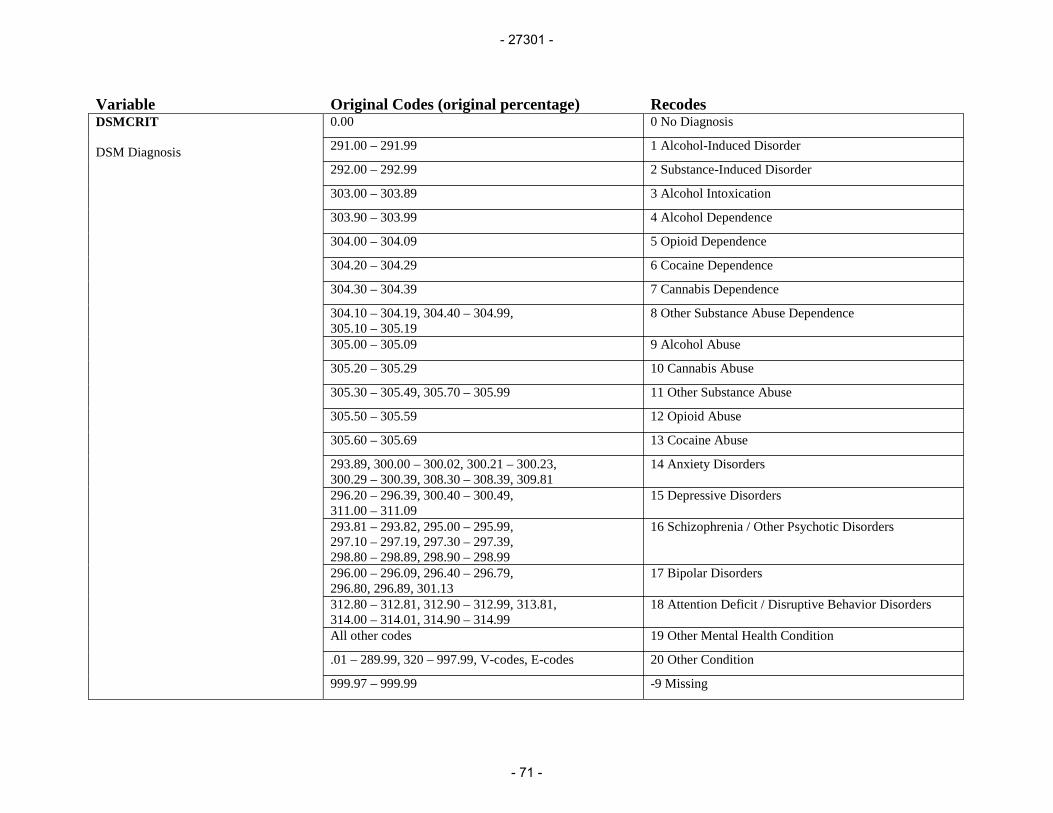
Variable Original Codes (original percentage) Recodes DSMCRIT DSM Diagnosis
0.00 0 No Diagnosis
291.00 – 291.99 1 Alcohol-Induced Disorder
292.00 – 292.99 2 Substance-Induced Disorder
303.00 – 303.89 3 Alcohol Intoxication
303.90 – 303.99 4 Alcohol Dependence
304.00 – 304.09 5 Opioid Dependence
304.20 – 304.29 6 Cocaine Dependence
304.30 – 304.39 7 Cannabis Dependence
304.10 – 304.19, 304.40 – 304.99, 305.10 – 305.19
8 Other Substance Abuse Dependence
305.00 – 305.09 9 Alcohol Abuse
305.20 – 305.29 10 Cannabis Abuse
305.30 – 305.49, 305.70 – 305.99 11 Other Substance Abuse
305.50 – 305.59 12 Opioid Abuse
305.60 – 305.69 13 Cocaine Abuse
293.89, 300.00 – 300.02, 300.21 – 300.23, 300.29 – 300.39, 308.30 – 308.39, 309.81
14 Anxiety Disorders
296.20 – 296.39, 300.40 – 300.49, 311.00 – 311.09
15 Depressive Disorders
293.81 – 293.82, 295.00 – 295.99, 297.10 – 297.19, 297.30 – 297.39, 298.80 – 298.89, 298.90 – 298.99
16 Schizophrenia / Other Psychotic Disorders
296.00 – 296.09, 296.40 – 296.79, 296.80, 296.89, 301.13
17 Bipolar Disorders
312.80 – 312.81, 312.90 – 312.99, 313.81, 314.00 – 314.01, 314.90 – 314.99
18 Attention Deficit / Disruptive Behavior Disorders
All other codes 19 Other Mental Health Condition
.01 – 289.99, 320 – 997.99, V-codes, E-codes 20 Other Condition
999.97 – 999.99 -9 Missing
- 27301 -
- 71 -