Embed Size (px)
Citation preview
Treatment Episode Data Set Admissions (TEDS-A), 2015
Center for Behavioral Health Statistics and Quality Substance Abuse and Mental Health Services Administration
Codebook
Acknowledgements
This data file was prepared for the Substance Abuse and Mental Health Services Administration (SAMHSA), U.S. Department of Health and Human Services (HHS).
Terms of Use These data are distributed under the following terms of use. By continuing past this page, you signify your agreement to comply with the requirements as stated below:
Privacy of Study Respondents Any intentional identification of a study respondent (whether an individual or an organization) or unauthorized disclosure of identifiable information violates the pledge given to the providers of the information. Disclosure of identifiable information may also be punishable under federal law. Therefore, users of data agree: • To use these datasets solely for research or statistical purposes and not for reidentification of specific study respondents.
• To make no use of the identity of any study respondents discovered inadvertently and to report any such discovery to SAMHSA ([email protected]).
Public Domain Notice All material appearing in this report is in the public domain and may be reproduced or copied without permission from SAMHSA. Citation of the source is appreciated. However, this publication may not be reproduced or distributed for a fee without the specific, written authorization of the Office of Communications, SAMHSA, U.S. Department of Health and Human Services.
1

Data Citation Data users agree to reference the recommended bibliographic citation in any of the publications that use these public use SAMHSA data.
Authors of publications that use these data are required to send citations of their published works to SAMHSA for inclusion in a database of related publications ([email protected])
Disclaimer
Data users acknowledge that SAMHSA and Eagle will bear no responsibility for use of the data or for interpretations or inferences based upon such uses.
SAMHSA complies with applicable Federal civil rights laws and does not discriminate on the basis of race, color, national origin, age, disability, or sex. SAMHSA cumple con las leyes federales de derechos civiles aplicables y no discrimina por motivos de raza, color, nacionalidad, edad, discapacidad o sexo.
Violations If SAMHSA or Eagle determines that this “Terms of Use” agreement has been violated, then possible sanctions could include:
• Report of the violation to the Research Integrity Officer, Institutional Review Board, or Human Subjects Review Committee of the user's institution.
• If the confidentiality of human subjects has been violated, then report of the violation may be made to the Federal Office for Human Research Protections.
• Report of the violation of federal law to the United S tates Attorney General for possible prosecution.
• Court awarded payments of damages to any individual(s)/organization(s) harmed by the breach of confidential data.
2

TREATMENT EPISODE DATA SET – ADMISSIONS CODEBOOK, 2015
Introduction
This codebook is for the Treatment Episode Data Set – Admissions (TEDS-A) for admissions to substance abuse treatment occurring in 2015. TEDS-A provides demographic and substance abuse characteristics of admissions to alcohol or drug treatment in facilities that report to individual state administrative data systems.
The TEDS system is comprised of two major components, the Admissions Data Set and the Discharges Da t a Se t (TEDS-D). The TEDS -Admissions (TEDS-A) f i l e i s an e s t ab l i shed program; data were first reported for TEDS-A in 1992. The TEDS-D began more recently, with the first data reported in 2000. TEDS includes treatment data that are routinely collected by states to monitor their individual substance abuse treatment systems. Selected data items from the individual state data files are converted to a standardized format that is consistent across states. These standardized data constitute TEDS.
The TEDS-A is comprised of a Minimum Data Set collected by all states, and a Supplemental Data Set collected by some states. The Minimum Data Set consists of 19 items that include:
• Demographic information; • Primary, secondary, and tertiary substances used by the subject, and their route of administration, frequency of use, and age at first use;
• Source of referral to treatment; • Number of prior treatment episodes; and • Service type, including planned use of medication-assisted (i.e., with methadone or buprenorphine) opioid therapy.
The 15 Supplemental Data Set items include psychiatric, social, and economic measures.
A full list of the variables can be viewed in the Variable Information and Frequency sections of this codebook.
This codebook provides background and descriptive information for the TEDS-A public-use files, limitations of the data, and frequencies. References are available detailing the data collected in each state with the TEDS data elements, including state-by-state descriptions of exceptions or anomalies in reporting practices. Users may refer to the TEDS Crosswalks available from SAMHSA. The crosswalks are frequently updated as new information becomes available.
Since 1992, the Office of Applied Studies (OAS) of the Substance Abuse and Mental Health Services Administration (SAMHSA), U.S. Department of Health and Human Services (DHHS), has funded and been responsible for TEDS. It coordinates and manages the collection of TEDS data from the states. In 2010, the OAS was renamed to the Center for Behavioral Health Statistics and Quality (CBHSQ). The unit of analysis is treatment admissions to state-licensed or certified substance abuse treatment centers that receive federal public funding.
3
Descriptive and analytical reports from TEDS are developed by BHSIS to provide national and state-level data on the number and types of clients treated and the characteristics of facilities providing services.
Data Collection
The “Treatment Episode Data Set State Instruction Manual – Admissions Data” is available from the SAMHSA Web site and provides complete instructions on how the TEDS-A data are processed and submitted by the states.
Confidentiality Protection
Several measures were taken to protect the confidentiality of the TEDS-A records. Variables that potentially identify an individual in their raw form underwent routine top- or bottom-coding in order to prevent high and low codes from distinguishing a respondent’s record. For example, AGE as a continuous variable has the potential to identify both the youngest and oldest participants in a public release file. Hence, AGE was recoded into 11 categories for the public- use file to reduce disclosure risk. The lowest category for age combines the ages of 12-14. Similarly, ages of 55 and older were top-coded. All the variables recoded are documented in Appendix B.
Disclosure analysis is used to identify records that remained unique after routine recoding measures were taken to protect confidentiality. Disclosure analysis is used to discern combinations of indirect identifiers that potentially link an individual to a record. Particular attention was given to the analytic importance of geographic data and of subgroup populations. Consequently, data swapping was applied to the TEDS in order to satisfy stringent confidentiality standards while preserving the analytic value of the public-use file.
The original location of a record in TEDS-A cannot be known for certain due to the use of data swapping. This method has several benefits over other disclosure protection options: (1) the overall impact to the data is typically small; (2) nearly all of the data are left intact; (3) data for special populations (e.g., minorities, pregnant women) are no more impacted than other data; (4) the procedures typically do not affect any analytic uses of the file; and (5) the procedures allow greater detail to remain on the public use file (e.g., the original ethnicity codes).
Universe
The universe for TEDS-A is admissions in calendar year 2015 that were received and processed through November 1, 2016.
4
5
Coverage
The TEDS attempts to include all admissions to providers receiving public funding. Because each state or jurisdiction decides the TEDS eligibility of a provider, there is no independent check on the actual sources of funding. Although SAMHSA requests submission of TEDS data on all admissions to any publicly funded treatment facility, reporting in some state agencies is structured so that only clients treated with public funds are included in the TEDS. The number of clients in these facilities whose treatment is not publicly funded is unknown.1
Data Limitations
The TEDS, while comprising a significant proportion of all admissions to substance abuse treatment, does not include all such admissions. The TEDS is a compilation of facility data from state administrative systems. The scope of facilities included in the TEDS is affected by differences in state licensure, certification, accreditation, and disbursement of public funds. For example, some state substance abuse agencies regulate private facilities and individual practitioners, while others do not. In some states, hospital-based substance abuse treatment facilities are not licensed through the state substance abuse agency. Some state substance abuse agencies track treatment in correctional facilities (state prisons and local jails), while others do not.
In general, facilities reporting TEDS data receive state alcohol and/or drug agency funds (including Federal Block Grant funds) for the provision of alcohol and/or drug treatment services. Most states are able to report all admissions to all eligible facilities, although some report only admissions financed by public funds. States may report data from facilities that do not receive public funds, but generally do not because of the difficulty in obtaining data from these facilities. The TEDS generally does not include data on facilities operated by federal agencies, including the Bureau of Prisons, the Department of Defense, and the Department of Veterans Affairs. However, some facilities operated by the Indian Health Service are included.
The primary goal of TEDS is to monitor the characteristics of treatment episodes for substance abusers. Implicit in the concept of treatment is a planned, continuing treatment regimen. Thus, the TEDS does not include early intervention programs; these are considered to be prevention programs. Crisis intervention facilities such as sobering-up stations and hospital emergency departments are not included in the TEDS.
The TEDS is a large and powerful data set. Like all data sets, however, care must be taken that interpretation does not extend beyond the limitations of the data. Limitations fall into two broad
1Substance Abuse and Mental Health Services Administration, Center for Behavioral Health Statistics and Quality, formerly Office of Applied Studies. Treatment Episode Data Set (TEDS): 1992-1997. National Admissions to Substance Abuse Treatment Services. DASIS Series: S-7, DHHS Publication No. (SMA) 99-3324, Rockville, MD, 1999, 115.

categories: those related to the scope of the data collection system, and those related to the difficulties of aggregating data from highly diverse state data collection systems.2
Limitations to be kept in mind while analyzing TEDS data include:
• The number and client mix of TEDS records depends, to some extent, on external factors -including the availability of public funds. In states with higher funding levels, a larger percentage of the substance abusing population may be admitted to treatment, including the less severely impaired and the less economically disadvantaged.
• The primary, secondary, and tertiary substances of abuse reported to the TEDS are those substances that led to the treatment episode, and not necessarily a complete enumeration of all drugs used at the time of admission.
• The way an admission is defined may vary from state to state such that the absolute number of admissions is not a valid measure for comparing states.
• States continually review the quality of their data processing. As systematic errors are identified, revisions may be enacted in historical TEDS data files. While this system improves the data set over time, reported historical statistics may change slightly from year to year.
• States vary in the extent to which coercion plays a role in referral to treatment. This variation derives from criminal justice practices and differing concentrations of abuser subpopulations.
• Public funding constraints may direct states to selectively target special populations, for example, pregnant women or adolescents.
• TEDS includes treatment admissions and in many states the files may include multiple admissions for the same client. Therefore, any statistics derived from the data will represent admissions, not clients. It is possible for clients to have multiple initial admissions within a state and even within providers that have multiple treatment sites within the state. A few states uniquely identify clients at the state-level and several more states are attempting to achieve this level of client identification. The TEDS provides a good national snapshot of what is seen at admission to treatment, but is currently unable to follow individual clients through a sequence of treatment episodes.
2 Substance Abuse and Mental Health Services Administration, Center for Behavioral Health Statistics and Quality, formerly Office of Applied Studies. Treatment Episode Data Set (TEDS): 2005. Discharges from Substance Abuse Treatment Services. DASIS Series: S- 41, DHHS Publication No. (SMA) 08-4312, Rockville, MD, 1999, 6.
6
• The TEDS distinguishes between "transfer admissions" and "initial admissions." Transfer admissions include clients transferred for distinct services within an episode of treatment. Only initial admissions are included in the public use files.
• Some states have no opioid treatment programs (OTPs) that provide medication-assisted therapy using methadone and/or buprenorphine. See the TEDS state-by-state crosswalk for information regarding data collected by each state.
Created Variables
The TEDS files contain several variables created from the original variables submitted by the states. For example, a variable was created to indicate whether each drug was included as a primary, secondary, or tertiary drug of abuse. These are called flag variables and labeled according to the drug, such as alcflg for alcohol flag variable, cokeflg for cocaine flag, etc.
Contents of Public-Use Files
The TEDS public use file contains Minimum, Supplemental, and Additional data for 45 states plus Puerto Rico and Washington DC. Georgia, Kansas, Oregon, Pennsylvania and South Carolina did not report usable data for the year 2015.
The TEDS Admissions public-use files are provided in SAS System, SPSS System, Stata System, R System and ASCII comma-delimited formats A separate codebook is provided for each year’s data file.
The number of observations and variables for 2015 are as follows:
Number of observations: 1,537,025 Number of variables: 62
User Responsibility
Users are reminded that the data are to be used solely for statistical analysis and reporting of aggregated information and not for investigation or identification of specific individuals or organizations.
7

Publications
The Center for Behavioral Health Statistics and Quality has other published TEDS reports on the SAMHSA Web site.
8

FREQUENCIES
9

CASEID: CASE IDENTIFICATION NUMBER
Program generated case (record) identifier. Variable Type: numeric
10

YEAR: YEAR OF ADMISSIONYEAR: YEAR OF ADMISSION
Year of client's admission to substance abuse treatment.
Value Label UnweightedFrequency %
2015 2015 1,537,025 100%
Total 1,537,025 100%
Width: 4; Decimal: 0 Variable Type: numeric
11

AGE: AGE (RECODED)AGE: AGE (RECODED)
Calculated from date of birth and date of admission and categorized.
Note: Records of clients aged 11 years old and younger or are unknown are no longer included in TEDS.
Value Label Unweighted
Frequency %
2 12-14 10,588 0.7%
3 15-17 54,898 3.6%
4 18-20 63,939 4.2%
5 21-24 170,677 11.1%
6 25-29 271,408 17.7%
7 30-34 239,891 15.6%
8 35-39 176,818 11.5%
9 40-44 139,676 9.1%
10 45-49 143,876 9.4%
11 50-54 132,981 8.7%
12 55 AND OVER 132,273 8.6%
Total 1,537,025 100%
• Minimum: 2 • Maximum: 12
Width: 2; Decimal: 0 Variable Type: numeric
12
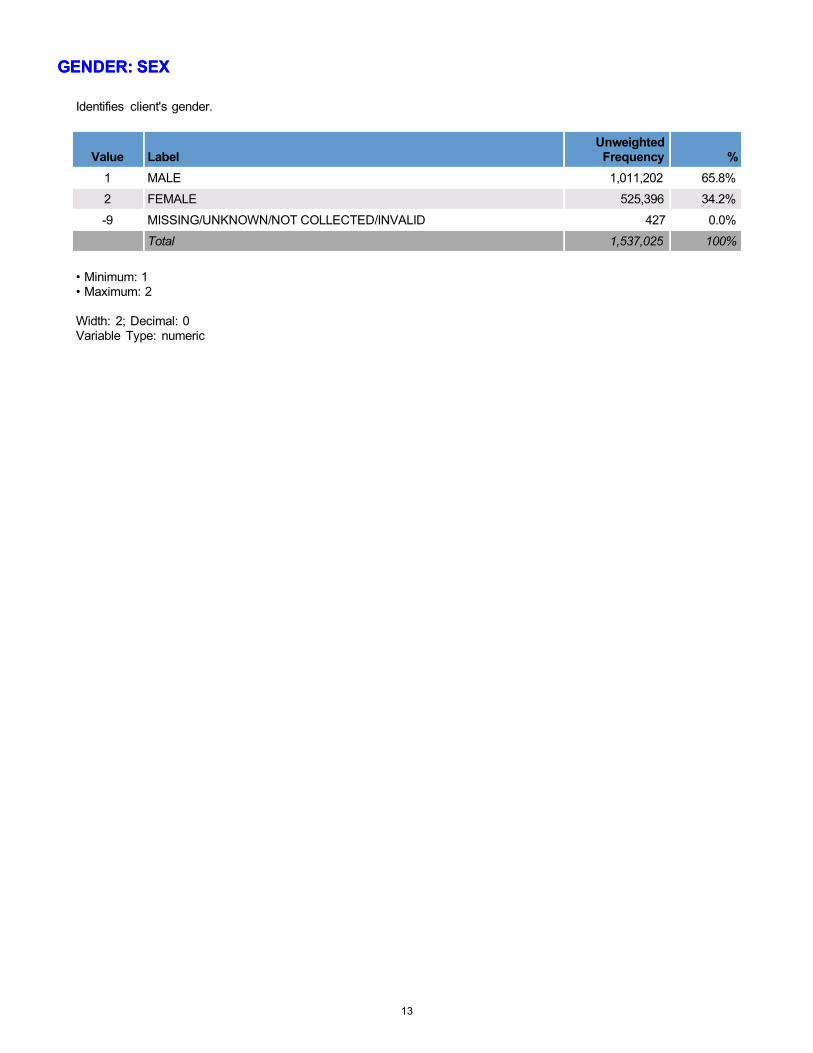
GENDER: SEXGENDER: SEX
Identifies client's gender.
Value Label Unweighted
Frequency %
1 MALE 1,011,202 65.8%
2 FEMALE 525,396 34.2%
-9 MISSING/UNKNOWN/NOT COLLECTED/INVALID 427 0.0%
Total 1,537,025 100%
• Minimum: 1 • Maximum: 2
Width: 2; Decimal: 0 Variable Type: numeric
13
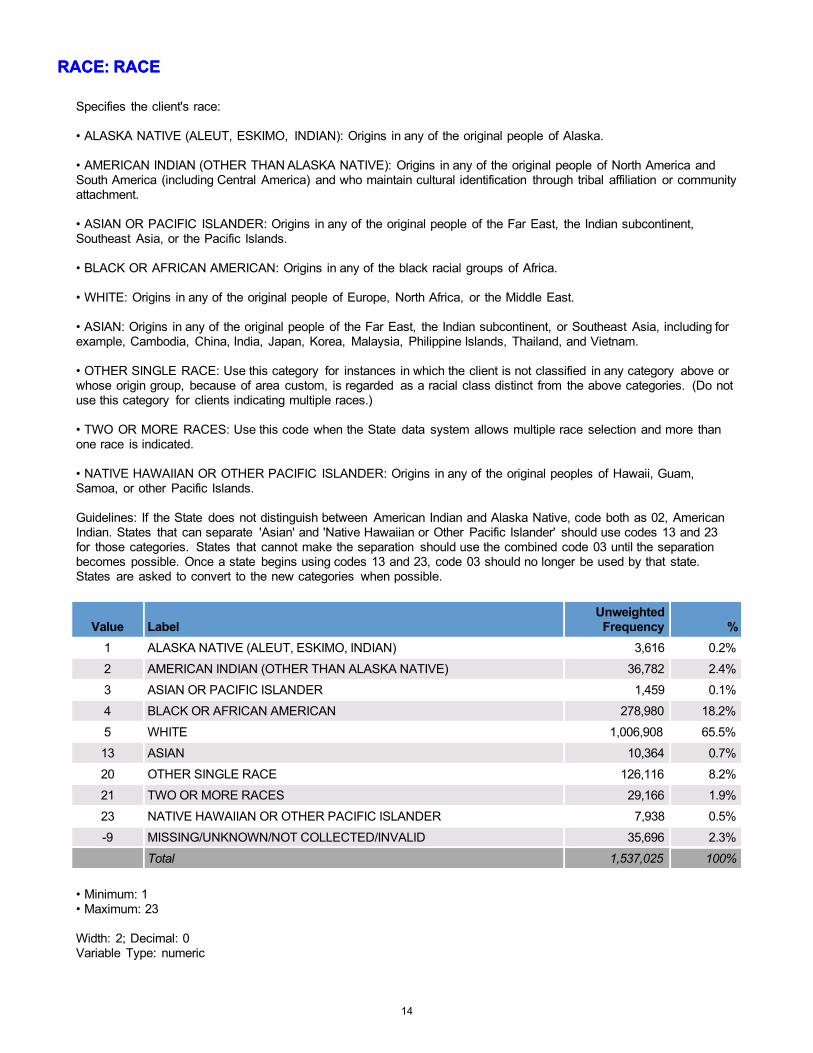
RACE: RACERACE: RACE
Specifies the client's race:
• ALASKA NATIVE (ALEUT, ESKIMO, INDIAN): Origins in any of the original people of Alaska.
• AMERICAN INDIAN (OTHER THAN ALASKA NATIVE): Origins in any of the original people of North America and South America (including Central America) and who maintain cultural identification through tribal affiliation or community attachment.
• ASIAN OR PACIFIC ISLANDER: Origins in any of the original people of the Far East, the Indian subcontinent, Southeast Asia, or the Pacific Islands.
• BLACK OR AFRICAN AMERICAN: Origins in any of the black racial groups of Africa.
• WHITE: Origins in any of the original people of Europe, North Africa, or the Middle East.
• ASIAN: Origins in any of the original people of the Far East, the Indian subcontinent, or Southeast Asia, including for example, Cambodia, China, India, Japan, Korea, Malaysia, Philippine Islands, Thailand, and Vietnam.
• OTHER SINGLE RACE: Use this category for instances in which the client is not classified in any category above or whose origin group, because of area custom, is regarded as a racial class distinct from the above categories. (Do not use this category for clients indicating multiple races.)
• TWO OR MORE RACES: Use this code when the State data system allows multiple race selection and more than one race is indicated.
• NATIVE HAWAIIAN OR OTHER PACIFIC ISLANDER: Origins in any of the original peoples of Hawaii, Guam, Samoa, or other Pacific Islands.
Guidelines: If the State does not distinguish between American Indian and Alaska Native, code both as 02, American Indian. States that can separate 'Asian' and 'Native Hawaiian or Other Pacific Islander' should use codes 13 and 23 for those categories. States that cannot make the separation should use the combined code 03 until the separation becomes possible. Once a state begins using codes 13 and 23, code 03 should no longer be used by that state. States are asked to convert to the new categories when possible.
Value Label Unweighted
Frequency %
1 ALASKA NATIVE (ALEUT, ESKIMO, INDIAN) 3,616 0.2%
2 AMERICAN INDIAN (OTHER THAN ALASKA NATIVE) 36,782 2.4%
3 ASIAN OR PACIFIC ISLANDER 1,459 0.1%
4 BLACK OR AFRICAN AMERICAN 278,980 18.2%
5 WHITE 1,006,908 65.5%
13 ASIAN 10,364 0.7%
20 OTHER SINGLE RACE 126,116 8.2%
21 TWO OR MORE RACES 29,166 1.9%
23 NATIVE HAWAIIAN OR OTHER PACIFIC ISLANDER 7,938 0.5%
-9 MISSING/UNKNOWN/NOT COLLECTED/INVALID 35,696 2.3%
Total 1,537,025 100%
• Minimum: 1 • Maximum: 23
Width: 2; Decimal: 0 Variable Type: numeric
14
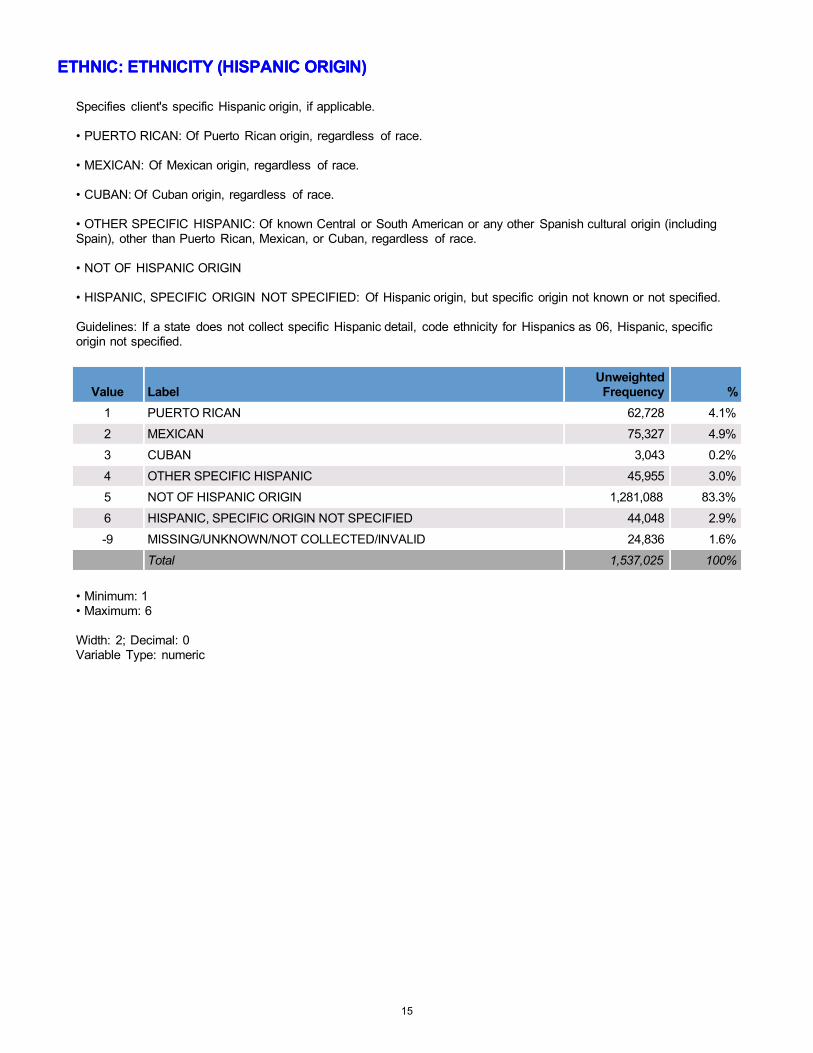
ETHNIC: ETHNICITY (HISPANIC ORIGIN)ETHNIC: ETHNICITY (HISPANIC ORIGIN)
Specifies client's specific Hispanic origin, if applicable.
• PUERTO RICAN: Of Puerto Rican origin, regardless of race.
• MEXICAN: Of Mexican origin, regardless of race.
• CUBAN: Of Cuban origin, regardless of race.
• OTHER SPECIFIC HISPANIC: Of known Central or South American or any other Spanish cultural origin (including Spain), other than Puerto Rican, Mexican, or Cuban, regardless of race.
• NOT OF HISPANIC ORIGIN
• HISPANIC, SPECIFIC ORIGIN NOT SPECIFIED: Of Hispanic origin, but specific origin not known or not specified.
Guidelines: If a state does not collect specific Hispanic detail, code ethnicity for Hispanics as 06, Hispanic, specific origin not specified.
Value Label Unweighted
Frequency %
1 PUERTO RICAN 62,728 4.1%
2 MEXICAN 75,327 4.9%
3 CUBAN 3,043 0.2%
4 OTHER SPECIFIC HISPANIC 45,955 3.0%
5 NOT OF HISPANIC ORIGIN 1,281,088 83.3%
6 HISPANIC, SPECIFIC ORIGIN NOT SPECIFIED 44,048 2.9%
-9 MISSING/UNKNOWN/NOT COLLECTED/INVALID 24,836 1.6%
Total 1,537,025 100%
• Minimum: 1 • Maximum: 6
Width: 2; Decimal: 0 Variable Type: numeric
15
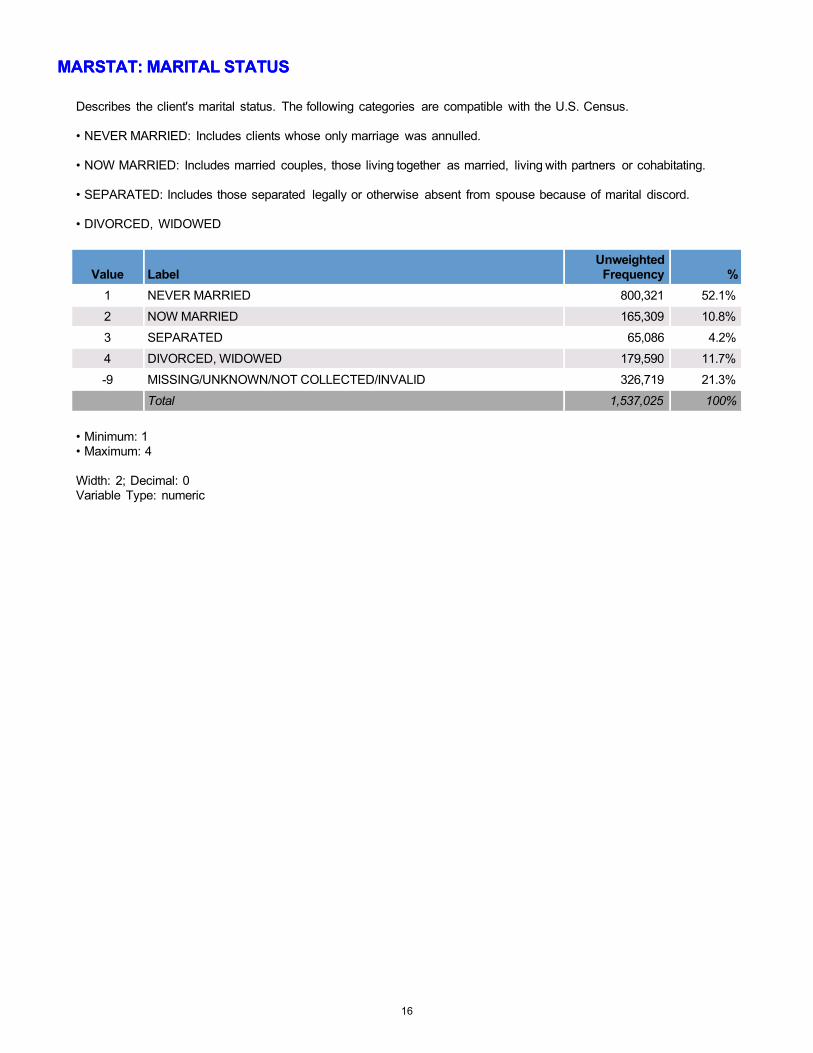
MARSTAT: MARITAL STATUSMARSTAT: MARITAL STATUS
Describes the client's marital status. The following categories are compatible with the U.S. Census.
• NEVER MARRIED: Includes clients whose only marriage was annulled.
• NOW MARRIED: Includes married couples, those living together as married, living with partners or cohabitating.
• SEPARATED: Includes those separated legally or otherwise absent from spouse because of marital discord.
• DIVORCED, WIDOWED
Value Label Unweighted
Frequency %
1 NEVER MARRIED 800,321 52.1%
2 NOW MARRIED 165,309 10.8%
3 SEPARATED 65,086 4.2%
4 DIVORCED, WIDOWED 179,590 11.7%
-9 MISSING/UNKNOWN/NOT COLLECTED/INVALID 326,719 21.3%
Total 1,537,025 100%
• Minimum: 1 • Maximum: 4
Width: 2; Decimal: 0 Variable Type: numeric
16

EDUC: EDUCATIONEDUC: EDUCATION
Specifies the highest school grade (number of school years) completed by the client.
Guidelines: States that use specific categories for designating education level should map their categories to a logical 'number of years of school completed.' The mapping should be recorded in the State Crosswalk. For example, a state category of 'Associate Degree' should be mapped to 14; 'Bachelor Degree' would be mapped to 16, etc.
Value Label Unweighted
Frequency %
1 8 YEARS OR LESS 103,837 6.8%
2 9-11 339,613 22.1%
3 12 659,052 42.9%
4 13-15 268,686 17.5%
5 16 OR MORE 95,465 6.2%
-9 MISSING/UNKNOWN/NOT COLLECTED/INVALID 70,372 4.6%
Total 1,537,025 100%
• Minimum: 1 • Maximum: 5
Width: 2; Decimal: 0 Variable Type: numeric
17

EMPLOY: EMPLOYMENT STATUSEMPLOY: EMPLOYMENT STATUS
Designates the client's employment status at the time of admission or transfer:
• FULL TIME: Working 35 hours or more each week; including active duty members of the uniformed services.
• PART TIME: Working fewer than 35 hours each week.
• UNEMPLOYED: Looking for work during the past 30 days or on layoff from a job.
• NOT IN LABOR FORCE: Not looking for work during the past 30 days or a student, homemaker, disabled, retired, or an inmate of an institution. Clients in this category are further defined in the Supplemental Data Set item 'Detailed Not in Labor Force' (DETNLF).
Guidelines: Seasonal workers are coded in this category based on their employment status at time of admission. For example, if they are employed full time at the time of admission, they are coded as 01. If they are not in labor force at time of admission, they are coded 04.
Value Label Unweighted
Frequency %
1 FULL TIME 252,797 16.4%
2 PART TIME 115,831 7.5%
3 UNEMPLOYED 546,480 35.6%
4 NOT IN LABOR FORCE 597,590 38.9%
-9 MISSING/UNKNOWN/NOT COLLECTED/INVALID 24,327 1.6%
Total 1,537,025 100%
• Minimum: 1 • Maximum: 4
Width: 2; Decimal: 0 Variable Type: numeric
18
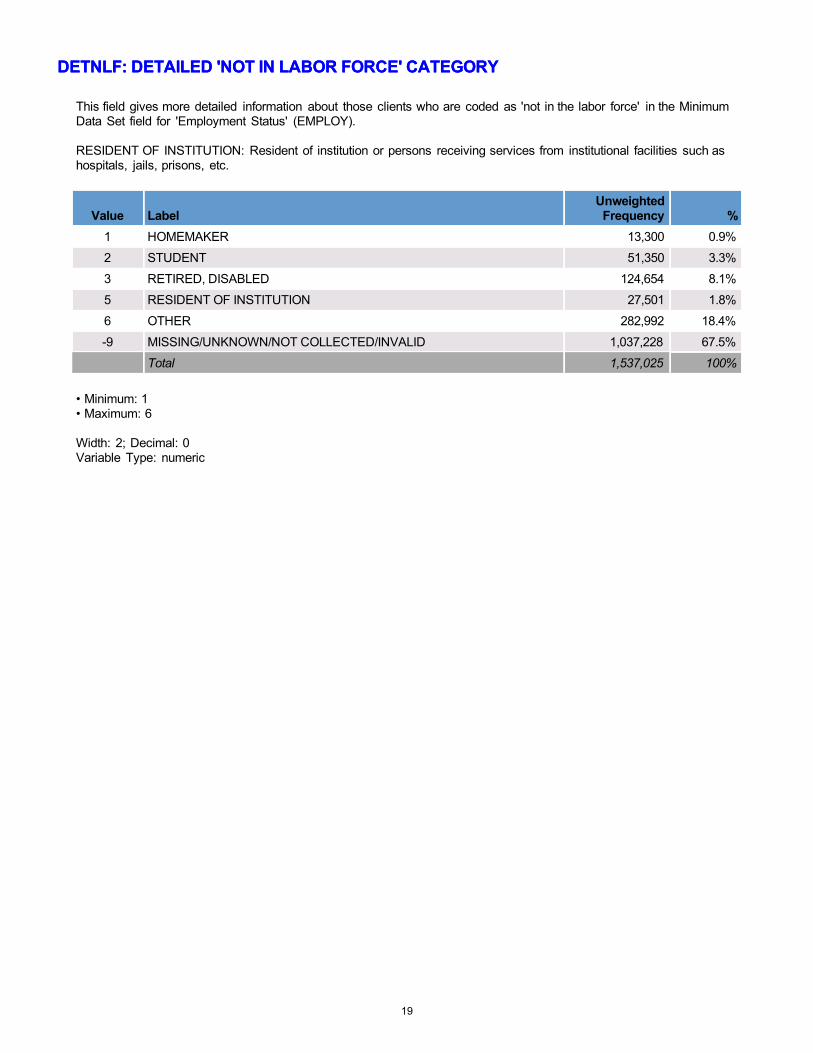
DETNLF: DETAILED 'NOT IN LABOR FORCE' CATEGORYDETNLF: DETAILED 'NOT IN LABOR FORCE' CATEGORY
This field gives more detailed information about those clients who are coded as 'not in the labor force' in the Minimum Data Set field for 'Employment Status' (EMPLOY).
RESIDENT OF INSTITUTION: Resident of institution or persons receiving services from institutional facilities such as hospitals, jails, prisons, etc.
Value Label Unweighted
Frequency %
1 HOMEMAKER 13,300 0.9%
2 STUDENT 51,350 3.3%
3 RETIRED, DISABLED 124,654 8.1%
5 RESIDENT OF INSTITUTION 27,501 1.8%
6 OTHER 282,992 18.4%
-9 MISSING/UNKNOWN/NOT COLLECTED/INVALID 1,037,228 67.5%
Total 1,537,025 100%
• Minimum: 1 • Maximum: 6
Width: 2; Decimal: 0 Variable Type: numeric
19
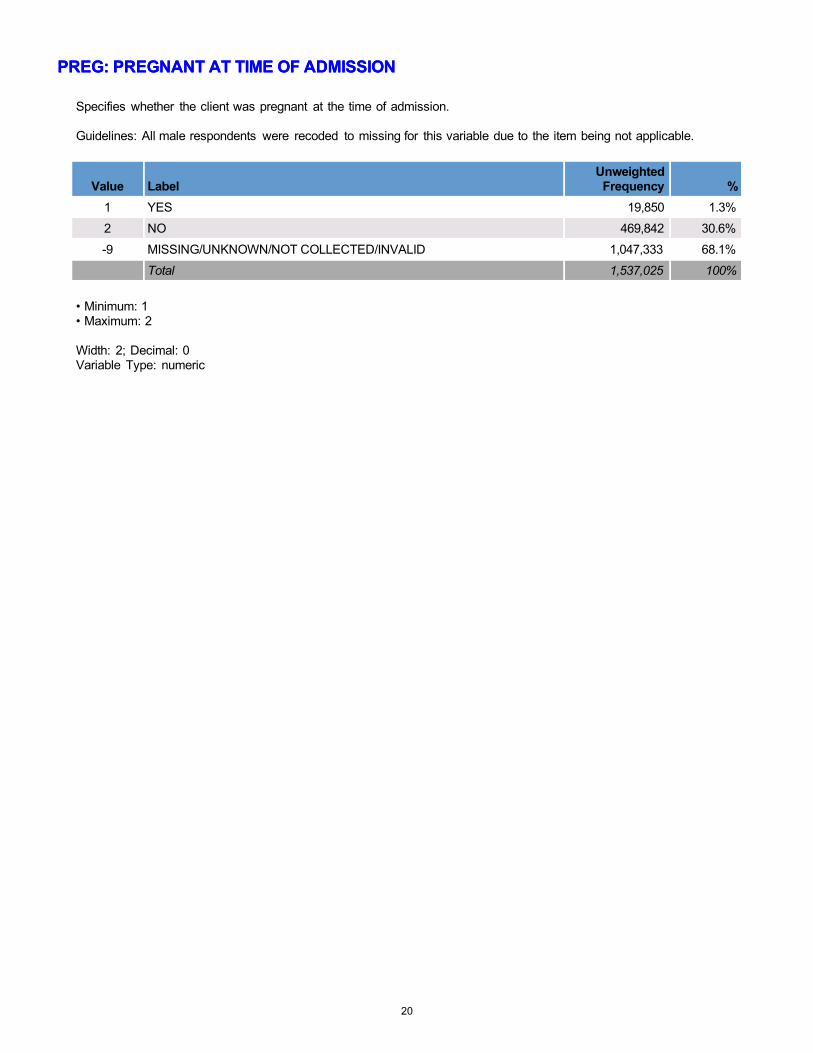
PREG: PREGNANT AT TIME OF ADMISSIONPREG: PREGNANT AT TIME OF ADMISSION
Specifies whether the client was pregnant at the time of admission.
Guidelines: All male respondents were recoded to missing for this variable due to the item being not applicable.
Value Label Unweighted
Frequency %
1 YES 19,850 1.3%
2 NO 469,842 30.6%
-9 MISSING/UNKNOWN/NOT COLLECTED/INVALID 1,047,333 68.1%
Total 1,537,025 100%
• Minimum: 1 • Maximum: 2
Width: 2; Decimal: 0 Variable Type: numeric
20

VET: VETERAN STATUSVET: VETERAN STATUS
Specifies whether the client has served in the uniformed services (Army, Navy, Air Force, Marines, Coast Guard, Public Health Service Commissioned Corps, Coast and Geodetic Survey, etc.).
Guidelines: A veteran is a person 16 years or over who has served (even for a short time), but is not currently serving, on active duty in the US Army, Navy, Marine Corps, Coast Guard, or Commissioned Corps of the US Public Health Service or National Oceanic and Atmospheric Administration, or who served as a Merchant Marine seaman during World War II. Persons who served in the National Guard or Military Reserves are classified as veterans only if they were ever called or ordered to active duty, not counting the 4-6 months for initial training or yearly summer camps.
Value Label Unweighted
Frequency %
1 YES 47,067 3.1%
2 NO 1,370,651 89.2%
-9 MISSING/UNKNOWN/NOT COLLECTED/INVALID 119,307 7.8%
Total 1,537,025 100%
• Minimum: 1 • Maximum: 2
Width: 2; Decimal: 0 Variable Type: numeric
21

LIVARAG: LIVING ARRANGEMENTLIVARAG: LIVING ARRANGEMENT
Specifies whether the client is homeless, living with parents, living in a supervised setting, or living independently on his or her own.
• HOMELESS: Clients with no fixed address; includes shelters.
• DEPENDENT LIVING: Clients living in a supervised setting such as a residential institution, halfway house or group home, and children (under age 18) living with parents, relatives, or guardians or in foster care.
• INDEPENDENT LIVING: Clients living alone or with others without supervision. Includes adult children (age 18 and over) living with parents.
Value Label Unweighted
Frequency %
1 HOMELESS 232,797 15.1%
2 DEPENDENT LIVING 263,558 17.1%
3 INDEPENDENT LIVING 1,000,771 65.1%
-9 MISSING/UNKNOWN/NOT COLLECTED/INVALID 39,899 2.6%
Total 1,537,025 100%
• Minimum: 1 • Maximum: 3
Width: 2; Decimal: 0 Variable Type: numeric
22
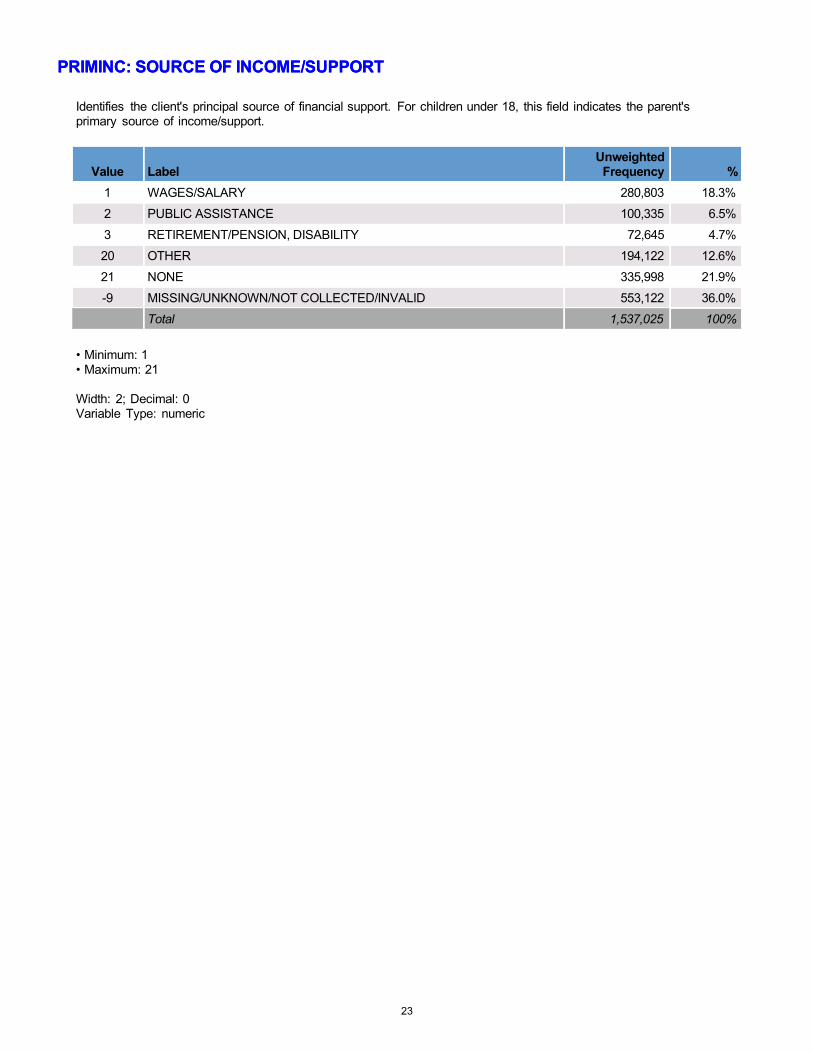
PRIMINC: SOURCE OF INCOME/SUPPORTPRIMINC: SOURCE OF INCOME/SUPPORT
Identifies the client's principal source of financial support. For children under 18, this field indicates the parent's primary source of income/support.
Value Label Unweighted
Frequency %
1 WAGES/SALARY 280,803 18.3%
2 PUBLIC ASSISTANCE 100,335 6.5%
3 RETIREMENT/PENSION, DISABILITY 72,645 4.7%
20 OTHER 194,122 12.6%
21 NONE 335,998 21.9%
-9 MISSING/UNKNOWN/NOT COLLECTED/INVALID 553,122 36.0%
Total 1,537,025 100%
• Minimum: 1 • Maximum: 21
Width: 2; Decimal: 0 Variable Type: numeric
23
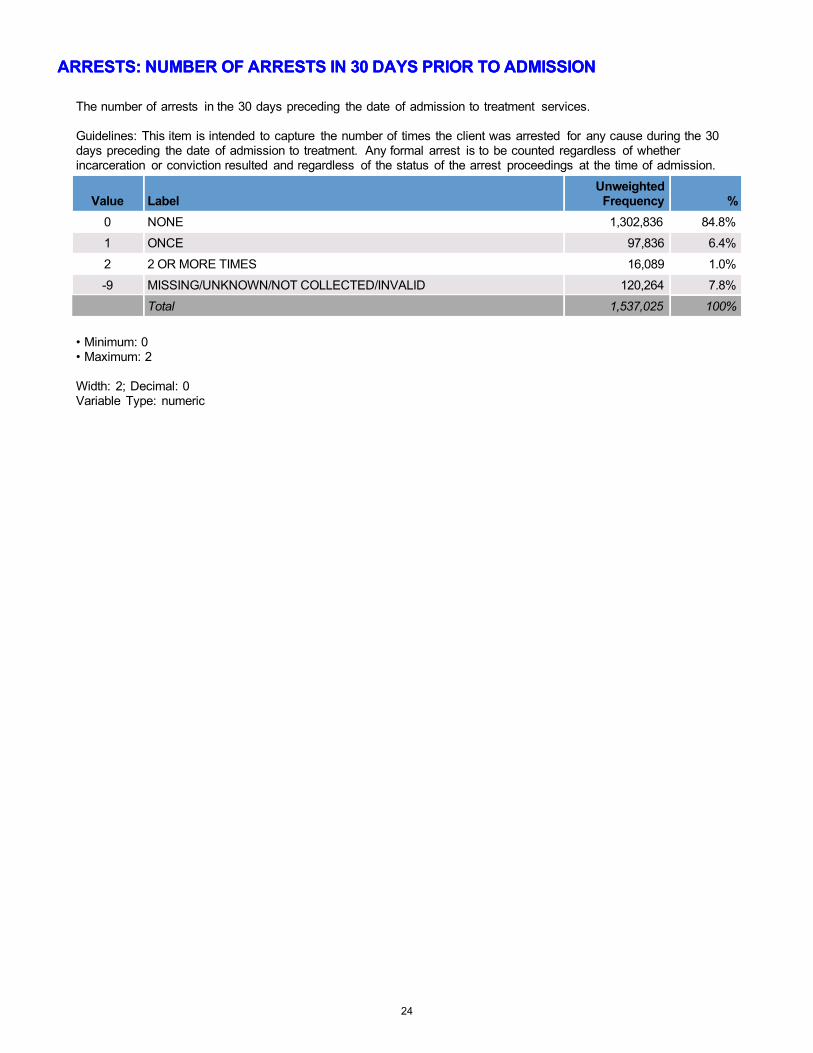
ARRESTS: NUMBER OF ARRESTS IN 30 DAYS PRIOR TO ADMISSIONARRESTS: NUMBER OF ARRESTS IN 30 DAYS PRIOR TO ADMISSION
The number of arrests in the 30 days preceding the date of admission to treatment services.
Guidelines: This item is intended to capture the number of times the client was arrested for any cause during the 30 days preceding the date of admission to treatment. Any formal arrest is to be counted regardless of whether incarceration or conviction resulted and regardless of the status of the arrest proceedings at the time of admission.
Value Label Unweighted
Frequency %
0 NONE 1,302,836 84.8%
1 ONCE 97,836 6.4%
2 2 OR MORE TIMES 16,089 1.0%
-9 MISSING/UNKNOWN/NOT COLLECTED/INVALID 120,264 7.8%
Total 1,537,025 100%
• Minimum: 0 • Maximum: 2
Width: 2; Decimal: 0 Variable Type: numeric
24
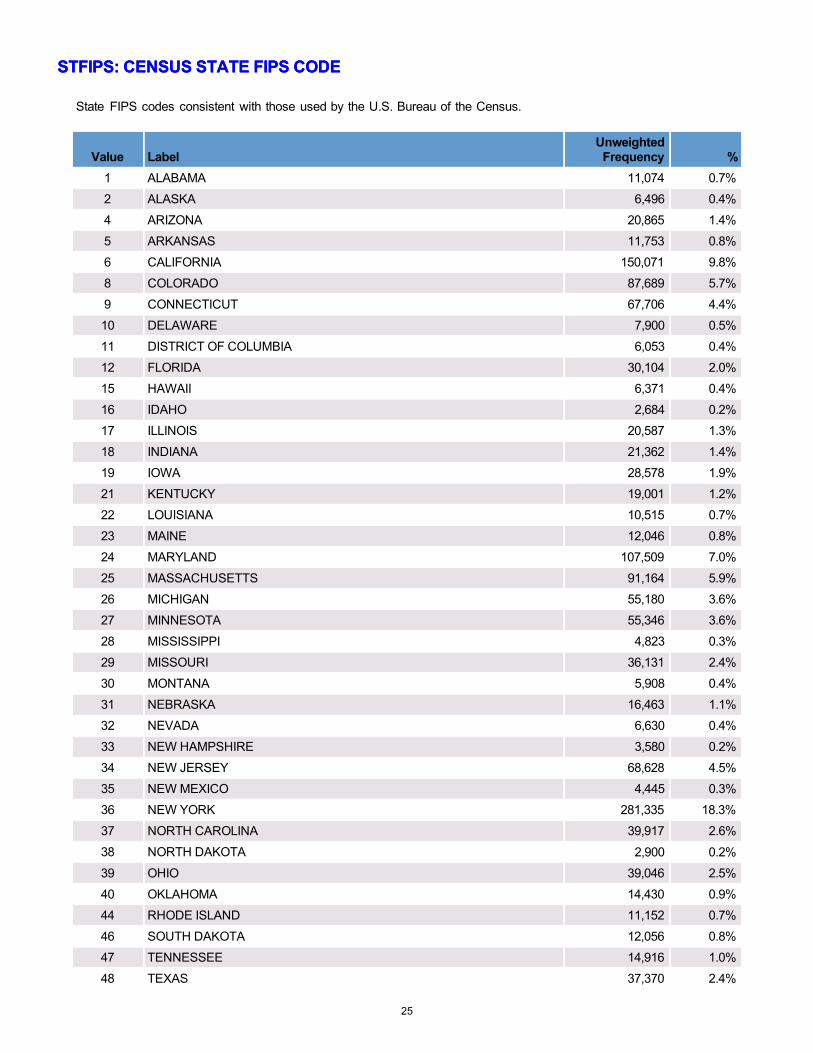
STFIPS: CENSUS STATE FIPS CODESTFIPS: CENSUS STATE FIPS CODE
State FIPS codes consistent with those used by the U.S. Bureau of the Census.
Value Label Unweighted
Frequency %
1 ALABAMA 11,074 0.7%
2 ALASKA 6,496 0.4%
4 ARIZONA 20,865 1.4%
5 ARKANSAS 11,753 0.8%
6 CALIFORNIA 150,071 9.8%
8 COLORADO 87,689 5.7%
9 CONNECTICUT 67,706 4.4%
10 DELAWARE 7,900 0.5%
11 DISTRICT OF COLUMBIA 6,053 0.4%
12 FLORIDA 30,104 2.0%
15 HAWAII 6,371 0.4%
16 IDAHO 2,684 0.2%
17 ILLINOIS 20,587 1.3%
18 INDIANA 21,362 1.4%
19 IOWA 28,578 1.9%
21 KENTUCKY 19,001 1.2%
22 LOUISIANA 10,515 0.7%
23 MAINE 12,046 0.8%
24 MARYLAND 107,509 7.0%
25 MASSACHUSETTS 91,164 5.9%
26 MICHIGAN 55,180 3.6%
27 MINNESOTA 55,346 3.6%
28 MISSISSIPPI 4,823 0.3%
29 MISSOURI 36,131 2.4%
30 MONTANA 5,908 0.4%
31 NEBRASKA 16,463 1.1%
32 NEVADA 6,630 0.4%
33 NEW HAMPSHIRE 3,580 0.2%
34 NEW JERSEY 68,628 4.5%
35 NEW MEXICO 4,445 0.3%
36 NEW YORK 281,335 18.3%
37 NORTH CAROLINA 39,917 2.6%
38 NORTH DAKOTA 2,900 0.2%
39 OHIO 39,046 2.5%
40 OKLAHOMA 14,430 0.9%
44 RHODE ISLAND 11,152 0.7%
46 SOUTH DAKOTA 12,056 0.8%
47 TENNESSEE 14,916 1.0%
48 TEXAS 37,370 2.4%
25

STFIPS: CENSUS STATE FIPS CODE
State FIPS codes consistent with those used by the U.S. Bureau of the Census.
Value Label Unweighted
Frequency %
49 UTAH 11,939 0.8%
50 VERMONT 10,318 0.7%
51 VIRGINIA 22,910 1.5%
53 WASHINGTON 34,843 2.3%
54 WEST VIRGINIA 3,029 0.2%
55 WISCONSIN 16,296 1.1%
56 WYOMING 5,563 0.4%
72 PUERTO RICO 2,343 0.2%
Total 1,537,025 100%
• Minimum: 1 • Maximum: 72
Width: 2; Decimal: 0 Variable Type: numeric
26
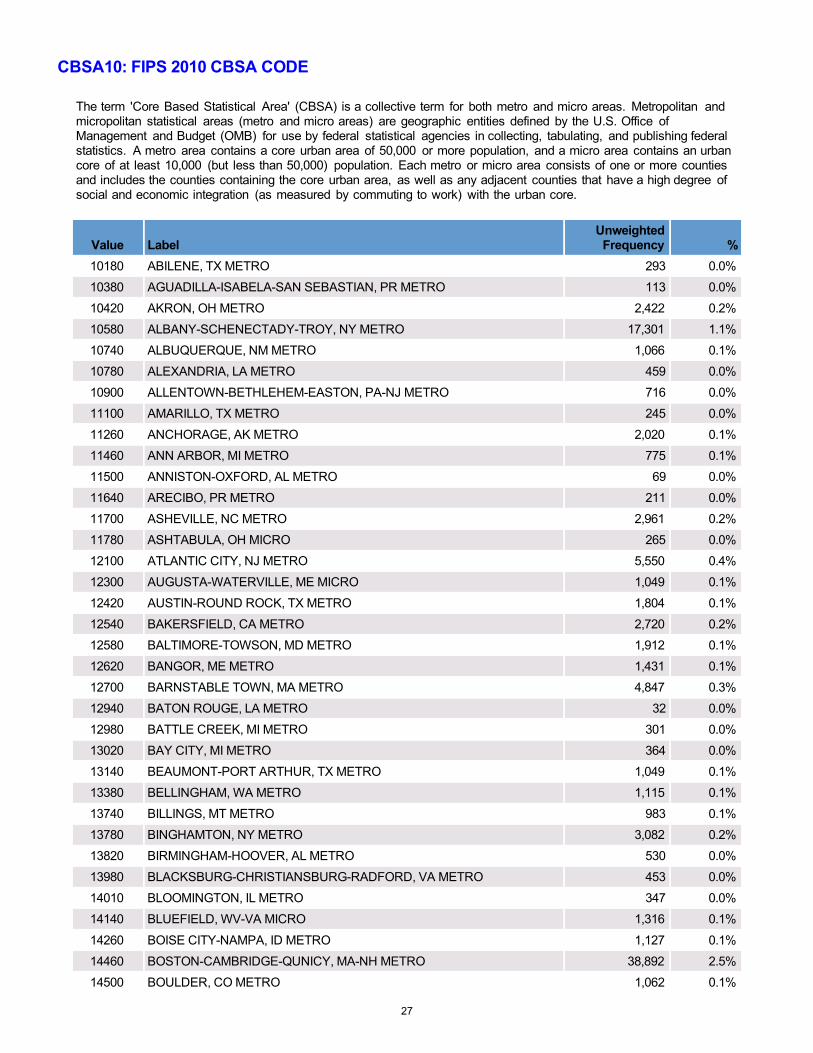
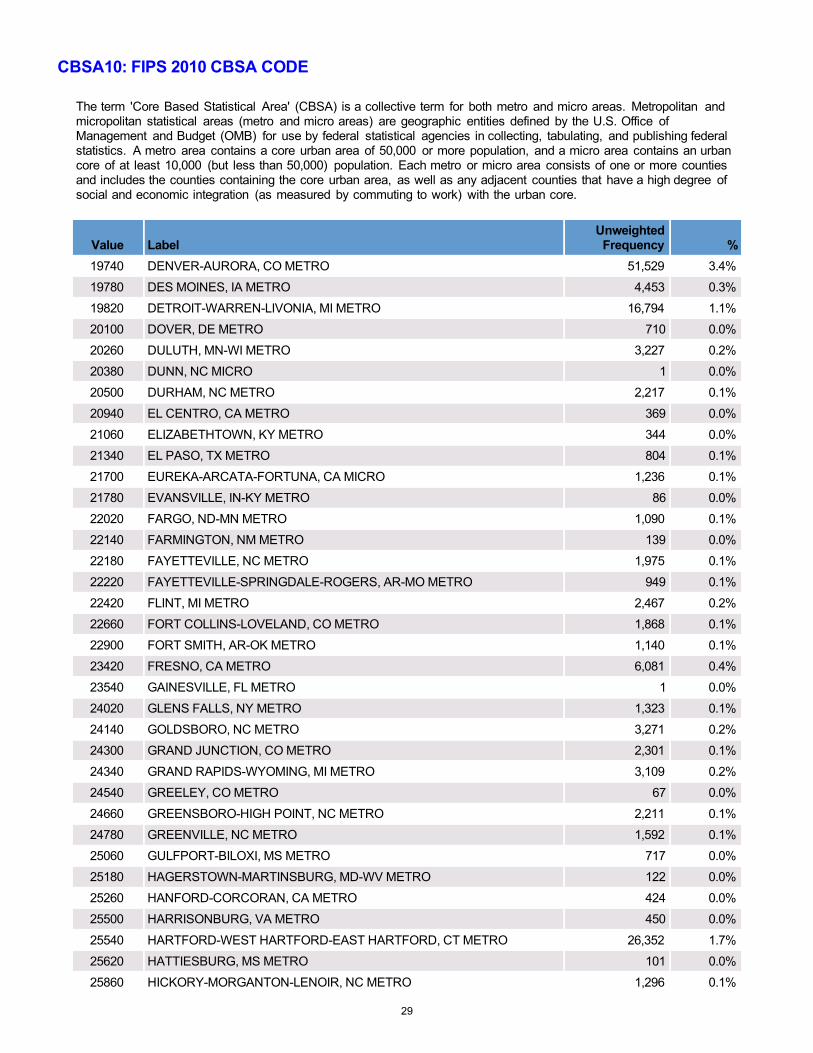
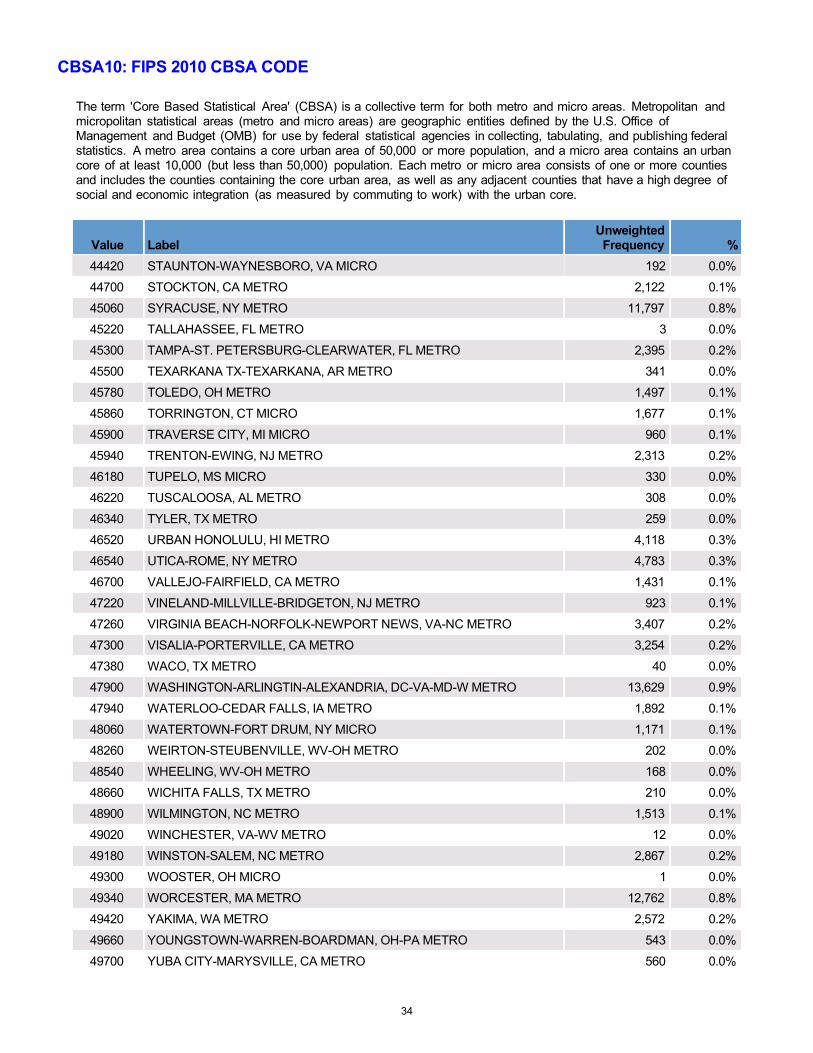
CBSA10: FIPS 2010 CBSA CODE
The term 'Core Based Statistical Area' (CBSA) is a collective term for both metro and micro areas. Metropolitan and micropolitan statistical areas (metro and micro areas) are geographic entities defined by the U.S. Office of Management and Budget (OMB) for use by federal statistical agencies in collecting, tabulating, and publishing federal statistics. A metro area contains a core urban area of 50,000 or more population, and a micro area contains an urban core of at least 10,000 (but less than 50,000) population. Each metro or micro area consists of one or more counties and includes the counties containing the core urban area, as well as any adjacent counties that have a high degree of social and economic integration (as measured by commuting to work) with the urban core.
Value Label Unweighted
Frequency %
10180 ABILENE, TX METRO 293 0.0%
10380 AGUADILLA-ISABELA-SAN SEBASTIAN, PR METRO 113 0.0%
10420 AKRON, OH METRO 2,422 0.2%
10580 ALBANY-SCHENECTADY-TROY, NY METRO 17,301 1.1%
10740 ALBUQUERQUE, NM METRO 1,066 0.1%
10780 ALEXANDRIA, LA METRO 459 0.0%
10900 ALLENTOWN-BETHLEHEM-EASTON, PA-NJ METRO 716 0.0%
11100 AMARILLO, TX METRO 245 0.0%
11260 ANCHORAGE, AK METRO 2,020 0.1%
11460 ANN ARBOR, MI METRO 775 0.1%
11500 ANNISTON-OXFORD, AL METRO 69 0.0%
11640 ARECIBO, PR METRO 211 0.0%
11700 ASHEVILLE, NC METRO 2,961 0.2%
11780 ASHTABULA, OH MICRO 265 0.0%
12100 ATLANTIC CITY, NJ METRO 5,550 0.4%
12300 AUGUSTA-WATERVILLE, ME MICRO 1,049 0.1%
12420 AUSTIN-ROUND ROCK, TX METRO 1,804 0.1%
12540 BAKERSFIELD, CA METRO 2,720 0.2%
12580 BALTIMORE-TOWSON, MD METRO 1,912 0.1%
12620 BANGOR, ME METRO 1,431 0.1%
12700 BARNSTABLE TOWN, MA METRO 4,847 0.3%
12940 BATON ROUGE, LA METRO 32 0.0%
12980 BATTLE CREEK, MI METRO 301 0.0%
13020 BAY CITY, MI METRO 364 0.0%
13140 BEAUMONT-PORT ARTHUR, TX METRO 1,049 0.1%
13380 BELLINGHAM, WA METRO 1,115 0.1%
13740 BILLINGS, MT METRO 983 0.1%
13780 BINGHAMTON, NY METRO 3,082 0.2%
13820 BIRMINGHAM-HOOVER, AL METRO 530 0.0%
13980 BLACKSBURG-CHRISTIANSBURG-RADFORD, VA METRO 453 0.0%
14010 BLOOMINGTON, IL METRO 347 0.0%
14140 BLUEFIELD, WV-VA MICRO 1,316 0.1%
14260 BOISE CITY-NAMPA, ID METRO 1,127 0.1%
14460 BOSTON-CAMBRIDGE-QUNICY, MA-NH METRO 38,892 2.5%
14500 BOULDER, CO METRO 1,062 0.1%
27
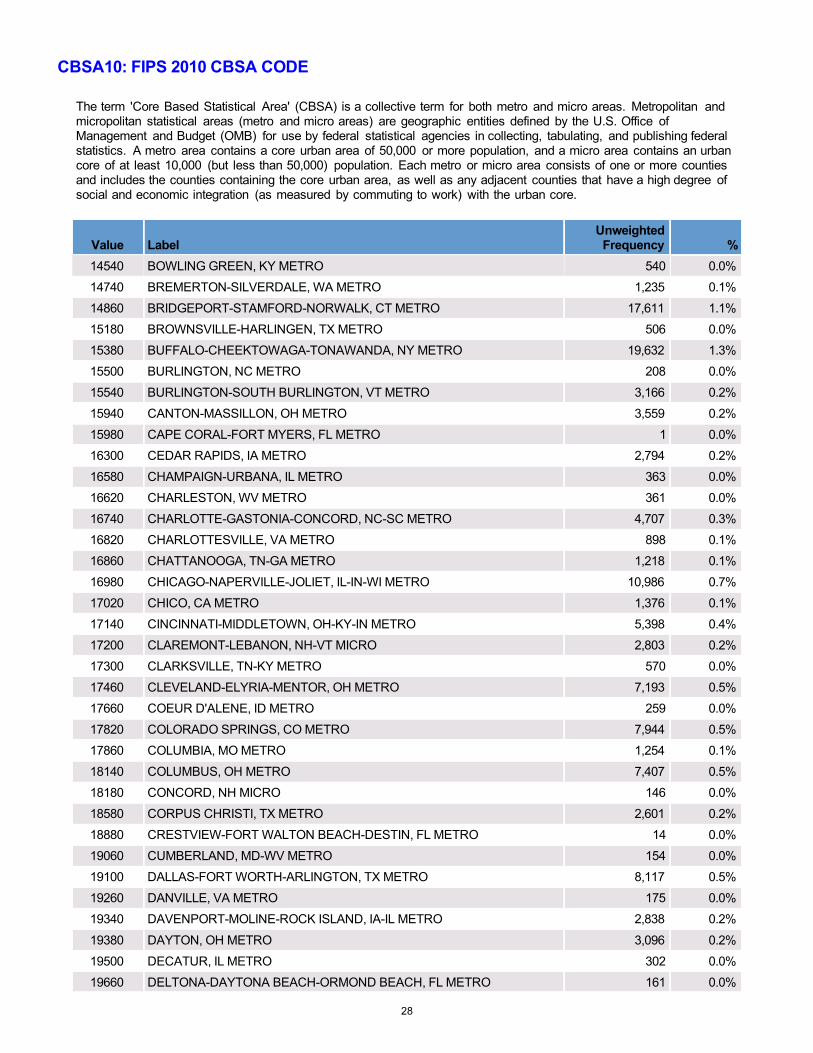
CBSA10: FIPS 2010 CBSA CODE
The term 'Core Based Statistical Area' (CBSA) is a collective term for both metro and micro areas. Metropolitan and micropolitan statistical areas (metro and micro areas) are geographic entities defined by the U.S. Office of Management and Budget (OMB) for use by federal statistical agencies in collecting, tabulating, and publishing federal statistics. A metro area contains a core urban area of 50,000 or more population, and a micro area contains an urban core of at least 10,000 (but less than 50,000) population. Each metro or micro area consists of one or more counties and includes the counties containing the core urban area, as well as any adjacent counties that have a high degree of social and economic integration (as measured by commuting to work) with the urban core.
Value Label Unweighted
Frequency %
14540 BOWLING GREEN, KY METRO 540 0.0%
14740 BREMERTON-SILVERDALE, WA METRO 1,235 0.1%
14860 BRIDGEPORT-STAMFORD-NORWALK, CT METRO 17,611 1.1%
15180 BROWNSVILLE-HARLINGEN, TX METRO 506 0.0%
15380 BUFFALO-CHEEKTOWAGA-TONAWANDA, NY METRO 19,632 1.3%
15500 BURLINGTON, NC METRO 208 0.0%
15540 BURLINGTON-SOUTH BURLINGTON, VT METRO 3,166 0.2%
15940 CANTON-MASSILLON, OH METRO 3,559 0.2%
15980 CAPE CORAL-FORT MYERS, FL METRO 1 0.0%
16300 CEDAR RAPIDS, IA METRO 2,794 0.2%
16580 CHAMPAIGN-URBANA, IL METRO 363 0.0%
16620 CHARLESTON, WV METRO 361 0.0%
16740 CHARLOTTE-GASTONIA-CONCORD, NC-SC METRO 4,707 0.3%
16820 CHARLOTTESVILLE, VA METRO 898 0.1%
16860 CHATTANOOGA, TN-GA METRO 1,218 0.1%
16980 CHICAGO-NAPERVILLE-JOLIET, IL-IN-WI METRO 10,986 0.7%
17020 CHICO, CA METRO 1,376 0.1%
17140 CINCINNATI-MIDDLETOWN, OH-KY-IN METRO 5,398 0.4%
17200 CLAREMONT-LEBANON, NH-VT MICRO 2,803 0.2%
17300 CLARKSVILLE, TN-KY METRO 570 0.0%
17460 CLEVELAND-ELYRIA-MENTOR, OH METRO 7,193 0.5%
17660 COEUR D'ALENE, ID METRO 259 0.0%
17820 COLORADO SPRINGS, CO METRO 7,944 0.5%
17860 COLUMBIA, MO METRO 1,254 0.1%
18140 COLUMBUS, OH METRO 7,407 0.5%
18180 CONCORD, NH MICRO 146 0.0%
18580 CORPUS CHRISTI, TX METRO 2,601 0.2%
18880 CRESTVIEW-FORT WALTON BEACH-DESTIN, FL METRO 14 0.0%
19060 CUMBERLAND, MD-WV METRO 154 0.0%
19100 DALLAS-FORT WORTH-ARLINGTON, TX METRO 8,117 0.5%
19260 DANVILLE, VA METRO 175 0.0%
19340 DAVENPORT-MOLINE-ROCK ISLAND, IA-IL METRO 2,838 0.2%
19380 DAYTON, OH METRO 3,096 0.2%
19500 DECATUR, IL METRO 302 0.0%
19660 DELTONA-DAYTONA BEACH-ORMOND BEACH, FL METRO 161 0.0%
28
CBSA10: FIPS 2010 CBSA CODE
The term 'Core Based Statistical Area' (CBSA) is a collective term for both metro and micro areas. Metropolitan and micropolitan statistical areas (metro and micro areas) are geographic entities defined by the U.S. Office of Management and Budget (OMB) for use by federal statistical agencies in collecting, tabulating, and publishing federal statistics. A metro area contains a core urban area of 50,000 or more population, and a micro area contains an urban core of at least 10,000 (but less than 50,000) population. Each metro or micro area consists of one or more counties and includes the counties containing the core urban area, as well as any adjacent counties that have a high degree of social and economic integration (as measured by commuting to work) with the urban core.
Value Label Unweighted
Frequency %
19740 DENVER-AURORA, CO METRO 51,529 3.4%
19780 DES MOINES, IA METRO 4,453 0.3%
19820 DETROIT-WARREN-LIVONIA, MI METRO 16,794 1.1%
20100 DOVER, DE METRO 710 0.0%
20260 DULUTH, MN-WI METRO 3,227 0.2%
20380 DUNN, NC MICRO 1 0.0%
20500 DURHAM, NC METRO 2,217 0.1%
20940 EL CENTRO, CA METRO 369 0.0%
21060 ELIZABETHTOWN, KY METRO 344 0.0%
21340 EL PASO, TX METRO 804 0.1%
21700 EUREKA-ARCATA-FORTUNA, CA MICRO 1,236 0.1%
21780 EVANSVILLE, IN-KY METRO 86 0.0%
22020 FARGO, ND-MN METRO 1,090 0.1%
22140 FARMINGTON, NM METRO 139 0.0%
22180 FAYETTEVILLE, NC METRO 1,975 0.1%
22220 FAYETTEVILLE-SPRINGDALE-ROGERS, AR-MO METRO 949 0.1%
22420 FLINT, MI METRO 2,467 0.2%
22660 FORT COLLINS-LOVELAND, CO METRO 1,868 0.1%
22900 FORT SMITH, AR-OK METRO 1,140 0.1%
23420 FRESNO, CA METRO 6,081 0.4%
23540 GAINESVILLE, FL METRO 1 0.0%
24020 GLENS FALLS, NY METRO 1,323 0.1%
24140 GOLDSBORO, NC METRO 3,271 0.2%
24300 GRAND JUNCTION, CO METRO 2,301 0.1%
24340 GRAND RAPIDS-WYOMING, MI METRO 3,109 0.2%
24540 GREELEY, CO METRO 67 0.0%
24660 GREENSBORO-HIGH POINT, NC METRO 2,211 0.1%
24780 GREENVILLE, NC METRO 1,592 0.1%
25060 GULFPORT-BILOXI, MS METRO 717 0.0%
25180 HAGERSTOWN-MARTINSBURG, MD-WV METRO 122 0.0%
25260 HANFORD-CORCORAN, CA METRO 424 0.0%
25500 HARRISONBURG, VA METRO 450 0.0%
25540 HARTFORD-WEST HARTFORD-EAST HARTFORD, CT METRO 26,352 1.7%
25620 HATTIESBURG, MS METRO 101 0.0%
25860 HICKORY-MORGANTON-LENOIR, NC METRO 1,296 0.1%
29

CBSA10: FIPS 2010 CBSA CODE
The term 'Core Based Statistical Area' (CBSA) is a collective term for both metro and micro areas. Metropolitan and micropolitan statistical areas (metro and micro areas) are geographic entities defined by the U.S. Office of Management and Budget (OMB) for use by federal statistical agencies in collecting, tabulating, and publishing federal statistics. A metro area contains a core urban area of 50,000 or more population, and a micro area contains an urban core of at least 10,000 (but less than 50,000) population. Each metro or micro area consists of one or more counties and includes the counties containing the core urban area, as well as any adjacent counties that have a high degree of social and economic integration (as measured by commuting to work) with the urban core.
Value Label Unweighted
Frequency %
25900 HILO, HI MICRO 934 0.1%
26090 HOLLAND, MI MICRO 69 0.0%
26420 HOUSTON-BAYTOWN-SUGAR LAND, TX METRO 7,420 0.5%
26580 HUNTINGTON-ASHLAND, WV-KY-OH METRO 874 0.1%
26820 IDAHO FALLS, ID METRO 226 0.0%
26900 INDIANAPOLIS, IN METRO 1,332 0.1%
26980 IOWA CITY, IA METRO 2,652 0.2%
27100 JACKSON, MI METRO 595 0.0%
27140 JACKSON, MS METRO 1,356 0.1%
27180 JACKSON, TN METRO 499 0.0%
27260 JACKSONVILLE, FL METRO 165 0.0%
27340 JACKSONVILLE, NC METRO 289 0.0%
27460 JAMESTOWN-DUNKIRK-FREDONIA, NY MICRO 1,151 0.1%
27620 JEFFERSON CITY, MO METRO 836 0.1%
27740 JOHNSON, CITYTN METRO 943 0.1%
27860 JONESBORO, AR METRO 443 0.0%
27900 JOPLIN, MO METRO 1,535 0.1%
27980 KAHULUI-WAILUKU, HI MICRO 1,060 0.1%
28020 KALAMAZOO-PORTAGE, MI METRO 1,649 0.1%
28100 KANKAKEE-BRADLEY, IL METRO 338 0.0%
28140 KANSAS CITY, MO-KS METRO 7,099 0.5%
28420 KENNEWICK-RICHLAND-PASCO, WA METRO 697 0.0%
28660 KILLEEN-TEMPLE-FORT HOOD, TX METRO 195 0.0%
28700 KINGSPORT-BRISTOL, TN-VA METRO 1,098 0.1%
28740 KINGSTON, NY METRO 3,032 0.2%
28940 KNOXVILLE, TN METRO 1,410 0.1%
29100 LA CROSSE, WI-MN METRO 54 0.0%
29180 LAFAYETTE, LA METRO 1 0.0%
29340 LAKE CHARLES, LA METRO 2 0.0%
29460 LAKELAND-WINTER HAVEN, FL METRO 3 0.0%
29620 LANSING-EAST LANSING, MI METRO 1,233 0.1%
29700 LAREDO, TX METRO 473 0.0%
29820 LAS VEGAS-PARADISE, NV METRO 3,113 0.2%
30340 LEWISTON-AUBURN, ME METRO 1,172 0.1%
30460 LEXINGTON-FAYETTE, KY METRO 1,423 0.1%
30
CBSA10: FIPS 2010 CBSA CODE
The term 'Core Based Statistical Area' (CBSA) is a collective term for both metro and micro areas. Metropolitan and micropolitan statistical areas (metro and micro areas) are geographic entities defined by the U.S. Office of Management and Budget (OMB) for use by federal statistical agencies in collecting, tabulating, and publishing federal statistics. A metro area contains a core urban area of 50,000 or more population, and a micro area contains an urban core of at least 10,000 (but less than 50,000) population. Each metro or micro area consists of one or more counties and includes the counties containing the core urban area, as well as any adjacent counties that have a high degree of social and economic integration (as measured by commuting to work) with the urban core.
Value Label Unweighted
Frequency %
30620 LIMA, OH METRO 203 0.0%
30700 LINCOLN, NE METRO 6,764 0.4%
30780 LITTLE ROCK-NORTH LITTLE ROCK, AR METRO 1,996 0.1%
30860 LOGAN, UT-ID METRO 565 0.0%
30980 LONGVIEW, TX METRO 503 0.0%
31080 LOS ANGELES-LONG BEACH-ANAHEIM, CA METRO 33,547 2.2%
31140 LOUISVILLE, KY-IN METRO 6,591 0.4%
31180 LUBBOCK, TX METRO 745 0.0%
31300 LUMBERTON, NC MICRO 560 0.0%
31340 LYNCHBURG, VA METRO 531 0.0%
31460 MADERA, CA METRO 439 0.0%
31700 MANCHESTER-NASHUA, NH METRO 1,226 0.1%
31900 MANSFIELD, OH METRO 45 0.0%
32420 MAYAGUEZ, PR METRO 152 0.0%
32580 MCALLEN-EDINBURG-PHARR, TX METRO 108 0.0%
32820 MEMPHIS, TN-MS-AR METRO 2,513 0.2%
32900 MERCED, CA METRO 846 0.1%
32940 MERIDIAN, MS MICRO 368 0.0%
33100 MIAMI-FORT LAUDERDALE-MIAMI BEACH, FL METRO 5,424 0.4%
33260 MIDLAND, TX METRO 355 0.0%
33460 MINNEAPOLIS-ST. PAUL-BLOOMINGTON, MN-WI METRO 34,094 2.2%
33700 MODESTO, CA METRO 1,996 0.1%
33740 MONROE, LA METRO 23 0.0%
33780 MONROE, MI METRO 434 0.0%
34060 MORGANTOWN, WV METRO 135 0.0%
34100 MORRISTOWN, TN METRO 146 0.0%
34580 MOUNT VERNON-ANACORTES, WA METRO 1,228 0.1%
34740 MUSKEGON-NORTON SHORES, MI METRO 954 0.1%
34820 MYRTLE BEACH-CONWAY-NORTH MYRTLE BEACH, SC METRO 287 0.0%
34900 NAPA, CA METRO 1,024 0.1%
34940 NAPLES-MARCO ISLAND, FL METRO 1 0.0%
34980 NASHVILLE-DAVIDSON--MURFREESBORO, TN METRO 1,772 0.1%
35100 NEW BERN, NC MICRO 1,260 0.1%
35300 NEW HAVEN-MILFORD, CT METRO 11,294 0.7%
35380 NEW ORLEANS-METAIRIE-KENNER, LA METRO 1,303 0.1%
31
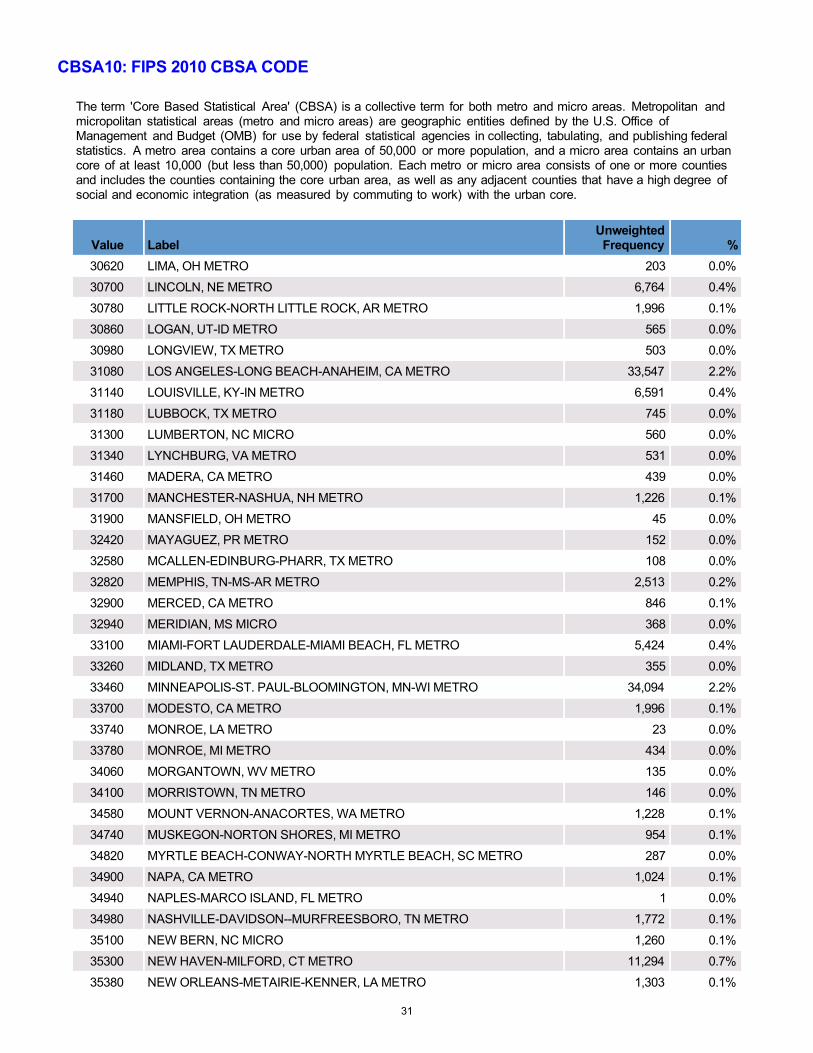
CBSA10: FIPS 2010 CBSA CODE
The term 'Core Based Statistical Area' (CBSA) is a collective term for both metro and micro areas. Metropolitan and micropolitan statistical areas (metro and micro areas) are geographic entities defined by the U.S. Office of Management and Budget (OMB) for use by federal statistical agencies in collecting, tabulating, and publishing federal statistics. A metro area contains a core urban area of 50,000 or more population, and a micro area contains an urban core of at least 10,000 (but less than 50,000) population. Each metro or micro area consists of one or more counties and includes the counties containing the core urban area, as well as any adjacent counties that have a high degree of social and economic integration (as measured by commuting to work) with the urban core.
Value Label Unweighted
Frequency %
35620 NEW YORK-NEWARK-EDISON, NY-NJ-PA METRO 211,389 13.8%
35660 NILES-BENTON HARBOR, MI METRO 273 0.0%
35840 NORTH PORT-SARASOTA-BRADENTON, FL METRO 2 0.0%
35980 NORWICH-NEW LONDON, CT METRO 8,168 0.5%
36100 OCALA, FL METRO 7 0.0%
36220 ODESSA, TX METRO 385 0.0%
36260 OGDEN-CLEARFIELD, UT METRO 1,855 0.1%
36300 OGDENSBURG-MASSENA, NY MICRO 2,774 0.2%
36500 OLYMPIA, WA METRO 1,103 0.1%
36540 OMAHA-COUNCIL BLUFFS, NE-IA METRO 5,620 0.4%
36740 ORLANDO, FL METRO 93 0.0%
36860 OTTAWA-STREATOR, IL MICRO 106 0.0%
36980 OWENSBORO, KY METRO 632 0.0%
37100 OXNARD-VENTURA-THOUSAND OAKS VENTURA, CA METRO 3,646 0.2%
37460 PANAMA CITY-LYNN HAVEN, FL METRO 67 0.0%
37860 PENSACOLA-FERRY PASS-BRENT, FL METRO 26 0.0%
37900 PEORIA, IL METRO 1,572 0.1%
37980 PHILADELPHIA-CAMDEN-WILMINGTON, PA-NJ-DE-M METRO 14,759 1.0%
38220 PINE BLUFF, AR METRO 867 0.1%
38340 PITTTSFIELD, MA METRO 2,570 0.2%
38660 PONCE, PR METRO 451 0.0%
38860 PORTLAND-SOUTH PORTLAND, ME METRO 5,553 0.4%
38900 PORTLAND-VANCOUVER-BEAVERTON, OR-WA METRO 2,010 0.1%
38940 PORT ST. LUCIE, FL METRO 813 0.1%
39300 PROVIDENCE-NEW BEDFORD-FALL RIVER, RI-MA METRO 20,451 1.3%
39340 PROVO-OREM, UT METRO 932 0.1%
39380 PUEBLO, CO METRO 3,547 0.2%
39580 RALEIGH-CARY, NC METRO 3,430 0.2%
39660 RAPID CITY, SD METRO 4,568 0.3%
39820 REDDING, CA METRO 1,275 0.1%
39900 RENO-SPARKS, NV METRO 1,879 0.1%
40060 RICHMOND, VA METRO 3,231 0.2%
40140 RIVERSIDE-SAN BERNARDINO-ONTARIO, CA METRO 13,467 0.9%
40220 ROANOKE, VA METRO 2,016 0.1%
40340 ROCHESTER, MN METRO 2,082 0.1%
32
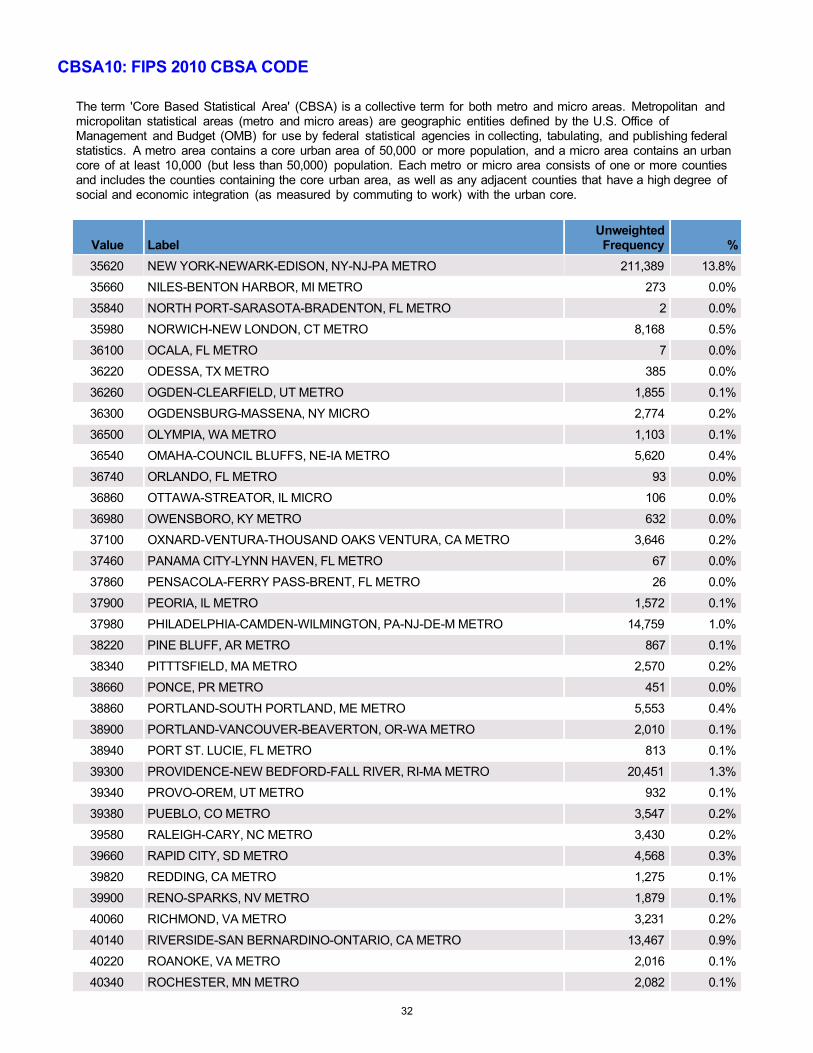
CBSA10: FIPS 2010 CBSA CODE
The term 'Core Based Statistical Area' (CBSA) is a collective term for both metro and micro areas. Metropolitan and micropolitan statistical areas (metro and micro areas) are geographic entities defined by the U.S. Office of Management and Budget (OMB) for use by federal statistical agencies in collecting, tabulating, and publishing federal statistics. A metro area contains a core urban area of 50,000 or more population, and a micro area contains an urban core of at least 10,000 (but less than 50,000) population. Each metro or micro area consists of one or more counties and includes the counties containing the core urban area, as well as any adjacent counties that have a high degree of social and economic integration (as measured by commuting to work) with the urban core.
Value Label Unweighted
Frequency %
40380 ROCHESTER, NY METRO 16,863 1.1%
40420 ROCKFORD, IL METRO 525 0.0%
40580 ROCKY MOUNT, NC METRO 275 0.0%
40900 SACRAMENTO--ARDEN-ARCADE--ROSEVILLE, CA METRO 8,861 0.6%
40980 SAGINAW-SAGINZW TOWNSHIP NORTH, MI METRO 1,603 0.1%
41060 SAINT CLOUD, MN METRO 2,737 0.2%
41140 SAINT JOSEPH, MO-KS METRO 661 0.0%
41180 SAINT LOUIS, MO-IL METRO 10,532 0.7%
41400 SALEM, OH MICRO 1,255 0.1%
41500 SALINAS, CA METRO 989 0.1%
41540 SALISBURY, MD METRO 911 0.1%
41620 SALT LAKE CITY, UT METRO 7,538 0.5%
41660 SAN ANGELO, TX METRO 236 0.0%
41700 SAN ANTONIO, TX METRO 4,094 0.3%
41740 SAN DIEGO-CARLSBAD-SAN MARCOS, CA METRO 13,159 0.9%
41860 SAN FRANCISCO-OAKLAND-FREMONT, CA METRO 18,804 1.2%
41940 SAN JOSE-SUNNYVALE-SANTA CLARA, CA METRO 7,404 0.5%
41980 SAN JUAN-CAGUAS-GUAYNABO, PR METRO 1,404 0.1%
42020 SAN LUIS OBISPO-PASO ROBLES, CA METRO 1,194 0.1%
42100 SANTA CRUZ-WATSONVILLE, CA METRO 1,774 0.1%
42140 SANTA FE, NM METRO 1,326 0.1%
42200 SANTA MARIA-SANTA BARBARA, CA METRO 2,989 0.2%
42220 SANTA ROSA, CA METRO 4,520 0.3%
42660 SEATTLE-TACOMA-BELLEVUE, WA METRO 12,517 0.8%
42680 SEBASTIAN-VERO BEACH, FL METRO 78 0.0%
43300 SHERMAN-DENISON, TX METRO 162 0.0%
43340 SHREVEPORT-BOSSIER CITY, LA METRO 633 0.0%
43580 SIOUX CITY, IA-NE-SD METRO 2,184 0.1%
43620 SIOUX FALLS, SD METRO 3,769 0.2%
43780 SOUTH BEND-MISHAWAKA, IN-MI METRO 80 0.0%
44060 SPOKANE, WA METRO 3,847 0.3%
44100 SPRINGFIELD, IL METRO 611 0.0%
44140 SPRINGFIELD, MA METRO 7,742 0.5%
44180 SPRINGFIELD, MO METRO 2,929 0.2%
44220 SPRINGFIELD, OH METRO 292 0.0%
33
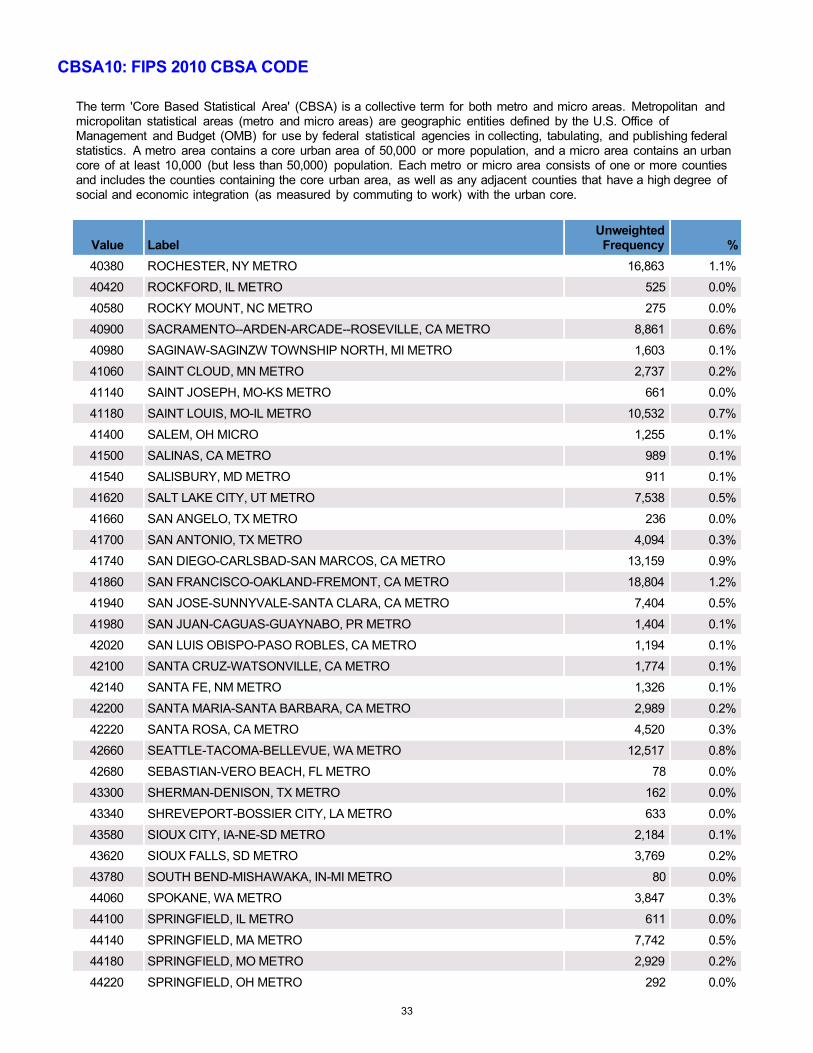
CBSA10: FIPS 2010 CBSA CODE
The term 'Core Based Statistical Area' (CBSA) is a collective term for both metro and micro areas. Metropolitan and micropolitan statistical areas (metro and micro areas) are geographic entities defined by the U.S. Office of Management and Budget (OMB) for use by federal statistical agencies in collecting, tabulating, and publishing federal statistics. A metro area contains a core urban area of 50,000 or more population, and a micro area contains an urban core of at least 10,000 (but less than 50,000) population. Each metro or micro area consists of one or more counties and includes the counties containing the core urban area, as well as any adjacent counties that have a high degree of social and economic integration (as measured by commuting to work) with the urban core.
Value Label Unweighted
Frequency %
44420 STAUNTON-WAYNESBORO, VA MICRO 192 0.0%
44700 STOCKTON, CA METRO 2,122 0.1%
45060 SYRACUSE, NY METRO 11,797 0.8%
45220 TALLAHASSEE, FL METRO 3 0.0%
45300 TAMPA-ST. PETERSBURG-CLEARWATER, FL METRO 2,395 0.2%
45500 TEXARKANA TX-TEXARKANA, AR METRO 341 0.0%
45780 TOLEDO, OH METRO 1,497 0.1%
45860 TORRINGTON, CT MICRO 1,677 0.1%
45900 TRAVERSE CITY, MI MICRO 960 0.1%
45940 TRENTON-EWING, NJ METRO 2,313 0.2%
46180 TUPELO, MS MICRO 330 0.0%
46220 TUSCALOOSA, AL METRO 308 0.0%
46340 TYLER, TX METRO 259 0.0%
46520 URBAN HONOLULU, HI METRO 4,118 0.3%
46540 UTICA-ROME, NY METRO 4,783 0.3%
46700 VALLEJO-FAIRFIELD, CA METRO 1,431 0.1%
47220 VINELAND-MILLVILLE-BRIDGETON, NJ METRO 923 0.1%
47260 VIRGINIA BEACH-NORFOLK-NEWPORT NEWS, VA-NC METRO 3,407 0.2%
47300 VISALIA-PORTERVILLE, CA METRO 3,254 0.2%
47380 WACO, TX METRO 40 0.0%
47900 WASHINGTON-ARLINGTIN-ALEXANDRIA, DC-VA-MD-W METRO 13,629 0.9%
47940 WATERLOO-CEDAR FALLS, IA METRO 1,892 0.1%
48060 WATERTOWN-FORT DRUM, NY MICRO 1,171 0.1%
48260 WEIRTON-STEUBENVILLE, WV-OH METRO 202 0.0%
48540 WHEELING, WV-OH METRO 168 0.0%
48660 WICHITA FALLS, TX METRO 210 0.0%
48900 WILMINGTON, NC METRO 1,513 0.1%
49020 WINCHESTER, VA-WV METRO 12 0.0%
49180 WINSTON-SALEM, NC METRO 2,867 0.2%
49300 WOOSTER, OH MICRO 1 0.0%
49340 WORCESTER, MA METRO 12,762 0.8%
49420 YAKIMA, WA METRO 2,572 0.2%
49660 YOUNGSTOWN-WARREN-BOARDMAN, OH-PA METRO 543 0.0%
49700 YUBA CITY-MARYSVILLE, CA METRO 560 0.0%
34

CBSA10: FIPS 2010 CBSA CODE
The term 'Core Based Statistical Area' (CBSA) is a collective term for both metro and micro areas. Metropolitan and micropolitan statistical areas (metro and micro areas) are geographic entities defined by the U.S. Office of Management and Budget (OMB) for use by federal statistical agencies in collecting, tabulating, and publishing federal statistics. A metro area contains a core urban area of 50,000 or more population, and a micro area contains an urban core of at least 10,000 (but less than 50,000) population. Each metro or micro area consists of one or more counties and includes the counties containing the core urban area, as well as any adjacent counties that have a high degree of social and economic integration (as measured by commuting to work) with the urban core.
Value Label Unweighted
Frequency %
-9 UNDESIGNATED AREA/MISSING/UNKNOWN/NOT COLLECTED/INVALID
Total
466,562
1,537,025
30.4%
100%
• Minimum: 10180 • Maximum: 49700
Width: 5; Decimal: 0 Variable Type: numeric
35
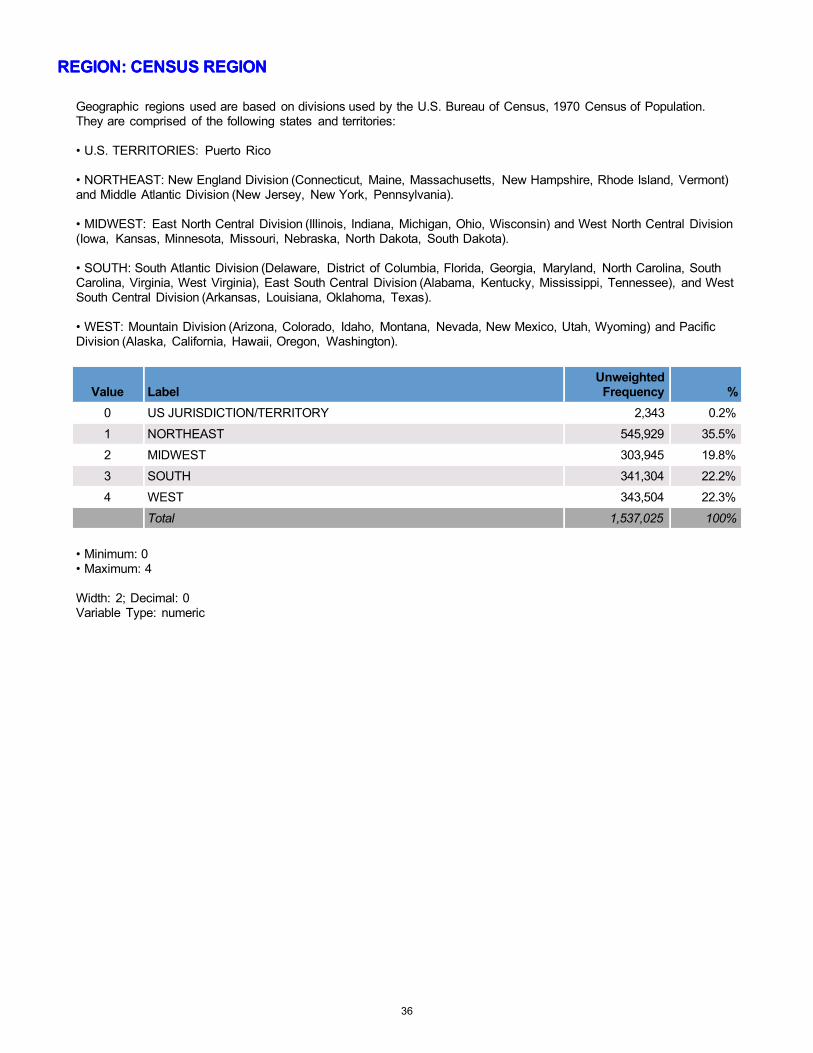
REGION: CENSUS REGIONREGION: CENSUS REGION
Geographic regions used are based on divisions used by the U.S. Bureau of Census, 1970 Census of Population. They are comprised of the following states and territories:
• U.S. TERRITORIES: Puerto Rico
• NORTHEAST: New England Division (Connecticut, Maine, Massachusetts, New Hampshire, Rhode Island, Vermont) and Middle Atlantic Division (New Jersey, New York, Pennsylvania).
• MIDWEST: East North Central Division (Illinois, Indiana, Michigan, Ohio, Wisconsin) and West North Central Division (Iowa, Kansas, Minnesota, Missouri, Nebraska, North Dakota, South Dakota).
• SOUTH: South Atlantic Division (Delaware, District of Columbia, Florida, Georgia, Maryland, North Carolina, South Carolina, Virginia, West Virginia), East South Central Division (Alabama, Kentucky, Mississippi, Tennessee), and West South Central Division (Arkansas, Louisiana, Oklahoma, Texas).
• WEST: Mountain Division (Arizona, Colorado, Idaho, Montana, Nevada, New Mexico, Utah, Wyoming) and Pacific Division (Alaska, California, Hawaii, Oregon, Washington).
Value Label Unweighted
Frequency %
0 US JURISDICTION/TERRITORY 2,343 0.2%
1 NORTHEAST 545,929 35.5%
2 MIDWEST 303,945 19.8%
3 SOUTH 341,304 22.2%
4 WEST 343,504 22.3%
Total 1,537,025 100%
• Minimum: 0 • Maximum: 4
Width: 2; Decimal: 0 Variable Type: numeric
36
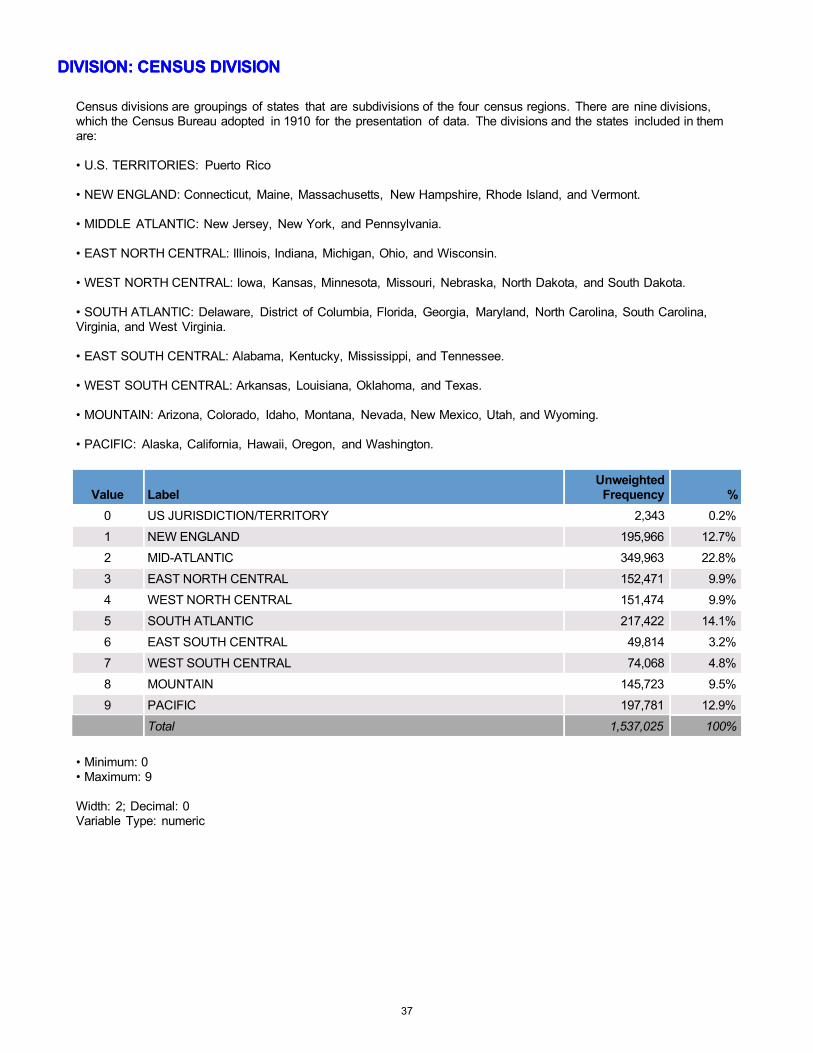
DIVISION: CENSUS DIVISIONDIVISION: CENSUS DIVISION
Census divisions are groupings of states that are subdivisions of the four census regions. There are nine divisions, which the Census Bureau adopted in 1910 for the presentation of data. The divisions and the states included in them are:
• U.S. TERRITORIES: Puerto Rico
• NEW ENGLAND: Connecticut, Maine, Massachusetts, New Hampshire, Rhode Island, and Vermont.
• MIDDLE ATLANTIC: New Jersey, New York, and Pennsylvania.
• EAST NORTH CENTRAL: Illinois, Indiana, Michigan, Ohio, and Wisconsin.
• WEST NORTH CENTRAL: Iowa, Kansas, Minnesota, Missouri, Nebraska, North Dakota, and South Dakota.
• SOUTH ATLANTIC: Delaware, District of Columbia, Florida, Georgia, Maryland, North Carolina, South Carolina, Virginia, and West Virginia.
• EAST SOUTH CENTRAL: Alabama, Kentucky, Mississippi, and Tennessee.
• WEST SOUTH CENTRAL: Arkansas, Louisiana, Oklahoma, and Texas.
• MOUNTAIN: Arizona, Colorado, Idaho, Montana, Nevada, New Mexico, Utah, and Wyoming.
• PACIFIC: Alaska, California, Hawaii, Oregon, and Washington.
Value Label Unweighted
Frequency %
0 US JURISDICTION/TERRITORY 2,343 0.2%
1 NEW ENGLAND 195,966 12.7%
2 MID-ATLANTIC 349,963 22.8%
3 EAST NORTH CENTRAL 152,471 9.9%
4 WEST NORTH CENTRAL 151,474 9.9%
5 SOUTH ATLANTIC 217,422 14.1%
6 EAST SOUTH CENTRAL 49,814 3.2%
7 WEST SOUTH CENTRAL 74,068 4.8%
8 MOUNTAIN 145,723 9.5%
9 PACIFIC 197,781 12.9%
Total 1,537,025 100%
• Minimum: 0 • Maximum: 9
Width: 2; Decimal: 0 Variable Type: numeric
37
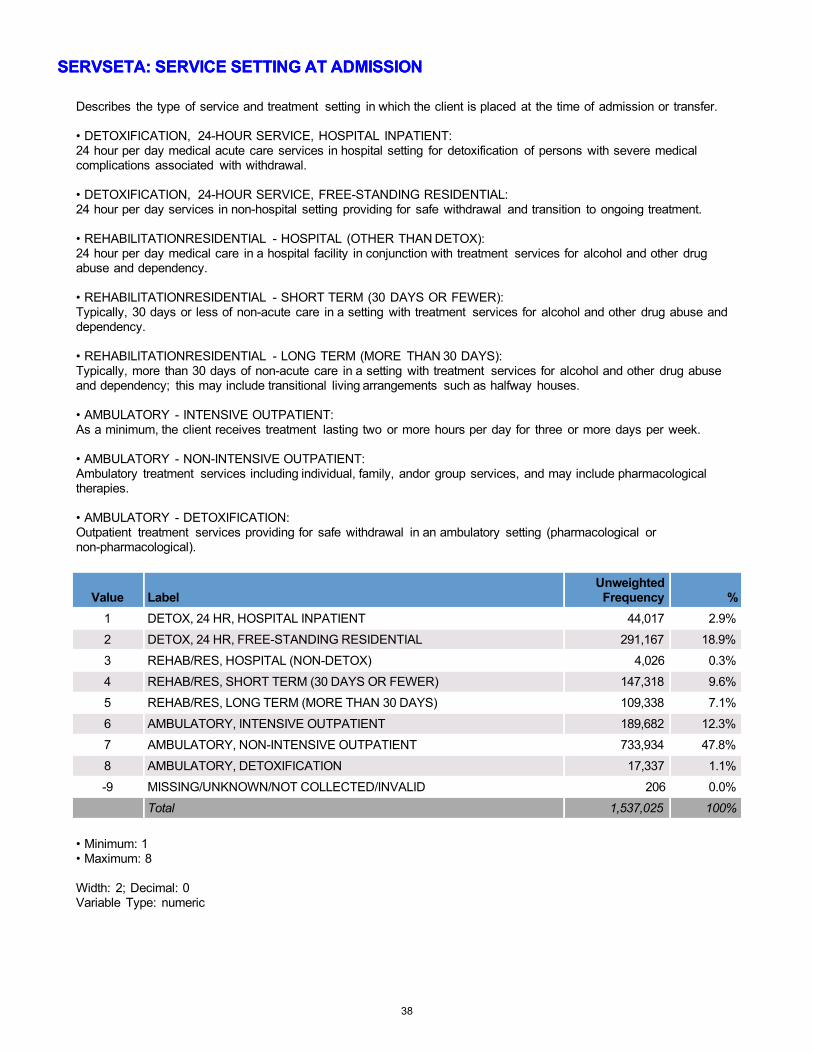
SERVSETA: SERVICE SETTING AT ADMISSIONSERVSETA: SERVICE SETTING AT ADMISSION
Describes the type of service and treatment setting in which the client is placed at the time of admission or transfer.
• DETOXIFICATION, 24-HOUR SERVICE, HOSPITAL INPATIENT: 24 hour per day medical acute care services in hospital setting for detoxification of persons with severe medical complications associated with withdrawal.
• DETOXIFICATION, 24-HOUR SERVICE, FREE-STANDING RESIDENTIAL: 24 hour per day services in non-hospital setting providing for safe withdrawal and transition to ongoing treatment.
• REHABILITATIONRESIDENTIAL - HOSPITAL (OTHER THAN DETOX): 24 hour per day medical care in a hospital facility in conjunction with treatment services for alcohol and other drug abuse and dependency.
• REHABILITATIONRESIDENTIAL - SHORT TERM (30 DAYS OR FEWER): Typically, 30 days or less of non-acute care in a setting with treatment services for alcohol and other drug abuse and dependency.
• REHABILITATIONRESIDENTIAL - LONG TERM (MORE THAN 30 DAYS): Typically, more than 30 days of non-acute care in a setting with treatment services for alcohol and other drug abuse and dependency; this may include transitional living arrangements such as halfway houses.
• AMBULATORY - INTENSIVE OUTPATIENT: As a minimum, the client receives treatment lasting two or more hours per day for three or more days per week.
• AMBULATORY - NON-INTENSIVE OUTPATIENT: Ambulatory treatment services including individual, family, andor group services, and may include pharmacological therapies.
• AMBULATORY - DETOXIFICATION: Outpatient treatment services providing for safe withdrawal in an ambulatory setting (pharmacological or non-pharmacological).
Value Label Unweighted
Frequency %
1 DETOX, 24 HR, HOSPITAL INPATIENT 44,017 2.9%
2 DETOX, 24 HR, FREE-STANDING RESIDENTIAL 291,167 18.9%
3 REHAB/RES, HOSPITAL (NON-DETOX) 4,026 0.3%
4 REHAB/RES, SHORT TERM (30 DAYS OR FEWER) 147,318 9.6%
5 REHAB/RES, LONG TERM (MORE THAN 30 DAYS) 109,338 7.1%
6 AMBULATORY, INTENSIVE OUTPATIENT 189,682 12.3%
7 AMBULATORY, NON-INTENSIVE OUTPATIENT 733,934 47.8%
8 AMBULATORY, DETOXIFICATION 17,337 1.1%
-9 MISSING/UNKNOWN/NOT COLLECTED/INVALID 206 0.0%
Total 1,537,025 100%
• Minimum: 1 • Maximum: 8
Width: 2; Decimal: 0 Variable Type: numeric
38
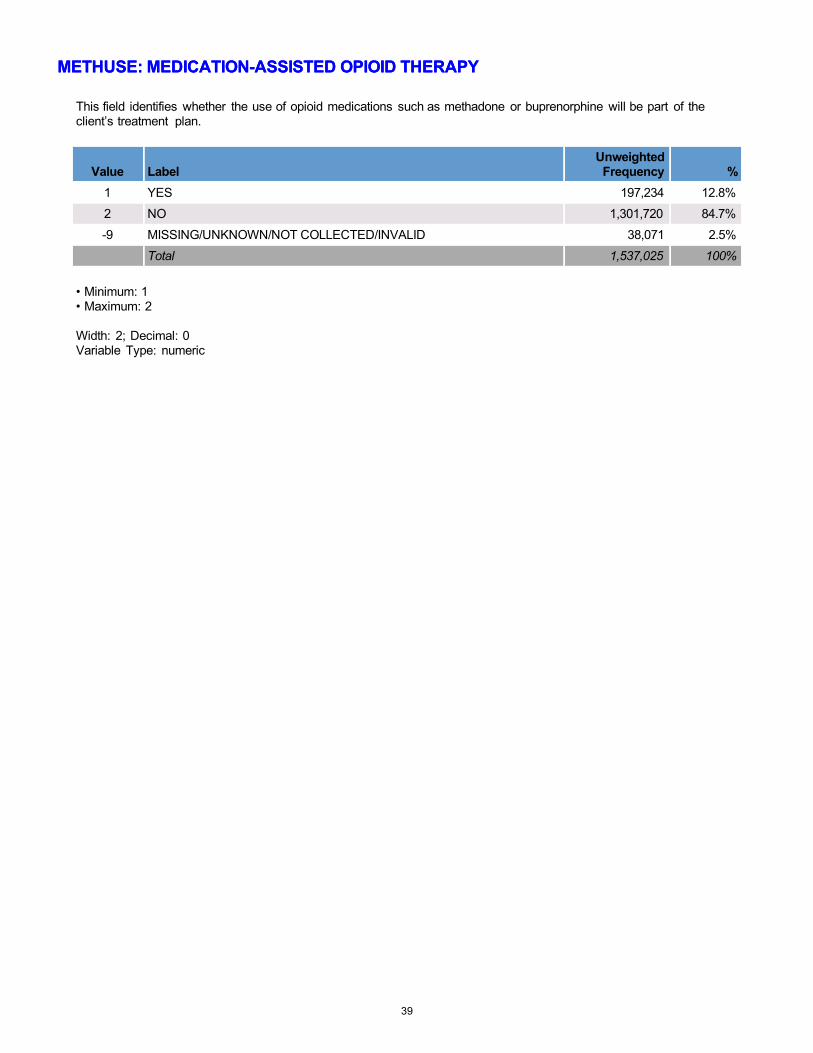
METHUSE: MEDICATION-ASSISTED OPIOID THERAPYMETHUSE: MEDICATION-ASSISTED OPIOID THERAPY
This field identifies whether the use of opioid medications such as methadone or buprenorphine will be part of the client’s treatment plan.
Value Label Unweighted
Frequency %
1 YES 197,234 12.8%
2 NO 1,301,720 84.7%
-9 MISSING/UNKNOWN/NOT COLLECTED/INVALID 38,071 2.5%
Total 1,537,025 100%
• Minimum: 1 • Maximum: 2
Width: 2; Decimal: 0 Variable Type: numeric
39
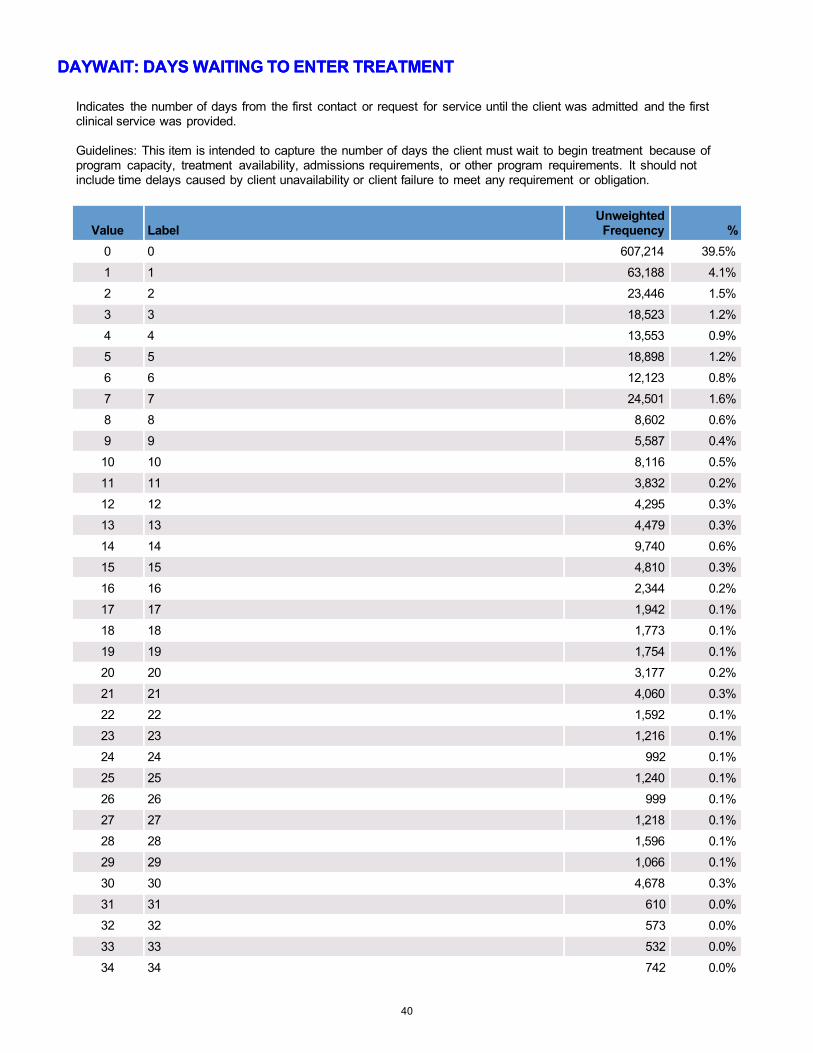
DAYWAIT: DAYS WAITING TO ENTER TREATMENTDAYWAIT: DAYS WAITING TO ENTER TREATMENT
Indicates the number of days from the first contact or request for service until the client was admitted and the first clinical service was provided.
Guidelines: This item is intended to capture the number of days the client must wait to begin treatment because of program capacity, treatment availability, admissions requirements, or other program requirements. It should not include time delays caused by client unavailability or client failure to meet any requirement or obligation.
Value Label Unweighted
Frequency %
0 0 607,214 39.5%
1 1 63,188 4.1%
2 2 23,446 1.5%
3 3 18,523 1.2%
4 4 13,553 0.9%
5 5 18,898 1.2%
6 6 12,123 0.8%
7 7 24,501 1.6%
8 8 8,602 0.6%
9 9 5,587 0.4%
10 10 8,116 0.5%
11 11 3,832 0.2%
12 12 4,295 0.3%
13 13 4,479 0.3%
14 14 9,740 0.6%
15 15 4,810 0.3%
16 16 2,344 0.2%
17 17 1,942 0.1%
18 18 1,773 0.1%
19 19 1,754 0.1%
20 20 3,177 0.2%
21 21 4,060 0.3%
22 22 1,592 0.1%
23 23 1,216 0.1%
24 24 992 0.1%
25 25 1,240 0.1%
26 26 999 0.1%
27 27 1,218 0.1%
28 28 1,596 0.1%
29 29 1,066 0.1%
30 30 4,678 0.3%
31 31 610 0.0%
32 32 573 0.0%
33 33 532 0.0%
34 34 742 0.0%
40
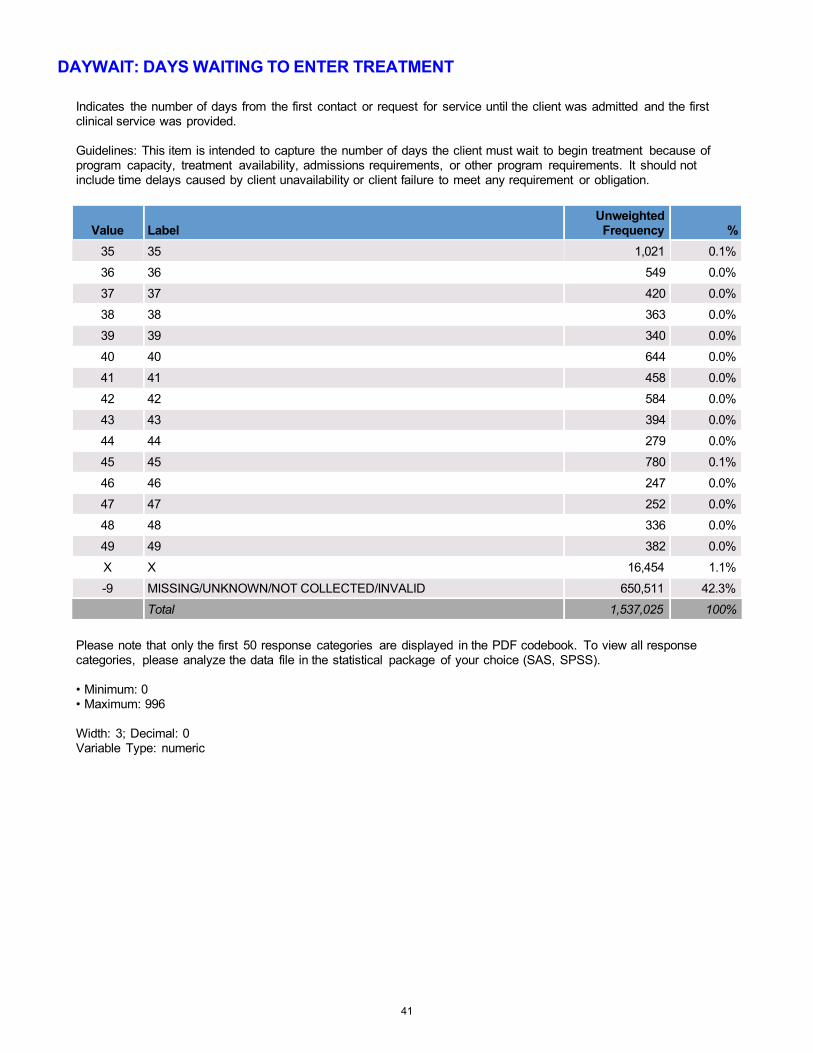
DAYWAIT: DAYS WAITING TO ENTER TREATMENT
Indicates the number of days from the first contact or request for service until the client was admitted and the first clinical service was provided.
Guidelines: This item is intended to capture the number of days the client must wait to begin treatment because of program capacity, treatment availability, admissions requirements, or other program requirements. It should not include time delays caused by client unavailability or client failure to meet any requirement or obligation.
Value Label Unweighted
Frequency %
35 35 1,021 0.1%
36 36 549 0.0%
37 37 420 0.0%
38 38 363 0.0%
39 39 340 0.0%
40 40 644 0.0%
41 41 458 0.0%
42 42 584 0.0%
43 43 394 0.0%
44 44 279 0.0%
45 45 780 0.1%
46 46 247 0.0%
47 47 252 0.0%
48 48 336 0.0%
49 49 382 0.0%
X X 16,454 1.1%
-9 MISSING/UNKNOWN/NOT COLLECTED/INVALID 650,511 42.3%
Total 1,537,025 100%
Please note that only the first 50 response categories are displayed in the PDF codebook. To view all response categories, please analyze the data file in the statistical package of your choice (SAS, SPSS).
• Minimum: 0 • Maximum: 996
Width: 3; Decimal: 0 Variable Type: numeric
41

PSOURCE: PRINCIPAL SOURCE OF REFERRALPSOURCE: PRINCIPAL SOURCE OF REFERRAL
Describes the person or agency referring the client to the alcohol or drug abuse treatment program:
• INDIVIDUAL (INCLUDES SELF-REFERRAL): Includes the client, a family member, friend, or any other individual who would not be included in any of the following categories. Includes self-referral due to pending DWI/DUI.
• ALCOHOL/DRUG ABUSE CARE PROVIDER: Any program, clinic, or other health care provider whose principal objective is treating clients with substance abuse problems, or a program whose activities are related to alcohol or other drug abuse prevention, education, or treatment.
• OTHER HEALTH CARE PROVIDER: A physician, psychiatrist, or other licensed health care professional; or general hospital, psychiatric hospital, mental health program, or nursing home.
• SCHOOL (EDUCATIONAL): A school principal, counselor, or teacher; or a student assistance program (SAP), the school system, or an educational agency.
• EMPLOYER/EAP: A supervisor or an employee counselor.
• OTHER COMMUNITY REFERRAL: Community or religious organization or any federal, state, or local agency that provides aid in the areas of poverty relief, unemployment, shelter, or social welfare. Self-help groups such as Alcoholics Anonymous (AA), Al-Anon, and Narcotics Anonymous (NA) are also included in this category. Defense attorneys are also included in this category.
• COURT/CRIMINAL JUSTICE REFERRAL/DUI/DWI: Any police official, judge, prosecutor, probation officer, or other person affiliated with a federal, state, or county judicial system. Includes referral by a court for DWI/DUI, clients referred in lieu of or for deferred prosecution, or during pretrial release, or before or after official adjudication. Includes clients on pre-parole, pre-release, work or home furlough, or TASC. Client need not be officially designated as 'on parole'. Includes clients referred through civil commitment. Client referrals in this category are further defined in the Supplemental Data Set item 'Detailed Criminal Justice Referral (DETCRIM)'.
Value Label Unweighted
Frequency %
1 INDIVIDUAL (INCLUDES SELF-REFERRAL) 618,636 40.2%
2 ALCOHOL/DRUG ABUSE CARE PROVIDER 150,652 9.8%
3 OTHER HEALTH CARE PROVIDER 97,802 6.4%
4 SCHOOL (EDUCATIONAL) 9,880 0.6%
5 EMPLOYER/EAP 5,556 0.4%
6 OTHER COMMUNITY REFERRAL 170,306 11.1%
7 COURT/CRIMINAL JUSTICE REFERRAL / DUI / DWI 456,839 29.7%
-9 MISSING/UNKNOWN/NOT COLLECTED/INVALID 27,354 1.8%
Total 1,537,025 100%
• Minimum: 1 • Maximum: 7
Width: 2; Decimal: 0 Variable Type: numeric
42

DETCRIM: DETAILED CRIMINAL JUSTICE REFERRALDETCRIM: DETAILED CRIMINAL JUSTICE REFERRAL
This field gives more detailed information about those clients who are coded as 'Criminal Justice Referral' in the Minimum Data Set field for 'Principal Source of Referral' (PSOURCE).
• STATE/FEDERAL COURT, OTHER COURT
• PROBATION/PAROLE
• DIVERSIONARY PROGRAM (e.g., TASC)
• PRISON
• DUI/DWI
• OTHER RECOGNIZED LEGAL ENTITY, OTHER: Other recognized legal entities includes local law enforcement agency, corrections agency, youth services, review board/agency
Guidelines: This field is to be used only if Principal Source of Referral in the Minimum Data Set field is coded 07, 'Criminal Justice Referral'. For all other Principal Source of Referral codes (01 to 06 and missing), this field should be coded as Missing.
Value Label Unweighted
Frequency %
1 STATE/FEDERAL COURT, OTHER COURT 92,836 6.0%
3 PROBATION/PAROLE 105,050 6.8%
5 DIVERSIONARY PROGRAM 11,609 0.8%
6 PRISON 8,293 0.5%
7 DUI/DWI 36,824 2.4%
8 OTHER RECOGNIZED LEGAL ENTITY, OTHER 79,636 5.2%
-9 MISSING/UNKNOWN/NOT COLLECTED/INVALID 1,202,777 78.3%
Total 1,537,025 100%
• Minimum: 1 • Maximum: 8
Width: 2; Decimal: 0 Variable Type: numeric
43
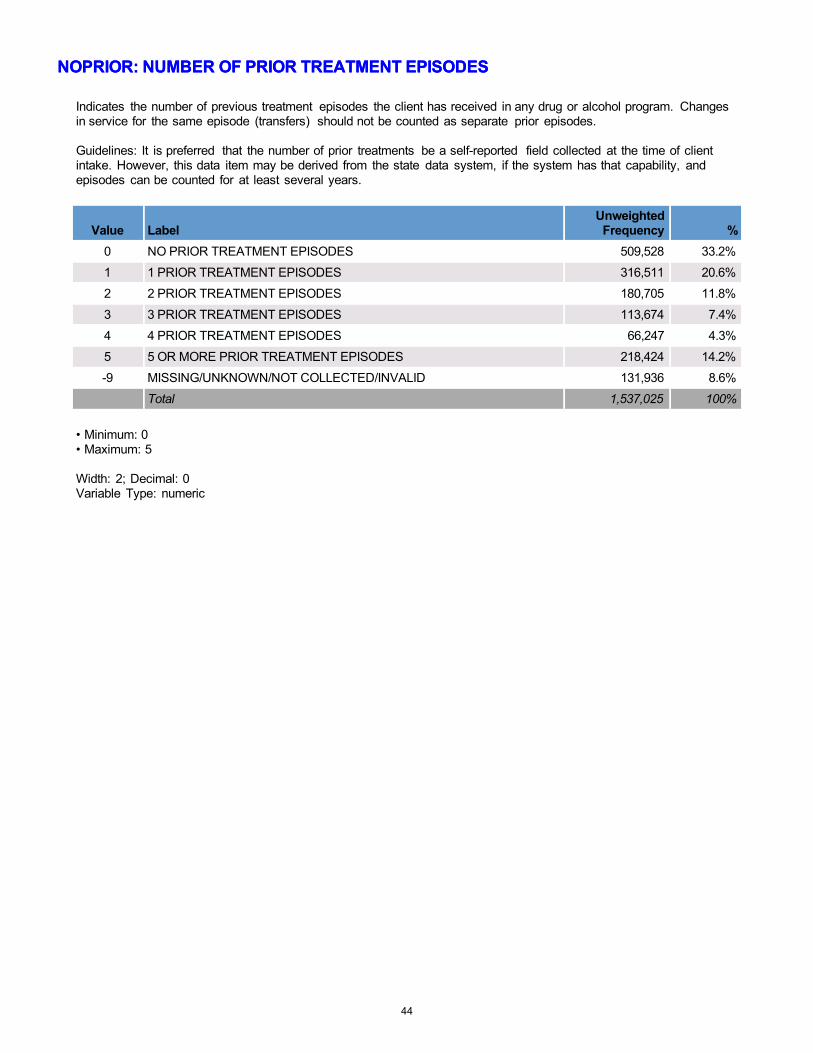
NOPRIOR: NUMBER OF PRIOR TREATMENT EPISODESNOPRIOR: NUMBER OF PRIOR TREATMENT EPISODES
Indicates the number of previous treatment episodes the client has received in any drug or alcohol program. Changes in service for the same episode (transfers) should not be counted as separate prior episodes.
Guidelines: It is preferred that the number of prior treatments be a self-reported field collected at the time of client intake. However, this data item may be derived from the state data system, if the system has that capability, and episodes can be counted for at least several years.
Value Label Unweighted
Frequency %
0 NO PRIOR TREATMENT EPISODES 509,528 33.2%
1 1 PRIOR TREATMENT EPISODES 316,511 20.6%
2 2 PRIOR TREATMENT EPISODES 180,705 11.8%
3 3 PRIOR TREATMENT EPISODES 113,674 7.4%
4 4 PRIOR TREATMENT EPISODES 66,247 4.3%
5 5 OR MORE PRIOR TREATMENT EPISODES 218,424 14.2%
-9 MISSING/UNKNOWN/NOT COLLECTED/INVALID 131,936 8.6%
Total 1,537,025 100%
• Minimum: 0 • Maximum: 5
Width: 2; Decimal: 0 Variable Type: numeric
44

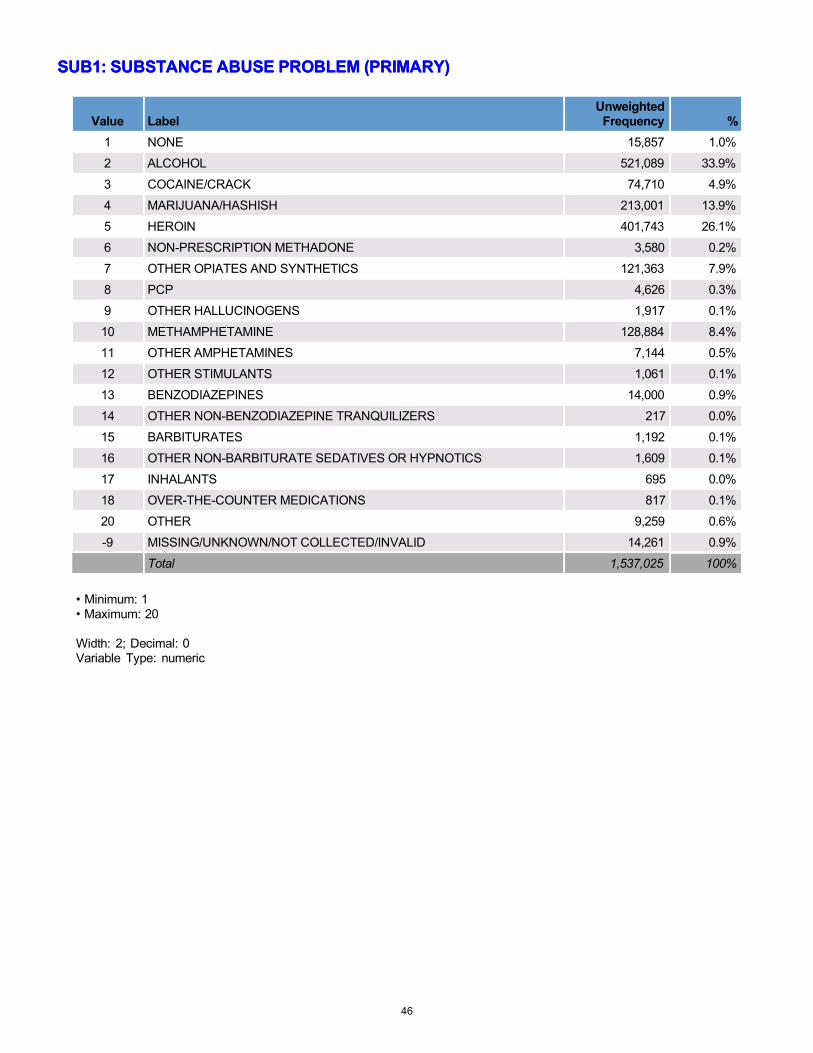
SUB1: SUBSTANCE ABUSE PROBLEM (PRIMARY)
This field identifies the client's primary substance problem.
(1) NONE
(2) ALCOHOL
(3) COCAINE/CRACK
(4) MARIJUANA/HASHISH: Includes THC and any other cannabis sativa preparations.
(5) HEROIN
(6) NON-PRESCRIPTION METHADONE
(7) OTHER OPIATES AND SYNTHETICS: Includes buprenorphine, codeine, hydrocodone, hydromorphone, meperidine, morphine, opium, oxycodone, pentazocine, propoxyphene, tramadol, and any other drug with morphine-like effects.
(8) PCP: Phencyclidine
(9) OTHER HALLUCINOGENS: Includes LSD, DMT, STP, hallucinogens, mescaline, peyote, psilocybin, etc.
(10) METHAMPHETAMINE
(11) OTHER AMPHETAMINES: Includes amphetamines, MDMA, phenmetrazine, and other unspecified amines and related drugs.
(12) OTHER STIMULANTS: Includes methylphenidate and any other stimulants.
(13) BENZODIAZEPINES: Includes alprazolam, chlordiazepoxide, clonazepam, clorazepate, diazepam, flunitrazepam, flurazepam, halazepam, lorazepam, oxazepam, prazepam, temazepam, triazolam, and other unspecified benzodiazepines.
(14) OTHER NON-BENZODIAZEPINE TRANQUILIZERS: Includes meprobamate, tranquilizers, etc.
(15) BARBITURATES: Includes amobarbital, pentobarbital, phenobarbital, secobarbital, etc.
(16) OTHER NON-BARBITURATE SEDATIVES OR HYPNOTICS: Includes chloral hydrate, ethchlorvynol, glutethimide, methaqualone, sedatives/hypnotics, etc.
(17) INHALANTS: Includes chloroform, ether, gasoline, glue, nitrous oxide, paint thinner, etc.
(18) OVER-THE-COUNTER MEDICATIONS: Includes aspirin, cough syrup, diphenhydramine and other anti-histamines, sleep aids, and any other legally obtained non-prescription medication.
(20) OTHER: Includes diphenylhydantoin/phenytoin, GHB/GBL, ketamine, etc.
See next page for frequency table
45
SUB1: SUBSTANCE ABUSE PROBLEM (PRIMARY)SUB1: SUBSTANCE ABUSE PROBLEM (PRIMARY)
Value Label Unweighted
Frequency %
1 NONE 15,857 1.0%
2 ALCOHOL 521,089 33.9%
3 COCAINE/CRACK 74,710 4.9%
4 MARIJUANA/HASHISH 213,001 13.9%
5 HEROIN 401,743 26.1%
6 NON-PRESCRIPTION METHADONE 3,580 0.2%
7 OTHER OPIATES AND SYNTHETICS 121,363 7.9%
8 PCP 4,626 0.3%
9 OTHER HALLUCINOGENS 1,917 0.1%
10 METHAMPHETAMINE 128,884 8.4%
11 OTHER AMPHETAMINES 7,144 0.5%
12 OTHER STIMULANTS 1,061 0.1%
13 BENZODIAZEPINES 14,000 0.9%
14 OTHER NON-BENZODIAZEPINE TRANQUILIZERS 217 0.0%
15 BARBITURATES 1,192 0.1%
16 OTHER NON-BARBITURATE SEDATIVES OR HYPNOTICS 1,609 0.1%
17 INHALANTS 695 0.0%
18 OVER-THE-COUNTER MEDICATIONS 817 0.1%
20 OTHER 9,259 0.6%
-9 MISSING/UNKNOWN/NOT COLLECTED/INVALID 14,261 0.9%
Total 1,537,025 100%
• Minimum: 1 • Maximum: 20
Width: 2; Decimal: 0 Variable Type: numeric
46
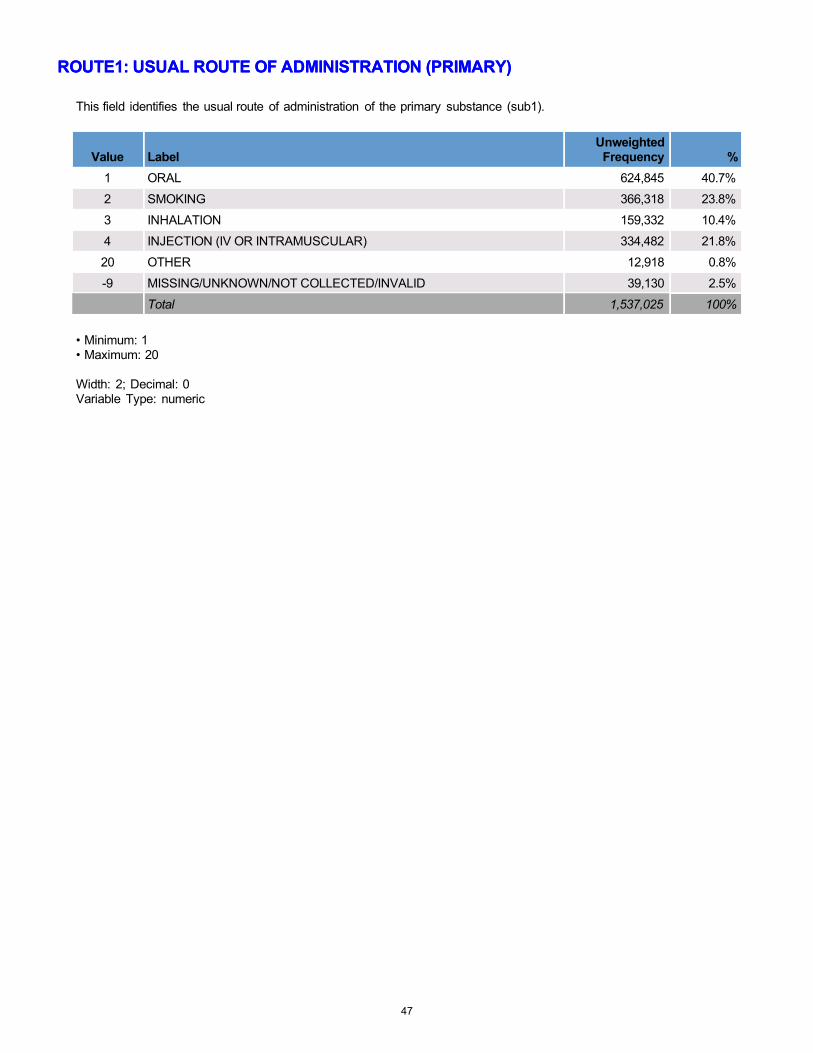
ROUTE1: USUAL ROUTE OF ADMINISTRATION (PRIMARY)ROUTE1: USUAL ROUTE OF ADMINISTRATION (PRIMARY)
This field identifies the usual route of administration of the primary substance (sub1).
Value Label Unweighted
Frequency %
1 ORAL 624,845 40.7%
2 SMOKING 366,318 23.8%
3 INHALATION 159,332 10.4%
4 INJECTION (IV OR INTRAMUSCULAR) 334,482 21.8%
20 OTHER 12,918 0.8%
-9 MISSING/UNKNOWN/NOT COLLECTED/INVALID 39,130 2.5%
Total 1,537,025 100%
• Minimum: 1 • Maximum: 20
Width: 2; Decimal: 0 Variable Type: numeric
47
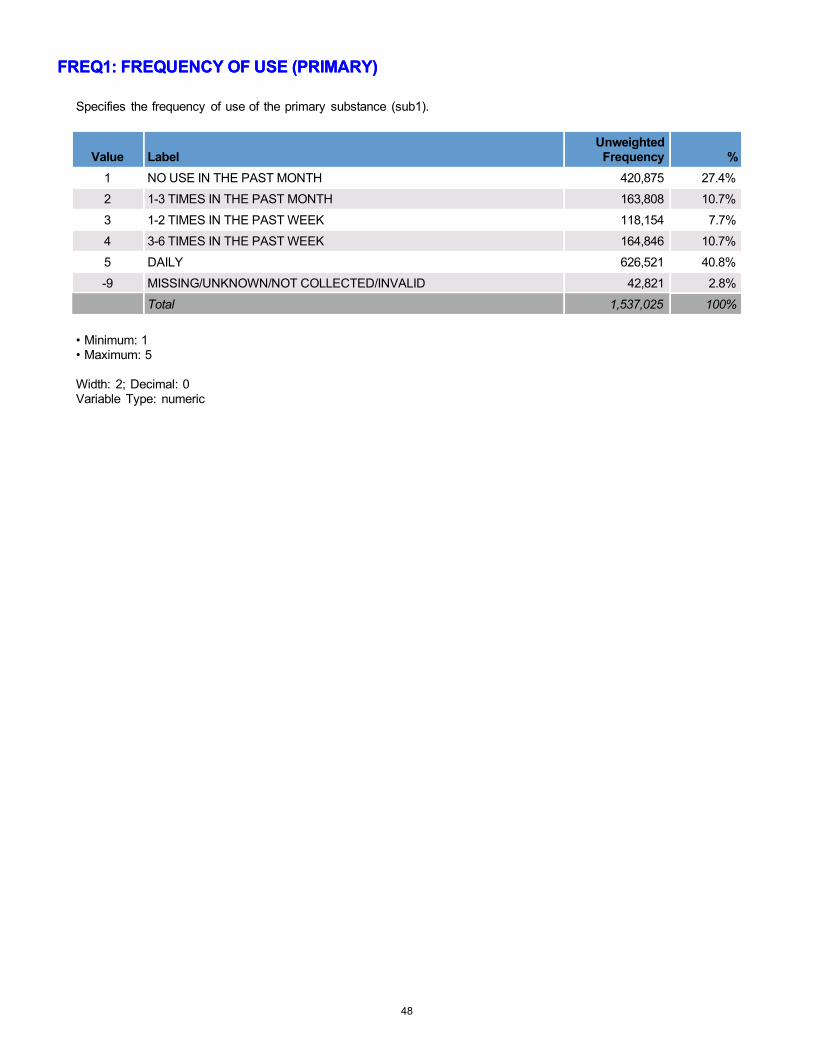
FREQ1: FREQUENCY OF USE (PRIMARY)FREQ1: FREQUENCY OF USE (PRIMARY)
Specifies the frequency of use of the primary substance (sub1).
Value Label Unweighted
Frequency %
1 NO USE IN THE PAST MONTH 420,875 27.4%
2 1-3 TIMES IN THE PAST MONTH 163,808 10.7%
3 1-2 TIMES IN THE PAST WEEK 118,154 7.7%
4 3-6 TIMES IN THE PAST WEEK 164,846 10.7%
5 DAILY 626,521 40.8%
-9 MISSING/UNKNOWN/NOT COLLECTED/INVALID 42,821 2.8%
Total 1,537,025 100%
• Minimum: 1 • Maximum: 5
Width: 2; Decimal: 0 Variable Type: numeric
48
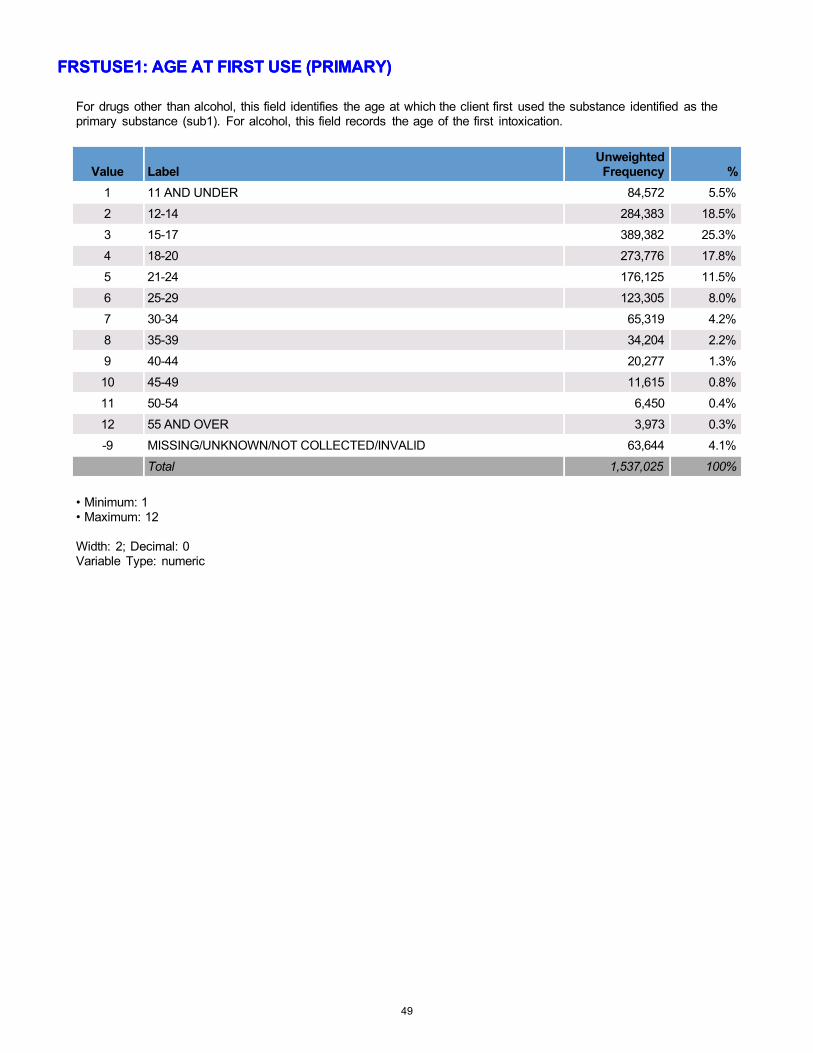
FRSTUSE1: AGE AT FIRST USE (PRIMARY)FRSTUSE1: AGE AT FIRST USE (PRIMARY)
For drugs other than alcohol, this field identifies the age at which the client first used the substance identified as the primary substance (sub1). For alcohol, this field records the age of the first intoxication.
Value Label Unweighted
Frequency %
1 11 AND UNDER 84,572 5.5%
2 12-14 284,383 18.5%
3 15-17 389,382 25.3%
4 18-20 273,776 17.8%
5 21-24 176,125 11.5%
6 25-29 123,305 8.0%
7 30-34 65,319 4.2%
8 35-39 34,204 2.2%
9 40-44 20,277 1.3%
10 45-49 11,615 0.8%
11 50-54 6,450 0.4%
12 55 AND OVER 3,973 0.3%
-9 MISSING/UNKNOWN/NOT COLLECTED/INVALID 63,644 4.1%
Total 1,537,025 100%
• Minimum: 1 • Maximum: 12
Width: 2; Decimal: 0 Variable Type: numeric
49

SUB2: SUBSTANCE ABUSE PROBLEM (SECONDARY)
This field identifies the client's secondary substance problem.
(1) NONE
(2) ALCOHOL
(3) COCAINE/CRACK
(4) MARIJUANA/HASHISH: Includes THC and any other cannabis sativa preparations.
(5) HEROIN
(6) NON-PRESCRIPTION METHADONE
(7) OTHER OPIATES AND SYNTHETICS: Includes buprenorphine, codeine, hydrocodone, hydromorphone, meperidine, morphine, opium, oxycodone, pentazocine, propoxyphene, tramadol, and any other drug with morphine-like effects.
(8) PCP: Phencyclidine
(9) OTHER HALLUCINOGENS: Includes LSD, DMT, STP, hallucinogens, mescaline, peyote, psilocybin, etc.
(10) METHAMPHETAMINE
(11) OTHER AMPHETAMINES: Includes amphetamines, MDMA, phenmetrazine, and other unspecified amines and related drugs.
(12) OTHER STIMULANTS: Includes methylphenidate and any other stimulants.
(13) BENZODIAZEPINES: Includes alprazolam, chlordiazepoxide, clonazepam, clorazepate, diazepam, flunitrazepam, flurazepam, halazepam, lorazepam, oxazepam, prazepam, temazepam, triazolam, and other unspecified benzodiazepines.
(14) OTHER NON-BENZODIAZEPINE TRANQUILIZERS: Includes meprobamate, tranquilizers, etc.
(15) BARBITURATES: Includes amobarbital, pentobarbital, phenobarbital, secobarbital, etc.
(16) OTHER NON-BARBITURATE SEDATIVES OR HYPNOTICS: Includes chloral hydrate, ethchlorvynol, glutethimide, methaqualone, sedatives/hypnotics, etc.
(17) INHALANTS: Includes chloroform, ether, gasoline, glue, nitrous oxide, paint thinner, etc.
(18) OVER-THE-COUNTER MEDICATIONS: Includes aspirin, cough syrup, diphenhydramine and other anti-histamines, sleep aids, and any other legally obtained non-prescription medication.
(20) OTHER: Includes diphenylhydantoin/phenytoin, GHB/GBL, ketamine, etc.
See next page for frequency table
50

SUB2: SUBSTANCE ABUSE PROBLEM (SECONDARY)SUB2: SUBSTANCE ABUSE PROBLEM (SECONDARY)
Value Label Unweighted
Frequency %
1 NONE 602,388 39.2%
2 ALCOHOL 164,836 10.7%
3 COCAINE/CRACK 145,409 9.5%
4 MARIJUANA/HASHISH 221,410 14.4%
5 HEROIN 47,833 3.1%
6 NON-PRESCRIPTION METHADONE 3,342 0.2%
7 OTHER OPIATES AND SYNTHETICS 72,260 4.7%
8 PCP 2,779 0.2%
9 OTHER HALLUCINOGENS 3,169 0.2%
10 METHAMPHETAMINE 64,652 4.2%
11 OTHER AMPHETAMINES 7,407 0.5%
12 OTHER STIMULANTS 1,680 0.1%
13 BENZODIAZEPINES 51,431 3.3%
14 OTHER NON-BENZODIAZEPINE TRANQUILIZERS 515 0.0%
15 BARBITURATES 746 0.0%
16 OTHER NON-BARBITURATE SEDATIVES OR HYPNOTICS 3,561 0.2%
17 INHALANTS 707 0.0%
18 OVER-THE-COUNTER MEDICATIONS 1,259 0.1%
20 OTHER 29,214 1.9%
-9 MISSING/UNKNOWN/NOT COLLECTED/INVALID 112,427 7.3%
Total 1,537,025 100%
• Minimum: 1 • Maximum: 20
Width: 2; Decimal: 0 Variable Type: numeric
51

ROUTE2: USUAL ROUTE OF ADMINISTRATION (SECONDARY)ROUTE2: USUAL ROUTE OF ADMINISTRATION (SECONDARY)
This field identifies the usual route of administration of the secondary substance (sub2).
Value Label Unweighted
Frequency %
1 ORAL 281,580 18.3%
2 SMOKING 357,703 23.3%
3 INHALATION 93,798 6.1%
4 INJECTION (IV OR INTRAMUSCULAR) 81,415 5.3%
20 OTHER 6,180 0.4%
-9 MISSING/UNKNOWN/NOT COLLECTED/INVALID 716,349 46.6%
Total 1,537,025 100%
• Minimum: 1 • Maximum: 20
Width: 2; Decimal: 0 Variable Type: numeric
52

FREQ2: FREQUENCY OF USE (SECONDARY)FREQ2: FREQUENCY OF USE (SECONDARY)
Specifies the frequency of use of the secondary substance (sub2).
Value Label Unweighted
Frequency %
1 NO USE IN THE PAST MONTH 294,157 19.1%
2 1-3 TIMES IN THE PAST MONTH 120,508 7.8%
3 1-2 TIMES IN THE PAST WEEK 85,452 5.6%
4 3-6 TIMES IN THE PAST WEEK 87,800 5.7%
5 DAILY 243,307 15.8%
-9 MISSING/UNKNOWN/NOT COLLECTED/INVALID 705,801 45.9%
Total 1,537,025 100%
• Minimum: 1 • Maximum: 5
Width: 2; Decimal: 0 Variable Type: numeric
53

FRSTUSE2: AGE AT FIRST USE (SECONDARY)FRSTUSE2: AGE AT FIRST USE (SECONDARY)
For drugs other than alcohol, this field identifies the age at which the client first used the substance identified as the secondary substance (sub2). For alcohol, this field records the age of the first intoxication.
Value Label Unweighted
Frequency %
1 11 AND UNDER 52,037 3.4%
2 12-14 181,231 11.8%
3 15-17 229,189 14.9%
4 18-20 141,939 9.2%
5 21-24 83,986 5.5%
6 25-29 63,882 4.2%
7 30-34 34,965 2.3%
8 35-39 19,093 1.2%
9 40-44 12,144 0.8%
10 45-49 7,733 0.5%
11 50-54 4,762 0.3%
12 55 AND OVER 2,903 0.2%
-9 MISSING/UNKNOWN/NOT COLLECTED/INVALID 703,161 45.7%
Total 1,537,025 100%
• Minimum: 1 • Maximum: 12
Width: 2; Decimal: 0 Variable Type: numeric
54
SUB3: SUBSTANCE ABUSE PROBLEM (TERTIARY)
This field identifies the client's tertiary substance problem.
(1) NONE
(2) ALCOHOL
(3) COCAINE/CRACK
(4) MARIJUANA/HASHISH: Includes THC and any other cannabis sativa preparations.
(5) HEROIN
(6) NON-PRESCRIPTION METHADONE
(7) OTHER OPIATES AND SYNTHETICS: Includes buprenorphine, codeine, hydrocodone, hydromorphone, meperidine, morphine, opium, oxycodone, pentazocine, propoxyphene, tramadol, and any other drug with morphine-like effects.
(8) PCP: Phencyclidine
(9) OTHER HALLUCINOGENS: Includes LSD, DMT, STP, hallucinogens, mescaline, peyote, psilocybin, etc.
(10) METHAMPHETAMINE
(11) OTHER AMPHETAMINES: Includes amphetamines, MDMA, phenmetrazine, and other unspecified amines and related drugs.
(12) OTHER STIMULANTS: Includes methylphenidate and any other stimulants.
(13) BENZODIAZEPINES: Includes alprazolam, chlordiazepoxide, clonazepam, clorazepate, diazepam, flunitrazepam, flurazepam, halazepam, lorazepam, oxazepam, prazepam, temazepam, triazolam, and other unspecified benzodiazepines.
(14) OTHER NON-BENZODIAZEPINE TRANQUILIZERS: Includes meprobamate, tranquilizers, etc.
(15) BARBITURATES: Includes amobarbital, pentobarbital, phenobarbital, secobarbital, etc.
(16) OTHER NON-BARBITURATE SEDATIVES OR HYPNOTICS: Includes chloral hydrate, ethchlorvynol, glutethimide, methaqualone, sedatives/hypnotics, etc.
(17) INHALANTS: Includes chloroform, ether, gasoline, glue, nitrous oxide, paint thinner, etc.
(18) OVER-THE-COUNTER MEDICATIONS: Includes aspirin, cough syrup, diphenhydramine and other anti-histamines, sleep aids, and any other legally obtained non-prescription medication.
(20) OTHER: Includes diphenylhydantoin/phenytoin, GHB/GBL, ketamine, etc.
See next page for frequency table
55

SUB3: SUBSTANCE ABUSE PROBLEM (TERTIARY)SUB3: SUBSTANCE ABUSE PROBLEM (TERTIARY)
Value Label Unweighted
Frequency %
1 NONE 904,328 58.8%
2 ALCOHOL 60,384 3.9%
3 COCAINE/CRACK 53,954 3.5%
4 MARIJUANA/HASHISH 81,811 5.3%
5 HEROIN 13,571 0.9%
6 NON-PRESCRIPTION METHADONE 1,749 0.1%
7 OTHER OPIATES AND SYNTHETICS 25,783 1.7%
8 PCP 1,743 0.1%
9 OTHER HALLUCINOGENS 3,913 0.3%
10 METHAMPHETAMINE 17,396 1.1%
11 OTHER AMPHETAMINES 5,880 0.4%
12 OTHER STIMULANTS 1,118 0.1%
13 BENZODIAZEPINES 28,355 1.8%
14 OTHER NON-BENZODIAZEPINE TRANQUILIZERS 373 0.0%
15 BARBITURATES 504 0.0%
16 OTHER NON-BARBITURATE SEDATIVES OR HYPNOTICS 2,136 0.1%
17 INHALANTS 579 0.0%
18 OVER-THE-COUNTER MEDICATIONS 743 0.0%
20 OTHER 21,498 1.4%
-9 MISSING/UNKNOWN/NOT COLLECTED/INVALID 311,207 20.2%
Total 1,537,025 100%
• Minimum: 1 • Maximum: 20
Width: 2; Decimal: 0 Variable Type: numeric
56

ROUTE3: USUAL ROUTE OF ADMINISTRATION (TERTIARY)ROUTE3: USUAL ROUTE OF ADMINISTRATION (TERTIARY)
This field identifies the usual route of administration of the tertiary substance (sub3).
Value Label Unweighted
Frequency %
1 ORAL 120,471 7.8%
2 SMOKING 134,271 8.7%
3 INHALATION 40,223 2.6%
4 INJECTION (IV OR INTRAMUSCULAR) 22,818 1.5%
20 OTHER 4,336 0.3%
-9 MISSING/UNKNOWN/NOT COLLECTED/INVALID 1,214,906 79.0%
Total 1,537,025 100%
• Minimum: 1 • Maximum: 20
Width: 2; Decimal: 0 Variable Type: numeric
57

FREQ3: FREQUENCY OF USE (TERTIARY)FREQ3: FREQUENCY OF USE (TERTIARY)
Specifies the frequency of use of the tertiary substance (sub3).
Value Label Unweighted
Frequency %
1 NO USE IN THE PAST MONTH 141,720 9.2%
2 1-3 TIMES IN THE PAST MONTH 49,736 3.2%
3 1-2 TIMES IN THE PAST WEEK 31,699 2.1%
4 3-6 TIMES IN THE PAST WEEK 28,255 1.8%
5 DAILY 86,115 5.6%
-9 MISSING/UNKNOWN/NOT COLLECTED/INVALID 1,199,500 78.0%
Total 1,537,025 100%
• Minimum: 1 • Maximum: 5
Width: 2; Decimal: 0 Variable Type: numeric
58

FRSTUSE3: AGE AT FIRST USE (TERTIARY)FRSTUSE3: AGE AT FIRST USE (TERTIARY)
For drugs other than alcohol, this field identifies the age at which the client first used the substance identified as the tertiary substance (sub3). For alcohol, this field records the age of the first intoxication.
Value Label Unweighted
Frequency %
1 11 AND UNDER 26,279 1.7%
2 12-14 76,488 5.0%
3 15-17 89,648 5.8%
4 18-20 52,683 3.4%
5 21-24 29,603 1.9%
6 25-29 22,640 1.5%
7 30-34 12,780 0.8%
8 35-39 6,818 0.4%
9 40-44 4,544 0.3%
10 45-49 2,980 0.2%
11 50-54 1,886 0.1%
12 55 AND OVER 1,094 0.1%
-9 MISSING/UNKNOWN/NOT COLLECTED/INVALID 1,209,582 78.7%
Total 1,537,025 100%
• Minimum: 1 • Maximum: 12
Width: 2; Decimal: 0 Variable Type: numeric
59
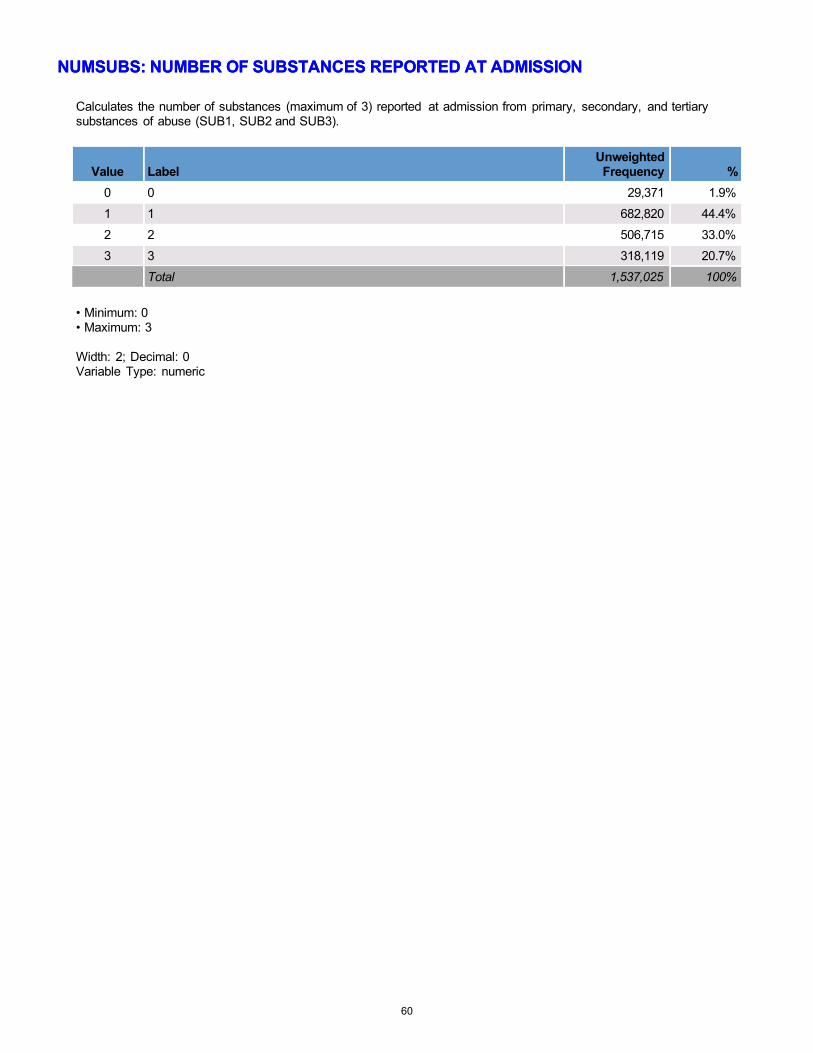
NUMSUBS: NUMBER OF SUBSTANCES REPORTED AT ADMISSIONNUMSUBS: NUMBER OF SUBSTANCES REPORTED AT ADMISSION
Calculates the number of substances (maximum of 3) reported at admission from primary, secondary, and tertiary substances of abuse (SUB1, SUB2 and SUB3).
Value Label Unweighted
Frequency %
0 0 29,371 1.9%
1 1 682,820 44.4%
2 2 506,715 33.0%
3 3 318,119 20.7%
Total 1,537,025 100%
• Minimum: 0 • Maximum: 3
Width: 2; Decimal: 0 Variable Type: numeric
60
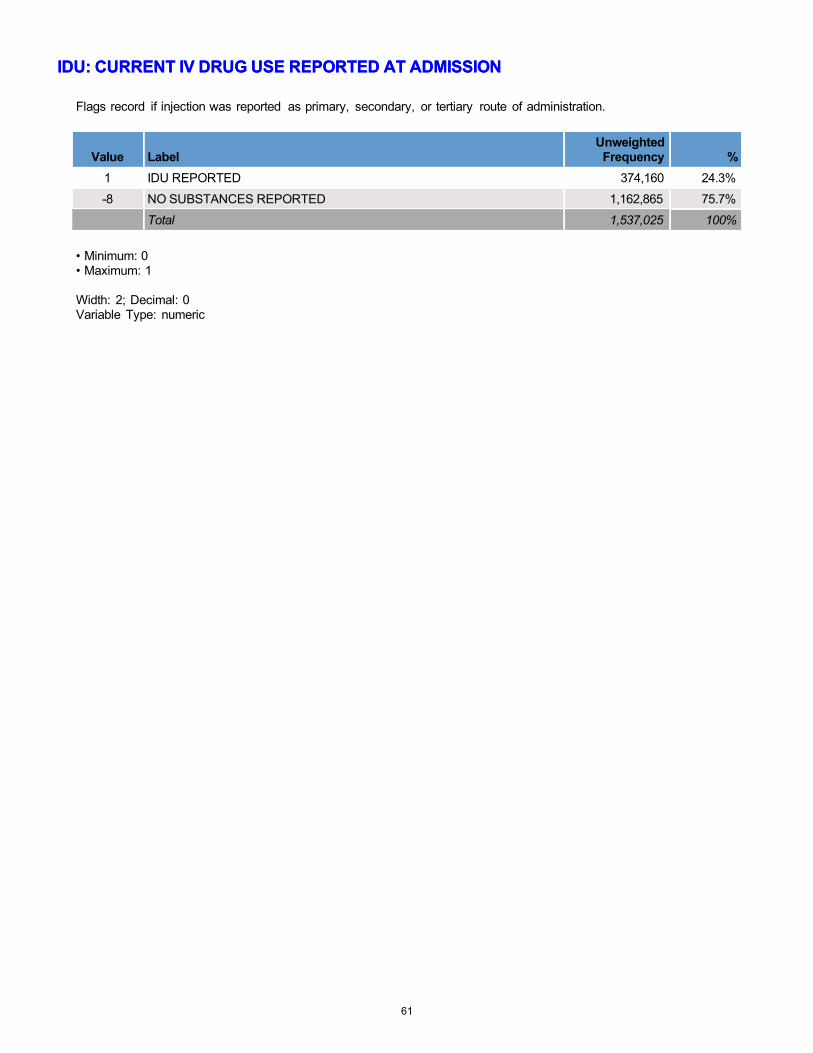
IDU: CURRENT IV DRUG USE REPORTED AT ADMISSIONIDU: CURRENT IV DRUG USE REPORTED AT ADMISSION
Flags record if injection was reported as primary, secondary, or tertiary route of administration.
Value Label Unweighted
Frequency %
1 IDU REPORTED 374,160 24.3%
-8 NO SUBSTANCES REPORTED 1,162,865 75.7%
Total 1,537,025 100%
• Minimum: 0 • Maximum: 1
Width: 2; Decimal: 0 Variable Type: numeric
61
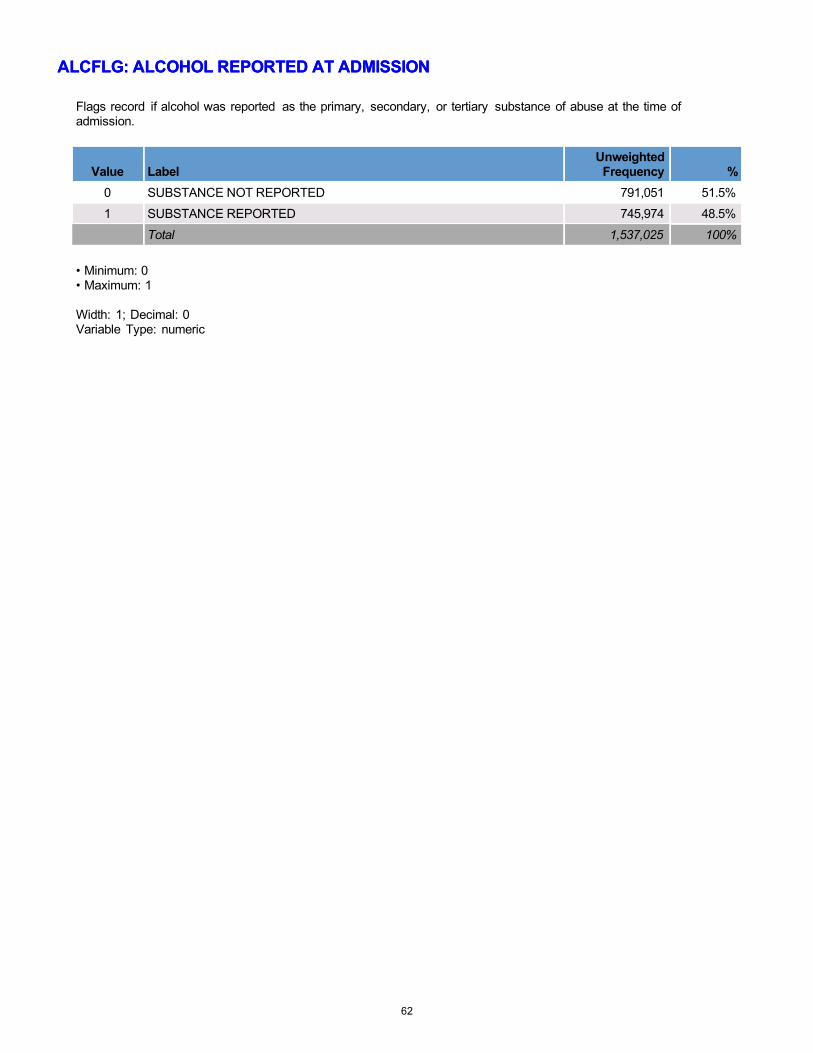
ALCFLG: ALCOHOL REPORTED AT ADMISSIONALCFLG: ALCOHOL REPORTED AT ADMISSION
Flags record if alcohol was reported as the primary, secondary, or tertiary substance of abuse at the time of admission.
Value Label Unweighted
Frequency %
0 SUBSTANCE NOT REPORTED 791,051 51.5%
1 SUBSTANCE REPORTED 745,974 48.5%
Total 1,537,025 100%
• Minimum: 0 • Maximum: 1
Width: 1; Decimal: 0 Variable Type: numeric
62

COKEFLG: COCAINE/CRACK REPORTED AT ADMISSIONCOKEFLG: COCAINE/CRACK REPORTED AT ADMISSION
Flags record if cocaine or crack was reported as the primary, secondary, or tertiary substance of abuse at the time of admission.
Value Label Unweighted
Frequency %
0 SUBSTANCE NOT REPORTED 1,267,636 82.5%
1 SUBSTANCE REPORTED 269,389 17.5%
Total 1,537,025 100%
• Minimum: 0 • Maximum: 1
Width: 1; Decimal: 0 Variable Type: numeric
63
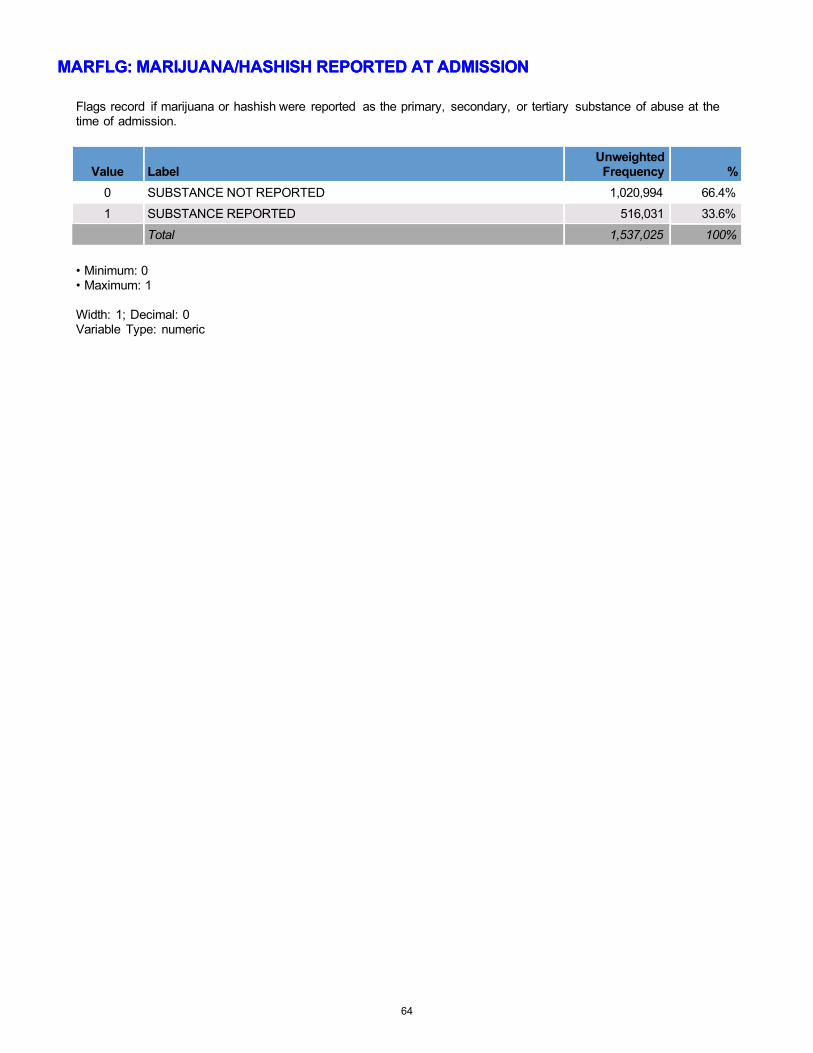
MARFLG: MARIJUANA/HASHISH REPORTED AT ADMISSIONMARFLG: MARIJUANA/HASHISH REPORTED AT ADMISSION
Flags record if marijuana or hashish were reported as the primary, secondary, or tertiary substance of abuse at the time of admission.
Value Label Unweighted
Frequency %
0 SUBSTANCE NOT REPORTED 1,020,994 66.4%
1 SUBSTANCE REPORTED 516,031 33.6%
Total 1,537,025 100%
• Minimum: 0 • Maximum: 1
Width: 1; Decimal: 0 Variable Type: numeric
64

HERFLG: HEROIN REPORTED AT ADMISSIONHERFLG: HEROIN REPORTED AT ADMISSION
Flags record if heroin was reported as the primary, secondary, or tertiary substance of abuse at the time of admission.
Value Label Unweighted
Frequency %
0 SUBSTANCE NOT REPORTED 1,074,249 69.9%
1 SUBSTANCE REPORTED 462,776 30.1%
Total 1,537,025 100%
• Minimum: 0 • Maximum: 1
Width: 1; Decimal: 0 Variable Type: numeric
65

METHFLG: NON-RX METHADONE REPORTED AT ADMISSIONMETHFLG: NON-RX METHADONE REPORTED AT ADMISSION
Flags record if non-prescription methadone was reported as the primary, secondary, or tertiary substance of abuse at the time of admission.
Value Label Unweighted
Frequency %
0 SUBSTANCE NOT REPORTED 1,528,364 99.4%
1 SUBSTANCE REPORTED 8,661 0.6%
Total 1,537,025 100%
• Minimum: 0 • Maximum: 1
Width: 1; Decimal: 0 Variable Type: numeric
66

OPSYNFLG: OTHER OPIATES/SYNTHETICS REPORTED AT ADMISSIONOPSYNFLG: OTHER OPIATES/SYNTHETICS REPORTED AT ADMISSION
Flags record if other opiates or synthetics were reported as the primary, secondary, or tertiary substance of abuse at the time of admission.
Value Label Unweighted
Frequency %
0 SUBSTANCE NOT REPORTED 1,322,395 86.0%
1 SUBSTANCE REPORTED 214,630 14.0%
Total 1,537,025 100%
• Minimum: 0 • Maximum: 1
Width: 1; Decimal: 0 Variable Type: numeric
67
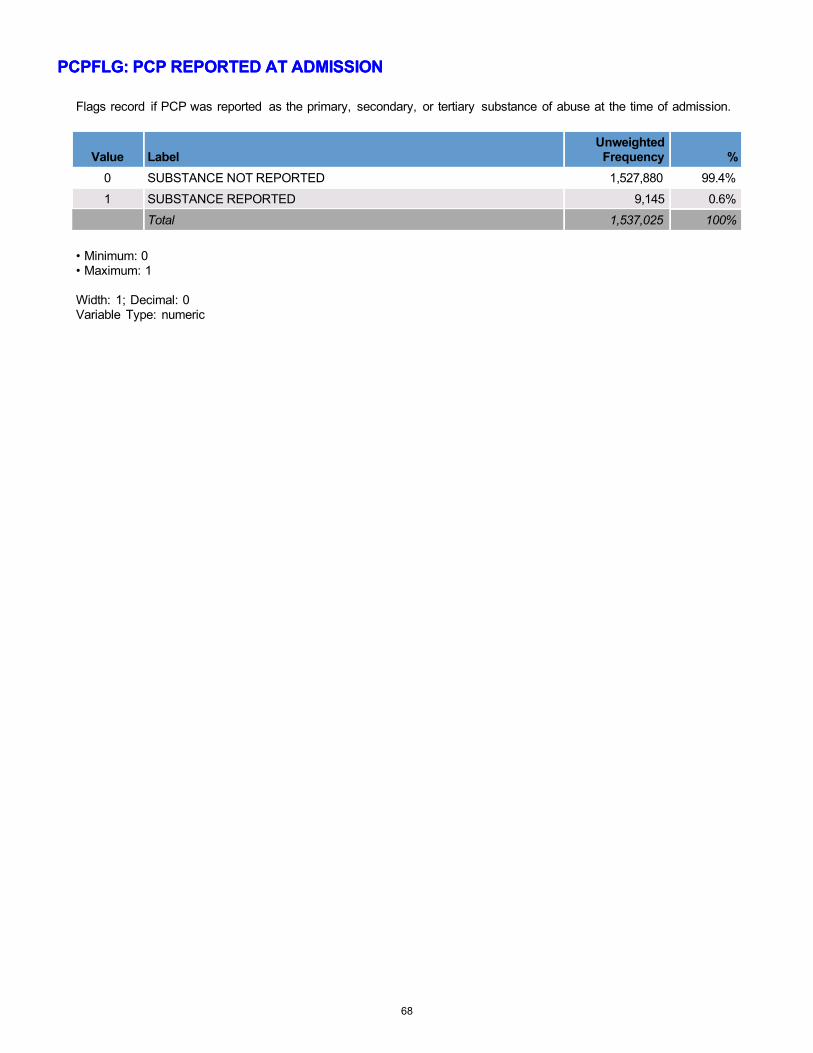
PCPFLG: PCP REPORTED AT ADMISSIONPCPFLG: PCP REPORTED AT ADMISSION
Flags record if PCP was reported as the primary, secondary, or tertiary substance of abuse at the time of admission.
Value Label Unweighted
Frequency %
0 SUBSTANCE NOT REPORTED 1,527,880 99.4%
1 SUBSTANCE REPORTED 9,145 0.6%
Total 1,537,025 100%
• Minimum: 0 • Maximum: 1
Width: 1; Decimal: 0 Variable Type: numeric
68
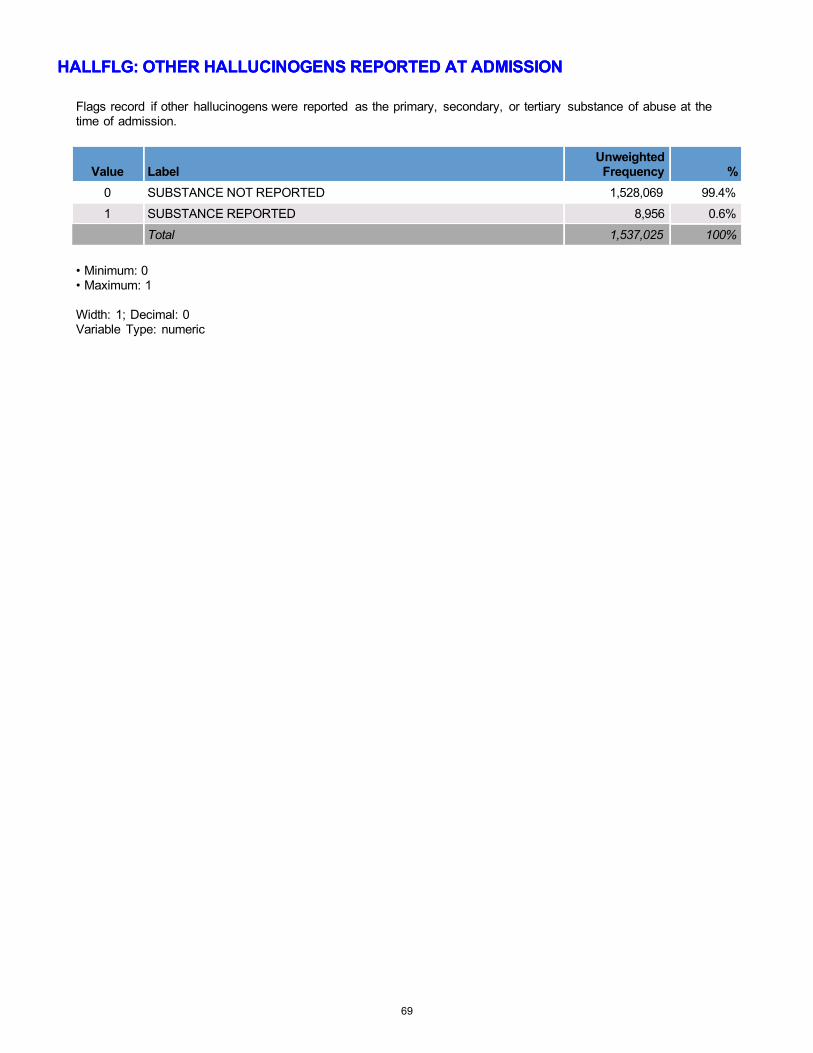
HALLFLG: OTHER HALLUCINOGENS REPORTED AT ADMISSIONHALLFLG: OTHER HALLUCINOGENS REPORTED AT ADMISSION
Flags record if other hallucinogens were reported as the primary, secondary, or tertiary substance of abuse at the time of admission.
Value Label Unweighted
Frequency %
0 SUBSTANCE NOT REPORTED 1,528,069 99.4%
1 SUBSTANCE REPORTED 8,956 0.6%
Total 1,537,025 100%
• Minimum: 0 • Maximum: 1
Width: 1; Decimal: 0 Variable Type: numeric
69

MTHAMFLG: METHAMPHETAMINE REPORTED AT ADMISSIONMTHAMFLG: METHAMPHETAMINE REPORTED AT ADMISSION
Flags record if methamphetamines were reported as the primary, secondary, or tertiary substance of abuse at the time of admission.
Value Label Unweighted
Frequency %
0 SUBSTANCE NOT REPORTED 1,326,123 86.3%
1 SUBSTANCE REPORTED 210,902 13.7%
Total 1,537,025 100%
• Minimum: 0 • Maximum: 1
Width: 1; Decimal: 0 Variable Type: numeric
70
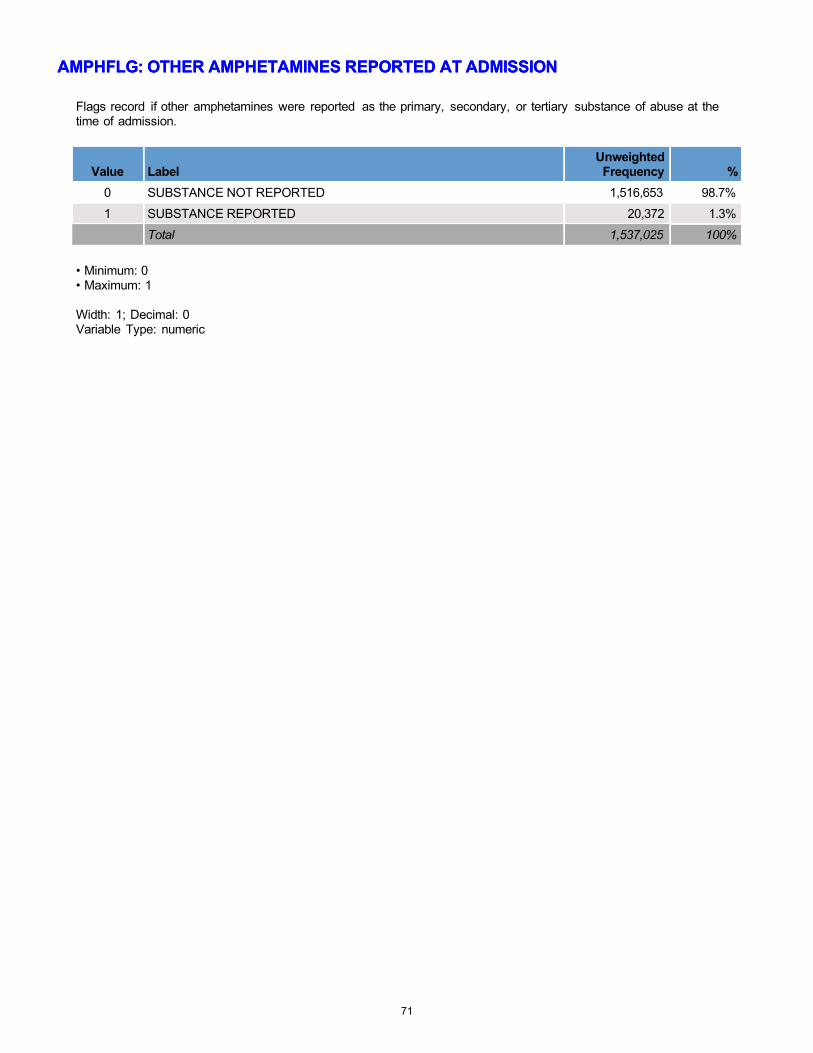
AMPHFLG: OTHER AMPHETAMINES REPORTED AT ADMISSIONAMPHFLG: OTHER AMPHETAMINES REPORTED AT ADMISSION
Flags record if other amphetamines were reported as the primary, secondary, or tertiary substance of abuse at the time of admission.
Value Label Unweighted
Frequency %
0 SUBSTANCE NOT REPORTED 1,516,653 98.7%
1 SUBSTANCE REPORTED 20,372 1.3%
Total 1,537,025 100%
• Minimum: 0 • Maximum: 1
Width: 1; Decimal: 0 Variable Type: numeric
71

STIMFLG: OTHER STIMULANTS REPORTED AT ADMISSIONSTIMFLG: OTHER STIMULANTS REPORTED AT ADMISSION
Flags record if non-prescription methadone was reported as the primary, secondary, or tertiary substance of abuse at the time of admission.
Value Label Unweighted
Frequency %
0 SUBSTANCE NOT REPORTED 1,533,173 99.7%
1 SUBSTANCE REPORTED 3,852 0.3%
Total 1,537,025 100%
• Minimum: 0 • Maximum: 1
Width: 1; Decimal: 0 Variable Type: numeric
72

BENZFLG: BENZODIAZEPINES REPORTED AT ADMISSIONBENZFLG: BENZODIAZEPINES REPORTED AT ADMISSION
Flags record if benzodiazepines were reported as the primary, secondary, or tertiary substance of abuse at the time of admission.
Value Label Unweighted
Frequency %
0 SUBSTANCE NOT REPORTED 1,443,846 93.9%
1 SUBSTANCE REPORTED 93,179 6.1%
Total 1,537,025 100%
• Minimum: 0 • Maximum: 1
Width: 1; Decimal: 0 Variable Type: numeric
73
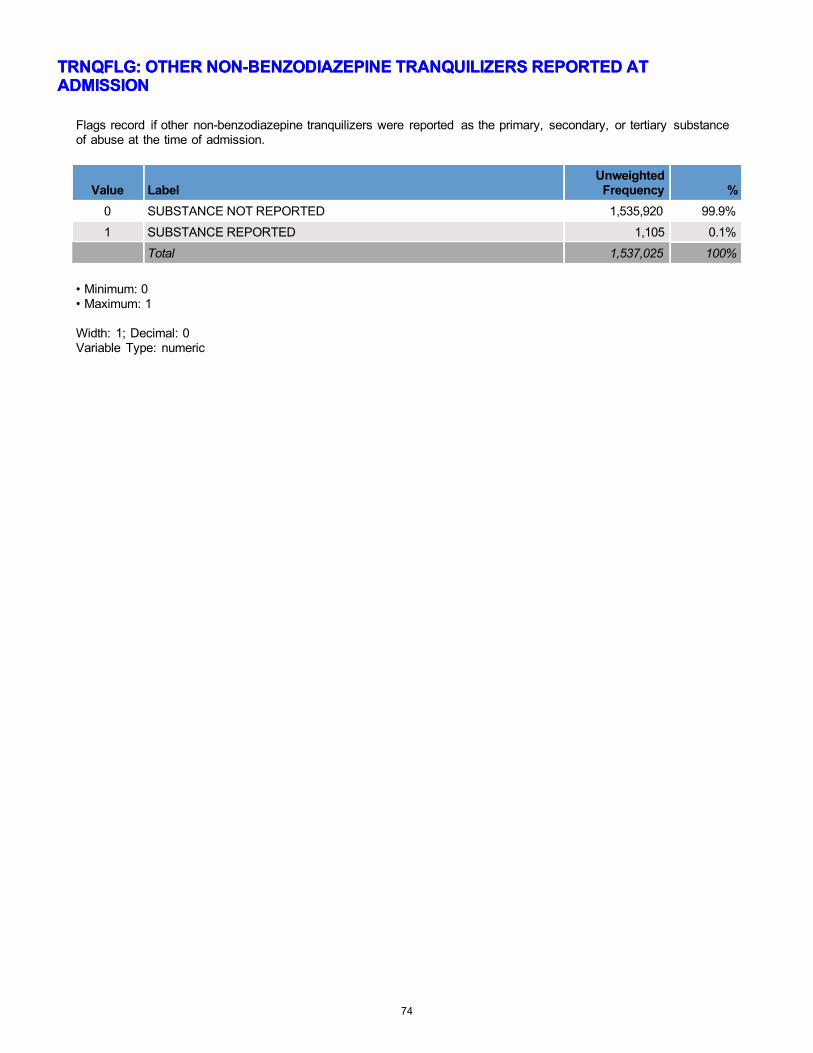
TRNQFLG: OTHER NON-BENZODIAZEPINE TRANQUILIZERS REPORTED ATTRNQFLG: OTHER NON-BENZODIAZEPINE TRANQUILIZERS REPORTED AT ADMISSIONADMISSION
Flags record if other non-benzodiazepine tranquilizers were reported as the primary, secondary, or tertiary substance of abuse at the time of admission.
Value Label Unweighted
Frequency %
0 SUBSTANCE NOT REPORTED 1,535,920 99.9%
1 SUBSTANCE REPORTED 1,105 0.1%
Total 1,537,025 100%
• Minimum: 0 • Maximum: 1
Width: 1; Decimal: 0 Variable Type: numeric
74
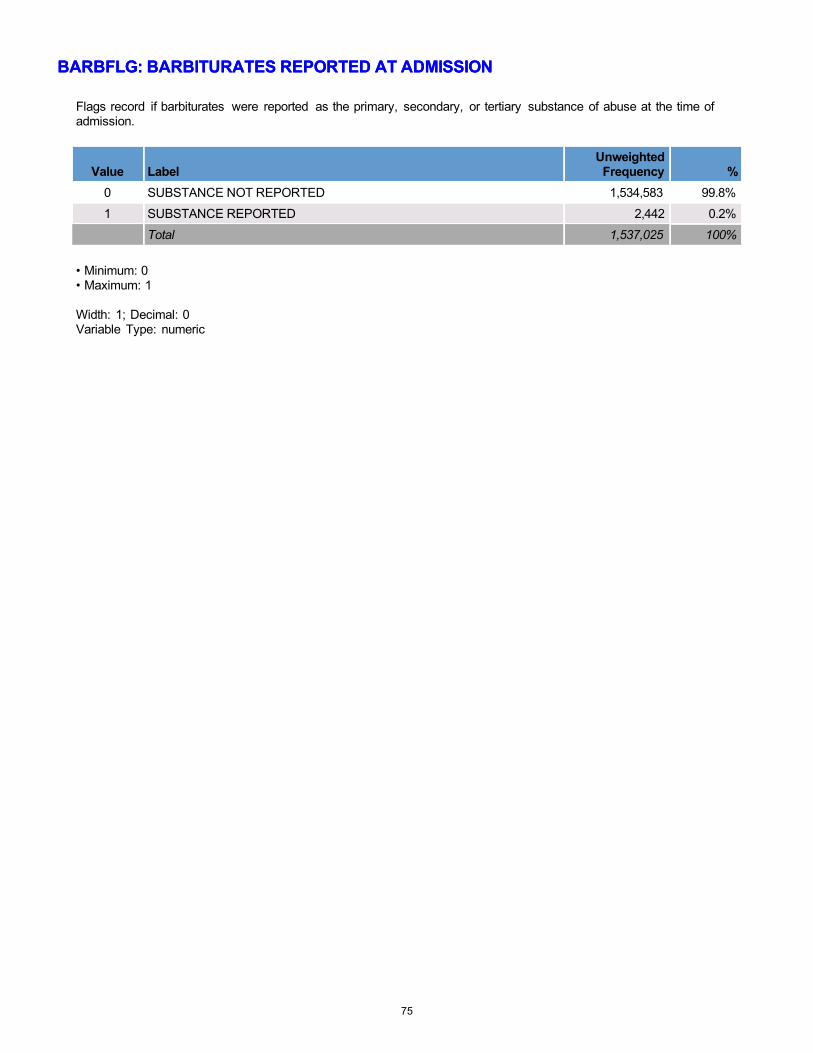
BARBFLG: BARBITURATES REPORTED AT ADMISSIONBARBFLG: BARBITURATES REPORTED AT ADMISSION
Flags record if barbiturates were reported as the primary, secondary, or tertiary substance of abuse at the time of admission.
Value Label Unweighted
Frequency %
0 SUBSTANCE NOT REPORTED 1,534,583 99.8%
1 SUBSTANCE REPORTED 2,442 0.2%
Total 1,537,025 100%
• Minimum: 0 • Maximum: 1
Width: 1; Decimal: 0 Variable Type: numeric
75
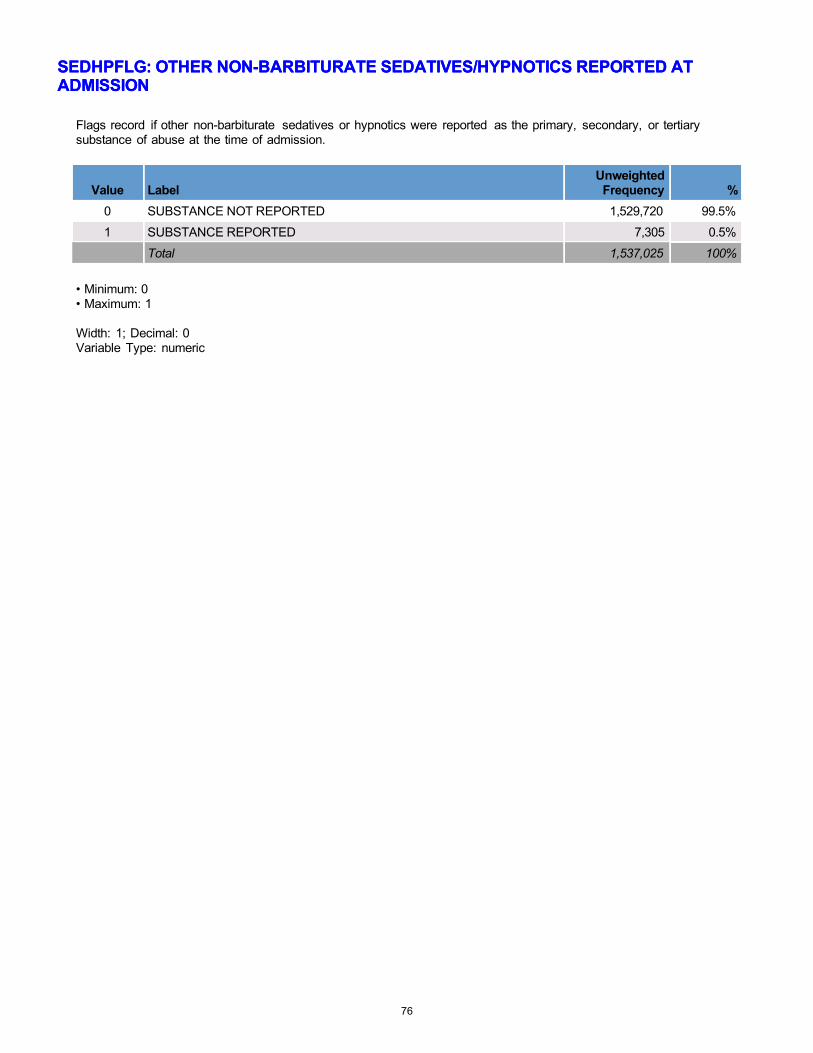
SEDHPFLG: OTHER NON-BARBITURATE SEDATIVES/HYPNOTICS REPORTED ATSEDHPFLG: OTHER NON-BARBITURATE SEDATIVES/HYPNOTICS REPORTED ATADMISSIONADMISSION
Flags record if other non-barbiturate sedatives or hypnotics were reported as the primary, secondary, or tertiary substance of abuse at the time of admission.
Value Label Unweighted
Frequency %
0 SUBSTANCE NOT REPORTED 1,529,720 99.5%
1 SUBSTANCE REPORTED 7,305 0.5%
Total 1,537,025 100%
• Minimum: 0 • Maximum: 1
Width: 1; Decimal: 0 Variable Type: numeric
76

INHFLG: INHALANTS REPORTED AT ADMISSIONINHFLG: INHALANTS REPORTED AT ADMISSION
Flags record if inhalants were reported as the primary, secondary, or tertiary substance of abuse at the time of admission.
Value Label Unweighted
Frequency %
0 SUBSTANCE NOT REPORTED 1,535,047 99.9%
1 SUBSTANCE REPORTED 1,978 0.1%
Total 1,537,025 100%
• Minimum: 0 • Maximum: 1
Width: 1; Decimal: 0 Variable Type: numeric
77

OTCFLG: OVER-THE-COUNTER MEDICATION REPORTED AT ADMISSIONOTCFLG: OVER-THE-COUNTER MEDICATION REPORTED AT ADMISSION
Flags record if over-the-counter medications were reported as the primary, secondary, or tertiary substance of abuse at the time of admission.
Value Label Unweighted
Frequency %
0 SUBSTANCE NOT REPORTED 1,534,209 99.8%
1 SUBSTANCE REPORTED 2,816 0.2%
Total 1,537,025 100%
• Minimum: 0 • Maximum: 1
Width: 1; Decimal: 0 Variable Type: numeric
78

OTHERFLG: OTHER DRUG REPORTED AT ADMISSIONOTHERFLG: OTHER DRUG REPORTED AT ADMISSION
Flags record if other substances were reported as the primary, secondary, or tertiary substance of abuse at the time of admission.
Value Label Unweighted
Frequency %
0 SUBSTANCE NOT REPORTED 1,477,254 96.1%
1 SUBSTANCE REPORTED 59,771 3.9%
Total 1,537,025 100%
• Minimum: 0 • Maximum: 1
Width: 1; Decimal: 0 Variable Type: numeric
79

ALCDRUG: SUBSTANCE ABUSE TYPEALCDRUG: SUBSTANCE ABUSE TYPE
Classifies client's substance abuse type as alcohol only, other drugs only, alcohol and other drugs, or none. This variable looks across primary, secondary, and tertiary substances of abuse reported at the time of admission to treatment.
Value Label Unweighted
Frequency %
0 NONE 29,371 1.9%
1 ALCOHOL ONLY 294,169 19.1%
2 OTHER DRUGS ONLY 761,680 49.6%
3 ALCOHOL AND OTHER DRUGS 451,805 29.4%
Total 1,537,025 100%
• Minimum: 0 • Maximum: 3
Width: 2; Decimal: 0 Variable Type: numeric
80

DSMCRIT: DSM DIAGNOSISDSMCRIT: DSM DIAGNOSIS
Client’s diagnosis is used to identify the substance abuse problem that provides the reason for client encounter or treatment. This can be reported by using either the Diagnostic and Statistical Manual of Mental Disorders (DSM) from the American Psychiatric Association or the International Classification of Diseases (ICD), from the World Health Organization.
The discrete diagnosis codes have been recoded into categories related to abuse of and dependence on specific substances, mental health conditions, and other conditions.
Value Label Unweighted
Frequency %
0 NO DIAGNOSIS 24,119 1.6%
1 ALCOHOL-INDUCED DISORDER 3,199 0.2%
2 SUBSTANCE-INDUCED DISORDER 12,546 0.8%
3 ALCOHOL INTOXICATION 25,946 1.7%
4 ALCOHOL DEPENDENCE 61,740 4.0%
5 OPIOID DEPENDENCE 64,425 4.2%
6 COCAINE DEPENDENCE 8,781 0.6%
7 CANNABIS DEPENDENCE 23,107 1.5%
8 OTHER SUBSTANCE DEPENDENCE 34,520 2.2%
9 ALCOHOL ABUSE 20,767 1.4%
10 CANNABIS ABUSE 16,206 1.1%
11 OTHER SUBSTANCE ABUSE 5,214 0.3%
12 OPIOID ABUSE 3,047 0.2%
13 COCAINE ABUSE 1,988 0.1%
14 ANXIETY DISORDERS 1,704 0.1%
15 DEPRESSIVE DISORDERS 3,322 0.2%
16 SCHIZOPHRENIA/OTHER PSYCHOTIC DISORDERS 976 0.1%
17 BIPOLAR DISORDERS 1,792 0.1%
18 ATTENTION DEFICIT/DISRUPTIVE BEHAVIOR DISORDERS 380 0.0%
19 OTHER MENTAL HEALTH CONDITION 7,044 0.5%
20 OTHER CONDITION 6,333 0.4%
-9 MISSING/UNKNOWN/NOT COLLECTED/INVALID 1,209,869 78.7%
Total 1,537,025 100%
• Minimum: 0 • Maximum: 20
Width: 2; Decimal: 0 Variable Type: numeric
81

PSYPROB: PSYCHIATRIC PROBLEM IN ADDITION TO ALCOHOL/DRUG PROBLEMPSYPROB: PSYCHIATRIC PROBLEM IN ADDITION TO ALCOHOL/DRUG PROBLEM
Indicates whether the client has a psychiatric problem in addition to his or her alcohol or drug use problem.
Value Label Unweighted
Frequency %
1 YES 493,277 32.1%
2 NO 770,949 50.2%
-9 MISSING/UNKNOWN/NOT COLLECTED/INVALID 272,799 17.7%
Total 1,537,025 100%
• Minimum: 1 • Maximum: 2
Width: 2; Decimal: 0 Variable Type: numeric
82

HLTHINS: HEALTH INSURANCEHLTHINS: HEALTH INSURANCE
Specifies the client's health insurance (if any). The insurance may or may not cover alcohol or drug treatment.
Value Label Unweighted
Frequency %
1 PRIVATE INSURANCE, BLUE CROSS/BLUE SHIELD, HMO 73,065 4.8%
2 MEDICAID 269,535 17.5%
3 MEDICARE, OTHER (E.G. TRICARE, CHAMPUS) 55,076 3.6%
4 NONE 263,334 17.1%
-9 MISSING/UNKNOWN/NOT COLLECTED/INVALID 876,015 57.0%
Total 1,537,025 100%
• Minimum: 1 • Maximum: 4
Width: 2; Decimal: 0 Variable Type: numeric
83
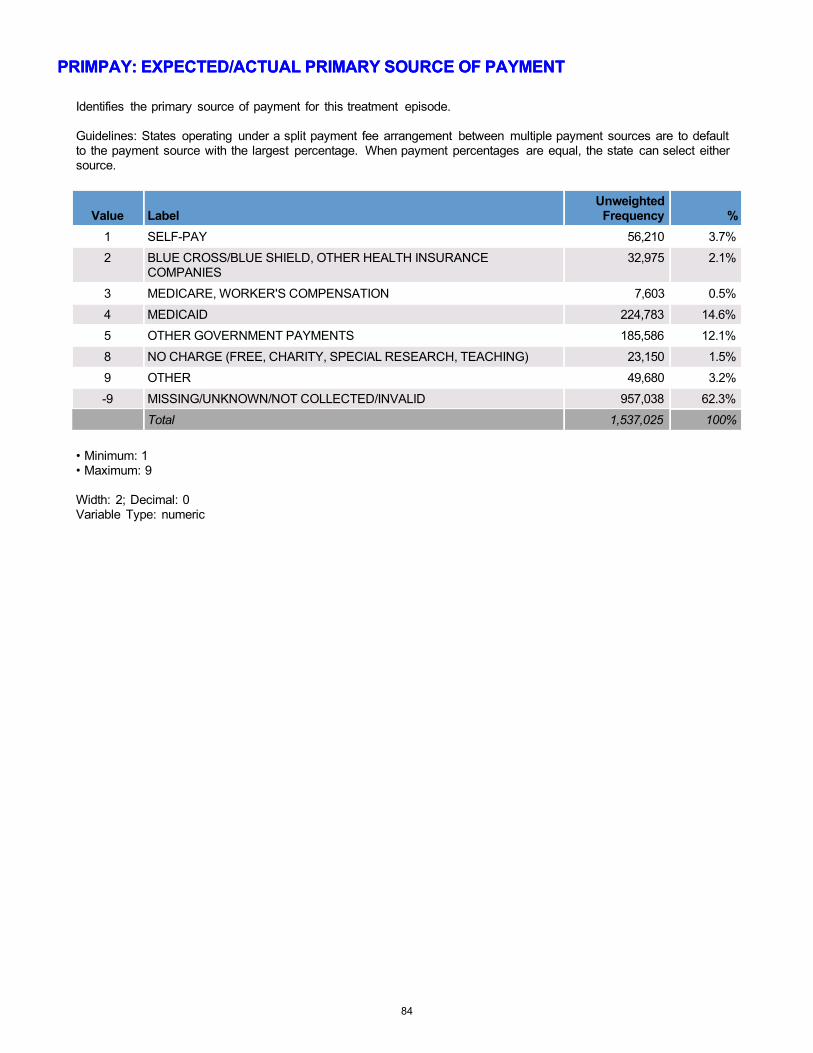
PRIMPAY: EXPECTED/ACTUAL PRIMARY SOURCE OF PAYMENTPRIMPAY: EXPECTED/ACTUAL PRIMARY SOURCE OF PAYMENT
Identifies the primary source of payment for this treatment episode.
Guidelines: States operating under a split payment fee arrangement between multiple payment sources are to default to the payment source with the largest percentage. When payment percentages are equal, the state can select either source.
Value Label Unweighted
Frequency %
1 SELF-PAY 56,210 3.7%
2 BLUE CROSS/BLUE SHIELD, OTHER HEALTH INSURANCE COMPANIES
32,975 2.1%
3 MEDICARE, WORKER'S COMPENSATION 7,603 0.5%
4 MEDICAID 224,783 14.6%
5 OTHER GOVERNMENT PAYMENTS 185,586 12.1%
8 NO CHARGE (FREE, CHARITY, SPECIAL RESEARCH, TEACHING) 23,150 1.5%
9 OTHER 49,680 3.2%
-9 MISSING/UNKNOWN/NOT COLLECTED/INVALID 957,038 62.3%
Total 1,537,025 100%
• Minimum: 1 • Maximum: 9
Width: 2; Decimal: 0 Variable Type: numeric
84

APPENDIX
85
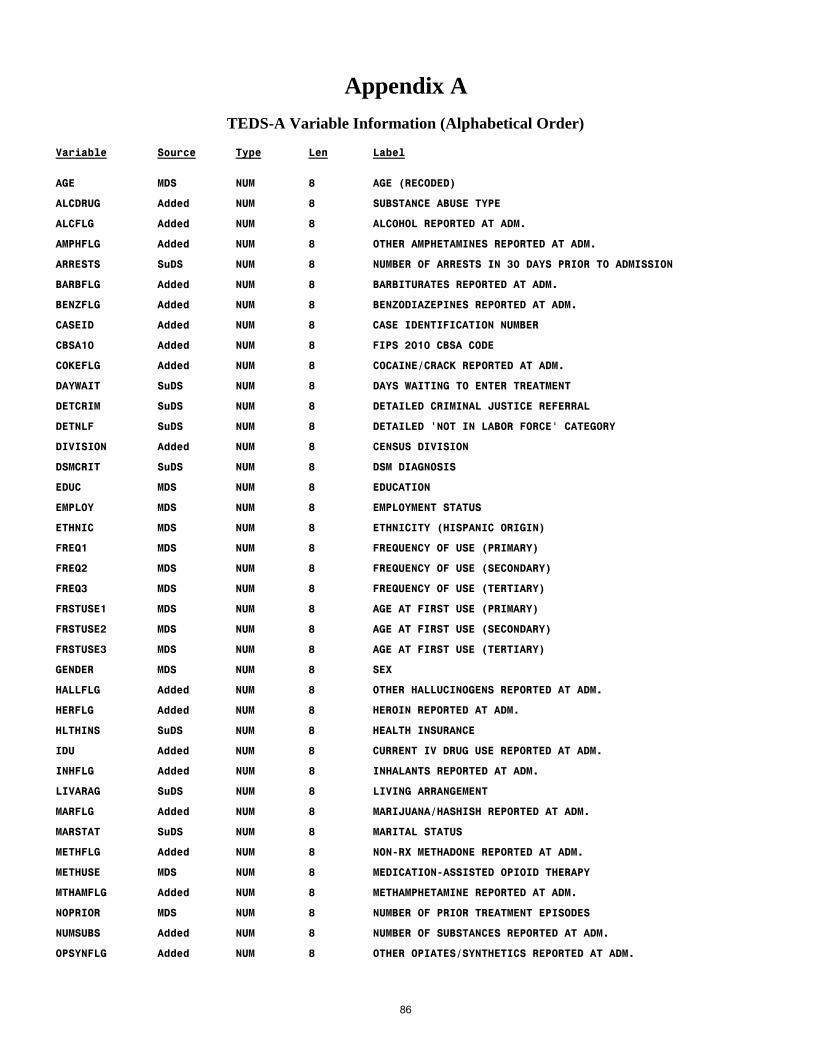
Variable Source Type Len Label
AGE
ALCDRUG
MDS
Added
NUM
NUM
8
8
AGE (RECODED)
SUBSTANCE ABUSE TYPE
ALCFLG Added NUM 8 ALCOHOL REPORTED AT ADM.
AMPHFLG Added NUM 8 OTHER AMPHETAMINES REPORTED AT ADM.
ARRESTS SuDS NUM 8 NUMBER OF ARRESTS IN 30 DAYS PRIOR TO ADMISSION
BARBFLG Added NUM 8 BARBITURATES REPORTED AT ADM.
BENZFLG Added NUM 8 BENZODIAZEPINES REPORTED AT ADM.
CASEID Added NUM 8 CASE IDENTIFICATION NUMBER
CBSA10 Added NUM 8 FIPS 2010 CBSA CODE
COKEFLG
DAYWAIT
Added
SuDS
NUM
NUM
8
8
COCAINE/CRACK REPORTED AT ADM.
DAYS WAITING TO ENTER TREATMENT
DETCRIM SuDS NUM 8 DETAILED CRIMINAL JUSTICE REFERRAL
DETNLF SuDS NUM 8 DETAILED 'NOT IN LABOR FORCE' CATEGORY
DIVISION Added NUM 8 CENSUS DIVISION
DSMCRIT SuDS NUM 8 DSM DIAGNOSIS
EDUC MDS NUM 8 EDUCATION
EMPLOY MDS NUM 8 EMPLOYMENT STATUS
ETHNIC
FREQ1
FREQ2
FREQ3
FRSTUSE1
FRSTUSE2
FRSTUSE3
GENDER
MDS
MDS
MDS
MDS
MDS
MDS
MDS
MDS
NUM
NUM
NUM
NUM
NUM
NUM
NUM
NUM
8
8
8
8
8
8
8
8
ETHNICITY (HISPANIC ORIGIN)
FREQUENCY OF USE (PRIMARY)
FREQUENCY OF USE (SECONDARY)
FREQUENCY OF USE (TERTIARY)
AGE AT FIRST USE (PRIMARY)
AGE AT FIRST USE (SECONDARY)
AGE AT FIRST USE (TERTIARY)
SEX
HALLFLG Added NUM 8 OTHER HALLUCINOGENS REPORTED AT ADM.
HERFLG Added NUM 8 HEROIN REPORTED AT ADM.
HLTHINS SuDS NUM 8 HEALTH INSURANCE
IDU Added NUM 8 CURRENT IV DRUG USE REPORTED AT ADM.
INHFLG Added NUM 8 INHALANTS REPORTED AT ADM.
LIVARAG SuDS NUM 8 LIVING ARRANGEMENT
MARFLG
MARSTAT
Added
SuDS
NUM
NUM
8
8
MARIJUANA/HASHISH REPORTED AT ADM.
MARITAL STATUS
METHFLG Added NUM 8 NON-RX METHADONE REPORTED AT ADM.
METHUSE MDS NUM 8 MEDICATION-ASSISTED OPIOID THERAPY
MTHAMFLG Added NUM 8 METHAMPHETAMINE REPORTED AT ADM.
NOPRIOR MDS NUM 8 NUMBER OF PRIOR TREATMENT EPISODES
NUMSUBS Added NUM 8 NUMBER OF SUBSTANCES REPORTED AT ADM.
OPSYNFLG Added NUM 8 OTHER OPIATES/SYNTHETICS REPORTED AT ADM.
Appendix A TEDS-A Variable Information (Alphabetical Order)
86
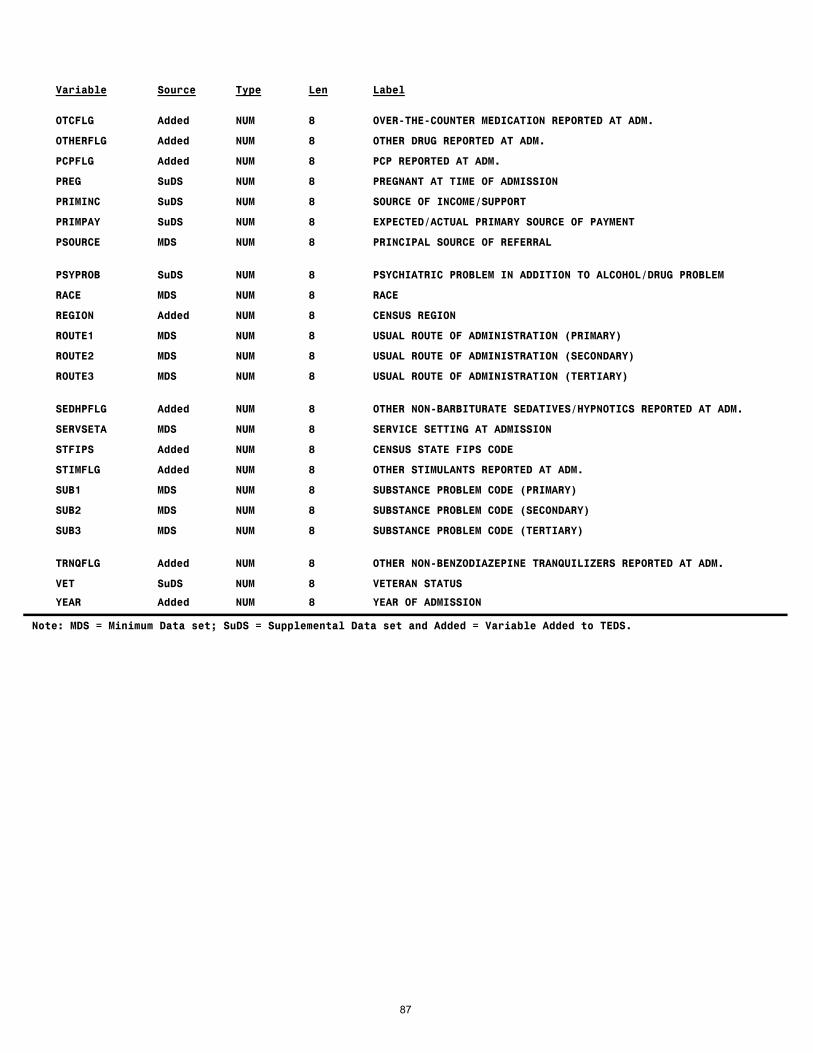
Variable Source Type Len Label
OTCFLG Added NUM 8 OVER-THE-COUNTER MEDICATION REPORTED AT ADM.
OTHERFLG Added NUM 8 OTHER DRUG REPORTED AT ADM.
PCPFLG Added NUM 8 PCP REPORTED AT ADM.
PREG SuDS NUM 8 PREGNANT AT TIME OF ADMISSION
PRIMINC
PRIMPAY
PSOURCE
SuDS
SuDS
MDS
NUM
NUM
NUM
8
8
8
SOURCE OF INCOME/SUPPORT
EXPECTED/ACTUAL PRIMARY SOURCE OF PAYMENT
PRINCIPAL SOURCE OF REFERRAL
PSYPROB
RACE
SuDS
MDS
NUM
NUM
8
8
PSYCHIATRIC PROBLEM IN ADDITION TO ALCOHOL/DRUG PROBLEM
RACE
REGION Added NUM 8 CENSUS REGION
ROUTE1
ROUTE2
ROUTE3
MDS
MDS
MDS
NUM
NUM
NUM
8
8
8
USUAL ROUTE OF ADMINISTRATION (PRIMARY)
USUAL ROUTE OF ADMINISTRATION (SECONDARY)
USUAL ROUTE OF ADMINISTRATION (TERTIARY)
SEDHPFLG
SERVSETA
Added
MDS
NUM
NUM
8
8
OTHER NON-BARBITURATE SEDATIVES/HYPNOTICS REPORTED AT ADM.
SERVICE SETTING AT ADMISSION
STFIPS Added NUM 8 CENSUS STATE FIPS CODE
STIMFLG Added NUM 8 OTHER STIMULANTS REPORTED AT ADM.
SUB1
SUB2
SUB3
MDS
MDS
MDS
NUM
NUM
NUM
8
8
8
SUBSTANCE PROBLEM CODE (PRIMARY)
SUBSTANCE PROBLEM CODE (SECONDARY)
SUBSTANCE PROBLEM CODE (TERTIARY)
TRNQFLG
VET
Added
SuDS
NUM
NUM
8
8
OTHER NON-BENZODIAZEPINE TRANQUILIZERS REPORTED AT ADM.
VETERAN STATUS
YEAR Added NUM 8 YEAR OF ADMISSION
Note: MDS = Minimum Data set; SuDS = Supplemental Data set and Added = Variable Added to TEDS.
87

Variable Original Codes Recodes AGE
Age at Admission
Continuous (0-95) 2 12-14 years old 3 15-17 years old 4 18-20 years old 5 21-24 years old 6 25-29 years old 7 30-34 years old
8 35-39 years old 9 40-44 years old 10 45-49 years old 11 50-54 years old
12 55-95 years old ARRESTS
Number of Arrests Prior to Admission
Continuous (0-96) 0 None 1 Once
2 Two or More Times
MARSTAT 1 Never Married 2 Now Married
1 Never Married 2 Now Married
Marital Status 3 Separated 4 Divorced 5 Widowed
3 Separated 4 Divorced, Widowed
EDUC Continuous (0-25) 1 8 Years or Less 2 9-11
Education 3 12 4 13-15
5 16 or More
APPENDIX B Variable Recode Table
88
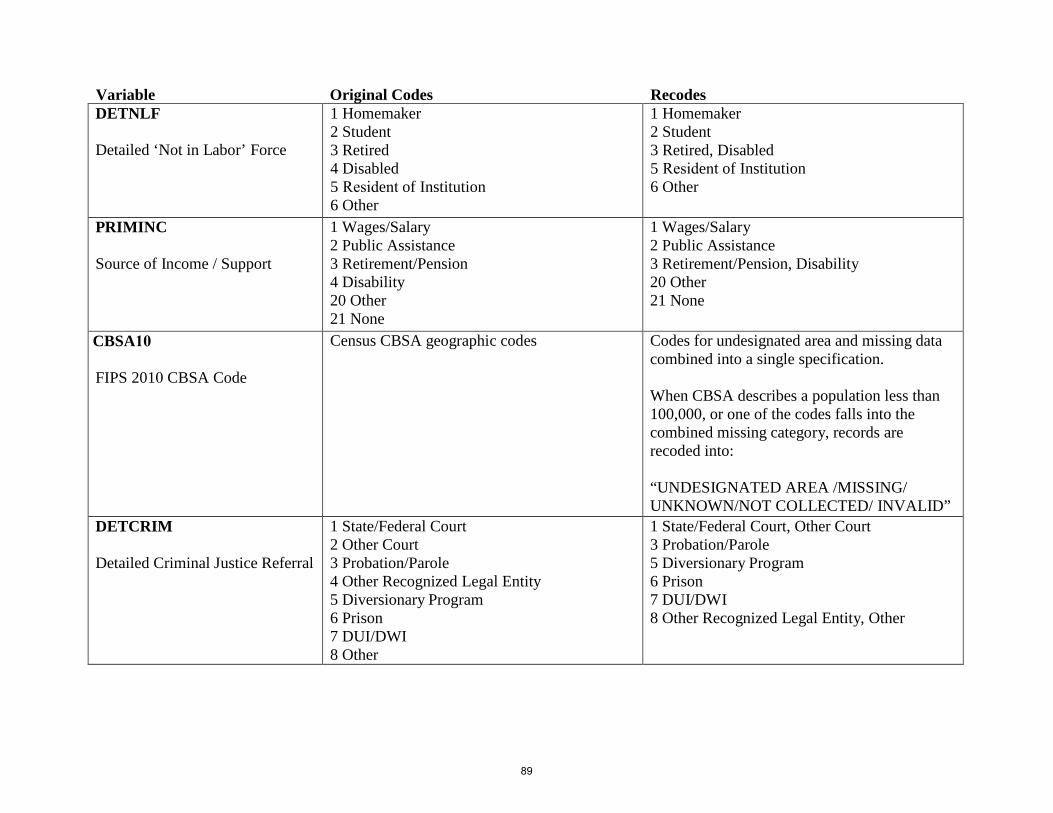
DETNLF 2 Student 2 Student
Detailed ‘Not in Labor’ Force 3 Retired 3 Retired, Disabled 4 Disabled 5 Resident of Institution 5 Resident of Institution 6 Other 6 Other
PRIMINC 1 Wages/Salary 1 Wages/Salary 2 Public Assistance 2 Public Assistance
Source of Income / Support 3 Retirement/Pension 3 Retirement/Pension, Disability 4 Disability 20 Other 20 Other 21 None 21 None
CBSA10
FIPS 2010 CBSA Code
Census CBSA geographic codes Codes for undesignated area and missing data combined into a single specification.
When CBSA describes a population less than 100,000, or one of the codes falls into the combined missing category, records are recoded into:
“UNDESIGNATED AREA /MISSING/ UNKNOWN/NOT COLLECTED/ INVALID”
DETCRIM 1 State/Federal Court 1 State/Federal Court, Other Court 2 Other Court 3 Probation/Parole
Detailed Criminal Justice Referral 3 Probation/Parole 5 Diversionary Program 4 Other Recognized Legal Entity 6 Prison 5 Diversionary Program 7 DUI/DWI 6 Prison 8 Other Recognized Legal Entity, Other 7 DUI/DWI
Variable Original Codes Recodes 1 Homemaker 1 Homemaker
8 Other
89
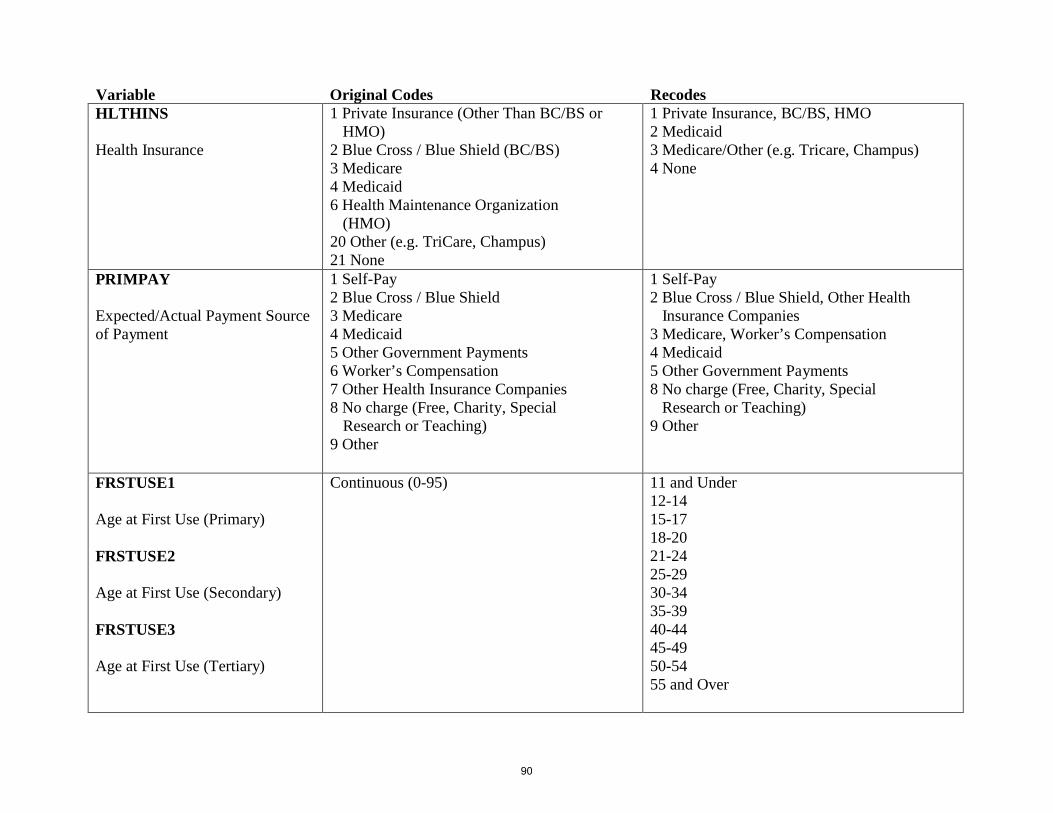
Variable Original Codes Recodes HLTHINS 1 Private Insurance (Other Than BC/BS or 1 Private Insurance, BC/BS, HMO
HMO) 2 Medicaid Health Insurance 2 Blue Cross / Blue Shield (BC/BS) 3 Medicare/Other (e.g. Tricare, Champus)
3 Medicare 4 Medicaid 6 Health Maintenance Organization (HMO)
20 Other (e.g. TriCare, Champus) 21 None
4 None
PRIMPAY
Expected/Actual Payment Source of Payment
1 Self-Pay 2 Blue Cross / Blue Shield 3 Medicare 4 Medicaid 5 Other Government Payments 6 Worker’s Compensation 7 Other Health Insurance Companies 8 No charge (Free, Charity, Special Research or Teaching)
9 Other
1 Self-Pay 2 Blue Cross / Blue Shield, Other Health Insurance Companies 3 Medicare, Worker’s Compensation 4 Medicaid 5 Other Government Payments 8 No charge (Free, Charity, Special Research or Teaching) 9 Other
FRSTUSE1 Continuous (0-95) 11 and Under 12-14
Age at First Use (Primary) 15-17 18-20
FRSTUSE2 21-24 25-29
Age at First Use (Secondary) 30-34 35-39
FRSTUSE3 40-44 45-49
Age at First Use (Tertiary) 50-54 55 and Over
90

Variable Original Codes Recodes DSMCRIT
DSM Diagnosis
0.00 0 No Diagnosis
291.00 – 291.99 1 Alcohol-Induced Disorder
292.00 – 292.99 2 Substance-Induced Disorder
303.00 – 303.89 3 Alcohol Intoxication
303.90 – 303.99 4 Alcohol Dependence
304.00 – 304.09 5 Opioid Dependence
304.20 – 304.29 6 Cocaine Dependence
304.30 – 304.39 7 Cannabis Dependence
304.10 – 304.19, 304.40 – 304.99, 305.10 – 305.19
8 Other Substance Abuse Dependence
305.00 – 305.09 9 Alcohol Abuse
305.20 – 305.29 10 Cannabis Abuse
305.30 – 305.49, 305.70 – 305.99 11 Other Substance Abuse
305.50 – 305.59 12 Opioid Abuse
305.60 – 305.69 13 Cocaine Abuse
293.89, 300.00 – 300.02, 300.21 – 300.23, 300.29 – 300.39, 308.30 – 308.39, 309.81
14 Anxiety Disorders
296.20 – 296.39, 300.40 – 300.49, 311.00 – 311.09
15 Depressive Disorders
293.81 – 293.82, 295.00 – 295.99, 297.10 – 297.19, 297.30 – 297.39, 298.80 – 298.89, 298.90 – 298.99
16 Schizophrenic / Other Psychotic Disorders
296.00 – 296.09, 296.40 – 296.79, 296.80, 296.89, 301.13
17 Bipolar Disorders
312.80 – 312.81, 312.90 – 312.99, 313.81, 314.00 – 314.01, 314.90 – 314.99
18 Attention Deficit / Disruptive Behavior Disorders
All other codes 19 Other Mental Health Condition
.01 – 289.99, 320 – 997.99, V-codes, E-codes 20 Other Condition
999.97 – 999.99 -9 Missing
91