Embed Size (px)
Citation preview

Available online at www.sciencedirect.com
www.elsevier.com/locate/jtrangeo
Journal of Transport Geography 16 (2008) 342–357
Travel-to-school mode choice modelling and patternsof school choice in urban areas
Sven Muller *, Stefan Tscharaktschiew, Knut Haase
Institute for Transport and Economics, Dresden University of Technology, Andreas-Schubert-Strasse 23, 01062 Dresden, Germany
Abstract
Because of declining enrollment and school closures in some German regions students have to choose a certain school location from areduced set of schools. For the analysis of adverse effects of school closures on transport mode choice the patterns of school choice arespecified first. It seems that proximity and the profile offered (languages as a core for example) are adequate factors. Second, the travel-to-school mode choice are modelled using a multinomial logit approach, since students might switch from low cost transport modes(cycling for instance) to modes with remarkably higher costs (public transport for instance). Here, the most influencing factors are dis-tance, car availability and weather. Furthermore, these findings are incorporated into a case study to quantify the effects of a modal-shift(switch from one transport mode to another). For this analysis a comprehensive survey was undertaken and a method of data disaggre-gation and geocoding is presented.� 2007 Elsevier Ltd. All rights reserved.
Keywords: Multinomial logit model; Data disaggregation; School choice; Travel-to-school mode choice
1. Introduction
More and more German regions are confronted withdeclining enrollment numbers caused by decreasing popu-lation and negative net migration. This in turn impliesthe necessity to close some school locations. Students haveto choose a certain school location from a reduced set ofremaining schools and may face a longer way to school.Since distance strongly influences the travel-to-schoolmode choice, students switch from modes appropriate forshort distances like cycling to modes appropriate for longerdistances like public transport (modal-shift). Latest studieson travel-to-school mode choice stress the establishment ofneighborhood schools and thus the preponderance of activ-ity-related travel-modes like walking or biking due to shorttravel-to-school distances (Ewing et al., 2005; de Boer,
0966-6923/$ - see front matter � 2007 Elsevier Ltd. All rights reserved.
doi:10.1016/j.jtrangeo.2007.12.004
* Corresponding author. Tel.: +49 351/463 3 6815; fax: +49 351/463 37758.
E-mail addresses: [email protected] (S. Muller), [email protected] (K. Haase).
2005). Inter alia, these modes are beneficial for students’health (McDonald, 2005; McMillan, 2003). Our focus ison the economic benefit of neighborhood schools and shortdistances: modes like car or public transport are related toconsiderably higher costs in contrast to walking andbiking. Moreover, neighborhood schools are desirable,because any policy which forces people to use motorizedtransport modes might not be appropriate within the con-text of climate change and peaking of global oil produc-tion. The closure of schools leads to savings forauthorities in infrastructural and personnel costs, but therecould be an increase in transport costs, which yieldsincreased total costs. For an estimation of the additionalcosts within the framework of dynamic school networkplanning one has to analyze the process and the most influ-encing factors of school choice and travel-to-school modechoice first. This is a more complex task in urban than inrural areas. Recent studies explain school choice (in Ger-many) by proximity and tuition fees among others but donot cover the school’s profiles – i.e. special courses (Speiser,1993; Mahr-George, 1999; Hoxby, 2003; Schneider, 2004;

Fig. 1. Main aspects of the educational system of Saxony.
1 There are 64 districts and more than 6400 blocks in Dresden.
S. Muller et al. / Journal of Transport Geography 16 (2008) 342–357 343
Hastings et al., 2005). We expect that students choose theschool closest to their home and those who do not, choosea school with a different profile than the closest one. In thispaper we analyze the consequences of a school closure inthe City of Dresden, Saxony and present the results of alarge empirical study (n = 4700).
The remainder of this article is organized as follows. InSection 2 we describe the data used and present a methodof data disaggregation. This is followed by the examina-tion of the school choice behavior (Section 3) and themodelling of travel-to-school mode choice (Section 4). InSection 5 we present an example of school closure andmodal-shift for the City of Dresden. Some final remarkscan be found in Section 6.
2. Data and disaggregation
In this section we depict how the survey was accom-plished, what data are available and how these data aredisaggregated using a commercial Geographic InformationSystem (GIS). The data are analyzed in detail in Sections 3and 4.
2.1. Data
This study is focused on secondary schools, particularlycolleges (German = ‘‘Gymnasium”). College students areaged between 10 and 19 years (see Fig. 1). In Dresdenaround 45% of all secondary school students are collegestudents (City Council of Dresden (=LandeshauptstadtDresden, 2003). The possibility to enroll on a college orhigh school depends on the elementary school report (over-all average grade). Our data set includes administrativeareas (spatial units), the school locations, the street net-work, the bus and tram stops and the routes of the publictransportation system of Dresden. As administrative areas
we consider districts and blocks1. A block is bordered bystreets (see Fig. 2). Note, each district consists of a uniqueset of blocks. Using a shortest path algorithm we havedetermined the street network distances between all blockswithin Dresden. These distances have to be interpreted aswalking distances in the absence of information aboutaccessibility for cars around one-way street systems forinstance. As this paper just considers the commute toschool, the car and motorcycle do not play an importantrole (see also Section 4). Population data cover the agegroups 10–19 years at block level for the years 2004 and2008 (forecast). These data are needed to compute theabsolute effects of modal-shift due to a school closure in2008 compared to the situation in 2004.
In 2004, a survey was carried out covering nearly 4700of 14000 college students at 12 of the 23 colleges in Dresdenlasting from January to November including a pre-test. Ashort form questionnaire (two pages) was used very similarto that used by the German Federal Ministry of Transport(Federal Ministry of Transport, Building and UrbanAffairs, 2002). Information was obtained of each student’shome district, the school attended, age, sex, car availabilityand whether the student owns a driver’s license as well astravel-to-school mode choice and total travel-time. Thetotal travel-time is related to the most preferred transportmode from home to school in the summer term. Studentswere asked to state their preferred transport mode whichis usually chosen for the way to school and back home bothin winter and summer term. Fair weather was assumed tobe synonymous with the summer term and bad weatherwith the winter term, respectively (see Fig. 3). Furthermore,the students were asked how often they use a certain modewhile commuting to school within a representative week.

Fig. 2. The City of Dresden – Administrative areas and public transport access.
Fig. 3. Climate diagram for Dresden, Saxony.
344 S. Muller et al. / Journal of Transport Geography 16 (2008) 342–357
Again, this information is available for the summer and thewinter term. In case of the usage of public transportation,there is information about bus routes and stops (origin,
destination and change). Moreover, the students wereasked to state their waiting times (departure station,change) and access as well as egress times, which are the

S. Muller et al. / Journal of Transport Geography 16 (2008) 342–357 345
walking time from home to the departure station and thewalking time from the destination station to school. Thequestionnaire ends with questions, among others, onthe ticket used and the satisfaction with the level of service.
2.2. Disaggregation
Due to administrative restrictions which prohibit inquir-ing about detailed student addresses, a method was devisedfor small scale (blocks) geocoding of the survey data usinga GIS. The data were collected on the scale of districts.Since distance is an important variable discriminatingbetween most of the transport modes, data as disaggregat-ed as possible are needed in order to obtain a good approx-imation of exact distances for each student. Several authorsstress the use of disaggregated data for distance relatedanalysis (Goodchild, 1979; Bach, 1981; Fotheringhamet al., 1995; Longley et al., 2001). There are only a fewmethods that deal with data disaggregation for transportsurveys, but some work has been done in other fields ofresearch (Gimona et al., 2000; Spiekermann and Wegener,2000; Van der Horst, 2002; Greaves et al., 2004; Oosterha-ven, 2005).
Most of the students use public transportation on theirway to school (50–60%, see Section 4). Thus, the departurebus or tram stop used and the time needed to get therefrom home are known. Now, let us assume a student islocated in district A (see Fig. 4). Taking into account anaverage walking speed of 4 km/h, one can determine a stu-
Fig. 4. Allocation of students u
dent specific isochrone around the stated departure bus ortram stop. So, just a few blocks possibly contain the homeof the student. Blocks without population are eliminated.The number of possible blocks could be reduced by consid-ering the bus or tram route chosen by the student. This isbased on the assumption that most of the students usethe bus stop of the chosen line which is closest to theirhome. However, the situation arose that more than onepossible block has to be taken into account for allocatingthe specific student although using all information avail-able. Students with comparable properties (travel-time,home district) are allocated to the considered blocks rela-tive to the population of the specific age-group.
Regarding students who never commute to school bypublic transportation this detailed information is not avail-able. In this case the following procedure has to be used:Imagine another student living in district A and the schoolattended is located in district B (see Fig. 5). Again, theinformation of the commuting mode is available fromour survey data as well as the total travel-time. We assumea transport mode specific average speed for walking of4 km/h and for cycling of 12 km/h (Federal EnvironmentAgency Germany, 2007). The speed limit for cars andmotorcycles is usually 50 km/h. Due to traffic lights andcongestion we suppose an average speed of 30 km/h forcars and motorcycles in (German Aerospace Center,2007). We expect these average speeds to be sufficient forthe geocoding process. Using the average speed and the sta-ted travel-times, we are able to determine a student specific
sing public transportation.

Fig. 5. Allocation of students not using public transportation.
2 Which is comparable to magnet schools.
346 S. Muller et al. / Journal of Transport Geography 16 (2008) 342–357
isochrone around the school attended. For the modes bik-ing and in particular car/motorcycling these isochrones arelarger than those around bus stops (see above). Accordingto this, there is more uncertainty about the correctness ofthe allocation of students to blocks in this case. However,there is just a very small percentage (6–10%) of studentswho commute to school by car or motorcycle (see Section4). But we expect that possible errors will be limited due tothe extent of the sample.
3. Patterns of school choice
In Saxony, no regulations exist restricting the choice ofschools. So, there are no intrinsic school-districts and stu-dents are free to choose a certain school location. Severalsurveys yield proximity and the authority responsible (pri-vate or public school) as two very important factors ofschool choice. Others are the reputation of schools and tui-tion fees, for example Speiser (1993), Mahr-George (1999),Hoxby (2003), Schneider (2004) and Hastings et al. (2005).We expect that the school’s profiles could have influence onschool choice as well. In this study we will focus on dis-tance, the school profile and the authority responsible todetermine the school location choice, since most of theother influencing factors stated in the literature cannot beapplied here due to the lack of data or unimportance (i.e.average household income and tuition fees). With regardto profile we differentiate between schools with a commonprofile and schools with an unique profile. A common pro-file is offered by several colleges. So these schools are sub-
stitutable by others (mathematics/science for example). Aunique profile2 – i.e. advanced-level/core languages – isonly offered by one specific school. For an overview ofschool locations and profiles offered, see Fig. 6.
3.1. School catchment area and proximity
We have to determine the surrounding catchment areaof each school first. Therefore, the nearest school locationhas been verified for each block. Because students will notalways realize this strictly drawn border, we have addedtwo zones with virtually reduced distances (zone 2:�1000 m and zone 3: �2000 m). Consequently, the dis-tances of blocks within zones 2 and 3 are minimal to thespecific school location (see Fig. 7). Table 1 shows the per-centage of students within the corresponding zones for allschools of our sample. In example, 84.8% of all studentsattending Klotzsche college are located in zone 1 of thiscollege. The surrounding catchment area of each schoolconsists of three zones as defined above. We believe thatwithin this area students recognize the specific school asthe closest one. Two main patterns are evident:
� Students attending schools with a common profilemostly are located in the surrounding catchment area.Thus, one could assume that proximity is an importantfactor for school choice.

Fig. 6. Colleges in Dresden.
S. Muller et al. / Journal of Transport Geography 16 (2008) 342–357 347
� For schools with a unique profile and for private schoolsthis does not hold true. It seems to be that a unique pro-file, or a private school, reduces the importance ofproximity.
Outliers in both groups – Marie-Curie College andMartin-Andersen-Nexo College, for example – are dueto the topology of the school network (see Fig. 6).Schools located in an area with a high density of schoollocations (spatial cluster) obtain smaller surroundingcatchment areas and thus fewer students within them.At the outskirts these catchment areas are larger and pos-sibly contain more students. For students located inblocks close to a spatial cluster it is not always obviouswhich school location is the closest one. Within a clusterthere are many choice alternatives available withinremarkable proximity (Bertold-Brecht College forinstance, see Fig. 6). It is reasonable to assume that ifthe closest school location does not match the preferencesof students for a combination of profiles, etc., a schoolwithin the cluster does so. For students located in a spa-tial cluster, proximity is less important than for those stu-dents located at the outskirts. At the same time other
properties like profile, are more important for the deci-sion which school to enroll at.
3.2. School profile and school choice
For a deeper investigation of the influence of profileand the authority responsible we consider Table 2. Itshows the distribution of those students who attendschools which are not the closest one. Over all most ofthe students (80%) choose schools with a different profileand/or a different authority responsible. Let us takeKlotzsche College as an example: for 100 students Klotz-sche College is the closest one, but they actually choose adifferent school (sum 1–5). Eighty-eight (0.88, see last col-umn) of them choose colleges with a different profileoffered and/ or a different authority responsible (sum 2–5). Twenty of these 88 students choose colleges with analternative profile (column 3). Over all colleges nearly70% of the students who choose a different school thanthe closest one, choose a school with a different profile.Therefore, we assume that profile and the authorityresponsible are two factors which influence the choice ofa certain school. Those 20% of students who attend a

Fig. 7. Surrounding catchment areas: blocks to which the three exemplary colleges are the closest one.
Table 1School-specific catchment areas
College Zone 1 Zone 2 Zone 3 Other Sum zones 1–3
Klotzsche 84.8 0.5 0 14.7 85.3Großzschachwitz 68 12.9 1.7 17.4 82.6Cotta 50 23.3 17.5 9.3 90.7Julius-Ambrosius-Hulße 32.6 28.7 12.4 26.4 73.6Fritz-Loffler 35.8 11.2 23 30 70Plauen 46 9.4 8.9 35.7 64.3Vitzthum 48.6 5.7 17.7 28 72Romain-Rolland 9.4 18.8 3.6 68.2 31.8Marie-Curie 8.3 14.8 11.6 65.3 34.7Martin-Andersen-Nexo 15.1 26.1 17.6 41.2 58.8Joseph-Haydn 7.3 17 32.1 43.6 56.4St. Bennoa 0.4 4.1 10.2 85.3 14.7
Values are given in percentage.Only schools which are covered in the survey by at least 150 students are considered.Colleges written bold are magnet schools (unique profile).
a Private school.
348 S. Muller et al. / Journal of Transport Geography 16 (2008) 342–357
school with the same properties as their closest one, maybe attracted by factors not considered here (extracurricu-
lar program for example). Another possible reason maybe inner-city student migration.

Table 2Conditional school choice of students choosing a different school than the closest one
# of students in zone 1 of college Attending a college with Sum 2–5 Sum 1–5 Sum 2–5/sum 1–5
1 2 3 4 5
Klotzsche 12 29 20 0 39 88 100 .88Großzschachwitz 49 0 169 0 30 199 248 .80Cotta 23 0 20 0 17 37 60 .62Julius-Ambrosius-Hußle 37 0 31 0 32 63 100 .63Fritz-Loffler 0 8 81 0 11 100 100 1Plauen 40 4 67 0 25 96 136 .71Vitzthum 1 50 97 0 20 167 168 .99Romain-Rolland 0 3 12 0 13 28 28 1Marie-Curie 1 0 21 0 6 27 28 .96Martin-Andersen-Nexo 47 5 19 0 33 57 104 .55Joseph-Haydn 23 0 20 0 16 36 59 .61St. Bennoa 0 0 0 24 0 24 24 1
Average (total numbers) 19.4 8.3 46.4 2 20.2 76.8 96.3 .80Average (relative numbers, %) 20 9 48 2 21 80
1: Identical profile and authority responsible; 2: additional feature (additional language i.e.); 3: alternative profile; 4: alternative authority responsible; 5:alternative profile and authority responsible.Colleges written bold are magnet schools (unique profile).
a Private school.
S. Muller et al. / Journal of Transport Geography 16 (2008) 342–357 349
4. Travel-to-school mode choice modelling
Regarding the travel-to-school mode choice, the mode isa categorical variable. We suggest a student chooses thetransport mode with the highest utility. So we revert tomultinomial logistic regression since this is based on utilitytheory and appropriate for categorical data analysis. Thelogit approach has been widely used in fields of transportmodelling. The modeler assumes the utility Uij of a trans-port mode i (walking, cycling, public transport and car/motorcycle) to a student j, and includes a deterministiccomponent Vij and an additive random component eij
U ij ¼ V ij þ eij ð1Þ
Fig. 8. Mod
Here, the deterministic component of the utility function islinear in parameters. Assuming that the random compo-nent, which represents errors in the modeler’s ability to rep-resent all the elements that influence the utility of atransport mode to an individual, is independently and iden-tically Gumbel-distributed across individuals and transportmodes, the multinomial logit model (MNL) is as follows:
P ij ¼exp V ij
PIi’¼1 exp V ı’j
ð2Þ
where Pij is the probability that transport mode i is chosenby student j and I is the set of different transport modes.The closed form of the MNL makes it straightforward toestimate (maximum likelihood estimation procedure),
al split.

Table 4Regression parameters
Logistic regression Correctlypredicated(per cent)
Coefficient Wald
Walking 88Absolute term 10.774 2119.891Distance �4.376 1369.57Winter season/bad �0.591 13.024
350 S. Muller et al. / Journal of Transport Geography 16 (2008) 342–357
interpret and use. Detailed work on theory, shortcomingsand some applications can be found in the literature(McFadden, 1973; Ben-Akiva and Lerman, 1985; Bhat,1997; Koppelmann and Sethi, 2000; Greene, 2003). Recentstudies concerning travel-to-school mode choice utilizingMNL have been focused on urban form, built environmentand distance (McMillan, 2003; Black et al., 2004) as well astravel-time (Woodside et al., 2002; Ewing et al., 2004;McDonald, 2005). Ewing et al. (2005) and de Boer (2005)focused on the relationships between travel-to-school modechoice and school location, safety, and vehicle emission.
We like to analyze the influence of the variables dis-tance, car availability, season or weather, respectively, oncommuting mode choice. Age is considered as an explana-tory variable as well, admittedly it turned out to be not sig-nificant for public transport. Distance is a continuousvariable measured in kilometers. Car availability (alltime/not all time) and weather (fair/bad) are dummy vari-ables. Car availability means, whether the student has thepossibility of travelling to school by car. This includesthe possibility of the student being passenger while themother for instance drives the car. Car availability equalsone, if the student has the possibility of commuting toschool by car every day. We just consider a few variablesfor forecasting purposes and for an easy interpretation ofthe relationships.
Table 3 displays an aggregated overview of the surveydata set. It is remarkable that the average distance of pub-lic transport and car/motorcycle increases in summer whilethe absolute number of students decreases. We suggest thatthis is because in summer (or fair weather) only those stu-dents who are not able to switch to walking or cycling dueto too long distances use the bus or car. In winter (or badweather) there are some students taking the bus/car for rea-sons of convenience – i.e. avoid walking in the rain –although the distance to school would be acceptable for
Table 3Mean distances for each transport mode and absolute car availability
Variable Mean Standarddeviation
n cases
Distance, km 3.941 3.566 4644Distance – walking (summer) 0.710 0.408 845Distance – walking (winter) 0.859 0.526 1010Distance – cycling (summer) 2.364 1.307 1130Distance – cycling (winter) 2.022 0.988 349Distance – public transportation
(summer)5.390 3.111 2390
Distance – public transportation(winter)
4.943 3.034 2838
Distance – car/motorcycle (summer) 7.693 6.910 279Distance – car/motorcycle (winter) 6.036 6.104 447
Winter Summern cases n cases
Car availability – all time 391 502Car availability – not all time 4253 4142Season/weather 4644 4644
cycling or walking. With regard to cycling the slightincrease in average distance in summer is related to thestrong increase in the number of students choosing to cycle.Some of these additional students who are cycling in thesummer term show longer distances (using public transpor-tation or car in winter).
We expect that the slight decrease in average distancefor walking in winter is conditional on students who switchfrom cycling in summer (due to distance) to walking in win-ter due to weather conditions. For example, they avoid tak-ing a risk going by bike in case of snowfall.
4.1. Model results and interpretation
The results of the estimation are shown in Table 4.There are 4650 college students within our data set. Thesample size for estimation is 9300 because we regard eachstudent as twofold: once for summer and once for winter.
Table 4 shows that on average 81% of all cases are cor-rectly predicted by our model. A logistic analogy to R2 inordinary least squares (OLS) regression is the McFaddenR2. In general, the McFadden R2 greater than 0.4 can beinterpreted as a very good goodness of fit (Backhauset al., 2003). With reference to these aspects, the modelappears to have good explanatory qualities.
weatherCar availability (all time) �5.279 489.696
Cycling 42Absolute term 6.57 1196.853Distance �0.904 748.843Winter season/bad
weather�2.081 200.51
Car availability (all time) �4.772 675.716
Public transport 89Absolute term 4.477 686.946Distance �0.052 8.796Winter season/bad
weather�0.489 1510.892
Car availability (all time) �0.553 13.111
Car/motorcycle 81Average 81Number of observations 93002 log likelihood �9584McFaddenR2 0.63
All variables are significant at the 1% level. The Transport mode car/motorcycle is defined as reference category and parameters are set to zero.This means that all the other regression coefficients have to be interpretedin relationship to this category.

S. Muller et al. / Journal of Transport Geography 16 (2008) 342–357 351
Compared to the mode car/motorcycle all other trans-port modes have a higher utility. If we ignore other influenc-ing factors, walking is the most preferred mode (10.774).Taking into account the other variables, it is obvious thatthe utility of car/motorcycle will increase in relation to thethree other modes. Although some information is providedby the coefficients themselves, the interpretation of thechoice probabilities is more revealing. Fig. 9 shows thetransport mode choice probabilities. Walking is the mostimportant transport mode for short distances (up to1 km) regardless of car availability and weather. Concern-ing cycling, weather and distance have a strong influenceon associated probability. Students with car availabilityswitch from bike to car at shorter distances than those withno car available who switch from bike to public transporta-tion. To discriminate between the modes public transportand car/motorcycle the stated car availability is the most
Fig. 9. Mode specific choice probabilities (a: walking,
important factor. The gap between summer and winter inboth motorized transport modes within the range of1–3 km is related to the reduced probability of travel-to-school by bike in winter. Mostly, distance influences thedecision to go by bike or walk on the one hand and to usepublic transportation or car/motorcycle on the other.
For several reasons it is recommendable to avoid a highproportion of students choosing transport modes otherthan walking or cycling. Obviously, there are higher costsrelated to transport modes like car/motorcycle than thisis the case for walking and cycling. Moreover, walkingand cycling are more activity related and thus better forstudents’ health than motorized transport modes. A largepercentage of students using public transport or car/motor-cycle yields a negative impact on the environment due toemission (noise/pollution). In the following section theseissues will be discussed in more depth.
b: cycling, c: public transport, d: car/ motorcycle).

Fig. 10. Zone 1 of Großzschachwitz College: Absolute (c) and relative (d) change in student numbers from 2004 (a) to 2008 (b).
3 We have computed the average utility due to summer and winter term.
352 S. Muller et al. / Journal of Transport Geography 16 (2008) 342–357
5. Modal-shift and school closure – an example
Under-utilization usually forces authorities to closeschools. This is often justified for economic reasons. In thissection, we like to analyze whether there is economic orsocial/ecological evidence emerging from a modal-shift,which could justify keeping open an under-used school.
5.1. Differences in mode choice due to school closure
In the year 2000, the school authorities in Saxonydecided to close several school locations in Dresden dueto declining enrollment in the 1990s. One of them isGroßzschachwitz College which will be closed in summer2008. According to this, the students affected have toattend different schools which are available. Here, weanalyze the shift in transport mode choice and the relatedconsequences. The example is based on the year 2004 andcovers a student number forecast for 2008. The forecastshows that student numbers and hence enrollment willincrease again (see Fig. 10). This phenomenon is typicalfor recently prospering cities in Eastern Germany. Afteryears of dramatic decline, the population increases again.
According to Table 1, there are 68% of the studentslocated in zone 1 attending Großzschachwitz College. In
2004, there are overall 467 students enrolled atGroßzschachwitz College. Hence, 318 students ofGroßzschachwitz College are located in zone 1. The totalof college students in zone 1 of Großzschachwitz Collegeis 403 in 2004. Thus, 79% of all college students located ina block of zone 1 of Großzschachwitz College attend thiscollege in 2004. Based on this, we assume that 79% of thestudents located in zone 1 enroll at the closest collegeavailable (see Section 3). We apply the MNL specifiedin Section 4 and yield the number of students3 choosinga given transport mode for the years 2004 and 2008 (seeFigs. 11 and 12). In both cases we just consider those79% of the students located in zone 1 who attend theclosest college, which is Großzschachwitz College in2004 and Julius-Ambrosius-Hulße College in 2008. Threemain patterns are evident:
1. Usually there is no possibility for most of the students totravel-to-school by car (see Fig. 8 and Table 3). So, inboth scenarios there is only a small number of studentscommuting to school by car or motorcycle.
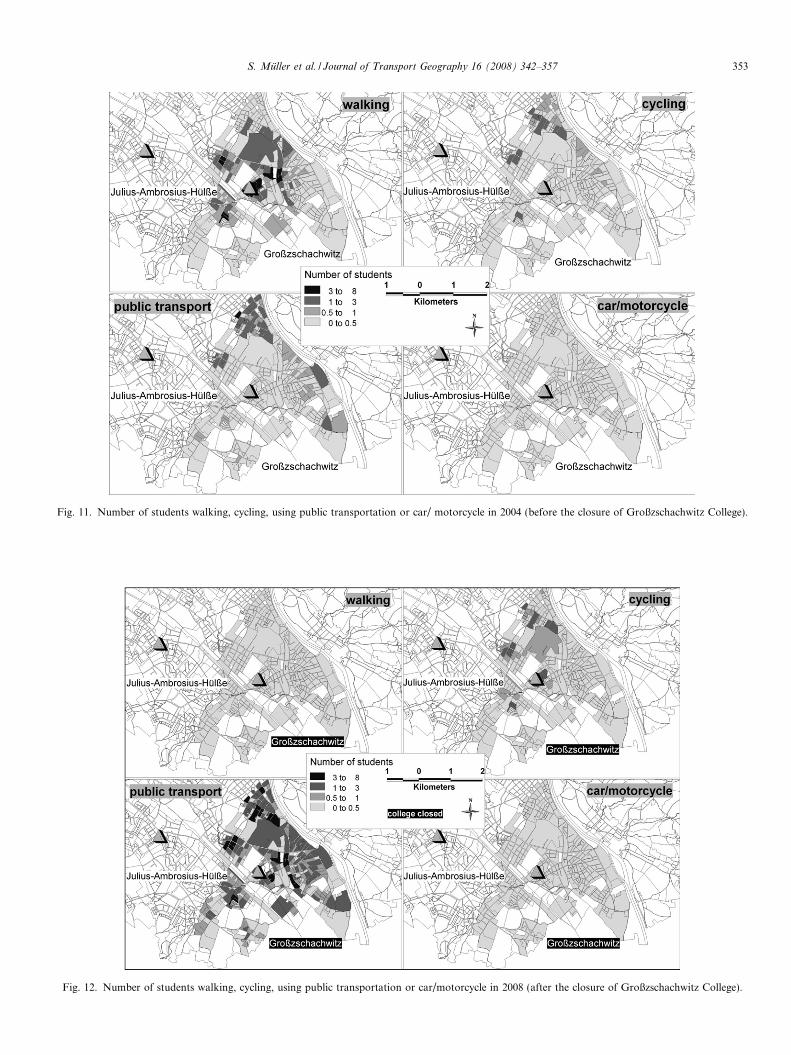
Fig. 11. Number of students walking, cycling, using public transportation or car/ motorcycle in 2004 (before the closure of Großzschachwitz College).
Fig. 12. Number of students walking, cycling, using public transportation or car/motorcycle in 2008 (after the closure of Großzschachwitz College).
S. Muller et al. / Journal of Transport Geography 16 (2008) 342–357 353

Table 5Cost figures
Name Costsin €
Unit Source
Plain costs
Cycling .005 Student km AssumedBus/tram (fare) 1 Student choosing
public transportVerkehrsverbundOberelbe (2007)
Car/motorcycle .165 Student km FGSV (2002)
354 S. Muller et al. / Journal of Transport Geography 16 (2008) 342–357
2. Although no strong difference in the absolute number ofstudents cycling can be observed, one can identify a dif-ference in the spatial pattern: the spatial center of grav-ity of students who commute to school by bike shiftstoward the location of Großzschachwitz College.
3. Most obviously there is a strong increase in the use ofpublic transport while remarkably fewer students walkto school in 2008.
Value of travel-time
Walking .03 Student min Baum et al. (1998)Cycling .035 Student min AssumedPublic transport .04 Student min Axhausen et al. (2001)Car/motorcycle .065 Student min Axhausen et al. (2001)
Baum et al. (1998)
Accident
Public transport .28 Student kmCar/motorcycle 1.64 Student km
Noise Baum et al. (1998)Public transport .00525 Student kmCar/motorcycle .00645 Student km
Pollution Baum et al. (1998)Public transport .00745 Student kmCar/motorcycle .01455 Student km
Note that all figures are costs per trip.
5.2. Quantification of modal-shift
Here, we try to quantify the consequences of the modal-shift due to a school closure. Since we focus on the trans-port sector we ignore costs related to the school locationlike maintenance and rent as well as external location costslike those of the loss of local neighborhood community (i.e.shops and services that depend on local schools are forcedto close). We are aware of the difficulties associated withquantifying the modal-shift by costs since these costs arenot always easy to determine – particularly external diseco-nomies. For convenience we do not discuss the differentcost figures stated in the literature (see Infras/IWW,2004; Planco Consulting GmbH, 1993 and Bickel andFriedrich, 1995 for example). Here, we use the cost figures
Fig. 13. Transport costs per mode in 2004.

Fig. 14. Transport costs per mode in 2008.
S. Muller et al. / Journal of Transport Geography 16 (2008) 342–357 355
given in Table 5. As plain costs we consider the averageusage and consumption costs for cars and bicycles coveringfuel usage, insurance as well as purchase and maintenancecosts. The bus or tram fare reflects the costs of one tripusing a standard seasonal ticket. We carefully assume thata student makes 2.2 trips to school per day.4 There areusually 200 days of school per year in Saxony. The tra-vel-times are derived from the distance matrix and theassumed average speeds (see Section 2). For public trans-port travel-times we use a travel-time matrix based on thebus and tram line network. We do not explicitly considercongestion costs because we assume these are included inthe value of travel-time, pollution and noise costs. Further-more, there arise costs due to decreased physical activitywhich is related to the transport modes public transportand car. An increase in the number of students commutingto school by car or bus yields increased levels of obesity,type 2 diabetes, heart disease etc. Unfortunately, we cannotobtain information about the relationship between student
4 One trip to school in the morning and one trip back home at middayper school day. On some days there are additional trips necessary in theafternoon, for example sports.
illness and students choosing motorized transport modes,nor do we have costs figures available based on diseases.Figs. 13 and 14 present the mode specific transport costsallocated to the location of the originator (student) for2004 and 2008. In 2004 the walking costs are due to thevalue of travel-time of a lot of students walking to schoolwith distances up to 1.5 km. Due to longer distances thenumber of students walking is very low in 2008 – and soare the walking costs. There is an increase in cycling costsobservable, particularly within proximity of Großzschach-witz College. This is reasonable since there is a strongincrease in student numbers in this area. Moreover, morestudents go by bike due to longer commuting distances.The increased number of students is a cogent reason forthe increase in public transport costs as well. But most ofall of this is because of the modal-shift due to longercommuting distances caused by the closure of Großz-schachwitz College. There is a remarkable increase in stu-dents commuting by public transport, in particular withinproximity to Großzschachwitz College. Because of thelow level of car availability this transport mode and itscosts are neglectable. In absolute numbers the transportcosts rise from nearly 80,000€ in 2004 to more than200,000€ in 2008 (increase by 150%). This increase is

Fig. 15. Zone 1 of Großzschachwitz college: Absolute (c) and relative (d) change in transport costs from 2004 (a) to 2008 (b).
356 S. Muller et al. / Journal of Transport Geography 16 (2008) 342–357
mainly due to public transport costs and focuses spatiallyon the proximate area (radius of 1 km) of GroßzschachwitzCollege (see Fig. 15).
Assuming realistic location costs of a college of morethan 1 million euros per year, the increase in transportcosts does not justify the decision to keep an underused col-lege running. This will probably hold true even if one con-siders additional external diseconomies (health, loss ofcommunity). From an economic point of view it is there-fore not advisable to maintain a dense school networkwhich is not appropriate for a smaller number of students.But if we consider other interests like ecological and socialbenefits, the example gives some evidence that local neigh-borhood schools are desirable.
6. Conclusion
We have presented a method utilizing GIS to disaggre-gate travel survey data. Particularly for travel-to-schoolanalysis this could be a useful procedure to gain betterand even more realistic modelling results. Mostly, stu-dents choose public transportation and thus detailed spa-tial information is available. In our analysis we haveshown that besides the well-known factors like distance
and authority responsible, the school’s profile is affectingthe school choice as well. The results of the multivariateanalysis illustrate that weather or season, respectively,have a strong influence on transport mode choice for stu-dents’ travel-to-school. Furthermore, we show that dis-tance is the most important factor for discriminationbetween modes of transport linked with costs (publictransport and car/motorcycle) and those with lower costs(walking and cycling). Our findings are consistent withthe literature in the field. Moreover, the findings gener-ate robust empirical evidence due to the extent of thesample.
By using an example we have made the attempt to quan-tify the costs of a modal-shift due to school closure.Although the increase in transport costs is remarkable thisis not a substantial reason – from an economic point of view– against a school closure within an urbanized area. If wemostly consider other factors like the health of the studentsor ecological aspects, the costs of a modal-shift becomeapparent. Note, these findings are only valuable for anurban area. The closure of a school location in rural areaswill have much more dramatic effects on travel-timesand modal-shift as well as other socio-economic con-sequences.

S. Muller et al. / Journal of Transport Geography 16 (2008) 342–357 357
Acknowledgements
We like to thank Dresdner Verkehrsbetriebe AG (DVBAG) for financial support of the survey. The very helpfulcomments of three anonymous referees are gratefulacknowledged. Finally, we thank the Editor of this Jour-nal, Prof. Richard Knowles, for copy editing the paper.
References
Axhausen, K., Haupt, T., Fell, B., Heidl, U., 2001. Searching for the railbonus – results from a panel SP/RP study. European Journal ofTransport and Infrastructure Research 1 (4), 353–369.
Bach, L., 1981. The problem of aggregation and distance for analyses ofaccessibility and access opportunity in location–allocation models.Environment and Planning A 13, 955–978.
Backhaus, K., Erichson, B., Plinke, W., Weiber, R., 2003. MultivariateAnalysemethoden, 10th ed. Springer, Berlin.
Baum, H., Esser, K., Hohnscheid, K., 1998. Volkswirtschaftliche Kostenund Nutzen des Verkehrs. In: Forschungsarbeiten aus dem Strassen-und Verkehrswesen, No. 108.
Ben-Akiva, M., Lerman, S., 1985. Discrete Choice Analysis, Theory andApplications to Travel Demand. MIT Press, Cambridge, MA.
Bhat, C., 1997. A nested logit model with covariance heterogeneity.Transportation Research B 31, 11–21.
Bickel, P., Friedrich, R., 1995. Was kostet uns die Mobilitat? ExterneKosten des Verkehrs. Heidelberg.
Black, C., Collins, A., Snell, M., 2004. Encouraging walking: the case ofjourney-to-school trips in compact urban areas. Urban Studies 38 (7),1121–1141.
City Council of Dresden (=Landeshauptstadt Dresden), 2003. Dresden inZahlen. Technical Report, Dresden.
de Boer, E., 2005. The dynamics of school location and schooltransportation: Illustrated with the Dutch town of Zwijndrecht.Transportation Research News (237), 11–16.
Ewing, R., Forinash, C., Schroeer, W., 2005. Neighborhood schools andsidewalk connections: what are the impacts on travel mode choice andvehicle emission?. Transportation Research News (237) 4–10.
Ewing, R., Schroeer, W., Greene, W., 2004. School location and studenttravel, analysis of factors affecting mode choice. Journal of theTransportation Research Board (TRB) (1895), 55–63.
Federal Environment Agency Germany, 2007. Nachhaltige Entwicklung.<http://www.umweltbundesamt.de/verkehr/verkehrstraeg/fussfahrad/texte/foerdnmiv.htm> (7 September 2007).
Federal Ministry of Transport, Building and Urban Affairs, 2002.Mobilitat in Deutschland. <http://www.mid2002.de/> (15 June 2006).
FGSV (Ed.), 2002. Wirtschaftlichkeitsuntersuchungen an Straßen: Standund Entwicklung der EWS. Forschungsgesellschaft fur Strassen- undVerkehrswesen, Koln.
Fotheringham, A., Densham, P., Curtis, A., 1995. The zone definitionproblem in location allocation modelling. Geographical Analysis 27(1), 60–77.
German Aerospace Center, 2007. Verkehrslage mit floating-car-daten(fcd). <http://www.taxifcd.de/Lage/HAMBURG/Barometer.html> (7September 2007).
Gimona, A., Geddes, A., Elston, D., 2000. Localised areal disaggregationfor linking agricultural census data to remotely sensed land cover data.
In: Innovations in GIS, Computational Issues, vol. 7. Francis andTaylor, Philadelphia.
Goodchild, M., 1979. The aggregation problem in location–allocation.Geographical Analysis 11 (3), 240–255.
Greaves, S., 2004. GIS and the collection of travel survey data. In:Hensher, D. et al. (Eds.), Handbook of Transport Geography andSpatial Systems. Elsevier, Amsterdam, pp. 375–390.
Greene, W., 2003. Econometric Analysis, fifth ed. Pearson Education,New Jersey.
Hastings, J., Kane, T., Staiger, D., 2005. Parental preferences and schoolcompetition, evidence from a public school choice program. TechnicalReport, National Bureau of Economic Research.
Hoxby, C. (Ed.), 2003. The Economics of School Choice. University ofChicago Press.
Infras/IWW, 2004. External costs of transport – update study, on behalfof International Union of Railways (UIC). Infras/IWW, Zurich/Karlsruhe.
Koppelmann, F., Sethi, V., 2000. Closed-form discrete choice models. In:Hensher, D., Button, K. (Eds.), Handbook of Transport Modelling.Elsevier, Amsterdam, pp. 211–226.
Longley, P., Goodchild, M., Maguire, D., Rhind, D., 2001. GeographicInformation Systems and Science. Wiley, Chichester.
Mahr-George, H., 1999. Determinanten der Schulwahl beim Ubergang indie Sekundarstufe 1. In: Forschung Soziologie, vol. 28. Leske+Bud-rich, Opladen.
McDonald, M., 2005. Children’s travel, patterns and influences. Ph.D.Thesis, University of California, Berkeley.
McFadden, D., 1973. Conditional logit analysis of quantitative choicebehaviour. In: Zaremmbka, P. (Ed.), Frontier of Econometrics.Academic Press, New York.
McMillan, T., 2003. Walking and urban form: Modelling and testingparental decisions about children’s travel. Ph.D. Thesis, University ofCalifornia, Irvine.
Oosterhaven, J., 2005. Spatial interpolation and disaggregation ofmultipliers. Geographical Analysis 37 (1), 69–84.
Planco Consulting GmbH (Ed.), 1993. Gesamtwirtschaftliche Bewertungvon Verkehrswegeinvestitionen: Bewertungsverfahren fur den Bundes-verkehrswegeplan 1992. Essen.
Schneider, T., 2004. Der Einfluss des Einkommens der Eltern auf dieSchulwahl. Discussion Papers, vol. 446. DIW, Berlin.
Speiser, I., 1993. Determinanten der Schulwahl, Privatschulen – offentlicheSchulen. In: Europaische Hochschulschriften 513, Padagogik, vol. 11.Lang, Frankfurt a.M.
Spiekermann, K., Wegener, M., 2000. Freedom from the tyranny of zones:towards new GIS-based spatial models. In: Fotheringham, A.,Wegener, M. (Eds.), Spatial Models and GIS – New Potential andNew Models. Taylor & Francis, London, pp. 45–62.
Van der Horst, D., 2002. The benefits of more spatial detail in regionalbioenergy models and the problems of disaggregating agriculturalcensus data. Options Mediterraneennes A 48, 131–138.
Verkehrsverbund Oberelbe, 2007. Fahrpreise auf einen Blick. <http://www.vvoonline.de/de/ticketsundnetz/fahrpreise/fahrpreiseaufeinenb-lick/index.aspx> (7 September 2007).
Woodside, A., Gunay, B., Seymour, J., 2002. Travel to school: a study ofthe effect of socioeconomic differences in secondary schools on thechoice of ‘travel to school’ modes. In: Proceedings of the PTRCConference. Cambridge.