Embed Size (px)
Citation preview

Australasian Transport Research Forum 2010 Proceedings 29 September – 1 October 2010, Canberra, Australia Publication website: http://www.patrec.org/atrf.aspx
1
Travel Time and Origin-Destination Data Collection using Bluetooth MAC Address
Readers
Miranda Blogg1, Conor Semler1, Manu Hingorani2, Rod Troutbeck3
1Kittelson & Associates, Level 4, 80 Petrie Terrace, Brisbane QLD 4000
2Department of Transport and Main Roads, Level 5, 196 Wharf Street, Spring Hill QLD 4001
3Troutbeck & Associates, 59 Montpelier Street, Clayfield QLD 4011
Email for correspondence: [email protected]
Abstract
Vehicle origin-destination (O-D) data has traditionally been a resource-intensive and expensive collection process. This paper reports on the passive observations of Bluetooth protocol devices embedded in vehicles and motorists’ mobile devices to collect the O-D data. Bluetooth media access control address data has been used widely in the last few years to collect speed and travel time data; however, the use of media access control (MAC) address data for O-D surveys is not well documented. Several MAC O-D trials were performed for the Queensland Department of Transport and Main Roads. The Bluetooth MAC data are shown to compare favourably to both Video and Automated Number Plate Recognition (ANPR) O-D data, however more research is needed to refine the expansion methodology. Despite expansion limitations, the MAC data collection is a cost effective way to collect O-D data in small and controlled networks. For more extensive networks the daily fluctuations indicated by MAC O-D data can be used to supplement traditional methods where collection over a longer period of time is cost prohibitive.

ATRF 2010 Proceedings
2
1. Introduction
State and local transport agencies often conduct origin-destination (O-D) surveys to understand travel patterns in a region. Compared with traffic counts, O-D data provide insight into where people are travelling. By understanding the popularity of origin and destination pairs, decision-makers can determine which new facilities to prioritise or where to invest in public transport infrastructure. O-D data are often used as an input into regional traffic models.
Vehicle O-D data has traditionally been a resource-intensive and expensive collection process. This paper reports on the passive observations of Bluetooth protocol devices embedded in vehicles and motorists’ mobile devices to collect the O-D data. The unique media access control (MAC) address of each Bluetooth device is recorded and time-stamped as it passes MAC address readers located along a corridor or throughout a network. Due to limited resource needs, such technology provides the opportunity to collect data over long periods of time for a fraction of the cost of traditional O-D surveys.
Several MAC O-D case studies were performed for the Queensland Department of Transport and Main Roads (TMR). These include a 13-kilometre segment of the Centenary Motorway in southwest Brisbane and an arterial street network in north Brisbane between Stafford and Strathpine (illustrated in Figure 1). Comparisons with Automated Number Plate Recognition (ANPR) and Video O-D data were also performed. The use of MAC address data for O-D survey has not been well documented, and hence, these findings provide substantial benefit both to TMR and the industry.
This paper documents the findings of the TMR studies as well as insights into the data sampling and expansion of the MAC O-D to traffic volumes.
Figure 1: MAC Case Study Locations, Centenary Motorway, Brisbane (left); and North Brisbane Arterial Network (right)

Travel Time and Origin-Destination Data Collection using Bluetooth MAC Address Readers
3
2. Related Work
2.1 Origin-Destination
There are a variety of techniques for measuring origin-destination data, such as license plate matching (Schaefer 1998), toll-tag matching, and manual car following studies that have traditionally been used to collect data for planning purposes. The following sections summarise several traditional data collection methods.
2.1.1 License Plate Matching
Recording vehicle license plates passing points at critical locations along a corridor or network is a common method of collecting origin-destination data. The recorder stands roadside and writes down all or a portion of license plates as they pass. At high volume locations a determination on vehicles to sample is necessary, such as only counting vehicles of a single colour, to allow manageable data collection. The use of video to record license plates is another tactic that allows recorders to slow down video playback and capture more license plates, but again requires large data resources to watch video and record license plates and compare matches manually to determine origins and destinations. This data collection approach is very resource intense and collecting more than a few days of data is not typical due to strain on resources.
2.1.2 Manual Car Following
This simplistic data collection technique involves following vehicles through a network or along a corridor and manually counting the number of turning trips and through trips. This is the least scientific approach and most difficult to capture origin-destinations through multiple intersections or interchanges. This technique is generally used for very high-level planning.
2.2 Travel Time
Techniques for measuring travel times include floating car studies with clip board and stop watch, license plate matching, toll-tag matching, and more recently Global Positioning System (GPS) equipped vehicles (Quiroga 1998 and Quiroga 1999) and matching of MAC addresses (Hoeschen 2005). All of these techniques have particular characteristics that make them more or less suitable to various studies.
2.2.1 GPS Equipped Probe Vehicles
GPS equipment capable of logging position and velocity of a probe vehicle is readily available and can be deployed very quickly. The capabilities and challenges of this technique are summarised in Table 1. This has been the dominant travel time data collection technique used world wide for the past 10 years (Quiroga 1998, Quiroga 1999, Hoeschen 2005, and Garcia 2006). Although the technique produces extremely high resolution probe vehicle trajectory information, the cost of collecting this data is extremely high when one considers the cost of probe vehicle drivers, vehicle maintenance/depreciation, data management, and data reduction.

ATRF 2010 Proceedings
4
Table 1: Enumeration of capabilities and challenges of GPS Travel Time Data Collection
Capabilities Challenges Hi Resolution vehicle trajectory data (1Hz) Tunnels, tree canopies
No installation required in vehicles Data management, particular with large data sets where one wishes to keep track of drivers (that have different driving characteristics)
Precise scheduling of start of run Unless a large number of vehicles are used, cycle time between runs can be very large and not capture peak conditions.
Virtually no training required for field staff driving floating vehicles
Even with low cost labour, vehicle operating costs are very expensive and almost always preclude obtaining data that can be used to show statistically significant differences between conditions.
Deploying large number of vehicles to collect a large data set may have a significant negative impact on the facility being monitored
2.3 Roadside Observation and Matching of Bluetooth MAC Addresses
Matching toll tags has been used for a number of years in regions with electronic tolling facilities and large penetrations of those devices. More recently, the concept of using MAC addresses of discoverable Bluetooth devices (Wasson 2008) has been proposed and used for data collection along arterials and freeways. The capabilities and challenges of this technique are summarised in Table 2.
Table 2: Enumeration of capabilities and challenges of Bluetooth Origin-Destination Data Collection
Capabilities Challenges Match rates of 3-10% between stations for through vehicles.
Requires good antenna placement.
No installation required in vehicles Equipment must be deployed adjacent to the road.
Virtually no training required for field staff deploying roadside equipment.
Training field personnel on good data management field procedures.
Bluetooth MAC address matching is analogous to a license plate or toll tag matching, but without a database that maps a unique ID of a vehicle back to an owner. Due to the reduced need for manual labour, costs of Bluetooth data collection are significantly cheaper than other data collection methods.
3. MAC Technology Overview
A MAC address is a 48-bit, 12 alpha-numeric character, unique identifier (e.g. 00:17:4b:de:12:56) assigned to technology with the ability to send and/or receive a signal by the device’s manufacturer. The reading of MAC addresses remotely is enabled by wireless, short-range communication of data through the protocol known as Bluetooth. Bluetooth radio stations on the roadside wirelessly detect Bluetooth enabled devices in discoverable mode as the vehicle passes.
Travel Time and Origin-Destination Data Collection using Bluetooth MAC Address Readers
5
Supplemented AC power to run the computers is necessary to conduct field studies in excess of the computer’s on-board battery life, typically two to four hours. Power can be provided within a traffic controller cabinet or other Intelligent Transport System (ITS) cabinet, or through additional battery power. Examples of cabinet and battery-powered deployments are shown in Figure 2.
Figure 2: Typical MAC reader deployments in cabinet (left) and with battery (right)
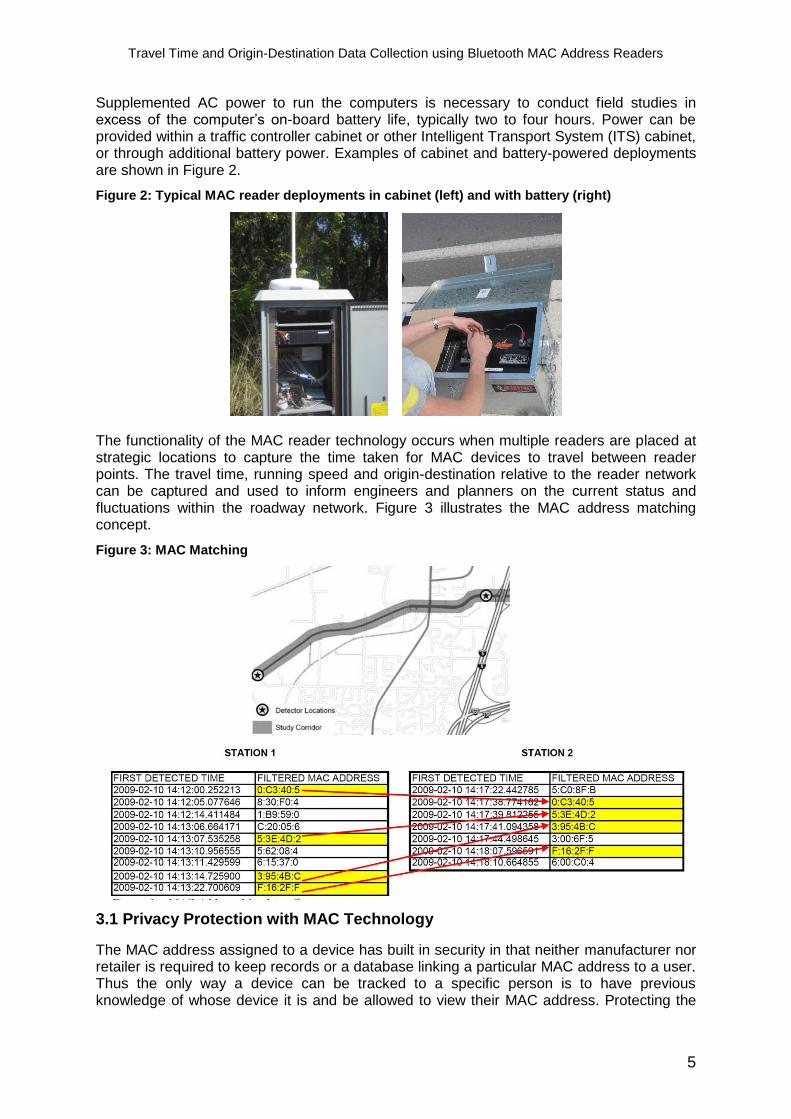
The functionality of the MAC reader technology occurs when multiple readers are placed at strategic locations to capture the time taken for MAC devices to travel between reader points. The travel time, running speed and origin-destination relative to the reader network can be captured and used to inform engineers and planners on the current status and fluctuations within the roadway network. Figure 3 illustrates the MAC address matching concept.
Figure 3: MAC Matching
3.1 Privacy Protection with MAC Technology
The MAC address assigned to a device has built in security in that neither manufacturer nor retailer is required to keep records or a database linking a particular MAC address to a user. Thus the only way a device can be tracked to a specific person is to have previous knowledge of whose device it is and be allowed to view their MAC address. Protecting the

ATRF 2010 Proceedings
6
privacy of MAC addresses in the study is a high priority and is achieved through the filtering of MAC addresses, such that a reduced number of characters are captured. These filtered addresses allow very high certainty levels of matches, while making the tracing of devices to specific individuals nearly impossible.
4. Research Approach
To better understand the applicability of MAC address data collection results, the research team developed a series of tests and case studies to refine the analysis. Several critical factors were identified, including:
Penetration Rate – It is critical to understand the penetration rate of MAC devices to estimate the maximum vehicle capture percentage under ideal conditions.
Capture Rate – Many factors affect whether a MAC device passing a station will be detected, some systematic and others random. Comparing traffic counts to MAC hits provides a MAC-to-Volume ratio used to estimate capture rate.
MAC Noise – stationary MAC devices and those from non-vehicular sources affect the capture statistics.
A combination of field tests and case studies were performed to better understand these factors and develop MAC data collection methods. The results were then compared with established data collection techniques to understand the strengths and weaknesses of collecting data with MAC address readers.
5. Establishing an Upper Sample Rate in Brisbane
Several isolated and small scale tests were performed by Kittelson and Associates in an effort understand the upper limit of the local MAC capture. Mt-Cootha Road (a tourist route) was selected based on the absence of noise (nearby stationary sources of MAC data), low volumes to isolate the MAC address by vehicle, and low speeds. No vehicle- or occupant-specific details were recorded during these tests and only aggregate details are presented here.
A summary of the number of MAC addresses per vehicle is shown in Table 3. Thirty-one percent of passenger vehicles have a single MAC address, five-percent have two MAC addresses, and there were no vehicles that had in excess of two MAC addresses. Commercial vehicles (marked vans, utilities, and trucks) are reported separately, and comprise approximately nine-percent of the total vehicle count. There appears to be a much higher observation of one or more MAC addresses per commercial vehicle, however, the sample is small and it is difficult to comment with any certainty.
The data yields a vehicle-sampling rate of 38 percent (one or more MAC addresses), compared with a MAC-to-Volume ratio of 45 percent (35* 1 MAC + 7* 2 MAC). Vehicles with multiple MAC addresses comprise 33 percent of the total MAC sample. That is, 33 percent of the vehicles with a Bluetooth devise were sampled twice.
Table 3: MACs per Vehicle (100 vehicle sample)
# of MACs Passenger Vehicles Commercial Vehicles Total Vehicles
0 64 64% 4 40% 68 62%
1 31 31% 4 40% 35 32%
2 5 5% 2 20% 7 6%
3 0 0% 0 0% 0 0%

Travel Time and Origin-Destination Data Collection using Bluetooth MAC Address Readers
7
Table 4 summarises the number of passengers per vehicle. The average vehicle occupancy (VO) of the observed sample is 2.1 persons per vehicle. The vehicle occupancy is much higher than the average typically observed on a commuter route.
Table 4: Vehicle Occupancy for Passenger and Commercial Vehicles
Vehicle Occupancy All Vehicles
1 25 23%
2 60 55%
3 14 13%
4 10 9%
5 1 1%
Average 2.1 100%
The observed MAC-to-Volume ratio of 46 percent is unlikely to be exceeded on a commuter route with lower vehicle occupancy. Furthermore, the ability to capture multiple MAC addresses in a given vehicle would only complicate O-D sampling if there was a notable variation in the vehicle occupancy by route.
6. Station Optimisation
There are several factors that can create variation in the sampling rates. Most notably these include computer clock drift, detection interference, ping cycle detection, and noise such as nearby roadway facilities, public transport, bicycles, and pedestrians.
Clock Drift: If computer clocks are isolated from a network/central time source, they cannot keep perfect time. In most cases, laptops will experience a few seconds of linear time drift over the course of a week. Where station spacing is short, a few seconds of travel time difference can impact calculated speeds. Clock drift was found to be approximated reasonably in a linear fashion. Wide shifts in temperature may increase the rate of clock drift. This is an area for further research.
Detection Interference: Bluetooth radio devices can be detected at distances up to 100 metres away with a class 1 radio. The capture can be reduced significantly by physical barriers, for example, a metal car door, and to a lesser degree, plastic-caps for weather protection of the antennas that are connected to the radios. The antennas should ideally be placed at the vehicle’s window height. Various sources have documented Bluetooth equipment detection, such as Malinovskiy, et al, 2010.
Ping Cycle: Bluetooth MAC readers have a very short ping cycle; typically 0.1 seconds. Depending on the strength and speed of the passing Bluetooth device, it may be detected many times as it passes by a single station or none at all depending on several factors including the location of roadside reader and the amount of time the device is within the range of the reader.
Nearby Roadway Facilities, Public Transport, Bicycles, and Pedestrians: The equipment can be modified to limit the collection radius and directionality to limit the collection of nearby roadways, public transport facilities, or bike paths. Pedestrian influences can be controlled by isolating low travel speeds during data processing or providing adequate separation of the stations to avoid the inclusion of pedestrian data. Public transport and bicycle users on the subject road are more difficult to isolate, and as such, no method has been developed at this time.

ATRF 2010 Proceedings
8
The number of MAC addresses collected at a given station tends to increase linearly with an increase in the volume – resulting in a constant MAC-to-Volume ratio. The hourly MAC-to-Volume ratios at a trial station are shown in Figure 4. An alternative means of illustrating this relationship is shown in Figure 5 - the percentage of the total volume and the total MACs across a single day. The MAC-to-Volume ratio is fairly consistent between 6:00 a.m. and 6:00 p.m. Variation occurs early in the morning and late in the evening, when the volume is very low.
Figure 4: Weekday MAC-to-Volume Ratio at a Trial Station
0%
5%
10%
15%
20%
25%
30%
35%
40%
45%
00:00 06:00 12:00 18:00 00:00
Mon
Tue
Wed
Thu
Fri
avg
stde
vstde
v
Figure 5: Percent of Total Volume and Total MACs Across a Single Day
0%
2%
4%
6%
8%
10%
0 2 4 6 8 10 12 14 16 18 20 22 24
Time (hr)
% o
f D
aily V
olu
me
Tubes
MACs
Exception to this relationship occurs when the travel speed declines – often during peak hours when there is congestion at a given site. Figure 6 illustrates the hourly MACs versus the hourly volume at a trial station across a week. During the a.m. and p.m. peak periods the MAC capture increases significantly, breaking the linear trend with volume. Hence, a decrease in speed tends to increase the capture of MACs.

Travel Time and Origin-Destination Data Collection using Bluetooth MAC Address Readers
9
Figure 6: Weekday Hourly MACs versus Traffic Volume
0
200
400
600
800
1000
1200
0 500 1000 1500 2000 2500 3000 3500
Volume (veh/hour)
MA
C (
MA
C/h
ou
)
Station 24
Linear (Station 24)
The “daily” MAC-to-Volume ratio is largely indicative of the site’s capture strength and has been used to prepare a stepwise regression. Twenty-nine stations, each representing one daily MAC-to-Volume ratio observation, with a range of station characteristics were assessed. Site characteristics included speed, location of the station to the nearest signal, and nearby moving conflicts (bicycle paths, heavy pedestrian activity, and nearby roadways). A simple queue rating from 1-3 (limited to heavy) was deduced based on the stations location to a nearby signal, while the occurrence of conflicting MACs was estimated based on proximity to adjacent roadways, parking lots, or other major pedestrian generators.
A regression analysis was conducted with the base case of 70 km/h speed limit, no conflicting MAC devices, and heavy queue presence. The results of the regression using dummy variables for conflicting devices and queue presence are summarised in Table 5. The ability of the selected characteristics to measure the variation between sites is weak (2.6<T-Stat>-2.6) and several of the coefficients are not intuitive (e.g. the capture at 80 km/h should be less than 70 km/h); however there is a notable trend against the queue rating. The queue rating as a function of the MAC-to-Volume ratio example is illustrated in Figure 7, and demonstrates a linear trend (with significant variation of around the average).

ATRF 2010 Proceedings
10
Table 5: Regression for MAC-to-Volume Ratio
Coefficients Error t Stat P-value
Intercept 0.288 0.042031 6.852452 8.97E-07
100km/hr -0.015 0.059563 -0.26153 0.796235
80km.hr 0.018 0.038352 0.470361 0.642946
70km/hr BASE
60km/hr -0.030 0.037097 -0.81795 0.422573
50km/hr 0.0459 0.047112 0.974867 0.340723
Non-Auto+ MACS
-0.011 0.021179 -0.54703 0.590123
Auto MACS BASE
1 -0.138 0.027084 -5.09693 4.77E-05
2 -0.059 0.023501 -2.52163 0.019828
3 (Base) BASE
Figure 7: Queue Rating as a Function of MAC-to-Volume Ratio
Avg 0.288
Avg 0.229
Avg 0.150
0.00
0.05
0.10
0.15
0.20
0.25
0.30
0.35
0.40
1 2 3
Queue Rating
MA
C t
o V
olu
me R
atio
The significance of this parameter suggests that MAC devices in slow or stationary vehicles have a higher likelihood of being detected by a nearby MAC address reader. The longer a device is within the range of a MAC reader, the greater the chance it will be detected and the higher the MAC-to-Volume ratio.
Other parameters were observed to affect the capture strength, but are varying and difficult to quantify. For instance, vandalism at one station resulted in the unit being overturned, which caused the antenna to twist and change direction. This corresponded with a halving of the MAC-to-Volume ratio for that time period.

Travel Time and Origin-Destination Data Collection using Bluetooth MAC Address Readers
11
The use of two MAC readers at each station (offsetting the associated pinging cycles) was found to increase the MAC-to-Volume ratio by up to 7 percent.
7. Brisbane MAC Data O-D Case Studies
Two case studies were prepared for TMR, each providing insights into the viability of using MAC data collection for O-D data:
Northbound Centenary Motorway: Deployment of six MAC reader units in roadside detector cabinets over seven days. Automatic number plate recognition (ANPR) cameras and loop detector traffic volume counts were also collected.
North Brisbane Arterial Network: Deployment of 29 MAC reader units using battery power over seven days. Control traffic counts and a manual video origin-destination survey were also collected at each station.
The results of these studies are described below.
7.1 Centenary Motorway
ANPR and MAC survey technology were used to collect two O-D pairs: 1) the Ipswich Motorway west (Station 1) to the Toowong Roundabout (Station 3) and 2) the Centenary Highway South (Station 2) to the Toowong Roundabout (Station 3). MAC stations 1 and 2 sampled 24 and 22 percent of the passing daily volume, respectively. Station 3 had significant queuing throughout the day and sampled 40 percent of the daily volume. The raw O-D data was not expanded to estimate the volume, and as such expansion methodologies were not tested as part of this trial.
Between Station 1 and 3 there were 2,246 daily MAC O-D pairs compared with 5,773 ANPR O-D pairs. Similarly, between Station 2 and 3 there were 1,301 daily MAC O-D pairs compared with 2,738 ANPR O-D pairs. Figure 8 illustrates the percent of the daily ANPR and MACs in each 15 minute period between Station 1 and 3. The sample methods follow a similar trend. There is significant noise between the 15-minute O-D observations in both methods. To reduce this variation, the use of one-hour O-D data is recommended.
Table 6 illustrates the hourly MAC and ANPR percentages for the two O-D pairs. A paired T-test indicates that these sampling method results are different. The comparison may have been improved by normalising the MAC O-D pairs using the associated station 1 or 2 capture rate – bringing the values to a common sampling rate. Because the daily sampling rates at the origins are fairly similar, a significant change in these results is not anticipated.

ATRF 2010 Proceedings
12
Figure 8: Station 1-3 Percentage of Daily ANPR and MAC O-D Data by Time Period (Wednesday, 18 September 2009)
Wednesday OD (Ipswich Off-Ramp to Toowong Roundabout)
0.0%
0.5%
1.0%
1.5%
2.0%
2.5%
3.0%
3.5%
0.00 5.00 10.00 15.00 20.00 25.00
Time (Hours)
% o
f D
aily
O-D
Observ
ations
Mac OD
Video OD
Table 6: Percent O-D Matrix and GEH
Time
MAC ANPR
1-3 2-3 Total 1-3 2-3 Total
5.00 61% 39% 100% 66% 34% 100%
6.00 51% 49% 100% 56% 44% 100%
7.00 54% 46% 100% 58% 42% 100%
8.00 53% 47% 100% 56% 43% 100%
9.00 66% 34% 100% 70% 30% 100%
10.00 70% 30% 100% 70% 30% 100%
11.00 65% 35% 100% 70% 30% 100%
12.00 70% 30% 100% 76% 24% 100%
13.00 71% 29% 100% 73% 26% 100%
14.00 68% 32% 100% 70% 30% 100%
15.00 68% 32% 100% 69% 31% 100%
16.00 66% 34% 100% 69% 31% 100%
17.00 67% 33% 100% 73% 27% 100%
7.2 North Brisbane Arterial Network
The typical hourly MAC-to-Volume ratio across the 29 stations was 20 percent, with some stations as low as 5 percent and as high as 40 percent. Most of the video survey stations captured upwards of 90 percent, however, several stations captured as low as 30 percent.
Video license plate O-D pairs are expanded to volume using the inverse of the product of each station’s capture rate. This method relies on two important assumptions 1) the method

Travel Time and Origin-Destination Data Collection using Bluetooth MAC Address Readers
13
samples the entire population; and 2) the missed vehicles are random. These assumptions are not applicable to MAC survey. MAC address readers sample the population of Bluetooth-enabled devices, not vehicles. A significant portion of vehicles do not have such equipment and will never be captured. From the population of Bluetooth devices, missed devices are not necessarily random – the device or station strength could result in a high frequency of the same missed device. The assumption that devices are randomly missed would yield excessive volume expansion factors. Barcelo, etal, 2010, also notes that such simple expansion techniques are not effective for Bluetooth data.
Based on these considerations, the MAC O-D data was expanded to volume using a simple two-step methodology as follows:
1. Each O-D pair constitutes two stations with two capture rates. These rates were normalised for each pair according to the station with the lower capture rate, and adjusted to represent a network average capture rate of 15%.
2. Each cell was expanded by a factor of 6.66 (150
1
.) to increase the normalised value
to an estimate of volume.
Comparing O-D matrices for 29 stations (i.e., 29 x 29 or 841 O-D pairs) across 24 hours is difficult both analytically and conceptually. The data was compared in aggregate and for specific O-D pairs using the Geoffrey E Harris Method (GEH), a common statistical test for acceptable traffic demand model forecasts (UK Highways Agency 2010). A GEH of 5 or less indicates a reasonable fit between two data sets. In excess of 85% of the samples have a GEH less than 5; however, there are a number of key O-Ds with a GEH much greater than five.
Figure 9 illustrates the largest O-D pair in the trial from the M3 to south Gympie Road (approximately 10 kilometres). The MAC O-D has a similar trend to the video O-D, but tends to overestimate the a.m. peak.
Figure 9: Daily Volume Profile – M3 to south Gympie Road (Thursday, 12 November 2009) STATION 1 TO STATION 28
0
100
200
300
400
500
600
700
800
0 1 2 3 4 5 6 7 8 9 10 11 12 13 14 15 16 17 18 19 20 21 22 23 24
Hours
Vo
lum
e E
xp
an
de
d
MAC
VIDEO
Several sources of error have not been addressed in the expansion procedure:
1. A downstream station with a strong capture will often pick up false origins or destination because the MAC device was missed at a nearby, weaker station. This finding is not unique to MAC O-D data.

ATRF 2010 Proceedings
14
2. Directional capture rates would likely improve the expansion. The station characteristics can result in favourable estimates in only one direction of travel; however, the directional MAC capture cannot be readily or directly measured.
Several additional expansion methods were tested. None yielded an improvement in the O-D comparison. More research is needed to determine whether identifying origin-destination patterns in such a system is possible using MAC address readers
In addition to the MAC O-D matrices, the MAC data was used to develop hourly factors for Thursday’s data to increase or decrease the video O-D to estimate other days of the week. Figure 10 illustrates the daily fluctuation between South Gympie Road and the Chermside Shopping Zone.
Figure 10: Daily O-D Variation, South Gympie Road to Shopping Zone, 6:00-7:00 PM From ST28 to ST22
0
0.2
0.4
0.6
0.8
1
1.2
Monday
9-Nov-2009
Tuesday
10-Nov-2009
Wednesday
11-Nov-2009
Thursday
12-Nov-2009
Friday
13-Nov-2009
Saturday
14-Nov-2009
Sunday
15-Nov-2009
Facto
r o
f Th
ursday V
olu
me
18:00 - 19:00
The peak in evening traffic on a Thursday for this O-D pair represents the demand for late-night shopping, which occurs on Thursdays in Brisbane suburbs.
8. Summary
The MAC O-D trials funded by the Queensland Transport and Main Roads provide significant insights into the strengths and weaknesses of the MAC technology. The MAC O-D estimates compare favourably with ANPR and Video O-D, however, correction and expansion methodologies could be improved. Areas for improvement include directional capture rates, and correction for variation in the capture between stations resulting in false origins or destinations. Promising techniques are available that may overcome this limitation with additional development. Opportunities also exist to enhance the station set-up and improve the capture rates.
Despite the current limitations, the MAC data collection is a cost effective way to collect O-D in small and controlled networks. For more extensive networks the daily fluctuations indicated by MAC O-D data can be used to supplement traditional methods where collection over a longer period of time is cost prohibitive.
9. References
Barceló, J., Montero, L., Marqués, L., and Carmona, C., Travel Time Forecasting and Dynamic OD Estimation In Freeways Based On Bluetooth Traffic Monitoring, 89th Transportation Research Board 2010 Annual Meeting, Washington, D.C., January 2010.
Garcia, C., R. Huebschman, D. Abraham, and D.M. Bullock, “Using GPS to Measure the Impact of Construction Activities on rural Interstates,” Journal of Construction Engineering and Management, Vol. 132, No. 5, pp. 508-515, May 2006.

Travel Time and Origin-Destination Data Collection using Bluetooth MAC Address Readers
15
Hoeschen, B., D.M. Bullock, and M. Schlappi, “A Systematic Procedure for Estimating Intersection Control Delay From Large GPS Travel Time Data Sets," Transportation Research Record, #1917, TRB, National Research Council, Washington, DC, pp. 18-27, 2005.
Malinovskiy Y., et. al., Field Experiments on Bluetooth-based Travel Time Data Collection, Presentation in the 89th Annual Transportation Research Board Meeting in Washington D.C., January 2010.
Quiroga, C. and D.M. Bullock, “Travel Time Studies with Global Positioning and Geographic Information Systems: An Integrated Methodology,” Transportation Research Part C, Pergamon Pres, Vol. 6C, No. 1/2, pp. 101-127, 1998.
Quiroga, C. and D.M. Bullock, “Measuring Control Delay at Signalized Intersections,” Journal of Transportation Engineering, ASCE, Vol. 125, No. 4, pp. 271-280, July/August, 1999.
Schaefer, M.C., “License Plate Matching Surveys: Practical Issues and Statistical Considerations,” Institute of Transportation Engineers Journal, Volume 58, Number 7, July 1988.
UK Highways Agency, Design Manual for Roads and Bridges, Department for Transport, 2010.
Wasson, J.S., J.R. Sturdevant, D.M. Bullock, “Real-Time Travel Time Estimates Using MAC Address Matching,” Institute of Transportation Engineers Journal, ITE, Vol. 78, No. 6, pp. 20-23, June 2008.