Embed Size (px)
Citation preview
DYNAMIC ORIGIN-DESTINATION TRIP DEMAND ESTIMATION FOR SUBAREA ANALYSIS
Xuesong Zhou
Sevgi Erdoğan [email protected]
and
Hani S. Mahmassani* [email protected]
*Corresponding author
Maryland Transportation Initiative Department of Civil & Environmental Engineering
University of Maryland 3130 Jeong H. Kim Engineering Building
College Park, MD 20742 Phone: 301-405-0221 FAX: 301-314-6868
July 27, 2005
Revised Oct 26, 2005 Total words: 5749 + Figures: 5 + Tables: 2 = 7499 Submitted for Presentation at the 85th Annual Meeting of the Transportation Research Board
and Publication in Transportation Research Record
TRB 2006 Annual Meeting CD-ROM Paper revised from original submittal.
Zhou, Erdoğan and Mahmassani
2
2
DYNAMIC ORIGIN-DESTINATION TRIP DEMAND ESTIMATION FOR SUBAREA ANALYSIS
Xuesong Zhou, Sevgi Erdoğan and Hani S. Mahmassani*
ABSTRACT
A subarea analysis capability is needed in conjunction with dynamic network analysis models to allow consideration and rapid evaluation of a large number of scenarios and to support transportation network planning and operations decisions for situations that may not require analysis on a complete network representation. Focusing on how to provide an up-to-date time-dependent OD demand matrix for the subarea network, this paper describes a two-stage subarea demand estimation procedure. The first stage uses path-based traffic assignment results from the original network to generate an induced OD demand matrix for the subarea network. The second stage incorporates an iterative bi-level subarea OD updating procedure to find a consistent network flow pattern by utilizing the induced OD demand information and archived traffic measurements in the subarea network. An excess-demand traffic assignment formulation is adopted to model the external trips that traverse or bypass the subarea network. This formulation allows vehicular flow to respond to traffic conditions resulting from network and operational changes in the subarea, and it can be nicely interpreted in an entropy maximization framework. The proposed procedure is illustrated in a case study using the Los Angeles subarea network extracted from the Southern California Association of Governments regional transportation planning network. Keywords: Dynamic traffic assignment, subarea analysis, origin-destination demand estimation
TRB 2006 Annual Meeting CD-ROM Paper revised from original submittal.
Zhou, Erdoğan and Mahmassani
3
3
INTRODUCTION
Dynamic traffic assignment (DTA) methods address many of the limitations of static planning tools, and provide planning agencies with modern approaches to tackle emerging challenges. Simulation-based DTA systems (1-3) systematically combine (1) dynamic network assignment models, used primarily in conjunction with demand forecasting procedures for planning applications, and (2) traffic simulation models, used primarily for traffic operational studies to capture the evolution of traffic flows in a traffic network, which result from the decisions of individual travelers making path choice decisions. By considering the time-varying nature of traffic flows, DTA can produce practically useful estimates of state variables such as speeds, queue lengths, delays, and congestion effects to better assess the functional and environmental impacts of a variety of traditional and emerging transportation planning measures. However, DTA models require high-level representation of the transportation system components, leading to a more challenging planning process. The preparation of networks with the required level of detail is one of the most cumbersome steps for DTA planning applications. Because original traffic networks utilized by metropolitan planning organizations are generally developed for conventional static planning applications, they lack several essential features such as time-dependent OD demand input, highway interchange modeling, and signal control information for an operational planning tool. Therefore, development of a transportation network for any DTA modeling tool calls for careful integration, and in some cases reconciliation of different data sources.
Subarea analysis is an essential capability for integrating DTA-based operational planning tools into regional planning applications for several reasons. First, analyses of operational decisions and Intelligent Transportation System (ITS) deployment alternatives generally require a high level of detail in only a portion of the regional or metropolitan area network rather than in the entire network. In many cases, greater level of detail in network and operational strategy representation is necessary only for directly affected areas, not for outer reaches of the network. In other cases, large-scale regional networks entail minimal secondary and tertiary impacts outside a given subarea due to weak structural interactions, in which case a subarea analysis would be satisfactory. Another case where subarea analysis is of great use is that when the analysis is of special concern of a local organization, jurisdiction or an authority and the analysis boundaries are determined by their specific needs. The computational advantages of using a subarea network instead of a large regional network are also evident for cases where consideration and rapid evaluation of large number of policy scenarios are needed.
Several modeling challenges must be addressed in the subarea analysis problem in the DTA modeling framework. These challenges are due to complex interaction between demand and supply sides of the original network and the subarea network. For example, it is desirable for the network model at the subarea level to retain the capability to capture changes in overall demand in the original network (more specifically, for demand with at least one trip end outside the subarea) in response to changes in supply in the subarea. Of particular importance is the need to estimate up-to-date time-dependent OD trip desires for the subarea analysis. Essentially, the subarea OD demand information could be obtained by two different approaches: (1) calculating subarea OD demand using the traffic assignment result in the original network; and (2) estimating OD demand based on real-world traffic measurements in the subarea. The first approach is also referred as the induced OD matrix construction problem in Larson et al. (4) and the term is adopted in this study to define the reduced or aggregated OD matrix which is obtained by considering only subarea related demand in the overall network.
TRB 2006 Annual Meeting CD-ROM Paper revised from original submittal.
Zhou, Erdoğan and Mahmassani
4
4
Several aggregation techniques have been proposed to construct the induced OD demand matrix. For example, the Drive Project (5) described a two-step procedure. The first step performs an equilibrium assignment in the complete network to obtain path flow information, which is used in the second step to calculate an induced OD matrix for the subarea. Given the static equilibrium link flow solution in a subarea network, Larson et al. (4) proposed an entropy maximization model to construct the most likely route flow pattern (among route flow patterns that are consistent with the given link flow solution pattern in the extracted network).
Growing interest in the application of simulation-based DTA models has been accompanied by several studies on the estimation of dynamic OD trip desires. Substantial research has been devoted to the dynamic demand estimation problem using time-varying link counts. Early models (6,7) were proposed to estimate time-dependent OD flows on individual components, such as a single intersection or a freeway facility; these models aim to estimate unknown dynamic OD split fractions based on the entry and exit flow measurements, under the simplifying assumption of constant link travel time. Extending the concepts and solution methodologies of the static OD estimation problem, Cascetta et al. (8) proposed a generalized least-squares (GLS) estimator for dynamic OD demand based on a simplified assignment model for a general network. A bi-level generalized least-squares optimization model and an iterative solution framework have been proposed by Tavana and Mahmassani (9) to estimate dynamic OD demand and to maintain internal consistency between the upper-level demand estimation problem and the lower-level DTA problem. Tavana (10) also provided an extensive literature review of the dynamic OD demand estimation problem and its inherent connection to the dynamic traffic assignment problem. Zhou et al. (11) and Mahmassani and Zhou (12) presented several dynamic demand estimation and updating methods for planning and operational applications using multi-day traffic measurements.
Providing time-dependent OD demand for subarea analysis represents a new class of demand estimation problems that are of growing importance in deploying DTA for planning applications. It differs considerably from the conventional OD demand estimation problem with a target demand table, because the traffic assignment solution obtained for the complete network does not directly provide a compatible reference for the time-dependent OD matrix in the subarea. As the historical OD demand data, which are typically the basis of induced OD demand construction, cannot provide up-to-date demand inputs, it is necessary to utilize other archived traffic measurements to capture network system dynamics. A sound demand updating procedure for subarea analysis, moreover, needs to maintain elaborate linkages between the subarea and surrounding area and to maintain essential structural information on OD, path and link flow patterns in the reduced subarea network.
This paper describes a two-stage subarea demand estimation procedure to provide time-dependent OD trip information for subarea analysis. Following the problem definition and process overview in the next section, a detailed description of the induced demand calculation procedure is given in the third section. An excess-demand traffic assignment formulation is then applied to accommodate possible changes in external trips, which is consistent with an entropy maximization derivation Finally, a case study based on a large-scale regional planning network is presented to illustrate the proposed procedure. PROBLEM STATEMENT AND PROCESS OVERVIEW Consider a large-scale regional traffic network with a set of nodes connected by a set of directed links. The zonal structure of the entire network is defined by multiple origin zones u∈U and destination zones v∈V, and the static OD trip desires in the complete network are expressed as the number of vehicle trips du,v traveling from origin zone u to destination zone v
TRB 2006 Annual Meeting CD-ROM Paper revised from original submittal.

Zhou, Erdoğan and Mahmassani
5
5
during the analysis period of interest. As a subset of the regional traffic network, the subarea network is defined by a set of nodes N and a set of links L, with L' ⊆ L denoting the subset of links with observations in the subarea. The subarea boundary is assumed to be prespecified by traffic planners, the subarea zonal structure is specified as a set of origin zones I and a set of destination zones J, and the analysis period of interest is discretized into departure time intervals τ=1, 2, …, Td. Accordingly, the time-dependent OD trip desires in the subarea are expressed as the number of vehicle trips di,j,τ, traveling from origin zone i to destination zone j in departure time interval τ , ∀ i ∈I, j ∈J and τ=1, 2, …Td. Given a historical OD demand matrix in the complete network, the predefined subarea boundary, time-dependent traffic measurements for a subset of links in the subarea, that is, measured link flow cl,t on link l∈ L' during observation interval t=1, 2, …., Tc, the objective of the subarea demand estimation problem is to find a consistent subarea time-dependent OD demand matrix.
The proposed procedure includes two stages where the output from one stage is input to the next. In the first stage, path flow patterns in the complete network are generated to calculate the induced OD demand in the subarea network. To consider all trip desires that might use the transportation facilities in the subarea, the induced OD demand table should not only include the demand originating and/or terminating in the subarea network, but also include vehicular flows passing through the subarea network. The induced OD demand information is then combined with available real-world traffic observations in the second stage to update the subarea OD demand matrix. Figure 1 depicts a detailed flow chart of the procedure.
Static OD demandmatrix in complete
network
Archived time-dependent traffic
measurements
Path-based trafficassignment
Induced ODdemand calculation
Path flow pattern incomplete network
Induced OD demand matrixand network flow pattern in
subarea network
Virtual link structure andflow split function
Subarea ODdemand updating
Dynamic subarea ODdemand matrix
Dynamic trafficassignment withexcess demand
Flow proportionmatrices
FIGURE 1 Flow chart for subarea demand estimation procedure.
TRB 2006 Annual Meeting CD-ROM Paper revised from original submittal.
Zhou, Erdoğan and Mahmassani
6
6
STAGE I: INDUCED DEMAND CALCULATION In order to obtain the best estimate of time-dependent travel time on virtual links, this study first converts the given historical static OD matrix to a time-dependent OD table with a time-of-day profile, and then a path-based dynamic traffic assignment program, namely DYNASMART-P (2,3), is used to load the OD demand onto the complete network to generate the path flow pattern in the entire network. The network path flow pattern can be expressed in terms of the number of vehicles fu,v,h,τ from origin u to destination v using path h at timeτ . Conceptually, the traffic assignment process can be written as
)(DTAPF = (1) where F = simulated/induced path flow vector, with elements [ τ,,, hvuf ], D = OD demand vector with elements [ τ,,vud ], TAP = traffic assignment process function The traffic assignment process maintains the flow conservation equations between OD flows and path flows on the complete network, that is,
ττ ,,,,, vuh
hvu df =∑ , ∀u,v,τ (2)
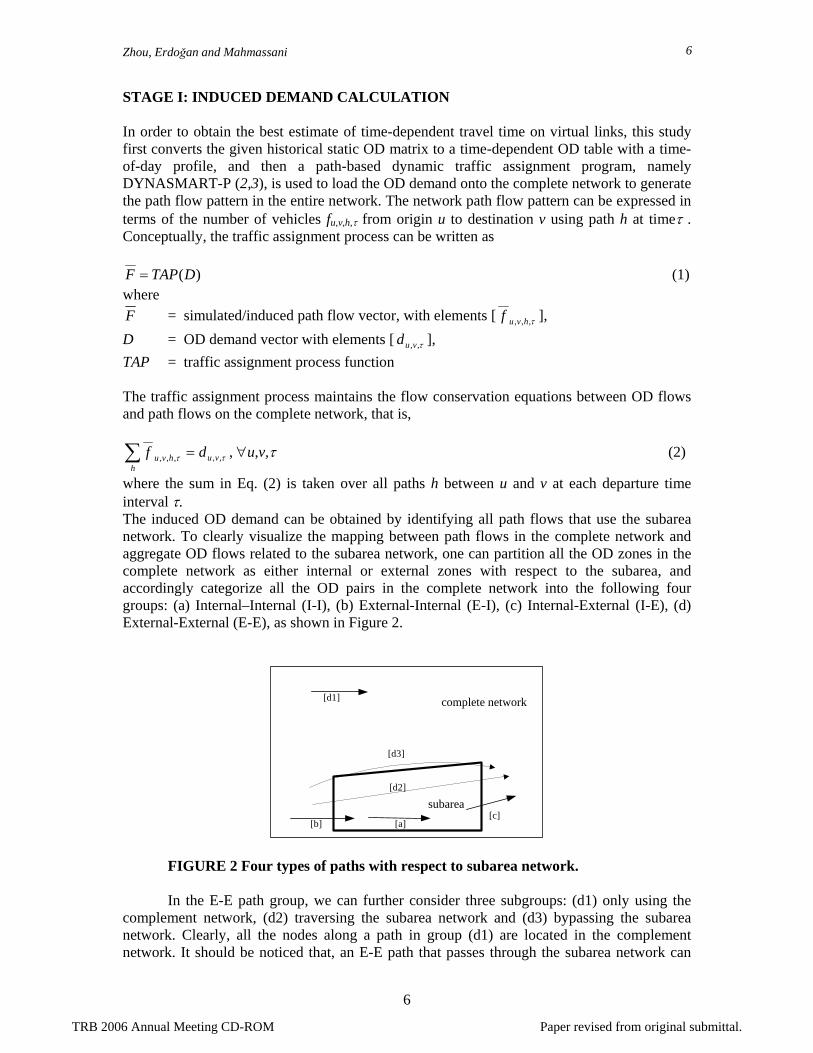
where the sum in Eq. (2) is taken over all paths h between u and v at each departure time interval τ. The induced OD demand can be obtained by identifying all path flows that use the subarea network. To clearly visualize the mapping between path flows in the complete network and aggregate OD flows related to the subarea network, one can partition all the OD zones in the complete network as either internal or external zones with respect to the subarea, and accordingly categorize all the OD pairs in the complete network into the following four groups: (a) Internal–Internal (I-I), (b) External-Internal (E-I), (c) Internal-External (I-E), (d) External-External (E-E), as shown in Figure 2.
complete network[d1]
[c][a]
[d2]
[d3]
subarea[b]
FIGURE 2 Four types of paths with respect to subarea network.
In the E-E path group, we can further consider three subgroups: (d1) only using the
complement network, (d2) traversing the subarea network and (d3) bypassing the subarea network. Clearly, all the nodes along a path in group (d1) are located in the complement network. It should be noticed that, an E-E path that passes through the subarea network can
TRB 2006 Annual Meeting CD-ROM Paper revised from original submittal.
Zhou, Erdoğan and Mahmassani
7
7
enter and exit the subarea network multiple times. In this study, we can define a subpath as the portion of the original path that starts from the first entering zone to the last exit zone in the subarea. If more than half of the path trajectory along a subpath is located inside the subarea network, we classify the path in group (d2). Similarly, a subpath in group (d3) has more than half of its trajectory located in the compliment network. Another simple rule is that a subpath with more than 50% of its travel time spent in the subarea network is considered as a traversing path, otherwise it is specified as a bypassing path. As both types of flows in subgroups (d2) and (d3) can respond to possible transportation policy changes in the subarea, the trip rates in the induced OD demand matrix should include path flows in both (d2) and (d3). The flow equation for induced OD can be written as
∑=',,,
,,',,,',,,,,
τ
ττττ σ
hvu
jihvuhvuji fd (3)
where ττσ ,,
',,,ji
hvu is the time-dependent path flow indicator, ττσ ,,
',,,ji
hvu =1 if zones i and j are the first entering zone and last exit zone for path flow (u,v,h,τ') traveling into the subarea at time τ,
ττσ ,,
',,,ji
hvu =0 otherwise. The following describes the algorithmic implementation of equation (3).
Initialize τ,, jid = 0 for i∈I and j∈J, τ ∈T For the hth path from zone u to zone v at time τ' on the original network,
Scan the path node sequence, Identify the first entering zone and the last exit zone in the subarea network as origin zone i and destination zone j. If zones i and j can be found and the hth path trajectory enters the subarea at time τ, then ',,,,,,, τττ hvujiji fdd += .
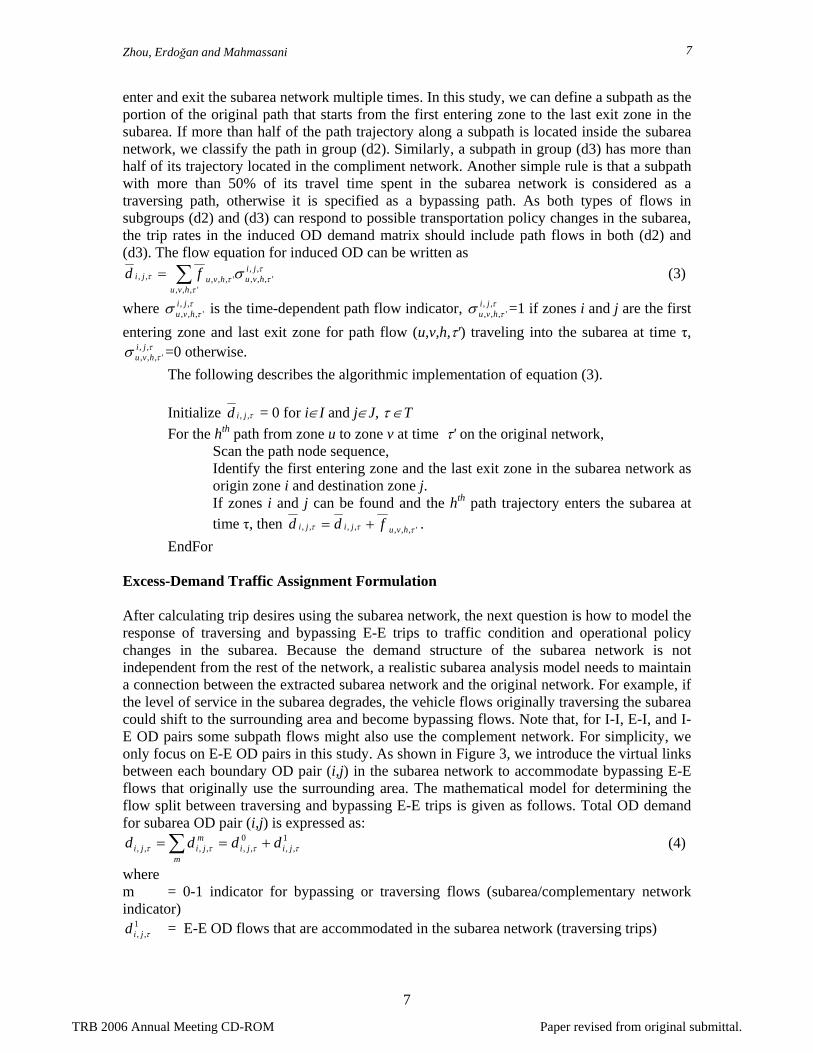
EndFor Excess-Demand Traffic Assignment Formulation After calculating trip desires using the subarea network, the next question is how to model the response of traversing and bypassing E-E trips to traffic condition and operational policy changes in the subarea. Because the demand structure of the subarea network is not independent from the rest of the network, a realistic subarea analysis model needs to maintain a connection between the extracted subarea network and the original network. For example, if the level of service in the subarea degrades, the vehicle flows originally traversing the subarea could shift to the surrounding area and become bypassing flows. Note that, for I-I, E-I, and I-E OD pairs some subpath flows might also use the complement network. For simplicity, we only focus on E-E OD pairs in this study. As shown in Figure 3, we introduce the virtual links between each boundary OD pair (i,j) in the subarea network to accommodate bypassing E-E flows that originally use the surrounding area. The mathematical model for determining the flow split between traversing and bypassing E-E trips is given as follows. Total OD demand for subarea OD pair (i,j) is expressed as:
1,,
0,,,,,, ττττ jiji
m
mjiji dddd +== ∑ (4)
where m = 0-1 indicator for bypassing or traversing flows (subarea/complementary network indicator)
1,, τjid = E-E OD flows that are accommodated in the subarea network (traversing trips)
TRB 2006 Annual Meeting CD-ROM Paper revised from original submittal.
Zhou, Erdoğan and Mahmassani
8
8
0,, τjid = E-E OD flows that are carried by the virtual link from zone i to zone j (bypassing
trips).
complete network
virtual link
i
j
1,, τjid
0,, τjid
subarea network
τ,, jid
FIGURE 3 Virtual link for OD pair (i,j). In the following, an excess-demand formulation is adopted to capture the existing split
of E-E OD flows between the subarea network and the complement network. For each boundary OD pair, we consider a simple flow split function:
1,,,
0,,,
,,,
,,,,ττ
τ
θθ
θ
ττjijijiji
mjiji
TT
T
jim
jiee
edd+
= (5)
where 1
,, τjiT and ojiT τ,, are average travel times for paths (i,j,τ) traversing and bypassing the
subarea network respectively, and θi,j is a dispersion parameter to be estimated. The above formula can be interpreted as estimating the most likely route flow pattern
based on the maximum entropy principle. Because the complement network is not physically modeled, we need to re-construct the E-E path flow pattern in the subarea network. There exist many possible combinations (or states) of traversing and bypassing flows in the subarea network. The entropy maximization principle provides a criterion for choosing the distribution that maximizes path flow entropy subject to two constraints, namely the total flow constraint and the total travel time constraint. The number of combinations for m
jid τ,, is
!!!
!!
)( 1,,
0,,
,,
,,
,,,,
ττ
τ
τ
ττ
jiji
ji
m
mji
jimji dd
dd
ddZ ==
∏ . (6)
Let TTi,j,τ denote the total travel time incurred by all traversing and bypassing trips related to OD pair (i,j,τ) for departure time interval τ. That is, TTi,j,τ is the sum of travel time for all the subpath flows along OD pair (i,j,τ) at time τ obtained from the traffic assignment result on the complete network. The total travel time constraint (7) aims to ensure that the new set of traversing and bypassing flows in the subarea network should produce the same total travel time as TTi,j,τ , and 1
,, τjiT and ojiT τ,, are unchanged .
( ) τττ ,,,,,, jim
mji
mji TTTd =×∑ . (7)
The set of path flow patterns, that is most likely to occur, can be obtained by solving an optimization model that maximizes )( ,,
mjidZ τ subject to constraints (4) and (7). Rather than
TRB 2006 Annual Meeting CD-ROM Paper revised from original submittal.
Zhou, Erdoğan and Mahmassani
9
9
maximizing )( ,,m
jidZ τ directly, we can take its logarithm and approximate it by Stirling’s formula, leading to an equivalent entropy maximization model for each individual OD pair:
( )∑ −≈m
mji
mji
mji
mji ddddZ ττττ ,,,,,,,, ln)(lnmax (8)
subject to constrains (4) and (7). The corresponding Lagrangian function is (subscripts (i,j,τ) are omitted for simplicity)
( ) )()(ln m
m
m
m
m
m
mmm TTdTTdddddL ×−+−+−= ∑∑∑ θλ ,
where λ and θ are Lagrangian multipliers for constraints (4) and (7), respectively. Its first order optimization condition is
0ln =×−−=∂∂ mm
m TTddL θλ with solution mm TTd ×+= θλln .
Substituting mTTm ed ×+= θλ back into constraint (4), we obtain de
m
TT m
=∑ ×+θλ , leading to
∑ ×=
m
TT m
edeθ
λ and 21 TTTT
TTm
eeedd
m
××
×
+×=
θθ
θ
.
Essentially, the optimization problem produces an analytical optimal solution in the same Logit-type form as (5). Similar derivations that map equilibrium link flows to the most likely route flow pattern can be found in Larson et al. (4) and Rossi et al. (13). Detailed mathematical treatment of the entropy optimization theory can be found in (14). After calculating the bypassing and traversing flow proportions and the corresponding travel times based on the traffic assignment result on the complete network, we can further calibrate the coefficient θi,j for each OD pair.
The traffic assignment model with elastic demand can be solved by the standard fixed demand traffic assignment program through network representation. In our implementation, virtual links are not physically modeled in the subarea network for the dynamic traffic assignment program, and the elastic demand is assigned to the subarea network according to the following three steps. (1) Calculate 1
,, τjiT based on the traffic flow pattern in the subarea network, and determine 0
,, τjiT from the traffic assignment result in the complete network,
(2) Estimate the flow split for each OD pair and determine OD demand ][ 1,,
1τjidD = ,
(3) Perform dynamic traffic assignment using OD demand D1 in the subarea network. Note that 1
,, τjiT are time-varying as the result of dynamic traffic assignment. If a static
traffic assignment model is used to generate the path flow pattern, then 1,, τjiT would be time-
invariant. In this case, the flow split function (5) might lead to large modeling errors as the travel time measurements of the subarea network and related virtual link are inconsistent.. STAGE II: DYNAMIC OD DEMAND UPDATING PROCEDURE USING ARCHIVED TRAFFIC MEASUREMENTS
TRB 2006 Annual Meeting CD-ROM Paper revised from original submittal.
Zhou, Erdoğan and Mahmassani
10
10
Given induced OD demand information from the first stage and time-dependent link measurements, the dynamic OD demand estimation procedure aims to find a consistent time-dependent OD demand table that minimizes (1) the deviation between estimated link flows and observed link counts (2) the deviation between the network flow pattern to be updated and the induced network flow pattern in the subarea. The induced network flow pattern can be expressed in terms of OD flows, path flows and link flows in the subarea. In the context of dynamic traffic assignment, especially in congested networks, the mapping matrix between OD demand and link flows are not constant and are, themselves, a function of the unknown OD demand values. A bi-level dynamic OD estimation formulation (11) is adapted here. Specifically, the upper-level problem aims to estimate the dynamic OD trip desires based on given link counts and flow proportions, subject to non-negativity constraints for demand variables. The flow proportions are in turn generated from the dynamic traffic network loading problem at the lower level, which is solved by a DTA simulation program, with a dynamic OD trip table calculated from the upper level. The weights w1, w2, and w3 associated with the combined deviations could be interpreted as the decision maker’s relative preference or importance belief for the different objectives or different information sources. They could also be considered as the dispersion scales for the error terms in the ordinary least-squares estimation procedure. Several interactive multi-objective programming methods can be applied in this context to determine appropriate weights that lead to best compromise solutions for inconsistent information sources, for example, sensed traffic counts vs. simulated traffic counts on the same link. Essentially, a representative subset of non-dominated solutions is first generated by varying the weights, and then the decision maker (i.e. planner) can determine the weight based on the following three criteria: minimum combined deviation, best trade-off as well as minimum distance from the ideal point. Since the temporal patterns in the induced OD demand and simulated time-dependent link counts are generated from an external time-of-day profile, rather than being observed directly, in order to avoid possible estimation biases, the following estimator only considers total induced demand and total simulated link counts over the planning horizon. In other words, the actual measured time-dependent link counts cl,t will play a major role in inferring the temporal characteristics of the subarea OD demand matrix. Detailed assessment along this line can be found in (11). Upper level: Constrained ordinary least-squares problem
2
,,,,,,,3
2
,,,,2
2,,,,,,,
,,,1 ][][][ l
jijijil
ljijijitljijitl
jitl
fdpwddwcdpw −×+−+−× ∑∑∑ ∑∑∑τ
τττ
ττττ
(9)
s.t. nonnegativity constraints ττ ,,0,, jid ji ∀≥ where di,j,τ = estimated traffic demand from zone i to zone j at departure interval τ cl,t = measured traffic flows on link l at observation interval t
jid , = induced traffic demand from zone i to zone j
lf = simulated traffic counts on link l, obtained from the traffic assignment result in the complete network
pl,t,i,j,τ = time-dependent link-flow proportions, i.e. fraction of vehicular flows from origin i to destination j, starting their trips during departure interval τ, contributing to the flow on link l during observation interval t
pl,i,j,τ = link-flow proportions, i.e. fraction of vehicular flows from origin i to destination j, starting their trips during departure interval τ, contributing to the flow on link l
TRB 2006 Annual Meeting CD-ROM Paper revised from original submittal.
Zhou, Erdoğan and Mahmassani
11
11
w1,w2, w3 = weighting factors for different objective functions. Lower level: Elastic demand dynamic traffic assignment problem P=EDTA(D) (10) where P = link-flow proportion matrix D = time-dependent OD demand matrix contains elements [di,j,τ] for the subarea network. EDTA = function of elastic demand traffic assignment process.
The following details the iterative bi-level dynamic OD demand updating procedure. The final output is a time-dependent OD demand matrix ready for the subarea analysis. Let k be the iteration number. Step 1: (Initialization) k = 0. Using [ jid , ], the induced OD demand matrix, as an initial
demand matrix D0 , generate link-flow proportions P0 from the DTA simulator. Step 2: (Optimization) Substituting link-flow proportions Pk, solve the upper level OD
estimation problem to obtain demand Dk. Step 3: (Simulation) Using demand Dk, run the DTA simulator to generate new link-flow
proportions Pk+1. Step 4: (Evaluation) Calculate the combined deviation according to objective function (9). Step 5: (Convergence test) If the convergence criterion is satisfied (estimated demand is stable
or no significant improvement in the overall objective), stop; otherwise k = k +1 and go to Step 2.
To obtain a unique solution to the above ordinary least-squares formulation, one needs
to ensure that the number of unknown variables (time-dependent OD demand flows) is not greater than the sum of the number of independent link observations cl,t , the number of OD pairs in the demand matrix jid , and the number of induced link flow counts lf . In fact, in the above OD demand updating problem, the system identification condition is relatively easer to satisfy than in the standard OD demand estimation problem, since a large number of simulated link counts obtained from assignment in the complete network are available in the subarea network. If the system is still underdetermined when including all the links in the subarea, the simulated path counts can be introduced to increase the number of constraints. Accordingly, path-flow proportion matrices should be generated from the lower-level DTA program to map subarea OD flows to path flows. On the other hand, to reduce the computational effort associated with the nonlinear optimization program, one can select a set of critical links and critical paths to construct the “target” network flow pattern, as opposed to including all links and paths in the subarea. CASE STUDY: ILLUSTRATION OF THE PROCEDURE ON LOS ANGELES SUBAREA NETWORK
The test network used for this study is the regional transportation planning network of the Southern California Association of Governments (SCAG). The network includes four California Department of Transportation (CALTRANS) districts covering Los Angeles and Ventura counties, San Bernardino and Riverside Counties, Imperial County (not included in
TRB 2006 Annual Meeting CD-ROM Paper revised from original submittal.
Zhou, Erdoğan and Mahmassani
12
12
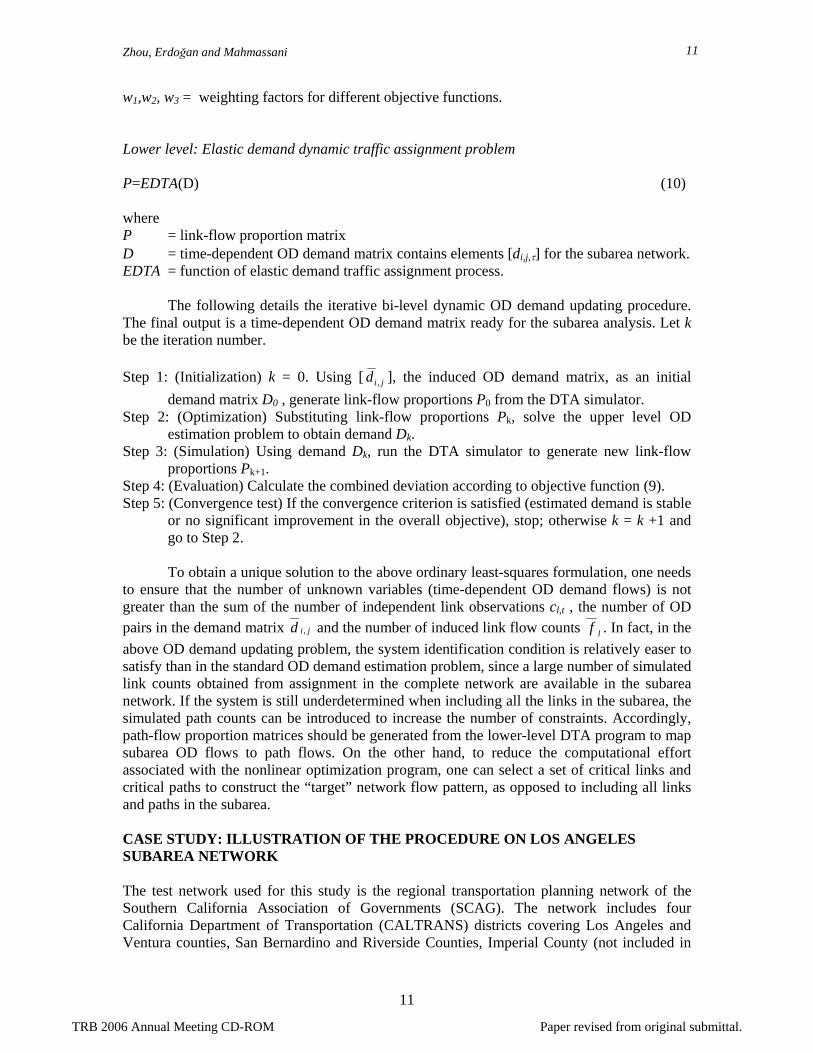
the Year 2000 planning process) and Orange County. The network and the historical OD demand data are obtained from the year 2000 regional transportation plan (15). In year 2000, the region population was 16.12 million served by a 14,504 route-mile (or equivalent 51,827 lane-mile) highway network. The total vehicle traffic in the region was 17.2 million in peak periods and approximately 34 million in all time periods. Los Angeles County, where the study area is located, has the highest share in the regional vehicular traffic with 9.6 million vehicle trips in the peak periods and 19 million trips in all time periods. In Figure 4-(a), the rectangle shown in the complete network plot marks an approximate boundary of the subarea. The subarea network on which the OD estimation procedure is applied is shown in Figure 4-(b). The network characteristics for both complete and subarea networks are given in Table 1.
FIGURE 4 (a) SCAG regional planning network and (b) Los Angeles subarea network representation in DYNASMART-P.
TABLE 1 SCAG Original and Subarea Network Size Comparison Complete network Subarea network % Number of links (excluding connectors)
68,535 8,530 12.45
Number of nodes (excluding zone centroids)
27,187 3,197 11.76
Number of TAZ’s 3,191 60 1.88 The input data was obtained from the SCAG regional planning model. In this static
transportation planning model, the OD demand matrix for the complete network covers the AM peak period (6:00 am to 9:00 am), corresponding to a 3191 by 3191 matrix. The matrix was converted to a time-dependent OD table with a time-of-day profile, and the signal control data were generated using an approximation approach because the detailed signal timing data was not available at the time of this study.
After compiling the necessary input data for the complete network, we run DYNASMART-P with an initial OD demand to obtain the simulated path flows. As shown in the procedure in Figure 1, the first stage outputs an induced OD matrix for the subarea. At the second stage, the induced dynamic OD demand is updated by utilizing both archived traffic
(a) (b)
Link 1016
Link 713
TRB 2006 Annual Meeting CD-ROM Paper revised from original submittal.
Zhou, Erdoğan and Mahmassani
13
13
measurements and the induced OD matrix. The archived traffic measurements are obtained from the California Freeway Performance Measurement System (PeMS) (16). In the PeMS database, traffic measurements such as occupancy, volume, and speed are available either as raw data (30 second intervals) or as aggregated data (5 minute intervals). 244 detectors from the PeMS database related to the subarea are selected and mapped to the subnetwork links in DYNASMART-P. In this study, 5-min aggregated measurements were collected from these 244 links on August 2, 2004 (Monday) and input to the bi-level dynamic OD estimation procedure.
In order to evaluate the performance of the procedure, the Root Mean Squared Error (RMSE) between observed link volumes cl,t and simulated link volumes c'l,t are used as the measure of effectiveness.
.
)( 2,,
tl
ccRMSE l t
tltl∑∑ −′
= (11)
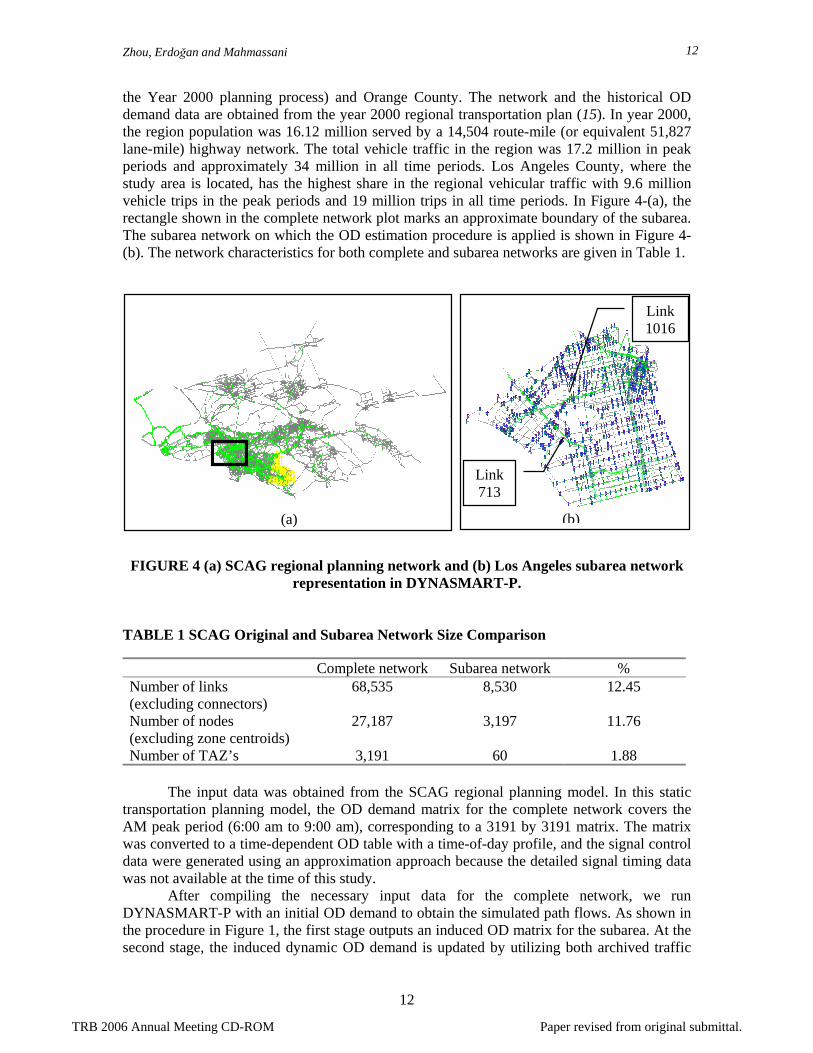
TABLE 2 RMSE Values of Estimation Results with and without Traffic Measurements
Induced OD demand only
Induced OD demand + archived traffic measurements
% Improvement
Density (veh/lane/mile) 15.7 13.1 16.5 Volume (veh/hour/lane) 340.5 257.9 24.2 Speed (mile/hour) 18.6 14.7 20.0
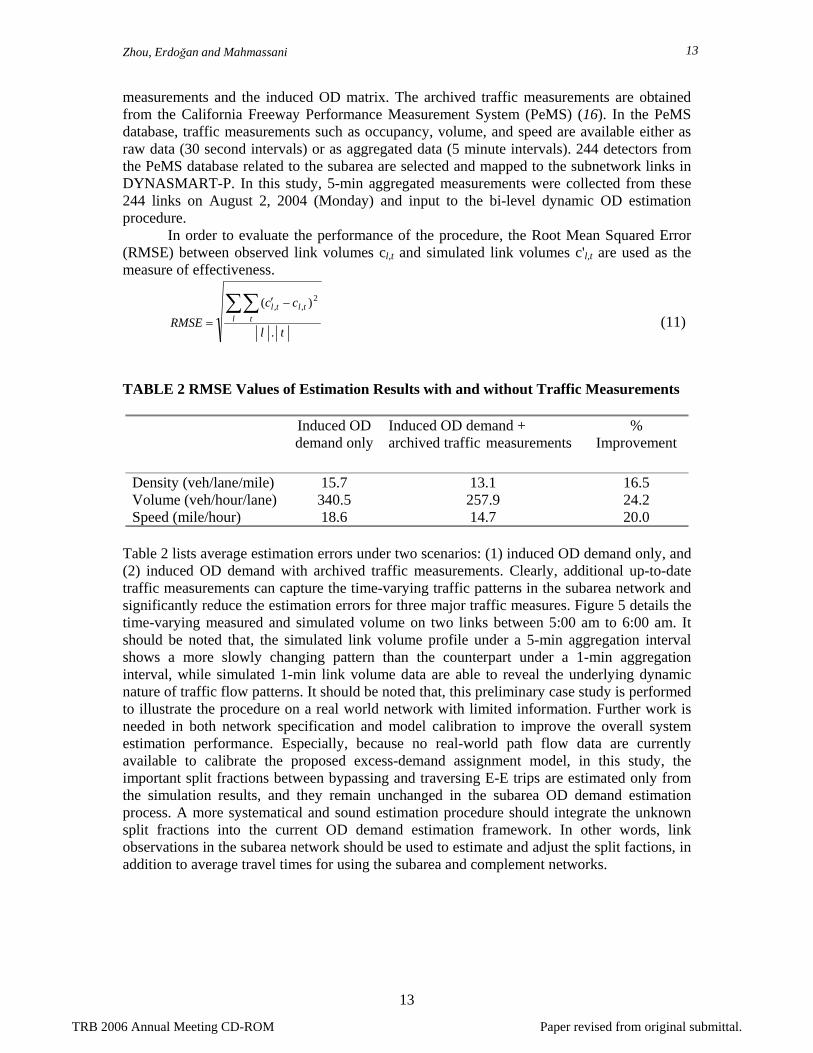
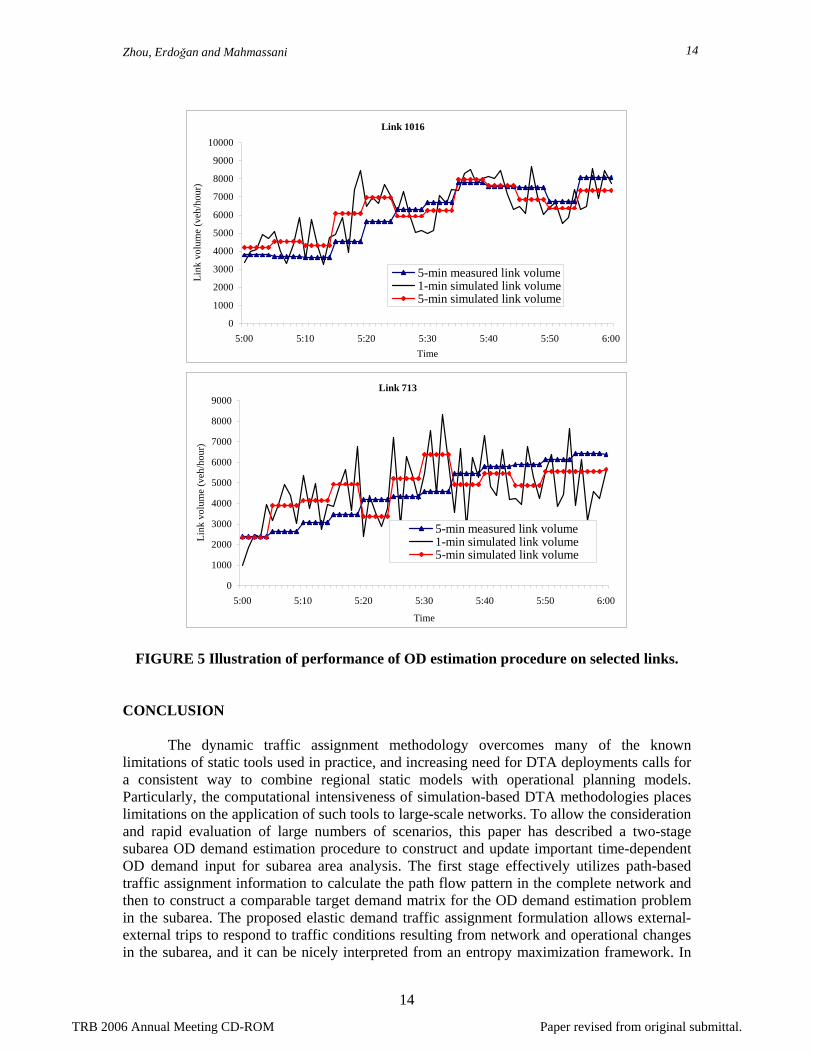
Table 2 lists average estimation errors under two scenarios: (1) induced OD demand only, and (2) induced OD demand with archived traffic measurements. Clearly, additional up-to-date traffic measurements can capture the time-varying traffic patterns in the subarea network and significantly reduce the estimation errors for three major traffic measures. Figure 5 details the time-varying measured and simulated volume on two links between 5:00 am to 6:00 am. It should be noted that, the simulated link volume profile under a 5-min aggregation interval shows a more slowly changing pattern than the counterpart under a 1-min aggregation interval, while simulated 1-min link volume data are able to reveal the underlying dynamic nature of traffic flow patterns. It should be noted that, this preliminary case study is performed to illustrate the procedure on a real world network with limited information. Further work is needed in both network specification and model calibration to improve the overall system estimation performance. Especially, because no real-world path flow data are currently available to calibrate the proposed excess-demand assignment model, in this study, the important split fractions between bypassing and traversing E-E trips are estimated only from the simulation results, and they remain unchanged in the subarea OD demand estimation process. A more systematical and sound estimation procedure should integrate the unknown split fractions into the current OD demand estimation framework. In other words, link observations in the subarea network should be used to estimate and adjust the split factions, in addition to average travel times for using the subarea and complement networks.
TRB 2006 Annual Meeting CD-ROM Paper revised from original submittal.
Zhou, Erdoğan and Mahmassani
14
14
Link 1016
0
1000
2000
3000
4000
5000
6000
7000
8000
9000
10000
5:00 5:10 5:20 5:30 5:40 5:50 6:00Time
Link
vol
ume
(veh
/hou
r)
5-min measured link volume1-min simulated link volume5-min simulated link volume
Link 713
0
1000
2000
3000
4000
5000
6000
7000
8000
9000
5:00 5:10 5:20 5:30 5:40 5:50 6:00
Time
Link
vol
ume
(veh
/hou
r)
5-min measured link volume1-min simulated link volume5-min simulated link volume
FIGURE 5 Illustration of performance of OD estimation procedure on selected links. CONCLUSION
The dynamic traffic assignment methodology overcomes many of the known limitations of static tools used in practice, and increasing need for DTA deployments calls for a consistent way to combine regional static models with operational planning models. Particularly, the computational intensiveness of simulation-based DTA methodologies places limitations on the application of such tools to large-scale networks. To allow the consideration and rapid evaluation of large numbers of scenarios, this paper has described a two-stage subarea OD demand estimation procedure to construct and update important time-dependent OD demand input for subarea area analysis. The first stage effectively utilizes path-based traffic assignment information to calculate the path flow pattern in the complete network and then to construct a comparable target demand matrix for the OD demand estimation problem in the subarea. The proposed elastic demand traffic assignment formulation allows external-external trips to respond to traffic conditions resulting from network and operational changes in the subarea, and it can be nicely interpreted from an entropy maximization framework. In
TRB 2006 Annual Meeting CD-ROM Paper revised from original submittal.
Zhou, Erdoğan and Mahmassani
15
15
the second stage, archived time-dependent traffic measurements are utilized to update the induced demand matrix, and this OD updating method enables the OD trip matrix used in the subarea analysis to capture current demand and network flow patterns. The case study illustrates a practical and sound procedure for DTA-based subarea analysis applications, and demonstrates effectiveness of combining ITS traffic measurements with conventional planning data in DTA deployment. Essentially, the use of traffic measurements increases the performance of OD estimation procedure, and path-based simulation-assignment systems can provide an evolving platform for integrating operational considerations in planning models for effective decision support. Since the subarea network and corresponding zonal structure provide the fundamental input to the subarea OD demand estimation problem studied in this paper, successful deployment of DTA models in subarea analysis also places a great need for rigorous formulations and practical solution procedures for the network extraction and zonal aggregation problems. Additionally, it is desirable to systemically evaluate the value of information and reliability associated with the induced OD demand matrix and real-world traffic measurements so that the decision maker can better allocate scarce data collection resources to improve the final quality of OD estimation. Aknowledgments: This paper is based on work partially supported at the Maryland Transportation Initiative (MTI) by the Federal Highway Administration (FHWA), US Department of Transportation. The authors are grateful for the assistance and encouragement of Dr. Henry Lieu of FHWA, and for the cooperation and assistance provided by Mr. Srinivas Bhat and Dr. Deng Bang Lee of the Southern California Association of Governments (SCAG). Several graduate research assistants on the MTI DTA team have contributed to building the network and performing the analysis described in this paper. The work presented in this paper remains the sole responsibility of the authors.
TRB 2006 Annual Meeting CD-ROM Paper revised from original submittal.

Zhou, Erdoğan and Mahmassani
16
16
REFERENCES
1. Mahmassani, H. S. Dynamic Network Traffic Assignment and Simulation Methodology for Advanced System Management Applications. Networks and Spatial Economics, Vol. 1, 2001, pp. 267-292.
2. Ben-Akiva, M., M. Bierlaire, D. Burton, H. Koutsopoulos, and R. Mishalani. Network State Estimation and Prediction for Real-Time Transportation Management Applications. Networks and Spatial Economics, Vol. 1, 2001, pp 293-318.
3. Mahmassani, H. S., H. Sbayti, and X. Zhou. DYNASMART-P 1.0 User’s Guide, 2004, College Park, Maryland.
4. Larson, T., J. T. Lundgren, and C. Rydergren. Most Likely Traffic Equlibrium Route Flows Analysis and Computation. In Equilibrium Problems: Nonsmootth Optimization and Variational Inequality Models (Gianessi, F., A. Maugeri, and P. M. Pardalos, eds,) Kluwer A.P, 2001, pp. 129-159.
5. Drive Project v1054, 1st Deliverable, Report on Model Requirements, 1989.
6. Cremer, M., and H. Keller. Dynamic Identification of Flows from Traffic Counts at Complex Intersections. In Proceedings the 8th International Symposium on Transportation and Traffic Theory (Hurdle, V. F. et al., Eds.), 1981, Toronto University, pp. 121-142.
7. Cremer, M. and H. Keller. A New Class of Dynamic Methods for Identification of Origin-Destination Flows. Transportation Research. 21B, 1987, pp. 117-132.
8. Cascetta, E., D. Inaudi, and G. Marquis. Dynamic Estimators of Origin-Destination Matrices Using Traffic Counts. Transportation Science, Vol. 27, No. 4, 1993, pp. 363-373.
9. Tavana, H. and H.S. Mahmassani. Estimation of Dynamic Origin-Destination Flows from Sensor Data Using Bi-Level Optimization Method. Transportation Research Board CD-ROM Paper Preprints (TRB Paper No. 01-3241), 2001, National Research Council, Washington, D.C.
10. Tavana, H. Internally-Consistent Estimation of Dynamic Network Origin-Destination Flows from Intelligent Transportation Systems Data Using Bi-Level Optimization. Ph.D. Dissertation, 2001, University of Texas at Austin.
11. Zhou, X., X. Qin, and H.S. Mahmassani. Dynamic Origin-Destination Demand Estimation Using Multi-Day Link Traffic Counts for Planning Applications. Transportation Research Record, No. 1831, 2003, pp. 30-38.
12. Mahmassani, H. S., and X. Zhou. Transportation System Intelligence: Performance Measurement and Real-Time Traffic Estimation and Prediction in a Day-to-Day Learning Framework. In Festchrift in honor of Professor Pravin Varaiya (Abed, Eyad eds.), 2005, Springer-Birkhauser.
13. Rossi, T.F., S. McNeil, and C. Hendrickson. An Entropy Model for Consistent Impact Fee Assessment. ASCE Journal of Urban Planning and Development, Vol. 115, No. 2, 1989, pp. 51-63.
14. Fang, S.-C., J.R. Rajasekera, and H.-S. Tsao, Entropy Optimization and Mathematical Programming, Kluwer Academic Publishers, MA, 1997.
15. Southern California Association of Governments. Year 2000 Model Validation and Summary Report, Regional Transportation Model, CA, 2000.
TRB 2006 Annual Meeting CD-ROM Paper revised from original submittal.
Zhou, Erdoğan and Mahmassani
17
17
16. California Department of Transportation Freeway Performance Measurement System(PeMS). http://pems.eecs.berkeley.edu/Public/. Accessed July 25, 2005.
TRB 2006 Annual Meeting CD-ROM Paper revised from original submittal.