Embed Size (px)
Citation preview

TRANSPORTATION ECONOMICS OF
COAL RESOURCES OF NORTHERN
SLOPE COAL FIELDS, ALASKA
M. I. R. L. Report No. 31
. A -- - . -- -
Mineral Industry Research Laboratory
University of Alaska
Fairbanks, Alaska 99701
Paul R . Clark
May 1973

ABSTRACT
This paper describes the Northern coal fields, the environment in which they are
situated, and various routes and systems for transporting metal I urgica l qua1 ity coal from
these deposits to a potential market in Japan. Each transportation mode i s discussed with
respect to northern Alaska conditions. Capitol and operating costs were developed for
each system.
If the coal must support the entire transportation system cost, the transportation of
coal from the North Slope of Alaska to Japan appears to be economically feasible only
from easily mined areas which are close to an ocean shipping port. In the case of trans-
portation cost sharing by other users, or by government subsidization, the prospects of
northern coal exploitation would be enhanced.
The final feasibility of developing any of this coal deposit cannot be determined un-
t i l the mining costs and the factors which influence these costs are known.

ACKNOWLEDGEMENTS
The author wishes to express his appreciation to Dr. Chris Lambert, Jr., Head,
Department of Mineral Engineering for his advice and guidance he offered as chairman of
my thesis advisory committee for the Master of Science Degree. I would also like to convey
my appreciation to the other members of my advisory committee: Dr. Donald J. Cook, De-
portment of Mineral Engineering and Dr. Ernest N. Wolff, Mineral Industry Research Labora-
tory.
A special thanks i s extended to Dr. Dharma Rao, Associate Professor of Coal Techno-
logy for his interest and consultation i n this study, to Mr. Bruce Thomas who made arrange-
ments for the author to see the study area, and to the United States Bureau of Mines who
provided the graduate assistantship which made this investigation possible.
A further thanks i s extended to the many companies and agencies who provided the
current prices and specifications which were util ized in this study.
Lastly, the author would like to thank his wife, Karen, for her support and timely
suggestions during the period of investigation.

TABLE OF CONTENTS
Page
ABSTRACT . . . . . . . . . . . . . . . . . . . . . . . . . . . . . . . i i ... ACKNOWLEDGEMENTS . . . . . . . . . . . . . . . . . . . . . . . . . I I I
LIST OF TABLES . . . . . . . . . . . . . . . . . . . . . . . . . . . . v i i
LIST OF FIGURES . . . . . . . . . . . . . . . . . . . . . . . . . . . IX
Chapter
. . . . . . . . . . . . . . . . . . . . . . . . I . INTRODUCTION
IMPORTANCE OF THE PROBLEM . . . . . . . . . . . . . . . PREVIOUSLY RELATED RESEARCH . . . . . . . . . . . . . . .
. . . . . . . . . . . . . . . . . . . PURPOSE AND SCOPE
II . THE NORTH SLOPE COAL DEPOSITS . . . . . . . . . . . . . . 4
LOCATION AND EXTENT . . . . . . . . . . . . . . . . . . 4
ANALYSIS . . . . . . . . . . . . . . . . . . . . . . . . . 4
STRIPPABLE RESOURCES . . . . . . . . . . . . . . . . . . . 4
LAND STATUS . . . . . . . . . . . . . . . . . . . . . . . . 8
MARKET . . . . . . . . . . . . . . . . . . . . . . . . . . 8
AREA GEOGRAPHY . . . . . . . . . . . . . . . . . . . . . 1 1
Physiography . . . . . . . . . . . . . . . . . . . . . . . 1 1
Drainage and Water Resources . . . . . . . . . . . . . . . . 15
Vegetation . . . . . . . . . . . . . . . . . . . . . . . . 19
Climate . . . . . . . . . . . . . . . . . . . . . . . . . . 19
Settlement and Accessibility . . . . . . . . . . . . . . . . 19
Northwestern Coast . . . . . . . . . . . . . . . . . . . . 19
Ill . COAL TRANSPORTATION METHODS . . . . . . . . . . . . . . 25
RAILROAD . . . . . . . . . . . . . . . . . . . . . . . . . . 25
Construction in Permafrost . . . . . . . . . . . . . . . . . 25
Construction Costs . . . . . . . . . . . . . . . . . . . . . 25
Unit Trains . . . . . . . . . . . . . . . . . . . . . . . . 28
SLURRY PIPELINE . . . . . . . . . . . . . . . . . . . . . . 28
Slurry Pipeline Design . . . . . . . . . . . . . . . . . . . 29
Chapter Page
Major Pipeline Components . . . . . . . . . . . . . . . . . 29
Slurry Pipelines in Northern Areas . . . . . . . . . . . . . . 31
ROADS AND TRUCKS . . . . . . . . . . . . . . . . . . . . 32
Truck . . . . . . . . . . . . . . . . . . . . . . . . . . 32
Northern Road Construction . . . . . . . . . . . . . . . . . 33
Construction Costs . . . . . . . . . . . . . . . . . . . . . 33
. . . . . . . . . . . . . . . . . . . . . BELT CONVEYORS
. . . . . . . . . Construction and Operation in Cold Weather
. . . . . . . . . . . . . . . . . . . . . Construction Cost
. . . . . . . . . . . . . . . . . . . . . . . . . . SHIPPING
. . . . . . . . . . . . . . . . . . . . . . . . . Barging
. . . . . . . . . . . . . . . . . . . . . . . . . . HARBORS
Piers . . . . . . . . . . . . . . . . . . . . . . . . . . . . . . . . . . . . . . . . . . . . . . . . Artificial Island
. . . . . . . . . . . . . . . . . . . . . . Slurry Loclding
. . . . . . . . . . . . . . . . . . . . . . . Lighter Craft
. . . . . . . . . . . . . . . . . . . COAL GASIFICATION
. . . . . . . . . . . . . . . . . . . . . . . Introduction
. . . . . . . . . . . . . . . . . . . . Existing Technology
. . . . . . . . . . . . . . . . . . . . . . . . . . . Demand
. . . . . . . . . . . . . . . . . . . . . . . . Economics
. . . . . . . . . . . . . . Gmification of North Slope Coal
. . . . . . . . . . . . . . . . . . IV . TRANSPORTATION SYSTEMS
SYSTEM1 . . . . . . . . . . . . . . . . . . . . . . . . . . . . . . . . . . . . . . . . . . . . . . . . . . SYSTEM II
. . . . . . . . . . . . . . . . . . . . . . . . SYSTEM 111
. . . . . . . . . . . . . . . . . . . . . . . . SYSTEM 1V
. . . . . . . . . . . . . . . . . . . . . . . . . SYSTEM V
AN ILLUSTRATIVE EXAMPLE FOR SYSTEMS Ill. IV. and IV . . . . . . . . . . . . . . . . . . . . . . . . . . V . CONCLUSIONS
. . . . . . . . . . . . . . . . . . . . . . . . . REMARKS
. . . . . . . . . . . . . . . . . . . . . . . . . SUMMARY
FUTURE RESEARCH . . . . . . . . . . . . . . . . . . . . . v

APPENDICES
. . . . . . . . . A . SYSTEM I
B . SYSTEM II . . . . . . . . C . SYSTEM Ill . . . . . . . .
RAIL. HARBOR. SHIPPING
D . SYSTEM Ill . . . . . . . . SLURRY PIPELINE . . .
E . SYSTEM I11 . . . . . . . . BELT CONVEYOR . . .
. . . . . . . . . F SYSTEM Ill
SLURRY LOADING . . G - S Y S T E M I V . . . . . . . . H - S Y S T E M V . . . . . . . .
. . . . . . . . SELECTED BIBLIOGRAPHY

LIST OF TABLES Table Page
1 . Coal Reserves of the North Slope Coal Fields. by district . . . . . . . . . . 6
2 . Strippoble Resources and Reserves of coal in Northern Alaska . . * . . . . . 9
. . . . . . . . . . . . . . . . . . . . . 3 . Strippable Resenresf by District 9
. . . . . . . . . . . . . . . . . . 4 . Major Rivers in Northwestern Alaska- 17
. . . . . . 5 . Climatological Duta at Various Locations in Northwestern Alaska 20
. . . . . . . . . . . . . . . . . . 6 . Dates of Ice Break-Up and Freeze-Up 24
7 . Construction Costs of Existing and Proposed Railroads . . . . . . . . . . . . 27
8 . Some Long Distance Slurry Piplines . . . . . . . . . . . . . . . . . . . 30
. . . . . . . . . . . . . . . . . . 9 . Types of Roads and Construction Costs 34
. . . . . . . . . . . . . . . . . . . . . 10 . Some Existing Conveyor Systems 37
. . . . . . . . . . . . . . . . . . . . . . . . . . 1 1 . Belt Conveyor Costs 39
12 . System I . Annual Costs . . . . . . . . . . . . . . . . . . . . . . Rail. Loading. Shipping 56
. . . . . . . . . . . . . . . . . . . . . . . . 13 . SystemII.AnnualCosts 59 Truck
14 . System Ill . Annual Costs . . . . . . . . . . . . . . . . . . . . Rail. Dry Loading. Shipping. 62
15 . System I ll . Annual Costs . . . . . . . . . . . . . . . . . . . Rail. Slurry Loading. Shipping 63
16 . Sptem Ill . Annual Costs . . . . . . . . . . . . . . . . Slurry Pipeline. Dry Loading. Shipping 64
17 . System I II . Annual Costs . . . . . . . . . . . . . . . Slurry Pipeline. Slurry Loading. Shipping 65
18 . System I II . Annual Costs . . . . . . . . . . . . . . . . . . Conveyor. Dry Loading. Shipping 66
19 . System I II . Annual Costs . . . . . . . . . . . . . . . . . Conveyor. Slurry Loading. Shipping 67
20 . System IV . Annual Costs . . . . . . . . . . . . . . . . . . . . . Rail. Dry Loading. Barging 72
21 . System IV . Annual Costs . . . . . . . . . . . . . . . . . . . . Rail. Slurry Loading. Barging 73
22 . System IV . Annual Costs . . . . . . . . . . . . . . . . Slurry Pipeline. Dry Loading. Barging 74
23 . System IV . Annual Costs . . . . . . . . . . . . . . . Slurry Pipeline. Slurry Loading. Barging 75
24 . System IV . Annual Costs . . . . . . . . . . . . . . . . . . . Conveyor. Dry Loading. Barging 76 v i i

Table Page
25. System IV - Annual Costs Conveyor, Slurry Loading, Barging . . . . . . . . . . . . . . . . . 77
26. System V - Annual Costs Rail, Slurry Loading, Shipping . . . . . . . . . . . . . . . . . . . 8 1
27. System V - Annual Costs Slurry Pipeline, Slurry Loading, Shipping . . . . . . . . . . . . . . 82
28. System V - Annual Costs Conveyor, Slurrh Loading, Shipping. . . . . . . . . . . . . . . . . 83
29. Transportation Costs per Ton Point 1 to Japan . . . . . . . . . . . . . . . . . . . . . . . , . 88
30. Transportation Costs per Ton Point 2 to Japan . . . . . . . . . . . . . . . . . . . . . . . . 89
3 1 . Transportation Costs per Ton Point 3 to Japan . . . . . . . . . . . . . . . . . . . . . . . . . 9 0
32. Transportation Costs per Ton Point4to Japan . . . . . . . . . . . . . . . . . . . , . . . . . 91
33. Belt Conveyors - Capital Costs . . . . . . . . . . . . . . . . - . . 113
34. Belt Conveyors - Operation and Maintenance Cwts . . . . . . . . . . 114
v i i i

LIST OF FIGURES
Figure
. . . . . . . . . . . . . . . . . . . . . I North Slope Coa\ Fields
2. Classification of Coal i n the North Slope Coal Fields . . . . . . . . . . . . . . . . . . . . . . . . 3 Land Status of Northwestern Alaska
4 . Japan's Sources of Coking Coal . . . . . . . . . . . . . . . . . . . . . . . . . . . . . . . 5 Projected Coking Coal Imports to Japan
6 . Physiographic Divisions of Northern Alaska . . . . . . . . . . . . . . . . . . . . . . . . 7 Distribution of Permafrost i n Northern Alaska
. . . . . . 8 Discharge and Suspended Load in the Colvil le River. 1962
9. Loccltion of the 60 Foot Water Depth on the Coast of Northern Alaska
10 . Profiles of Track Construction in Permafrost . . . . . . . . . . . . 1 1 . Cross Section of a Road Constructed over Permafrost . . . . .
. . . . . . . . . . . . . . . . . 12 . Ship Operating Cost vs Ship Size
. . . . . . . . . . . . . . . . . . . . 13 . Ship Draft vs . Ship Size
14 . Possible Shiploading Methods . . . . . . . . . . . . . . . . . . . . . . . . . . . . . . . . . . . . 15 . U . S . Gas Supply - Demand
. . . . . . . . . . . . . . . . . . . 16 Coal Transportation Systems
. . . . . . . . . . . . . . . 17 . Coal Transportation Cost - System I
. . . . . . . . . . . . . 18 . System I I I - Transportation Cost per Ton
. . . . . . . . . . . . . 19 . System IV - Transportation Cost per Ton
. . . . . . . . . . . . . 20 . System V - Transportation Cost per Ton
. . . . 21 . Possible Mining Areas Used to I I lustrate Transportation Costs
. . . . . . . . . . . . . . . . . 22 . Truck Cost Cash Flow Diagram
Page
5
7


CHAPTER I
INTRODUCTION
Early in the twentieth century, a significant portion of the revenues of the Terri-
tory of Alaska came from placer gold mining on the Seward Peninsula and in Interior Alaska,
from lode gold mining in the Juneau area and from copper mining near McCarthy in Southern
Alaska. Since that time, increasing operational costs without a proportional increase in
the price of gold, and closure of the lode gold mines during World War II to increase base
metal in production has resulted in the discontinuance of the larger gold mining operations.
The largest copper producer suspended its operation when high qua1 ity ore became scarce.
I t is generally agreed that Alaska has significant mineral potential, but develop-
ment has been slow because of high capital and operational costs, long distances to a mar-
ket, lack of internal transportation and recently for political and ecological reasons.
The recent discovery of oil at Prudhoe Bay on the Arctic Ocean and the subsequent
planning of the Trans-Alasko pipeline has demonstrated that a number of these problems can
be overcome. A copper mine in Northern Alaska, and a fluorite mine on the Seward Penin-
sula, which has been proposed for operation in the late 1970ts, must surmount similar devel-
opmental difficulties. Perhaps these activities are the harbingers of o new mining era in
Alaska, and wil l lead the way to a resurgence of other mining developments in the State.
One of these developments could be coal mining. Barnes (1967) estimated the coal resources
of Alaska to be approximately 130 billion tons, of which 120 billion tons exist in nofihern
Alaska. Recent tests have indicated that part of this deposit i s coking coal, a commodity
which i s in demand on the world markets.
IMPORTANCE OF THE PROBLEM
The economic considerations for the establishment of a commercial coal mining
activity on the North Slope fall into two basic elements: mining costs and transportation
costs. I t i s essential that good estimates of both of these elements are known before invest-
ment of capitol i s considered.
I t i s important that a l l types of applicable transportation methods are also studied
from aspects other than economic considerations; namely, flexibi lily, ecolo gical effects,
and future development.
I t i s only after the above i s accompl ished that a reasonable conclusion of North
Slope coal development can be reached.
1

PREVIOUSLY RELATED RESEARCH
Collier (1905) described coal deposits of the Corwin Bluff area which were investi-
gated by a U . S . Geological Survey party in 1904. Coal wcls discovered near Cape Beau-
fort in 1826 by A. Collie, who accornpunied Captain Beechey to the Arctic Ocean. Whalers
used the coal from beds near Corwin Bluff, 28 miles east of Cape Lisburne between 1880 and
1905. In 1900 and 1901, about 1000 tons of this coal was mined and sold at Nome for fuel . (Collier, 1905).
Smith and Mertie (1930) and Chapman and Sable (1960) reported the results of the
reconnaissance of northern coal deposits in 1926-1927 and 1944-53 during U . S . G . S. investi-
gations of Petroleum Reserve No. 4. In 1946, the U. S. Bureau of Mines investigated the
coal deposits to assess the possibility of their use for heating in local Eskimo villages*(San-
ford, 1946, Toenges, 1947). A small mine on the Meade River supplied coal to the village
of Barrow from 1944 until gas became available as a substitute fuel.
In 1954, representatives of the Morgan Coal Company drove a 70 foot adit and a
raise in the coal beds of the Kukpowruk River and extracted a bulk sample from this raise
(Warfield, 1969). In the field seasons of 1962, 1963, 1964, and 1966, Bureau of Mines purties
gathered samples from surface outcrops, trenches and at depth with the use of a diamond dri l l
from the coal beds of the Kokolik and Kukpowruk Rivers. Extensive carbonization studies
were conducted on some of these samples (Warfield, 1966, 1969).
Callahan (1969, 1971) reported the results of U . S . G .S . reconnaissance surveys and
surface mapping performed in 1966 and 1967 along the Kukpowruk River and in two adjoining
townships, and of surveys done in 1969 i n the Cape Beaufort area and near Corwin Bluff in
1970. In the summer of 1970, Kaiser Steel Corporation made a brief study of the coal occwr-
rences along the Kukpowruk River ("Kaiser Steel---", 1970).
The Bureau of Mines continued their drilling program on the coal deposits near Cape
Beaufort in the summer of 1972.
Several major studies concerning transportation to northern Alaska have been performed
although none of them were directly related to the exploitation of the northern coal fields.
Bush (1942) conducted investigations for the U. S. Army Corps of Engineers on the feasibility
of a railrocld or highway route from Fairbanks to an ocean port on the Seward Peninsula. In
1967, the NORTH Commission was established to foster the development of the northern area
of the state of Alaska. Under the direction of this Commission, EBS Management Consultants
(1967) performed a study on a proposed extension of the Alaska Railroad to Kobuk, Alaska.
In connection with this proposed extension, Heiner and Wolff (1968) performed a study on a 2


CHAPTER II
THE NORTH SLOPE COAL DEPOSITS
LOCATION AND EXTENT
The northern coal fields are situated mainly in northwestern Alaska, bounded ap-
proximately by the Arctic Ocean and the Chukchi Sea to the west, the Arctic Ocean to the
north, the lower Colville and ltkillok Rivers in the east and the Brooks Range in the south.
The coal bearing area covers about 30,000 square miles of which 24,000 square miles is
included in Naval Petroleum Reserve No . 4.
fhrnes (1967) estimated the coal resources of the region to total 120,197 mill ion
tons under less than 3000 feet of overburden, of which 19,292 mill ion tons i s bituminous
coal in beds of more than 14 inch thickness and 100,905 million tons i s subbituminous coal
in beds of more than 2 1/2 feet thick. The locations of the bituminous and subbituminous
coal are shown in Figures I and 2, and the reserves of each district of the coal field are
listed in Table I.
ANALYSIS
Warfield (1966) reported that the majority of samples taken from a 20 foot seam in
the Kukpowruk River coal beds were found to have significant coking qua1 ities. He also re-
ported that exposure of one of these samples to air for extended periods did not reduce the
coking qualities more than noted in similar treatment of an eastern U. S. coking coal.
Several coal deposits sampled in 1964 and 1966 in the Kukpowruk River, Kokolik
River and Cape Beaufort areas were established as good quality and of possible use for coke
production (Warfield, 1969). In the Cape Beaufort area, none of the surface samples showed
coking properties, but a drill sample from a depth of 200 feet had a higher heating value
and pronounced coking characteristics.
Warfield (1969) also reported that the coal from these areas has a low moisture, ash
and sulfur content.
STRIPPABLE RESOURCES
A recent Bureau of Mines report ("Strippable Reserves---", 1971) listed the strippuble
coal reserves of the northern coal fields. These estimates are listed in Table 2.
Only coal with a seam thickness of 14 inches or more under 120 feet or less of ovar-

0 100 200 - Scale - miles
FIOURE I N O R T H S L O P E COAL FIELDS
A l a s k a R . R . Source - Conwell (197 2 )

Table 1
District
Corwin Bluff - Cape Beaufort
Kukpowruk River
Kokolik River
Utokok River
Meade River
Colville River
Kuk River (Wainwright)
Kugra River (Peard Bay)
lkpikpuk River
Total
Coal Reserves of the North Slope
Coal Fields, by District
(mil l ions of short tons)
Bituminous Subbituminous
982.3
3065.3
2336.1
2737.9 44,738.1
2948.3 39,756.3
7222.3 11,489.1
1,457.7
840.2
2,623.9
Source Barnes, (1967)

Capa Liaburne .
B i t uminour A Araoa of minobla thickness
14" for bi tuminour
Sub b i tuminour 30" for aubbituminour and l i g n i t e
6 A r e o r where information on the qua l l ty and thicknas* 1s
Lacklng
F I B U R E 2
C L A S S I F I C A T I O N OF COAL IN THE
N O R T H S L O P E C O A L F IELDS
S o u r c e - Bornes (1961)

burden was counted as reserves.
Table 3 i s an estimate of the strippable coal reserves in each of the northern coal
field districts. These estimates were computed with the use of the following equation:
Reserves in the District x Total Strippable Reserves
Total Reserves
The purpose of this table was only to give an indication of the strippable resources in each
district and i s not intended to be completely accurate.
LAND STATUS OF THE NORTHERN COAL DEPOSITS
Most of the northern coal fields are contained in Naval Petroleum Reserve No. 4
which at the present time i s not open to mineral leasing.
Coal prospecting permits in the Kukpowruk River area have been issued to Morgan
Coal Company. Applications for prospecting permits on approximately 140,000 acres i n
other parts of the coal fields have been submitted by various organizations and are pending
approval from the Bureau of Land Management (Bureau of Land Management, 1972). No
coal leases have been issued for the northern coal fields.
The most recent (March 17, 1972) Land Classification of Alaska i s shown in Figure
3. Only land which i s classified as unreserved public lands i s open to mineral leasing at
the present time (October, 1972).
MARKET
The markets for coal fal l into two main categories, coking coal and non-coking
coal. Coking coal i s a necessary ingredient in the manufacture of steel, whereas non-
coking coal is used mainly for fuel in thermal-electric plants.
The market for the non-coking coal of the northern coal fields is very limited. The
domestic market for coal in Alaska i s presently being f i l led by a producing mine i n the
Nenana coal field. Oil and natural gas have replaced coal i n the Anchorage and Kenai
areas. I t i s possible that small markets for steam coal could evolve i f mining or other devel-
opments occur near the northern coal deposit.
In Canada and the lower 48 states, there are adequate supplies of non-coking coal
to last several hundred years at the present rate of consumption.
A t the present time, Japan i s the most favorable market for coking coal from Alaska
(Japanese Government regulations restrict the importation of steam coal.) Alaskan coal has
8

Table 2
Grade
B i tuminous
Subbituminous
Strippable Resources and Reserves of Coal in Northern Alaska
(millions of short tons)
Source - ("Strippable Reserves---," Bureau of Mines, 1971)
Remaining Strippable Resource
1,197
5,293
Recovemble Strippable Strippable Resource Reserves
957 478
4,234 3,387
Total 6,490 5,191 3,865
Table 3
Strippable Reserves by District
(mil l ions of short tons)
District
Corwin Bluff - Cape Beaufort
Kukpowruk River
Kokol ik River
Utukok River
Meade River
Colville River
Kuk River
Kugrua River
lkpikpuk River
Total
Bituminous
24
76
58
68
73
1 79
Subbituminous


a geographic advantage over many of Japan's coking coal suppliers; this advantage could
result in a favorable competitive position through lower shipping costs.
In 1971 , 20 mi l lion tons or 34.4 per cent (See Fig. 4) of U. S. coal exports were
shipped to Japan (International Coal Trade, February, 1972). In recent years, Canada and
Australia have captured an increasing portion of the Japanese market. In the first quarter
of 1972, Australia displaced the United States as Japan's leading suppl ier of coking coal . The U .S. S. R . has proposed to Japan the development of the South Yakutsk,
Siberia coal field at a cost of 175-185 million dollars (International Coal Trade, May 1972).
Japan conveyed their intention of importing up to 10,000,000 tons per year from this field
in the late 1980's provided the qua1 ity meets their requirements. Figure 5 shows estimates
of Japan's coking coal imports to 1979. ("Iron and Steel---", 1971).
Selling price. The average price per metric ton of coking coal in 1971, C. I .F.
Japan was $21 .OO (C . Itoh and Company, 1972). This i s equivalent to $19 -20 per short ton.
The premium coking coal from the eastern United States demand a higher price. In the first
quarter of 1972, coking coal was purchased C. I. F. Japan at the following prices: (Interna-
tional Coal Trade, May 1972)
Country Price per Metric Ton Price per Short Ton
U.S.A. $24.46 to $28.20 $22.40 to $25.80
Australia $16.58 $15.20
Canada $20.83 $19.15
U.S.S.R.
Pol and
Since very l i t t le of the northern coal has been analyzed, i t i s difficult to project
what sales price i t could demand. However, the tests performed to date indicate that the
northern coking coal i s a blending coal and would therefore sell at the medium to low cok-
ing coal prices.
AREA GEOGRAPHY
Northern Alaska i s composed of four physiographic divisions: namely, moderately
high rugged mountains, low mountains, plateaus and highlands and plains and lowlands
(See Fig. 6). The major topographic features are the Arctic Coastal Plain, the Arctic Foot-


90
80 . - ID C 0 .- - - .- E d
0
5 0 r 1 + 1971 1972 1973 1974 1975 1976 1977 1 9 7 8 1979
Y a o r
F I G U R E 5
P r o j e c t e d C o k i n g C o a l I m p o r t 6 t o J o p a n S o u r c e - " l r o n o n d S t e e l - ~ o p a n ' s ~ e l l w o t h r r ' ' (1971)


hi1 Is and the Brooks Range.
Arctic Coastal Plain. Wahraftig (1965) described the Arctic Coastal Plain as a
smooth plain rising imperceptibly from the Arctic Ocean to a maximum altitude of 600 feat
at its southern margin. Thousands of shallow lakes from 2 to 20 feet deep and from a few
feet to 9 miles long pockmark the coastal plain. The plain i s poorly drained, and as a re-
sult, swampy conditions are prevalent during the summer. Pingos and ice-wedge polygons
are common features in this area. Permafrost to depths of 1000 or more feet underlie most
of this area. The active layer i s from three inches to four feet deep.
Arctic Foothills. The arctic foothills are plateaus and low mountains ranging from
600 to 3500 feet in altitude. The northern section of the foothills i s dominated by mesalike
mountains. The southern section is characterized by irregular buttes, mesas and ridges inter-
rupted by undulating tundra plains. The entire area i s underlain by permafrost. (See Fig.7).
Brooks Range. The mountains of the Brooks Range rise to summits of 7000-8000
feet in altitude in the southern part. In the higher areas of the range, small glaciers are
common. The main north flowirg rivers begin at the head of the wide flat-floored glacier
valleys of the Brooks Range.
Drainage and Water Resources
Table 4 i s an outline of the major rivers in northern Alaska. Rivers east of the Col-
v i l le River in the Arctic Coastal Plain have numerous braided channels, whereas rivers west
of the Colville meander sluggishly in valleys 50-300 feet deep (Wahraftig, 1965). Most
streams in the Arctic Foothills have swift braided courses across broad gravel flats. The
major rivers of the Brooks Range flow nor+h to the Arctic Ocean, and south to the Kobuk,
Koyukuk and Yukon Rivers.
The many small lakes on the Arctic Coastal Plain are limited to low volume uti l ira-
tion because low annual precipitafion results in slow replenishment rate. In most hreas,
permafrost to depths of over 1000 feet prevents the formation of any subsurface water
(Parker, 1972).
In winter, ice cover of approximately 6 feet builds up on al l surface water bodies.
Many streams are locally covered in winter with extensive sheets of anchor ice. Even in the
largest rivers, flow in winter i s approximately 5 per cent of the summer flow (See Fig. 8).
Water i s available from lakes which do not freeze to the bottom and from unfrozen
aquifiers beneath the rivers. Williams (1970) reported that aquifien in the Colville River
15


Table 4
Major Rivers in Northwestern Alaska
Drainage Area
River (sq. miles)
Kukpowruk 4,178
Meade 3,850
lkpikpuk 4,540
Colville 24,000
Kukparuk 3,659
Sagavanirktok 5,546
Length of Estimated Average Main Stream Annual Flow
(mi l es) (cu.ft./sec.)
Source - Parker (1972)

.
L
v 0
' 3 a s > a d s ~ a b a w s ! q n a a b ~ o q a s ! a o -I
o o O o o rlr w 0 s 0 LT I r - w n c d R1 - w
0 c c 0 u Q I ' o
& ;
CJ (D
m - C
W L 0 PD P > c .- - , = N
r- a m CID - - - s .d - C " > ", -
0
E o m ; s
O D , + 0 I 0 0 - = L W L .-
0 0 0 0 0 0 0 0 u1 0 P n
O (\I E
E D P l a d s u o + p o o l p a p u a d s n s

yield from several hundred gallons per minute from alluvium to less then ten gallons per
minute from bedrock.
Vegetation
Most of the Arctic Coastal Plain consists of tundra which i s characteristically tree-
less. Trees of the willow and poplar variety do exist along the larger valleys in the Arctic
Foothills and to a lesser extent in the mountain valleys.
In the Brooks Range, the tree line along the southern slopes usual ly occurs between
the 1000 to 2000 foot elevations. The most prevalent plant l i fe i s the cotton grass tussock
which i s 6 to 10 inches in width and height, and i s separated by mossy channels a few in-
ches wide. Other types of vegetation common to northern Alaska are mosses, lichens, sed-
ges, dwarfed berry bushes and many wild flowers.
Climate
Al l of northwestern Alaska i s considered to have an arctic climate (Johnson, 1971).
This arctic climate i s characterized by light precipitation, strong winds and a 10' to 20' F
mean annual temperature, Marine influence affects this climate somewhat in summer, but
to a lesser extent in winter.
Temperatures of -4Q0 F. are common in the winter and have been known to drop
to -65' F. Strong winds and storms, many approaching gale velocities are common. Table
5 i s a summary of climatological data at various points in northwestern Alaska.
Settlement and Accessibility
Settlement in northwestern Alaska consists mainly of isolated Eskimo coastal v i l -
lages, the largest of which is Barrow with more than 1000 residents. Oil comprrr;~q engag-
ing in exploration and construction maintain temporary camps at several points i t ! 14le region.
The area contains no roads, railroads or trails. None of the major rivers are navi-
gatable except the Colville River which i s navigatable by barges with a three foot draft.
Travel i s pr inc ip l ly by air although tractor trains have been used in past explora-
tion programs. Supplies are brought into the coastal villages by ship and barge in the late
summer.
Northwestern Coast
Continental shelves of the Bering and Chukchi Seas create fairly shallow waters on
19

Mean Annual
Location Preci p .
Ft. Lay 6
Cape Lisburne 8
Cape Thompson 8
Mean Annual Snowfal I
20
40
25
30
30
Cl imatological Data at Various Locations in Northwestern Alaska
Mean Mean January Annual Minimum
**?.O -24
10 -18
15 -20
**19.0 -16
17 -16
Temperature F
Mean Mean January July Maximum Minimum
Mean July
Maximum
Kotzebue 8 40 21 -16 0 46 60
* Number of degree days below 65 F for one year.
**Source - U. S . Dept. of Commerce, Environmental Science Services Administration
Source - Adapted from Johnson, Hartman 1971
* Heating Degree
Days

the northwestern coast. (See Fig. 9) Water depths of sixty feet are at least three miles
from shore. Port Clarence and Golovnin Bay, both of which are on the Seward Peninsula
are the only natural deep harbors north of Norton Sound. The next natural deepwater har-
bor past Port Clarence i s at Herschel Island in the Canadian Arctic.
At Kotzebue, sea going ships must anchor 14 miles offshore, where cargo i s trans-
ferred to shallow draft lighter barges. At Prudhoe Bay, cargo i s transferred from ocean
barges to lighter barges 6 miles from shore (Moreau, 1970).
In 1958 a study was undertaken by the U . S . Geological Survey (Pewe, 1958) to
determine the most suitable site on the northwestern coast of Alaska for the excavation of
an artificial harbor by a nuclear device. The harbor site recommended in this study was at
the mouth of Ogotoruk Creek, about seven miles south-east of Cape Thompson. At this
point there exists a seavalley which starts one quarter mile from shore and extends seaward
for 15 miles to a depth of 135 feet (Sainsbury, 1966).
Seafloor. Reflection studies between Cape Lisburne and Cape Seepings and be-
tween Icy Cape and Point Barrow have indicated that bedrock is exposed or nearly exposed
on the seafloor in many areas (Craeger, 1967). Sainsbury and Scholl (1966) found outcrops
exposed on the surface of the seafloor near the mouth of Ogotoruk Creek.
Coastline topography. Nearly continuous steep sea cl i f f s characterize the coastal
region from Ogotoruk Creek to Cape Beaufort. Breaks in these cliffs occur where stream
valleys meet the coast. Beaches are generally steep and narrow except at Point Hope where
barrier islands project offshore.
From Cape Beaufort to the Utukok River, about 25 miles south of Icy Cape, the
coastline consists of almost continuous sea c l i f k from 15 to 45 feet high. In the Cape Beau-
fort area, the cliffs are directly exposed to the ocean. From approximately 25 miles north
of Cape Beaufort to the Utukok River, the coast i s fronted with low relief barrier islanck
which enclose small shallow lagoons.
The shoreline from the Utukok River northeastward to Point Barrow i s characterized
by moderate to low relief sea cliffs which are either directly exposed to the sea or are
fronted by sedimentary barriers (Hartwel I, 1972).
Tides. Tides along the northwest coast are weak. Normal maximum tides range
from three feet near Kotzebue to 0.6 feet near Point Barrow (Johnson, 1971). Storms can
cause changes in the sea level, such as one storm in 1963 when three meter high waves
caused flooding and about three mil lion do1 lars damage to the village of Barrow (Hartwel I, 2 1


1972).
Ice Conditions. In northwestern Alaska, ice begins to form on the beaches in the
late fall and remains for approximately 8 months. This ice attains a thickness of about 5
feet (Hartwell, 1972). If shearing occurs between the fast ice (ice frozen fast to the shore)
and the floating ice offshore, large pressure ridges and jumbled ice fields usually occur.
Pack ice usually forms a major pressure ridge offshore at Barrow and at times grounds on the
sea floor to depths of 60 to 100 feet. Even during the normal ice-free season at Barrow, an
onshore wind can bring the pack ice into shore. When the protective fast ice thaws, the
sea ice may be driven onshore by winds. These major ice shoves can produce ridges up to
6 feet high. Coastal ice scour i s prevalent during the winter months. Deep hulls of pres-
sure ridges which extend beneath the floating sea ice rub and gouge the sea floor from shore
to depths of 100 feet. Some of this gouging in the Beaufort Sea has produced troughs in the
sea floor from 2 to 30 feet deep. ("Ice Gouging---", Whitehorse Star , 1972).
Table 6 i s a list of the dates of break-up and freeze-up at locations in northwestern
Alaska.

Location
Table 6
Dates of Ice Break-Up and Freeze-Up
Ice Break-Up Ice Freeze-Up Ice-Free Months Ice Light Heavy
Ave . Earl iest Latest Ave . Earl iest Free Ice Ice Latest
Golovin Bay May 23 May 13 June 14 Nov 2 Oct 8 Nov 19
Te\ler-Port Clarence June 7 May 12 June 18 Nov 10 N w 1 3 Dec26 *3 * 4 * 5
Kotzebue May31 May17 June8 Oct 23 Oct 2 Nov 5
Point Hope June 20 May 30 July 8 Nov 11 Oct 6 Dec 19 **3 **3 **6 tQ P
Point Lay June 24 June 1 July 10 Nov 4 Oct 12 Nov 27 **2.5 **3 **6.5
Wainwright June 29 June 7 July 26 Oct 2 Sept26 0 d 9 *2 *3 *7
Point Barrow July 22 June 15 Aug 22 Oct 3 Sept31 Dec19 *2 **3 **7
* Source - U. S. Coast Guard, Polar Transportation Requirements
Source - U. S. Coast Pilot No. 9, 1964
** Estimated from above sources

CHAPTER Ill
COAL TRANSPORTATION METHODS
RAIL ROAD
The most widely used method of transporting coal overland today i s the railroad.
Railroads have been constructed and successfully operated in many types of environments
and climatic conditions.
Early railroads in Alaska were the Seward Peninsula Railroad, the Copper River and
Northwestern Railroad near Valdez and the Alaska Railroad which extends from Fairbanks
to Seward. Only the Alaska Railroad is stil l operating. At the present time, approximately
one mil lion tons of freight are hauled over the Alaska Railroad annually.
Other railways built in northern areas and still operating are the Labrador Ungava
Railway, the Great Slave Railway, the Hudson Bay Railway, all of which are in Canada
and the White Pass and Yukon Railway which operates between Whitehorse, Yukon Territory
and Skagway, Alaska.
Construction in Permafrost
A railroad built in areas where permafrost i s prevalent requires large amounts of
f i l l material. This f i l l material serves as a railroad bed and as an insulation layer to retard
the thawing of the underlying permafrost (See Fig. 10). The general method of construction
on permafrost i s to preserve the frozen condition by building on it, rather than excavating
into it. Side hi l l railroad construction i s a technique which i s applied in northern areas.
Valley bottoms are often flooded during the spring run-off.
Drainage i s also an important consideration for railroad construction in permafrost
areas. Water in contact with the permafrost causes thawing, the result being settling of
the railroad bed.
Construction Costs
Railroad construction costs in northern areas vary with the location, but in general
these costs are substantially higher than for railroads in southern areas. The main reasons
for the higher costs are: importation of labor, severe climatic conditions hence lower labor
and machine efficiency, the large volumes of f i l l required, and the transportation costs for
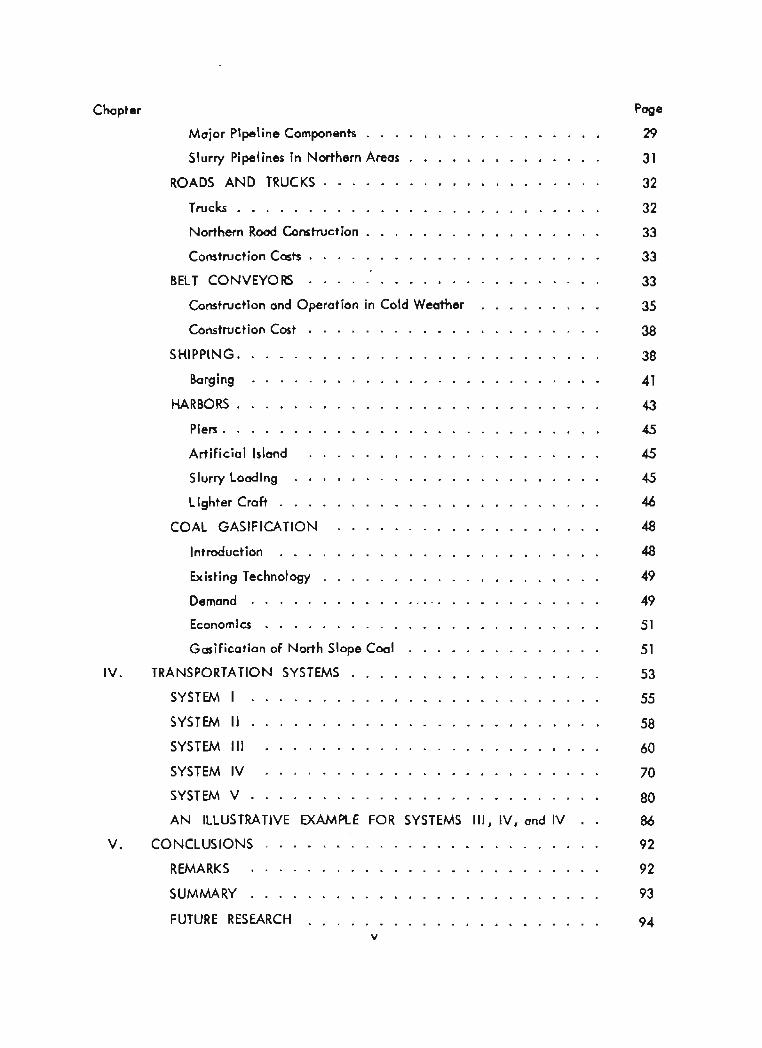
supplies and materials from southern areas. Table 7 shows the construction costs of existing
and proposed railroads in northern areas.
25

Gravel Fill
f r o s t table ',
I F I G U R E 10
PROFILES OF T R A C K CONSTRUCTION IN PERMAFROST
S o u r c m - ~ o n o d i a n l n r t i t u t r o f Guided G r o u n d T r a n r p o r t ( 1 9 7 2 )
26
Table 7
Rail road
1 . Great Slave Railway
2. Quebec North Shore and Lclbrador Railway
3. Extension of the Alaska Rail road
8 4. Railway to the Arctic
5. Railroad North of Fairbanks
6. Railroad to North Slope
Construction Casts of Existing and Proposed Rail roads
Locaf ion
Year Length Constructed (miles) or Proposed
Roma, Alberta to Hay River, 377 N.W.T.
Sept Iles, Quebec to 360 Sheffervi l l e, Labrador
Dunbar, Alaska to Kobuk Alaska
Trout River, Alberta to 1240 Prudhoe Bay, Alaska
Nenana, Alaska to Deadhone, Alaska
Construct ion Cost per mile (dot Ian)
Sources: 1- Charles (1965) 4 - Canadian Institute of Guided Ground Transport (1972) 2- Pryer (1963) 5 - Polar Transportation Requirements (1968) 3- ERS Management Consultants (1967) 6 - Tudor, Kelly, Shannon (1972)

Unit Trains
The unit train technique i s 0 relatively new concept in railway transportation. The
first unit train system started in the United States in 1959. In 1967, 327 coal mines were
shipping coal by unit trains (Glover, 1970).
The unit train concept usually involves the following:
a) A train or number of trains dedicated to the haulage of the bulk material.
b) A long term contractoral agreement between the shipper, supplier and receiver.
c) One source and one destination.
d) A predetermined louding, unloading and travel time schedule.
The major advantages of the unit train are: high equipment utilization, low
clerical costs, and higher shipper and receiver benefits due to the precision of advanced
scheduling.
SLURRY PIPELINE
Slurry transmission by pipeline has been in existence since before the 20th century,
but i t has been only in recent years that long distance transmission has developed. Two of
the most noted pioneer efforts in bulk movement by slurry pipeline were built in 1957. A
71 mils long pipeline used to transport Gilsonite extended from Bonanza, Utah, to Grand
Junction, Colorado, and a 108 mile long coal slurry pipeline was constructed between Cadiz
and Cleveland, Ohio.
The most recent efforts in the use of slurry pipelines are the 53 mile long Savage
River pipeline in Tasmania which transports iron ore slurry, and the 273 mile long Black
Mesa pipeline which transpork a coal slurry between Arizona and Nevada. A 490 mile long
pipeline to transport coking coal from eastern British Columbia to the Pacific coast has been
proposed for operation in the late 1970's ("World Wide---", 1972).
A long distance slurry pipeline has only one source and one destination. Each ap-
plication i s a separate case and normally cannot be used interchangeably with other mater-
ials. The general requirements for pipeline construction are large ore reserves and a long
term market contract. The main advantages of a slurry pipel ine are low operating costs and
low material losses. In many slurry pipelines, the pumping stations are automated or semi-
automated, A pipeline i s a closed system, therefore dust losses or contamination of the en-
vironment i s minimal. Mosf pipelines are buried, consequently, they do not occupy the land
surface or create surface obstruetims. 28

Table 8 i s a list of data on some commercial pipeline applications.
Slurry Pipeline Design
Link (1972) stated that slurry transport in many cases i s still more of an art than a
science. A number of commercial pipeline construction projects have been precluded by
extensive laboratory and pilot plant testing.
Particle size, pumping velocity and solids concentration are three of the most im-
portant factors in slurry pipeline design.
Pumping velocity. In slurry pipelines i t i s important that the solid particles remain
in a homogeneous suspension. In every ease, there exists a critical velocity, the point at
which particles begin to settle to the bottom of the pipe. The pumping velocity must be
above this critical velocity. I f not, solid particles tend to be dragged along the bottom of
the pipe causing excessive pipe wear and creating unstable flow conditions. The optimum
velocity for commercial coal slurry applications has been determined to be between 3 and 6
feet per second (Wasp, 1971).
Solids concentration. The concentration of solids in a slurry has a direct influence
on the particle settling velocity and the pumping velocity. Commercial coal slurry pipe-
lines use solids concentrations of 45 t o 60 per cent by weight. Beyond 60 per cent, small
increases in concentration mean large increases in the pressure drop, hence a higher pumping
horsepower and higher cats with disproportionate gains in the amount of material transported.
Another factor in the design of a pipeline i s the carrier fluid. In most cases, wafer
i s used as the carrier fluid although i t i s possible to use oil, gasoline, or other hydrocarbons
i f readily available. However, i t i s the rare case where the markets are available for the
exact balance of the solids and the carrier fluid.
Major pipeline Components
Pumps. Slurry pipelines have employed centrifugal pumps and piston and plunger
reciprocating pumps. Centrifugal pumps are used where the pump discharge pressure i s re-
latively low, below 650 p . ~ . i. Piston reciprocating pumps are normally used for pressures
up to 2000 p.s. i., plunger pumps are used where pressures up to 4000 p.s. i. are required
(Thompson, 1972).
The main advantage of the reciprocating pump i s the higher operating pressure.
This higher pressure allows a greater distance between pumping stations, hence a lower sta- 29

Table 8
Some Long Distance Slurry Pipelines
Pipel ine Location Pipe Annual Material % Solids Size Tonnage Transported by wt.
(Length) (mill ions)
American Gilsonite Co. Utah, 10" 0.4 Gi lsoni te 48 Colorado (72)
Consolidated Coal Co. Ohio ( I bKi 1.3 Coal 50 -60
ConsoliaatedCoalCo. Virginia, 18" 10 Coa 1 N .A. New York (350)
Black Mesa Pipeline Co. Arizona, 18" 5 Coal 45-50 Nevada (273)
Savage River Tasmania 9" 2.25 iron Ore 60 (53)
Cascade Pipeline British N.A. 10 Coal N.A. Ltd. Columbia (500)
* Closed due to decreased railroad tariffs
Construction Year Cast Started or
(mil lions) Proposed
N.A. 1957
N.A. *19P
200 1969-P
Sources - Job (1969) * Longest Largest Coal Slurry---" (1971)
Love (1969) McDemott and others (1968)

tion cost. One of the largest slurry pumps constructed at present i s 1750 horsepower, where-
as earlier commercial coal pipelines used motors of 450 horsepower.
Another advantage of the reciprocating pump is that they can work effectively
under abrasive conditions. In a centrifugal pump, the slurry must be conveyed through the
body of the pump, whereas in a reciprocating pump water can be forecsd into the face of
the piston and plunger so that slurry contact with the components of the pump i s minimal.
h. Slurry pipe generally has a higher carbon content than pipe used for oil
transmission.
Pipelines conveying a highly abrasive material such os iron ore have to be rotated
at intervals. Coal i s from onequarter to one-half as abrasive as iron more, thus pipe wear
i s not as serious a consideration.
Preparation and dewatering plant. The cost of the slurry preparation and subse-
quent drying, if required, may be an added c a t of slurry transportation i f the coal i s marketed
in the dry state.
Slurry Pipelines in Northern Areas
The cold northern climate poses some unique problems to slurry pipeline construc-
tion and operation.
Water. The scarcity of water in northern, particularly arctic areas in the winter - may require consideration of seasonal operation, a smaller water supply line from a large
water source, or recirculation of water.
Permafrost. Normally pipelines are buried except over river crossings or when
travelsing a mountainous terrain. Burying a pipeline in permafrost may cause complications.
Lachenbruch (1970) studied the effects of a hot oil 48 inch diameter pipeline buried in perma-
frost and concluded that a cylindrical thaw region 20 to 30 feet in diameter would occur af-
ter several years of operation. He also aoncluded that insulating the pipe would increase
the oil temperature rather than decrease the thawing. A similar effect, although much less
severe, may result i f a slurry pipeline i s buried. Heat i s generated from the abrasion of the
slurry along the pipe and pump walls. Although this heat generation rate may not be high,
i t wil l have to be accounted for.
Climate, Slurry pipeline operation could be either seasonal or year round. A sea- 3 1

sonal operation would avoid the severe winter tempemtures but would have to be propor-
tionately larger than a year-round system.
A year round pipeline system would have to be insulated and/or heated to prevent
freezing. No long distance commercial slurry pipelines exist in areas where freezing of the
line i s a problem. Many short distance pipelines exist in cold areas, but these are either
heated or the exposure time to cold temperatures is minimal.
ROADS AND TRUCKS
Compared to other,modes of bulk transport,trucking i s considered the most flexible . In the development of a system to move large amounts of bulk materials over long distances,
the establishment of a road and truck system normally involves a lower capital cost, but a
higher operating cost than other systems. Where the belt conveyor and slurry pipel ine are
designed for a maximum amount of material to be transported, a road-truck system can be
expanded simply by the addition of more road and more trucks. Since each truck i s self
propelled unit requiring one or two operators, the labor costs and maintenance costs are
higher than for other systems. Roads are not as limited to grade as are railroads. Railroads
generally are restricted to grades close to 2 percent where roads can be constructed with
grades of 8 percent or more. To move material from the same source to the same destination
in an undulating terrain, a railroad would then normally be longer than a road.
Trucks
There are two major classes of trucks fm the movement of bulk materials: on-the-
highway trucks and off-the-highway trucks. Off-the-highway trucks with capacities up to
250 tons are presently being usd, and trucks with capacities greater than 300 tons are anti-
cipated in the near future. These large trucks are normally used for short hauls in open pi t
mines or in large construction projects. On-themhighway trucks can be of two types: those
operating on public roads and those operating on private roads. Trucks operating on public
roads are subject to width, length and weight restrictions. In Alaska, the weight restriction
i s 18,000 gross pounds per axle for single wheels, and 20,000 gross pounds per axle for dual
wheels (Alaska Department of Highways). The maximum allowable truck width i s 8 feet and
the allowable length is 70 feet. In the Yukon Territory, the maximum allowable gross weight
per truck i s 95,000 pounds (Baker, 1971). As a result of these restrictions, truck payloads
normally range from 25 to 30 tons.
32

On-the-highway trucks which operate on private roads are not normally subject to
restrictions, except those imposed by the condition of the roads on which they operate. A
trucking system which has the advantage of greater labor and truck utilization than on pub-
l i c roads operates at a phosphate mine in Idaho. Each truck hauls three 70 ton capacity
trailers a round trip distance of 31 miles (Atwood, 1971).
Northern road construction
Road construction over permafrost requires the some special consideration as rail - road construction. Damage to the insulating tundra layer wi l l cause rapid degradation of
the road bed and adjacent area. Protection of this insulation layer can be accomplished by
covering the tundra with large amounts of gravel or sand f i 11 material. (Foam insulation i s
presently being considered for use in road beds to reduce the amount of f i l l required .) Stokes
(1971) suggested that a 5 foot deep fill layer over high center polygons and a 6 foot deep f i l l
over low areas makes an adequate roadway on the North Slope which requires l i t t le maint-
enance. Drainage i s another important factor in road location. Ditching i s not always
possible because i t may result in erosion of the permafrost. An adequate number of drainage
culverts are necessary to prevent water from melting the permafrost beneath the road beds.
Figure I1 i s a cross section of a typical road constructed on permafrost on the North Slope.
Construction Costs
The cost of a road varies with the types of road required. A winter road can be
constructed at a very low cost but i t can only be utilized for a portion of the year. In most
cases, there i s a tradeoff between the initial road construction cost and the yearly mainten-
ance cost of the road and trucks. Table 9 i s a summary of the construction costs of various
types of northern rmds .
BELT CONVEYORS
Belt conveyors have been used extensively for the movement of bulk materials since
the late 19th century. At the present time, belt conveyors are probably handling more mater-
ial than any other system. An overland conveyor system i s usually composed of a number ofsingle
flight conveyors. The length of a conveyor system appears to be unlimited, but the length
of a single flight is limited by the maximum tension rating of the belt. Until recently, con-
veyor belts were composed of rubber with a cotton carcass. New developments such as the
nylon belt, the steel cord belt and the cable belt have increased belt tension ratings, which
33

Road
1. Minimal Road Class I
2. Minimal Road Class I f
i2 3. Minimal Road
Class Ill
4. Al l Weather Track
5. Earth Road
6. Permanent Earth Road
7. Tarred or Surfaced Road
Table 9
Types of Roads and Construction Costs
Description
Clearing of existing trails
Clearing surface vegetation Natural earth surface
Minimal cut and fill
Filling, drainage systems Ferries at river crossings
Capable of hand1 ing heavy truck traffic in good weather
A l l traffic - al l year al l crossings bridged
A1 l traffic at high speeds a1 l year
Construction C a t (per mile)
$500,000 or greater
Source - Ehrl ich (1969)

have permitted increases in the length of single flight belt conveyors.
In nylon and steel cord belts, the nylon or steel cords act as the tension members.
The cable belt conveyor consists of a belt held on two parallel wire ropes, and drive power
is transmitted down the ropes, instead of through the belt. The cables and belt are suppor-
ted by cable sheaves instead of the idlers which are used for the support of nylon and steel
cord be1 ts . Before the development of these stronger belts, i t was unusual to have a single
flight conveyor more than one mile in length. A conveyor manufacturer has reported that
within the next year, two conveyors, each of which wi l l be 5 miles between head and tail
pulleys, wi l l be installed (B.F. Goodrich, 1972). New drive concepts are being tested to
permit longer single flight conveyors - up to 50 miles between centers (B. F. Goodrich,
1972) . The main advantage of longer single flights i s in the reduction of transfer points.
Transfer points are normal ly the areas where spillage occurs most frequently . Transfer points
cause increased wear on the belt due to the impact of the material, increased chute wear,
dust problems, possible sources of plugging, and a greater horsepower requirement due to the
added height required.
Conveyors are widely accepted as a transpofiation vehicle for two main reasons:
ease of operation and relatively low maintenance costs. However, long distance conveyor
systems are inflexible: thcrt is, they are designed for a specific tonnage, source and destina-
tion. Also, conveyors create a surface obstruction which i s more apparent than obstructions
caused by other transportation modes such as roads and railway. Table 10 i s a list of some
existing conveyor systems.
Construction and Operation in Cold Weather
The primary consideration in the construction of a belt conveyor system i s belt
alignment. A misaligned belt wil l result in excessive be1 t wear and possibly spillage. Align-
ment wi l l be a more serious problem in northern areas because of the land shifts caused-by
frost action. Stability can be attained with the use of sunken pilings to support the structure,
but this wi l l be expensive.
Belt conveyors have operated successful ly in temperatures below -45' F and belts can
be designed to operate in temperatures as low as -67' F . ( Goodyear, 1972). Conveyors
which are operated in cold climates are normally shut down only for short periods of time.
When material is not being transported, the conveyor continues to run, but at a creep speed,
35

5 t o 6 '
' G r o v e l Road Flll - .
- - - - - - - - - - - - - - - - - - - - - - - - - - - - - - - - - * - - - - * - - A c t l v r Layer --- -- - /
F I G U R E I I C r o s s S e c t i o n o f a R o o d
Const ructad over P e r m a f r o s t
S o u r c o - Stokes (1971)


substantially lower than the normal operating speed.
In areas where snow and wind are common, protective covering of the conveyor is
a necessity. Bearings, drives and other mechanical equipment must be designed to withstand
extreme temperatures, and must be kept well lubricated with low temperature lubricants.
Problems wil l occur during the freeze-up or thaw times of the year when temperatures are
near the freezing point. Ice may build up unevenly on the belt and idlers, which may came
belt run-off and eventual spillage (Oszter, 1965). A conveyor operating in cold weather
should be either completely unheated, or completely heated. Problems occur most frequently
when freezing takes place on the belt conveyor. Horsepower requirements are normally
greater for cold weather operations due to increased friction resistance. A friction multip-
lier, which accounts for the resistance to idler rotation, used in conveyor belt design at 0
-40°F i s three times the multiplier used at 30 F (Conveyor Equipment Manufacturers Assoc.,
1966).
Construction Cost
Capital cost estimates of various widths of conveyor belts are shown in Table 11.
These costs are probably representative of conveyors constructed in southern areas where
problems associated with cold temperatures are minimal.
Total capital and operating cost of be1 t conveyors vary from $ .02 to $. 07 per ton
mile, depending on the amount of material transported and the annual operating time
(Maddex, 1971).
SHIPPING
For the movement of large amounts of coal from the N0rl.h Slope of Alaska, stock-
piling and handling at both Japan and the northwest coast of Alaska would be minimal i f
year round shipping could be achieved. However, the problems of year round shipping to
northwestern Alaska may become paramount over the alternative extra stockpiling and handl-
ing problems. To date, there has been no successful navigation north of the Bering Strait in
winter, even by icebreakers (Lyons, 1972). Alternatives to year round shipping exist, but
these may be less satisfactory to the supplier und receiver. Some of the possible alternatives
are:
I) Shipment of al l the coal to Japan during the ice free season. This alternative may
have a negative effect on the marketability of the coal. Large stockpile areas would be re-
38

Table II
Belt width (inches)
Belt Conveyor Costs (short distance on1 y )
Idlers Be1 ting S ~ P P * 4 & \ O f t . I000 ft. Frame and spacing $ per Iin.ft. Decking $ per lin.ft. $ per lin.ft.
Installc~tion and Training
$ per ft.
Total installed $ per ft.
Source - Maddex, P. J. and W. F . Haddon (1971)

quired in both Alaska and Japan. Assembl ing enough ships for the short season and arrang-
ing haul contracts for the remainder of the year for supplier owned ships may be difficult.
2) Shipment of the coal to a transhipment point during the ice-free season, then
from this point to Japan for the remainder of the year. This alternative requires the dupli-
cation of harbors and an increase in the ship loading and unloading costs, however, ships
could be employed year round and Japan would have a more consistent coal delivery.
3) Same as No. 2 except coal would be delivered simultaneously to Japan and the
transhipment point during the ice-free season, Japan would then have a consistent coal
delivery throughout the year. A possible problem of alternatives 2 and 3 may be the in-
equality in the number of ships required between the ice-free season and the remainder of
the year. The difficulty of arranging hauling contracts or leasing ships may occur, but to a
much lesser extent than in alternative No. 1 . 4) Extension of the shipping season: A renewed emphasis has been placed on arctic
shipping as a result of the successful voyage of the 108,000 ton dwt . ice-breaking tanker,
"Manhattan ", through the Northwest Passage in September of 1969. This voyage proved
that the technology exists to build ice-breaking carriers and that winter shipping by this
method i s operationally feasible. It may be a few years before i t can be determined i f
winter shipping through ice i s economically feasible.
The first consideration for winter shipping i s probably the capital cost of the ships.
German (1971) estimates the incremental cost of an icebreaking carrier to be 40 per cent
over the cost of a conventional vessel of the same size. This incremental cost i s for ice
conditions which might be comparable to the first year ice which would be encountered on
the northwest coast of Alaska north of the Bering Strait. The next consideration would be
additional operating costs. Insurance costs would be very high at least for the first few
years of winter shipping. Ice-breaking ships would encounter pressure ridges that can be up
to 20 feet in height and five times as deep beneath the water. An aerial reconnaissance of
the Bering Strait was made in May of 1968 by the U. S. Coast Guard (Polar Transportation
Requirements, 1968) to view the area in terms of sea transport. One of the conclusions
made from this study was that, "travel through the Bering Strait in the event of closed leads
i s impossible without passing through pressure ridges. " The ship must be able to pass through
these ridges without stopping, or trcwel time would be excessive. German (1971) gave a
hypothetical example where a ship had to stop and ram an ice ridge once every 20 miles,
then regain its travelling speed of 8 knots through the ice. The result was an increase in
the voyage time of 54 per cent. 40

Another consideration is the extent of ice-breaker support that would be required
for winter shipping. A Coast Guard study (Polar Transportation Requirements) estimated
the user cost of such an ice-breaker would be $22,500 per day.
Terminal facilities in the arctic require special innovations. Underwater pipelines
would be exposed to ice gouging. Bubbling systems for piers and wharves have been tested
in Tuktoyaktuk on the arctic coast of Canada (Inee, 1963) and in Thule, Greenland (Dehn,
1972). These bubblers worked effectively against ice formation; however, Dehn (1972)
observed that when a wind blew in the wrong direction, the ice was pushed up against the
wharf. This phenomenon can also occur in an open channel broken by an icebreaker. A
wind con shift the sea ice together and close the channel completely.
The Soviet policy at present i s to use icebreakers to serve locations in northern
Siberia for I 4 months, thus extending the shipping season frun 2 4 months to 4 months
(Armstrong, 1970). Up to the present time, no ship greater than 10,000 tons dwt. appears
to have been used for the Northern Sea Route. The shallow waters of the continental shelf
in this area would present difficulties to larger ships.
The cost of shipping North Slope coal in ice conditions was not developed in this
study. It is the opinion of the author that winter shipping in this area has potential, but
that cost estimates of this shipping could only be made properly after more information on
the ice conditions becomes available, and a feasible harbor design has been developed.
In the analyses in the following chapter, 100,000 ton dwt. ships were used for the
computation of shipping costs. This size of ship was selected as a trade-off between econ-
omy of scale (Figure 12) and the draft of the vessel (Figure 13). The draft of the ship i s an
important consideration due to the shallow waters along the northwestern coast of Alaska.
The ocean freight rates for coal from the east coast of the United States to Japan
vary from $3.70 to $4.50 per ton for single trips (International Coal Trade, 1972). Single
or spot trips w i l l generally be higher than for long term contracts. Cunningham (1972) esti-
mates the cost of shipping coal from Vancouver to Japan ranges from a low of $2.25 per ton
for 100,000 ton dwt. ships to a high of $3.25 per ton for 50,000 ton dwt. ships.
Barging
Tug and barge combinations for the movement of bulk materials have traditionally
been confined to inland waterways and coastal areas. I t has only been in the last few years
that ocean barge developments have become significant. The main reason for the relatively
slow progress in tug-barge ocean application was the difficulty in developing a method of
41

3 -
5 C
L
m
a + r 2 0 U w C - 0 a - x
" I * Z - + - 0:
0 J
40 60 80 I00
D W T ( 1000 t o n s )
F IGURE 12 Ship O p e r a t i n g C o s t us Ship S i z e
s o u r c e W o u p h (1971 S a s a d i ( 1 9 7 2 )
8 6
C: Z ss - r r 0 C
46 e m .-
26 10 100 19 0 280
D W T (1000 t o n s ) F I G U R E 13
Ship D r a f t vs S h i p Size S o u r c e - K o i s c h ( 1 9 I )
coupling the tug and barge together.
Barges up to 30,000 tons dwt, are presently being used in the Gulf of Mexico for
the shipment of bulk commodities between ports in Florida and Texas.
The use of a trans-ocean tug barge system for the movement of coal from northern
Alaska has a n u d e r of advantages over self propel led ships.
I) Crew - Tugs require smaller crew than ships:approximately I0-12versus 40 or
more for ships.
2) Terminals - A tug-barge system can operate in much shallower waters than a
ship, consequently, less elaborate harbor facilities are required.
3) Util itation - With the use of extra barges, loading and unloading can be accom-
plished when the tug i s not in port. The only tug port time required would be the
time required to change one barge for another.
There are two major disadvantages of tug-barge transport. Tug-barge combinations
have a relatively slow cruising speed so the turnaround time i s higher than that of a ship.
Secondly, tugs are restricted to the ice free season.
The capital costs of tugs and barges are lower than ships mainly because of their
relatively simple design. This advantage may be partly offset by the higher insurance costs
ctssociated by tug-barge transport. Insurance costs for barges in Alaska are among the high-
est in the world (Parker, 1972).
In the analyses in the following chapter, 60,000 ton dwt. barges were used to com-
pute the shipping costs, There are no barges of this size presently being utilized, but i t i s
anticipated that technological developments wi l l make construction and operation possible
in the near future.
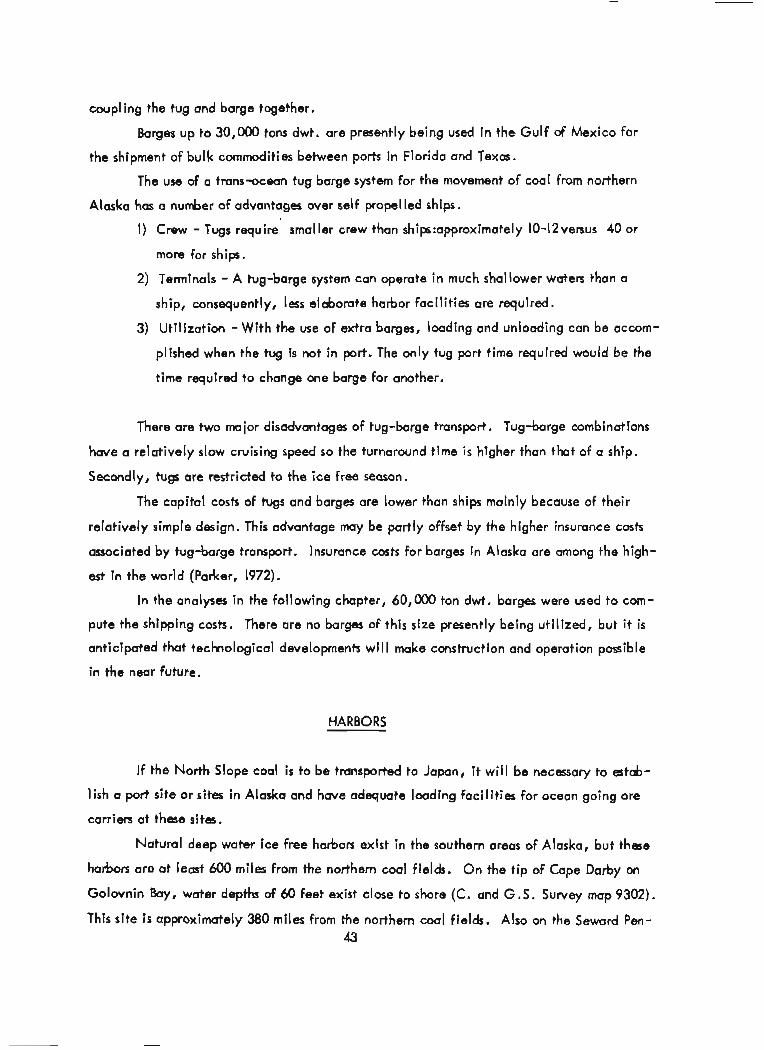
HARBORS
If the North Slope coal i s to be transported to Japan, it wi l l be necessary to estab-
lish a port site or sites in Alaska and have adequate loading facilities for ocean going ore
carriers at these sites,
Natural deep water ice free harbors exist in the southern areas of Alaska, but these
harbors are at least 600 miles from the northern coal fields. On the tip of Cape Darby on
Golovnin Bay, water depths of 60 feet exist close to shore (C. and G ,S. Survey map 9302).
This site i s approximately 380 miles from the northern coal fields. Also on the Seward Pen- 43

insula i s the natural harbor of Port Clarence, which i s between 40 and 45 feet deep. Port
Clarence has a good potential for harbor development, but would require dredging i f large
ocean vessels were to be used. Its usefulness to the nor+hem coal deposits i s again limited
by the distance between the coal and the harbor. As previously noted in Chapter II, no
natural harbor exists in Alaska north of Port Clarence.
A potential site for the construction of an artificial harbor close to the coal i s at
the mouth of Ogortoruk Creek, south of Cape Thompson. At this site, the shoreline is
fairly flat, and the sixty fmt water depth i s closer to shore than at most points on the north-
west coast. This potential harbor site was used in the analysis of several trans portation
systems in Chapter IV.
The information available on the seabottom of the Northwest coast indicates that
bedrock i s at or near the surface of the sea floor. The general cost of removing overburden
(sediments) from the seafloor is from $0,40 to $2.50 per cubic yard, while the cost of
blasting and removing rock from the sea floor normally ranges from $15.00 to $25.00 per
cubic yard (Koisch, 19A). An excavation close to shore and a channel to this excavation
large enough for large ore carriers would require the removal of approximately 10,000,000
cubic yards of material. One estimate of a deepwater Arctic Port was 500 million dollars
(Moreau, 1970). A nuclear device was considered for the excavation of an artificial har-
bor at the mouth of Ogotoruk Creek. However, the ecological consequences of this dstona-
tion were determined to be long lasting, and the projected movement of materials through
the harbor was not sufficient to warrant the expenditures required for its construction. At
the present time, a plan such as this would have considerably more opposition. It would
probably have to be a national emergency before such a method could be employed.
I t i s doubtful that the exploitation of coal deposits alone could carry the economic
burden of the construction of an artificial harbor by conventional methods.
The exclusion of an artificial harbor as an alternative does not necessarily rule out
shiploading i n this area. Other methods presently in use in other areas are:
I) Structural steel, concrete, or earth fil led piers to deeper water.
2) An artificial island in deep water to act as base for smaller lighter craft from
shore.
3) A slurry pipeline from shore to a moored vessel in deep water.
4) The use of lighter craft to a moored ship and loading to the large vessel in open
water.

Piers - The northwest coast of Alaska i s an area of extreme ice activity. While i t may be
possible to design and construct steel and/or concrete piers to withstand the ice pressures,
this wi l l be accomplished only after intensive experimentation. Such piers do exist in
southern areas, but the ice problem in these areas is either minimal or non-existent.
An eat-bh fil led pier three miles long would not be without serious problems, such
as wave and ice erosion and perhaps movement by the ice. However, this type of construc-
tion would probably be able to cope with the ice pressures more easily than other types.
An earth and gravel fil led pier about one mile long has been designed for a fluorite mine
near Port Clarence, where winter ice conditions are a major design factor. The projected
cost of this pier i s between 10 and 15 million dollars (Sheardown, 1972). The design and
c a t of an earth and gravel fil led pier in the Cape Thompson area are contained in
Appendix C.
Artificial Island
An artificial island in deep water would require large amounts of f i l l material.
This f i l l material could either be transported from shore or seabottom by pipeline, or by
barge from shore. This island would also be vulnerable to wave and ice erosion.
A 50 acre artificial island, connected to shore by a three mile long causeway has
been constructed in Vancouver, B.C., for the rnovemed of coal from Japan (Singhal,
1971). Preliminary designs have been made for a 300 acre island three to four miles from
shore in the Delaware Bay area for the stockpiling and loading of coal and iron ore
("Zapata Plans---", 1971). In the Beaufort Sea, a two acre island has been constructed
for an oil dri l l site ("Imperial Beaufort---", 1972). Although this island has not yet been
subject to ice pressures, i t withstood severe storms without a significant loss of material
(Imperial's Man---, 1972).
A main objection to an artificial island, other than the high initial cost might be
the additional handling and equipment required for the lighter craft required to convey the
coal from the shore to the island.
Slurry Loading
Slurry Loading is a system which has evolved over the last few years and has opera-
ted successfully for iron ore as well as other mineral ores.
A slurry loading system usually consists of a large slurry pond on shore from which
45

the slurried material i s drawn by a floating suction dredge, then pumped to the ship off-
shore by a moored floating pump. The obvious advantage to this system i s that neither a
harbor nor a pier i s required.
I t may be possible that a slurry pipeline loading system could be applied to the
transportation of North Slope coal. The design of this system would have to include the
following considerations:
I) Coal has a specific gravity of 1.5, iron ore has a specific gravity of approxima-
tely 5.2, consequently a much higher settling rate. In order to minimize a ship-
loading time, the unsettled decanted coal fines would have to be returned to a
settling pond on shore by another pipeline, then recovered when shiploading i s
not in progress. This means the additional expense of another pipeline and
another settling pond.
2) Ice gouging of the seafloor may damage the pipelines i f they were left submerged
on the ocean bottom for winter months, but summer storms would probably pre-
clude a floating pipeline.
3) Slurry ponds would freeze to a depth of six feet in the winter months, hence
either continued agitation of the pond or dry storage of the coal would be re-
quired i f an extension of the shipping season were contemplated.
A cost estimate of a proposed coal slurry loading system on the Northwest Coast of
Alaska i s outlined in Appendix F,
Lighter Craft
Lighter craft are presently used for unloading cargo and yearly supplies at most
coastal villages in Northwestern Alaska, For the movement of large amounts of coal,
lightering i s not practical because of the ship wailing time required, and because of the
problems of transferring the coal from the barge to the ship. The waiting problem may be
overcome by mooring a number of fil led barges in deep water to anticipate the arrival of
the ship, however, transfer of the coal would still remain a problem.
In summary~an efficient shiploading system at a harbor close to the coal deposits i s
a necessity i f the north slope coal i s to be transported economically.
Several harbor designs have been considered. The two most practical designs ap-
pear to be the earth and gravel pier and slurry loading (See Fig. 14). These are the only
two.designs used i n the cost analyses of Chapter IV. Both designs could be applicable to 46

S l u r r y L o a d i n g - not t o scale
R o c k a n d G r a v e l F i l l e d Pier - n o t t o sca l e
P r e v a i l i n g w i n d
F I G U R E 14 P O S S I B L E S H I P L O A D I N G M E T H O D S

most areas on the northwestern coast although the eat+h fil led pier would have a length and
economic I imitation.
COAL GASIFICATION
Introduction
Manufactured gas from coal or coke i s not a new concept. Coal gas was used before
oi l well drilling was developed in Pennsylvania in 1886.
Producer gas and coke oven gas were of considerable importance to industry in the
past. Producer gas is made by blowing air or air and steam through an incadescent fuel bed.
Producer gas from coke contains several percent methane, some hydrogen, nitrogen, carbon
monoxide and carbon dioxide. I t has a heating value as high as 180 BTU per cubic foot
(Battelle, 1950). Producer gas from coal contains l i t t le or no methane and less hydrogen than
coke producer gas, consequently, i t has a lower heating value. Coke oven gas i s the gas re-
leased from bituminous coal during the manufacture of coke. This gas has a heating value of
approximately 600 B . T. U. per cubic foot.
In 1926, there were 11,000 manufacturers of producer gas, but when natural gas be-
came available at low cost, producer gas manufacture was eliminated.
Renewed interest in the gasification of coal has resulted from projected shortages of
natural gas within the next decade. In July 4, 1971, the President's message announced a
major new initiative in cool gasification. Under a joint government-industry program, ex-
penditures into coal gasification research would be $30 million per year.
Important considerations which resulted in this expanded program were summarized
in a hearing before the Committee on Interior and Insular Affairs on July 27-28, 1971.
I. Natural gas i s the least polluting of the fossil fuels.
2. Natural gas can be produced and transported with less environmental de- gradation than other fuels.
3. For three consecutive years, the amount of gas consumed in the U. S. exceeded new supplies found in the contiguous forty-eight states.
4. Projections of future gas demand are such that every new supply source must be developed, including natural gas by pipeline, importation of liquified natural gas from overseas sources and the gasification d coal.
5. I t i s important to provide the cleanest fuel to the American consumer using resources that can be produced by American mines and which are secure from the vagaries of foreign suppliers .

Existing Technology
A number of processes can be employed to gasify coal. Most of these processes
consist of three stages. The first stage consists of the oxidation of the carbon with steam,
producing a hydrogen rich gas.
The second stage consists of the removal of sulfur and other impurities. At the end
of the second stage, the resultant gas i s a producer gas which has a heating value of about
160B.T.U. per cubic foot.
The third stage consists of conversion of the low B.T.U. gas to a high methane con-
tent, high B.T.U. gas (950-1000 B.T.U. per cubic foot).
After moisture removal, this gas i s considered pipeline quality gas and i s very
similar in chemical and physical properties to natural gas.
At present, there are no operating commercial plants manufacturing gas from coal.
Pilot plants exist in Homer City, Pa., Chicago, II I., and Rapid City, South Dakota. Each
plant employs a different method for converting coal to gas. Plans have been revealed for
the construction of two commercial plants in southwestern U.S. for the production of syn-
thetic natural gas from coal (Levene, 1972).
Demand
The U.S. gas supply balance i s shown in Figure 15.
As previously noted, the greatest advantage of natural gas i s its clean burning
characteristics. Other energy sources listed below have inherent disadvantages or limita-
tions that may restrict their use in the future.
Coal. The greatest disadvantage of burning coal directly i s the resultant air pol- - lution from sulfur, f ly ash and nitrous oxides.
Nuclear Power. It i s anticipated that 10 per cent of the nation's power wil l be
provided by nuclear energy by 1980 and 23 per cent by 1990.
Oil. By 1985, 50 per cent of the nation's oil requirements wi l l be imports from - other countries.
Hydropower. Most of the sources of hydropower are being utilized.

7
60 50
40 4 0
- r 30 m
30 C
C) - a
20 20
e 0 - - '; 10 C
10
0 0 1966 1970 197 5 1980 1985 ISSO
I U n s o t i s f ~ e d demand
2 Gas f rom c o o l
3 G a r f r o m A l a s k a
4 LNG i m p o r t s
3 N e t p i p e l i n e ~ m p o r t r
6 Production f r o m potent ia l n a t u r a l g o s reserves
7 P r o d u c t i o n f r o m 1 9 7 0 r e s e r v e s
F I G U R E 15 U . S . G A S S U P P L Y - D E M A N D
S o u r c m - L e v r n e ( 1 9 7 2 )

Others. Geothermal sources are not expected to contribute to the nation's
energy needs for years to come. Solar energy, tidal energy and other variable sources are
limited by the lack of developed technology on the storage of such energy.
Economics
The cost of natural gas at present is approximately 3 q to 3 5 ~ per thousand cubic
feet or 2 7 ~ to 3 2 ~ per million B.T. U. and i s increasing with increased demand.
A feasibility study performed in 1967 by Consolidated Coal Company for the Office
of Cool Reseurch estimated the cost of a high B.T.U. synthetic gas from coal would cost
8.397 per million B.T. U. This study was based on a 250 mil lion cubic foot per day plant
production and a coal cost of $1.50 per ton. Costs are broken down as follows:
million B.T.U.
Lignite cost 16.9
Direct processing 12.6
Capital charges 10.2
Total 39.7
Another study performed by the Institute of Gas Technology for the Office of Coal
Research estimated a cost of 46.6~ per million B.T.U. based on a production of 250 million
cubic feet per day and a bituminous coal cost of $3.00 per ton.
Gasification of North Slope Coal
The maior part of the North Slope coal is sub-bituminous and non-coking. I t i s
unlikely that much of this low rank coal would be transported for use as steam coal because
of its low value and distance to large consumers of power. If this coal were to be used to
any large extent, i t wi l l probably be converted to another higher value product at or near
the mining site.
The recent discovery of oi l and natural gas at Prudhoe Bay has resulted in investi-
gatiotx into the design of a natural gas pipeline. This pipeline i s reported to be designed
for a daily capacity of three billion cubic feet of natural gas ('In the 'Greatt---", 1971).
The cost of the pipeline wi l l be about five billion dollars. This high construction cost wi l l
result in high gas costs to the consumer, high enough to compare with the cost of synthetic
gas ("Northwest Project---", 1972).
The construction of the gas pipeline may become an important factor in the econo-
5 1

mics of developing the North Slope coal reserves. I t may be possible that the coal could
be gasified at the mine site, then transported to the existing pipeline by a smaller pipeline.
The synthetic gas produced from North Slope coal would have to compete with gas
produced from the large coal reserves in the lower western states, which are accessible to
existing natural gas pipeline networks. However, i t may be possible that gas production
could exist in both areas. At the present lime, i t appears that coal gasification wi l l be
the only way that the lower grades of the North Slope coal can become a significant energy
source.

CHAPTER IV
TRANSPORTATION SYSTEMS
This chapter contains the results of cost analyses performed on five separate sys-
tems used for transporting coal from the North Slope of Alaska to Japan (See Fig. 16).
Each of these systems consists of three stages: each stage i s treated as a single
entity. In most cases, the cost estimate of each stage was performed in three steps: design
of the transportation mode, division of each mode into its basic elements, and summation of
the costs of these elements. I f i t was not feasible to break a transportation mode into basic
elements, costs were derived from pub1 ished information on existing systems and adapted to
the situation with the use of cost indexes and cost capacity factors. There are several in-
stances where portions of the systems involved designs or methods which have not been
proven technically feasible. In these cases, the author assumed that i t is likely they would
be proven feasible when such a system i s required. Also, since the designs of the transpor-
tation modes were used only to facilitate cost estimates, some generalizations were made
that otherwise may have to be proven experimentally i f the mode were designed for actual
use.
The cost of transportation was computed under the assumption that the coal pro-
ducer would bear the total cost of the system. Government sponsorship or additional reve-
nue from other agencies using the transportation system was calculated in the costs in only
one case. Al l total system transportation costs were F. 0. B. Yokohama, Japan.
The capital costs of construction and equipment were converted to annual costs
based on a 20 year operating period and a 15 per cent rate of return. Twenty years was
selected because large capital expenditures in a transportation system would be made only
i f a long term agreement was made between the supplier and purchaser, especially if this
system i s exclusive to coal. A fifteen per cent rate of return was used because this i s con-
sidered the minimum rate which wil l attract large investments to these coal deposits.

I I S sys tem I
I 0 100 200 - S c a l e m i l a s
/ 0
0
I 0 # _#ddC
------'--
F I G U R E 16
C O A L TRANSPORTATION S Y S T E M S
i

SYSTEM I
System I consists of a railway which connects a mining area on the eastern portion
of the northern coal deposits to the port of Seward on the southern coast of Alaska. This
system requires the construction of a 492 mile railroad from the existing Alaska Railroad at
Nenana to the coal deposits, and the construction of coal handling facilities at Seward.
In this analysis, i t i s assumed that the Alaska Railroad could bear the additional traffic
without significant modification.
Unit trains transporf. the coal directly from the northern coal fields to Seward with-
out any handling or excess waiting time between the source and destination. Coal is un-
loaded at Seward, stockpiled, then loaded onto 100,000 ton deadweight ore carriers for
year round conveyance to Japan.
Table 12 i s a summary of the cost analyses of this system. The analysis and cri-
teria used are contained in Appendix A. Figure 17 i s a graphical illustration of the trans-
portation costs of System I.
The total transportation cost to move coal by System I varies from $21.02 per ton
for 15,000,000 tons per year to $46.82 per ton for 5,000,000 tons per year. The rail
transportation cost is from 80 to 90 percent of the total transportation cost.
If the coal deposit must support the construction of a 492 mile long railroad, then
the transportation costs alone are prohibitively high to allow an economically feasible opara-
tion. Figure 17 shows that an increase in the number of tons of coal transported over 15
million tons per year does not lower the transportation cost per ton significantly.

Table 12
System I - Annual Costs in Thousands of Dollars Railway from North Slope Coal Deposits to Seward, Dry Loading,
Shipment to Japan by 100,000 ton dwt. Ore Carriers
Tons Transported Annual I (million$
5
10
15
Total System
Cost
233,395
274,106
315,826
s
Tons Transported
Annually (millions)
5
10
15 L
Total System
Cost Per Ton
(dol I an)
46.82
27.41
21.02
Shipping
Percent of Transportation Cost
Total Cost
18,069
36,139
54,208
Rai I
90.5
84.4
80.0
Cost Per Ton
(do1 lars)
3.61
3.61
3.61
Rail Harbor
Total Cost
210,763
231,104
252,505
Harbor
1.9
2.5
Total Cost
4,563
6,863
9,113
Cost Per Ton
(do1 lars)
42.30
23.20
16.80
Shipping
7.6
13.1
Cost Per Ton
(do! lars)
-91
-69
.6 1
2.9 I 17.1

F I G U R E 17
COAL TRANSPORTATION COST- S Y S f EM 1
P-
50.00 '
40.00 - C 0 I-
L
m
-30 00- * UI 0 0
c 0 ~ 2 0 . 0 0 - o t L
O 0 UI . C 0 L
I- 10.00-
0
I
2
I - T o t o l t r a n s p o r t a t i o n c o s t
2 - R a i l t r a n s p o r t a t i o n c o s t
3 -- S h i p p i n g c o s t 4 .. . S h i p l o o d i n g c o s t
3 - 3 -------- - ----------- 4 . -- . . . . . . . . . . . . . . . . . -- . . . . . . . . - . . . . ......
1 I 1
0 5 10 15
Tons o f C o a l T r a n s p o r t e d p e r Y e a r ( m i l l i o n s )

SYSTEM II
This transportation system proposes the use of the road that i s to be constructed
from Fairbanks to Prudhoe Bay. The coal deposits are reached by travelling 500 miles from
Fairbanks on this road, and 100 miles on a secondary road which would be constructed.
These two roads supply a linkage to the Alaska Railroad at Fairbanks where the coal i s
loaded into railway cars and shipped to Seward for futherance to Japan. Since State road
weight limitations restricts the use of trucks greater than approximately 25 tons net capa-
city, 25 ton trucks are used in this analysis.
Annual costs, which are outlined fully in Appendix B were computed only for the
transportation costs incurred from the coal fields to Fairbanks.
The cost of ownership and operation of the trucks i s a direct function of the tons
transported, therefore, i f more coal was moved, the annual truck costs would increase
accordingly. Consequently, the annual truck cost per ton of coal cannot go below $29.63
On the other hand, i f the tonnage transported per year was less than 5,000,000 tons, the
road costs would become more significant and the cost per ton of coal transported would
Increase.
Table 13 is a summary of the coal transportation costs using System II.
To move 5,000,000 tons of coal per year by truck from the North Slope to Fair-
banks, i t costs $32.69 per ton of coal of which $29.63 per ton i s the cost of owning and
operating a fleet of trucks. As in System I, this transportation cost i s too high to allow an
economically feasible operation. The high cost of truck transportation in this System pre-
eluded any further investigation into railway costs from Fairbanks to Seward.

Table 13
System I I
Truck Transportation from Northern Coal Fields to Fairbanks
5,000,000 tons per year
Annual Cost
Capital Cost of Trucks
Operation and Maintenance of Trucks
Road Cosb (Capital and Maintenance)
Loading and Unloading (Capital, Operating, and Maintenance)
Total Annual Costs
Total Annual Cost per ton = $32.69
Total Annual Truck Cost per ton = 29.63

SYSTEM Ill
System II I involves the movement of coal by an overland system 350 days per year
to a harbor near Cape Thompson on the Chukchi Sea. During the ice free season, the stock-
piled coal at this port i s shipped simultaneously to Japan and to on ice free transhipment
port at Dutch,Harbor in the Aleution Islands. The purpose of the simultaneous shipment i s
to maintain a consistent delivery schedule to Japan. The coal shipped to Dutch Harbor i s
stockpiled until the ice begins to form at the Chukchi Sea port. At this time, the coal
stockpiled at Dutch Harbor i s shipped to Japan.
Three types of overland systems were considered in this analysis: railroad, slurry
pipeline and be1 t conveyon. Two types of shiplooding techniques were also considered:
dry loading and slurry loading,
In this system, no definite mining site was established. Instead, costs were com-
puted as a function of the overland distance from the coal source to an ocean port.
In the analysis performed for slurry pipelines, the costs of a secondary smaller
pipeline was added to the total cost. Because of the scarcity of an inland winter supply
of water in this region, feed water would either have to be recirculated or transported from
a large lake or the ocean in order to operate a slurry pipeline year round.
In order to use slurry loading for ship loading, two ponds would have to be con-
structed on shore, one for the actual loading of the coal to the ship and the second as a
settling pond for the fine suspended material decanted from the ship.
Tables 14-19 are the summaries of cost analyses performed for System Ill. Figure 18
i s a graphical illustration of thee results. Cost computations and criteria are outlined in
Appendices C, D, E, and F.
For the movement of 5,000,000 tons of coal per year, railroad i s the most expen-
sive form of overland transportation, belt conveyor i s the next most expensive and slurry
pipeline, the least expensive. At 15,000,000 tons per year, railroad, belt conveyor, and
slurry pipeline transportation costs are very simi lar.
Overland transportation costs range from a low of $1.35 per ton for 50 miles for
15,000,000 tons to a high of $15.00 per ton for 200 miles for 5,000,000 tons per year,
Slurry loading costs are approximately 50 per cent less expensive than dry loading
costs. A significant part of the dry loading cost is the capital cost of a harbor on the shallow
coast of the Chukchi Sea.
The cost of ocean shipping, which includes the conveyance of the coal to a trans-
shipment point and furtherance to Japan i s $3.57 per ton. 60

Given the total transportation cost to Japan cannot exceed $10.00 to be econo-
mically feasible, then the maximum overland distance in which the coal can be transported
can be determined in Figures 18 a, b, and c. For a railroad, this distance ranges from 45
miles to 200 miles depending on the number of tons transported annually . For a slurry pipe-
line, the distance i s from 80 miles to 200 miles and for a conveyor, it i s from 70 miles to
200 miles.
The slurry lad ing costs for System Ill are the same regardless of the transportation
mode from mine to port. This wculd be true i f the coal was stored at the port site in the
dry state. Some savings would occur in a slurry loading operation directly connected to an
overland slurry pipeline. This savings would be relatively small and probably would not
change economic relationship of the different systems.

Table 14
System I II - Annual Costs i n Thousands of Do! I a n Railway from Coal Deposits to a Port near Cape Thompson, Dry Loading,
Shipment to Japan v ia a Transhipment Point at Dutch Harbor by 100,000 ton dwt. Ore Ships
Total
System Cost
Per Ton (do1 Ian)
10.61
1 4.39
21.63
7.63
9.65
13.66
6.58
7.97
10.84
Total
System C a t
53,076
71,940
108,141
76,315
96,455
136,649
98,870
119,634
162,631
Tons Trcmsporfed
Annually (mi l l ions)
5
Shipping
Total Cost
17,871
17,871
17.871
Dry Loading
Total Cost
15,288
15,288
15,288
10
15
Cost Per Ton (do1 tan)
3.57
3.57
3.57
Cost PerTon
(do1 Ian)
3.06
3.06
3.06
Rail
Cost Per Ton (do! lars)
3.98
7.76
15.00
R~~~ (miles)
50
100
200
35,657 1.89
1.89
1.89
1.47
1.47
1.47
Total Cost
19,917
38,781
74,982
3.57 50
100
200
21,718
41,858
82,052
2.17
4.19
8.20
35,657
35,657
50
100
200
18,940
18,940
18,940
3.57
3.57
53,613
53,613
53,613
22,036
22,036
23,221
43,985
3 . 9
3.57
3.57
I .54
2.93
86,982 5.80 22,036

8 F W . d l ; $
m cu % 5 9 ~ 0 - 4 * z 2
R G G & A &
c c z S ? ? . ~ ~ l l m W m "
- - - P O *
x z x ? ? % c o o
a a z , - N V)
- m a
q g . : 8 1 %
i ? g E
rr) -
2 R (E G c d S
" " F X q % S ; & R
7
~ q a m m m
k h b * O , * O , * Q , W O W m m m
8 - - -
s s s N.w .m. o o o - - - " ~ a F l - W
N
[ % a E q g
E 8 8 - cu
0 -
8 O . O3 $! E
gI9 - O*. -. f s g
~ + = R R B ' & A 4
11 11 - h h h
? ? g o , h h h - - -
a a a g ' = N N N ' - - -
z z z ? ? ? a + a
s - z g z s . rn h 2
h - C u - 0 3 m O*. hc 9 E I X
S g g
- g t - ~ ^ E 0 $2: + u , =
a, 0 0-z
- E +; 5 +
0) c .- Q Q .- r *
UJ . w 8 J
2
- .,
(nXu
5 - z
2s
- 2 % 2 8
' 0 u z g
- * 2 8 2"
%I-= u bz ez
g 5 + w
h
8 .- r= 2 5
8 -7 ; ..- 8.3- g , c ; = C C E
+ 2 4 - b

Table 16
System I t l - Annual Costs in Thousands of Dollars Slurry Pipeline from Coal Deposits to a Port near Cape Thompson, Dry Loading
Shipment to Japan via a Transhipment Point at Dutch Harbor by 100,000 ton dwt. Ore Ships
Total System
Cost Per Ton
(do1 lars)
9.04
10.61
13.74
7.44
8.74
11 -32
6.94
8.22
10.79
Tons
Annually (millions)
Total System
Cost
Shipping Dry Loading
Total Coat
Total Cost
Slurry Pipeline
Cost Per Ton
(do l !an)
Cost Per Ton (do l ta n)
5
15,288
15,288
15,288
18,940
1 8,940
18,940
Cost Per Ton (do1 Ian)
. P i p 1 ine (miles)
50
100
200
12,064 2.41
~ o t a l Cost
3.57
3.57
3.57
3 . 9
3.57
3 . P
3.57
19,891
35,553
3.06
3.06
3.06
1.89
1.89
1.89
45,223
53,050
68,712
74,410
87,347
113,221
: 104,123
3.98
7.11
1.98
3.28
5.86
17,871
17,871
17,871
35,657
35,657
35,657
19,813
32,750
58,624
50
53,613
10
22,036
3.57
3.57
100
200
15
t
1.47
123,387
161,914
50
100
200
22,036
22,036
28,474
47,738
86,255
1-90
3.18
5.75
1.47
1.47
53,613
53,613

1 3 R . d i d - C ba 7
4 h ' g - E n
~ p 6 $ O u r O C -
k- XU L- rn m a
LZL I
4 h OD - -
- 2 - 5 E 2 $u
C V
Cn C L .- 2 .- x V)
UJ .- u 0" J
P 3 - v,
al c .- - P) " 2 2
h h h "! "! '? m m m
- - - h h h m , % m , b b k
.o .o 9 CY CY CV
2 - -
S S S % % m "c ,. 9 2
6 3 ~ ~ : 4 m h'
2 6 ; $ 6 5
" " E g -
rr)
* c ? $ 2 u ; 2
n ,,
- u c % 8 '-u
C "3 5 -
U & , o L -
- 0 %
2s
0 " 2 s
- g s I-u
w - .e G - - a a -- E
EL-
-5: ,.% t- c ,- 97s : 2 c z
!2<g +
s a q M M ~
h h r r ) l r ) r r )
Y ' ? . o , rr) rr) 3 m w
3 8 s - - -
-!. cv* ?!. , a , 7 - -
2 3 - m u;
" 8 3 a h 9
$ $ $
2
F" C
c i c a m m m
? % S m m m r r ) m r r )
- 7 -
? S O :
; = I x x 9 , 9 % M m m 7 - 7
2 2 2 m w
- 4 - o O r r )
a n q 03C h* m * O D
8 8 : -
'0 7
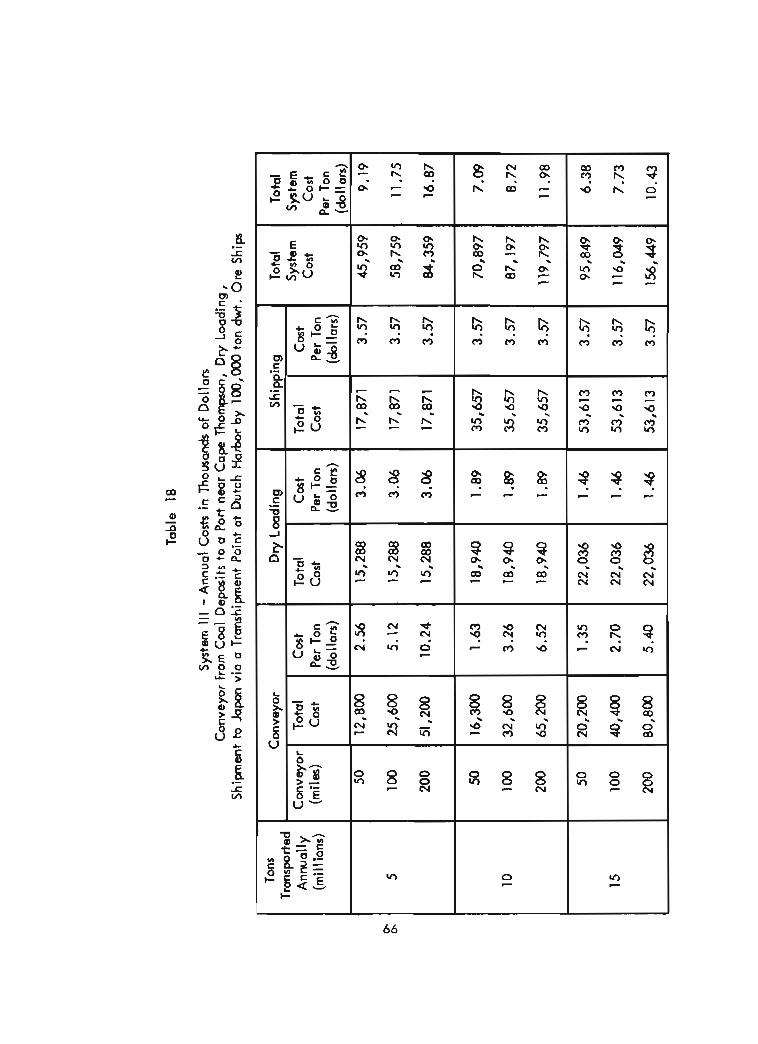
- c r y - g ~ n o o L o + =
$ 2 ~ $ 8 n-
E - 0 2 % & r n O 2 cnXu
* h a q - - - OI 0.
g m r r , S " , ? 3 : a
h h h ? Y V! m n C 3
- - F -
h h h O D , ? ? h h h - - -
6 z g a g . 9 m m m
W C Q O O w w Q1 "! w. w. r r ) r r ) m - - -
q N ; N l r ) O - 8 8 8 ? 2 y ~3~
c .- P Q .- z m
rn
% 8 d * C3
0" E u
+_a "$3
- 0 - - $ 2 u
+-= u i g
- e % 2 6
s - z 5 +-" u $ 5 = z
- 9 3
6'
% ? ? L a p - - 0 . 0 . 0 7 . 4 e & - 7
0.
q q q m m m
h
"3 ? . . 3 z 2
0 1 0 . 0 . " ? ' ? C 9 - - -
% % S '? 9 9 z E z
q N g q - - m a
8 8 8 9, Y $ 2 3
'0
! R 3 * h ' d -
% 3 0 m 2 P ; d - -
q a c ; m 0 M
-
m m m - - - c o d a L,,
g q s - - -
8 8 % 9 9 9 N N N (V N w
q g 9 - m u ,
8 s 8 l-!. S "D, a 3 8
8 8 8 - '3
0 -
Ir) 0 - R v -
0 0 0
m - 0 27
m t x g3- 0 g n '=
f < & C
W

Table 19
System I l l - Annual Cosfs in Thousands of Dollars Conveyor from Coal Deposits to a Port near Cape Thompson, Slurry Loading,
Shipment to Japan via a Transhipment Point at Dutch Harbor by 100,000 ton dwt. Ore Ships
Total System Cost
Per Ton (dollars)
7.39
9.95
15.07
6.22
7.85
11.17 d
5.83
7.16
9.86
Total System
Cost
36,985
Tons Transported Annually (mil lions)
Shipping
5
10
Total Cost
17,871
Slurry Loading
Total I Cost Cost Per Ton (dollan)
3.57
Conveyor
Cost
6,314
6,3 14
6,314
10,240
Per Ton (dollars)
1.26
Cost Per Ton (do l 1 an)
2.56
5.12
10.24
1.63
3.26
'
Conveyor (miles)
50
100
200
50
100
6.52
1.35
2.70
Total Cost
12,800
25,600
51,200
16,300
32,600
49,785
76,071
65,200
20,200
40,400
10,240
3.57
3.57
1.26
1.26
15
17,871
17,871
3.57
3.57 200
50
100
1.02
1.02
78,497
111,097
-
35,657
35,657 3.57
200
1 3,674
13,674
13,674 80,800
35,657
62,197
10,240
.91
.9 1
.91 5.40
1.02
87,487
107,687
148,087
53,613
53,613
53,613
3.57
3.57
3.57

4
S Y S T E M m 5,000,ooo tpy
20.00- R o l l , L o a d i n g , Shipplng a
c o s t s per ton
a
1 10,000,000 tpy
L
1 15 ,000 ,000 tpy
- d r y load ing
-- a l u r r y load ing 0 L. I-
F l B U R E 18 a
0 - - , - - , - - - - , - . - - T - - - - (
0 SO 100 1 6 0 2 0 0 Ovrr land MTIes f r o m Coal Source
20.00-
C 0 I- - 15 .00 - m rn
S Y S T E M m S l u r r y P i p e l i n e , Loading , *
Shipping c o s t 8 p r r t o n
1 5 , 0 0 0 , 0 0 0 tpy
310,000,000 tpy 3 1 5 , 0 0 0 , 0 0 0 t p y
- d r y l o a d i n g
- - r l u r r y l o a d i n g
F I G U R E l 8 b
O h . . - - , . - . . , - 1 * - - - 1
0 5 0 100 1 SO 2 0 0 . O v r r l a n d M i l r a f r o m Coa l Sourcmr

F I G U R E 1 8 c
20.00 - S Y S T E M I l l
Conveyor, L o a d i n g ,
Shipping C o s t s per Ton
C
a 10.00- 0
d r y loading n m r l u r r y l o a d i n g C Q C I-
0 1 " - - 1 " ' - 1 " " 1
0 5 0 10 0 1 5 0 2 0 0 O v e r l a n d M ~ l a s f r o m Coal S o u r c e

SYSTEM IV
In this system, coal i s transported overland by either conveyor belt, railroad or a
slurry to a port near Point Lay. At this port, the cml i s loaded on 60,000 ton
capacity ocean barges by either dry loading or slurry loading.
At Point Lay, forty feet of water depth can be reached approximately tw miles
from shore. The sixty foot water depth i s approximately eight miles from shore. This eight
mile distance would preclude dry loading into a 100,000 ton ore ship because o f the high
cost of a pier facility. In this analysis 60,000 ton dwt. barges are used to move the coal
from the Northwestern Coast of Alaska to Japan. The harbor facility for dry loading these
barges consists of an earth and gravel pier I& miles in length.
The greatest advantage of a port at Point Lay over a port near Cape Thompson i s
i t s proximity to the maior portion of the coal reserves. A limitation of this port i s its
shorter ice free season of 75 days compared with a 90 day ice free season at a port near Cape
Thompson.
The usefulness of the relatively shallow draft ocean barge in this situation i s off-
set somewhat by their inherent low speed characteristics (average speed of II knots versus
16 knots for ships). More tugs and barges are required than ships because of their lower
capacity and their slower speed.
During the ice free season, the coal is transported to Japan and simultaneously to
o transhipment point at Dutch Harbor. The coal stockpiled at Dutch Harbor would then be
transported to Japan by ocean barges when the Point Lay area i s non-navigatable due to ice
conditions.
The cost of the tug-barge combination depends upon whether or not these quality
for the government shipbuilding subsidy of 41 per cent (the U.S. Government ollows Ameri-
can shipbuilders in American shipyards a 41 per cent subsidy on merchant ships). Therefore,
the tug-barge costs were computed with and without the subsidy.
The transportation costs of the northern coal under System IV are summarized in
Tables 20-25. These same costs are shown graphically in Figures 19 a, b, c. The criteria
and computation used for System IV are in Appendix G.
The cost of barging from Point Lay to Japan, including a transshipment point is
$3.58 per ton i f the shipbuilding subsidy i s granted or $4.80 per ton without the subsidy.
Dry loading costs are lower in System IV than System Ill because the harbor facilities for
60,000 ton barges are not as expensive as those required for 100,000 ton ships.
Again, if $10.00 i s the maximum transportation cost allowed in order to make fhe 70
operation economic, then the maximum number of overland railway miles varies from 35
miles for 5,000,000 tons per year to 160 miles for 15,000,000 tons per year of coal transpor-
ted. Similarly, these respecfive number of miles for slurry pipeline are 65 miles and 155
miles; for conveyor they are 55 miles and 170 miles.

Table 20
System IV -Annual Costs in Thousands of Dojlan Rail way from Cool Deposits to a Port near Point Lay, Dry Loading,
Shipment to Japan via a Transhipment Point at Dutch Harbor by 60,000 ton dwt. Ocean Barges
Bar! bor Cost Total
Per Ton Cost (do1 lars)
2.48 23,998 * 17,900
2.48 23,998 * 17,900
2.48 23,998 I *17,900
1.60 47,996 *35,800
1.60 47,996 *35,800
1.60 47,996 * 35,800
Cost Per Ton (do1 lard
Total System Cost
Total System Cost
Per Ton (do1 Ian)


Table 22
System IV - Annual Costs in Thousands of Dollan Slurry Pipeline from Coal Deposits to a Port near Point Lay, Dry Loading,
Shipment to Japan via a Transhipment Point a t Dutch Harbor by 60,000 ton dwt. Ocean Barges


Table 24
System tV - Annual Costs in Thousands of Do1 Ian Cwlveyor from Coal Deposits to a Port near Point Lay, Dry Loading,
Shipment to Japan via a Transhipment Point at Dutch Harbor by 60,000 ton dwt . Ocean Barges
Total System Cost
Tons Transported Annual ly (millions)
Total System t
Cost / Per Ton
(do1 l an)
9.84 * (8.62) 12.40
*(I 1.18) 17.92
* (16.30)
8.03 *(6.81) 9.66
* (8.44) 12.92
7.43 "(6.21) 8.78
* (7.56) 11.48
"110.32)
Dry Loading Conveyor Barging
Total Cost
Total Cost
Cost Per Ton
Cost Per Ton
I Conveyor (miles)
'4 01
Cost Per Ton
12,387
12,387
12,387
16,004
15,004
16,004
19,121
19,121
19,121
Total Cost
C
5
23,998
23,998
23,998
49,997
49,997
49.997
71,994
71,994
71.994
(dollan)
2.48
2.48
2.48
1 .&0
1.60
1.60
1.28
1.28
1.28
(do1 Ian)
2.56
5.12
10.24
1.63
3.26
6.52
1.35
50
100
200
50
100
200
50
10
2.70
5.40
12,800
25,600
51,200
16,300
32,600
65,200
20,200
100
200
(do! Ian)
4.80 * (3.58) 4.80
*(3.58) 4.80
* (3.58)
4.80 *(3.58) 4.80
*(3.58) 4.80
*(3.58)
4.80 "(3.58) 4.80
*(3.58) 4.80
"(3.58)
40,400
80,800
49,185
61,985
87,585
80,300
96,600
129,200
111,315
131,515
171,915


5 , 0 0 0 , 0 0 0 tpy
2 0 . 0 0 - SYSTEM I V
R o i l , L o a d i n g ,
B a r g i n g C o s t s per Ton
15 0 0 -
- dry l o a d i n g -- slurry l o a d i n g
5.00 - n Y)
c 0
L FIGURE 1 9 a
0 - - . . - , - - - - , - - - - I - - - - ,
0 60 100 160 900 Overland M l l a r f r o m Cool Sourer
20.00 - c 0 I-
b
S Y S T E M I V
S l u r r y P ~ p e l ~ n e , L o o d i n g ,
B o r g i n q C o s t s par t o n
15.00 -
11,000,000 tpy 0 - dry l o a d i n g
-- alurry l o a d i n 0
5 . 0 0 - F I G U R E 1 9 b
0 l - - - - l - - - - l - ' - - l 0 S O 10 0 160 9 00
O v r r l a n d M l l r s f rom Coal aourca

F I G U R E 1 9 c
S Y S T E M IV 20.00-
Conveyor, L o o d l n g , 6
B a r g i n g C o w t r par Ton 0 k
5 15.00 - Q
L a- I 0 0
C 0 - * Q C
- dry l o a d i n g z -- wlurry l o m d i n q 0 I = 5.00- 0 .I +
0 v - - - - 1 - - - - - - - - - 1
o so 100 IS o no0 Ovarlmnd M i l e 8 f r o m CemI I o u r t a
.,

SYSTEM V
This system consists of either a railway, pipeline or conveyor system to a coastal
point near Point Lay. A slurry ~ i p e l ine system loads 100,000 ton ore ships anchored 8 to 10
miles offshore.
Al l loading from this port is accomplished during the 75 day ice free season. The
coal i s shipped to Japan and to Dutch Harbor simultaneously during the summer months as in
Systems I l l and IV. The analysis of this system i s in Appendix H. Tables 26-27 are the re-
sults of the analysis, and Figures 20 a, b, c are these results presented graphically.
The total cost of 'transportation using ships in System V i s less than the total cost
using barges in System IV when no subsidy on barge cost i s considered. When this subsidy
i s considered, then System V total costs are higher than System IV total transportation costs.
The maximum number of railroad miles the coal can be moved to remain below
$10.00 total transportation cost i s 60 miles for 5,000,000 tons per year and 175 m i l e for
15,000,000 tons per year. For a slurry pipeline, the respective distances are 120 miles and
190 miles, and for a belt conveyor these distances are 85 miles and 200 miles.

Table 26
System V - Annual Costs in Thousand; of Do1 lars Railway from Coal Deposits to a Port near Point Lay, Slurry Loading,
Shipment to Japan via a Tmnshipment Point at Dutch Harbor by 100,000 ton dwt. Ore Ships
,
Tons Transported Annual ly (mil lions)
Rail
Rail (miles)
I 19,917 50
12.98
20.22
45,995
Total System
Cost
3.98
Total Cost
6,502
Slurry Loading
9.20
Total System Cost
Per Ton (dollars)
Shipping
Cost Per Ton (do1 lars)
1.30
Total Cost
19,576
Total Cost
Cost Per Ton
(do1 lars)
3.92
19,576 5
Cost Per Ton (do1 Ian)
38,781
74,982
100
200
10
3.92
21,718
41,858
82,052
50
100
200
7.76
15.00
64,859
39,152
39,152
39, I52
101,060
3.92
3.92
3.92
19,576
71,367
91,507
131,701
15
I
6,502
6,502 3.92
I 2.17 f 10,497 7.13
9.15
13.16 I
50
100
1.30
1.30
1.04
I 200
95,924
116,688
23,221
43,985
6.39
7.78
4.19 I 10,497 1.04
.93
.93
10.65
1.54
2.93
1.04 I
86,982
13,975
13,975
58,728
58,728
8.20
5.80 13,975
3.92
3.92
58,728
10,497
I .93 159,687

- E 5- o a x k $ S 4- C
2 gu ti= v, "4
Y
- E 2;: 0
I- ,Xu
r; O * $ !
' 3 ; . C 9 s 5 z
g z N e l c - 4 0: 0: 0: M CC) m
2 2 4 " 1 " 1 " 1 z z z
2 2 2
B o N o N ? "!. "-! 9 9 9
: a q c g - ? -
G t a e i m K
+ ? $ ~ r n l n ' % e l o o - - CC)
0 8 8 -
rr)
m c .- n . Q .- s rn
C .- -0
0" J
c - m
aJ C .- -
i? L
1 V,
h
C
U L O 2~
- # 3 c V
h
. ; E $ W : : R a ' - = U & $ n-
3 , O * ; 5 'U
G I - 2
- g e 3
+2u
%
a J h . E l l - - aJ '- a E .- V
e
-
$ 3 ", 4 c d
m $ i $ & N W
c u c u r u h - 9 M M M
N W C J
m D ' o ' d 0.
F C C
h h h
% % % s < g
3 3 % m~
s g a % \ ?
p r ) m
" 8 -
0 C
.*.----..-
3 ?';; t- r
0 0 E g 3 - $ ' = 5 F a -
I-
w
2 8 53 4 o d g
I
00
k 3 . % + gC.4- 7 - 7
N G ? q M M M
.. m W c g
Z E R o o ' o j , ' ,,,
h " 2 ? S T ? . m m m - 7 7
8 2 2 - M U-I
* a " a q o N
3 $ 9 a 4
3 8 8 - N
b
2
P

- - - , $ b O Z k & 4- ;'-z
a 71
- E * E L "o % G k 2 s z m m m 8 K U 7 r n Z 2
V)
N N N N N C V W C V N 57, , , , , , , , ,
( * J C ~ M m m m m m U L 0
0, 2z C I-
I
a n 2 9 9 C V N N C O d O c O V)
- e - S q P , . 2 1 9 e r n " 0 8 l l k
+ u 6 ~ 2 $ $ $ $ $ $
c - + O " 0 0 6 c 4 ? ? 4 a s s
C W L c - - C .- 7 - 7
-0 24 8 V
I
A
P - N h h h 2 2 z 2 0 % 8 3 0 3 3 8 - * o y q m . V), !2u a * $ 0 . 0 - 7 _ m c _ m
- m a
L
8 Z 0 8 8 8 8 5 8 k a + . CV
$ 6 a m - - N u ) d & W " q g 0 - m a eu u . - -
L
0
-
k-;;; > u 8 8 : S 8 8 c, C - '34 s g $ ' Scs
"
2 h- t = 2
0 0 L,, w 0 2 5, 52 2 " Fa&
I-
i
= - O D *
m
= ? S N .
* N q ln N. d m
7
3 3 % = ' ? Y O ?
8 8 s 4 h - g
o " g 3 s - . ' ?

SYSTEM V
2 0 . 0 0 - R a l I , Slurry Loading, 5 , 0 0 0 , 0 0 0 tpy
Shipping Coat8 par Ton
e
El5 00 - C m P 10,000,000 t p y + 0 U 10.00 - 1 5 , 0 0 0 , 0 0 0 t p y
e 0 - r 0 C * 0 P
5 . 0 0 - 0
c F I G U R E 2 0 0
O ' . - - - r - - - . r - - - - , . - - - I 0 5 0 100 1 5 0 2 0 0
Ovmrland M i l e 4 f r o m Coa l Souroo
20.00 - C o I-
C * n 15.00 - e a 0
S Y S T E M V
S l u r r y P i p e l i n e , S l u r r y L o a d i n g ,
Shipping C o s t 8 par Ton
L1 5 , 0 0 0 , 0 0 0 t p y
E 0 10,000,000 t p y -; 10.00- 0
II
C 0 a w C 0
I= 5-00'
0
F I G U R E 2 0 b
I - - - - o 5 o I bo 150
I 2 00
O v e r l a n d M i l e s f r o m Cool S o u r c e

F I G U R E 2 0 c
20.00-
e
S Y S T E M V
C o n v e ~ o r , S l u r r y Loading S h i p p i n g C o a t a per Ton
5,000,000 tpy ; 15.00 - L
0 10,000,000 t p y 0 w 0
u 10.00- C 0 - - 0 C C 0 n r 5.0 0- C 0 L
I-
0 I - - 1 I I
0 5 0 100 1 so 200
Ovrrlond Mile8 from Coal Source

AN ILLUSTRATIVE EXAMPLE FOR SYSTEMS Ill, IV, AND V
In order to illustrate the transportation costs more clearly, four poink in the coal
bearing areas were selected and the cost of transporting the ccal by various systems were de-
rived from the systems tables and graphs. These costs are only for an annual movement of
5,000,000 tons per year, but the costs for 10,000,000 and 15,000,000 tons per year could
be determined readily by using the appropriate tables and graphs.
Costs were also computed for systems without a transhipment point: that is, the
movement of al l the coal to Japan during the ice free season. This method has been dis-
cussed under the section on Shipping. These costs wi l l not indicate marketability or ship
lease problems which may occur when all the coal i s shipped in such a limited time period.
Figure 21 i s a map of the coal area showing the 4 possible coal mining areas.
Tables 29 to 32 are summaries of the transportation cost from these mining areas.
Table 29 i s a summary of the total transportation cost from point I to Japan using
System Ill. The total transportation costs vary from a low of $6.07 per ton of coal using a
slurry pipeline, slurry loading and shipping without a transhipment point to a high of $10.10
for a railroad, dry loading, shipping with a transhipment point. A l l of the total transporta-
tion costs are below $10.00 per ton except one, which i s $10.10.
The results summarized in Table 30 show that the total transporl-ation costs from
point 2 to Japan using System II I are very close or above the $10.00 economic l imi t, but
are well below this limit when System IV or V i s used. Total transportation costs from point
3 to Japan (Table 31) are above a $10.00 economic limit except in one case using System
Ill, but are below this limit using Systems IV and V. Transportation costs from point 4
(Table 32) using systems IV and V vary from $7.32 per ton to $15.60 per ton. The least ex-
pensive method of transportation in this case i s pipelining, slurry loading, barging or ship-
ping without a transhipment point.
In summary, this example has shown that i f there exists a $10.00 economic limit
on total transportation costs, then there i s a combination of transportation modes whose
total costs are below this limit for each of these possible mining area for the movement of
5,000,000 tons of coal per year.
Figures 18, 19 and 20 show that transportation costs lower with increased annual
movement. The movement of 10,000,000 tons per year or 15,000,000 tons per year means
that the total transportation costs from points I to 4 to Japan are substantially lower.

F I G U R E 21
P O S S I B L E M I N I N G AREAS
U S E D TO I L L U S T R A T E
TRANSPORTATION C O S T S 0 100 200 * I I


Table 31
Cost Per Ton To Transport 5,000,000 Tons of Coal Per Year From Point 3 to Japan
System Overland System Elements Used Miles Overland Ship Shipping
(approximate) Loading
*with subsidy
Tofal Transportation Cost Without With
Transhiprnent Transhipent Point Point


CHAPTER V
CONCLUSIONS
Remarks
The results derived from the analysis of System I indicate that i t would not be
economically feasible to construct and operate a railroad from the North Slope to Fairbanks
i f the coal deposit must support the entire construction and operation. However, the trans-
portation economics may be entirely different if this railroad was constructed by state and
federal governments and the costs were shared by the users of the railroad (eg. coal and oil
producers and other developments which may occur along the railroad route).
The transportation of coal by truck from the North Slope to Fairbanks would be pro-
hibitively expensive even i f the coal did not have to support any of the main road con-
struction and maintenance costs. The high cost of truck transportation in System II results
from the road weight limitations, hence the large number of trucks required. However, even
with larger capacity trucks, i t i s doubtful the transportation cost could be low enough to al-
low this coal to be competitive with other sunpliers to Japan.
The transportation cosfs of moving the coal from the Northwest coast of Alaska ap-
pears to be competitive with the transportation costs of existing coking coal suppliers to
Japan palticularly i f these w a l deposits are on or near the coast. As the overland distance
to the coal deposits increase, the costs become greater and coal becomes less competitive.
I f the total transportation costs cannot exceed $10.00 per ton to be economically feasible,
and the transportation system was one outlined in Systems Ill, IV, and V, then the overland
distance cannot exceed I20 miles at the 5,000,000 ton per year production level and 200
miles at the 15,000,000 ton per year production level.
In Systems Ill, IV and V the railway i s the most expensive method of overland
transportation, whereas conveyor and pipeline have similar transportation costs. As pointed
out previously, conveyors and pipeline in most cases can transport material from the same
source and destination as a railroad over a shorter route. But, both conveyors and pipelines
are inflexible to increased production and new developments, and do not provide backhaul
capabilities. A railroad can easily accommodate increased tonnages and backhaul traffic.
The costs of shiploading by slurry pipelines are less than the cost of shiploading by
conventional dry methods. One reason is the large capital expenditure required to build a
pier facility on any part of the shallow northwestern Alaskan coast.
Ocean transportation costs by 60,000 ton dwt. tug-barge and 100,000 ton dwt.
ore ships are almost the same. The fact that ocean going tug-barge combinations are slower
92

than ships means that more of them are required, but each unit costs less to build and less
to operate than a large ship. The tug-barge combination has one advantage over a ship i n
northern Alaska; a barge can operate in much shallower waters.
Summary
On the North Slope of Alaska, there is approximately 120 billion tons of subbitu-
minous and bituminous coal, some of which is coking coal. This coal may be in an advan-
tageous geographical position to one of the world's largest importers of coking coal, Japan.
This study was undertaken to determine the economics of transporting coal From
the North Slope of Alaska. Five transportution systems were analyzed. The first two systems
linked with the existing Alaska Railroad and a shipping point at Seward on the Pacific Coat.
The remaining three systems consisted of an overland transportation mode to a shipping point
on the northwestern coast of Alaska.
The costs of transporting North Slope coal to Japan via a port on the Pacific Ocean
are too high to be economically feasible if the coal deposit must support the transportation
network.
Overland transportation costs from the coal deposit to a hahor on the northwest
coast vary from $0.80 per ton mile at a production level of 5,000,000 tons per year to
$.025 per ton mile at a production level of 15,000,000 tons per year, Shiploading costs
vary from $3.06 per ton for dry loading, at 5,000,000 tons per yeor to $.91 per ton for
slurry loading at 15,000,000 tons per year. (Loading costs are the total of the Dutch Harbor
costs and the Chukchi Sea harbor costs). The costs of shipping coal from the northwestern
coat to Japan, with a transhiprnent point between varies between $3.58 per ton and $4.80
per ton.
Given a sales price of $20 per ton in Japan, and allowing $10 per ton for mining
costs, profit and unloading costs in Japan, then at a production level of at least 5,000,000
tons per year, part of the North Slope coal reserves i s economically competitive wi th
Japan's present coking coal suppliers. As the production rate increases, more of the re-
serves fall into the economic category. At 15,000,000 tons per year, coal up to 200 miles
from a harbor site could be transported to Japan for less than $10.00 per ton.
The overland distance which the coal can be transported economically i s sensitive
to the market price, mining cost, profit and shipping cost,
Future Research
There are several aspects of coal transportation in northern Aluska which require
further research. The foremost of these are marine terminals and shiploading techniques.
Before any quantity of coal i s moved from the northern coal fields, a suitable harbor and/
or shiploading method must be available. Slurry loading of coal onto ore carriers seems to
be promising, but this technique has not been fully developed for coal to date.
Extensive design and test work, probably on a pilot plant scale, i s necessary to
design a slurry pipeline system which can operate year round in the arctic. The market-
ability of the fine coking coal required by such a pipeline also needs investigation.
Fu~her research and experience into shipping should be undertaken to determine
the costs and benefits of extending the shipping season to northwestern Alaska. This research
should include a study of the requirements and necessity of transhipmsnt points.
Lastly, and probably most important, the delineation of favorable mining areas,
a study of the mining costs and a full marketability study are all necessary before the eco-
nomic feasibility of development of the Nor+h Slope coal reserves can be determined.

APPENDIX A
SYSTEM I

Analysis l - Annual Costs
Railroad.
Operating Basis.
Production - 5,000,000 tons per year
Schedule - 350 operating d ~ ~ s / ~ e a r
Round trip time - 50 hours (30 mileshr.)
Loading time - .05 hours and
Unloading time
S i re of trains - 13,000 tons/train (8 locomotives, 125 cars
Number of operating trains - 3
Performance of each train - 225,362 miles per year I 126 trips per year I 1,666,000 tons per year I
Cost of Equipment.
Gondola cars @ $15,000
Locomotives @ $340,000 $ 8,160,000 I Loading Equipment $ 550,000 I Unloading Equipment $ 1,450,000 I
Total $15,785,000
Train Operating Cost.
Locomotives 24 @ $1.20 per locomotive mile $ 6,490,426 I
Gondola Cars 375 @ $0.06 per car mile $ 5,070,645 ,
Labor 52 @ $30,000 per man $ 11560tOO0
Total $13,121,071
Cost of Railroad.
Nenam to North S lop
Communications @ $5000/mile $ 4,471,500
Buildings & Auxilary Equipment $ 5 , ~ , ~ 0
Total $1,216,638,173

Annual Maintenance Cost.
$14,00O/mile x 894.3 miles $12,520,200
Total Annual Costs of Railroad.
Equipment - $15,785,000 (A/P, 15, 20) $ 2,525,600
Operating Cost $ 13,121,071
Rui l road Capital Cost (1,207,166,673) (A/P, 15, 20)
Railroad Maintenance Cost $ 12,520,200
Total $210,662,571
Annual Harbor Cost
Capital Costs.
Equipment and Dock (14,150,000) (A/P, 15, 20) $ 2,162,500
Operating Costs.
Labor, Supervision
I Power, Tugs $ 2,000,000
Maintenance Costs $ 200,000
Total $ 4,562,500
Shipping
Operating Basis.
Schedule - 335 operating days/-eur
Round Trip Time - 19 days (16 knots)
1 Loading Time - 20 hours
Unloading Time - 20 hours
Number of ships required - 3
Ship Size - 100,000 tons deadweight
Performance of each ship - 17.6 trips per year
Annual Cost.
Capital Cost @ 14,750,000/ship Vessel Expense @ $7500/day/shi
Fuel Costs $ 2,777,016
97 Total $ 18,069,615

APPENDIX B
SYSTEM I I

APPENDIX B
SYSTEM l l
Operating Busis
Production
Schedule
Round Trip Time
- 5,000,000 tons per year
- 300 operating days per year
- 40 hours (30 m.p.h.)
Loading and Unloading Time - .05 hours
Truck Capacity - 25 tons
Performance of each truck - 198,000 miles per year
Number of trucks opemting - 1112 trucks
Annual Road Costs
*Capital Cost @ $300,000/mile - $ 4,500,000
Maintenance @ $2700/mile (Rhoads- $10,27O,OQO +. 02 per ton mile 1972)
Total $14,770,000
Annual Truck and Equipment Costs
**Capital Cost @ $49,00O/twck - $60,073,020
Operating Cost @ $.40 per truck per mile - $88,070,400
Capital C a t of Loading Equipment - $ 320,000
Labor Cost for Loading & Unloading - $ 240,000
Total $148,703,420
*Annual cost baed on 15 per cent rate of return and perpetual life.
**Referring to Figure 22, the annual cost of the trucks over a 20 year period truck l i fe of 7200 hours i s 110.25% of the original purchase price of the trucks.

I
C o s t o f t r u c k s over a 2 0 year per iod a s s u m i n g a 3 % per y e o r
e s c o l a t l o n r a f e and o 2 0 % s a l v a g e v a l u e
% o f o r i g i n a l t r u c k c o s t - p u r c h a s e c o s t
103 106 109 112 115 118 12L 124 127 I30 1 3 3 136 139 142 145 148 151 154 1 5 7
ye -or .
-0 I 3 4 5 6 7 8 9 1 0 12 I3 I4 15 16 17 18 19 2 0
200 20.6 21.2 21.8 22.4 23.0 23.6 242 24.8 25.4 26.0 26.6 27.2 27.8 28.4 29.0 29.6 30.2 30.8 31.4
% o f o r i g i n a l t r u c k c o s t - s o l v a g e v a l u e
F I G U R E 22
T R U C K C O S T CASH FLOW DIAGRAM
i

APPENDIX C
SYSTEM Ill
RAIL, HARBOR, SHIPPING

APPENDIX A
SYSTEM I
Railroad Criteria
Maximum speed - 60 m . p. h.
Maximum speed on curves - 25 m. p. h . Maximum grade - 1.75 per cent
Construction cost of the 492.2 mils long railroad
(Based on the results of the 3 million dollar, 3 year long study entitled "Alaska Trans- portation Corridor Study", by Tudor, Kelly, Shannon, Alaskan Transportation Consul - tank)
Consfruc t ion - $ 922,445,000
Engineering Services 146,354,923
Contingencies 138,366,750
Total $1,207,166,673
Cost Per Mile $2,452,594
Maintenance Cats, variable with tonnage transported
Tonnage Per Year - $/mi le/-ear
5,000,000 14,000
10,000,000 22,000
15,000,000 30,000
Other Capital Costs
Communication cost - $5000 per mile
Buildings and Auxiliary Equipment - $5,000,000 Total
Train and 'loading Equipment.
Looding Time - 80 seconds per car
Unloading Time - 100 seconds per car
Number of Engines - 8 per 125 car train
Average Speed - 30 m . p. h . Number of days in use per year - 350
Gondola type 105 ton capacity car with rotary coupler
$15,000 each

Six axle, 3000 H.P. Locomotives $340,000 each
Loading Equipment Feeders and Hoppers
Unloading Equipment
Rotary Dumper with foundations
Train Positionar erected
Hoppers and Feeders
$550,000 total
$500,000 tota I
$400,000 total
$550,000 total
Operating and Maintenance Cost of Trains
Locarnot ives - $1.20 per mile per locomotive
Cars - $0.06 per mile per car
Labor - $30,000 per man per year
Harbor Criteria
Capital Costs.
Stockpile Area
Dock and Shiploader
Stacker Reclaimers
Total
Shipping Criteria
Size - 100,000 tons
Draft - 50 feet
Averaga S p e d - 16 knots
Length - 940 feet
Cost - $25,000,000 Less 41 p r cent subsidy ("Six Hundred---", 1972)
$10,250,000
Total $14,750,000
Daily Expense $7500/day (Polar Transportation Requirements, 1967)
Fuel Requirements - 1300 bbl/day at sea
800 bbl/dcy in port 1 03

APPENDIX C
SYSTEM Ill
Analysis I
Rail road.
Operating Basis.
Production - 5,000,000 tons per year
Rail Length - 50 miles
Annual Cost,,
Railroad Construction - $17,406,773 @ 2,452,594/mi le
Equipment $ 493,600
Operation and Maintenance - $ 2,017,570
Total $19,917,943
Chukchi Sea Harbor - 5,000,000 tons per year.
Capital Cost - Construction.
Stockpile area - $ 561,436
Rock, gravel pier - $20,373,792
Total $20,935,228
Capital Cost - Equipment.
Stacker-Reclaimers - $ 4,000,000
Shiploader - $ 3,000,000
Conveyor System - $ 6,000,000
Total $13,000,000
Annual Costs.
Pier and Stockpile Capital Cost - $ 3,125,284 (20,373,792) (P/A, 15,OO)
Equipment Capital Costs $ 2,080,000 (13,000,000) (P/A, 15, 20)
Operation & MMntenance $ 3,400,000
Total $ 8,605,284
1 04

Dutch Harbor.
Caaital Costs.
Dock and Stockpile Area - $10,550,000
Equipment - $lO,OOO,OOO
Total $20,550,000
Annual Costs.
Dock and Stockpile Area Capital - $ 1,582,500 Cost 10,550,000 (P/A, 15,OO)
Equipment Capital Cost - $ 1,600,000 lO,OOO,OOO (P/A, 15, 20)
Operation and Maintenance - $ 3,500,000
Total $ 6,682,500
Shipping.
Operating Basis.
Production - 5,000,000 tons per year
Ship Size - 100,000 tons
Round Trip Time - 17 darj to Japan (16 knots) - 6.5 days to Dutch Harbor
Ice Free Season - 90 days
Loading Time - 20 hours
Unloading Time - 20 hours
Number of Ships - 2 for whole year
- 2 for 3 months
- another for 6 months
Annual Costs.
Ship Capital Cost - $ 7,OO2,O96 @ 14,750,000/ship
Operating Expense - $ 8,122,135
Fuel - $ 2,746,460
Total $17,870,691
105

APPENDIX D
SYSTEM I I I
SLURRY PIPELINE

APPENDIX D
SYSTEM I l l
Slurry Pipeline Design
Design Criteria.
Size of coal - 14 m x 0
Average size - 28 mesh = .0232
Specific Gravity of Coal - 1.5
Concentration of coal by weight in the slurry - 60%
Concentration by volume - 49.7%
Flow velocity - 6.0 ft. per second
Analysis II
Operating Basis - Slurry Pipeline.
Production - 5,000,000 tons per year
I - 634.2 tons per hour
I Operating Factor .. 90%
I Pipeline Volume - 3406 gal Ions per minute
I Slurry Velocity - 6 feet per second
I Pipeline Diameter - 16 inches
'Frictional Head LOSS - 119.2 psi per mile (assuming gradient of -20 feet per mile)
I 2~orrepower p r mile - 237
I 3~umps per mile - .201
Distance between pump stations - 20.0 miles
Capital Costs. per mile
Pumps @ $225,000 per pump itstalled - $ 45,225
-1 -93 I)Frictioml Head Loss JM = J w tJwCv280 (Zandi, 1971)
Where JW = Head loss of clear water at same velocity Cd = Drag Coefficient
g = gravity constant 2)hooepwer = Q P Where Q volume in gallons per minute
mT P = pressure in p.s,i.
3 ) ~ 7 5 ~ horsepower per pump and 90% pump efficiency, 3 operating and I spare pump per station. 107

Capital Costs. (continued)
Pipeline
per mile
- $52,800
Pump Stations $400,00O/station - $20,000
Piping, Controls per Station $900,000/station - $45,000
Communications $1000 per mile - $ l,ooO
Construction Cost $150,00O/mile - $150,000
Insulation Costs $17,30O/mile - $ 17,300
Research, Enginaeri ng , Contingencies - $66,265 20% of Capital & Construction Cost
Preparation Facility 2.00/ton = $l0,000,000
Rsceival Facility $!0,000,000
Total Cost $20,000,000 + $397,590 per mile
Operating and Maintenance Costs.
Power @ .03 per kw-hr. - $ 41,801
Pumps - 0.8 ~ / t o n / ~ u r n ~ station - $ 2,000
Pipeline - 2% of original cost - $7,040
Inhibitor = $.I0 per ton = $500,000
Labor, Administration, General Overhead - $ . I0 per ton = $500,000
Total = $1,000,000 + $50,841 per mi le
Total Annual Cost = $4,200,000 + $114,455/mile
Water Pipeline Design and Costs.
Operating Basis - Water Pipeline.
Pipe Diameter - 12 inches
Water Velocity - 5 feet per second
Head lass - 14.6 p.s.i. per mile
Horsepower per mi le - 15.3
Number of pumps per mile - .0318 @ 800 H.P. per pump
Distance between stations - 94.3 miles @ 3 pump per station

Water Pipeline Capital Costs. Cost per mile
Pumps @ $30,000 per pump
Pipeline $43720/mile
Pump Stations $300,000 per station - $ 3,181
Piping, Controls $750,000 per station - $ 7,953
Construction Costs $100,000 per mi le - $100,000
Insulation Costs - $ 13,000
Research, Engineering, Contingencies - --.$ 33,760
Total = $175,000 + $202,%9/mile
Water Pipeline Operating Costs.
Power
Maintenance
Labor, Administration
Pipe Heating
Total $ 9,758
Total Annual Water Pipeline Cost = $28,000 + $42,169/mile
Slurry and Water Pipeline - 10,000,000 tons per year.
Slurry Pipeline.
Pipe Diameter - 24"
Frictional Head Loss - 115 p.s.i. per mi le
Horsepower required per mile = 457 H. P.
Number of pumps per mile = .387 pumps
Distance between stations - 10.6 miles
Capital Cost = $30,300,000 + $618,776 per mile
Operating and Maintenance Cost - $2,000,000 + $100,527/rnile Total Annual Slurry Pipeline Cost = 6,848,000 + $199,531 per mi le
Water Pipeline.
Pipe Diameter = 18"
Frictional Head Loss =9.1 p.s.i. per mile
Horsepower required per mile = 18.6 H. P.
Number of pumps per mile = .0385 pumps 109

Water Pipeline. (continud)
Distance between stations = 77.8 miles
Capital Cost = $175,000 + $293,929/mile
Operating and Maintenance Cost = $12,179/mile
Total Annual Water Pipeline Cost = $28,000 + $59,208/mile
Slurry and Water Pipeline - 15,000,000 tons per year.
Slurry Pipeline.
Pipe Diameter - 2, 20 inch pipes
Frictional Head Loss - 127 p.s.i. per mile per pipe
Horsepower required per mile - 378.6 H. P. per pipe
Number of pumps per mile = .320 pumps per mi le
Distance between stations = 12.5 miles
Capital Costs = $38,640,000 + $925, 715/mile
Operating and Maintenance = $3,000,000 + $158,36O/mile
Total Annual Slurry Pipeline Cost = $9,182,400 -t $306,474/rnile
Water Pipeline.
Pipe Diameter = 20 inches
Frictional Head Loss = 10.9 psi per mi le
Horsepower required per mi le =:32.6 H.P.
Number of pumps per mile = .0678
Distance between stations = 44.2 miles
Capital Cost = $175,000 + $381,153/mile
Operating and Maintenance $17,86I/mile
Total Annual Water Pipeline Cost = $28,000 + $78, 800/mile

APPENDIX E
SYSTEM I l l
BELT CONVEYOR

APPENDIX E
SYSTEM Ill
Belt Conveysrs
Design Criteria.
Weight per cubic foot
Angle of repose
Surcharge angle
- 50 lb.
- 25 " - 35 O
Analysis I l l
Operating Basis.
Production - 5,000,000 tons per year
Be1 t Size - 24 inches
Idler Spacing - 6.5 feet troughing
- 10.0 feet return
Belt Speed - 1000 feet per second
Idler Configuration - 3 9
Single Belt Length Center to Center
- 3 miles
Operating Factor - 90%
Horsepower at primary drive - 840
Horsepower at secondary drive - 216
Tensibn per inch of belt width - 1386 lb.
Belt Conveyor for 10,000,000 tons per year.
Belt Size - 36 inches
Horsepower at primary drive - 1350
Horsepower at secondary drive - 330
Tension per inch of belt width - 1473 Ib.
Belt Conveyor for 15,000,000 tons per year.
Belt Size - 42 inches
Horsepower at primary drive - 1880
Horsepower at secondary drive - 480
Tension per inch of belt width - 1668 Ib.
Table 33 i s a summary of Belt Conveyor Capital Costs; Table 34 is a summary of Belt Conveyor operating and maintenance costs.
I12

Table 33
Belt Conveyors - Capital Costs
Million Belt Tons Width M o b s Trans ported Idlers Belting and Structure Cover Instal lation Per 1) 2) 3fuileys 4) 5) 6 ) Year
1) Stephans-Adamson Co. (1972) - Replaced every 5 years
2) Adapted from 8. F. Goodrich (1972) - Replaced every 10 yean
3) Motor cost estimated at $40 per horsepower - pulley costs from 1)
4) Adapted from Maddix (1971) - includes $50,000 for transfer point
5) Cover estimated at $ .50 per square foot
Total
6) 75% of equipment cost - Hewiff-Robins Co.


Conveyor Belt - 3 Miles Long
Annual Cost in thousands of dollars
Million Eel t Capital Operating Total Total Tons Width Cost Costs Per Per (inches) 1) M i le Year
I ) Total Capital Cost (P/A, i , n) where i = 15% n = 20 years

APPENDIX F
SYSTEM I l l
SLURRY LOADING

APPENDIX F
SYSTEM Ill
Ancllvsis IV - Slurry Loading
Annual Costs - 5,000,000 tons per year.
Equipment Capital Cost - $ 4,923,800
Stockpile Cost - Cape Thompson $ 79,715
Stockpile Cost - Dutch Harbor - $ 82,500
Direct Cost - Cape Thompson - $ 500,000 @ $. 10 per ton
Direct Cost - Dutch Harbor - $ 728,000 @ $. 10 per ton loading and unloading
Total $ 6,314,015
Cost Per Ton $1 -26
Annual Costs - 10,000,000 tons per year.
Total Cost - $10,239,988
Cost Per Ton - $1 -02
Annual Costs - 15,000,000 tons per year.
Total Cost - $13,673,579
Cost Per Ton - $.91

APPENDIX G
SYSTEM IV

APPENDIX G
SYSTEM IV
Barging
Design Criteria.
Tug Barge Speed - I I knots
Barge Size - 60,000 tons
Barge Length - 61 1 feet
Barge Beam - 135 feet
Barge Draft - 33 feet
Tug Size - 4400 horsepower
Crew Size - 10
Ice Free Season - 75 days
Operating Basis.
Product ion - 5,000,000 tons per year
Round Trip Time - 23 days (I1 knok)
Loading and Unloading Time - 0
Tugs Required - 6 a l l year - 6 for 3 months
Barges Required - 8 a11 year - 8 for 3 months
*Annual Costs - 5,000,000. tons per year.
Capital Costs @ $8,240,000 per barge - $15,114,800
1,609,000 per tug
Operating Costs - Tugs Fuel Lubricants
Maintenance and Repair
Stores and Supplies
Crew Insurance
Operating Costs - Barges Maintenance and Repair Insurance
Total $23,997,711 *Computed from formulae by Matson Research Corporation, 1970.
119

Annual Costs - 5, 000,000 tons per year. (continued)
Cost per ton = $4.80
Annual Costs with Shipbuilding Construction Subsidy.
Capital Costs - $ 9,017,732
Operating Costs - $ 8,882,911
Total = $17,900,643
Cost. per ton = $3.58

APPENDIX H
SYSTEM V

APPENDIX H
SYSTEM V
Shipping
Operating Basis.
Production - 5,000,000 tons per year
Round Trip Time - 18 days (16 knots)
Ships Required
lee Free Season
- 7 - Ice Free Season 2 - Remainder of the year
- 75 days
Annual Costs - 5,000,000 tons per year.
2 ships al l year - $12,046,344
5 ships for ice free sectson - $ 7,529,165
Total $19,575,509
Total Shipping Cost per Ton - $3.92
Slurry Loading - Annual Costs
5,000,000 tons per year - $ 6,502,205
10,000,000 tons per year - $1 0,496,965
15,000,000 tons per year - $13,974,726

SELECTED BlBL IOGRAPHY
SELECTED BIBLIOGRAPHY
Armstrong, Terrance. Soviet Northern Development with some Alaskan Parallels and Con- trasts. College: Institute of Social, Economic, and Government Research, Univer- - sity of Aloska, 1970.
Atwood, G. L , and William Brown. "Large Tmck Trains - A Rapid Transit, " Mining Engi- neering, Vol. 24 No. 8, (1972), pp. 56-57.
Bain, A. G, and S. T. Bonningham. Hydraulic Transportation of Solids by Pipeline (1st Ed.) Oxford, New York: Pergamon Press, 1970.
Baker, K. J. "Yukon ~o'ads, " Arctic Transportation, Vol . II, Ottawa: Information Canada, February 1971.
Barnes, Farrell . Coal Resources of Alaska. U. S. Geological S U ~ V ~ , Bulletin 1242-8,1967.
, Coal Resources of the Cape Lisburne-Colville River Region, Alaska. U .S. Geo- logical Survey, Bulletin 1242-E, f967a.
Barnes, G. W. "Present Status of the Canadian Coal Industry," Coal Mining and Processing, Vol. 9 No. 2, (1972), pp. 34-39.
Battelle Memorial Institute. Fuel Gas From Coal, New York: McGraw-Hill Book Co., Inc., 1950.
B. F. Goodrich Co. Ltd. "Steel Cable Conveyor Belting Handbook," Akron, Ohio: Manual No. IPC-256-6.
Beebe, R. R., A. K. Andersen and A. K. Bhasin. Evaluation of Basic Slurry Properties as Design Criteria for the Marconaflo System. San Francisco: A report presented to the 70th Annual Meeting,of the American Institute of Chemical Engineers, Atlan- t ic City, N. J., August 31, 1971.
Berkowitz, N. and E. J. Jensen. "On Possibilities for Pipelining Coal in Canada, " C.1 .M, Bulletin, Vol. 56 No. 615, (July 1963), pp. 504-508.
Bocchietti, H. M., J. Azan, and J , Clot, "How World's Longest Belt Conveyor Moves Ore 8 Miles on Pacific Island, " World Mining, Vol . 25 No. 4, (1972), pp. 28-31.
"Building and Construction Cost Indexes, " Engineering News Record, Vol . 180 No. 12, (1968), and Vol. 188 No. 25, (1972).
Burdick, John L. (Ed.). Symposium on Cold Regions Engineering. Alaska Section, Ameri- can Society of Civil Engineers and Department of Civi l Engineering, University of
I Alaska: V ~ I . I and 2, March 1971.
Bush, Captain, J. D, , Jr., Reconnaissance for Railroad or Highway West of Faihanks, Anchorage: U. S. Army' ~ o r p s of tngineers, U.S. Geological Survey, Upen File Report, 1969.

Callahan, J. E. and others. Geology of T. IS, R44W Unsurveyed Umiat Principal Meridian in the Kukpowruk Coal Field, Alaska. U. S. Geological Survey, Open File Report, 1969.
. Geology and Coal Resources of T.GS, RSlW Unsurveyed Umiat Principal Meri- dian in the Cape Beaufort Coal Field, Northwestern Alaska. U.S. Geological Survey, Op en File Report, 1971.
Canadian Institute of Guided Ground Transport. Railway to the Arctic. (rev.) Kingston, Ont.: Queen's University, July 1972.
Chapman, R. M. and E. G. Sable. Geology of the Utukok-Corwin Region, Northwestern Alaska. U . S . Geological Survey, Professional Paper 303-C, 1960.
Charles, J . L . "Permafrost Aspects of Hudson Bay Railroad, " Journal of the Soil Mechanics and Foundations Division: Proceedings of the American Society of Civil Engineers: Vol. 85 No. SM6, (December 1959), pp. 125-135.
. "The Great Slave Railway, " Engineering Journal, Vol . 48 No. 5, (1965), pp. 15-19,
Climatological Data - Alaska, United States Department of Commerce, Environmental Science Service Administration.
Collier, A. J. "Coal Resources of the Cape Lisburne Region. " Report on Progress of Investi- gations of Mineral Resources of Alaska. U.S. Geological Survey, Bulletin 259, 1905.
Colorado School of Mines Research Foundation. The Transportation of Solids in Steel Pipe- lines. Golden, Colorado: Colorado School of Mines, 1963.
Consolidation Coal Co. Pipeline Gas from Lignite Classification - A Feasibility Study. Library, Pennsylvania: January 13, 1965.
Conwel I, Cleland N . Faihanks: Department of Natural Resources, Divi- sion of Geological Survey, State of Alaska, 1972.
Constantini, Ralph M. "Feasibility of Long Distance Solids Pipelines, " Mining Congress Journal, Vol. 49 No. 1, (1963), pp. 42-46.
Conveyor Equipment Manufacturers Association. Belt Conveyors for Bulk Materials. Boston: Cahners Publishing Co. Inc., 1966.
Cost Analyses of Model Mines for Strip Mining Coal. U.S. Bureau of Mines, Information Circular 8535, 1972.
Creager, J. 5. and McManus. "Geology of the Floor of the Bering and Chukchi Seas, "
The Bering Land Bridge. Stanford: Stanford University Press, 1967.
Cunninnham, J. F. "The Role of Ocean Transportation in the Marketing of Minerals," - ~ i n e r a l s Transportcrtion, San ~rancisco: Proceedings of the 1st International Sym-
125

posium on Transportation and Handling of Minerals, Vancouver, B. C., October 20-23, 1971. Mil ler Freeman Publications, 1972.
Department of Indian Affairs and Northern Development (Canada) and Ministry of Transport (Canada). Arctic Transportation. 3 Vol . Ottawa: Proceedings of the Arctic Trans- portation Conference, Yellowknife, December 8-9, 1970. lnformation Canada, February 1971.
Department of Public Works (Canada). Herschel Island, Feasibility of A Marine Terminal. Ottawa: 1972.
Draper, J. C., R. F. Slack and J. A. Younkins, Jr., "Overland Conveyor Hauls 40 million Tons of Coal 4; Miles," Mining Engineering, Vol. 18 No. 11, (1966), pp. 58-62.
Durham, G. H. "Solids Pipeline Engineering and Economics," A paper presented to Index 71 at Saskatwn, Saskc~tchewan, May 1971.
E. B. S. Management Consultants Inc., Extension of the Alaska Railroad. A report to the NORTH Commission, Washington, D . C . : November IY6/.
Edmondson, A. Cameron. "A new Use for Alaska's Cool," Alaska Industry, Vol. 4 No. 9, (1972), pp. 35-36.
Ehrlich, I, R. "A Dynamic Vehicle System for the North, " Arctic and Middle North Trans- portation, Washington: Arctic Institute of North America, 1969.
Ferrians, 0. J. Jr., R. Kachodoorian, and G. W. Greene. Permafrost and Related Engi- neering Problems in Alaska. U . S. Geological Survey, Professional Paper 678, 1969.
"The Fortune Directory," Fortune, Vol. 85 No. 5, (1972), Vol, 83 No. 6, (1972), Val. 83 No. 5 (1971), Vol. 83 No. 5, (1971).
Fraser, D. A. "Pipeline Transportation of Concentrates, " Mining Congress Journal, Vol . 46 No. 3, (1960), pp. 44-48.
Fraser, M. J. and L. P. Connolly. Marconaflo and I t s Use in New Mineral Developments. San Francisco: A report prepared for presentation a t the 73rd Annual General Meeting of the Canadian Institute of Mining and Metallurgy, Quebec City, Canada, April 26-28, 1971.
German, M. J. "Bulk Shipping and Icebreaker Support i n the Arctic, " Arc t ic Transporta- tion, Vol. Ill. Ottawa: lnformation Canada, February 1971. -
Glover, T. O., M. E. Hinkle, and H. L. Riley. Unit Train Transportation of Coal. U.S. Bureau of Mines, Information Circular 8444, 1970,
I Good, John E. "Challenges i n Developing Western Canadian Coals, " New York: S ,A. I .M,E. Preprint No. 72-F-46, Feb. 1972.
I 126

Grant, Eugene L. and W. Grant Ireson. Principles of Engineerins Economy (5th Ed.) New York: The Ronald Press Company, 1970.
Greene, Robert W. I II and I. M .Thompson. "How to Move Inland Coal by Water - Including a Nine Mile Single Flight Coweyor," S.A. I .M. E. Preprint No. 71-6-316, Sept. 1971.
Greenwood, Julian K, and R. Sage Murphy. Factors Affectina Water Manaaement on the North Slope of Alaska. Fairbanks: Institute of Water Resources, University of Alaska. Report No. IWR 19, Feb. 1972.
Habeck, Walter J. and Robert F. McNamara. "The Economics of Slurry Pipelines, " lron - and Steel Engineer, Vol. 40 No. 8, (1963), pp. 137-141.
Hartwell, A. D. "Coastal Conditions of Arctic Northern Alaska," Terrain and Coastal Con- ditions on the Arctic Alaskan Coastal Plain, Hanover, N. H.: CRRR Special Re- port 165, 1972.
Heiner, Lawrence E. (Ed.) and Ernest N . Wolff (Ed .). Final Report: Mineral Resources of Northern Alaska, College, Alaska: submitted to the NORTH Commission by the Mineral Industry Research Laboratory, M. I .R.L. Report No. 16, 1968.
"Ice Gouging Studies to Continue," Whitehorse Star, Vol. 72 No. 86, (1972), p. 4.
"Imperial Beaufort Island Building Said Moving Along at Satisfactory Rate, " Oilweek, Vol. 23 No. 28, (1972), pp, 16-18.
"Imperial's Man-Made Island Withstands Big Beaufort Storm, " Oilweek, Vol . 23 No. 31, September 18, 1972, p. 26.
Inee, Simon. "Winter Regime of a Tidal Inlet in the Arctic and the Use of Air Bubbls for the Protection of Wharf Structures, " Coastal Engineering, (Eighth Conference, Mexico City: Council on Mbve Research.) The Engineering Foundation, 1963, pp. 521-532.
International Coal Trade. U.S. Bureau of Mines, Nov. 1971, Jan. 1972, Feb. 1972, May 1972.
"In the 'Great Gas War', i t ' s Consortium vs. Consortium," Alaska Construction and Oi l Re- - Vol. 12 No. 11, (1971), pp. 10-11, 14-15.
"lron and Steel - Japan's Bellwether, " Engineering and Mining Journal, Vol. 172 No. II, (1971), pp. 94-102.
Jelen, F . C. Cost and Optimization Engineering, New York: McGraw-Hil l Book Company, Inc., 1970.
Job, A. L. Transport of Solids in Pipelines with Special Reference to Mineral Ores, Con- centrates and Unconsolidated Deposits (A Literature Survey), Ottawa: Department of Energy, Mines and Resources, Mines Branch, Information Circular IC 230, October 1969. 127

Johnson, Philip R. and Charles W. Hartrnan. Environmental Atlas of Alaska (2nd Ed.). Fairbanks: Institute of Arctic Envionmental Engineering, University of Alaska, 1971.
"Kaiser Resources gets better price for coking coal, " Northern Miner, Vol. 58 No. 17, (1972), p. II,
"Kaiser Steel May Tap North Slope Coal," Alaska Industry, Vol. ll NO. 3, (1970), pp. 22- 23.
Keniston, Henry E. "Rail Transportation of Bulk Materials, Yesterday, Today and Tomorrow," New York" S.A. I.M. E. Preprint No. 72-H-12, February 1972.
Koisch, Francis P. '!Supercarriers vs. U. S. Harbor Dimensions, " Journal of the Waterways Harbors and Coastal Ennineerina Division, Proceedings of the American Society of Civil Engineers, Vol . 97 No. WWI, (Feb. 1971), pp. 20-27.
Kreith, Frank. Principles of Heat Transfer (2nd ed.), Scranton: International Textbook Co., 1967.
Lackenbruch, Arthur H. Some Estimates of the Thermal Effects of a Heated Pipeline in Permafrost, U. S, Geological Survey Circular 632, 1970.
Levene, Harold D . "A progress repork on coal gasification, " Coal Mining and Processing, Vol. 9 No. 8, (1972), pp. 39-41, 52, 54.
Link, James M. "The Slurry Transport of Industrial Minerals," New York: $,A. I .M. E, Preprint No. 72-H-75, February 1972,
"The Longest Largest Coal Slurry Pipeline Ever Built," Coal Mining and Processing, Vol. 8 No. 2, (1971), pp, 37-40.
Love, F. H. "The Black Mesa Story," Pipeline Engineer, Nov. 1969.
Lutjen, George P. "Marconaflo - How i t Works and I t s Exciting Potential for the Mining Industry," Engineering and Mining Journal, Vol. 171 No. 5, (1970).
Maddex, P. J. and W. F. Haddon. "Transportation - Materials Handling," Mining Engi- neering, Vol. 23 No. 7, (1971), pp. 53-61.
"Major effort under way for changing coal io gas, It Fairbanks Daily News Miner, Vol . 70 No. 174, (1972).
Matson Research Corporation. Transocean Tug-Barge Systems. 3 Vol . San Francisco: A report to the Maritime AdminTstration, U. S. Department of Commerce, 1970.
McDermott, W. F . and othe . "Savage River Mines, the World's First Long Distance Iron Ore Slurry PipelinJ" A paper presented at the Society of Mining Enginears Fall Meeting, Minneapolis, Minnesota, September 18-20, 1968.
Moreau, Captain J . W . "Problems and Developments in Arctic Alaskan Transportation, " Proceedings, U. 5 . Naval Institute: Vol. 96 No. 5/807, (May 1970), pp. 98-119.
128

Murphy, E. J. "Slurry Transportation and Shiploading at Waipipi Ironsands," Skillings Mining Review, Vol. 61 No. 15, (1972), pp. 8-13,
National Resources Planning Board. Resources and Transportation Facilities in the Area Tri- butary to the Trans-Canadian-Alaska Rail way, Western DivisionL Portland, Oregon: March, 1943.
"Northwest Project Cost Doubles, " Oilweek, Vol . 23 No. 3, (1972), pp. 50-51.
Oszter, Z. F. "Cold Weather Problems in Belt Conveyor Design," C.I.M. Bulletin, Vol. 58 No. 633, (1965), pp. 60-65.
Porker, W., D. Swanson, V. Fischer and J. Christian. Northwest Alaska Economic and Transportation Prospects. Fairbanks: Institute of Social, Economic and Government Research, University of Alaska, March 1972.
Pewe, T. L., D. M. Hopkins and A. H. Lachenbruch. Engineering Geology Bearing on Harbor Site Selection Along the Northwest Coast of Alaska from Nome to Pt. Bar- row. U. S. Geological Survey, Open File Report 173, April 1958. -
Pipe Friction Manual, New York: Hydraulic Institute, 1954.
Polar Transportation Requirements Study Report. 3 Vol. United States Department of Truns- portation, U. S. Coast Guard, Nov. 1968.
Polta, Harold J. Mesabi Range Iron Ore Transportation: Feasibility and Estimated Cost of Pipelining. U. S. Bureau of Mines, Information Circular 8512, 1971.
Pryer, S. W. J. "Mine Railroads in Labrador-Ungava, " Proceedings of Permafrost Inter- national Conference, Washington: Notional Academy of Sciences - National Re- search Council Publication No. 1287, 1963.
"Relative Prices Around the World," Civil Engineering - ASCE, Vol. 41 No. 10, (1971), pp. 91-92.
Ross, Ian S. "Design Problems Associated with Port Handling Facilities, " New York: S .A. I .M. E. Preprint No. 72-H-58, 1972.
. "Trends in Bulk Ocean Transport, " Mining Congress Journal, Vol. 55 No. 12, (1969), pp. 66-70.
Sainsbury, C. L. and D. W Schol I. "Marine Geology of the Ogotoruk Creek Area, " Environment of the Cape Thompson Renion , Alaska, Washington: U . S . Atomic Energy Commission, 1966.
Sanford, P. Exploration of Coal Deposits of the Point Barrow and Wainwright Areas, North- ern Alaska. U. S. Bureau of Mines, Report of Investigation 3934, 1946.
Sasadi, John. "High Capacity Unloading of Ships, " New York: S.A. I.M.E. Preprint 72-8-64, Feb. 1972.
129

Seeby, H. W. and M. Hunter, Climate of the North Slope, Alaska. U. S. Department of Commerce, National Oceanic and Atornospheric Administration, N .O ,A.A. Tech- nical Mem. AR-4.
Singhal, R. K . "Some Engineering Aspects of the Roberts Bank Superport," Coal Mining and ProcessingL Vol. 8 No. 6, (1971), pp. 53-57.
"Six Hundred and Sixty Mi l l ion Contract Aids Shipping Industry," Fairbanks (Alaska) Daily News Miner, July 1, 1972.
Smith, P. S. and J. 0. Mertie, Jr., Geology and Mineral Resources of Northwestern Alaska. U. S. Geological Survey, Bulletin 850, 1930.
Spetzrnan, L. A. Vegetation of the Arctic Slope of Alaska. U. S. Geological Survey, Pro- fessional Paper 302-B, 1959,
Stephans-Adamson of Borg Warner Corporation. "Bulk Material Handl ing Equipment Catalo- gue 77, " Aurora, Illinois.
Stokes, W. P. "North Slope - Construction Criteria for Roads and Facil ities, " Journal of Petroleum Technology, Vol . 23 No. 10, (1971), pp. 1209-1214.
Strippable Reserves of Bituminous Coal and Lignite in the United States. U. S. Bureau of Mines, Information Circular 8531, 1971.
Svgin, Leonard. "Alternatives in Port Terminal Layout, Dredging vs. Offshwe Terminal, New York: S.A.1 .M.E. Preprint No. 72-8-68. Feb. 1972.
Tail leur, I. L , Low-Volatile Bituminous Coal of Mississippian Age on the Lisburne Peninsula, Northwestern Alaska. U. S. Geological Survey, Professional Paper 525B, 1965.
Thompson, T. L. and R. J. Frey, N. T. Cowpoer and E. J. Wasp. Slurry Pumps: A Survey, A paper presented at the 74th Annual General Meeting of the Canadian lnstitute of Mining and Metallurgy, Ottawa, Canada, April 12, 1972.
Toenges, Jolley, lnvestigation of Coal Deposits for Local Use i n the Arctic Regions of Alaska, and Proposed Mine Development. Bureau of Mines, Report of lnvestigation 4150, 1947.
Tsaros, C. L. , S. J. Knabel and L. A. Sheridan. Process Desian and Cost Estimate for Pro- " '
dustion of 266 Mi l l ion SCF/D~Y of Pipeline Gar b y the ~ ~ d r o ~ a r i f i c a t i o n o f Bituminous Coal--Hydrogen by the Steam Iron Process. Chicago, Ill.: Institute of Gas Technology, August 1966.
Tudor, Kelly, Shannon, Alaskan Transportation Consultants. Alaska Transportation Corridor Study, submitted to the Federal Highway Administration, U. 5. Department of Transportation, Interim Reparts 1, 2, 3, 4, 5, June 1970 to April 1972.
Tussing, A. R., S. Comitini and H. J, Gellert, Japan-Alaska Economic Relations. Fair- banks: lnstitute of Social, Economic and Government Research, University of Alaska, Report #17, 1968.
130

U.S. Coast Pilot, Pacific and Arctic Coasts, Cape Spencer to Beaufort Sea. Vol. 9. U. S. Department of Commerce, Coast and Geodetic Survey, 1964.
United States Congress. Senate. Committee on Interior and Insular Affairs. Coal Gasifica- tion Development. Hearing, 92nd Congress, 1st session before the Sub-committee on Minerals, Materials, and Fuels, July 27-28, 1971. Washington: Government Printing Office, 1971.
Wahrhaftig, Clyde. Physiographic Divisions of Alaska. U. S. Geological Survey Profession- al Paper 482, 1965.
Warfield, R. S. and C. C. Boley. Sampling and Coking Studies of Several Coal Beds in the Kokolik River, Kukpowruk River and Cape Beaufort Areas of Arctic Northwestern Alaska. U. S. Bureau of Mines, Report of Investigation 7321, 1969.
. W. S . Landers and C. C. Boley. Sampling and Coking Studies of Coal from the Kukpowruk River Area, Arctic Northwestern Alaska. U. S. Department of the In- terior, Bureau of Mines, Report of Investigation 6767, 1966.
Wasp, E. J . , Terry L. Thompson and Thomas C. Aude. "Initial Economic Evaluation of . . $lu;ry pipeline ~ystems," Transportatidn Engineering Journal: Proceedings of the American Society of Civil Engineers, Vol. 97 No. TEI, (1971), pp. 271-279.
Waugh, Richard G. Jr., "Economics of Channels and Maneuvering Areas for Ships, " Jour- nal of the Waterways, Harbors and Coastal Engineering Division, Proceedings of the American Society of Civil Engineers, Vol. 97, No. WW4, (November 1971), pp. 674-677.
Weir, John P. "Dollars and Sense of Pipelining Coal" Mining Engineering, Vol. 15 No. 9, (1962), pp. 43-45.
Williams, John R. A Review of Water Resources of the Umiat River, Northwestern Alaska. U. S. Geological Survey, Circular 636, 1970.
Wolff, E. N. and others. Optimum Transportation Systems to Serve the Mineral lndust North of the Yukon Basin in Alaska. MlRL Report No. 29, University of AlasFa, 1972.
Workman, I. L . "World's Longest Single Flight Belt Conveyor, " Mining Engineering, Vol. 21 No. 1, (1969), pp. 77-80.
"World Wide Construction Scoreboard, " Pipe Line Industry, Vol. 37 No. 1 , (1972), pp. 67-71.
Yu, A. T. "Bulk Handling - A Three-Quarter Century Survey and Outlook, " $.A. I .M.E. Preprint No. 71-B-17, Feb. 1971.
Zandi, I. Advances in Solid-Liquid Flow in Pipes and i t s Application. Oxford, New York: Pergamon Press, 1971 .
"Zapata Plans Delaware Bay Bulk Terminal," Ocean Industry, Vol. 5 No. 3, (1971) pp. 21 -22.
131

OTHER REFERENCES
Alaska Department of Highways, ~ersonal conversation, Fairbanks, Alaska, Nov. 1972.
B. F. Gmdrich Industrial Products Compny, personal correspondence, Akron, Ohio, Nov- ember 6, 1972.
Carrington Company, personal conversation, Fairbanks, Alaska, August 1972.
C. ltoh and Co. (America Inc.), Telegram to Dr. E. Wolff, July, 1972.
Cold Regions Research and Engineering Laboratory, personal conversation, Fairbanks, Alaska, July 26, 1972.
Consolidated Pips and Supply Company, personal correspondence, Birmingham, Alabama, March 27, 1972.
Consol idated Pipe and Supply Company, personal correspondence, Birmingham, Alabarncl, June 19, 1972.
Cyclops Corporation, Elwin G . Smith Division, personal correspondence, Pittsburgh, Penn- sylvania, October 5, 1972.
Dehn, Commander Wm. S. "SW Ice Problems Related to the Petroleum Industry," A lecture given at the University of Alaska, September, 1972.
FMC Corporation, Link-Belt Material Handling Systems Division, personal correspondence, Colmar Pennsylvania, July 24, 1972.
General Electric Transportation Systems Business Division, personal correspondence, Erie, Pennsylvania, June 1, 1972.
Goodyear Tire and Rubber Company, personal correspondence, Akron, Ohio, August 24, 1972.
Hewitt Robins Engineers and Constructors, personal correspondence, Totowa, New Jersey, August 15, 1972.
Hey1 and Patterson I nc . , Personal correspondence, Pi itsburgh, Pa., July 7, 1972.
Kaiser Steel Company, personal correspondence, Oakland Calif., June 14, 1972.
Lost River Mining Co., personal conversation, Fairbanks, March 28, 1972.
Marcona Corporation, personal correspondence, Son Francisco, Calif., June 15, 1972.
McDowell Wellman Engineering Company, personal correspondence, Cleveland, Ohio, July 7, 1972.
McNally Pittsburg Manufacturing Corp., personal correspondence, Pittsburgh, Kansas, May 10, 1972.
132

Rhoads, E. , personal conversation, Fairbanks, Alaska, September 1972.
Swan Wooster Engineering Company, personal correspondence, Vancouver, B. C., August 7, 1972.
U. S. Bureau of Land Management, personal conversation, Fairbanks office, July 1972.
U. S. Department of the Interior, Bureau of Mine, personal correspondence, Fairbanks, Alaska, July 20, 1972.
U. 5 . Department of Transportation, U. S. Coast Guard, personal correspondence, Seattle, Washington, May 25, 1972.
U. S. Steel Corporation, Wilson Snyder Pumps Division, personal correspondence, Dallas, Texas, June 29, 1972.
MAPS
Barnes, Farrell. Coal Fields of the United States (map) Sheet 2 Alaska: U. S. Department of the Interior, U . S. Geological Survey, 1961.
United States Department of Commerce, National Oceanic and Atmospheric Administration - Maps:
C & GS 9302 Bering Sea 1971 C & GS 9400 Arctic Coast C & GS 9402 Cape Prince of Wales to Pt. Barrow - 1969
U. S. Department of the Interior, Bureau of Land Management, Alaska, Land Status, Sept- ember 1972.
U. S. Geological Survey Alaska Maps:
Point Hope De Long Mts. Utukok River Point Lay Lookout Ridge lkpikpuk River Umiat Meade River Wainwright Harrison Bay Teshakpuk

In systems Ill, IV and V, a railway capital cost of $2,452,594 per mile was used for
determining railway transportation costs per ton of coal. This figure was derived from the
Tudor, Kelly, Shannon study on the proposed Nenana to Deadhorse railroad, and included
the cost of traversing major rivers and mountain passes. Since a railroad in the foothills and
coastal plain of northwestern Alaska would not be required to cross such formdable terrain,
a cost of $1,800,000 per mile may be more representative for systems 111, IV, and V. This
cost was derived from the same report, but from segments which may be more representative
of northwestern Alaska terrain. The net effect of this lower per mile cost i s to lower the rail
costs per ton from 15 to 25 per cent, and the total transportation costs from 5 to 20 per cent.


![The Economics of Transportation Management … [THE ECONOMICS OF TRANSPORTATION MANAGEMENT SYSTEMS] 3 years, managers are finding that they are expected to do more with less, while](https://img.dokumen.tips/doc/110x75/5ad05edf7f8b9a1d328e3714/the-economics-of-transportation-management-the-economics-of-transportation.jpg)