Embed Size (px)
Citation preview

NASA Contractor Report 201728
Translaminar Fracture Toughness of a
Composite Wing Skin Made of StitchedWarp-knit Fabric
JohH E Maslers
November 1997
https://ntrs.nasa.gov/search.jsp?R=19980017268 2020-05-11T19:57:37+00:00Z

The NASA STl Program O_'ce ...in ProdqTe
Since its founding, NASA has been dedicatedto the advancement of aeronautics and spacescience. The NASA Scientific and Technical
Information (STI) Program Office plays a key
part in helping NASA maintain thisimportant role.
The NASA STI Program Office is operated by
Langley Research Center, the lead center forNASA's scientific and technical information.
The NASA STI Program Office providesaccess to the NASA STI Database, the
largest collection of aeronautical and spacescience STI in the world. The Program Officeis also NASA's institutional mechanism for
disseminating the results of its research and
development activities. These results arepublished by NASA in the NASA STI ReportSeries, which includes the following report
types:
TECHNICAL PUBLICATION. Reports ofcompleted research or a major significantphase of research that present the resultsof NASA programs and include extensivedata or theoretical analysis. Includes
compilations of significant scientific andtechnical data and information deemed
to be of continuing reference value. NASAcounter-part of peer reviewed formalprofessional papers, but having lessstringent limitations on manuscriptlength and extent of graphic
presentations.
TECHNICAL MEMORANDUM.
Scientific and technical findings that arepreliminary or of specialized interest,
e.g., quick release reports, workingpapers, and bibliographies that containminimal annotation. Does not contain
extensive analysis.
CONTRACTOR REPORT. Scientific and
technical findings by NASA-sponsoredcontractors and grantees.
CONFERENCE PUBLICATION.
Collected papers from scientific andtechnical conferences, symposia,seminars, or other meetings sponsored or
co-sponsored by NASA.
SPECIAL PUBLICATION. Scientific,
technical, or historical information from
NASA programs, projects, and missions,often concerned with subjects havingsubstantial public interest.
TECHNICAL TRANSLATION. English-
language translations of foreign scientificand technical material pertinent toNASA's mission.
Specialized services that help round out theSTI Program Office's diverse offerings include
creating custom thesauri, building customizeddatabases, organizing and publishingresearch results ... even providing videos.
For more information about the NASA STI
Program Office, see the following:
• Access the NASA STI Program Home
Page at http://www.st1:nasa.goe
E-mail your question via the Internet [email protected]
Fax your question to the NASA Access
Help Desk at (301) 621-0134
• Phone the NASA Access Help Desk at(301) 621-0390
Write to:
NASA Access Help DeskNASA Center for AeroSpace Information800 Elkridge Landing Road
Linthicum Heights, MD 21090-2934

NASA Contractor Report 201728
Translaminar Fracture Toughness of a
Composite Wing Skin Made of Stitched
Warp-knit Fabric
John E Masters
Lockheed ._lartin EGw'neerin Z and Sciences, Hampton, Vi'rzim'a
National Aeronautics and
Space Administration
Langley Research Center
Hampton, Virginia 23681-2199
Prepared for Langley Research Centerunder Contract NAS1-96014
November 1997

The use of trademarks or names of manufacturers in the report is]
for accurate reporting and does not constitute an official]
endorsement, either expressed or implied, of such products or]manufacturers by the National Aeronautics and Space I
Administration, I
Available from the following:
NASA Center for AeroSpace Information (CASI)
800 Elkridge Landing Road
Linthicum Heights, MD 21090-2934(301) 621-0390
National Technical Information Service (NTIS)
5285 Port Royal Road
Springfield, VA 22161-2171
(703) 487-4650

Abstract:
A series of tests were conducted to measure the fracture toughness ofcarbon/epoxy composites. The composites were made from warp-knit carbon fabricand infiltrated with epoxy using a resin-film-infusion process. The fabric, which wasdesigned by McDonnell Douglas for the skin of an all-composite subsonic transportwing, contained fibers in the 0 °, ±45 °, and 90 ° directions. Layers of fabric were stacked
and stitched together with DuPont Kevlar® yarn to form a 3-dimensional preform.
Three types of test specimens were evaluated: compact tension, center notchtension, and edge notch tension. The effects of specimen size and crack length onfracture toughness were measured for each specimen type.
These data provide information on the effectiveness of the test methods and ongeneral trends in the material response. The scope of the investigation was limited bythe material that was available.
Introduction
McDonnell Douglas will design and build an all-composite wing for acommercial transport aircraft as part of NASA's AST Composite Wing Program. Thedesign will address the requirements of the FAA's FAR Airworthiness Standards. Thisincludes the requirement that the wing maintain adequate strength after sustainingdetectable impact damage and discrete source damage. Traditionally, discretesource damage is represented as a two-bay crack. A fracture mechanics methodologyis being developed by NASA to address this requirement and to support the wingdesign.
This report describes the results of a program conducted to developexperimental data in support of NASA's analytical efforts. A series of tests wereconducted to measure the fracture toughness of composites made of stitched warp-knitfabric. Three test methods were investigated: compact tension, center notch tension,and edge notch tension. Tests were conducted to assess the sensitivity of the testresults to specimen size, crack length, and specimen thickness. Notch openingdisplacement was also monitored in some tests to define the onset of damage at thenotch tips and to establish failure mechanisms.
A description of the materials tested is provided in the next section. This will befollowed by a definition of the test specimens and experimental procedures. A reviewof the test results is given in the following section. The final section of the reportprovides a few summary observations.
Materials Investigated.
The composites tested in this study were fabricated from an AS4 carbon warp-knit fabric made using technologies adapted from the textile industry. The fabric,which was designed by McDonnell Douglas for the skin of an all-composite subsonictransport wing, contained AS4 fibers in the 0°, ±45 °, and 90 ° directions. Theorientation and areal weight of each ply of fibers in the fabric is listed in Table I. By
Kevlar is a registered trademark of E. I, DuPont.
!

areal weight,44% of the fibers were configured in the 0 ° direction, 44% in the ___45°directions, and 12% in the 90 ° direction. Layers of fabric were stacked and stitchedtogether using a modified lock stitch to form a 3-dimensional preform of requiredthickness. Kevlar 29 yarns of 1600 and 400 denier were used for the needle andbobbin threads, respectively. The thickness of the stitched warp-knit fabric is 0.056inches per layer, which is equivalent to 54 plies of prepreg with a 4.3oz/yd 2arealdensity. The same fabric was stitched together to make tee-shaped stiffeners thatwere also stitched to the skin. After stitching, the preforms were infiltrated with 3501-6epoxy using a resin-film-infusion process.
Table I. Preform Fiber Orientation and Areal Weight
Ply Number
1234567
Orientation Fiber Areal Weight(Oz/yd 2)
+45 5.19-45 5.190 10.9
90 5.860 10.9
-45 5.19+45 5.19
All the specimens tested in this study were fabricated using the materials andprocedures described above. They differed only in their thickness and stitch spacing.Test specimens were obtained from two sources. Most were machined from a largestructural test panel that had been fabricated by McDonnell Douglas in Long Beach,CA and tested at NASA Langley. This 5-stringer panel featured blade stiffenersspaced 8 inches apart. Test specimens were cut from the undamaged sections ofwing skin material between the stiffeners. The remaining specimens were machinedfrom two plain 35-inch by 44-inch plates fabricated at NASA Langley.
McDonnell Douglas Material
The specimens machined from the 5-stringer panel consisted of six layers ofthe warp-knit fabric. The fabric was stitched (8 stitches/inch) in the 0° fiber direction.The rows of stitches were 0.5 inches apart.
The target fiber volume content was 54.2%. On average, the actual fibervolume content, which was determined through the matrix digestion technique definedin ASTM Test Method D-3171 was 55.4%. An examination of the specimens indicatedthat over-compaction of the stitched fabric during manufacture resulted in a 0.025-inch-thick layer of neat resin on one surface of the composites. Discounting thissurface layer, the composites had an effective fiber volume content of 59.4%. Stresseswere calculated using the thickness associated with the 55.4% fiber volume content.
A series of tensile tests were conducted to determine unnotched tensile
properties. The modulus, Poisson's ratio, and strength were measured. Theseproperties were measured in the axial or 0 ° direction only. The transverse properties
2
could not be measuredsince a viable transversetension specimencould not be madefrom the materialbetweenthe panel'sstiffeners. The resultsof these testsaresummarizedin Table I1.
Table I1. Warp-knitMaterial'sAxial Tensile Properties(6 fabric layers)
Specimen No.
501 -T1501 -T2501 -T3501-T4
Avg. ± Std.Dev.
Modulus, Poisson's Max. Stress,Msi Ratio ksi
10.5 0.398 117.210.3 0.406 122.010.8 0.408 118.510.1 0.384 118.6
10.4 - 0.30 0.399 -+ 0.011 119.2 ± 2.1
NASA Langley Material
The test panels fabricated at NASA Langley consisted of only two layers of thewarp-knit fabric. The thickness of the test specimens machined from these panelswere, therefore, 113 that of specimens cut from the 5-stringer panel fabricated byMcDonnell Douglas. Like the Douglas material, these panels were also stitched in the0 ° fiber direction at a stitch density of 8 stitches/inches. However, the rows of stitcheswere only 0.2 inches apart.
The mechanical properties of these panels were determined by Dr. Alan T.Nettles of the Mechanics of Materials Branch at NASA Langley Research Center. Asummary of the tensile properties measured are contained in Table II1.
Table III. Warp-knit Material's Axial Tensile Properties (2 fabric layers)
Property
Modulus, MsiPoisson's RatioMax. Stress, ksi
Longitudinal,
Avg. _+Std.Dev.
10.19 _ 0.190.400 _ 0.058
131.1 ±7.0
Transverse,
Avg. _+Std. Dev.
4.05 _0.060.172 -0.009
40.4 ±2.6
A comparison of the data in the two tables indicates that the two materials hadcomparable axial properties. Dr. Nettles' data also provides a measure of thematerial's anisotropy.
Poe (Ref. 1) derived the following expression to compute the fracture toughnessof a composite laminate in terms of constituent properties and a characteristic distancedo equal to 0.30 inches 1'2,which was evaluated using test data.

The 0° layers are assumedto be the critical layers,and the fibersand matrixareassumedto be well bonded. Representingthe stitchedwarp-knit fabric as a laminateand taking the tensile failingstrainof the fibers as _tut= 0.0148 and the elasticconstantsas E,= 10.4Msi, Ey= 5.22Msi, Vxy= 0.403, v_ = 0.202, the aboveequation gives the fracturetoughness (K,)p,_= 64.5ksi-inches1_. Also, for thecompositerotated90° relativeto the crack, the equationwith the subscriptsx and yinterchangedgives the fracture toughness (K,)p,ed= 32.4 ksi.inches_. Noticethat theterm v_,v_ is the samefor both composite orientations and that (Ki)pred iS therefore
proportional to the elastic modulus perpendicular to the crack.
Test Specimens and Experimental Procedures.
Three test methods were used to measure the material's fracture toughness:compact tension, center notch tension, and edge notch tension. The specimen sizeswere varied in each type of test to determine if test results were sensitive to specimengeometry. The ratio of the notch length, a, to the specimen width, W, was also variedin these tests to measure the sensitivity of the toughness measurements to thisparameter.
Compact Tension Test Specimens
The Compact Tension Test Specimens evaluated in this investigation werebased on the specimen design defined in ASTM test method E-399-90. That methodwas developed to measure the plane-strain fracture toughness of metallic materials.Two specimen sizes were tested. Their geometries are defined in Figures 1 and 2. Asthe figures indicate, the Large Compact Tension Specimens are twice the size of theSmall Compact Tension Specimens.
Figure 1.
11.70
Stitch Direction0.375 dia.
I J 0.385,I
,I
w (1.4oo) 'P"I
1.750-------I_
Small Compact Tension Geometry.
4
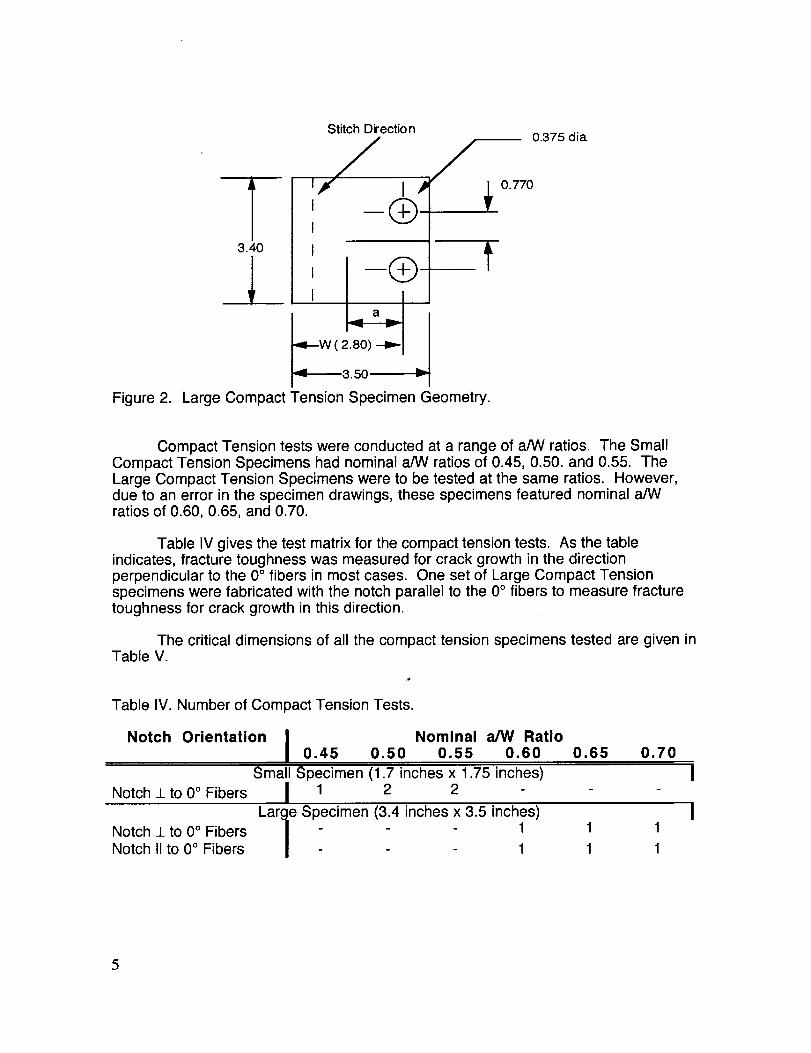
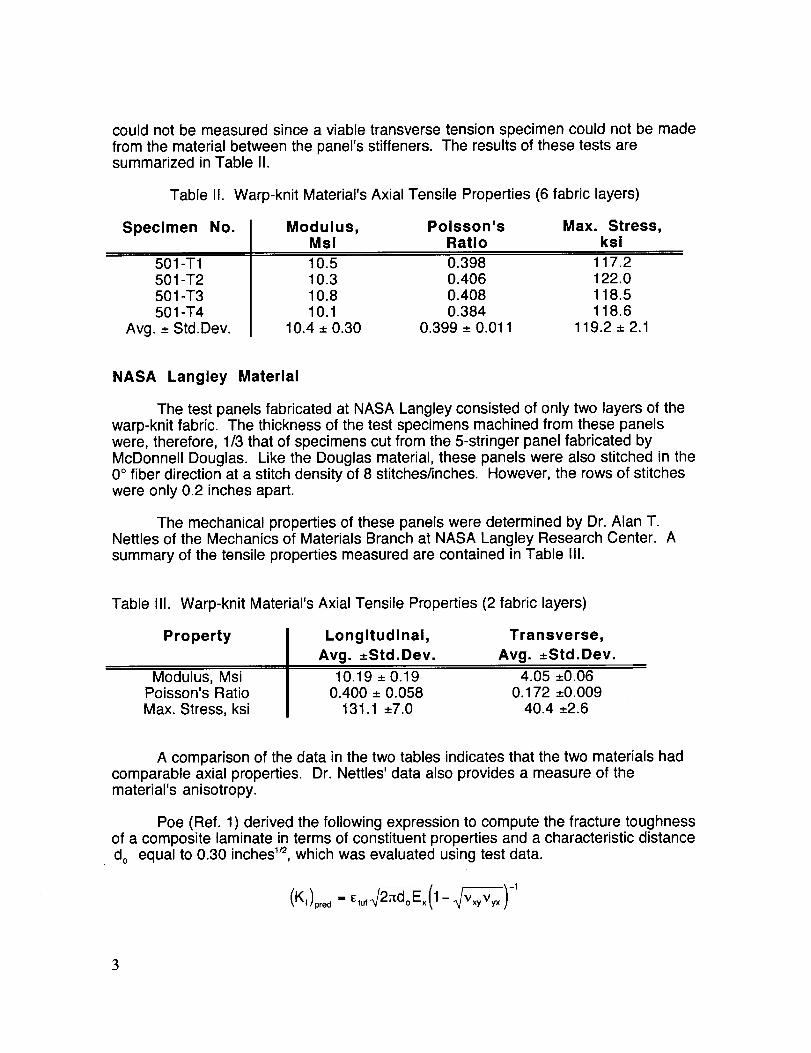
Figure2.
3.40
0.770
_1_3.50
Large Compact Tension Specimen Geometry.
0.375 dia.
Compact Tension tests were conducted at a range of a/W ratios. The SmallCompact Tension Specimens had nominal a/W ratios of 0.45, 0.50. and 0.55. TheLarge Compact Tension Specimens were to be tested at the same ratios. However,due to an error in the specimen drawings, these specimens featured nominal a/Wratios of 0.60, 0.65, and 0.70.
Table IV gives the test matrix for the compact tension tests. As the tableindicates, fracture toughness was measured for crack growth in the directionperpendicular to the 0 ° fibers in most cases. One set of Large Compact Tensionspecimens were fabricated with the notch parallel to the 0° fibers to measure fracturetoughness for crack growth in this direction.
The critical dimensions of all the compact tension specimens tested are given inTable V.
Table IV. Number of Compact Tension Tests.
Notch Orientation I Nominal a/W RatioI 0.45 0.50 0.55 0.60 0,65 0.70
Notch _Lto 0 ° Fibers
Notch _Lto 0 ° FibersNotch II to 0 ° Fibers
Small Specimen (1.7 inches x 1.75 inches)
I 1 2 2
Large Specimen (3.4 inches x 3.5 inches)
/ - - 1 1 1
- - 1 1 1
5

Table V. CompactTensionSpecimenDimensions.
Specimen Number I Thickness,I Inches
Width, ActualInches a/W Ratio
Small Specimens (1.7 inches x501 -CT-11 0.354501 -CT-21 0.351501 -CT-22 0.353501 -CT-31 0.352501 -CT-32 0.352
1.75 inches) with Notch _L to 0 ° Fibers1.409 0.461.407 0.501.409 0.511.403 0.561.404 0.56
Large Specimens (3.4 inches x 3.5 inches) with Notch _Lto 0 ° FibersCT-1L I 0.330 2.759 0.57
CT-2L I 0.331 2.825 0.63CT-3L 0.331 2.800 0.69
Large Specimens (3.4 inches x 3.5 inches) with Notch II to 0 ° FibersCT-1L90 I 0.326 2.809 0.57
CT-2L90 I 0.325 2.809 0.63CT-3L90 0.326 2.809 0.69
Center Notch Tension Test Specimens
Three center notch tension test specimens were evaluated in this study. Theyhave been identified by their widths- 2-Inch-Wide, 4-Inch-Wide, and 12-Inch-WideSpecimens.
The 2- and 4-Inch-Wide Center Notch Specimens, shown in Figures 3 and 4,respectively, were fabricated from material taken from the structural test panel materialdescribed earlier. They featured six layers of the warp-knit fabric. As the figuresdemonstrate, the 4-Inch-Wide Specimens were twice as long and wide as the 2-Inch-Wide Specimens. Two crack length/specimen width (2a/W) ratios, 0.25 and 0.33, wereevaluated for each specimen type.
0° Fiber Orection
4.0
T2.0
b_
Figure 3. 2-Inch-Wide Center Notch Tension Specimen Geometry.
6

0° Fiber Election I _ W
8.0
-" 160 "'-
TI
4.0
Figure 4. 4-Inch-Wide Center Notch Tension Specimen Geometry.
The 12-Inch-Wide Center Notch Tension Specimens are shown in Figure 5.They were fabricated at NASA Langley using two layers of the warp-knit fabric definedin Table I!1. The notch length was varied over a wider range in these specimens todetermine whether R-Curve effects were present when the thinner material was tested.Five specimens were tested; their notch lengths ranged from 3.0 inches to 5.0 inchesThe 2a/W ratios evaluated ranged from 0.25 to 0.42.
.4 35.0" i"/
4= 17.5" D,-' - D'-I _ 3.00"
©
© o.ol 5"- IV_'Iwide cut _, _-
.....................................................................
0 a- a. oe
C)" (10 places)
l ,©L ©
C:)_©
.5
4.50"
Figure 5. 12-Inch-Wide Center Notch Tension Specimen.
In addition to the three specimens described above, a series of Inclined CenterNotch Tension specimens with notches inclined at 45 ° to the loading direction werealso fabricated and tested. They were tested to provide a measure of the effect ofmixed Mode I and Mode II loading on fracture toughness. Their projected notchlength/specimen width ratios (2a'/W) were comparable to the 2-Inch-Wide Specimen's2a/W ratios. These specimens are shown in Figure 6.

0° Fiber Direction {VV
5.0 "J /
10.0 ,
Figure 6. Inclined Center Notch Tension Specimen.
The 2- and 4-Inch-Wide and Inclined Center Notch Specimens were tested inload frames equipped with hydraulic grips. The 2- and 4-Inch-Wide Center NotchSpecimens had a test section length to width ratio of 2.0. The Inclined Center NotchSpecimens had a slightly longer test section length to accommodate the inclinednotch. They had a test section length/width ratio of 2.5. Bolted mechanical grips wereused to test the 12-Inch-Wide specimens. They also had a test section length/widthratio of 2.0.
Table VI gives the test matrix for the center notch tension tests. With theexception of the Inclined Center Notch Specimens, all notches were orientedperpendicular to the 0° fiber direction. Center notch specimens were not tested forcrack growth parallel to the 0 ° fibers.
Table VI. Number of Center Notch Tension Tests.
Specimen Type
2-Inch-Wide Specimen1Inclined Notch Specimen
4-Inch-Wide Specimen12-Inch-Wide Specimen
Nominal 2a/W Ratio0.25 0.29 0.33 0.375 0.42
1 1 -1 1 -1 1 -1 1 1 1 1
1Ratio of projected notch length to specimen width, 2a'/W.
The critical dimensions of all the Center Notch Tension specimens tested aregiven in Table VII.
8

Table VII. Center NotchTension SpecimenDimensions.
Specimen Number I Thickness, Width,I Inches Inches
Actual2a/W Ratio
2-Inch-Wide Specimens (2.0 inches x 8.0 inches)501 -CN2 I 0.343 2.001 0.26501 -CN3 I 0.346 2.002 0.34
Inclined Notch Specimens (2.0 inches x 8.0 inches)501 -ICN1 0.323 2.01501 -ICN2 0.324 2.02
4-Inch-Wide Specimens (4.0 inches x 16.0 inches)501 -CN1L I 0.326 4.003 0.25501-CN2L I 0.325 4.000 0.34
12-Inch-Wide Specimens2A#1 0.1132B#2 0.1132A#2 0.1132B#3 0.1122A#3 0.112
(12.0 inches x 35.0 inches)12.005 0.4211.995 0.3812.005 0.3312.015 0.2911.910 0.25
* Ratio of Projected Notch Length to specimen width, 2a'/W.
Edge Notch Tension Test Specimens
Two edge notch tension specimens were also evaluated. Specimen size wasagain altered to determine if notch length effects were manifest. The specimens testedare shown in Figures 7 and 8.
_...,,ill
0 ° Fiber Direction
L., 5.0 'J
"-I10.0
Figure 7. 2-Inch-Wide Edge Notch Tension Specimen Geometry.
T2.0
9

- !l0 ° Fiber Direction a W
1_J 18.0
Figure 8.4-Inch-Wide Edge Notch Tension Specimen Geometry.
T4.0
J_
Like the 2- and 4-Inch-Wide Center Notch specimens, the ends of the EdgeNotch Specimens were also clamped during loading. Both the 2- and 4-Inch-WideEdge Notch specimens had a test section length/width ratio of 3.0.
Table VIII gives the test matrix for the Edge Notch Tension Tests. All notcheswere oriented perpendicular to the 0 ° fiber direction. Edge notch specimens were nottested for crack growth parallel to the 0 ° fibers. The critical dimensions of all the EdgeNotch Tension specimens tested are given in Table IX.
Table VIIi. Number of Edge Notch Tension Tests.
Specimen Type
2-Inch-Wide Specimen4-Inch-Wide Specimen
Nominal a/W Ratio0.25 0.33 0.50
1 1 11 1 -
Table IX. Edge Notch Tension Specimen Dimensions.
Specimen Number I Thickness, Width,I Inches Inches
Actuala/W Ratio
2-Inch-Wide Specimens (2.0 inches x 8.0 inches)501 -ENT1L I 0.322 2.02 0.25
501-ENT2L I 0.321 2.02 0.33501 -ENT3L 0.319 2.02 0.50
4-Inch-Wide Specimens (4.0 inches x 16.0 inches)501 -EN 1G I 0.346 4.003 0.25501 -EN2G I 0.338 4.004 0.34
Experimental Procedures.
All fracture toughness tests conducted in this investigation were run indisplacement control. A ramp rate of 0.05 inches/minute was employed in every test.
The load, cross head displacement, and crack opening displacement (COD)was monitored in all tests. These parameters were scanned and recorded once a
10

second. In addition, strain gages were mounted on a number of specimens tomeasure the far-field strains. Files of these data are available for analysis.
Experimental Results.
Compact Tension Test Results
The results of the compact tension tests are summarized in Table X. Two loadsare listed in the table for each test. The values, listed as PQ, were determined byapplying the procedure defined in Section 9 of ASTM Test Method E399. Thisprocedure is illustrated in Figure 9 where load is plotted against COD for the SmallCompact Tension Specimen 501-CT-21. Section 9 instructs the investigator to draw asecant line through the origin of the test record with the slope (P/v) s = 0.95 (P/v) o,where (P/v)o is the slope of the tangent to the initial linear part of the record. Thecriteria listed in the test method define Po as the intercept of the (P/v)s line and theload-COD curve since the load at every point on the record which precedes theintercept was lower than intercept value.
As Figure 9 illustrates, the specimen was able to sustain additional load beyondPQ, however. This was the case in virtually all of the compact tension tests conducted.The maximum loads attained in each test are also listed in Table X. When this occurs,
E399 requires the investigator to calculate the ratio of Pma,/PQ. If this ratio exceeds1.10, the test is not considered a valid measure of plane strain fracture toughness, K_c.The Pr, aIPQ ratios calculated for each test are listed in the table. The data indicate thatthe values exceeded 1.10 in a majority of cases.
In interpreting these results, it should be noted that E399 was written forisotropic metallic specimens. Composite materials, are generally orthotropic and lesshomogeneous than metals. The applicability of fracture mechanics, in general, andthis method, in particular, have yet to be established. The data presented in this reportwill contribute to that evaluation.
For an infinite plate containing a crack, the stress intensity factors for isotropicand orthotropic plates are equal (Ref. 2). Based on analytical work of Bowie andFreese (Ref. 3) for finite, orthotropic plates with a central crack, the isotropic equationsfor stress intensity factors are within 15% of orthotropic results. Similar accuracy isexpected for the other specimens tested.
The fracture toughness was computed for each test using the following equationfor isotropic materials given in E399.
where:
f(a/W) =
K, = (P/BW"2) f(a/W)
(2 + a / W) /'0.886 + 4.64a / W - 13.32a 2 / W 2 + 14.72a 3 / W3_
(1-a/W) 3'2 [-5.6a'/W' )
where:B = specimen thickness, inches
1!

P = load, kipsW = specimenwidth, inchesa = notch length, inchesf(a/W) = correctionfactor to accountfor specimenwidtheffects
Boththe maximumload, Prnax,and the load determinedby the offsetmethod,PQ,weresubstitutedinto this equation. The resultsare listed in the Table X.
Table X. CompactTensionTest Results.
Specimen I PQ, Pmax, Pmax/PQ
Number I kips kips
f(a/W) Ko, ksi- (K,)max, (K,)pred,in. 1/2 ksi.ln. 1/2 ksl-in. "=
Small Specimens501-CT-11 2.49501 -CT-21 1.90501 -CT-22 1.63501 -CT-31 1.09501 -CT-32 1.41
(1.7 inches x 1.75 inches) with Notch _Lto 0 ° Fibers2.68 1.08 8.58 50.8 54.7 64.52.31 1.22 9.66 44.1 53.6 64.52.32 1.42 9.96 38.7 55.1 64.51.88 1.72 11.77 30.8 53.1 64.51.90 1.35 11.77 39.8 53.6 64.5
Large Specimens (3.4CT-1L I 2.68 2.78
CT-2L I 2.30 2.60CT-3L 1.47 1.88
Avg. Krnax-Std.Dev. = 54.0
inches x 3.5 inches) with Notch _Lto 0° Fibers1.041.131.28
Large Specimens (3.4 inches xCT-1L90 I 1.62 1.68 1.04
CT-2L90 I 1.24 1.24 1.00CT-3L90 0.80 0.91 1.14
_+0.84
12.20 59.6 61.9 64.515.44 63.8 72.2 64.520.45 54.3 69.4 64.5
Av_l. KmaX+Std.Dev. = 67.8 _+5.33.5 inches) with Notch II to 0 ° Fibers
12.20 36.2 37.5 32.415.44 35.1 35.1 32.420.45 30.1 34.1 32.4
Avg. Km x ±Std.Dev. = 35.6 _+1.71
12

2500
2OO0
m 1500i
0
1000
500
0
Figure 9.
0 0.02 0.04 0.06 0.08 0.1 0.12
COD, In
Load vs. COD for Small Compact Tension Specimen 501-CT-21.
Figure 10 plots the typical load vs. COD curve for Large Compact TensionSpecimen CT-2L. As in the case of the Small Compact Tension Specimens, the notchwas cut perpendicular to the 0 ° direction in this specimen.
A comparison of the results obtained for the Small specimen (Figure 9) and theLarge specimen (Figure 10) indicates that, despite their size differences, the twospecimens exhibited similar responses. The curves exhibit a nonlinear response priorthe first load drop. Both specimens also continued to accept load beyond their PQ
levels. Finally, they both reached a maximum load greater than 1.10 times the PQvalue.
Although it is not reflected in these figures, the Large and Small CompactTension Specimens failed in different manners. Macroscopic crack growth in theSmall specimens was parallel to the 0° fibers. Failure progressed from the notch tip ina vertical direction. Failure in the Large specimens progressed in a horizontaldirection from the notch tip, which is usually referred to as self-similar fracture. Thenon-self-similar fracture is sometimes observed in specimens that have positive T-stresses. (The stress intensity factor is the coefficient of the singular term in theWilliams series expansion of stresses, and the T-stress is the coefficient of the zeroorder term.)
13

We_
m
mO
--I
3000
2500
2000
1500
I
........ I I
........................... __ I.............p ...,ri _,_--
COD, In
Figure 10. Load vs. COD for Large Compact Tension Specimen CT-2L.
Figure 11 plots the response of Specimen CT-2L90. This is a Large CompactTension Specimen in which the notch was machined parallel to the 0 ° direction.These specimens also failed in a self-similar manner.
The figure illustrates that, as in the case of Specimen CT-2L (Figure 10), thisspecimen was also able to sustain additional load beyond PQ. However, in contrast tothe specimens in which the crack growth was perpendicular to the 0 ° fibers, themaximum load sustained by the specimen was approximately equal to the loaddefined as PQ. AS the data in Table X illustrates, this was the case in two of the threeCT-L90 specimens tested.
14

1400
1200
1000
w 800J_n
"0
o 600.,J
400
200
.............................. [-I--T;i.....................I I I
_--.d]__.E_I_._.........._ = ......-- I /t,/
r-1 J/..........:........I-_:_
_/ I i I I
.............._ ........f-t......%--f+-t--
rj i i iiiilllli --
I
I
.......................
0 0.02 0.04 0.06 0.08 0.1 0.12
COD, in
Figure 11. Load vs. COD for Large Compact Tension Specimen CT-2L90.
The values of (K_)max for the large compact specimens in Table X were 5 to
10% greater than the (Kj)p,e_ values, depending on notch orientation. Thus, themeasured values were in reasonably good agreement with the predicted values. Thevalues of (K_)max for the small compact specimens, which did not fail in a self-similar
manner, were 84% of (Km)p,e_.
Center Notch Tension Test Specimens
The results of the center notch tension tests are summarized in Table Xl. Thetable lists the 2a/W ratios plus the maximum loads attained during loading. Themaximum stress values were computed by dividing the measured maximum loads bythe cross-sectional areas which were computed using the dimensions given in TableVII.
15

TableXl. CenterNotchTensionTest Results.
Specimen I Actual Max. Load, Max. (Ki)ma x,
Number ]2a/W Ratio kips Stress, ksl-inches 1/2ksi
(Kl)pred,ksl-lnches 1/_
2-Inch-Wide Specimens (2.0 inches x 8.0 inches)501-CN2 I 0.26 44.3 64.5 60.9
501 -CN3 I 0.34 37.2 53.7 59.8inclined Notch Specimens (2.0 inches x 8.0 inches)
I 0.251 39.8 61.3 57.80.331 37.7 57.6 62.4
64.564.5
501 -ICN1501 -ICN2
64.564.5
501-CN1L501 -CN2L
4-Inch-Wide Specimens (4.0 inches x 16.0 inches)
I 0.25 76.7 58.8 77.20.34 59.1 45.5 71.364.564.5
2A#122B#22A#22B#32A#3
12-Inch-Wide Specimens (12.0 inches x 35.0 inches)0.42 39.9 29.4 92.9 64.50.38 52.6 38.8 113.5 64.50.33 47.8 35.2 95.2 64.50.29 57.7 42.9 106.6 64.50.25 64.3 48.2 108.9 64.5
1Ratio of Pro ected Notch Length to specimen width, 2a'/W.2Specimen 2A#1 exhibited transverse buckling prior to failure. An anti-buckling guide
was used to suppress buckling on all subsequent tests.
Except for the inclined notch specimens, the fracture toughness values listed inTable Xl were computed using the following equation developed by Fedderson forisotropic materials (Ref. 2).
K, -- ooo _/-_-a[sec(=a / W)} ''2
where:
o®= maximum applied stressa = half crack lengthW = specimen width
For the inclined notch specimens, the fracture toughness values were computed usingthe following equation for an infinitely wide specimen made of isotropic material (Ref. 4with correction of Ref. 5).
K I= (_®-v_a I sin(13)c°s(-_) [sin(13)c°s2(_)- 3c°s(13)sin(@)] l
[+_-_ [c°s2 (1_)- sin2 (13)] sin2(e) ]
and
]6
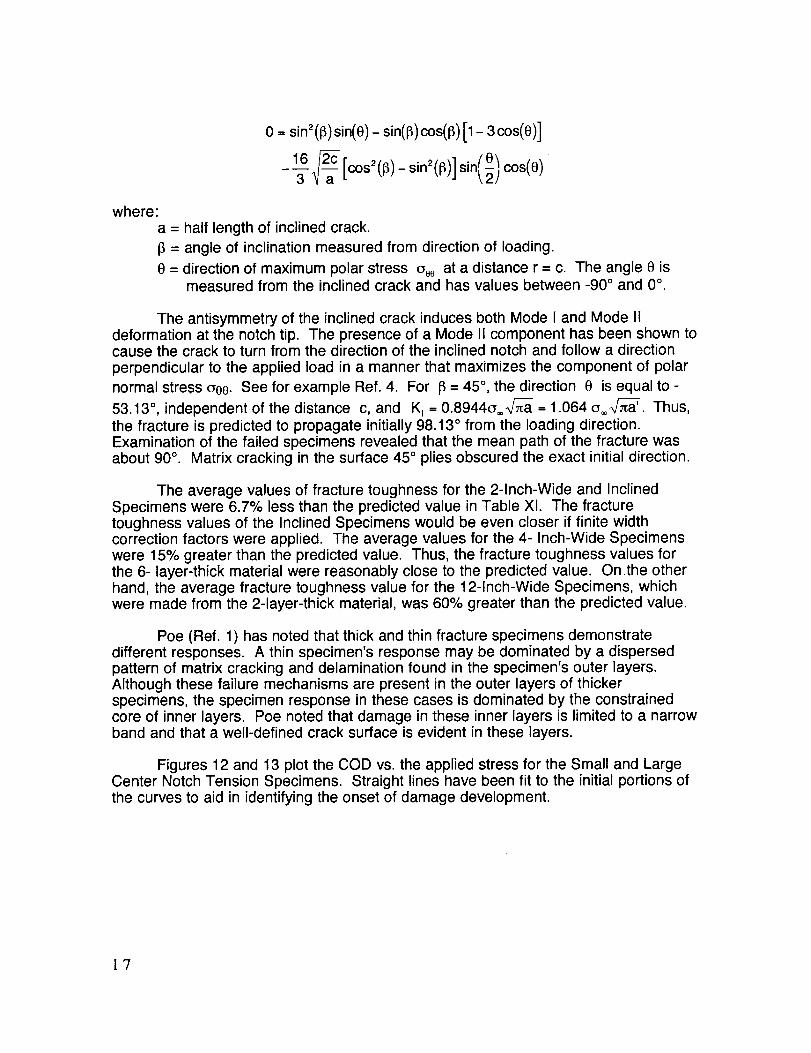
0 = sin2(13)sin(e)- sin(l_)cos(13)[1- 3 cos(e)]
163_ [c°s2 (13)- sin2(l_)] sin(_,2)e--'_cos(e)
where:
a = half length of inclined crack.
13= angle of inclination measured from direction of loading.
e = direction of maximum polar stress oee at a distance r = c. The angle e ismeasured from the inclined crack and has values between -90 ° and 0 °.
The antisymmetry of the inclined crack induces both Mode I and Mode IIdeformation at the notch tip. The presence of a Mode II component has been shown tocause the crack to turn from the direction of the inclined notch and follow a direction
perpendicular to the applied load in a manner that maximizes the component of polar
normal stress aee. See for example Ref. 4. For 13= 45 °, the direction (_ is equal to -
53.13 °, independent of the distance c, and K, = 0.8944a®_ = 1.064 o= _-_/_. Thus,the fracture is predicted to propagate initially 98.13 ° from the loading direction.Examination of the failed specimens revealed that the mean path of the fracture wasabout 90 ° . Matrix cracking in the surface 45 ° plies obscured the exact initial direction.
The average values of fracture toughness for the 2-Inch-Wide and InclinedSpecimens were 6.7% less than the predicted value in Table XI. The fracturetoughness values of the Inclined Specimens would be even closer if finite widthcorrection factors were applied. The average values for the 4- Inch-Wide Specimenswere 15% greater than the predicted value. Thus, the fracture toughness values forthe 6- layer-thick material were reasonably close to the predicted value. Onthe otherhand, the average fracture toughness value for the 12-Inch-Wide Specimens, whichwere made from the 2-layer-thick material, was 60% greater than the predicted value.
Poe (Ref. 1) has noted that thick and thin fracture specimens demonstratedifferent responses. A thin specimen's response may be dominated by a dispersedpattern of matrix cracking and delamination found in the specimen's outer layers.Although these failure mechanisms are present in the outer layers of thickerspecimens, the specimen response in these cases is dominated by the constrainedcore of inner layers. Poe noted that damage in these inner layers is limited to a narrowband and that a well-defined crack surface is evident in these layers.
Figures 12 and 13 plot the COD vs. the applied stress for the Small and LargeCenter Notch Tension Specimens. Straight lines have been fit to the initial portions ofthe curves to aid in identifying the onset of damage development.
1'7

0.025
0.02
,- 0.015
c_0(J
0.01
0.005
Figure 12.
---alP-Small, 2 in wide specimen
---B--Large, 4 in wide specimen
0 1 104 2 104 3 10 + 4 104 5 104 6 104
Stress, psi
COD vs. Stress for Center Notch Specimens (2a/W = 0.25).
7 10 4
18

p.
c_Oo
0.025
0.02
0.015
0.01
0.005
_Small, 2 in. wide specimen
---_--Large, 4 In. wide specimen
0 1 10 4 2 104 3 104 4 10 4 5 10 4 6 104
Stress, psi
Figure. 13. COD vs. Stress for Center Notch Specimens (2a/W = 0.33).
The COD vs. Load plot for a typical 12-Inch-Wide Specimen is shown in Figure14. The specimen was loaded and unloaded four times prior to failure so thatradiographs could be made of the damage at the crack tips. Test results indicated thatlarge changes in the curves' slopes accompanied bursts of matrix cracking anddelamination. This is seen during the fourth and final loading in this specimen.
]9

.m
o00
0.06 _'- 4th0.05
0.04 I _3rd 1
003I S x_-__2rid 1
0.02
0.01
00 10000 20000 30000 40000 50000 60000 70000
Load, Ibf
Figure 14. COD vs. Load for 12-Inch-Wide Center Notch Tension Specimen 2B#2.
Edge Notch Tension Test Specimens
The results of the edge notch tension tests are summarized in Table XlI. Thetable lists the a/W ratios plus the maximum loads attained during loading. As in thecase of the center notch tension tests, the maximum stress values were computed bydividing the measured maximum loads by the cross-sectional areas which werecomputed using the specimen dimensions. These values are given in Table VIII.
The fracture toughness values listed in Table Xll were computed using anequation developed by Gross (Ref. 2) for isotropic materials with uniform appliedstress boundary conditions. The equation is given below:
K, = o= _/-_-a 1.12-0.23(a/W)+ 10.6(a/W) 2 - 21.7(a/W) 3 + 30.4(a/W)'
where:
(_= = maximum applied stress
a = crack lengthW = specimen width
The values of K_ in Table Xll are 41 to 108% greater than Kpred. It should benoted, however, that the boundary conditions that existed in these tests were more
2O

nearly uniformapplieddisplacement. Bloom(Ref. 6) hasshownthat stress intensityfactors underuniformdisplacementconditionscan be muchsmaller than those foruniform stressconditions,dependingon specimenconfiguration. Thus, the values ofK_ are probably calculated incorrectly.
Table Xll. Edge Notch Tension Test Results.
Specimen I Actual Max. Load, Max.
Number I a/W Ratio kips Stress,ksi
(KI)max, (Kl)pred,
ksl.inches _/2 ksl-lnches _/2
Small Specimens (2.0 inches x 8.0 inches)501 -ENT1L I 0.25 31.6 48.6 91.2 64.5
501 -ENT2L I 0.33 25.3 39.0 101.1 64.5501 -ENT3L 0.50 16.9 26.2 134.2 64.5
Large Specimens (4.0 inches x 16.0 inches)501-EN1G I 0.25 51.3 37.0 99.7 64.5501-EN2G I 0.34 40.1 29.6 112.5 64.5
Figures 15 and 16 plot the crack opening displacement (COD) vs. net stresscurves for the Small and Large Edge Notch Tension tests. The data measured forspecimens with a nominal a/W ratio of 0.25 are shown in Figure 15. The 0.33 a/W dataare shown in Figure 16. Straight lines have again been fit to the initial portions of thecurves to aid in identifying the onset of damage development.
21

0.05
0.04
0.03
00
0,02
0.01
0 1 104 2 10i 3 104 4 104
Net Section Stress, psi
5 104
Figure 15. COD vs. Stress for Edge Notch Specimens (a/W = 0.25).
22

0.07
0.06
0.05
c-- 0.04
d0(J
0.03
0.02
0.01
Figure 16.
0 1 104 2 104 3 104 4 104
Net Section Stress, psi
COD vs. Stress for Edge Notch Specimens (a/W = 0.33).
Summary
A series of exploratory tests were conducted to determine the fracturetoughness of stitched multi-axial warp-knit material. Compact tension, center notchtension, and edge notch tension specimens were evaluated. Empirical data weredeveloped to establish the effects of specimen thickness, notch size, and specimensize on the material response. Values of fracture toughness were also predicted fromconstituent properties for comparison.
These date provide information on the effectiveness of the test methods and ongeneral trends in the material response. The limited amount of material availablelimited the scope of the investigation.
The results of the tests are summarized below by test type. Fracture toughnessvalues are also summarized in Figure 17 for all test types.
Compact Tension Tests
• The values of fracture toughness for the large compact specimens were within 10%of the predicted values.
The values of fracture toughness for notches oriented parallel to the 0 ° fibers wereabout one half the values for notches oriented perpendicular to the 0° fibers. Aspredicted, the values of fracture toughness increased in proportion to the elasticmodulus in the direction of loading.
23

The Pmax/PQ ratios exceeded 1.10 in a majority of cases indicating that the fracturetoughness values measured were invalid using the criteria listed in ASTM E399. Itshould be noted, however, that this criteria was developed for isotropic metals.
The Large and Small Specimens exhibited distinctly different macroscopic failures.The cracks grew in a self-similar fashion in the Large Specimens but grewperpendicular to the notch in the Small Specimens. The values of fracturetoughness for the Small Specimens were 84% of the predicted value.
Center Notch Tension Tests
• The average values of fracture toughness for the 2- and 4-Inch-Wide Specimensand Inclined Specimens were between -6.7% and 15% of the predicted value.
The average value of fracture toughness for the 12-Inch-Wide Specimens was60% greater than the predicted value. The 12-Inch-Wide Specimens were muchthinner than the other specimens. The small thickness is believed to cause thehigh toughness since the thick and thin composites had similar unnotchedmechanical properties.
• The crack grew approximately perpendicular to the applied load in the InclinedNotch Specimens as predicted.
Edge Notch Tension Tests
The values of fracture toughness were 41 to 108% greater than the predictedvalue. This discrepancy is probably due to the assumption of uniform stress. Theactual boundary condition was more nearly uniform displacements. Numericalresults in the literature indicate that the stress intensity factor would be significantlylower for uniform displacements than for uniform stress.
24

(Ki)max,ksi_/inches
140
120
100
80
6O
4O
2O
0
- O
- O
- OO- O
z_"_ A o O
o
-Notch parallel
to 0 ° fibers
2 layers of fabric• •
O
OA
Compact tension
-- Predicted
0 1 2 3 4 5 6
Notch length, inches
Figure 17. Summary of Fracture Toughness Values for all test types.
References
1. Poe, Jr. C. C., "Residual Strength of Composite Aircraft Structures with Damage,"ASM Handbook, Vol. 19, Fatigue and Fracture, 1996, pp. 920-935.
2. Tada, H., "The Stress Analysis of Cracks Handbook," Second Edition, ParisProductions Incorporated, 226 Woodbourne Dr. St. Louis, MO, 63105, 1985.
3. Bowie, O. L. and Freese, C. E., "Central Crack in Plane Orthotropic RectangularSheet," Int. Jour. Fract. Mech., Vol. 8, No. 1, March 1972, pp. 49-58.
4. Williams, J. G. and Ewing, P. D., "Fracture under Complex Stress - The AngledCrack Problem," Int. Jour. Fract. Mech., Vol. 8, No. 4, December 1972, pp. 441-446.
5. Finnie, I. and Saith, A., "A Note on the Angled Crack Problem and the DirectionalStability of Cracks," Int. Jour. of Fracture, 9, 1973, pp. 484-486.
. Bloom, Joseph M., The Short Single Edge Crack Specimen with Linearly VaryingEnd Displacements, Int. Jour. Fract. Mech., Vol. 2, No. 4, December 1996, pp. 597-603.
25

REPORT DOCUMENTATION PAGE o_A_o_
Public reporting burden for this colectkm of information Is estimated to average 1 hour per response, incl_r_ file time for reviewin_ k_struc'dons,searching existing data so__ .es,gatherk_ and main_Jnin_ the data needed, and cocnpletingand reviewing _ collectionof information. S_nd comments re_lardin mis .b_.en es_..'mateor any other ,asp_. of thisconect_n of informafion, zncluding sugges_ons for reckcing th_sburden, to W_ Headquarters Servces, _r_aJe to I_o_nation (_I:Jeration$and Reports, 1215 JeffersonDavis Highway, Suite 1204, Adington,VA 22202-4302, and to the Office of Management and Budget, Paperwork Red_ Prolect (704-0188), Washington, DC 20503
1. AGENCY USE ONLY (Leave blank) 2. REPORT DATE 3. REPORT TYPE AND DATES COVERED
November 1997 Contractor Report4. TITLE AND SUBTITLE 5. FUNDING NUMBERS
Translaminar Fracture Toughness of a Composite Wing Skin Made of
Stitched Warp-knit Fabric
6. AUTHOR(S)
John E. Masters
7. PERFORMING ORGANIZATION NAME(S) AND ADDRESS(ES)
Lockheed Martin Engineering and Sciences
Hampton, VA 23681-0001
9. SPONSORING/MONITORING AGENCY NAME(S) AND ADDRESS(ES)
National Aeronautics and Space Administration
Langley Research Center
Hampton, VA 23681-2199
NAS1-96014
WU 538-10-11-05
8. PERFORMING ORGANIZATIONREPORT NUMBER
10. SPONSORING/MONITORINGAGENCY REPORT NUMBER
NASA CR-201728
11. SUPPLEMENTARY NOTES
Langley Technical Monitor: C. C. Poe, Jr.
Final Report - Task DM25
12a. DISTRIBUTION/AVAILABILITY STATEMENT
Unclassified-Unlimited
Subject Category 24 Distribution: Nonstandard
Availability: NASA CASI (301) 621-0390
12b. DISTRIBUTION CODE
13. ABSTRACT (Maximum 200 words)
A series of tests were conducted to measure the fracture toughness of carbon/epoxy composites. The
composites were made from warp-knit carbon fabric and infiltrated with epoxy using a resin-film-infusion process.
The fabric, which was designed by McDonnell Douglas for the skin of an all-composite subsonic transport wing,
contained fibers in the 0 °, -+45°, and 90 ° directions. Layers of fabric were stacked and stitched together with Kevlar
yarn to form a 3-dimensional preform.
Three types of test specimens were evaluated: compact tension, center notch tension, and edge notch
tension. The effects of specimen size and crack length on fracture toughness were measured for each specimen type.
These data provide information on the effectiveness of the test methods and on general trends in the material
response. The scope of the investigation was limited by the material that was available.
14. SUBJECTTERMS
Fracture toughness; Fracture tests; Textile composites; warp-knit fabric; stitching;
Resin film infusion, AS4 carbon fiber; 3501-6 epoxy resin
17. SECURITY CLASSIFICATION 18. SECURH'Y CLASSIFICATION 19. SECURITY CLASSIFICATIONOF REPORT OF THB PAGE OF ABSTRACT
Unclassified Unclassified Unclassified
15. NUMBER OF PAGES
3016. PRICE CODE
A0320. LIMITATION
OF ABSTRACT
Standard Form 296 (Rev. 2-89)Prescribed by ANSI Std, Z-39-18296-1(_
NSN 7540-01-280-5500