Embed Size (px)
Citation preview

Training ProgramPerformance2005Employment and Earnings ofTraining Program ParticipantsExiting Alaska Training Programs in FY 2005
With a Comparison of Performance with FY 2002 through FY 2004 Program Data
A report prepared for the Alaska Workforce Investment Board by theAlaska Department of Labor and Workforce DevelopmentDivision of Administrative ServicesResearch and Analysis SectionFebruary 2007
State of Alaska
Sarah Palin, GovernorCommissioner Click Bishop
Jobs are Alaska’s Future

Training Program Performance 2005 Employment and Earnings of Training Program Participants Exiting Alaska Training Programs in FY 2005 With a Comparison of Performance with FY 2002 through FY 2004 Program Data
A report prepared for the Alaska Workforce Investment Board
by the Alaska Department of Labor and Workforce Development
Division of Administrative Services Research and Analysis Section
Brynn Keith, Chief
Jeff Hadland, Economist Andy Wink, Economist
Amy Soden, Research Analyst
February 2007

i
TABLE OF CONTENTS
Letter from the AWIB Chairman.............................................................................................. ii Overview and Executive Summary ......................................................................................... iii Overview of Performance Measures..........................................................................................1 Methodology..............................................................................................................................2 Training Programs and Funding Sources Included in this Report.............................................3 FY 2005 Performance Measures Summary ...............................................................................4 Employment Status and Trends .................................................................................................4 Earnings Trends .........................................................................................................................5 Training Program Participants Served by Multiple Programs...................................................6 AWIB Priorities .........................................................................................................................6 Working in an Occupation Related to Training.........................................................................7 Training Program Customer Satisfaction...................................................................................8 FY 2005 Data Summary ..........................................................................................................10 Long Term Follow-up of FY 2002 Exiters – Where Are They Now?.....................................11 Adult Training Programs Alaska Technical Center – Kotzebue.......................................................................................13 Alaska Vocational Technical Center (AVTEC) – Seward ......................................................15 University of Alaska Vocational Education Programs ............................................................19 WIA Title 1B Dislocated Worker Program .............................................................................24 State Training and Employment Program (STEP)...................................................................26 TAA .........................................................................................................................................29 Adults with Barriers Programs WIA Title 1B Adult Program ..................................................................................................32 Work Search.............................................................................................................................34 Youth Programs WIA Title 1B Youth Program..................................................................................................37 Other Programs Vocational and Technical Education Programs Supported by Carl Perkins Funding .............40 Carl Perkins – Post-Secondary and Tech-Prep ........................................................................41 Carl Perkins – Secondary.........................................................................................................43 Adult Basic Education .............................................................................................................45 Denali Training Fund...............................................................................................................49 Southwest Alaska Vocational Education Center (SAVEC) – King Salmon ...........................51 Ilisagvik College – Barrow ......................................................................................................53 Yuut Elitnaurviat – Bethel .......................................................................................................55

ii
February 15, 2007 I am pleased to present the Training Program Performance 2005 report, prepared for the Alaska Workforce Investment Board by the Research and Analysis Section of the Alaska Department of Labor and Workforce Development. As the lead planning and coordinating entity for workforce development in Alaska, the board provides policy oversight of state and federally funded job training and vocational education programs. AWIB members, many of whom are private sector leaders, examine employment trends and emerging occupations to ensure training efforts are aligned with market demand and Alaskans are ready for the good paying, high demand jobs that are available to them. Each year, the AWIB reports to the Alaska State Legislature on the performance of training programs within its purview, as specified in Alaska Statute 23.15.580(b)(9) and (f). The report demonstrates that nearly 20,000 Alaska training participants exited the training programs covered in the report in 2005. The full report may also be found on the department’s website at www.labor.state.ak.us/awib/home.htm. The Alaska Workforce Investment Board welcomes your support and perspectives. We look forward to working closely with you to build a quality workforce and a prosperous, satisfying future for all Alaskans.
Andy Baker, Chair Alaska Workforce Investment Board
P.O. BOX 111149 JUNEAU, ALASKA 99811-1149 PHONE: (907) 465-2700 FAX: (907) 465-2784
Sarah Palin, GOVERNOR
DEPARTMENT OF LABOR AND WORKFORCE DEVELOPMENT
Alaska Workforce Investment Board

iii
Alaska Workforce Investment Board Overview and Executive Summary
AWIB Vision
An Opportunity for Employment for All Alaskans. • Right Skills - A prepared and motivated workforce. • Right Person - Workers and employers connect. • Right Job - Alaskans meeting their potential for employment
in the areas of skills, salary and satisfaction. • Right Time - Linkages that produce a skilled Alaskan
workforce when and where needed.
AWIB Mission To provide leadership, and recommend policy, direction and
accountability standards to get Alaskans into jobs. AWIB Objectives
• 65 percent of training participants entering employment related to the training received.
• At least 60 percent of the training programs on the Eligible Training Provider List are registered apprenticeships, adhere to industry-based skill standards, or result in accredited degrees.
• Increase the rate of participants entering employment by 2 percent per year. • Increase market share among employer customers by 2 percent per year. • Reduce non-resident employment by 3 percent. • Earnings increase equal to 50 percent of a participant’s training cost within
six months. • 60 percent of participants trained in occupations identified by the board as
belonging to a priority industry. AWIB Recommendations The Alaska Workforce Investment Board (AWIB) and the Alaska Department of Labor and Workforce Development are committed to pursuing the best possible employment opportunities for Alaskans. One of the primary duties of the board is to advise the Governor, Legislature, and stakeholders of the workforce investment system. The AWIB has assessed the 2005 performance of employment training programs and offers the following recommendations: Governor and Legislature
• Aggressively expand the effective Jobs Are Alaska’s Future initiative by supporting the Alaska Hire and Alaska Youth First initiatives, and continuing the efforts begun under a federal grant award, the High Growth Job Training Initiative for Energy.
iv
• The Legislature should increase funding for the highly successful State Training and Employment Program (STEP) by doubling the employees’ portion of Unemployment Insurance contribution usable for training.
• Continue general fund investment in the Adult Basic Education (ABE) Program which prepares Alaskans for employment by providing instruction in the basic skills of reading, writing, mathematics, and General Educational Development (GED) preparation and testing, emphasizing practical life skills and workplace readiness skills.
• Add the “Everything you want to know about jobs” link to the quick links of the state’s web site.
Other Stakeholders
• Business and industry must invest in growing Alaska’s economy by committing resources to employment training and vocational education in order to achieve their Alaskan hire goals.
• Recognize and encourage that healthy communities encompass education, economic development and workforce development activities to improve the quality of life.
• Raise expectations for training and education quality and post-training employment.
• Increase coordination and collaboration between state and federal agencies, business and industry, and service providers.
• Ensure equal access, opportunity and representation in all aspects of workforce development, economic development, education and training for rural Alaskans.
Training and Service Providers
• End the duplication of effort created through multiple systems; look for opportunities to match funding sources; and share responsibilities between private and public resources.
• Be responsive to business needs, the changing economy, and the workforce needs of the future.
• Educators and employers should prepare Alaska’s youth for Alaskan jobs by adopting employability standards and coordinating with state agencies to make them effective tools.
• Implement the board-approved policies that recommend industry-based skill standards in workforce development and training.
v
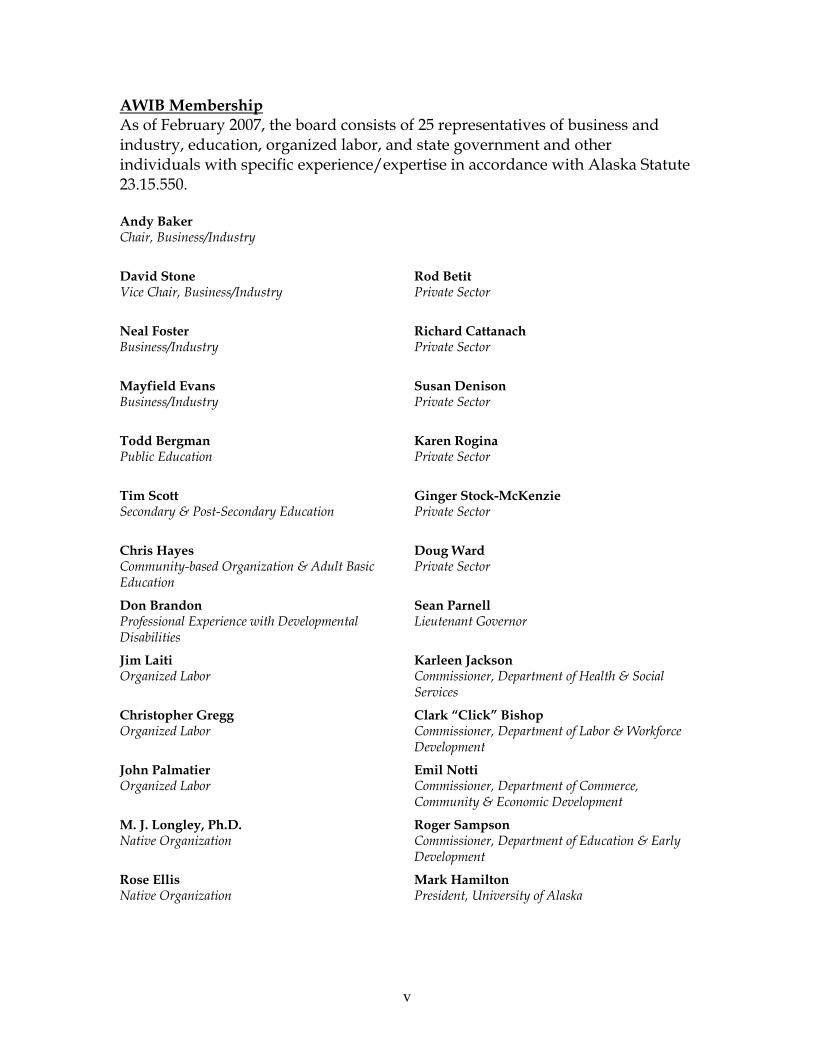
AWIB Membership As of February 2007, the board consists of 25 representatives of business and industry, education, organized labor, and state government and other individuals with specific experience/expertise in accordance with Alaska Statute 23.15.550. Andy Baker Chair, Business/Industry
David Stone Vice Chair, Business/Industry
Rod Betit Private Sector
Neal Foster Business/Industry
Richard Cattanach Private Sector
Mayfield Evans Business/Industry
Susan Denison Private Sector
Todd Bergman Public Education
Karen Rogina Private Sector
Tim Scott Secondary & Post-Secondary Education
Ginger Stock-McKenzie Private Sector
Chris Hayes Community-based Organization & Adult Basic Education
Doug Ward Private Sector
Don Brandon Professional Experience with Developmental Disabilities
Sean Parnell Lieutenant Governor
Jim Laiti Organized Labor
Karleen Jackson Commissioner, Department of Health & Social Services
Christopher Gregg Organized Labor
Clark “Click” Bishop Commissioner, Department of Labor & Workforce Development
John Palmatier Organized Labor
Emil Notti Commissioner, Department of Commerce, Community & Economic Development
M. J. Longley, Ph.D. Native Organization
Roger Sampson Commissioner, Department of Education & Early Development
Rose Ellis Native Organization
Mark Hamilton President, University of Alaska
vi
Priority Industries A critical component of the AWIB’s policy oversight and planning is targeting priority industries for investment of workforce development resources. With the assistance of economists at the Alaska Department of Labor and Workforce Development and input from industry groups, the board has identified the following priority industries based on “best bet” occupational forecasts:
• Construction • Transportation • Natural resource development (i.e., mining and petroleum) • Health care • Seafood processing and harvesting • Information technology • Hospitality and tourism • Education
Note: The Board will engage in a review of priority industries in 2007. Report Highlights
• Nearly 20,000 Alaska training participants exited the training programs covered in the report.
• More than 69% of exiting participants were employed in Alaska wage and salary employment during months 7 to 12 after exit.
• Further matching with federal civilian and military employment raised the employment rate to 73.3%.
• 76% of employed participants were working in the private sector. • Overall, 52.8% of employed exiting program participants were employed
in priority industry/occupation categories. The highest rates of AWIB priority employment were found in the federally sponsored Trade Act Assistance Program and at the Alaska Technical Center.
• The primary employers in the non-priority industry category were state and local government, which account for 11% of post-exit employment, and retail, which also accounts for 11% of post-exit employment.
TRAINING PROGRAM PERFORMANCE—2005
Alaska Department of Labor and Workforce Development, Research and Analysis Section 1
Overview of Performance Measures The Alaska Department of Labor and Workforce Development, through the Alaska Workforce Investment Board (AWIB), evaluates state employment related training programs to determine the employment status, earnings, and customer satisfaction of program participants after completion of the program. Specific required performance measures, as identified in AS 23.15.580 (f), to be calculated include:
The percentage of former participants who have jobs one year after leaving the training program. The percentage of employed training program participants is determined by matching training program records with Alaska unemployment insurance wage records for the months 7 to 12 (third and fourth quarter) following exit from the training program. Employment during the full year following exit from the program is also reported for each program. The median wage of former participants 7 to 12 months after leaving the program. The median total earnings of training program participants during months 7 to 12 following exit from the training program is determined from Alaska unemployment insurance wage records. Total earnings from all employers are calculated, and then all workers with some reported wages are arrayed from lowest to highest reported earnings. Half of the exiting participants with earnings fall above the median earnings level, half fall below. The percentage of former participants who were employed after leaving the training program who received training under the program that was directly related, or somewhat related, to their jobs, 7 to 12 months after leaving the training program. When the specific course or type of occupational training received is known, that information is compared with occupation data provided by employers on their Alaska unemployment insurance wage records to determine if the occupation is related to the course of study. When training program participants work in more than one occupation, the occupation in which they earned the most money in the post-training period is compared with the training program.
The customer satisfaction of exiting training program participants. Customer satisfaction is measured for the Workforce Investment Act (WIA) and State Training and Employment Program (STEP) participants from telephone surveys. Using the same survey questions, vocational education participants exiting the University of Alaska, Alaska Vocational Technical Center (AVTEC), and Alaska Technical Center programs in FY 2005 were surveyed by mail.
TRAINING PROGRAM PERFORMANCE—2005
Alaska Department of Labor and Workforce Development, Research and Analysis Section 2
Methodology Each training program provided participant social security numbers, training start dates, and training completion or exit dates. Some programs provided information on the types of training in which the participants were enrolled, as well as demographic information about the participants. Participant records were matched with historical Alaska unemployment insurance (UI) wage records. Alaska UI wage records provide the most comprehensive, quarter by quarter source of historical employment, earnings, occupation, and place of work information for each training program participant. Employment and earnings outcome data are based upon Alaska UI wage record data unless otherwise noted. Data were also collected on the current occupation of the training program participant. Participants currently working in an occupation directly related to their training are identified. To provide additional information on current work status, continuing education, and residency, program participant records were also matched with:
• Federal military and civilian payroll records • Alaska business license files • Alaska occupational license files • Alaska unemployment insurance records • National Student Clearinghouse records providing information on continuing postsecondary
education anywhere in the US • Alaska Permanent Fund Dividend (PFD) files to determine current residency status
This information is presented in the summary performance tables for each program.

TRAINING PROGRAM PERFORMANCE—2005
Alaska Department of Labor and Workforce Development, Research and Analysis Section 3
Training Programs and Funding Sources Included in this Report ALASKA
TECHNICAL CENTER
Alaska Technical Center in Kotzebue is designed to meet the vocational and technical training needs of rural Alaskans in four core areas: office occupations, building industrial technology, industrial mine maintenance, and health occupations. Also provides Adult Basic Education, GED programs and a wide variety of short-term training.
ALASKA VOCATIONAL
TECHNICAL CENTER
Technical and related training in Seward to students throughout Alaska. Provides market driven education in response to the needs of Alaska's business and industry. Programs are aimed at careers in areas such as allied health, business and office technology, applied technology, food service technology, learning resources, physical plant technology, and marine and fisheries.
U OF A VOC. ED. Adult vocational training at University of Alaska campuses throughout Alaska.
WIA TITLE IB DISLOCATED
WORKER
Provides employment and training assistance for dislocated workers. Services available include career counseling, testing, job placement, occupational training, relocation assistance and other services.
STATE TRAINING &
EMPLOYMENT PROGRAM-STEP
Funded by a percentage of employee contributions to the Alaska unemployment insurance trust fund, provides training and/or reemployment assistance to unemployed or under-employed workers who have worked in a job covered by UI in the past 3 years. By reducing the length of time that workers are unemployed, the program is designed to reduce the amount of unemployment insurance benefits that are paid.
AD
UL
T T
RA
ININ
G
TAA Federal entitlement program which offers help to workers who lose their jobs or whose hours of work and wages are reduced as a result of increased imports from any country.
WIA TITLE IB ADULT
PROGRAM
Adult Program supports training and services for adults who face multiple barriers to employment. Program services include an assessment of needs and abilities and services such as classroom training, on-the-job training, job search assistance, work experience, counseling, basic skills training, and support services.
AD
UL
TS
W/
BA
RR
IER
S
WORK SEARCH
Four-week program intended to help Temporary Assistance (ATAP) clients in their efforts to obtain and keep a job. Work Search attempts to move clients into the workforce as quickly as possible. All Temporary Assistance clients who are not exempt from participating in work activities are required to attend Work Search.
YO
UT
H
WIA TITLE IB YOUTH
PROGRAM
Year-round youth program provides training and employment programs for both in-school and out-of-school youth. Services may include limited internships in the private sector, school-to-work transition services, and alternative high school services. The targeted population is youth between the ages of 16 and 21. Summer youth employment program designed to improve basic education skills, encourage school completion, provide exposure to work, and enhance citizenship skills. The targeted population is low-income youth between the ages of 14 and 21.
CARL PERKINS VOCATIONAL
PROGRAMS
The Carl Perkins Vocational and Technical Education Act of 1998 was implemented to assist in the development of the academic, vocational, and technical skills of secondary and postsecondary students that choose to enroll in vocational and technical education programs.
DENALI TRANING FUND
The Denali Training Fund was established by the Denali Commission to ensure local residents have the skills necessary to become employed on the construction, operation, and maintenance of Denali Commission and other public infrastructure projects in rural Alaska.
ADULT BASIC EDUCATION
Adult Basic Education (ABE) provides adult learners instruction in the basic skills of reading, writing, and mathematics. In addition, they offer preparations and testing for English as a Second Language (ESL) courses and General Educational Development (GED) certificates. The ABE program funds 13 regional ABE programs and four Volunteer Literacy programs.
SAVEC
Southwest Alaska Vocational and Education Center provides needed employment and education opportunities for area residents, so they can learn alternative competencies for employment in the region and throughout Alaska. The Center focuses on the construction crafts, information technology and health career occupations.
ILISAGVIK COLLEGE
Ilisagvik College offers quality post-secondary academic, vocational and technical education aimed at matching workforce needs. Ilisagvik offers a selection of programs; Accounting, Office Administration, Information Technology, Computer Industry Certification, Electrical Trades, Construction Trades, CDL/Heavy Truck Operations, Associate of Applied Science, Business and Management, Associate of Arts and Industrial Safety.
OT
HE
R P
RO
GR
AM
S
YUUT ELITNAURVIAT
Yuut Elitnaurviat or The People’s Learning Center provides tech-prep opportunities to high school students and career ladder options for adults in a culturally relevant and supportive environment. The focused career areas include: health careers, early childhood/education, construction and aviation through a link with the existing tribal aviation program.
TRAINING PROGRAM PERFORMANCE—2005
Alaska Department of Labor and Workforce Development, Research and Analysis Section 4
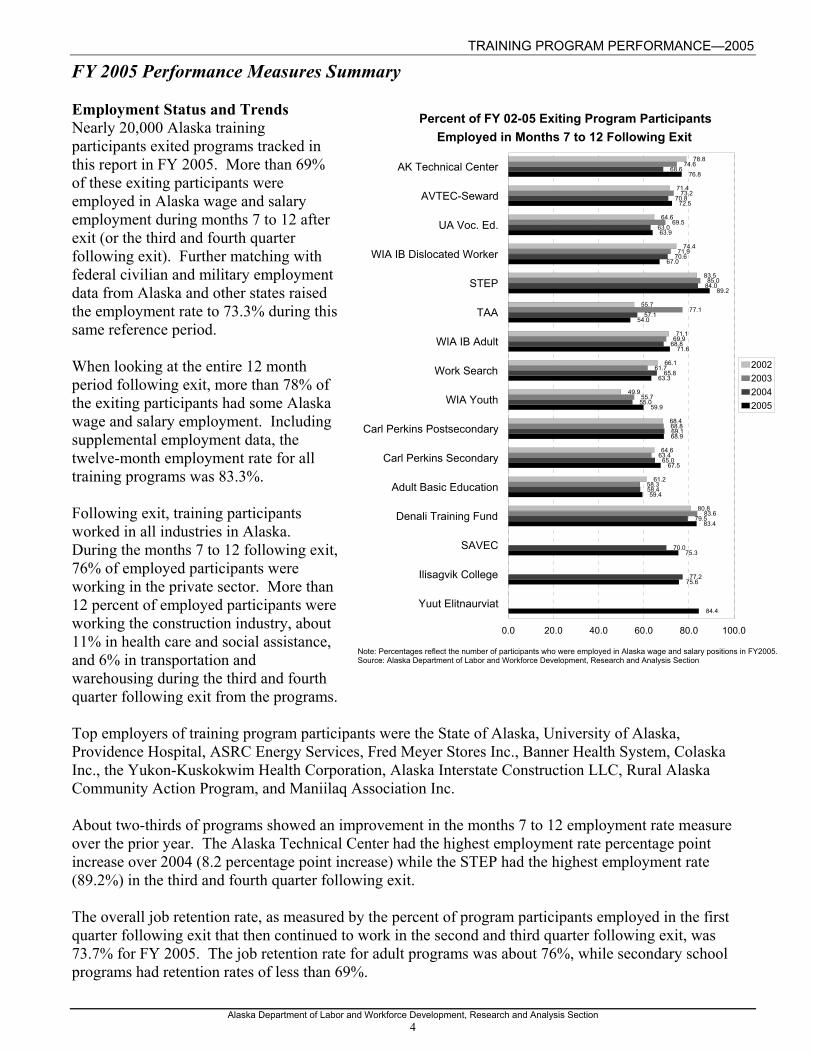
FY 2005 Performance Measures Summary Employment Status and Trends Nearly 20,000 Alaska training participants exited programs tracked in this report in FY 2005. More than 69% of these exiting participants were employed in Alaska wage and salary employment during months 7 to 12 after exit (or the third and fourth quarter following exit). Further matching with federal civilian and military employment data from Alaska and other states raised the employment rate to 73.3% during this same reference period. When looking at the entire 12 month period following exit, more than 78% of the exiting participants had some Alaska wage and salary employment. Including supplemental employment data, the twelve-month employment rate for all training programs was 83.3%. Following exit, training participants worked in all industries in Alaska. During the months 7 to 12 following exit, 76% of employed participants were working in the private sector. More than 12 percent of employed participants were working the construction industry, about 11% in health care and social assistance, and 6% in transportation and warehousing during the third and fourth quarter following exit from the programs. Top employers of training program participants were the State of Alaska, University of Alaska, Providence Hospital, ASRC Energy Services, Fred Meyer Stores Inc., Banner Health System, Colaska Inc., the Yukon-Kuskokwim Health Corporation, Alaska Interstate Construction LLC, Rural Alaska Community Action Program, and Maniilaq Association Inc. About two-thirds of programs showed an improvement in the months 7 to 12 employment rate measure over the prior year. The Alaska Technical Center had the highest employment rate percentage point increase over 2004 (8.2 percentage point increase) while the STEP had the highest employment rate (89.2%) in the third and fourth quarter following exit. The overall job retention rate, as measured by the percent of program participants employed in the first quarter following exit that then continued to work in the second and third quarter following exit, was 73.7% for FY 2005. The job retention rate for adult programs was about 76%, while secondary school programs had retention rates of less than 69%.
Percent of FY 02-05 Exiting Program ParticipantsEmployed in Months 7 to 12 Following Exit
Note: Percentages reflect the number of participants who were employed in Alaska wage and salary positions in FY2005.Source: Alaska Department of Labor and Workforce Development, Research and Analysis Section
78.8
71.4
64.6
74.4
83.5
55.7
71.1
66.1
49.9
68.4
64.6
61.2
80.8
74.6
73.2
69.5
71.9
85.0
77.1
69.9
61.7
55.7
68.8
63.4
58.3
83.6
68.6
70.8
63.0
70.6
84.0
57.1
68.8
65.8
55.0
69.1
65.0
58.4
79.5
70.0
77.2
76.8
72.5
63.9
67.0
89.2
54.0
71.6
63.3
59.9
68.9
67.5
59.4
83.4
75.3
75.6
84.4
AK Technical Center
AVTEC-Seward
UA Voc. Ed.
WIA IB Dislocated Worker
STEP
TAA
WIA IB Adult
Work Search
WIA Youth
Carl Perkins Postsecondary
Carl Perkins Secondary
Adult Basic Education
Denali Training Fund
SAVEC
Ilisagvik College
Yuut Elitnaurviat
0.0 20.0 40.0 60.0 80.0 100.0
2002200320042005

TRAINING PROGRAM PERFORMANCE—2005
Alaska Department of Labor and Workforce Development, Research and Analysis Section 5
Earnings Trends Total Alaska wage and salary earnings received from all employers were calculated for each exiting training program participant. Total earnings of FY 2005 training program participants were $351.3 million in the full twelve months following exit from the reported training programs, an increase of 31.7% compared with the twelve months prior to entering the programs. For the months 7 to 12 following exit from the program, the median participant earnings for this two-quarter period were calculated for all participants with reported earnings. These are shown in the figure at right. Highest median earnings during this two quarter period were received by participants in TAA and STEP; however, because each program is unique and serves a different clientele with different needs and work histories, caution should be used when comparing the earnings and employment measures across programs. Some programs are not designed to lead to an employment outcome. Some programs are directed to the unemployed, which can often result in dramatic pre-training and post-training performance gains. Direct year to year comparison of the broad programs and training institutions is problematic due to the changing mix of populations served and training programs offered. Some programs provide services to younger workers, older workers, those with no skills or those recently laid off from skilled jobs or relatively highly paid positions. Many programs serve clients that are likely to leave the state, continue their education, or become self-employed upon completion of their training. Those workers would likely not be included in Alaska post-training earnings and employment statistics.
Median Total Earnings of FY 02-05 Exiting Program ParticipantsEmployed in Months 7 to 12 Following Exit
Source: Alaska Department of Labor and Workforce Development, Research and Analysis Section
$14,815
$15,107
$11,239
$12,600
$13,178
$18,192
$9,362
$4,533
$1,659
$10,361
$2,758
$4,941
$7,841
$16,241
$11,592
$11,941
$13,543
$13,763
$8,390
$9,970
$6,020
$2,478
$9,309
$3,713
$5,106
$7,587
$6,122
$10,291
$10,812
$12,954
$14,384
$15,602
$9,632
$5,130
$2,943
$4,364
$9,098
$4,285
$8,004
$7,714
$11,074
$12,504
$11,197
$12,010
$13,071
$17,609
$22,373
$10,081
$2,018
$2,772
$9,771
$4,662
$5,069
$7,649
$10,955
$11,268
$6,403
AK Technical Center
AVTEC-Seward
UA Voc. Ed.
WIA Dislocated Worker
STEP
TAA
WIA IB Adult
Work Search
WIA Youth
Carl Perkins Postsecondary
Carl Perkins Secondary
Adult Basic Education
Denali Training Fund
SAVEC
Ilisagvik College
Yuut Elitnaurviat
$0 $7,000 $14,000 $21,000
2002200320042005

TRAINING PROGRAM PERFORMANCE—2005
Alaska Department of Labor and Workforce Development, Research and Analysis Section 6
Training Program Participants Served by Multiple Programs A large number of training participants are provided services by multiple training programs. Exiting program participant records for FY 2005 were matched with available exiting participant records for FY 2004 and FY 2005 to identify the number of individuals that participated in multiple training programs over the two-year period. A significant number of participants were identified that had obtained and completed services from multiple programs during FY 2004 and/or FY 2005. The leftmost column of the table shows the FY 2005 training programs. The matching program column shows the number of exiters in FY 2005, while the other columns show the number of students in that program who also participated in the other programs during FY 2004 and/or FY 2005. For example, 56 of the 1,888 STEP participants that exited in FY 2005 also exited a training program at AVTEC during FY 2004 or FY 2005 while 103 of the FY 2005 exiting STEP participants exited a University of Alaska vocational program in FY 2004 or FY 2005.
Number of Training Program Participants That Exited a Program in FY 2005 that Exited One or More Other Programs in FY 2004 and/or FY 2005
Adults Adults w/ Barriers Youth Other
AK Tech Kotzebue AVTEC
UA Voc
Ed
WIA 1B Dislocated
WorkerSTEP TAA
WIA 1B
Adult
Work Search
WIA 1B
Youth
Carl Perkins Secondary
Students
Denali Training
Fund
Perkins Post-
secondary
Adult Basic Education SAVEC I.C. Y.E.
AK Tech-Kotzebue 190 6 22 0 5 0 6 0 4 4 1 19 3 0 1 0AVTEC 8 886 43 11 48 4 18 0 7 13 43 344 13 19 1 0UA Voc Ed 22 49 5,740 40 91 10 39 2 23 120 15 2,214 13 21 1 0WIA 1B Dislocated Worker 1 44 76 727 41 19 11 4 0 1 32 75 6 13 1 1STEP 5 56 103 53 1,888 2 44 0 4 11 51 60 7 25 2 4
Adults
TAA 0 4 10 10 1 63 0 0 0 1 0 15 1 1 0 0WIA 1B Adult 8 46 58 13 48 0 619 3 2 1 10 100 8 1 1 2Adults
w/ Barriers Work Search 0 0 0 2 0 0 0 49 0 0 0 0 0 0 0 0Youth WIA 1B Youth 1 6 21 0 2 0 2 0 663 32 3 16 10 0 0 2
Carl Perkins Secondary Students 2 3 87 0 2 0 0 0 20 2,121 1 73 1 0 1 1Denali Training Fund 1 56 14 19 40 0 12 0 5 4 403 37 3 5 0 39Carl Perkins Postsecondary 14 347 2,035 48 71 15 72 2 22 190 26 5,611 19 2 2 0Adult Basic Education 1 9 13 4 6 1 2 1 8 3 1 11 715 0 6 1SAVEC 0 21 24 4 21 1 0 0 0 0 7 2 0 73 0 0Ilisagvik College 0 2 1 1 2 0 3 0 0 7 0 3 7 0 193 0
Other
Yuut Elitnaurviat 0 2 0 1 4 0 2 0 2 1 39 1 1 0 0 45
Source: Alaska Department of Labor and Workforce Development, Research and Analysis Section
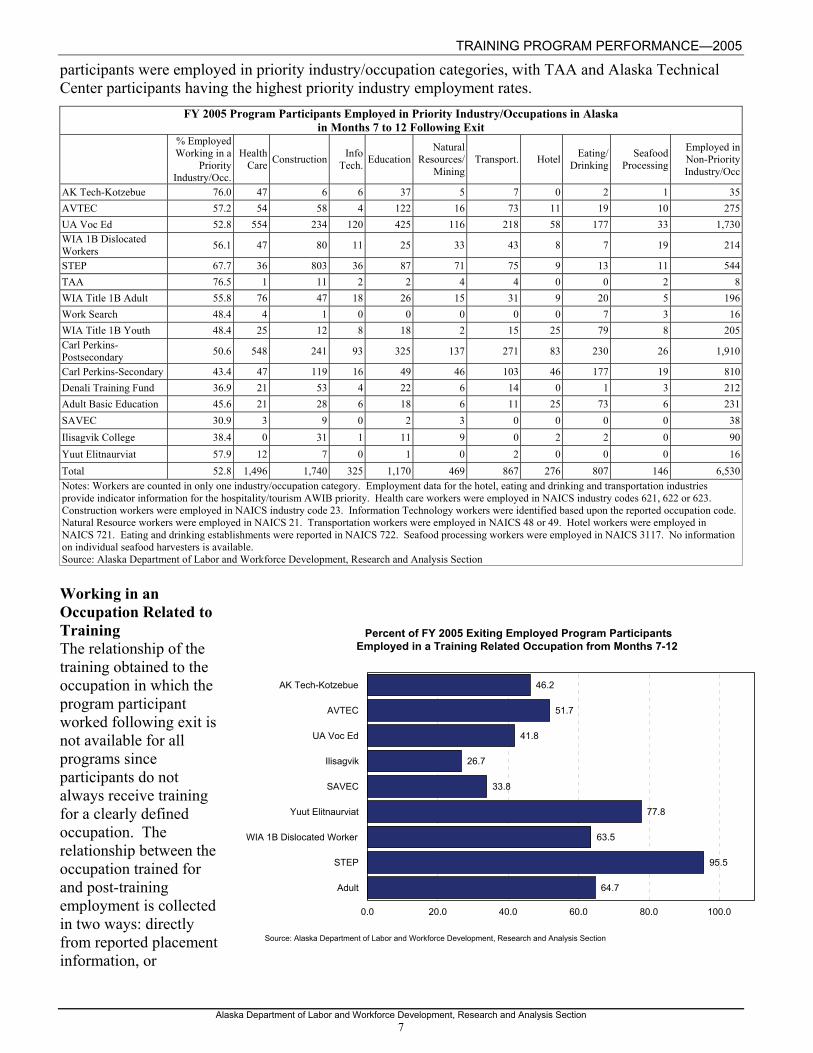
AWIB Priorities Historically, the AWIB has adopted a training priority list of industries and occupations based on economic, employment and other relevant data in order to maximize employment opportunities for participants in training programs. FY 2005 exiting participants’ industry and occupation of employment were matched with the AWIB priority industries/occupations to identify the number employed in these priority sectors. The most recent AWIB priorities include health care, construction, information technology occupations, education, natural resources (mining), transportation, hospitality/tourism, and seafood harvesting/processing. The number of participants employed in priority industries and/or occupations was determined by examining UI wage records for participant employment during months 7 to 12 following exit from each program. Overall, 52.8% of employed FY 2005 exiting program
TRAINING PROGRAM PERFORMANCE—2005
Alaska Department of Labor and Workforce Development, Research and Analysis Section 7
participants were employed in priority industry/occupation categories, with TAA and Alaska Technical Center participants having the highest priority industry employment rates.
FY 2005 Program Participants Employed in Priority Industry/Occupations in Alaska in Months 7 to 12 Following Exit
% Employed Working in a
Priority Industry/Occ.
Health Care Construction Info
Tech. EducationNatural
Resources/Mining
Transport. Hotel Eating/ Drinking
Seafood Processing
Employed in Non-Priority Industry/Occ
AK Tech-Kotzebue 76.0 47 6 6 37 5 7 0 2 1 35AVTEC 57.2 54 58 4 122 16 73 11 19 10 275UA Voc Ed 52.8 554 234 120 425 116 218 58 177 33 1,730WIA 1B Dislocated Workers 56.1 47 80 11 25 33 43 8 7 19 214
STEP 67.7 36 803 36 87 71 75 9 13 11 544TAA 76.5 1 11 2 2 4 4 0 0 2 8WIA Title 1B Adult 55.8 76 47 18 26 15 31 9 20 5 196Work Search 48.4 4 1 0 0 0 0 0 7 3 16WIA Title 1B Youth 48.4 25 12 8 18 2 15 25 79 8 205Carl Perkins-Postsecondary 50.6 548 241 93 325 137 271 83 230 26 1,910
Carl Perkins-Secondary 43.4 47 119 16 49 46 103 46 177 19 810Denali Training Fund 36.9 21 53 4 22 6 14 0 1 3 212Adult Basic Education 45.6 21 28 6 18 6 11 25 73 6 231SAVEC 30.9 3 9 0 2 3 0 0 0 0 38Ilisagvik College 38.4 0 31 1 11 9 0 2 2 0 90Yuut Elitnaurviat 57.9 12 7 0 1 0 2 0 0 0 16Total 52.8 1,496 1,740 325 1,170 469 867 276 807 146 6,530Notes: Workers are counted in only one industry/occupation category. Employment data for the hotel, eating and drinking and transportation industries provide indicator information for the hospitality/tourism AWIB priority. Health care workers were employed in NAICS industry codes 621, 622 or 623. Construction workers were employed in NAICS industry code 23. Information Technology workers were identified based upon the reported occupation code. Natural Resource workers were employed in NAICS 21. Transportation workers were employed in NAICS 48 or 49. Hotel workers were employed in NAICS 721. Eating and drinking establishments were reported in NAICS 722. Seafood processing workers were employed in NAICS 3117. No information on individual seafood harvesters is available. Source: Alaska Department of Labor and Workforce Development, Research and Analysis Section
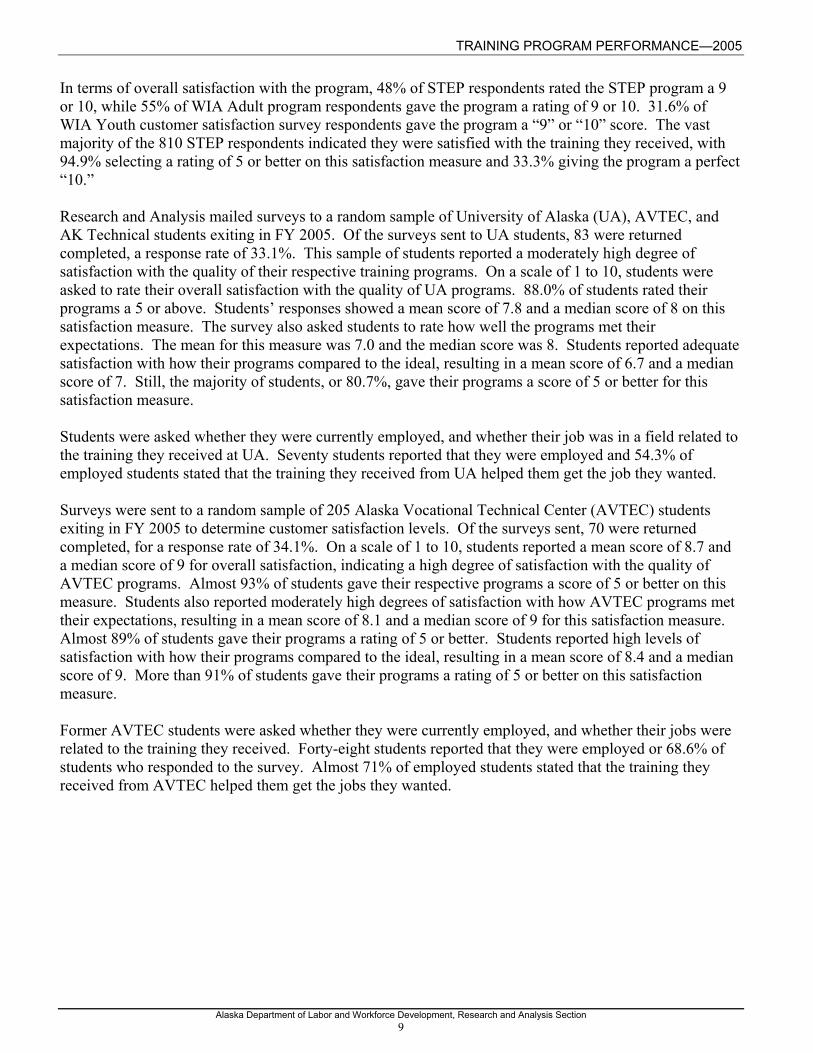
Working in an Occupation Related to Training The relationship of the training obtained to the occupation in which the program participant worked following exit is not available for all programs since participants do not always receive training for a clearly defined occupation. The relationship between the occupation trained for and post-training employment is collected in two ways: directly from reported placement information, or
Percent of FY 2005 Exiting Employed Program Participants Employed in a Training Related Occupation from Months 7-12
Source: Alaska Department of Labor and Workforce Development, Research and Analysis Section
46.2
51.7
41.8
26.7
33.8
77.8
63.5
95.5
64.7
AK Tech-Kotzebue
AVTEC
UA Voc Ed
Ilisagvik
SAVEC
Yuut Elitnaurviat
WIA 1B Dislocated Worker
STEP
Adult
0.0 20.0 40.0 60.0 80.0 100.0

TRAINING PROGRAM PERFORMANCE—2005
Alaska Department of Labor and Workforce Development, Research and Analysis Section 8
indirectly, based upon occupation information provided by employers on Alaska wage records. WIA and STEP training-related occupation rates are collected directly from the program records. Training-related employment rates for the AK Technical Center, AVTEC, the University of Alaska and other programs are determined based upon a comparison of reported Classification of Instructional Programs (CIP) code to occupational codes obtained from UI wage records for months 7 to 12 following exit from the program. Training Program Customer Satisfaction Customer satisfaction survey data were obtained for training programs from two sources: ongoing telephone surveys and a special annual customer satisfaction survey mailed to a sample of those that had exited the University of Alaska vocational programs, Alaska Technical Center, and AVTEC in FY 2005. The same three basic questions were asked of all customer satisfaction survey respondents:
(1) Using a scale of 1 to 10 where “1” means “very dissatisfied” and “10” means “very satisfied,” what is your overall satisfaction with the education and training services you were provided? (2) Considering all the expectations you may have had about the education and training services, to what extent have the services met your expectations? “1” means “falls short of your expectations and “10” means “exceeds your expectations.” (3) Think of the ideal education and training program for people in your circumstances. How well do you think the education and training services you received compare with the ideal set of services? “1” means “not very close to ideal” and “10” means “very close to ideal.”
Training Program Customer Satisfaction Survey Results FY 2005 Exiting Participants
Mean Median % Rating
Program “5” or higher
Total Respondents
Rating of overall satisfaction with the program STEP 8.1 8 94.9 810 WIA Adult 8.2 9 93.3 238 WIA IB Dislocated Worker 8.3 9 95.7 276 WIA Youth 7.6 8 94.7 38 AK Technical Center 8.0 8 91.7 12 AVTEC 8.7 9 92.9 70 U of A Vocational Education 7.8 8 88.0 83 Did the program meet your expectations? STEP 7.5 8 92.3 819 WIA Adult 7.8 8 90.3 238 WIA IB Dislocated Worker 7.6 8 91.9 273 WIA Youth 7.5 7 97.4 38 AK Technical Center 7.9 8 91.7 12 AVTEC 8.1 9 88.6 70 U of A Vocational Education 7.0 8 79.5 83 How well did the services you received compare with the ideal set of services? STEP 7.8 8 91.3 807 WIA Adult 8.0 9 91.7 229 WIA IB Dislocated Worker 7.7 8 90.0 271 WIA Youth 6.9 7 86.8 38 AK Technical Center 7.6 8 83.3 12 AVTEC 8.4 9 91.3 69 U of A Vocational Education 6.7 7 80.7 83 Source: Alaska Department of Labor and Workforce Development, Research and Analysis Section. Data from Division of Business Partnerships MIS and special surveys.
TRAINING PROGRAM PERFORMANCE—2005
Alaska Department of Labor and Workforce Development, Research and Analysis Section 9
In terms of overall satisfaction with the program, 48% of STEP respondents rated the STEP program a 9 or 10, while 55% of WIA Adult program respondents gave the program a rating of 9 or 10. 31.6% of WIA Youth customer satisfaction survey respondents gave the program a “9” or “10” score. The vast majority of the 810 STEP respondents indicated they were satisfied with the training they received, with 94.9% selecting a rating of 5 or better on this satisfaction measure and 33.3% giving the program a perfect “10.” Research and Analysis mailed surveys to a random sample of University of Alaska (UA), AVTEC, and AK Technical students exiting in FY 2005. Of the surveys sent to UA students, 83 were returned completed, a response rate of 33.1%. This sample of students reported a moderately high degree of satisfaction with the quality of their respective training programs. On a scale of 1 to 10, students were asked to rate their overall satisfaction with the quality of UA programs. 88.0% of students rated their programs a 5 or above. Students’ responses showed a mean score of 7.8 and a median score of 8 on this satisfaction measure. The survey also asked students to rate how well the programs met their expectations. The mean for this measure was 7.0 and the median score was 8. Students reported adequate satisfaction with how their programs compared to the ideal, resulting in a mean score of 6.7 and a median score of 7. Still, the majority of students, or 80.7%, gave their programs a score of 5 or better for this satisfaction measure. Students were asked whether they were currently employed, and whether their job was in a field related to the training they received at UA. Seventy students reported that they were employed and 54.3% of employed students stated that the training they received from UA helped them get the job they wanted. Surveys were sent to a random sample of 205 Alaska Vocational Technical Center (AVTEC) students exiting in FY 2005 to determine customer satisfaction levels. Of the surveys sent, 70 were returned completed, for a response rate of 34.1%. On a scale of 1 to 10, students reported a mean score of 8.7 and a median score of 9 for overall satisfaction, indicating a high degree of satisfaction with the quality of AVTEC programs. Almost 93% of students gave their respective programs a score of 5 or better on this measure. Students also reported moderately high degrees of satisfaction with how AVTEC programs met their expectations, resulting in a mean score of 8.1 and a median score of 9 for this satisfaction measure. Almost 89% of students gave their programs a rating of 5 or better. Students reported high levels of satisfaction with how their programs compared to the ideal, resulting in a mean score of 8.4 and a median score of 9. More than 91% of students gave their programs a rating of 5 or better on this satisfaction measure.
Former AVTEC students were asked whether they were currently employed, and whether their jobs were related to the training they received. Forty-eight students reported that they were employed or 68.6% of students who responded to the survey. Almost 71% of employed students stated that the training they received from AVTEC helped them get the jobs they wanted.

TRAINING PROGRAM PERFORMANCE—2005
Alaska Department of Labor and Workforce Development, Research and Analysis Section 10
FY 2005 Data Summary
FY 2005 Program Performance Measures Alaska Employment and Earnings for Months 7 to 12 Before and After Training
Number Employed Total Earnings Quarters Worked Avg. Earnings Per Quarter Worked
Median Total Earnings
Months 7 to 12 FY 05 Programs Number Exiting
Before After Pct Emp After Before After Before After Before After Before After
Adult Training AK Tech-Kotzebue 190 131 146 76.8 $1,697,896 $2,122,604 234 259 $7,256 $8,195 $10,152 $12,504AVTEC 886 606 642 72.5 6,570,943 8,505,033 1,078 1,169 6,095 7,275 8,682 11,197UA Voc Ed 5,740 3,490 3,665 63.9 42,140,431 51,511,437 6,340 6,637 6,647 7,761 9,754 12,010WIA 1B Dislocated Workers 727 488 487 67.0 5,626,233 6,997,171 874 904 6,437 7,740 9,253 13,071
STEP 1,888 1,685 1,685 89.2 25,619,561 33,892,873 3,048 3,061 8,405 11,072 12,465 17,609TAA 63 36 34 54.0 466,509 739,970 60 60 7,775 12,333 10,931 22,373Adults w/ Barriers Programs WIA Title 1B Adult 619 400 443 71.6 2,467,012 4,958,344 681 800 3,623 6,198 4,633 10,081Work Search 49 28 31 63.3 146,513 129,479 45 46 3,256 2,815 3,967 2,018Youth Programs WIA Title 1B Youth 663 203 397 59.9 400,436 1,621,638 306 653 1,309 2,483 1,288 2,772Other Programs Carl Perkins-Postsecondary 5,611 3,658 3,864 68.9 32,538,846 44,526,518 6,408 6,971 5,078 6,387 6,865 9,771Carl Perkins-Secondary 2,121 1,016 1,432 67.5 2,629,105 8,541,034 1,586 2,377 1,658 3,593 2,081 4,662Adult Basic Education 715 342 425 59.4 1,962,977 2,946,575 577 733 3,402 4,020 3,584 5,069Denali Training Fund 403 327 336 83.4 2,936,351 3,483,658 604 611 4,862 5,702 6,522 7,649SAVEC 73 57 55 75.3 653,899 730,765 102 100 6,411 7,308 9,193 10,955Ilisagvik College 193 141 146 75.6 1,365,783 1,708,325 238 257 5,739 6,647 5,223 11,268Yuut Elitnaurviat 45 35 38 84.4 292,748 374,906 59 67 4,962 5,596 3,303 6,403Notes: Includes an unduplicated count of individuals with reported SSN exiting a program. One individual may participate in more than one program. Includes Alaska reported employment and wage information only. Source: Alaska Department of Labor and Workforce Development, Research and Analysis Section
FY 2005 Program Performance Measures
Alaska Employment and Earnings for Months 1 to 12 Before and After Training
Number Employed Total Earnings Quarters Worked Avg. Earnings Per Quarter Worked
Median Total Earnings Months 1
to 12 FY 05 Programs Number Exiting
Before After Pct Emp After Before After Before After Before After Before After
Adult Training AK Tech-Kotzebue 190 148 162 85.3 $3,416,380 $4,266,581 476 526 $7,177 $8,111 $16,676 $19,791AVTEC 886 674 727 82.1 13,470,252 16,946,487 2,152 2,404 6,259 7,049 14,068 17,877UA Voc Ed 5,740 4,129 4,176 72.8 87,775,505 103,356,348 13,316 13,652 6,592 7,571 15,504 19,842WIA 1B Dislocated Workers 727 571 538 74.0 11,054,393 13,907,275 1,765 1,830 6,263 7,600 14,561 23,183STEP 1,888 1,809 1,797 95.2 59,659,130 73,091,224 6,292 6,330 9,482 11,547 28,041 36,116TAA 63 42 39 61.9 882,725 1,476,115 121 124 7,295 11,904 16,464 29,950Adults w/ Barriers Programs WIA Title 1B Adult 619 470 489 79.0 4,844,579 10,167,908 1,378 1,635 3,516 6,219 8,099 18,471Work Search 49 33 38 77.6 234,425 318,273 78 100 3,005 3,183 4,934 5,720Youth Programs WIA Title 1B Youth 663 303 488 73.6 970,705 3,292,489 685 1,321 1,417 2,492 1,989 4,542Other Programs Carl Perkins-Postsecondary 5,611 4,142 4,358 77.7 64,842,120 89,455,831 12,877 14,236 5,035 6,284 10,655 16,294Carl Perkins-Secondary 2,121 1,305 1,699 80.1 5,185,274 17,116,924 3,325 4,850 1,559 3,529 2,692 7,468Adult Basic Education 715 408 501 70.1 3,779,722 5,386,838 1,142 1,439 3,310 3,743 4,670 7,235Denali Training Fund 403 362 368 91.3 6,072,837 6,903,800 1,210 1,230 5,019 5,613 12,159 13,579SAVEC 73 63 66 90.4 1,342,064 1,532,908 203 216 6,611 7,097 15,832 17,211Ilisagvik College 193 167 171 88.6 2,573,403 3,255,749 455 510 5,656 6,384 6,545 15,016Yuut Elitnaurviat 45 41 40 88.9 673,717 784,315 123 136 5,477 5,767 11,275 16,251Notes: Includes an unduplicated count of individuals with reported SSN exiting a program. One individual may participate in more than one program. Includes Alaska reported employment and wage information only. Source: Alaska Department of Labor and Workforce Development, Research and Analysis Section

TRAINING PROGRAM PERFORMANCE—2005
Alaska Department of Labor and Workforce Development, Research and Analysis Section 11
Long Term Follow-up of FY 2002 Exiters – Where Are They Now? Training programs should provide workers with the tools they need to achieve long-term employment and earnings growth. To see how successful training programs have been in achieving these goals, exiting program participants reported on in the FY 2002 Training Program Performance Report (those participants exiting July 1, 2001, through June 30, 2002) were tracked to see how many are still working in Alaska. Overall, about 67% of FY 2002 exiters were still employed in Alaska in FY 2006—87% of those employed in the year following exit were still employed in the state. The employment rate varied significantly by program, with the Denali Training Fund participants and STEP having the highest FY 2006 employment rates. The Work Search and Adult Basic Education programs had the lowest FY 2006 Alaska employment rates. Average wages for employed workers in FY 2006 were highest for participants exiting from STEP and the Dislocated Worker program.
Long Term Follow-up of FY 2002 Exiting Alaska Training Program Participants Total Employment and Earnings in Years FY 2003 through FY 2006
FY 2002 Exiters
Employed in FY 2003
Employed in FY 2004
Employed in FY 2005
Employed in FY 2006
Total Wages in FY 2003
Total Wages in FY 2004
Total Wages in FY 2005
Total Wages in FY 2006
AK Tech 160 140 131 127 124 $3,782,986 $3,634,575 $3,493,331 $3,572,870
AVTEC 1,212 976 919 882 863 28,766,267 28,709,561 28,686,222 29,061,659
UA 5,601 4,023 3,740 3,547 3,466 93,793,012 94,745,676 97,537,386 99,627,604
Dislocated Workers 219 172 157 149 145 4,801,861 4,586,194 4,726,607 4,937,646
STEP 1,423 1,300 1,220 1,163 1,145 42,036,593 43,269,526 44,393,129 45,724,556
TAA and NAFTA-TAA 61 33 35 35 37 1,156,450 1,087,012 1,220,276 1,301,292
Adult 380 306 279 264 260 5,561,376 5,363,528 5,289,052 5,711,701
Work Search 765 587 516 490 462 6,232,152 6,129,864 6,391,579 6,498,024
Youth 653 437 445 450 438 2,205,694 3,022,828 3,946,000 4,209,382Carl Perkins -Postsecondary 4,828 3,739 3,545 3,377 3,261 80,265,759 85,426,208 91,288,514 93,488,014
Carl Perkins Secondary 2,987 2,416 2,295 2,175 2,047 17,700,318 22,822,952 27,896,560 30,794,829
Adult Basic Ed 1,434 1,015 936 878 862 11,858,054 12,669,132 13,199,452 13,558,219
Denali Training Fund 619 555 528 519 510 11,444,144 10,619,419 11,765,984 11,428,678
Total 20,342 15,699 14,746 14,056 13,620 309,604,666 322,086,474 339,834,094 349,914,476
Source: Alaska Department of Labor and Workforce Development, Research and Analysis Section
TRAINING PROGRAM PERFORMANCE—2005
Alaska Department of Labor and Workforce Development, Research and Analysis Section 12
Adult Training Programs
TRAINING PROGRAM PERFORMANCE—2005
Alaska Department of Labor and Workforce Development, Research and Analysis Section 13
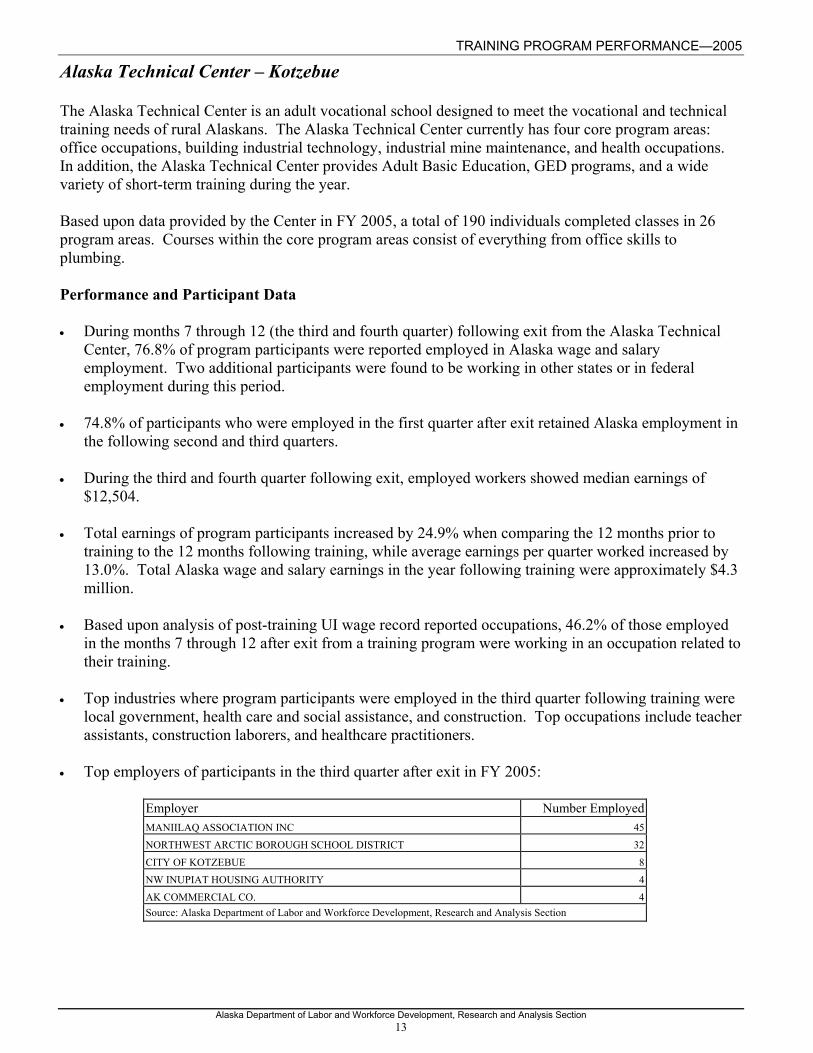
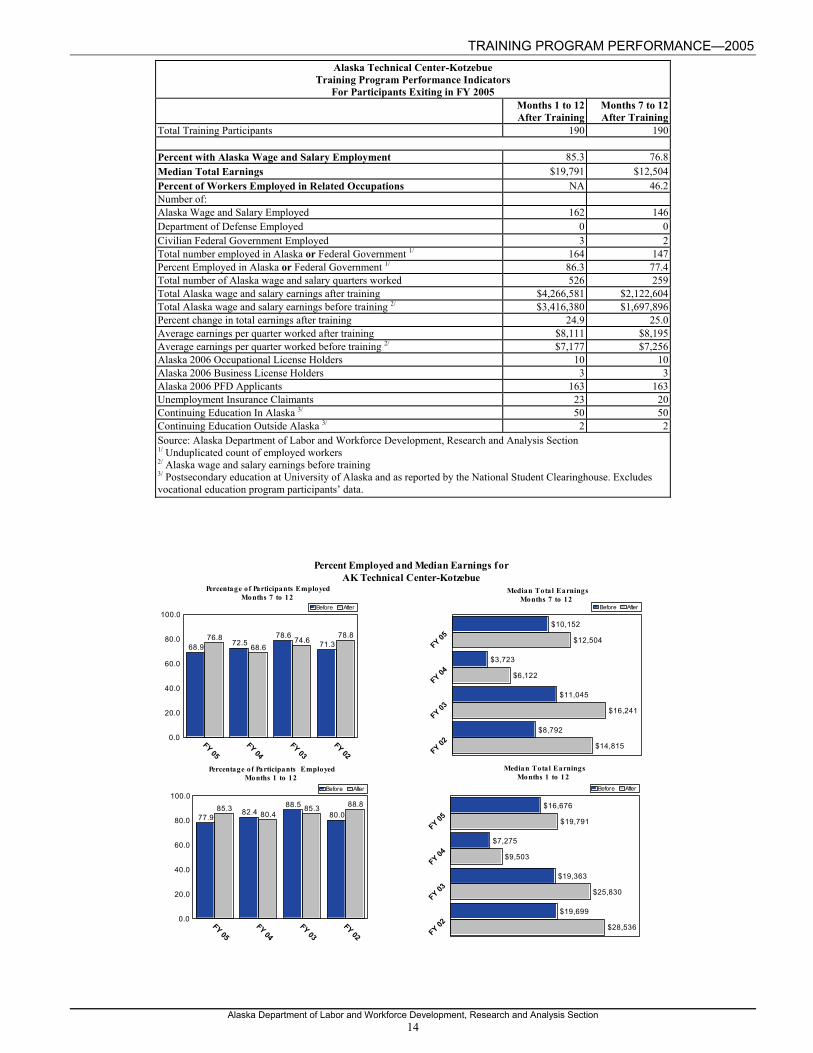
Alaska Technical Center – Kotzebue The Alaska Technical Center is an adult vocational school designed to meet the vocational and technical training needs of rural Alaskans. The Alaska Technical Center currently has four core program areas: office occupations, building industrial technology, industrial mine maintenance, and health occupations. In addition, the Alaska Technical Center provides Adult Basic Education, GED programs, and a wide variety of short-term training during the year. Based upon data provided by the Center in FY 2005, a total of 190 individuals completed classes in 26 program areas. Courses within the core program areas consist of everything from office skills to plumbing. Performance and Participant Data • During months 7 through 12 (the third and fourth quarter) following exit from the Alaska Technical
Center, 76.8% of program participants were reported employed in Alaska wage and salary employment. Two additional participants were found to be working in other states or in federal employment during this period.
• 74.8% of participants who were employed in the first quarter after exit retained Alaska employment in
the following second and third quarters. • During the third and fourth quarter following exit, employed workers showed median earnings of
$12,504. • Total earnings of program participants increased by 24.9% when comparing the 12 months prior to
training to the 12 months following training, while average earnings per quarter worked increased by 13.0%. Total Alaska wage and salary earnings in the year following training were approximately $4.3 million.
• Based upon analysis of post-training UI wage record reported occupations, 46.2% of those employed
in the months 7 through 12 after exit from a training program were working in an occupation related to their training.
• Top industries where program participants were employed in the third quarter following training were
local government, health care and social assistance, and construction. Top occupations include teacher assistants, construction laborers, and healthcare practitioners.
• Top employers of participants in the third quarter after exit in FY 2005:
Employer Number Employed MANIILAQ ASSOCIATION INC 45 NORTHWEST ARCTIC BOROUGH SCHOOL DISTRICT 32
CITY OF KOTZEBUE 8 NW INUPIAT HOUSING AUTHORITY 4 AK COMMERCIAL CO. 4 Source: Alaska Department of Labor and Workforce Development, Research and Analysis Section
TRAINING PROGRAM PERFORMANCE—2005
Alaska Department of Labor and Workforce Development, Research and Analysis Section 14
68.9 72.578.6
71.376.8
68.674.6
78.8
FY 05FY 04
FY 03FY 02
0.0
20.0
40.0
60.0
80.0
100.0Before After
Percent Employed and Median Earnings forAK Technical Center-Kotzebue
Median Total EarningsMonths 7 to 12
Percentage of Participants EmployedMonths 7 to 12
77.982.4
88.580.0
85.380.4
85.3 88.8
FY 05FY 04
FY 03FY 02
0.0
20.0
40.0
60.0
80.0
100.0Before After
$16,676
$7,275
$19,363
$19,699
$19,791
$9,503
$25,830
$28,536
FY 05
FY 04
FY 03
FY 02
Before After
$10,152
$3,723
$11,045
$8,792
$12,504
$6,122
$16,241
$14,815
FY 05
FY 04
FY 03
FY 02
Before After
Percentage of Participants EmployedMonths 1 to 12
Median Total EarningsMonths 1 to 12
Alaska Technical Center-Kotzebue Training Program Performance Indicators
For Participants Exiting in FY 2005
Months 1 to 12 After Training
Months 7 to 12 After Training
Total Training Participants 190 190
Percent with Alaska Wage and Salary Employment 85.3 76.8Median Total Earnings $19,791 $12,504Percent of Workers Employed in Related Occupations NA 46.2Number of: Alaska Wage and Salary Employed 162 146Department of Defense Employed 0 0Civilian Federal Government Employed 3 2Total number employed in Alaska or Federal Government 1/ 164 147Percent Employed in Alaska or Federal Government 1/ 86.3 77.4Total number of Alaska wage and salary quarters worked 526 259Total Alaska wage and salary earnings after training $4,266,581 $2,122,604Total Alaska wage and salary earnings before training 2/ $3,416,380 $1,697,896Percent change in total earnings after training 24.9 25.0Average earnings per quarter worked after training $8,111 $8,195Average earnings per quarter worked before training 2/ $7,177 $7,256Alaska 2006 Occupational License Holders 10 10Alaska 2006 Business License Holders 3 3Alaska 2006 PFD Applicants 163 163Unemployment Insurance Claimants 23 20Continuing Education In Alaska 3/ 50 50Continuing Education Outside Alaska 3/ 2 2Source: Alaska Department of Labor and Workforce Development, Research and Analysis Section 1/ Unduplicated count of employed workers 2/ Alaska wage and salary earnings before training 3/ Postsecondary education at University of Alaska and as reported by the National Student Clearinghouse. Excludes vocational education program participants’ data.
TRAINING PROGRAM PERFORMANCE—2005
Alaska Department of Labor and Workforce Development, Research and Analysis Section 15
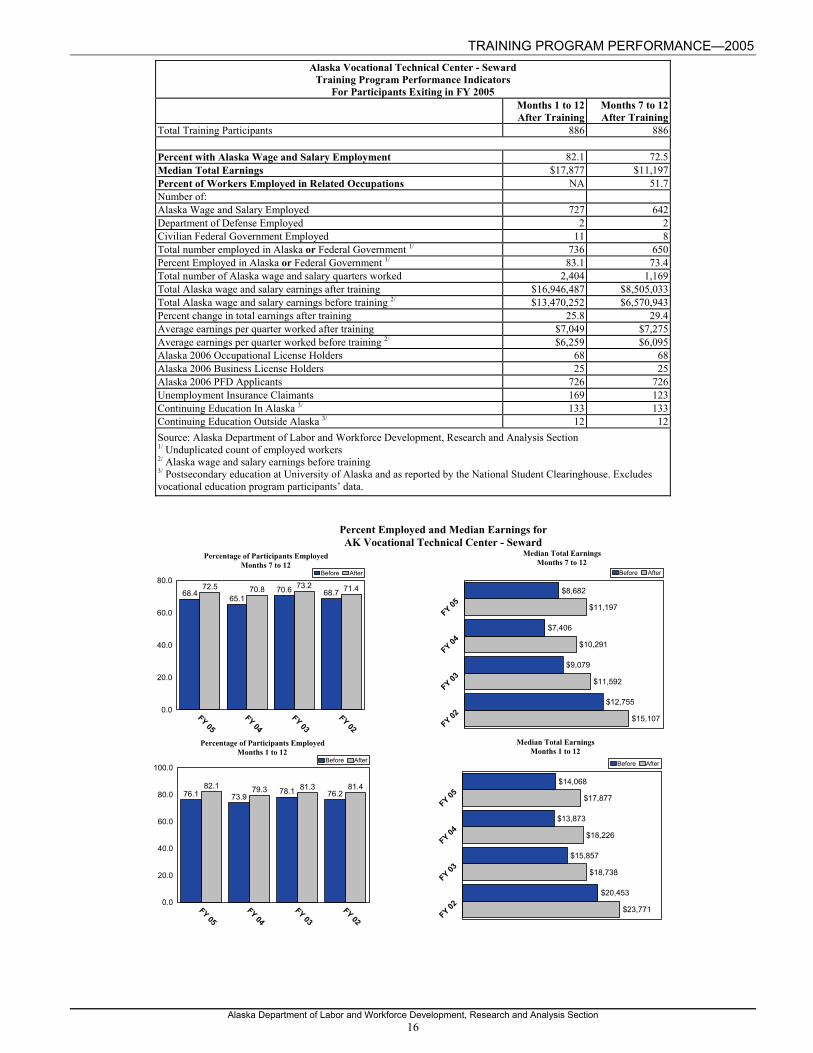
Alaska Vocational Technical Center (AVTEC) – Seward Alaska Vocational Technical Center-Seward (AVTEC) provides market driven education in response to the needs of Alaska's business and industry, in career areas such as allied health, business and office technology, applied technology, food service technology, learning resources, physical plant technology, and marine and fisheries. A total of 886 individuals had 1,307 program exits at AVTEC in FY 2005. Performance and Participant Data • During months 7 through 12 (the third and fourth quarter) following exit from the Alaska Vocational
Technical Center, 72.5% of program participants were reported employed in Alaska wage and salary employment. An additional 34 participants were identified from other state or federal employment records. This is an unduplicated count of employment records; students identified in Alaska wage and salary records are not counted again if they are identified in out-of-state employment records.
• 77.6% of participants who were employed in the first quarter after exit retained employment in the
following second and third quarters. • During the third and fourth quarter following exit, employed workers showed median earnings of
$11,197, marking an increase of 29.0% from the same time period before the workers entered the program.
• Total earnings of program participants increased by 25.8% when comparing the 12 months prior to
training to the 12 months following training. Total Alaska wage and salary earnings in the year following training were approximately $16.9 million.
• Based upon analysis of post-training UI wage record reported occupations, 51.7% of those employed
in the months 7 through 12 after exit from a training program were working in an occupation related to their training.
• Top industries where program participants were employed in the third quarter following training were
local government, transportation and warehousing, and health care and social assistance. Top occupations include teachers assistants; captains, mates, and pilots of water vessels; and freight, stock, and material movers.
• Top employers of participants in the third quarter after exit:
Employer Number Employed STATE OF ALASKA 33
BERING STRAIT SCHOOL DISTRICT 30 LOWER YUKON SCHOOL DISTRICT 20 PROVIDENCE HOSPITAL PAYROLL 19
CROWLEY MARINE SERVICES INC 18 Source: Alaska Department of Labor and Workforce Development, Research and Analysis Section
TRAINING PROGRAM PERFORMANCE—2005
Alaska Department of Labor and Workforce Development, Research and Analysis Section 16
Alaska Vocational Technical Center - Seward Training Program Performance Indicators
For Participants Exiting in FY 2005
Months 1 to 12 After Training
Months 7 to 12 After Training
Total Training Participants 886 886
Percent with Alaska Wage and Salary Employment 82.1 72.5Median Total Earnings $17,877 $11,197Percent of Workers Employed in Related Occupations NA 51.7Number of: Alaska Wage and Salary Employed 727 642Department of Defense Employed 2 2Civilian Federal Government Employed 11 8Total number employed in Alaska or Federal Government 1/ 736 650Percent Employed in Alaska or Federal Government 1/ 83.1 73.4Total number of Alaska wage and salary quarters worked 2,404 1,169Total Alaska wage and salary earnings after training $16,946,487 $8,505,033Total Alaska wage and salary earnings before training 2/ $13,470,252 $6,570,943Percent change in total earnings after training 25.8 29.4Average earnings per quarter worked after training $7,049 $7,275Average earnings per quarter worked before training 2/ $6,259 $6,095Alaska 2006 Occupational License Holders 68 68Alaska 2006 Business License Holders 25 25Alaska 2006 PFD Applicants 726 726Unemployment Insurance Claimants 169 123Continuing Education In Alaska 3/ 133 133Continuing Education Outside Alaska 3/ 12 12Source: Alaska Department of Labor and Workforce Development, Research and Analysis Section 1/ Unduplicated count of employed workers 2/ Alaska wage and salary earnings before training 3/ Postsecondary education at University of Alaska and as reported by the National Student Clearinghouse. Excludes vocational education program participants’ data.
68.465.1
70.6 68.772.5 70.8 73.2 71.4
FY 05FY 04
FY 03FY 02
0.0
20.0
40.0
60.0
80.0Before After
Percent Employed and Median Earnings forAK Vocational Technical Center - Seward
Median Total EarningsMonths 7 to 12
Percentage of Participants EmployedMonths 7 to 12
76.1 73.978.1 76.2
82.1 79.3 81.3 81.4
FY 05FY 04
FY 03FY 02
0.0
20.0
40.0
60.0
80.0
100.0Before After
$14,068
$13,873
$15,857
$20,453
$17,877
$18,226
$18,738
$23,771
FY 05
FY 04
FY 03
FY 02
Before After
$8,682
$7,406
$9,079
$12,755
$11,197
$10,291
$11,592
$15,107
FY 05
FY 04
FY 03
FY 02
Before After
Percentage of Participants EmployedMonths 1 to 12
Median Total EarningsMonths 1 to 12
TRAINING PROGRAM PERFORMANCE—2005
Alaska Department of Labor and Workforce Development, Research and Analysis Section 17
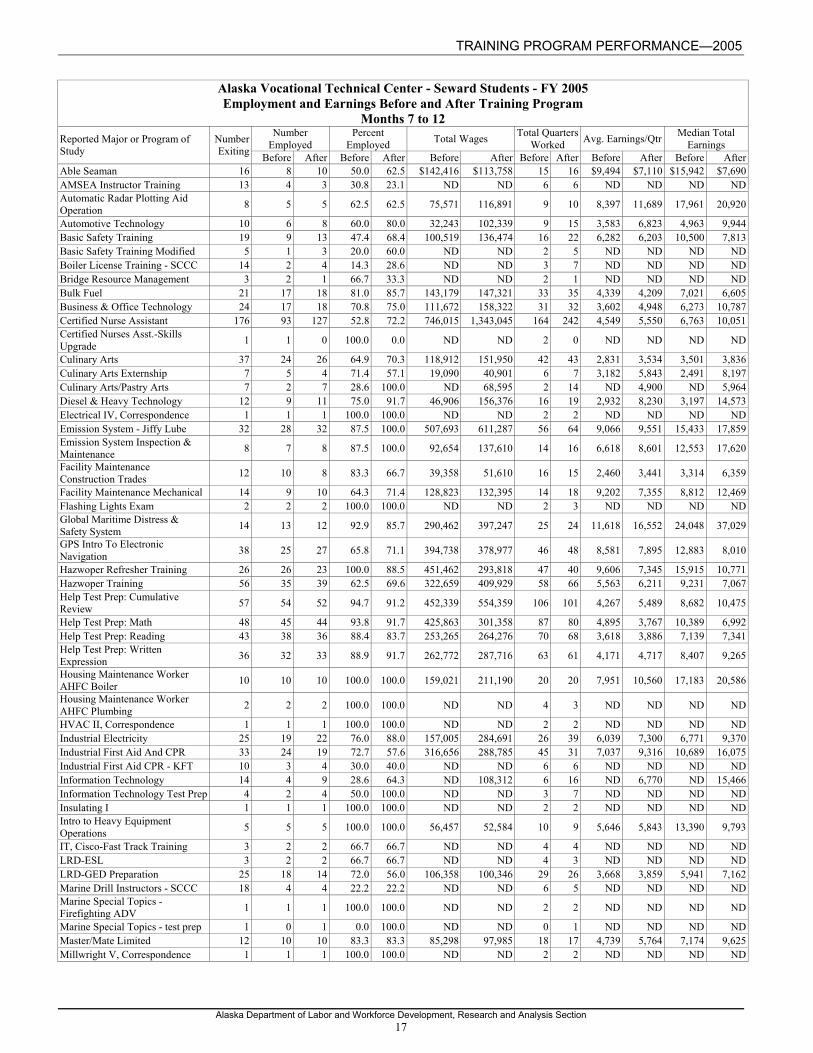
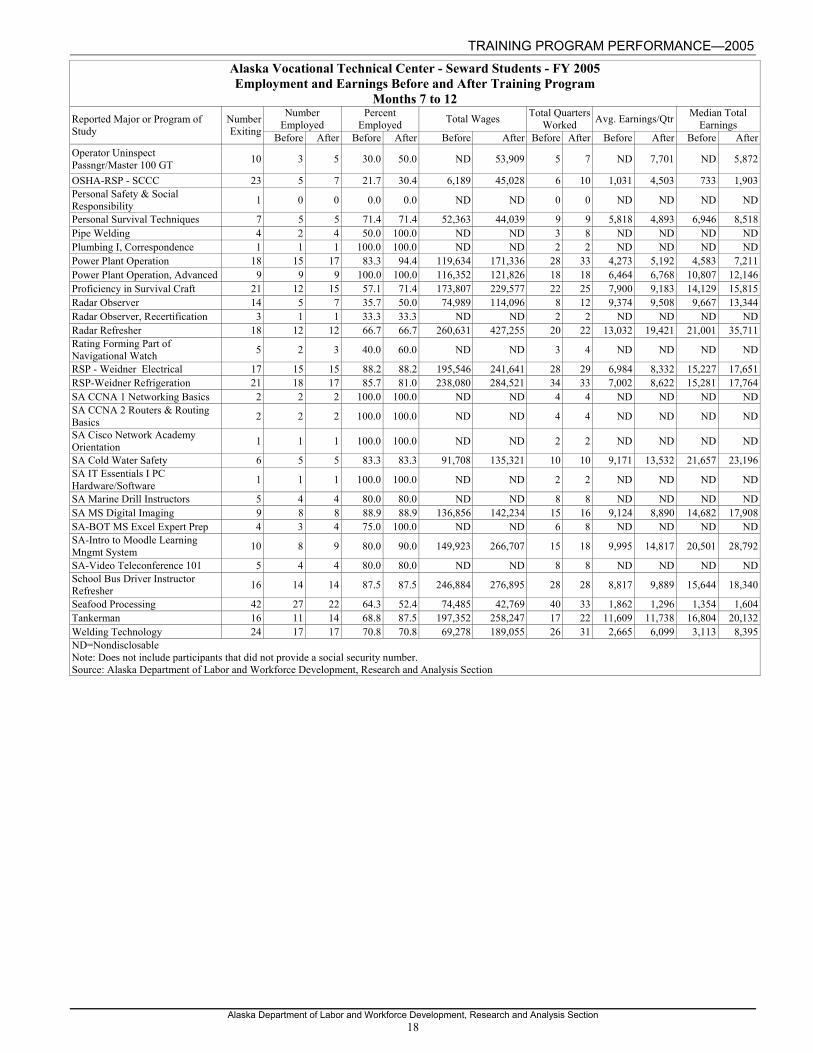
Alaska Vocational Technical Center - Seward Students - FY 2005 Employment and Earnings Before and After Training Program
Months 7 to 12 Number
Employed Percent
Employed Total Wages Total Quarters Worked Avg. Earnings/Qtr Median Total
Earnings Reported Major or Program of Study
Number Exiting Before After Before After Before After Before After Before After Before After
Able Seaman 16 8 10 50.0 62.5 $142,416 $113,758 15 16 $9,494 $7,110 $15,942 $7,690AMSEA Instructor Training 13 4 3 30.8 23.1 ND ND 6 6 ND ND ND NDAutomatic Radar Plotting Aid Operation 8 5 5 62.5 62.5 75,571 116,891 9 10 8,397 11,689 17,961 20,920
Automotive Technology 10 6 8 60.0 80.0 32,243 102,339 9 15 3,583 6,823 4,963 9,944Basic Safety Training 19 9 13 47.4 68.4 100,519 136,474 16 22 6,282 6,203 10,500 7,813Basic Safety Training Modified 5 1 3 20.0 60.0 ND ND 2 5 ND ND ND NDBoiler License Training - SCCC 14 2 4 14.3 28.6 ND ND 3 7 ND ND ND NDBridge Resource Management 3 2 1 66.7 33.3 ND ND 2 1 ND ND ND NDBulk Fuel 21 17 18 81.0 85.7 143,179 147,321 33 35 4,339 4,209 7,021 6,605Business & Office Technology 24 17 18 70.8 75.0 111,672 158,322 31 32 3,602 4,948 6,273 10,787Certified Nurse Assistant 176 93 127 52.8 72.2 746,015 1,343,045 164 242 4,549 5,550 6,763 10,051Certified Nurses Asst.-Skills Upgrade 1 1 0 100.0 0.0 ND ND 2 0 ND ND ND ND
Culinary Arts 37 24 26 64.9 70.3 118,912 151,950 42 43 2,831 3,534 3,501 3,836Culinary Arts Externship 7 5 4 71.4 57.1 19,090 40,901 6 7 3,182 5,843 2,491 8,197Culinary Arts/Pastry Arts 7 2 7 28.6 100.0 ND 68,595 2 14 ND 4,900 ND 5,964Diesel & Heavy Technology 12 9 11 75.0 91.7 46,906 156,376 16 19 2,932 8,230 3,197 14,573Electrical IV, Correspondence 1 1 1 100.0 100.0 ND ND 2 2 ND ND ND NDEmission System - Jiffy Lube 32 28 32 87.5 100.0 507,693 611,287 56 64 9,066 9,551 15,433 17,859Emission System Inspection & Maintenance 8 7 8 87.5 100.0 92,654 137,610 14 16 6,618 8,601 12,553 17,620
Facility Maintenance Construction Trades 12 10 8 83.3 66.7 39,358 51,610 16 15 2,460 3,441 3,314 6,359
Facility Maintenance Mechanical 14 9 10 64.3 71.4 128,823 132,395 14 18 9,202 7,355 8,812 12,469Flashing Lights Exam 2 2 2 100.0 100.0 ND ND 2 3 ND ND ND NDGlobal Maritime Distress & Safety System 14 13 12 92.9 85.7 290,462 397,247 25 24 11,618 16,552 24,048 37,029
GPS Intro To Electronic Navigation 38 25 27 65.8 71.1 394,738 378,977 46 48 8,581 7,895 12,883 8,010
Hazwoper Refresher Training 26 26 23 100.0 88.5 451,462 293,818 47 40 9,606 7,345 15,915 10,771Hazwoper Training 56 35 39 62.5 69.6 322,659 409,929 58 66 5,563 6,211 9,231 7,067Help Test Prep: Cumulative Review 57 54 52 94.7 91.2 452,339 554,359 106 101 4,267 5,489 8,682 10,475
Help Test Prep: Math 48 45 44 93.8 91.7 425,863 301,358 87 80 4,895 3,767 10,389 6,992Help Test Prep: Reading 43 38 36 88.4 83.7 253,265 264,276 70 68 3,618 3,886 7,139 7,341Help Test Prep: Written Expression 36 32 33 88.9 91.7 262,772 287,716 63 61 4,171 4,717 8,407 9,265
Housing Maintenance Worker AHFC Boiler 10 10 10 100.0 100.0 159,021 211,190 20 20 7,951 10,560 17,183 20,586
Housing Maintenance Worker AHFC Plumbing 2 2 2 100.0 100.0 ND ND 4 3 ND ND ND ND
HVAC II, Correspondence 1 1 1 100.0 100.0 ND ND 2 2 ND ND ND NDIndustrial Electricity 25 19 22 76.0 88.0 157,005 284,691 26 39 6,039 7,300 6,771 9,370Industrial First Aid And CPR 33 24 19 72.7 57.6 316,656 288,785 45 31 7,037 9,316 10,689 16,075Industrial First Aid CPR - KFT 10 3 4 30.0 40.0 ND ND 6 6 ND ND ND NDInformation Technology 14 4 9 28.6 64.3 ND 108,312 6 16 ND 6,770 ND 15,466Information Technology Test Prep 4 2 4 50.0 100.0 ND ND 3 7 ND ND ND NDInsulating I 1 1 1 100.0 100.0 ND ND 2 2 ND ND ND NDIntro to Heavy Equipment Operations 5 5 5 100.0 100.0 56,457 52,584 10 9 5,646 5,843 13,390 9,793
IT, Cisco-Fast Track Training 3 2 2 66.7 66.7 ND ND 4 4 ND ND ND NDLRD-ESL 3 2 2 66.7 66.7 ND ND 4 3 ND ND ND NDLRD-GED Preparation 25 18 14 72.0 56.0 106,358 100,346 29 26 3,668 3,859 5,941 7,162Marine Drill Instructors - SCCC 18 4 4 22.2 22.2 ND ND 6 5 ND ND ND NDMarine Special Topics - Firefighting ADV 1 1 1 100.0 100.0 ND ND 2 2 ND ND ND ND
Marine Special Topics - test prep 1 0 1 0.0 100.0 ND ND 0 1 ND ND ND NDMaster/Mate Limited 12 10 10 83.3 83.3 85,298 97,985 18 17 4,739 5,764 7,174 9,625Millwright V, Correspondence 1 1 1 100.0 100.0 ND ND 2 2 ND ND ND ND
TRAINING PROGRAM PERFORMANCE—2005
Alaska Department of Labor and Workforce Development, Research and Analysis Section 18
Alaska Vocational Technical Center - Seward Students - FY 2005 Employment and Earnings Before and After Training Program
Months 7 to 12 Number
Employed Percent
Employed Total Wages Total Quarters Worked Avg. Earnings/Qtr Median Total
Earnings Reported Major or Program of Study
Number Exiting Before After Before After Before After Before After Before After Before After
Operator Uninspect Passngr/Master 100 GT 10 3 5 30.0 50.0 ND 53,909 5 7 ND 7,701 ND 5,872
OSHA-RSP - SCCC 23 5 7 21.7 30.4 6,189 45,028 6 10 1,031 4,503 733 1,903Personal Safety & Social Responsibility 1 0 0 0.0 0.0 ND ND 0 0 ND ND ND ND
Personal Survival Techniques 7 5 5 71.4 71.4 52,363 44,039 9 9 5,818 4,893 6,946 8,518Pipe Welding 4 2 4 50.0 100.0 ND ND 3 8 ND ND ND NDPlumbing I, Correspondence 1 1 1 100.0 100.0 ND ND 2 2 ND ND ND NDPower Plant Operation 18 15 17 83.3 94.4 119,634 171,336 28 33 4,273 5,192 4,583 7,211Power Plant Operation, Advanced 9 9 9 100.0 100.0 116,352 121,826 18 18 6,464 6,768 10,807 12,146Proficiency in Survival Craft 21 12 15 57.1 71.4 173,807 229,577 22 25 7,900 9,183 14,129 15,815Radar Observer 14 5 7 35.7 50.0 74,989 114,096 8 12 9,374 9,508 9,667 13,344Radar Observer, Recertification 3 1 1 33.3 33.3 ND ND 2 2 ND ND ND NDRadar Refresher 18 12 12 66.7 66.7 260,631 427,255 20 22 13,032 19,421 21,001 35,711Rating Forming Part of Navigational Watch 5 2 3 40.0 60.0 ND ND 3 4 ND ND ND ND
RSP - Weidner Electrical 17 15 15 88.2 88.2 195,546 241,641 28 29 6,984 8,332 15,227 17,651RSP-Weidner Refrigeration 21 18 17 85.7 81.0 238,080 284,521 34 33 7,002 8,622 15,281 17,764SA CCNA 1 Networking Basics 2 2 2 100.0 100.0 ND ND 4 4 ND ND ND NDSA CCNA 2 Routers & Routing Basics 2 2 2 100.0 100.0 ND ND 4 4 ND ND ND ND
SA Cisco Network Academy Orientation 1 1 1 100.0 100.0 ND ND 2 2 ND ND ND ND
SA Cold Water Safety 6 5 5 83.3 83.3 91,708 135,321 10 10 9,171 13,532 21,657 23,196SA IT Essentials I PC Hardware/Software 1 1 1 100.0 100.0 ND ND 2 2 ND ND ND ND
SA Marine Drill Instructors 5 4 4 80.0 80.0 ND ND 8 8 ND ND ND NDSA MS Digital Imaging 9 8 8 88.9 88.9 136,856 142,234 15 16 9,124 8,890 14,682 17,908SA-BOT MS Excel Expert Prep 4 3 4 75.0 100.0 ND ND 6 8 ND ND ND NDSA-Intro to Moodle Learning Mngmt System 10 8 9 80.0 90.0 149,923 266,707 15 18 9,995 14,817 20,501 28,792
SA-Video Teleconference 101 5 4 4 80.0 80.0 ND ND 8 8 ND ND ND NDSchool Bus Driver Instructor Refresher 16 14 14 87.5 87.5 246,884 276,895 28 28 8,817 9,889 15,644 18,340
Seafood Processing 42 27 22 64.3 52.4 74,485 42,769 40 33 1,862 1,296 1,354 1,604Tankerman 16 11 14 68.8 87.5 197,352 258,247 17 22 11,609 11,738 16,804 20,132Welding Technology 24 17 17 70.8 70.8 69,278 189,055 26 31 2,665 6,099 3,113 8,395ND=Nondisclosable Note: Does not include participants that did not provide a social security number. Source: Alaska Department of Labor and Workforce Development, Research and Analysis Section
TRAINING PROGRAM PERFORMANCE—2005
Alaska Department of Labor and Workforce Development, Research and Analysis Section 19
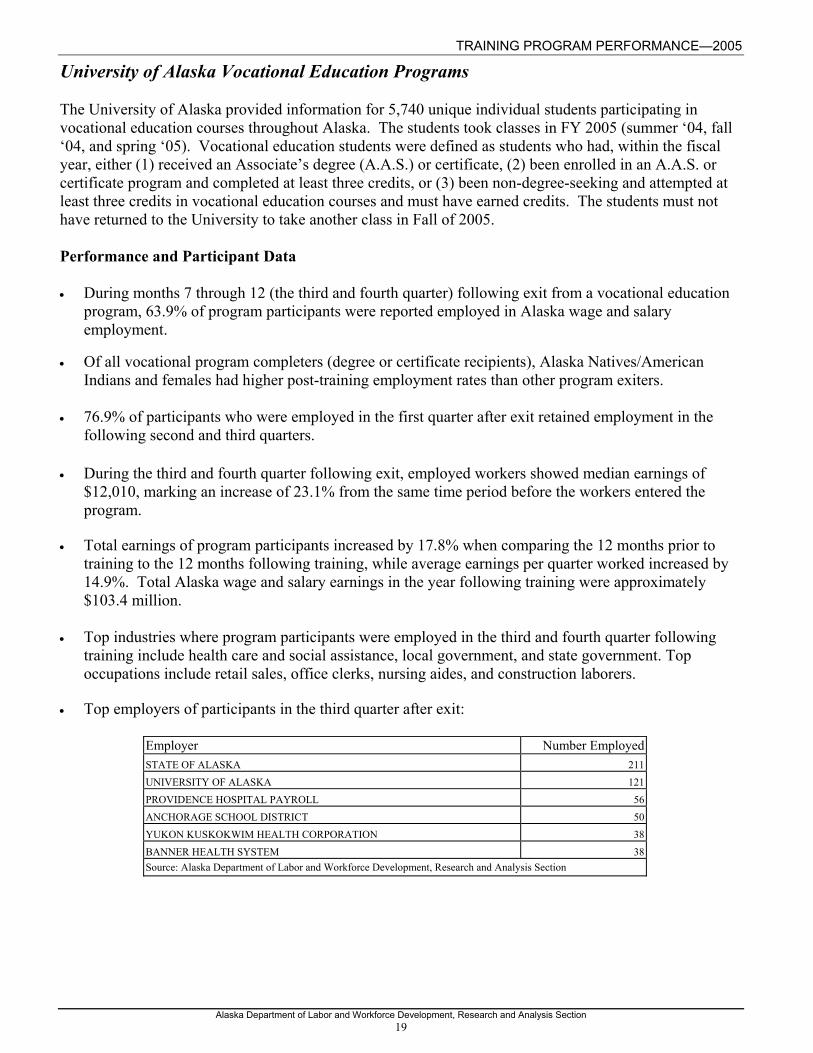
University of Alaska Vocational Education Programs The University of Alaska provided information for 5,740 unique individual students participating in vocational education courses throughout Alaska. The students took classes in FY 2005 (summer ‘04, fall ‘04, and spring ‘05). Vocational education students were defined as students who had, within the fiscal year, either (1) received an Associate’s degree (A.A.S.) or certificate, (2) been enrolled in an A.A.S. or certificate program and completed at least three credits, or (3) been non-degree-seeking and attempted at least three credits in vocational education courses and must have earned credits. The students must not have returned to the University to take another class in Fall of 2005. Performance and Participant Data • During months 7 through 12 (the third and fourth quarter) following exit from a vocational education
program, 63.9% of program participants were reported employed in Alaska wage and salary employment.
• Of all vocational program completers (degree or certificate recipients), Alaska Natives/American
Indians and females had higher post-training employment rates than other program exiters. • 76.9% of participants who were employed in the first quarter after exit retained employment in the
following second and third quarters. • During the third and fourth quarter following exit, employed workers showed median earnings of
$12,010, marking an increase of 23.1% from the same time period before the workers entered the program.
• Total earnings of program participants increased by 17.8% when comparing the 12 months prior to
training to the 12 months following training, while average earnings per quarter worked increased by 14.9%. Total Alaska wage and salary earnings in the year following training were approximately $103.4 million.
• Top industries where program participants were employed in the third and fourth quarter following
training include health care and social assistance, local government, and state government. Top occupations include retail sales, office clerks, nursing aides, and construction laborers.
• Top employers of participants in the third quarter after exit:
Employer Number Employed STATE OF ALASKA 211 UNIVERSITY OF ALASKA 121
PROVIDENCE HOSPITAL PAYROLL 56 ANCHORAGE SCHOOL DISTRICT 50 YUKON KUSKOKWIM HEALTH CORPORATION 38
BANNER HEALTH SYSTEM 38 Source: Alaska Department of Labor and Workforce Development, Research and Analysis Section

TRAINING PROGRAM PERFORMANCE—2005
Alaska Department of Labor and Workforce Development, Research and Analysis Section 20
University of Alaska Vocational Education Programs
Training Program Performance Indicators For Participants Exiting in FY 2005
Months 1 to 12 After Training
Months 7 to 12 After Training
Total Training Participants 5,740 5,740
Percent with Alaska Wage and Salary Employment 72.8 63.9Median Total Earnings $19,842 $12,010Percent of Workers Employed in Related Occupations NA 41.8Number of: Alaska Wage and Salary Employed 4,176 3,665Department of Defense Employed 119 100Civilian Federal Government Employed 175 162Total number employed in Alaska or Federal Government 1/ 4,403 3,892Percent Employed in Alaska or Federal Government 1/ 76.7 67.8Total number of Alaska wage and salary quarters worked 13,652 6,637Total Alaska wage and salary earnings after training $103,356,348 $51,511,437Total Alaska wage and salary earnings before training 2/ $87,775,505 $42,140,431Percent change in total earnings after training 17.8 22.2Average earnings per quarter worked after training $7,571 $7,761Average earnings per quarter worked before training 2/ $6,592 $6,647Alaska 2006 Occupational License Holders 367 367Alaska 2006 Business License Holders 145 145Alaska 2006 PFD Applicants 3,274 3,274Unemployment Insurance Claimants 536 380Continuing Education In Alaska 3/ 1,125 1,125Continuing Education Outside Alaska 3/ 574 574Source: Alaska Department of Labor and Workforce Development, Research and Analysis Section 1/ Unduplicated count of employed workers 2/ Alaska wage and salary earnings before training 3/ Postsecondary education at University of Alaska and as reported by the National Student Clearinghouse. Excludes vocational education program participants’ data.
60.8 59.967.7
62.663.9 63.069.5
64.6
FY 05FY 04
FY 03FY 02
0.0
10.0
20.0
30.0
40.0
50.0
60.0
70.0
80.0Before After
Percent Employed and Median Earnings forUniversity of Alaska Vocational Education Students
Median Total EarningsMonths 7 to 12
Percentage of Participants EmployedMonths 7 to 12
71.9 70.275.1 73.472.8 72.4
78.473.7
FY 05FY 04
FY 03FY 02
0.0
20.0
40.0
60.0
80.0
100.0Before After
$15,504
$14,382
$16,220
$14,869
$19,842
$18,166
$20,621
$18,628
FY 05
FY 04
FY 03
FY 02
Before After
$9,754
$8,824
$9,115
$8,940
$12,010
$10,812
$11,941
$11,239
FY 05
FY 04
FY 03
FY 02
Before After
Percentage of Participants EmployedMonths 1 to 12
Median Total EarningsMonths 1 to 12
TRAINING PROGRAM PERFORMANCE—2005
Alaska Department of Labor and Workforce Development, Research and Analysis Section 21
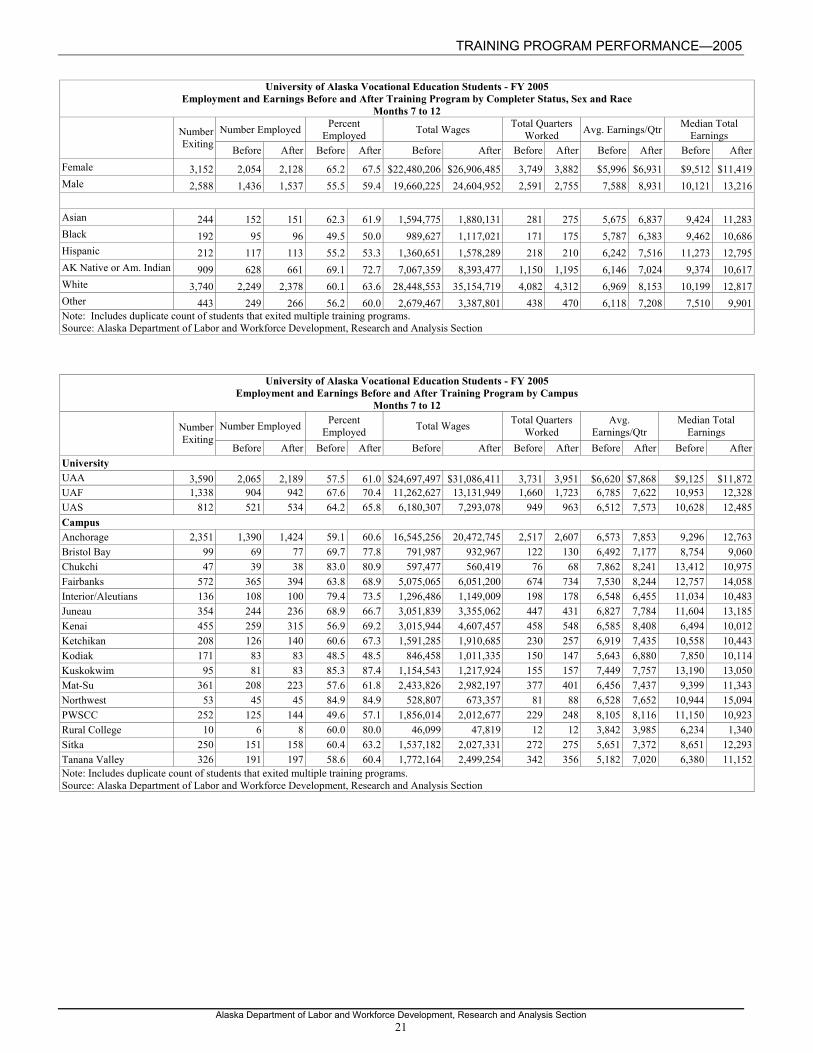
University of Alaska Vocational Education Students - FY 2005
Employment and Earnings Before and After Training Program by Completer Status, Sex and Race Months 7 to 12
Number Employed Percent Employed Total Wages Total Quarters
Worked Avg. Earnings/Qtr Median Total Earnings Number
Exiting Before After Before After Before After Before After Before After Before AfterFemale 3,152 2,054 2,128 65.2 67.5 $22,480,206 $26,906,485 3,749 3,882 $5,996 $6,931 $9,512 $11,419Male 2,588 1,436 1,537 55.5 59.4 19,660,225 24,604,952 2,591 2,755 7,588 8,931 10,121 13,216
Asian 244 152 151 62.3 61.9 1,594,775 1,880,131 281 275 5,675 6,837 9,424 11,283Black 192 95 96 49.5 50.0 989,627 1,117,021 171 175 5,787 6,383 9,462 10,686Hispanic 212 117 113 55.2 53.3 1,360,651 1,578,289 218 210 6,242 7,516 11,273 12,795AK Native or Am. Indian 909 628 661 69.1 72.7 7,067,359 8,393,477 1,150 1,195 6,146 7,024 9,374 10,617White 3,740 2,249 2,378 60.1 63.6 28,448,553 35,154,719 4,082 4,312 6,969 8,153 10,199 12,817Other 443 249 266 56.2 60.0 2,679,467 3,387,801 438 470 6,118 7,208 7,510 9,901Note: Includes duplicate count of students that exited multiple training programs. Source: Alaska Department of Labor and Workforce Development, Research and Analysis Section
University of Alaska Vocational Education Students - FY 2005 Employment and Earnings Before and After Training Program by Campus
Months 7 to 12
Number Employed Percent Employed Total Wages Total Quarters
Worked Avg.
Earnings/Qtr Median Total
Earnings Number Exiting
Before After Before After Before After Before After Before After Before AfterUniversity UAA 3,590 2,065 2,189 57.5 61.0 $24,697,497 $31,086,411 3,731 3,951 $6,620 $7,868 $9,125 $11,872UAF 1,338 904 942 67.6 70.4 11,262,627 13,131,949 1,660 1,723 6,785 7,622 10,953 12,328UAS 812 521 534 64.2 65.8 6,180,307 7,293,078 949 963 6,512 7,573 10,628 12,485Campus Anchorage 2,351 1,390 1,424 59.1 60.6 16,545,256 20,472,745 2,517 2,607 6,573 7,853 9,296 12,763Bristol Bay 99 69 77 69.7 77.8 791,987 932,967 122 130 6,492 7,177 8,754 9,060Chukchi 47 39 38 83.0 80.9 597,477 560,419 76 68 7,862 8,241 13,412 10,975Fairbanks 572 365 394 63.8 68.9 5,075,065 6,051,200 674 734 7,530 8,244 12,757 14,058Interior/Aleutians 136 108 100 79.4 73.5 1,296,486 1,149,009 198 178 6,548 6,455 11,034 10,483Juneau 354 244 236 68.9 66.7 3,051,839 3,355,062 447 431 6,827 7,784 11,604 13,185Kenai 455 259 315 56.9 69.2 3,015,944 4,607,457 458 548 6,585 8,408 6,494 10,012Ketchikan 208 126 140 60.6 67.3 1,591,285 1,910,685 230 257 6,919 7,435 10,558 10,443Kodiak 171 83 83 48.5 48.5 846,458 1,011,335 150 147 5,643 6,880 7,850 10,114Kuskokwim 95 81 83 85.3 87.4 1,154,543 1,217,924 155 157 7,449 7,757 13,190 13,050Mat-Su 361 208 223 57.6 61.8 2,433,826 2,982,197 377 401 6,456 7,437 9,399 11,343Northwest 53 45 45 84.9 84.9 528,807 673,357 81 88 6,528 7,652 10,944 15,094PWSCC 252 125 144 49.6 57.1 1,856,014 2,012,677 229 248 8,105 8,116 11,150 10,923Rural College 10 6 8 60.0 80.0 46,099 47,819 12 12 3,842 3,985 6,234 1,340Sitka 250 151 158 60.4 63.2 1,537,182 2,027,331 272 275 5,651 7,372 8,651 12,293Tanana Valley 326 191 197 58.6 60.4 1,772,164 2,499,254 342 356 5,182 7,020 6,380 11,152Note: Includes duplicate count of students that exited multiple training programs. Source: Alaska Department of Labor and Workforce Development, Research and Analysis Section
TRAINING PROGRAM PERFORMANCE—2005
Alaska Department of Labor and Workforce Development, Research and Analysis Section 22
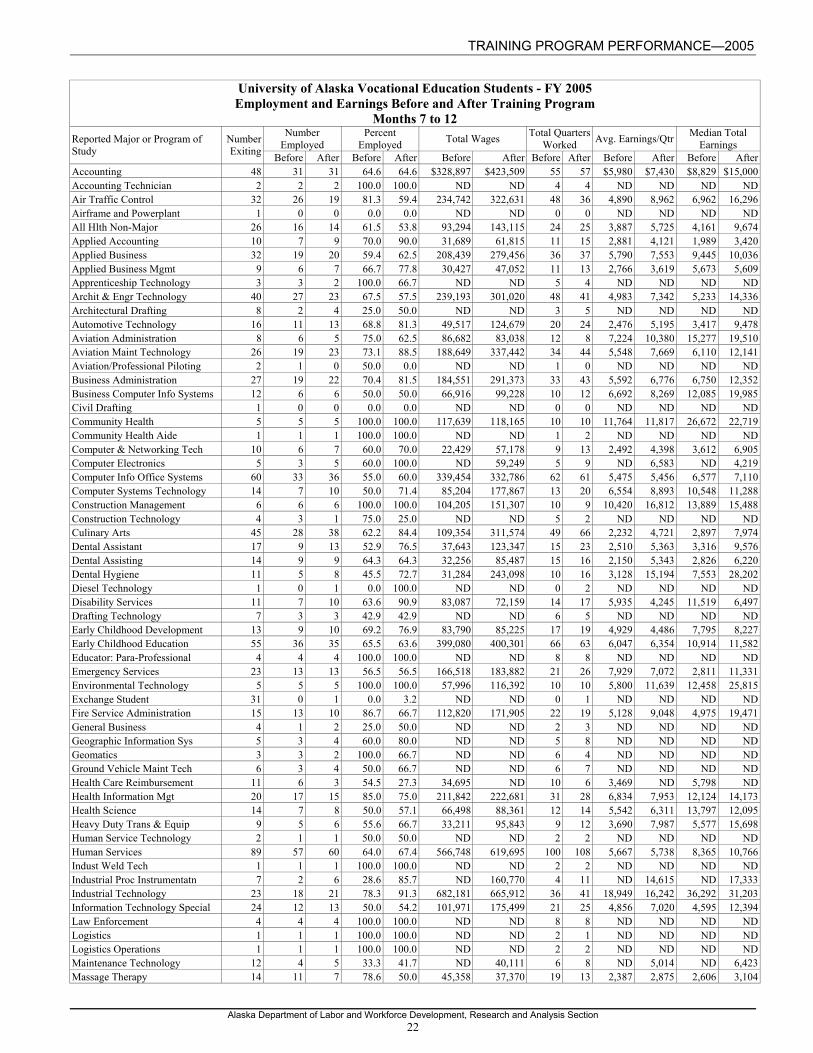
University of Alaska Vocational Education Students - FY 2005 Employment and Earnings Before and After Training Program
Months 7 to 12 Number
Employed Percent
Employed Total Wages Total Quarters Worked Avg. Earnings/Qtr Median Total
Earnings Reported Major or Program of Study
Number Exiting Before After Before After Before After Before After Before After Before After
Accounting 48 31 31 64.6 64.6 $328,897 $423,509 55 57 $5,980 $7,430 $8,829 $15,000Accounting Technician 2 2 2 100.0 100.0 ND ND 4 4 ND ND ND NDAir Traffic Control 32 26 19 81.3 59.4 234,742 322,631 48 36 4,890 8,962 6,962 16,296Airframe and Powerplant 1 0 0 0.0 0.0 ND ND 0 0 ND ND ND NDAll Hlth Non-Major 26 16 14 61.5 53.8 93,294 143,115 24 25 3,887 5,725 4,161 9,674Applied Accounting 10 7 9 70.0 90.0 31,689 61,815 11 15 2,881 4,121 1,989 3,420Applied Business 32 19 20 59.4 62.5 208,439 279,456 36 37 5,790 7,553 9,445 10,036Applied Business Mgmt 9 6 7 66.7 77.8 30,427 47,052 11 13 2,766 3,619 5,673 5,609Apprenticeship Technology 3 3 2 100.0 66.7 ND ND 5 4 ND ND ND NDArchit & Engr Technology 40 27 23 67.5 57.5 239,193 301,020 48 41 4,983 7,342 5,233 14,336Architectural Drafting 8 2 4 25.0 50.0 ND ND 3 5 ND ND ND NDAutomotive Technology 16 11 13 68.8 81.3 49,517 124,679 20 24 2,476 5,195 3,417 9,478Aviation Administration 8 6 5 75.0 62.5 86,682 83,038 12 8 7,224 10,380 15,277 19,510Aviation Maint Technology 26 19 23 73.1 88.5 188,649 337,442 34 44 5,548 7,669 6,110 12,141Aviation/Professional Piloting 2 1 0 50.0 0.0 ND ND 1 0 ND ND ND NDBusiness Administration 27 19 22 70.4 81.5 184,551 291,373 33 43 5,592 6,776 6,750 12,352Business Computer Info Systems 12 6 6 50.0 50.0 66,916 99,228 10 12 6,692 8,269 12,085 19,985Civil Drafting 1 0 0 0.0 0.0 ND ND 0 0 ND ND ND NDCommunity Health 5 5 5 100.0 100.0 117,639 118,165 10 10 11,764 11,817 26,672 22,719Community Health Aide 1 1 1 100.0 100.0 ND ND 1 2 ND ND ND NDComputer & Networking Tech 10 6 7 60.0 70.0 22,429 57,178 9 13 2,492 4,398 3,612 6,905Computer Electronics 5 3 5 60.0 100.0 ND 59,249 5 9 ND 6,583 ND 4,219Computer Info Office Systems 60 33 36 55.0 60.0 339,454 332,786 62 61 5,475 5,456 6,577 7,110Computer Systems Technology 14 7 10 50.0 71.4 85,204 177,867 13 20 6,554 8,893 10,548 11,288Construction Management 6 6 6 100.0 100.0 104,205 151,307 10 9 10,420 16,812 13,889 15,488Construction Technology 4 3 1 75.0 25.0 ND ND 5 2 ND ND ND NDCulinary Arts 45 28 38 62.2 84.4 109,354 311,574 49 66 2,232 4,721 2,897 7,974Dental Assistant 17 9 13 52.9 76.5 37,643 123,347 15 23 2,510 5,363 3,316 9,576Dental Assisting 14 9 9 64.3 64.3 32,256 85,487 15 16 2,150 5,343 2,826 6,220Dental Hygiene 11 5 8 45.5 72.7 31,284 243,098 10 16 3,128 15,194 7,553 28,202Diesel Technology 1 0 1 0.0 100.0 ND ND 0 2 ND ND ND NDDisability Services 11 7 10 63.6 90.9 83,087 72,159 14 17 5,935 4,245 11,519 6,497Drafting Technology 7 3 3 42.9 42.9 ND ND 6 5 ND ND ND NDEarly Childhood Development 13 9 10 69.2 76.9 83,790 85,225 17 19 4,929 4,486 7,795 8,227Early Childhood Education 55 36 35 65.5 63.6 399,080 400,301 66 63 6,047 6,354 10,914 11,582Educator: Para-Professional 4 4 4 100.0 100.0 ND ND 8 8 ND ND ND NDEmergency Services 23 13 13 56.5 56.5 166,518 183,882 21 26 7,929 7,072 2,811 11,331Environmental Technology 5 5 5 100.0 100.0 57,996 116,392 10 10 5,800 11,639 12,458 25,815Exchange Student 31 0 1 0.0 3.2 ND ND 0 1 ND ND ND NDFire Service Administration 15 13 10 86.7 66.7 112,820 171,905 22 19 5,128 9,048 4,975 19,471General Business 4 1 2 25.0 50.0 ND ND 2 3 ND ND ND NDGeographic Information Sys 5 3 4 60.0 80.0 ND ND 5 8 ND ND ND NDGeomatics 3 3 2 100.0 66.7 ND ND 6 4 ND ND ND NDGround Vehicle Maint Tech 6 3 4 50.0 66.7 ND ND 6 7 ND ND ND NDHealth Care Reimbursement 11 6 3 54.5 27.3 34,695 ND 10 6 3,469 ND 5,798 NDHealth Information Mgt 20 17 15 85.0 75.0 211,842 222,681 31 28 6,834 7,953 12,124 14,173Health Science 14 7 8 50.0 57.1 66,498 88,361 12 14 5,542 6,311 13,797 12,095Heavy Duty Trans & Equip 9 5 6 55.6 66.7 33,211 95,843 9 12 3,690 7,987 5,577 15,698Human Service Technology 2 1 1 50.0 50.0 ND ND 2 2 ND ND ND NDHuman Services 89 57 60 64.0 67.4 566,748 619,695 100 108 5,667 5,738 8,365 10,766Indust Weld Tech 1 1 1 100.0 100.0 ND ND 2 2 ND ND ND NDIndustrial Proc Instrumentatn 7 2 6 28.6 85.7 ND 160,770 4 11 ND 14,615 ND 17,333Industrial Technology 23 18 21 78.3 91.3 682,181 665,912 36 41 18,949 16,242 36,292 31,203Information Technology Special 24 12 13 50.0 54.2 101,971 175,499 21 25 4,856 7,020 4,595 12,394Law Enforcement 4 4 4 100.0 100.0 ND ND 8 8 ND ND ND NDLogistics 1 1 1 100.0 100.0 ND ND 2 1 ND ND ND NDLogistics Operations 1 1 1 100.0 100.0 ND ND 2 2 ND ND ND NDMaintenance Technology 12 4 5 33.3 41.7 ND 40,111 6 8 ND 5,014 ND 6,423Massage Therapy 14 11 7 78.6 50.0 45,358 37,370 19 13 2,387 2,875 2,606 3,104

TRAINING PROGRAM PERFORMANCE—2005
Alaska Department of Labor and Workforce Development, Research and Analysis Section 23
University of Alaska Vocational Education Students - FY 2005 Employment and Earnings Before and After Training Program
Months 7 to 12 Number
Employed Percent
Employed Total Wages Total Quarters Worked Avg. Earnings/Qtr Median Total
Earnings Reported Major or Program of Study
Number Exiting Before After Before After Before After Before After Before After Before After
Mech & Elect Drafting 2 1 1 50.0 50.0 ND ND 2 1 ND ND ND NDMechanical Technology 4 2 3 50.0 75.0 ND ND 4 5 ND ND ND NDMedical Assistant 24 16 14 66.7 58.3 142,515 149,833 31 25 4,597 5,993 8,807 13,035Medical Assisting 10 5 7 50.0 70.0 31,039 98,614 9 13 3,449 7,586 4,450 16,093Medical Lab Technology 2 2 1 100.0 50.0 ND ND 3 2 ND ND ND NDMicrocomputer Support Special 9 7 8 77.8 88.9 123,102 140,804 14 14 8,793 10,057 20,788 17,930Non-Degree Secondary Student 51 19 30 37.3 58.8 54,295 117,670 31 46 1,751 2,558 2,584 2,353Non-Degree Seeking 4,083 2,454 2,564 60.1 62.8 31,537,631 36,387,362 4,474 4,627 7,049 7,864 10,698 12,113Non-Degree/Accepted 16 10 13 62.5 81.3 40,352 107,112 16 23 2,522 4,657 2,393 6,802Nursing 41 31 29 75.6 70.7 331,655 541,260 58 57 5,718 9,496 11,164 19,211Occupational Safety & Health 5 4 5 80.0 100.0 ND 175,872 8 10 ND 17,587 ND 44,787Office Management & Technology 25 9 11 36.0 44.0 63,993 118,917 17 20 3,764 5,946 4,509 7,787Office Technology 2 0 1 0.0 50.0 ND ND 0 1 ND ND ND NDOutdoor Skills & Leadership 2 1 1 50.0 50.0 ND ND 2 2 ND ND ND NDParalegal Studies 21 15 11 71.4 52.4 149,789 182,571 26 21 5,761 8,694 7,584 15,859Paramedical Tech 3 3 2 100.0 66.7 ND ND 6 3 ND ND ND NDPetroleum Technology 2 2 2 100.0 100.0 ND ND 3 4 ND ND ND NDPharmacy Technology 2 2 0 100.0 0.0 ND ND 4 0 ND ND ND NDPhlebotomy 2 1 2 50.0 100.0 ND ND 2 4 ND ND ND NDPower Technology 7 6 5 85.7 71.4 76,216 103,494 11 10 6,929 10,349 9,805 14,330Practical Nursing 13 9 10 69.2 76.9 125,322 139,425 17 17 7,372 8,201 17,352 13,859Pre-Major Automotive Tech 2 1 2 50.0 100.0 ND ND 2 4 ND ND ND NDPre-Major Dental Assisting 6 1 5 16.7 83.3 ND 24,908 1 8 ND 3,113 ND 2,520Pre-Major Dental Hygiene 25 18 18 72.0 72.0 136,005 171,079 32 33 4,250 5,184 7,007 9,975Pre-Major Medical Assisting 11 6 7 54.5 63.6 108,833 87,042 11 12 9,894 7,253 15,807 9,883Pre-Major Medical Lab Tech 8 3 4 37.5 50.0 ND ND 5 7 ND ND ND NDPre-Major Nursing 126 83 85 65.9 67.5 790,109 1,022,896 150 156 5,267 6,557 8,634 11,177Pre-Major Paralegal Studies 17 11 10 64.7 58.8 150,964 145,145 22 20 6,862 7,257 13,492 13,437Pre-Major Radiologic Technology 52 32 35 61.5 67.3 271,551 378,790 56 63 4,849 6,013 6,448 10,406Process Technology 51 37 44 72.5 86.3 586,009 1,295,563 67 83 8,746 15,609 12,951 29,909Professional Piloting 19 9 10 47.4 52.6 51,772 120,914 18 17 2,876 7,113 4,606 11,939Radiologic Technology 21 15 19 71.4 90.5 94,582 408,469 24 38 3,941 10,749 4,082 23,836Refrig & Heat Technology 18 9 12 50.0 66.7 70,240 180,246 16 23 4,390 7,837 5,889 9,248Renewable Resources 2 2 2 100.0 100.0 ND ND 3 3 ND ND ND NDRural Human Services 21 21 18 100.0 85.7 334,492 240,517 42 33 7,964 7,288 16,821 15,505Small Business Administration 59 40 43 67.8 72.9 460,395 519,834 74 78 6,222 6,665 10,759 12,031Small Business Mgmt 11 5 3 45.5 27.3 17,794 ND 8 5 2,224 ND 3,329 NDTechnology 1 1 1 100.0 100.0 ND ND 2 2 ND ND ND NDTelecomm Elect & Computer Tech 25 12 11 48.0 44.0 84,765 103,549 22 20 3,853 5,177 5,114 9,013Theatre 1 0 0 0.0 0.0 ND ND 0 0 ND ND ND NDTribal Management 7 7 6 100.0 85.7 77,299 95,342 14 12 5,521 7,945 11,035 15,505TVC Non-Major 6 4 4 66.7 66.7 ND ND 6 6 ND ND ND NDWeld & NonDestruct Test Tech 11 8 9 72.7 81.8 37,237 162,515 16 18 2,327 9,029 4,669 13,216Welding Technology 3 2 2 66.7 66.7 ND ND 3 3 ND ND ND NDWord/Info Processing 1 1 0 100.0 0.0 ND ND 2 0 ND ND ND NDND=Nondisclosable Note: This table cannot be compared with data from prior reports. Previous years’ reports show enrollment by course subject while this information is presented by the program (major, degree and campus) in which the student is enrolled. Source: Alaska Department of Labor and Workforce Development, Research and Analysis Section
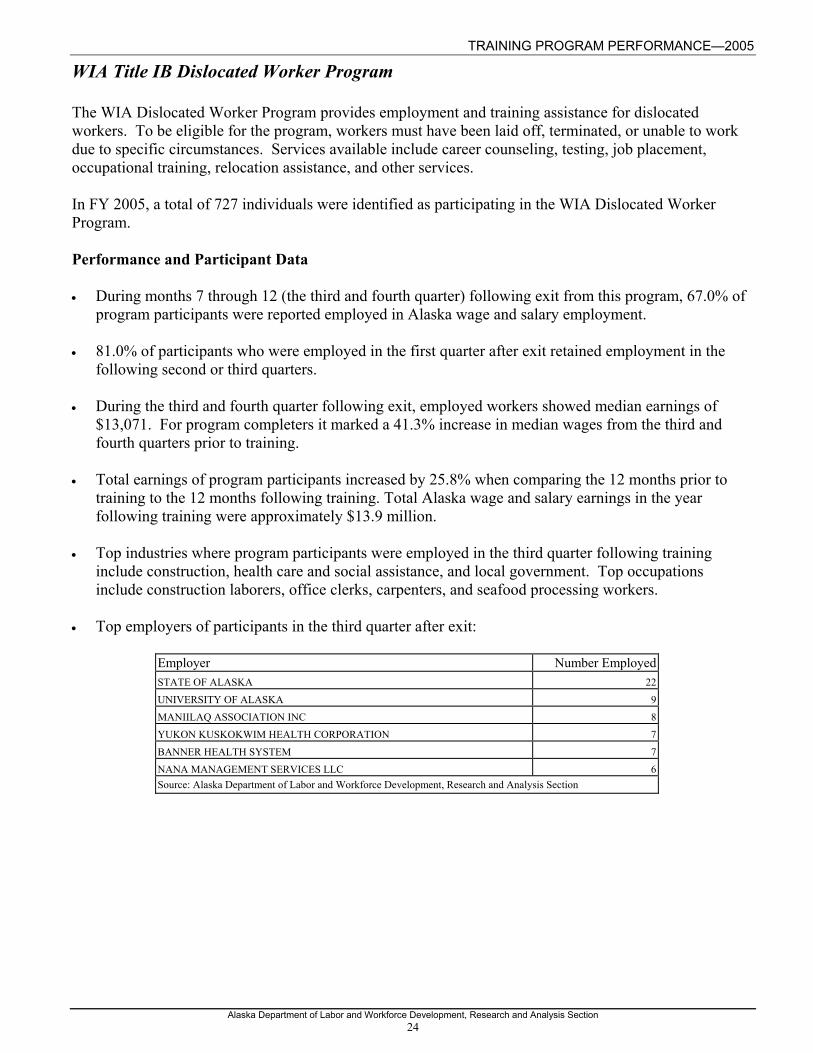
TRAINING PROGRAM PERFORMANCE—2005
Alaska Department of Labor and Workforce Development, Research and Analysis Section 24
WIA Title IB Dislocated Worker Program The WIA Dislocated Worker Program provides employment and training assistance for dislocated workers. To be eligible for the program, workers must have been laid off, terminated, or unable to work due to specific circumstances. Services available include career counseling, testing, job placement, occupational training, relocation assistance, and other services. In FY 2005, a total of 727 individuals were identified as participating in the WIA Dislocated Worker Program. Performance and Participant Data • During months 7 through 12 (the third and fourth quarter) following exit from this program, 67.0% of
program participants were reported employed in Alaska wage and salary employment. • 81.0% of participants who were employed in the first quarter after exit retained employment in the
following second or third quarters. • During the third and fourth quarter following exit, employed workers showed median earnings of
$13,071. For program completers it marked a 41.3% increase in median wages from the third and fourth quarters prior to training.
• Total earnings of program participants increased by 25.8% when comparing the 12 months prior to
training to the 12 months following training. Total Alaska wage and salary earnings in the year following training were approximately $13.9 million.
• Top industries where program participants were employed in the third quarter following training
include construction, health care and social assistance, and local government. Top occupations include construction laborers, office clerks, carpenters, and seafood processing workers.
• Top employers of participants in the third quarter after exit:
Employer Number EmployedSTATE OF ALASKA 22
UNIVERSITY OF ALASKA 9MANIILAQ ASSOCIATION INC 8YUKON KUSKOKWIM HEALTH CORPORATION 7
BANNER HEALTH SYSTEM 7NANA MANAGEMENT SERVICES LLC 6Source: Alaska Department of Labor and Workforce Development, Research and Analysis Section
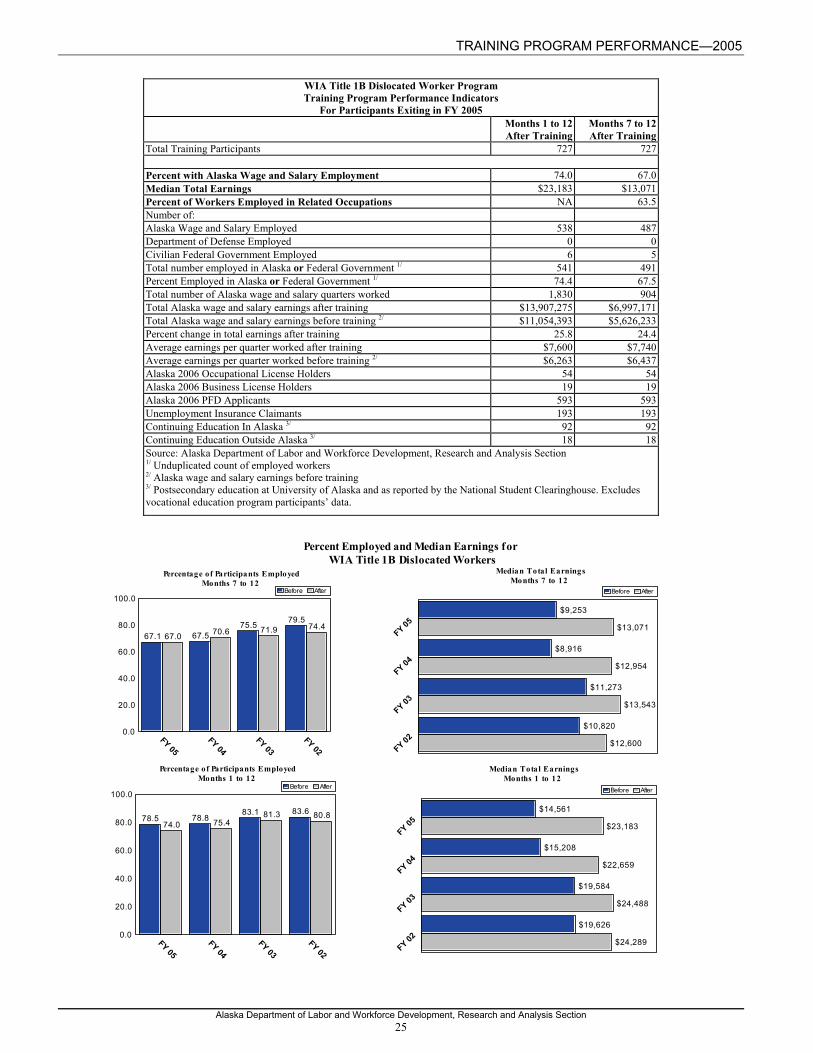
TRAINING PROGRAM PERFORMANCE—2005
Alaska Department of Labor and Workforce Development, Research and Analysis Section 25
WIA Title 1B Dislocated Worker Program Training Program Performance Indicators
For Participants Exiting in FY 2005 Months 1 to 12 After Training
Months 7 to 12 After Training
Total Training Participants 727 727
Percent with Alaska Wage and Salary Employment 74.0 67.0Median Total Earnings $23,183 $13,071Percent of Workers Employed in Related Occupations NA 63.5Number of: Alaska Wage and Salary Employed 538 487Department of Defense Employed 0 0Civilian Federal Government Employed 6 5Total number employed in Alaska or Federal Government 1/ 541 491Percent Employed in Alaska or Federal Government 1/ 74.4 67.5Total number of Alaska wage and salary quarters worked 1,830 904Total Alaska wage and salary earnings after training $13,907,275 $6,997,171Total Alaska wage and salary earnings before training 2/ $11,054,393 $5,626,233Percent change in total earnings after training 25.8 24.4Average earnings per quarter worked after training $7,600 $7,740Average earnings per quarter worked before training 2/ $6,263 $6,437Alaska 2006 Occupational License Holders 54 54Alaska 2006 Business License Holders 19 19Alaska 2006 PFD Applicants 593 593Unemployment Insurance Claimants 193 193Continuing Education In Alaska 3/ 92 92Continuing Education Outside Alaska 3/ 18 18Source: Alaska Department of Labor and Workforce Development, Research and Analysis Section 1/ Unduplicated count of employed workers 2/ Alaska wage and salary earnings before training 3/ Postsecondary education at University of Alaska and as reported by the National Student Clearinghouse. Excludes vocational education program participants’ data.
67.1 67.575.5 79.5
67.0 70.6 71.9 74.4
FY 05
FY 04FY 03
FY 02
0.0
20.0
40.0
60.0
80.0
100.0Before After
Percent Employed and Median Earnings forWIA Title 1B Dislocated Workers
Median Total EarningsMonths 7 to 12
Percentage of Participants EmployedMonths 7 to 12
78.5 78.883.1 83.6
74.0 75.481.3 80.8
FY 05FY 04
FY 03FY 02
0.0
20.0
40.0
60.0
80.0
100.0Before After
$14,561
$15,208
$19,584
$19,626
$23,183
$22,659
$24,488
$24,289
FY 05
FY 04
FY 03
FY 02
Before After
$9,253
$8,916
$11,273
$10,820
$13,071
$12,954
$13,543
$12,600
FY 05
FY 04
FY 03
FY 02
Before After
Percentage of Participants EmployedMonths 1 to 12
Median Total EarningsMonths 1 to 12
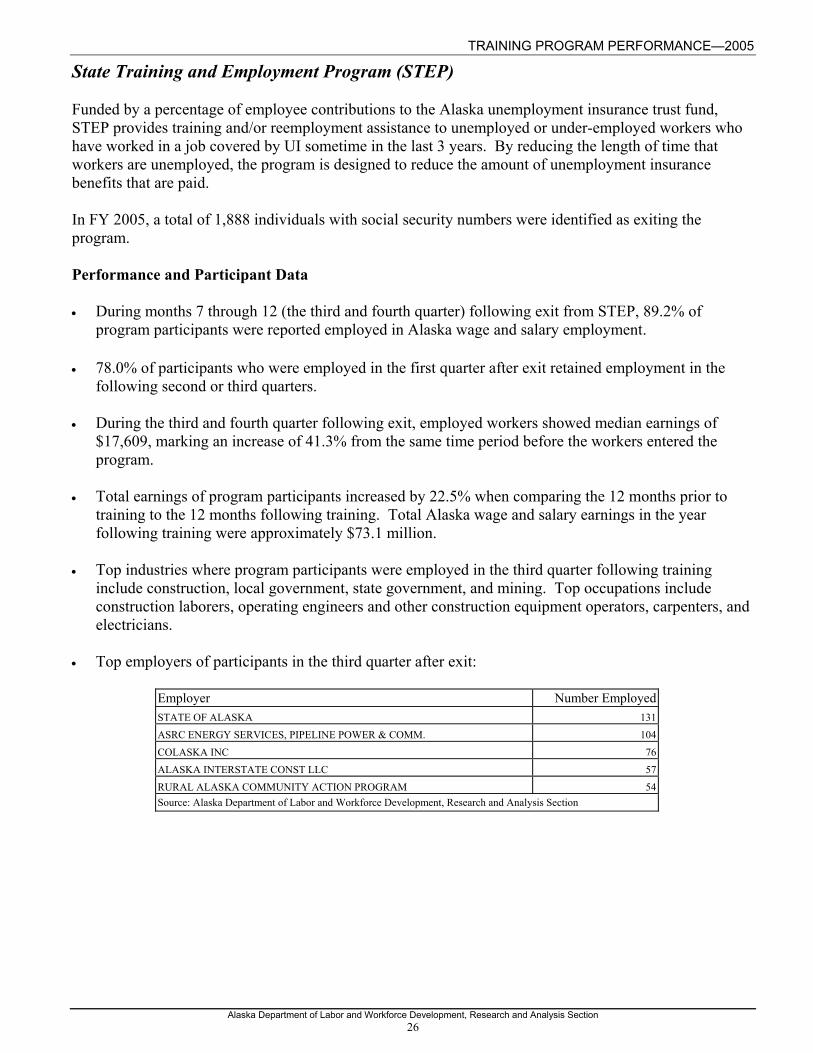
TRAINING PROGRAM PERFORMANCE—2005
Alaska Department of Labor and Workforce Development, Research and Analysis Section 26
State Training and Employment Program (STEP) Funded by a percentage of employee contributions to the Alaska unemployment insurance trust fund, STEP provides training and/or reemployment assistance to unemployed or under-employed workers who have worked in a job covered by UI sometime in the last 3 years. By reducing the length of time that workers are unemployed, the program is designed to reduce the amount of unemployment insurance benefits that are paid. In FY 2005, a total of 1,888 individuals with social security numbers were identified as exiting the program. Performance and Participant Data • During months 7 through 12 (the third and fourth quarter) following exit from STEP, 89.2% of
program participants were reported employed in Alaska wage and salary employment. • 78.0% of participants who were employed in the first quarter after exit retained employment in the
following second or third quarters. • During the third and fourth quarter following exit, employed workers showed median earnings of
$17,609, marking an increase of 41.3% from the same time period before the workers entered the program.
• Total earnings of program participants increased by 22.5% when comparing the 12 months prior to
training to the 12 months following training. Total Alaska wage and salary earnings in the year following training were approximately $73.1 million.
• Top industries where program participants were employed in the third quarter following training
include construction, local government, state government, and mining. Top occupations include construction laborers, operating engineers and other construction equipment operators, carpenters, and electricians.
• Top employers of participants in the third quarter after exit:
Employer Number EmployedSTATE OF ALASKA 131ASRC ENERGY SERVICES, PIPELINE POWER & COMM. 104
COLASKA INC 76ALASKA INTERSTATE CONST LLC 57RURAL ALASKA COMMUNITY ACTION PROGRAM 54Source: Alaska Department of Labor and Workforce Development, Research and Analysis Section

TRAINING PROGRAM PERFORMANCE—2005
Alaska Department of Labor and Workforce Development, Research and Analysis Section 27
State Training and Employment Program (STEP)
Training Program Performance Indicators For Participants Exiting in FY 2005
Months 1 to 12 After Training
Months 7 to 12 After Training
Total Training Participants 1,888 1,888
Percent with Alaska Wage and Salary Employment 95.2 89.2Median Total Earnings $36,116 $17,609Percent of Workers Employed in Related Occupations NA 95.5Number of: Alaska Wage and Salary Employed 1,797 1,685Department of Defense Employed 0 0Civilian Federal Government Employed 7 7Total number employed in Alaska or Federal Government 1/ 1,799 1,689Percent Employed in Alaska or Federal Government 1/ 95.3 89.5Total number of Alaska wage and salary quarters worked 6,330 3,061Total Alaska wage and salary earnings after training $73,091,224 $33,892,873Total Alaska wage and salary earnings before training 2/ $59,659,130 $25,619,561Percent change in total earnings after training 22.5 32.3Average earnings per quarter worked after training $11,547 $11,072Average earnings per quarter worked before training 2/ $9,482 $8,405Alaska 2006 Occupational License Holders 47 47Alaska 2006 Business License Holders 46 46Alaska 2006 PFD Applicants 1,706 1,706Unemployment Insurance Claimants 941 784Continuing Education In Alaska 3/ 168 168Continuing Education Outside Alaska 3/ 13 13Source: Alaska Department of Labor and Workforce Development, Research and Analysis Section 1/ Unduplicated count of employed workers 2/ Alaska wage and salary earnings before training 3/ Postsecondary education at University of Alaska and as reported by the National Student Clearinghouse. Excludes vocational education program participants’ data.
89.2 86.7 88.2 84.489.2
84.0 85.0 83.5
FY 05FY 04
FY 03FY 02
0.0
20.0
40.0
60.0
80.0
100.0Before After
Percent Employed and Median Earnings forSTEP
Median Total EarningsMonths 7 to 12
Percentage of Participants EmployedMonths 7 to 12
95.8 93.7 94.7 92.095.2 91.6 92.6 92.1
FY 05FY 04
FY 03FY 02
0.0
20.0
40.0
60.0
80.0
100.0
120.0Before After
$28,041
$23,786
$23,504
$23,848
$36,116
$29,241
$28,594
$27,024
FY 05
FY 04
FY 03
FY 02
Before After
$12,465
$10,686
$11,386
$11,367
$17,609
$14,384
$13,763
$13,178
FY 05
FY 04
FY 03
FY 02
Before After
Percentage of Participants EmployedMonths 1 to 12
Median Total EarningsMonths 1 to 12
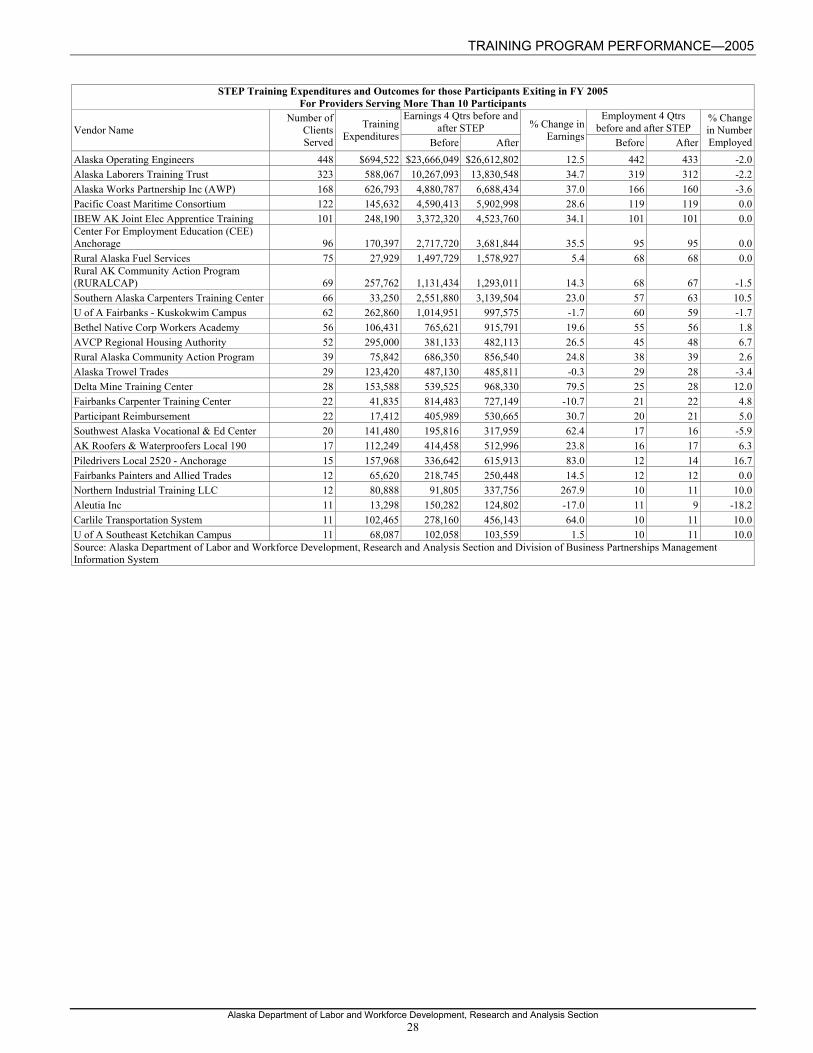
TRAINING PROGRAM PERFORMANCE—2005
Alaska Department of Labor and Workforce Development, Research and Analysis Section 28
STEP Training Expenditures and Outcomes for those Participants Exiting in FY 2005 For Providers Serving More Than 10 Participants
Earnings 4 Qtrs before and after STEP
Employment 4 Qtrs before and after STEP Vendor Name
Number of Clients Served
Training Expenditures Before After
% Change in Earnings Before After
% Change in Number Employed
Alaska Operating Engineers 448 $694,522 $23,666,049 $26,612,802 12.5 442 433 -2.0Alaska Laborers Training Trust 323 588,067 10,267,093 13,830,548 34.7 319 312 -2.2Alaska Works Partnership Inc (AWP) 168 626,793 4,880,787 6,688,434 37.0 166 160 -3.6Pacific Coast Maritime Consortium 122 145,632 4,590,413 5,902,998 28.6 119 119 0.0IBEW AK Joint Elec Apprentice Training 101 248,190 3,372,320 4,523,760 34.1 101 101 0.0Center For Employment Education (CEE) Anchorage 96 170,397 2,717,720 3,681,844 35.5 95 95 0.0Rural Alaska Fuel Services 75 27,929 1,497,729 1,578,927 5.4 68 68 0.0Rural AK Community Action Program (RURALCAP) 69 257,762 1,131,434 1,293,011 14.3 68 67 -1.5Southern Alaska Carpenters Training Center 66 33,250 2,551,880 3,139,504 23.0 57 63 10.5U of A Fairbanks - Kuskokwim Campus 62 262,860 1,014,951 997,575 -1.7 60 59 -1.7Bethel Native Corp Workers Academy 56 106,431 765,621 915,791 19.6 55 56 1.8AVCP Regional Housing Authority 52 295,000 381,133 482,113 26.5 45 48 6.7Rural Alaska Community Action Program 39 75,842 686,350 856,540 24.8 38 39 2.6Alaska Trowel Trades 29 123,420 487,130 485,811 -0.3 29 28 -3.4Delta Mine Training Center 28 153,588 539,525 968,330 79.5 25 28 12.0Fairbanks Carpenter Training Center 22 41,835 814,483 727,149 -10.7 21 22 4.8Participant Reimbursement 22 17,412 405,989 530,665 30.7 20 21 5.0Southwest Alaska Vocational & Ed Center 20 141,480 195,816 317,959 62.4 17 16 -5.9AK Roofers & Waterproofers Local 190 17 112,249 414,458 512,996 23.8 16 17 6.3Piledrivers Local 2520 - Anchorage 15 157,968 336,642 615,913 83.0 12 14 16.7Fairbanks Painters and Allied Trades 12 65,620 218,745 250,448 14.5 12 12 0.0Northern Industrial Training LLC 12 80,888 91,805 337,756 267.9 10 11 10.0Aleutia Inc 11 13,298 150,282 124,802 -17.0 11 9 -18.2Carlile Transportation System 11 102,465 278,160 456,143 64.0 10 11 10.0U of A Southeast Ketchikan Campus 11 68,087 102,058 103,559 1.5 10 11 10.0Source: Alaska Department of Labor and Workforce Development, Research and Analysis Section and Division of Business Partnerships Management Information System
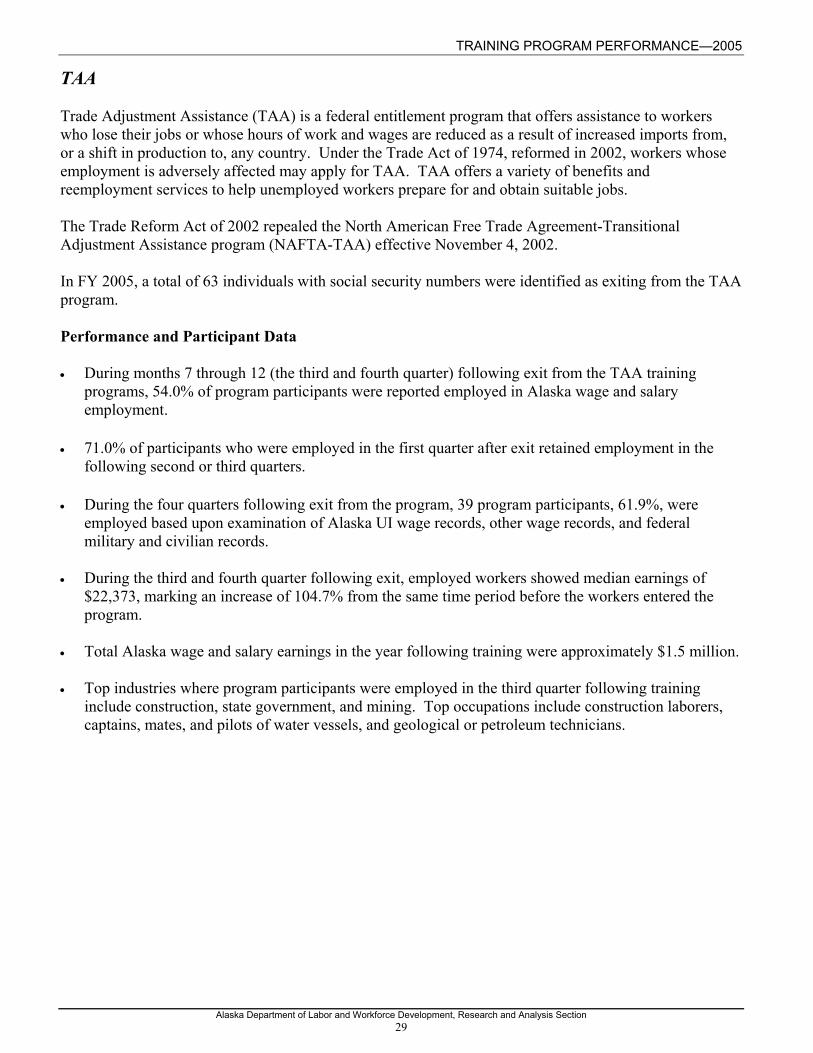
TRAINING PROGRAM PERFORMANCE—2005
Alaska Department of Labor and Workforce Development, Research and Analysis Section 29
TAA Trade Adjustment Assistance (TAA) is a federal entitlement program that offers assistance to workers who lose their jobs or whose hours of work and wages are reduced as a result of increased imports from, or a shift in production to, any country. Under the Trade Act of 1974, reformed in 2002, workers whose employment is adversely affected may apply for TAA. TAA offers a variety of benefits and reemployment services to help unemployed workers prepare for and obtain suitable jobs. The Trade Reform Act of 2002 repealed the North American Free Trade Agreement-Transitional Adjustment Assistance program (NAFTA-TAA) effective November 4, 2002. In FY 2005, a total of 63 individuals with social security numbers were identified as exiting from the TAA program. Performance and Participant Data • During months 7 through 12 (the third and fourth quarter) following exit from the TAA training
programs, 54.0% of program participants were reported employed in Alaska wage and salary employment.
• 71.0% of participants who were employed in the first quarter after exit retained employment in the
following second or third quarters. • During the four quarters following exit from the program, 39 program participants, 61.9%, were
employed based upon examination of Alaska UI wage records, other wage records, and federal military and civilian records.
• During the third and fourth quarter following exit, employed workers showed median earnings of
$22,373, marking an increase of 104.7% from the same time period before the workers entered the program.
• Total Alaska wage and salary earnings in the year following training were approximately $1.5 million. • Top industries where program participants were employed in the third quarter following training
include construction, state government, and mining. Top occupations include construction laborers, captains, mates, and pilots of water vessels, and geological or petroleum technicians.

TRAINING PROGRAM PERFORMANCE—2005
Alaska Department of Labor and Workforce Development, Research and Analysis Section 30
TAA
Training Program Performance Indicators For Participants Exiting in FY 2005
Months 1 to 12 After Training
Months 7 to 12 After Training
Total Training Participants 63 63
Percent with Alaska Wage and Salary Employment 61.9 54.0Median Total Earnings $29,950 $22,373Percent of Workers Employed in Related Occupations NA NANumber of: Alaska Wage and Salary Employed 39 34Department of Defense Employed 0 0Civilian Federal Government Employed 0 0Total number employed in Alaska or Federal Government 1/ 39 34Percent Employed in Alaska or Federal Government 1/ 61.9 54.0Total number of Alaska wage and salary quarters worked 124 60Total Alaska wage and salary earnings after training $1,476,115 $739,970Total Alaska wage and salary earnings before training 2/ $882,725 $466,509Percent change in total earnings after training 67.2 58.6Average earnings per quarter worked after training $11,904 $12,333Average earnings per quarter worked before training 2/ $7,295 $7,775Alaska 2006 Occupational License Holders 1 1Alaska 2006 Business License Holders 2 2Alaska 2006 PFD Applicants 49 49Unemployment Insurance Claimants 14 9Continuing Education In Alaska 3/ 16 16Continuing Education Outside Alaska 3/ 4 4Source: Alaska Department of Labor and Workforce Development, Research and Analysis Section 1/ Unduplicated count of employed workers 2/ Alaska wage and salary earnings before training 3/ Postsecondary education at University of Alaska and as reported by the National Student Clearinghouse. Excludes vocational education program participants’ data.
57.1
76.882.9
90.2
54.0 57.1
77.1
55.7
FY 05FY 04
FY 03FY 02
0.0
20.0
40.0
60.0
80.0
100.0Before After
Percent Employed and Median Earnings forTAA
Median Total EarningsMonths 7 to 12
Percentage of Participants EmployedMonths 7 to 12
66.776.8
82.9
96.7
61.957.1
77.1
59.0
FY 05FY 04
FY 03FY 02
0.0
20.0
40.0
60.0
80.0
100.0
120.0Before After
$16,464
$18,750
$39,861
$34,331
$29,950
$32,797
$11,967
$29,694
FY 05
FY 04
FY 03
FY 02
Before After
$10,931
$15,056
$27,000
$23,261
$22,373
$15,602
$8,390
$18,192
FY 05
FY 04
FY 03
FY 02
Before After
Percentage of Participants EmployedMonths 1 to 12
Median Total EarningsMonths 1 to 12
TRAINING PROGRAM PERFORMANCE—2005
Alaska Department of Labor and Workforce Development, Research and Analysis Section 31
Adults with Barriers Programs
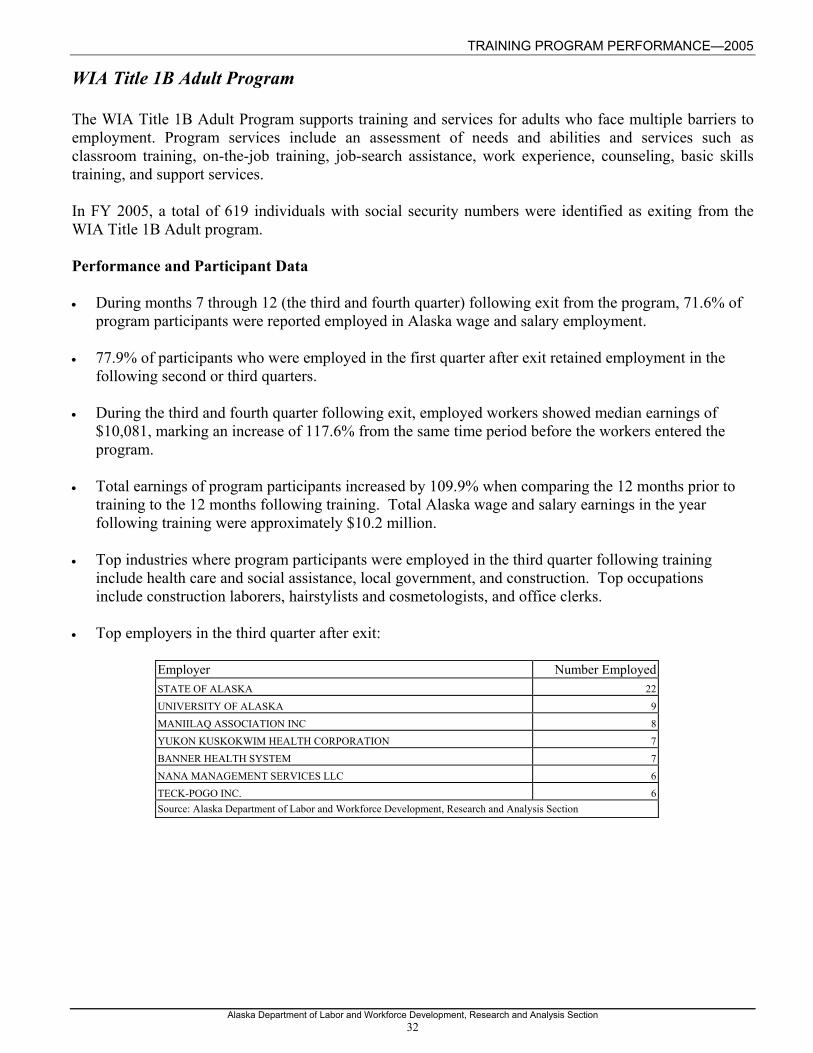
TRAINING PROGRAM PERFORMANCE—2005
Alaska Department of Labor and Workforce Development, Research and Analysis Section 32
WIA Title 1B Adult Program The WIA Title 1B Adult Program supports training and services for adults who face multiple barriers to employment. Program services include an assessment of needs and abilities and services such as classroom training, on-the-job training, job-search assistance, work experience, counseling, basic skills training, and support services. In FY 2005, a total of 619 individuals with social security numbers were identified as exiting from the WIA Title 1B Adult program. Performance and Participant Data • During months 7 through 12 (the third and fourth quarter) following exit from the program, 71.6% of
program participants were reported employed in Alaska wage and salary employment. • 77.9% of participants who were employed in the first quarter after exit retained employment in the
following second or third quarters. • During the third and fourth quarter following exit, employed workers showed median earnings of
$10,081, marking an increase of 117.6% from the same time period before the workers entered the program.
• Total earnings of program participants increased by 109.9% when comparing the 12 months prior to
training to the 12 months following training. Total Alaska wage and salary earnings in the year following training were approximately $10.2 million.
• Top industries where program participants were employed in the third quarter following training
include health care and social assistance, local government, and construction. Top occupations include construction laborers, hairstylists and cosmetologists, and office clerks.
• Top employers in the third quarter after exit:
Employer Number EmployedSTATE OF ALASKA 22
UNIVERSITY OF ALASKA 9MANIILAQ ASSOCIATION INC 8YUKON KUSKOKWIM HEALTH CORPORATION 7
BANNER HEALTH SYSTEM 7NANA MANAGEMENT SERVICES LLC 6TECK-POGO INC. 6Source: Alaska Department of Labor and Workforce Development, Research and Analysis Section
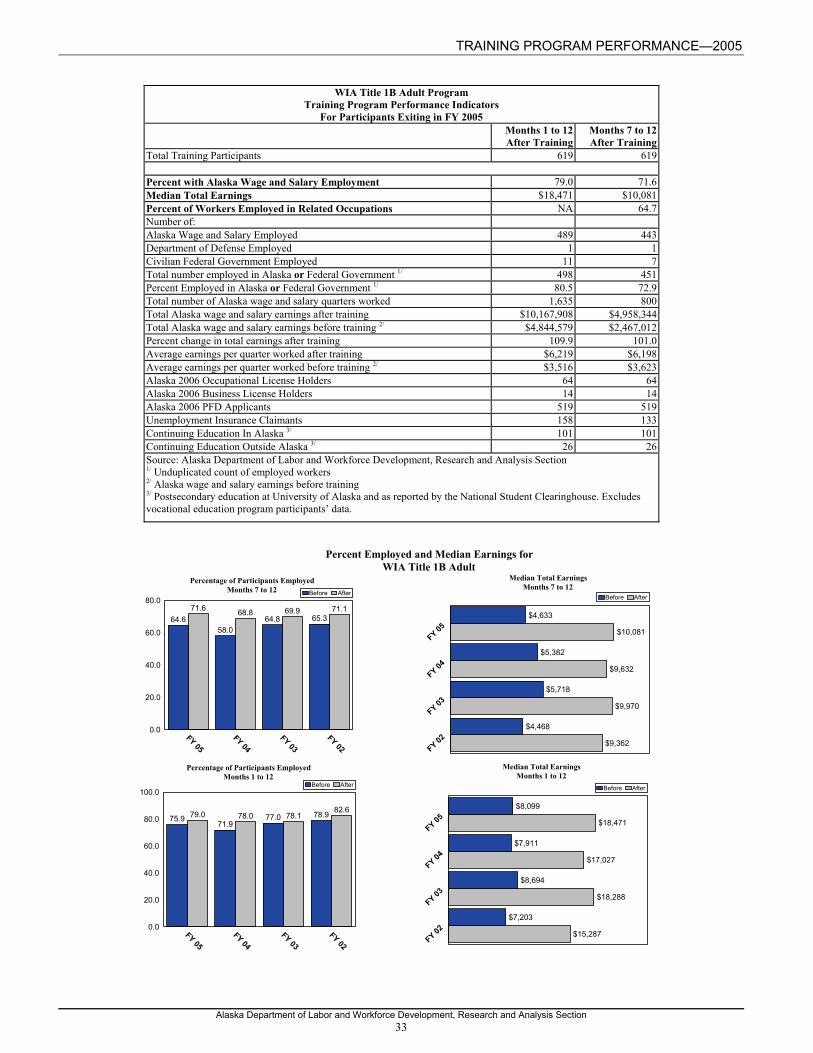
TRAINING PROGRAM PERFORMANCE—2005
Alaska Department of Labor and Workforce Development, Research and Analysis Section 33
WIA Title 1B Adult Program
Training Program Performance Indicators For Participants Exiting in FY 2005
Months 1 to 12 After Training
Months 7 to 12 After Training
Total Training Participants 619 619
Percent with Alaska Wage and Salary Employment 79.0 71.6Median Total Earnings $18,471 $10,081Percent of Workers Employed in Related Occupations NA 64.7Number of: Alaska Wage and Salary Employed 489 443Department of Defense Employed 1 1Civilian Federal Government Employed 11 7Total number employed in Alaska or Federal Government 1/ 498 451Percent Employed in Alaska or Federal Government 1/ 80.5 72.9Total number of Alaska wage and salary quarters worked 1,635 800Total Alaska wage and salary earnings after training $10,167,908 $4,958,344Total Alaska wage and salary earnings before training 2/ $4,844,579 $2,467,012Percent change in total earnings after training 109.9 101.0Average earnings per quarter worked after training $6,219 $6,198Average earnings per quarter worked before training 2/ $3,516 $3,623Alaska 2006 Occupational License Holders 64 64Alaska 2006 Business License Holders 14 14Alaska 2006 PFD Applicants 519 519Unemployment Insurance Claimants 158 133Continuing Education In Alaska 3/ 101 101Continuing Education Outside Alaska 3/ 26 26Source: Alaska Department of Labor and Workforce Development, Research and Analysis Section 1/ Unduplicated count of employed workers 2/ Alaska wage and salary earnings before training 3/ Postsecondary education at University of Alaska and as reported by the National Student Clearinghouse. Excludes vocational education program participants’ data.
64.658.0
64.8 65.371.6 68.8 69.9 71.1
FY 05FY 04
FY 03FY 02
0.0
20.0
40.0
60.0
80.0Before After
Percent Employed and Median Earnings forWIA Title 1B Adult
Median Total EarningsMonths 7 to 12
Percentage of Participants EmployedMonths 7 to 12
75.971.9
77.0 78.979.0 78.0 78.182.6
FY 05FY 04
FY 03FY 02
0.0
20.0
40.0
60.0
80.0
100.0Before After
$8,099
$7,911
$8,694
$7,203
$18,471
$17,027
$18,288
$15,287
FY 05
FY 04
FY 03
FY 02
Before After
$4,633
$5,382
$5,718
$4,468
$10,081
$9,632
$9,970
$9,362
FY 05
FY 04
FY 03
FY 02
Before After
Percentage of Participants EmployedMonths 1 to 12
Median Total EarningsMonths 1 to 12

TRAINING PROGRAM PERFORMANCE—2005
Alaska Department of Labor and Workforce Development, Research and Analysis Section 34
Work Search Work Search is a four-week program intended to help Alaska Temporary Assistance Program (ATAP) clients in their efforts to obtain and keep a job. It attempts to move clients into the workforce as quickly as possible. ATAP clients who are not exempt from participating in work activities participate in some form of Work Search. Work Search is designed to deliver services to clients in a group setting and to model the day-to-day requirements of a job. Work Search, as a stand-alone activity, also called Structured Work Search, is only available in communities with high concentrations of ATAP clients. Clients are required to attend for four weeks, five days a week, up to eight hours per day, unless a client finds a job before that time. In other areas of the state, Work Search activities are provided by contractors or grantees responsible for delivering Temporary Assistance Work Services. In any event, penalties are assessed by DPA (Department of Public Assistance) for clients who, without good cause, fail to attend Structured Work Search or to participate in work search activities assigned by their case manager. Work Search services include: a) an assessment of a client's skills, interests, aptitudes, and challenges to employment; b) workshops, lectures, and other activities to prepare clients to successfully find and keep employment; c) assisting clients to communicate with and support each other in their job seeking; d) actual job search by clients that is monitored by the Work Search provider; and e) the coaching, matching, and placement of clients into employment. In FY 2005, a total of 49 individuals with social security numbers were identified as exiting from the Work Search Program. Performance and Participant Data • During months 7 through 12 (the third and fourth quarter) following exit from the Work Search
program, 63.3% of program participants were reported employed in Alaska wage and salary employment.
• 51.6% of participants who were employed in the first quarter after exit retained employment in the
following second or third quarters. • During the third and fourth quarter following exit, employed workers showed median earnings of
$2,018, marking a decrease of 49.1% from the same time period before the workers entered the program.
• Total earnings of program participants increased by 35.8% when comparing the 12 months prior to
training to the 12 months following training. Total Alaska wage and salary earnings in the year following training were approximately $318,273.
• The dominant industries where program participants were employed in the third quarter following
training include retail trade, accommodation and food services, and health care and social assistance. Top occupations include retail sales, fast food workers, janitors, and cashiers.

TRAINING PROGRAM PERFORMANCE—2005
Alaska Department of Labor and Workforce Development, Research and Analysis Section 35
Work Search Training Program Performance Indicators
For Participants Exiting in FY 2005 Months 1 to 12 After Training
Months 7 to 12 After Training
Total Training Participants 49 49
Percent with Alaska Wage and Salary Employment 77.6 63.3Median Total Earnings $5,720 $2,018Percent of Workers Employed in Related Occupations NA NANumber of: Alaska Wage and Salary Employed 38 31Department of Defense Employed 0 0Civilian Federal Government Employed 0 0Total number employed in Alaska or Federal Government 1/ 38 31Percent Employed in Alaska or Federal Government 1/ 77.6 63.3Total number of Alaska wage and salary quarters worked 100 46Total Alaska wage and salary earnings after training $318,273 $129,479Total Alaska wage and salary earnings before training 2/ $234,425 $146,513Percent change in total earnings after training 35.8 -11.6Average earnings per quarter worked after training $3,183 $2,815Average earnings per quarter worked before training 2/ $3,005 $3,256Alaska 2006 Occupational License Holders 1 1Alaska 2006 Business License Holders 0 0Alaska 2006 PFD Applicants 41 41Unemployment Insurance Claimants 20 14Continuing Education In Alaska 3/ 4 4Continuing Education Outside Alaska 3/ 0 0Source: Alaska Department of Labor and Workforce Development, Research and Analysis Section 1/ Unduplicated count of employed workers 2/ Alaska wage and salary earnings before training 3/ Postsecondary education at University of Alaska and as reported by the National Student Clearinghouse. Excludes vocational education program participants’ data.
57.149.1 49.1 51.9
63.3 65.861.7
66.1
FY 05FY 04
FY 03FY 02
0.0
10.0
20.0
30.0
40.0
50.0
60.0
70.0
80.0Before After
Percent Employed and Median Earnings forWork Search
Median Total EarningsMonths 7 to 12
Percentage of Participants EmployedMonths 7 to 12
67.3 69.3 65.7 64.2
77.6 80.7 77.7 79.1
FY 05FY 04
FY 03FY 02
0.0
20.0
40.0
60.0
80.0
100.0Before After
$4,934
$4,143
$3,232
$4,020
$5,720
$7,947
$7,352
$7,483
FY 05
FY 04
FY 03
FY 02
Before After
$3,967
$3,456
$2,282
$2,892
$2,018
$5,130
$6,020
$4,533
FY 05
FY 04
FY 03
FY 02
Before After
Percentage of Participants EmployedMonths 1 to 12
Median Total EarningsMonths 1 to 12

TRAINING PROGRAM PERFORMANCE—2005
Alaska Department of Labor and Workforce Development, Research and Analysis Section 36
Youth Programs
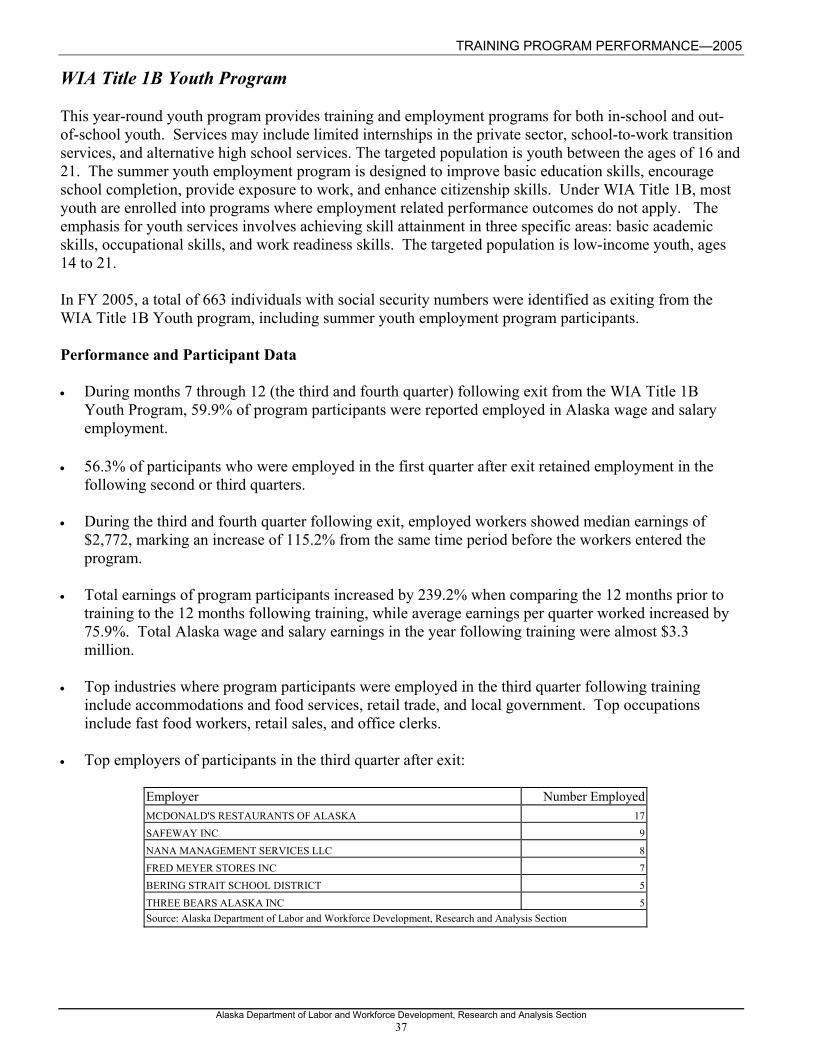
TRAINING PROGRAM PERFORMANCE—2005
Alaska Department of Labor and Workforce Development, Research and Analysis Section 37
WIA Title 1B Youth Program This year-round youth program provides training and employment programs for both in-school and out-of-school youth. Services may include limited internships in the private sector, school-to-work transition services, and alternative high school services. The targeted population is youth between the ages of 16 and 21. The summer youth employment program is designed to improve basic education skills, encourage school completion, provide exposure to work, and enhance citizenship skills. Under WIA Title 1B, most youth are enrolled into programs where employment related performance outcomes do not apply. The emphasis for youth services involves achieving skill attainment in three specific areas: basic academic skills, occupational skills, and work readiness skills. The targeted population is low-income youth, ages 14 to 21. In FY 2005, a total of 663 individuals with social security numbers were identified as exiting from the WIA Title 1B Youth program, including summer youth employment program participants. Performance and Participant Data • During months 7 through 12 (the third and fourth quarter) following exit from the WIA Title 1B
Youth Program, 59.9% of program participants were reported employed in Alaska wage and salary employment.
• 56.3% of participants who were employed in the first quarter after exit retained employment in the
following second or third quarters. • During the third and fourth quarter following exit, employed workers showed median earnings of
$2,772, marking an increase of 115.2% from the same time period before the workers entered the program.
• Total earnings of program participants increased by 239.2% when comparing the 12 months prior to
training to the 12 months following training, while average earnings per quarter worked increased by 75.9%. Total Alaska wage and salary earnings in the year following training were almost $3.3 million.
• Top industries where program participants were employed in the third quarter following training
include accommodations and food services, retail trade, and local government. Top occupations include fast food workers, retail sales, and office clerks.
• Top employers of participants in the third quarter after exit:
Employer Number Employed MCDONALD'S RESTAURANTS OF ALASKA 17 SAFEWAY INC 9
NANA MANAGEMENT SERVICES LLC 8 FRED MEYER STORES INC 7 BERING STRAIT SCHOOL DISTRICT 5
THREE BEARS ALASKA INC 5 Source: Alaska Department of Labor and Workforce Development, Research and Analysis Section
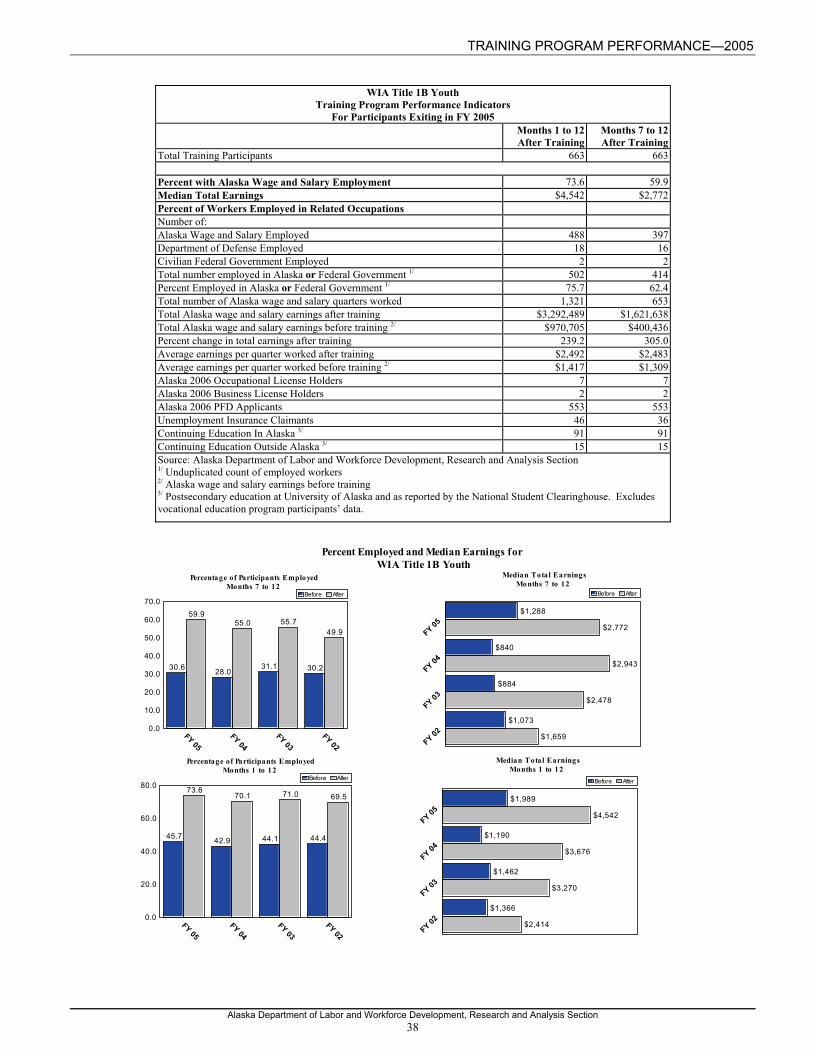
TRAINING PROGRAM PERFORMANCE—2005
Alaska Department of Labor and Workforce Development, Research and Analysis Section 38
WIA Title 1B Youth
Training Program Performance Indicators For Participants Exiting in FY 2005
Months 1 to 12 After Training
Months 7 to 12 After Training
Total Training Participants 663 663
Percent with Alaska Wage and Salary Employment 73.6 59.9Median Total Earnings $4,542 $2,772Percent of Workers Employed in Related Occupations Number of: Alaska Wage and Salary Employed 488 397Department of Defense Employed 18 16Civilian Federal Government Employed 2 2Total number employed in Alaska or Federal Government 1/ 502 414Percent Employed in Alaska or Federal Government 1/ 75.7 62.4Total number of Alaska wage and salary quarters worked 1,321 653Total Alaska wage and salary earnings after training $3,292,489 $1,621,638Total Alaska wage and salary earnings before training 2/ $970,705 $400,436Percent change in total earnings after training 239.2 305.0Average earnings per quarter worked after training $2,492 $2,483Average earnings per quarter worked before training 2/ $1,417 $1,309Alaska 2006 Occupational License Holders 7 7Alaska 2006 Business License Holders 2 2Alaska 2006 PFD Applicants 553 553Unemployment Insurance Claimants 46 36Continuing Education In Alaska 3/ 91 91Continuing Education Outside Alaska 3/ 15 15Source: Alaska Department of Labor and Workforce Development, Research and Analysis Section 1/ Unduplicated count of employed workers 2/ Alaska wage and salary earnings before training 3/ Postsecondary education at University of Alaska and as reported by the National Student Clearinghouse. Excludes vocational education program participants’ data.
30.6 28.031.1 30.2
59.955.0 55.7
49.9
FY 05FY 04
FY 03FY 02
0.0
10.0
20.0
30.0
40.0
50.0
60.0
70.0Before After
Percent Employed and Median Earnings forWIA Title 1B Youth
Median Total EarningsMonths 7 to 12
Percentage of Participants EmployedMonths 7 to 12
45.7 42.9 44.1 44.4
73.670.1 71.0 69.5
FY 05FY 04
FY 03FY 02
0.0
20.0
40.0
60.0
80.0Before After
$1,989
$1,190
$1,462
$1,366
$4,542
$3,676
$3,270
$2,414
FY 05
FY 04
FY 03
FY 02
Before After
$1,288
$840
$884
$1,073
$2,772
$2,943
$2,478
$1,659
FY 05
FY 04
FY 03
FY 02
Before After
Percentage of Participants EmployedMonths 1 to 12
Median Total EarningsMonths 1 to 12
TRAINING PROGRAM PERFORMANCE—2005
Alaska Department of Labor and Workforce Development, Research and Analysis Section 39
Other Programs
TRAINING PROGRAM PERFORMANCE—2005
Alaska Department of Labor and Workforce Development, Research and Analysis Section 40
Vocational & Technical Education Programs Supported by Carl Perkins Funding
The purpose of the Carl Perkins Vocational & Technical Education Act of 1998 (Perkins III) is to develop more fully the academic, vocational, and technical skills of all secondary students and postsecondary students who elect to enroll in vocational and technical education programs, by:
(1) building on the efforts of states and localities to develop challenging academic standards;
(2) promoting the development of services and activities that integrate academic, vocational, and technical instruction, and that link secondary and postsecondary education for participating vocational and technical education students;
(3) increasing state and local flexibility in providing services and activities designed to develop, implement, and improve vocational and technical education, including Tech Prep education; and
(4) disseminating national research, and providing professional development and technical assistance, that will improve vocational and technical education programs, services, and activities.
In order to receive funds, education agencies must have prepared a local plan for vocational and technical education plus an annual funding application and annual performance report. In FY 2005, fifty-three school districts, three postsecondary institutions and one statewide Tech Prep consortium participated in the funding programs. The major state program improvement efforts during FY 2005 were improving local curriculum to reflect state academic and national skill standards, maintaining a data reporting system to meet the accountability requirements, and providing quality professional development opportunities for local teachers. In FY 2005, Alaska received $365,746 in Tech-Prep funds. Alaska also received $4,214,921 in Perkins’ Basic Grant funds, a figure that has remained constant over the past 14 years.
Perkins funds are intended to improve existing career & technical education (CTE) programs or develop new elements, therefore data is required on the results of the entire vocational & technical program provided by the school district or postsecondary institution, not just the components that benefit from Perkins funding. The district or institution is given the flexibility to target the federal Perkins funds to any portion of this program that needs improvement or expansion. The Perkins statute requires data reporting about “participants” – students who enroll in one or more vocational and technical courses, “concentrators” – students who demonstrate commitment to a specific vocational & technical program, and “completers” – students who successfully finish the program that is available at the school or institution.
The Alaska Department of Education & Early Development (EED) and the Alaska Department of Labor and Workforce Development have worked cooperatively to obtain performance outcome statistics for both secondary and postsecondary vocational and technical program exiters. Postsecondary Perkins programs are managed by the Alaska Workforce Investment Board office within the Department of Labor. Participants exiting those programs have been tracked through data provided to EED and to the Department of Labor by the University of Alaska and the Alaska Vocational Technical Education Center. The EED manages secondary programs and data collection. The majority of school districts forwarded completer data to the Department of Labor’s Research and Analysis Section for follow-up information using unemployment insurance records and enrollment records from the University of Alaska.
TRAINING PROGRAM PERFORMANCE—2005
Alaska Department of Labor and Workforce Development, Research and Analysis Section 41
Carl Perkins – Postsecondary and Tech-Prep Postsecondary Background Alaska’s Perkins funding for Vocational and Technical Education grants is divided based on a ratio of 85% for secondary schools and 15% for postsecondary institutions. The allocation resulted in $483,662 available for grants to postsecondary institutions for FY 2005. This money was distributed via competitive grants to three places: (1) AVTEC, (2) Kachemak Bay Campus of the Kenai Peninsula College of the University of Alaska Anchorage, and (3) Sitka Campus of the University of Alaska Southeast. The Perkins Tech Prep competitive grant, which in FY 2005 totaled $345,000, was awarded to a new organization, the Alaska Tech Prep Consortium. It is made up of a number of school districts throughout the state, campuses of the University of Alaska, technical schools including AVTEC and several regional learning centers, and representatives of industry and labor. The fiscal agent is the University of Alaska Anchorage. Postsecondary Data – What is Being Counted Perkins funding is significant for the institutions that receive it, for the programs that it improves, and for the leveraging that occurs because of those efforts. It is worth realizing, however, that the vast majority of postsecondary career and technical education programs within the state, which are included in this section of the report, receive no direct Perkins funding. This report includes data on students taking courses in all vocational education programs of the entire University of Alaska system and in all AVTEC programs of at least 80 contact hours. They are counted without regard as to whether or not the campus they are attending, or the program they are taking, receives any Perkins funding. This report counts as participants those whom the Perkins federal program calls “concentrators.” The Perkins state definition for concentrator is:
A participant who has been admitted into a certificate or degree program, or has completed at least twelve vocational credit hours of the course/program of study toward a certificate or associate degree, or has completed all coursework for an industry recognized credential (not awarded by the postsecondary institution), as established by the postsecondary institution.
Unfortunately, the University system currently cannot track students completing coursework for which a credential can be earned. (“Credential,” often awarded for meeting the requirements of an industry or a professional association, here is distinguished from a two-year or four-year degree or a one year certificate. An example is a Cisco CCNP certification.) Therefore, as an approximation, UA career and technical education students who have earned 9 total credits during the reporting year are counted as concentrators, and these, along with AVTEC students who meet the above definition, are included in this report’s postsecondary section.
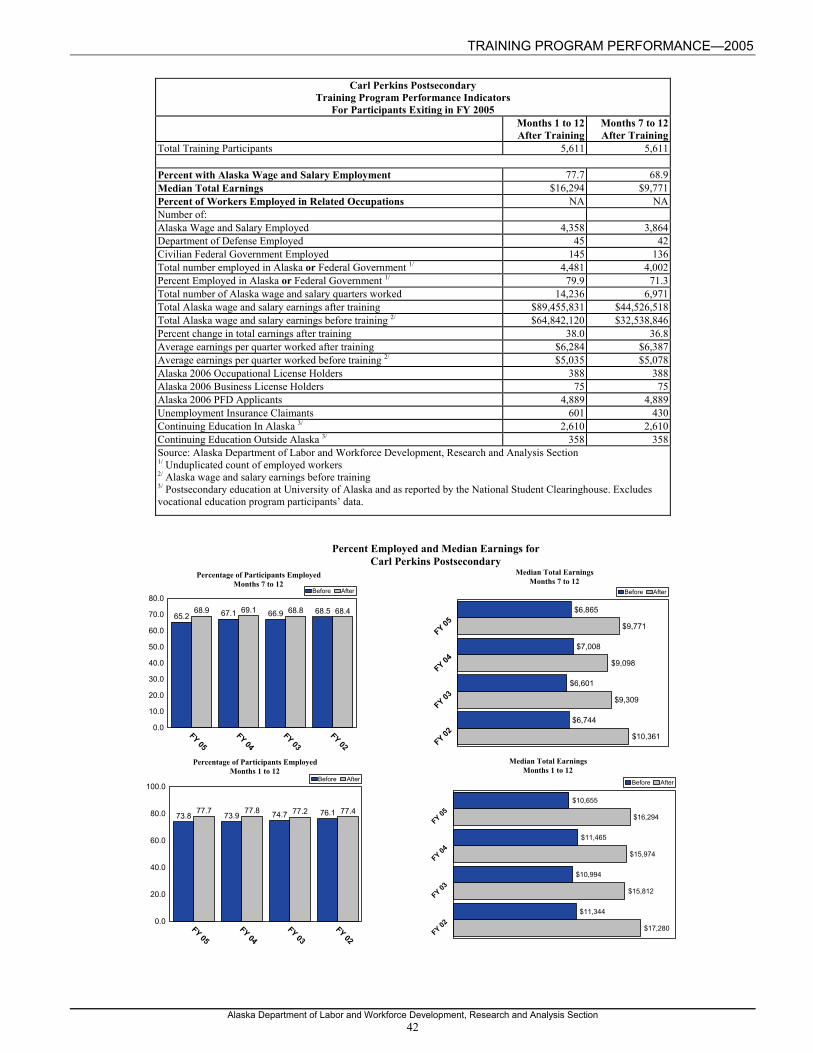
TRAINING PROGRAM PERFORMANCE—2005
Alaska Department of Labor and Workforce Development, Research and Analysis Section 42
Carl Perkins Postsecondary
Training Program Performance Indicators For Participants Exiting in FY 2005
Months 1 to 12 After Training
Months 7 to 12 After Training
Total Training Participants 5,611 5,611
Percent with Alaska Wage and Salary Employment 77.7 68.9Median Total Earnings $16,294 $9,771Percent of Workers Employed in Related Occupations NA NANumber of: Alaska Wage and Salary Employed 4,358 3,864Department of Defense Employed 45 42Civilian Federal Government Employed 145 136Total number employed in Alaska or Federal Government 1/ 4,481 4,002Percent Employed in Alaska or Federal Government 1/ 79.9 71.3Total number of Alaska wage and salary quarters worked 14,236 6,971Total Alaska wage and salary earnings after training $89,455,831 $44,526,518Total Alaska wage and salary earnings before training 2/ $64,842,120 $32,538,846Percent change in total earnings after training 38.0 36.8Average earnings per quarter worked after training $6,284 $6,387Average earnings per quarter worked before training 2/ $5,035 $5,078Alaska 2006 Occupational License Holders 388 388Alaska 2006 Business License Holders 75 75Alaska 2006 PFD Applicants 4,889 4,889Unemployment Insurance Claimants 601 430Continuing Education In Alaska 3/ 2,610 2,610Continuing Education Outside Alaska 3/ 358 358Source: Alaska Department of Labor and Workforce Development, Research and Analysis Section 1/ Unduplicated count of employed workers 2/ Alaska wage and salary earnings before training 3/ Postsecondary education at University of Alaska and as reported by the National Student Clearinghouse. Excludes vocational education program participants’ data.
65.2 67.1 66.9 68.568.9 69.1 68.8 68.4
FY 05FY 04
FY 03FY 02
0.0
10.0
20.0
30.0
40.0
50.0
60.0
70.0
80.0Before After
Percent Employed and Median Earnings forCarl Perkins Postsecondary
Median Total EarningsMonths 7 to 12
Percentage of Participants EmployedMonths 7 to 12
73.8 73.9 74.7 76.177.7 77.8 77.2 77.4
FY 05FY 04
FY 03FY 02
0.0
20.0
40.0
60.0
80.0
100.0Before After
$10,655
$11,465
$10,994
$11,344
$16,294
$15,974
$15,812
$17,280
FY 05
FY 04
FY 03
FY 02
Before After
$6,865
$7,008
$6,601
$6,744
$9,771
$9,098
$9,309
$10,361
FY 05
FY 04
FY 03
FY 02
Before After
Percentage of Participants EmployedMonths 1 to 12
Median Total EarningsMonths 1 to 12

TRAINING PROGRAM PERFORMANCE—2005
Alaska Department of Labor and Workforce Development, Research and Analysis Section 43
Carl Perkins – Secondary Secondary Program Background In FY 2005, 18,184 secondary students in 50 Alaska school districts participated in a program within one of sixteen career clusters identified by the U.S. Department of Education. The most popular cluster at the secondary level was Business & Administrative Services, followed by Construction, Human Services, Manufacturing, Transportation, Arts & Communication, Hospitality, Scientific & Technical, IT Services, and Health Services. All local school district programs continued to examine and revise their vocational curriculum to assure its alignment with industry based occupation standards as well as the state’s performance standards for reading, writing and math and other state academic, employability and cultural standards.
Secondary Data – What is Being Counted Secondary data reporting for the federal Perkins statute requires different definitions from those used for this report. Perkins data reporting collects information about three different levels of involvement: “participants” – students who enroll in one or more vocational and technical courses, “concentrators” – students who enroll in two or more courses within a specific vocational & technical program, and “completers” – students who successfully finish the program available at their school or institution.
Secondary program completer student data from Alaska school districts was matched with Alaska UI wage records and other administrative data to determine if students are employed, in the military or continuing their education. A follow-up of secondary students who graduated or dropped out in the 2004-2005 school year found that more than 81% of those students were employed or continued their education within or outside Alaska during the seven to 12 months after exit from the program (January to June 2006).
The following tables and charts report follow-up employment information for 2,121 vocational program “completers” who exited the secondary school system during or following the 2004-2005 school year.
• During months seven through 12 (the third and fourth quarter) following exit from an Alaskan school, 67.5% of program participants were reported employed in Alaska wage and salary employment. An additional 55 participants were identified from other state or federal government employment records. This is an unduplicated count of employment records; students identified in Alaska wage and salary records are not counted again if they are identified in out-of-state employment records.
• Top industries where program participants were employed in the third quarter following training were retail trade, accommodation and food service, and construction. Top occupations include retail sales, cashiers, and fast food workers.
• Top employers of participants in the third quarter after exit:
Employer Number Employed FRED MEYER STORES INC 35
WAL-MART ASSOCIATES INC 32 SAFEWAY INC 22 FEDERAL EXPRESS CORP 19
UNIVERSITY OF ALASKA 15 Source: Alaska Department of Labor and Workforce Development, Research and Analysis Section
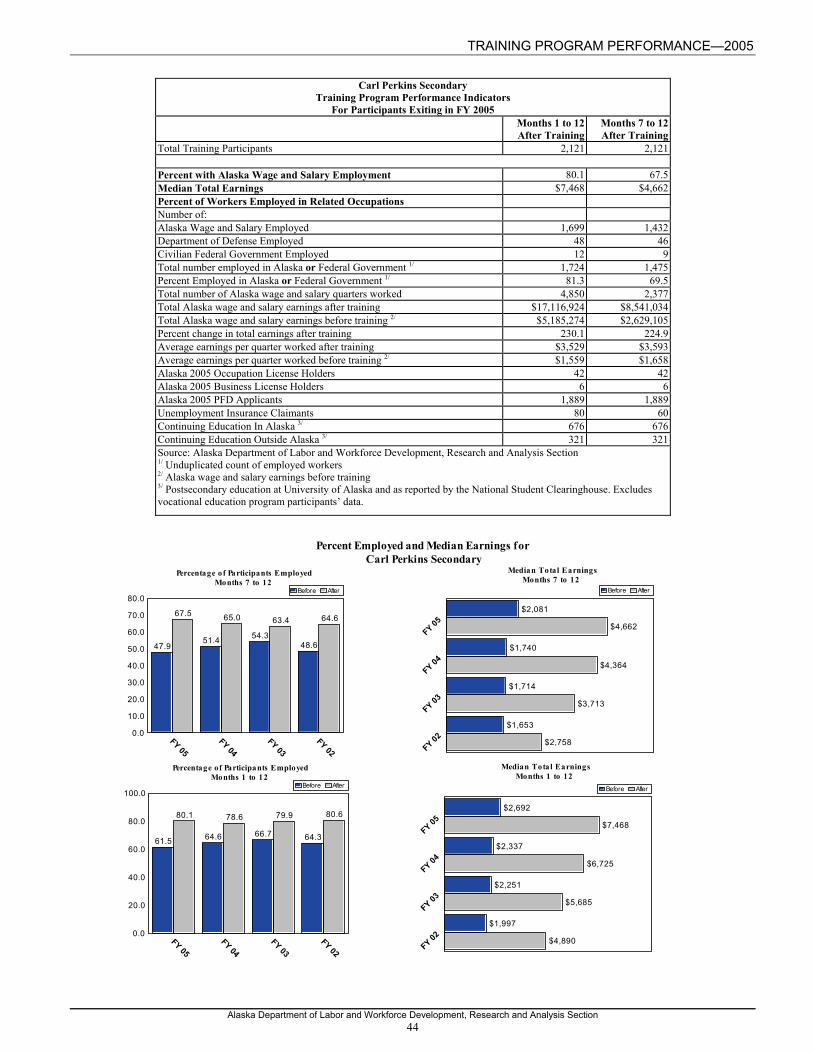
TRAINING PROGRAM PERFORMANCE—2005
Alaska Department of Labor and Workforce Development, Research and Analysis Section 44
Carl Perkins Secondary
Training Program Performance Indicators For Participants Exiting in FY 2005
Months 1 to 12 After Training
Months 7 to 12 After Training
Total Training Participants 2,121 2,121
Percent with Alaska Wage and Salary Employment 80.1 67.5Median Total Earnings $7,468 $4,662Percent of Workers Employed in Related Occupations Number of: Alaska Wage and Salary Employed 1,699 1,432Department of Defense Employed 48 46Civilian Federal Government Employed 12 9Total number employed in Alaska or Federal Government 1/ 1,724 1,475Percent Employed in Alaska or Federal Government 1/ 81.3 69.5Total number of Alaska wage and salary quarters worked 4,850 2,377Total Alaska wage and salary earnings after training $17,116,924 $8,541,034Total Alaska wage and salary earnings before training 2/ $5,185,274 $2,629,105Percent change in total earnings after training 230.1 224.9Average earnings per quarter worked after training $3,529 $3,593Average earnings per quarter worked before training 2/ $1,559 $1,658Alaska 2005 Occupation License Holders 42 42Alaska 2005 Business License Holders 6 6Alaska 2005 PFD Applicants 1,889 1,889Unemployment Insurance Claimants 80 60Continuing Education In Alaska 3/ 676 676Continuing Education Outside Alaska 3/ 321 321Source: Alaska Department of Labor and Workforce Development, Research and Analysis Section 1/ Unduplicated count of employed workers 2/ Alaska wage and salary earnings before training 3/ Postsecondary education at University of Alaska and as reported by the National Student Clearinghouse. Excludes vocational education program participants’ data.
47.951.4 54.3
48.6
67.5 65.0 63.4 64.6
FY 05FY 04
FY 03FY 02
0.0
10.0
20.0
30.0
40.0
50.0
60.0
70.0
80.0Before After
Percent Employed and Median Earnings forCarl Perkins Secondary
Median Total EarningsMonths 7 to 12
Percentage of Participants EmployedMonths 7 to 12
61.5 64.6 66.7 64.3
80.1 78.6 79.9 80.6
FY 05FY 04
FY 03FY 02
0.0
20.0
40.0
60.0
80.0
100.0Before After
$2,692
$2,337
$2,251
$1,997
$7,468
$6,725
$5,685
$4,890
FY 05
FY 04
FY 03
FY 02
Before After
$2,081
$1,740
$1,714
$1,653
$4,662
$4,364
$3,713
$2,758
FY 05
FY 04
FY 03
FY 02
Before After
Percentage of Participants EmployedMonths 1 to 12
Median Total EarningsMonths 1 to 12
TRAINING PROGRAM PERFORMANCE—2005
Alaska Department of Labor and Workforce Development, Research and Analysis Section 45
Adult Basic Education The purpose of the Adult Basic Education (ABE) Program is to prepare Alaskans for employment by providing instruction in the basic skills of reading, writing, mathematics, and General Educational Development (GED) preparation and testing. Emphasis is given to integrating practical life skills and workplace readiness skills into instruction. Adult students also receive instruction in speaking, reading, and writing English as a Second Language (ESL), with an emphasis on civics education and the language competency needed for most entry-level positions. In addition, the State ABE Program manages the GED testing program in Alaska. GED test administration occurs in 26 GED Testing Centers located statewide and GED transcript requests are filled for graduates seeking employment, entrance into the military, and/or entry into post-secondary education. The ABE program funds 13 regional ABE programs, four Volunteer Literacy programs, and one state-wide English Literacy grant. In addition, a small grant is let to State of Alaska Department of Corrections for ABE services. Collectively, these programs provide the following ABE activities: • Instruction in the basic skills of reading, writing, and mathematics • Instruction to take the General Educational Development (GED) tests • Basic skills study through preparation for citizenship testing • English as a Second Language instruction • Workplace Literacy • Family Literacy (in conjunction with state Even Start Family Literacy programs)
All ABE programs are required to provide instruction in basic academic skills and GED preparation. English Literacy may be provided according to the needs of the local community. Other program activities are encouraged if funding permits. ABE programs also: • Assist adult learners with learning about supportive services such as transportation, child care
resources, and job skills such as resume writing and interviewing; • Assist adult learners in transitioning from adult basic education into jobs, higher education, or
vocational training; • Provide tutoring for adult learners with learning disabilities; • Provide pre- and post-assessments to determine the grade level equivalency of adult learners; • Work with employers to develop workplace literacy training activities; and • Assist each adult learner in reaching a higher level of self-sufficiency as an individual, family
member, and community member. Performance and Participant Data The performance measures for Adult Basic Education programs include adult learners who show measurable gains in completing an educational level, passing the GED tests, attaining or advancing in a job, or transitioning into higher education or vocational training. • The number of FY 2005 ABE participants who were unemployed upon entry into the ABE program
having claimed a main or secondary goal of obtaining employment and who exited during the program year was 715.
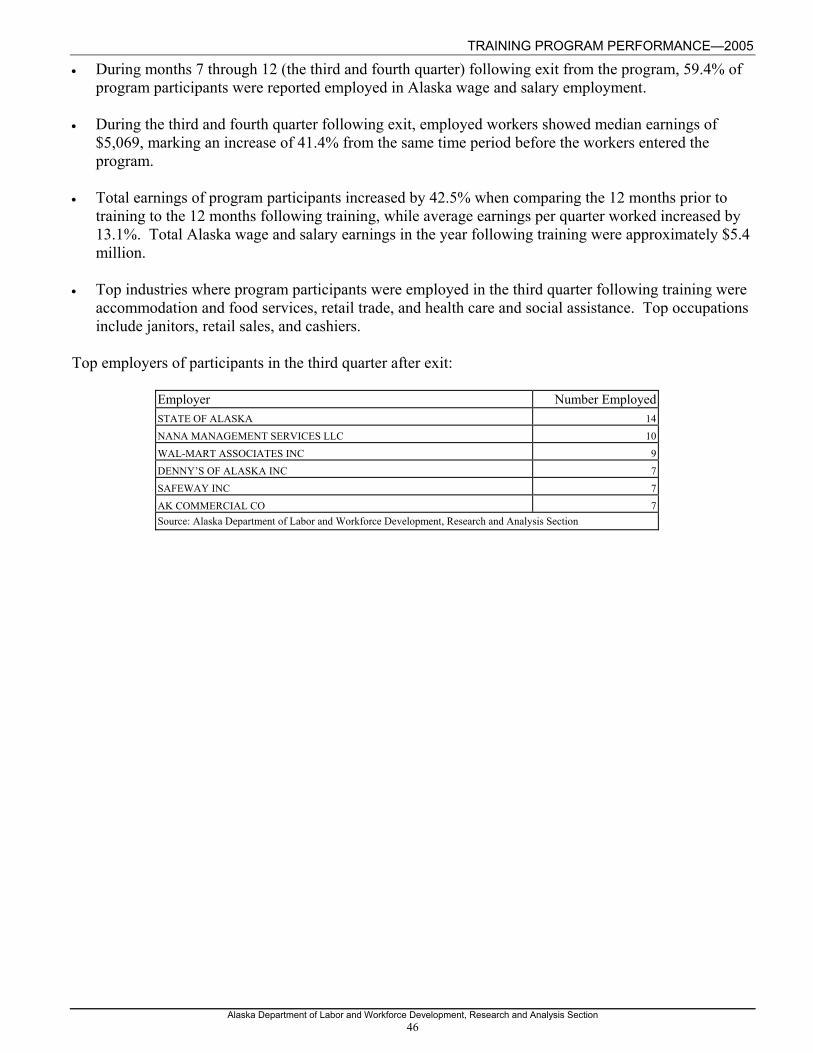
TRAINING PROGRAM PERFORMANCE—2005
Alaska Department of Labor and Workforce Development, Research and Analysis Section 46
• During months 7 through 12 (the third and fourth quarter) following exit from the program, 59.4% of program participants were reported employed in Alaska wage and salary employment.
• During the third and fourth quarter following exit, employed workers showed median earnings of
$5,069, marking an increase of 41.4% from the same time period before the workers entered the program.
• Total earnings of program participants increased by 42.5% when comparing the 12 months prior to
training to the 12 months following training, while average earnings per quarter worked increased by 13.1%. Total Alaska wage and salary earnings in the year following training were approximately $5.4 million.
• Top industries where program participants were employed in the third quarter following training were
accommodation and food services, retail trade, and health care and social assistance. Top occupations include janitors, retail sales, and cashiers.
Top employers of participants in the third quarter after exit:
Employer Number EmployedSTATE OF ALASKA 14NANA MANAGEMENT SERVICES LLC 10
WAL-MART ASSOCIATES INC 9DENNY’S OF ALASKA INC 7SAFEWAY INC 7
AK COMMERCIAL CO 7Source: Alaska Department of Labor and Workforce Development, Research and Analysis Section
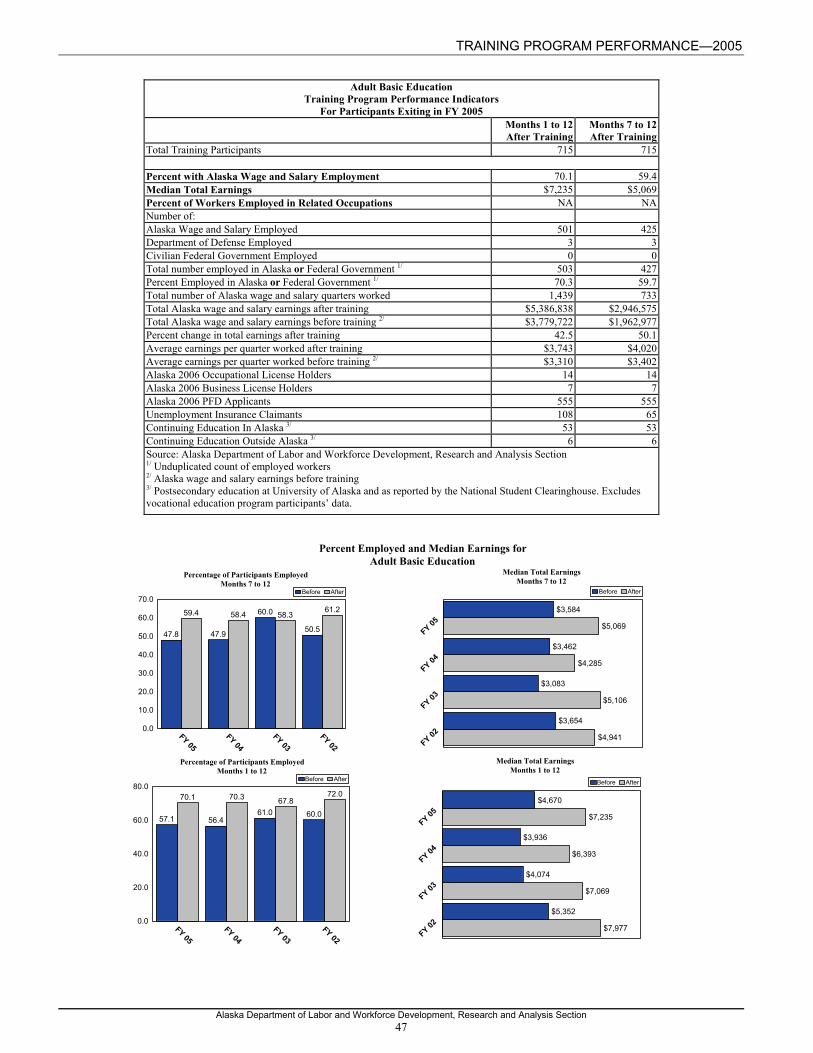
TRAINING PROGRAM PERFORMANCE—2005
Alaska Department of Labor and Workforce Development, Research and Analysis Section 47
Adult Basic Education
Training Program Performance Indicators For Participants Exiting in FY 2005
Months 1 to 12 After Training
Months 7 to 12 After Training
Total Training Participants 715 715
Percent with Alaska Wage and Salary Employment 70.1 59.4Median Total Earnings $7,235 $5,069Percent of Workers Employed in Related Occupations NA NANumber of: Alaska Wage and Salary Employed 501 425Department of Defense Employed 3 3Civilian Federal Government Employed 0 0Total number employed in Alaska or Federal Government 1/ 503 427Percent Employed in Alaska or Federal Government 1/ 70.3 59.7Total number of Alaska wage and salary quarters worked 1,439 733Total Alaska wage and salary earnings after training $5,386,838 $2,946,575Total Alaska wage and salary earnings before training 2/ $3,779,722 $1,962,977Percent change in total earnings after training 42.5 50.1Average earnings per quarter worked after training $3,743 $4,020Average earnings per quarter worked before training 2/ $3,310 $3,402Alaska 2006 Occupational License Holders 14 14Alaska 2006 Business License Holders 7 7Alaska 2006 PFD Applicants 555 555Unemployment Insurance Claimants 108 65Continuing Education In Alaska 3/ 53 53Continuing Education Outside Alaska 3/ 6 6Source: Alaska Department of Labor and Workforce Development, Research and Analysis Section 1/ Unduplicated count of employed workers 2/ Alaska wage and salary earnings before training 3/ Postsecondary education at University of Alaska and as reported by the National Student Clearinghouse. Excludes vocational education program participants’ data.
47.8 47.9
60.0
50.5
59.4 58.4 58.361.2
FY 05FY 04
FY 03FY 02
0.0
10.0
20.0
30.0
40.0
50.0
60.0
70.0Before After
Percent Employed and Median Earnings forAdult Basic Education
Median Total EarningsMonths 7 to 12
Percentage of Participants EmployedMonths 7 to 12
57.1 56.461.0 60.0
70.1 70.3 67.872.0
FY 05FY 04
FY 03FY 02
0.0
20.0
40.0
60.0
80.0Before After
$4,670
$3,936
$4,074
$5,352
$7,235
$6,393
$7,069
$7,977
FY 05
FY 04
FY 03
FY 02
Before After
$3,584
$3,462
$3,083
$3,654
$5,069
$4,285
$5,106
$4,941
FY 05
FY 04
FY 03
FY 02
Before After
Percentage of Participants EmployedMonths 1 to 12
Median Total EarningsMonths 1 to 12
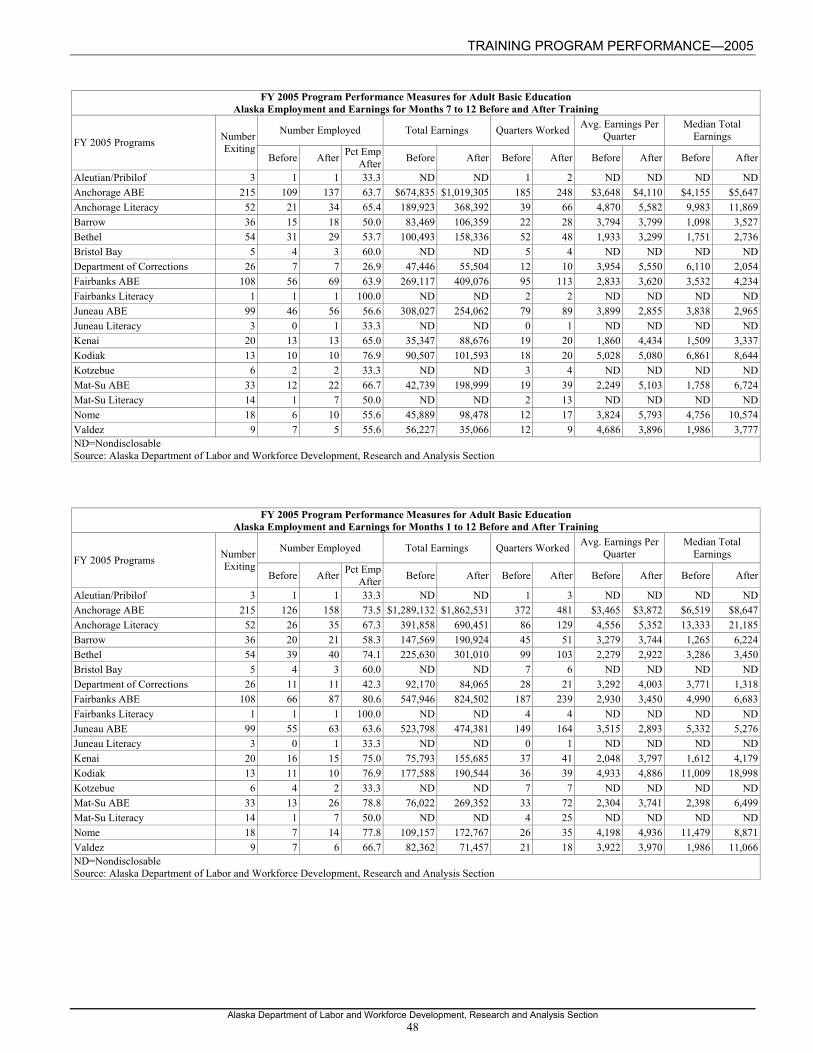
TRAINING PROGRAM PERFORMANCE—2005
Alaska Department of Labor and Workforce Development, Research and Analysis Section 48
FY 2005 Program Performance Measures for Adult Basic Education Alaska Employment and Earnings for Months 7 to 12 Before and After Training
Number Employed Total Earnings Quarters Worked Avg. Earnings Per Quarter
Median Total Earnings FY 2005 Programs Number
Exiting Before After Pct Emp
After Before After Before After Before After Before After
Aleutian/Pribilof 3 1 1 33.3 ND ND 1 2 ND ND ND NDAnchorage ABE 215 109 137 63.7 $674,835 $1,019,305 185 248 $3,648 $4,110 $4,155 $5,647Anchorage Literacy 52 21 34 65.4 189,923 368,392 39 66 4,870 5,582 9,983 11,869Barrow 36 15 18 50.0 83,469 106,359 22 28 3,794 3,799 1,098 3,527Bethel 54 31 29 53.7 100,493 158,336 52 48 1,933 3,299 1,751 2,736Bristol Bay 5 4 3 60.0 ND ND 5 4 ND ND ND NDDepartment of Corrections 26 7 7 26.9 47,446 55,504 12 10 3,954 5,550 6,110 2,054Fairbanks ABE 108 56 69 63.9 269,117 409,076 95 113 2,833 3,620 3,532 4,234Fairbanks Literacy 1 1 1 100.0 ND ND 2 2 ND ND ND NDJuneau ABE 99 46 56 56.6 308,027 254,062 79 89 3,899 2,855 3,838 2,965Juneau Literacy 3 0 1 33.3 ND ND 0 1 ND ND ND NDKenai 20 13 13 65.0 35,347 88,676 19 20 1,860 4,434 1,509 3,337Kodiak 13 10 10 76.9 90,507 101,593 18 20 5,028 5,080 6,861 8,644Kotzebue 6 2 2 33.3 ND ND 3 4 ND ND ND NDMat-Su ABE 33 12 22 66.7 42,739 198,999 19 39 2,249 5,103 1,758 6,724Mat-Su Literacy 14 1 7 50.0 ND ND 2 13 ND ND ND NDNome 18 6 10 55.6 45,889 98,478 12 17 3,824 5,793 4,756 10,574Valdez 9 7 5 55.6 56,227 35,066 12 9 4,686 3,896 1,986 3,777ND=Nondisclosable Source: Alaska Department of Labor and Workforce Development, Research and Analysis Section
FY 2005 Program Performance Measures for Adult Basic Education Alaska Employment and Earnings for Months 1 to 12 Before and After Training
Number Employed Total Earnings Quarters Worked Avg. Earnings Per Quarter
Median Total Earnings FY 2005 Programs Number
Exiting Before After Pct Emp
After Before After Before After Before After Before After
Aleutian/Pribilof 3 1 1 33.3 ND ND 1 3 ND ND ND NDAnchorage ABE 215 126 158 73.5 $1,289,132 $1,862,531 372 481 $3,465 $3,872 $6,519 $8,647Anchorage Literacy 52 26 35 67.3 391,858 690,451 86 129 4,556 5,352 13,333 21,185Barrow 36 20 21 58.3 147,569 190,924 45 51 3,279 3,744 1,265 6,224Bethel 54 39 40 74.1 225,630 301,010 99 103 2,279 2,922 3,286 3,450Bristol Bay 5 4 3 60.0 ND ND 7 6 ND ND ND NDDepartment of Corrections 26 11 11 42.3 92,170 84,065 28 21 3,292 4,003 3,771 1,318Fairbanks ABE 108 66 87 80.6 547,946 824,502 187 239 2,930 3,450 4,990 6,683Fairbanks Literacy 1 1 1 100.0 ND ND 4 4 ND ND ND NDJuneau ABE 99 55 63 63.6 523,798 474,381 149 164 3,515 2,893 5,332 5,276Juneau Literacy 3 0 1 33.3 ND ND 0 1 ND ND ND NDKenai 20 16 15 75.0 75,793 155,685 37 41 2,048 3,797 1,612 4,179Kodiak 13 11 10 76.9 177,588 190,544 36 39 4,933 4,886 11,009 18,998Kotzebue 6 4 2 33.3 ND ND 7 7 ND ND ND NDMat-Su ABE 33 13 26 78.8 76,022 269,352 33 72 2,304 3,741 2,398 6,499Mat-Su Literacy 14 1 7 50.0 ND ND 4 25 ND ND ND NDNome 18 7 14 77.8 109,157 172,767 26 35 4,198 4,936 11,479 8,871Valdez 9 7 6 66.7 82,362 71,457 21 18 3,922 3,970 1,986 11,066ND=Nondisclosable Source: Alaska Department of Labor and Workforce Development, Research and Analysis Section
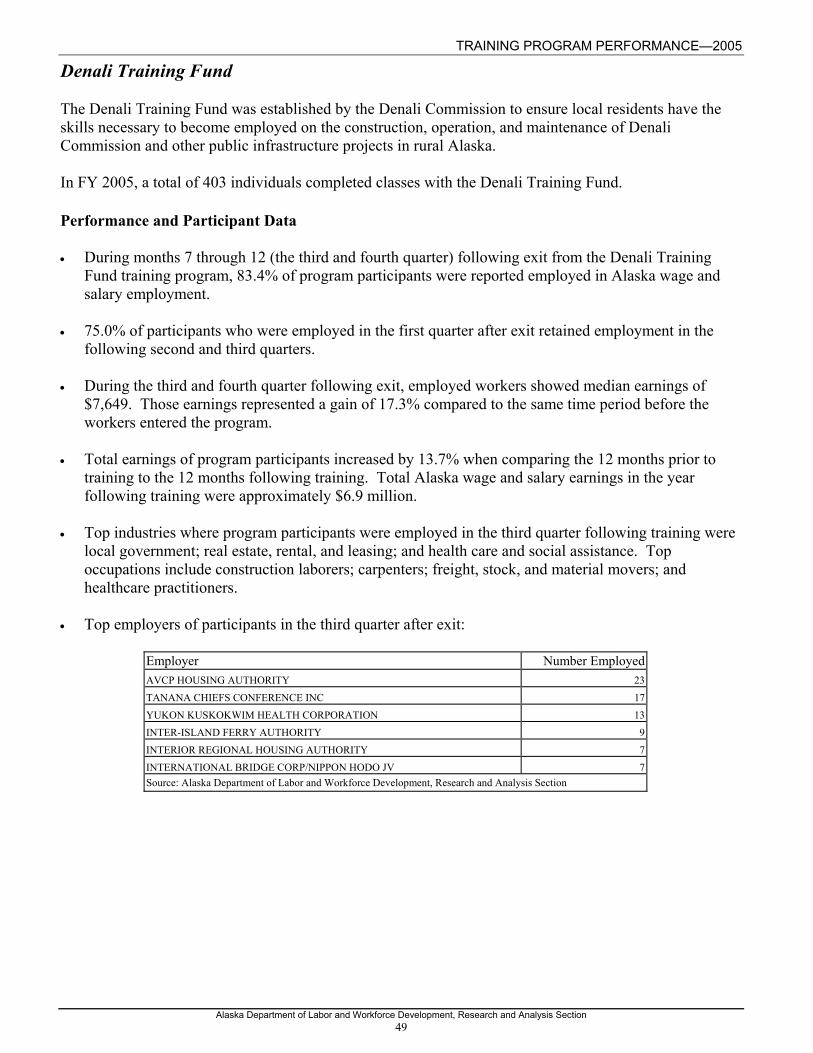
TRAINING PROGRAM PERFORMANCE—2005
Alaska Department of Labor and Workforce Development, Research and Analysis Section 49
Denali Training Fund The Denali Training Fund was established by the Denali Commission to ensure local residents have the skills necessary to become employed on the construction, operation, and maintenance of Denali Commission and other public infrastructure projects in rural Alaska. In FY 2005, a total of 403 individuals completed classes with the Denali Training Fund. Performance and Participant Data • During months 7 through 12 (the third and fourth quarter) following exit from the Denali Training
Fund training program, 83.4% of program participants were reported employed in Alaska wage and salary employment.
• 75.0% of participants who were employed in the first quarter after exit retained employment in the
following second and third quarters. • During the third and fourth quarter following exit, employed workers showed median earnings of
$7,649. Those earnings represented a gain of 17.3% compared to the same time period before the workers entered the program.
• Total earnings of program participants increased by 13.7% when comparing the 12 months prior to
training to the 12 months following training. Total Alaska wage and salary earnings in the year following training were approximately $6.9 million.
• Top industries where program participants were employed in the third quarter following training were
local government; real estate, rental, and leasing; and health care and social assistance. Top occupations include construction laborers; carpenters; freight, stock, and material movers; and healthcare practitioners.
• Top employers of participants in the third quarter after exit:
Employer Number Employed AVCP HOUSING AUTHORITY 23
TANANA CHIEFS CONFERENCE INC 17 YUKON KUSKOKWIM HEALTH CORPORATION 13 INTER-ISLAND FERRY AUTHORITY 9
INTERIOR REGIONAL HOUSING AUTHORITY 7 INTERNATIONAL BRIDGE CORP/NIPPON HODO JV 7 Source: Alaska Department of Labor and Workforce Development, Research and Analysis Section
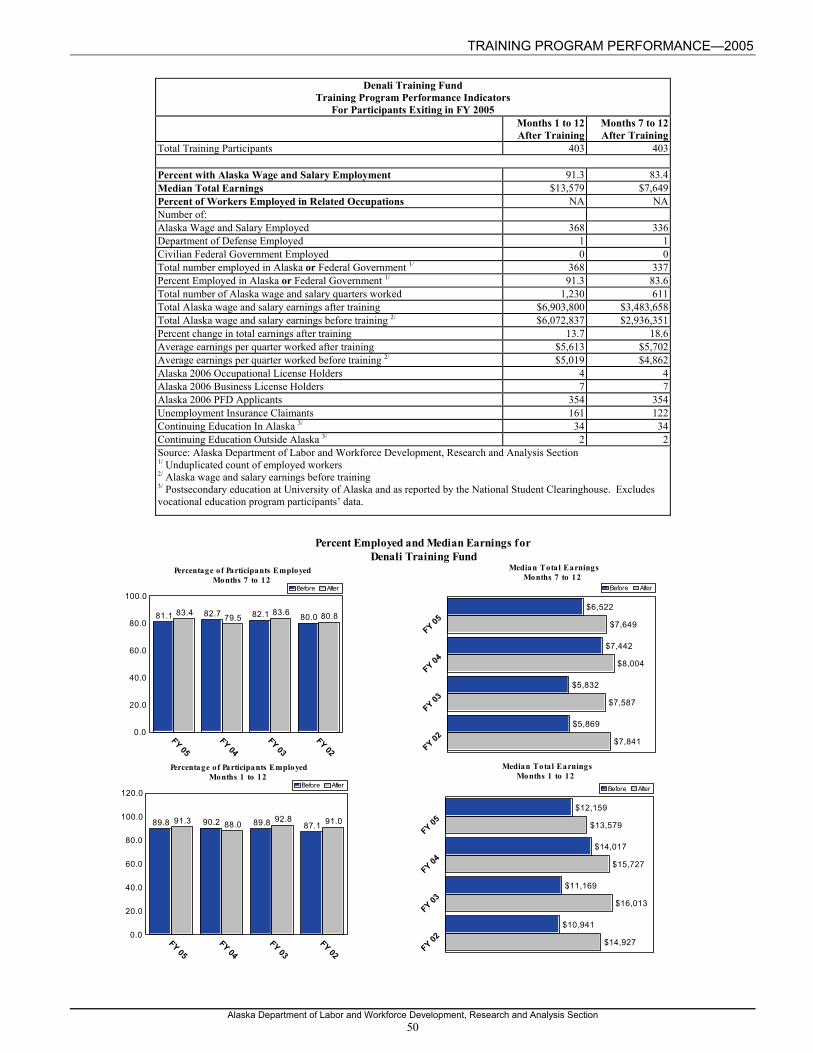
TRAINING PROGRAM PERFORMANCE—2005
Alaska Department of Labor and Workforce Development, Research and Analysis Section 50
Denali Training Fund
Training Program Performance Indicators For Participants Exiting in FY 2005
Months 1 to 12 After Training
Months 7 to 12 After Training
Total Training Participants 403 403
Percent with Alaska Wage and Salary Employment 91.3 83.4Median Total Earnings $13,579 $7,649Percent of Workers Employed in Related Occupations NA NANumber of: Alaska Wage and Salary Employed 368 336Department of Defense Employed 1 1Civilian Federal Government Employed 0 0Total number employed in Alaska or Federal Government 1/ 368 337Percent Employed in Alaska or Federal Government 1/ 91.3 83.6Total number of Alaska wage and salary quarters worked 1,230 611Total Alaska wage and salary earnings after training $6,903,800 $3,483,658Total Alaska wage and salary earnings before training 2/ $6,072,837 $2,936,351Percent change in total earnings after training 13.7 18.6Average earnings per quarter worked after training $5,613 $5,702Average earnings per quarter worked before training 2/ $5,019 $4,862Alaska 2006 Occupational License Holders 4 4Alaska 2006 Business License Holders 7 7Alaska 2006 PFD Applicants 354 354Unemployment Insurance Claimants 161 122Continuing Education In Alaska 3/ 34 34Continuing Education Outside Alaska 3/ 2 2Source: Alaska Department of Labor and Workforce Development, Research and Analysis Section 1/ Unduplicated count of employed workers 2/ Alaska wage and salary earnings before training 3/ Postsecondary education at University of Alaska and as reported by the National Student Clearinghouse. Excludes vocational education program participants’ data.
81.1 82.7 82.1 80.083.4 79.583.6 80.8
FY 05FY 04
FY 03FY 02
0.0
20.0
40.0
60.0
80.0
100.0Before After
Percent Employed and Median Earnings forDenali Training Fund
Median Total EarningsMonths 7 to 12
Percentage of Participants EmployedMonths 7 to 12
89.8 90.2 89.8 87.191.3 88.092.8 91.0
FY 05FY 04
FY 03FY 02
0.0
20.0
40.0
60.0
80.0
100.0
120.0Before After
$12,159
$14,017
$11,169
$10,941
$13,579
$15,727
$16,013
$14,927
FY 05
FY 04
FY 03
FY 02
Before After
$6,522
$7,442
$5,832
$5,869
$7,649
$8,004
$7,587
$7,841
FY 05
FY 04
FY 03
FY 02
Before After
Percentage of Participants EmployedMonths 1 to 12
Median Total EarningsMonths 1 to 12
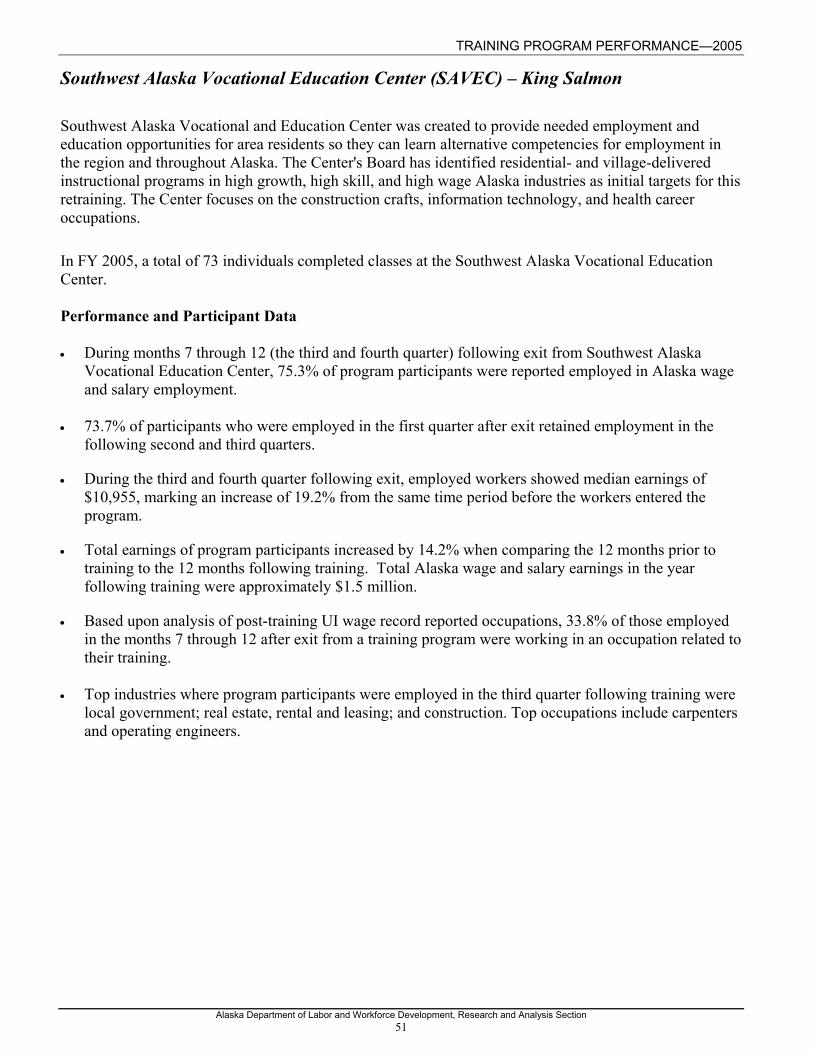
TRAINING PROGRAM PERFORMANCE—2005
Alaska Department of Labor and Workforce Development, Research and Analysis Section 51
Southwest Alaska Vocational Education Center (SAVEC) – King Salmon Southwest Alaska Vocational and Education Center was created to provide needed employment and education opportunities for area residents so they can learn alternative competencies for employment in the region and throughout Alaska. The Center's Board has identified residential- and village-delivered instructional programs in high growth, high skill, and high wage Alaska industries as initial targets for this retraining. The Center focuses on the construction crafts, information technology, and health career occupations. In FY 2005, a total of 73 individuals completed classes at the Southwest Alaska Vocational Education Center. Performance and Participant Data • During months 7 through 12 (the third and fourth quarter) following exit from Southwest Alaska
Vocational Education Center, 75.3% of program participants were reported employed in Alaska wage and salary employment.
• 73.7% of participants who were employed in the first quarter after exit retained employment in the
following second and third quarters.
• During the third and fourth quarter following exit, employed workers showed median earnings of $10,955, marking an increase of 19.2% from the same time period before the workers entered the program.
• Total earnings of program participants increased by 14.2% when comparing the 12 months prior to training to the 12 months following training. Total Alaska wage and salary earnings in the year following training were approximately $1.5 million.
• Based upon analysis of post-training UI wage record reported occupations, 33.8% of those employed in the months 7 through 12 after exit from a training program were working in an occupation related to their training.
• Top industries where program participants were employed in the third quarter following training were
local government; real estate, rental and leasing; and construction. Top occupations include carpenters and operating engineers.
TRAINING PROGRAM PERFORMANCE—2005
Alaska Department of Labor and Workforce Development, Research and Analysis Section 52
SAVEC
Training Program Performance Indicators For Participants Exiting in FY 2005
Months 1 to 12 After Training
Months 7 to 12 After Training
Total Training Participants 73 73
Percent with Alaska Wage and Salary Employment 90.4 75.3Median Total Earnings $17,211 $10,955Percent of Workers Employed in Related Occupations NA 33.8Number of: Alaska Wage and Salary Employed 66 55Department of Defense Employed 0 0Civilian Federal Government Employed 0 0Total number employed in Alaska or Federal Government 1/ 66 55Percent Employed in Alaska or Federal Government 1/ 90.4 75.3Total number of Alaska wage and salary quarters worked 216 100Total Alaska wage and salary earnings after training $1,532,908 $730,765Total Alaska wage and salary earnings before training 2/ $1,342,064 $653,899Percent change in total earnings after training 14.2 11.8Average earnings per quarter worked after training $7,097 $7,308Average earnings per quarter worked before training 2/ $6,611 $6,411Alaska 2006 Occupational License Holders 1 1Alaska 2006 Business License Holders 6 6Alaska 2006 PFD Applicants 62 62Unemployment Insurance Claimants 24 17Continuing Education In Alaska 3/ 18 18Continuing Education Outside Alaska 3/ 0 0Source: Alaska Department of Labor and Workforce Development, Research and Analysis Section 1/ Unduplicated count of employed workers 2/ Alaska wage and salary earnings before training 3/ Postsecondary education at University of Alaska and as reported by the National Student Clearinghouse. Excludes vocational education program participants’ data.
78.1 77.575.370.0
FY 05FY 04
0.0
20.0
40.0
60.0
80.0
100.0Before After
Percent Employed and Median Earnings forSAVEC
Median Total EarningsMonths 7 to 12
Percentage of Participants EmployedMonths 7 to 12
86.3 82.590.4
85.0
FY 05FY 04
0.0
20.0
40.0
60.0
80.0
100.0Before After
$15,832
$9,090
$17,211
$15,627
FY 05
FY 04
Before After
$9,193
$7,468
$10,955
$7,714
FY 05
FY 04
Before After
Percentage of Participants EmployedMonths 1 to 12
Median Total EarningsMonths 1 to 12

TRAINING PROGRAM PERFORMANCE—2005
Alaska Department of Labor and Workforce Development, Research and Analysis Section 53
Ilisagvik College – Barrow Located at the northernmost point of Alaska, Ilisagvik College is a two-year community college offering quality post-secondary academic, vocational, and technical education aimed at matching workforce needs. Ilisagvik College builds skills to match workforce needs by offering a selection of programs: Accounting, Office Administration, Information Technology, Computer Industry Certification, Electrical Trades, Construction Trades, CDL/Heavy Truck Operations, Associate of Applied Science, Business and Management, Associate of Arts, and Industrial Safety. Ilisagvik is an institution dedicated to perpetuating and strengthening Inupiat (Eskimo) culture, language, values, and traditions. In FY 2005, a total of 193 individuals completed classes at Ilisagvik College. Performance and Participant Data • During months 7 through 12 (the third and fourth quarter) following exit from Ilisagvik College,
75.6% of 193 program participants were reported employed in Alaska wage and salary employment.
• 64.8% of participants who were employed in the first quarter after exit retained employment in the following second and third quarters.
• During the third and fourth quarter following exit, employed workers showed median earnings of $11,268, marking an increase of 115.7% from the same time period before the workers entered the program.
• Total earnings of program participants increased by 26.5% when comparing the 12 months prior to training to the 12 months following training and average earnings per quarter worked increased by 12.9%. Total Alaska wage and salary earnings in the year following training were approximately $3.3 million.
• Based upon analysis of post-training UI wage record reported occupations, 26.7% of those employed in the months 7 through 12 after exit from a training program were working in an occupation related to their training.
• Top industries where program participants were employed in the third quarter following training were
local government and construction. Top occupations were freight, stock, and material movers and construction laborers.
• Top employers of participants in the third quarter after exit:
Employer Number Employed NORTH SLOPE BOROUGH 47 HARPOON CONSTRUCTION GROUP INC 12
NORTH SLOPE BOROUGH SCHOOL 8 OLGOONIK CORP 7 ILISAGVIK COLLEGE 7
ASRC ENERGY SERVICES O&M INC 5 Source: Alaska Department of Labor and Workforce Development, Research and Analysis Section

TRAINING PROGRAM PERFORMANCE—2005
Alaska Department of Labor and Workforce Development, Research and Analysis Section 54
Ilisagvik College
Training Program Performance Indicators For Participants Exiting in FY 2005
Months 1 to 12 After Training
Months 7 to 12 After Training
Total Training Participants 193 193
Percent with Alaska Wage and Salary Employment 88.6 75.6Median Total Earnings $15,016 $11,268Percent of Workers Employed in Related Occupations NA 26.7Number of: Alaska Wage and Salary Employed 171 146Department of Defense Employed 0 0Civilian Federal Government Employed 0 0Total number employed in Alaska, Other or Federal Government 1/ 171 146Percent Employed in Alaska, Other or Federal Government 1/ 88.6 75.6Total number of Alaska wage and salary quarters worked 510 257Total Alaska wage and salary earnings after training $3,255,749 $1,708,325Total Alaska wage and salary earnings before training 2/ $2,573,403 $1,365,783Percent change in total earnings after training 26.5 25.1Average earnings per quarter worked after training $6,384 $6,647Average earnings per quarter worked before training 2/ $5,656 $5,739Alaska 2006 Occupational License Holders 0 0Alaska 2006 Business License Holders 0 0Alaska 2006 PFD Applicants 174 174Unemployment Insurance Claimants 67 41Continuing Education In Alaska 3/ 5 5Continuing Education Outside Alaska 3/ 2 2Source: Alaska Department of Labor and Workforce Development, Research and Analysis Section 1/ Unduplicated count of employed workers 2/ Alaska wage and salary earnings before training 3/ Postsecondary education at University of Alaska and as reported by the National Student Clearinghouse. Excludes vocational education program participants’ data.
73.168.5
75.6 77.2
FT 05FY 04
0.0
20.0
40.0
60.0
80.0
100.0Before After
Percent Employed and Median Earnings forIlisagvik College
Median Total EarningsMonths 7 to 12
Percentage of Participants EmployedMonths 7 to 12
86.5
74.8
88.6 85.8
FY 05FY 04
0.0
20.0
40.0
60.0
80.0
100.0Before After
$6,545
$8,517
$15,016
$14,966
FY 05
FY 04
Before After
$5,223
$5,303
$11,268
$11,074
FY 05
FY 04
Before After
Percentage of Participants EmployedMonths 1 to 12
Median Total EarningsMonths 1 to 12
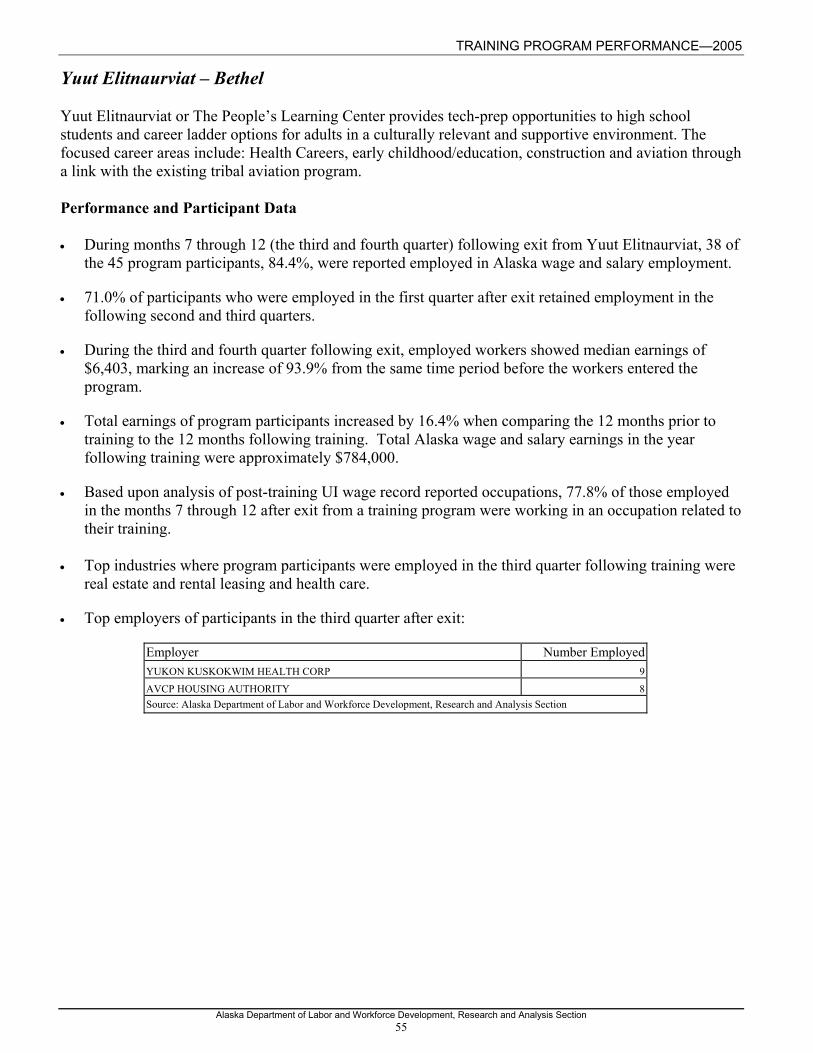
TRAINING PROGRAM PERFORMANCE—2005
Alaska Department of Labor and Workforce Development, Research and Analysis Section 55
Yuut Elitnaurviat – Bethel Yuut Elitnaurviat or The People’s Learning Center provides tech-prep opportunities to high school students and career ladder options for adults in a culturally relevant and supportive environment. The focused career areas include: Health Careers, early childhood/education, construction and aviation through a link with the existing tribal aviation program. Performance and Participant Data • During months 7 through 12 (the third and fourth quarter) following exit from Yuut Elitnaurviat, 38 of
the 45 program participants, 84.4%, were reported employed in Alaska wage and salary employment.
• 71.0% of participants who were employed in the first quarter after exit retained employment in the following second and third quarters.
• During the third and fourth quarter following exit, employed workers showed median earnings of $6,403, marking an increase of 93.9% from the same time period before the workers entered the program.
• Total earnings of program participants increased by 16.4% when comparing the 12 months prior to training to the 12 months following training. Total Alaska wage and salary earnings in the year following training were approximately $784,000.
• Based upon analysis of post-training UI wage record reported occupations, 77.8% of those employed in the months 7 through 12 after exit from a training program were working in an occupation related to their training.
• Top industries where program participants were employed in the third quarter following training were
real estate and rental leasing and health care.
• Top employers of participants in the third quarter after exit:
Employer Number Employed YUKON KUSKOKWIM HEALTH CORP 9 AVCP HOUSING AUTHORITY 8 Source: Alaska Department of Labor and Workforce Development, Research and Analysis Section
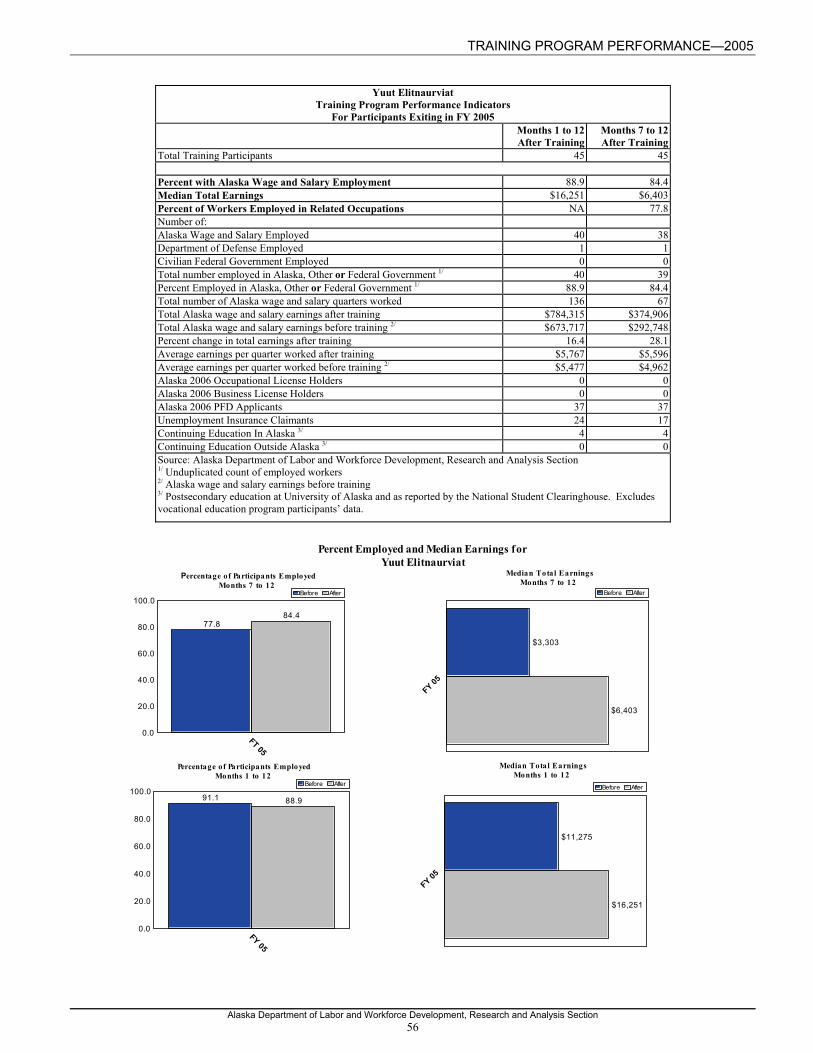
TRAINING PROGRAM PERFORMANCE—2005
Alaska Department of Labor and Workforce Development, Research and Analysis Section 56
Yuut Elitnaurviat
Training Program Performance Indicators For Participants Exiting in FY 2005
Months 1 to 12 After Training
Months 7 to 12 After Training
Total Training Participants 45 45
Percent with Alaska Wage and Salary Employment 88.9 84.4Median Total Earnings $16,251 $6,403Percent of Workers Employed in Related Occupations NA 77.8Number of: Alaska Wage and Salary Employed 40 38Department of Defense Employed 1 1Civilian Federal Government Employed 0 0Total number employed in Alaska, Other or Federal Government 1/ 40 39Percent Employed in Alaska, Other or Federal Government 1/ 88.9 84.4Total number of Alaska wage and salary quarters worked 136 67Total Alaska wage and salary earnings after training $784,315 $374,906Total Alaska wage and salary earnings before training 2/ $673,717 $292,748Percent change in total earnings after training 16.4 28.1Average earnings per quarter worked after training $5,767 $5,596Average earnings per quarter worked before training 2/ $5,477 $4,962Alaska 2006 Occupational License Holders 0 0Alaska 2006 Business License Holders 0 0Alaska 2006 PFD Applicants 37 37Unemployment Insurance Claimants 24 17Continuing Education In Alaska 3/ 4 4Continuing Education Outside Alaska 3/ 0 0Source: Alaska Department of Labor and Workforce Development, Research and Analysis Section 1/ Unduplicated count of employed workers 2/ Alaska wage and salary earnings before training 3/ Postsecondary education at University of Alaska and as reported by the National Student Clearinghouse. Excludes vocational education program participants’ data.
77.884.4
FT 05
0.0
20.0
40.0
60.0
80.0
100.0Before After
Percent Employed and Median Earnings forYuut Elitnaurviat
Median Total EarningsMonths 7 to 12
Percentage of Participants EmployedMonths 7 to 12
91.1 88.9
FY 05
0.0
20.0
40.0
60.0
80.0
100.0Before After
$11,275
$16,251
FY 05
Before After
$3,303
$6,403
FY 05
Before After
Percentage of Participants EmployedMonths 1 to 12
Median Total EarningsMonths 1 to 12