Embed Size (px)
DESCRIPTION
Training of Certifiers in the United States. Donna L. Hoyert Robert N. Anderson National Center for Health Statistics (NCHS). US Vital Statistics System. Decentralized system State vital statistics laws and regulations 57 registration areas - PowerPoint PPT Presentation
Citation preview

Training of Certifiers in the United States
Donna L. HoyertRobert N. Anderson
National Center for Health Statistics (NCHS)

US Vital Statistics System
Decentralized system
State vital statistics laws and regulations
57 registration areas
Funeral directors, physicians, medical examiners or coroners
2

Scale
2.4 million deaths annually
700,000-800,000 practicing physicians, medical examiners, and coroners
Skewed distribution of certification
3

Training in Decentralized System
Not NCHS’ responsibility to train certifiers
NCHS helps facilitate training but does more
4

Workshops on Improving Cause-of-Death Statistics
Sponsors: NCHS & National Committee on Vital and Health Statistics
Attendees:Federal vital statistics staff
State vital statistics staff
Professional organization representatives
5

Workshop Recommendations
Need broad-based educational training of certifiers
Multiple approaches
Multiple encounters
6

Workshop Recommendations
Training message:Importance of cause-of-death statistics
Value of statistics in improving the practice of medicine
Mechanics of completing the death certificate
7

Workshop Recommendations
Training Timing:
Medical school- Minimal orientation to process but emphasis on importance of statistics and physician contribution
Internship and residency- key time to begin training physicians
8

Follow through on Workshop Recommendations
Recommendations concerning training &:
Medical school
Internship & residency
Licensure & board certification
Practicing physicians
Medical examiners and coroners
Hospitals
Information dissemination and software
Other areas 9

Workshop Results
Workshop reports widely distributed
Resolutions of support
Notices of initiative in variety of publications
NCHS produced additional training material
States may have increased efforts
Other promising developments withered
10

Training Materials
Instructions on death certificate
Laminated instructions
Handbooks etc.
Exhibits
Presentations
Web page
11

Instructions on death certificate
Examples and some instructions
Purpose: To make sure instructions are available to every certifier who is completing a death certificate
12

Instructions in an electronic death registration system
NCHS recommendations for help screens, prompts, and queries on an electronic death certificate developed in 1999
Above recommendations were incorporated into the Death edit specifications for 2003 revision (http://www.cdc.gov/nchs/data/dvs/FinalDeathSpecs2-22-05.pdf)
13

Laminated instructions
2 separate pages of instructions
Purpose: To provide certifiers with a quick and handy reference
14

Handbooks and other publications
NCHS handbooks
Series report
CAP manuals
Journal articles
15

Handbooks
Text, instructions, examples
Purpose: To provide more detailed instructions tailored to physician or medical examiner and coroner
16

Other publicationsText, instructions, examples
Purpose: To distribute instructions and examples in medical professional’s own language differently

Exhibit
Main panel, 4 table top panels, variety of educational handouts
Purpose: To bring and distribute training materials directly to certifiers and to educate them about the importance of accurate cause-of-death certification
18

Illustration: Old Exhibit Display
19

Lif
e e
xp
ec
tan
cy
in y
ea
rs
76
75
74
73
72
71
701970 1972 1974 1976 1978 1980 1982 1984 1986 1988 1990 1992 1994 1995
Cause-of-death informationisusedtoimprovequality of lifeand increaselifeexpectancy forAmericans
Accurate death certificates are importantfor improvingthe health status of the Nation
NationalCenter for Health StatisticsNational CommitteeonVital and HealthStatistics
National Association for PublicHealth Statistics and Information Systems

Mortality trends in theUnited States
Accident death ratesare greater than ratesfor many causes atyounger age groupsand increasemoderately with age.HIV death rates peakfor age groups 25-34and 35-44. Cancerdeath rates increasequickly with age beforeleveling off at 75-84and 85+. Heart diseasedeath rates are highrelative to other causesfor children under 1,low for ages 1-4 and 5-14 and increase foreach subsequent age
Contribution in months to improvement in life expectancy
MortalityTrends1979-97Age-adjusted rate per 100,000 standard populationRate per 100,000 live births
Congenital anomalies
SIDS
Disorders relating to short gestationand unspecified low birthweight RDS
Newborn affected bymaternal complicationsof pregnancy
Age-adjusted death rates for Chronicobstructive pulmonary diseases and alliedconditions have increased fairly steadily since1979 while rates for HIV increaseddramatically from 1987 to 1995 and havedropped since. Rates for cancer have beenrelatively stable but have decreased since1990. Rates have decreased for heart disease,stroke, and accidents.
Heartdisease
Stroke
Rate per 100,000 live births
Majorcausesof deathinfluencing thechange inlifeexpectancy between1995 and1996
Sou rc e: C DC/N CH S, National Vital Stat ist ics System
HIV infection
Heart d isease
Cancer
Homicide
Suicide
Stroke
Diabetes
COPD
Hepatitis
0 0.5 1 1.5 2-0.5-1
Lif e expectancy increased from 75.8 years in 1995 to 76.1 years in 1996 for a total change of0.3 years (i.e., 3.6 months). The total change is the combination of i ncreasing mortality forsome causes and decreasing mortality for other causes. This chart shows the contribution ofspecif ic causes, both positive and negative, to the overall improvement in life expectancy.
Deathratesfor selectedcausesbyage,1997
Sou rce : C DC /NCH S, Nat ional Vita l Stat istics System, preli minar y data .
Rate per 100,000 population
Accidents
HIV
Heart disease
Under 11-4 5-14 15-24 25-34 35-44 45-54 55-64 65-74 75-84 85+0.1
1
10
100
1000
10000
Cancer
InfantmortalityratesforSIDS by month, US1989-96
Jan Jul Jan Jul Jan Jul Jan Jul Jan Jul Jan Jul Jan Jul Jan Jul
1989 1990 1991 1992 1993 1994 1995 1996
0
50
100
150
200
250
Source: CDC /NCHS, National Vital Stat ist ics System.
SIDS mortality rates follow a seasonal pattern with high rates in the winter and lowrates in the summer. Infant mortality rates for SIDS decreased about 44 percent
Sourc e: CDC/NCHS, National Vital Stat ist ics System. Preliminary data are basis for 1997 da ta.
1
10
100
1000
HIV
All age groups
1980 1985 1990 1995 199710
100
1000Infants
Inf ant mor tality rates have decreased foreach of these cond itions s ince 1995.Decreases for SIDS and RDS have beenrelatively rapid in recent years; rates f orcongenital anomalies and newborn affectedby maternal complications of pregnancyhave generally decreased since1979. Ratesfor disorders relating to short gestation andunspecif ied low birthweight have been morevariable.
Cancer
COPD
Accidents
1980 1985 1990 1995 199

Some Exhibit LocationsAmerican College of PhysiciansAmerican Academy of PhysiciansAmerican Society of Internal MedicineAmerican Public Health AssociationAmerican College of CardiologyAmerican Society of Clinical OncologyNational Medical AssociationNational Association of Medical ExaminersNational Association for Public Health Statistics and Information SystemsAmerican Geriatrics SocietyAmerican Academy of Family PhysiciansNational Funeral Directors Association
22
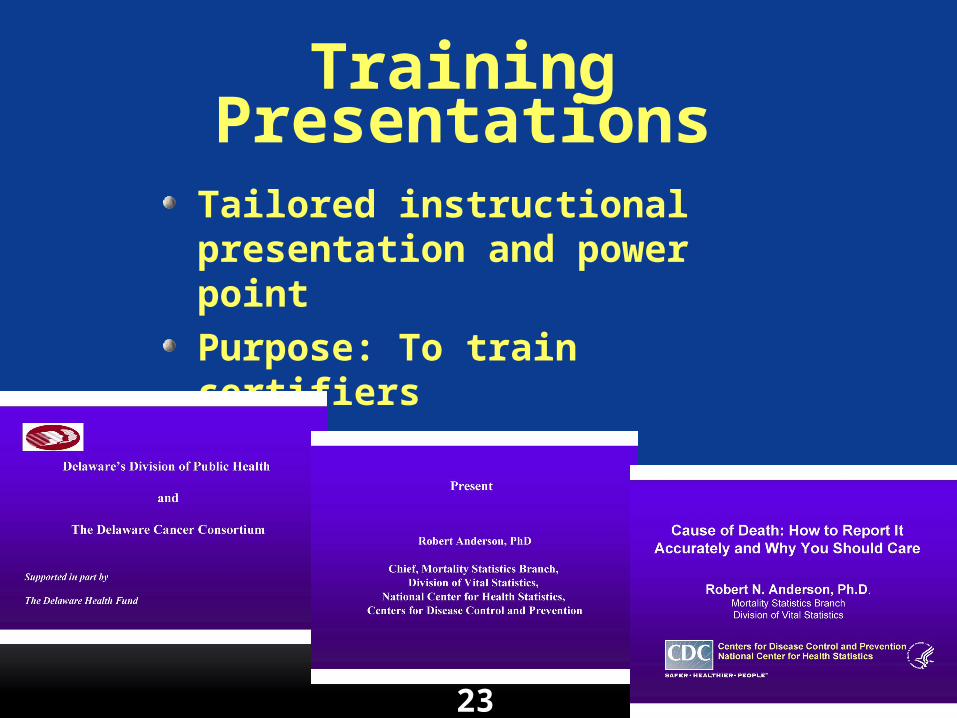
Training Presentations
Tailored instructional presentation and power point
Purpose: To train certifiers
23

Web PageLinks to training resources
Purpose: To help disseminate information
URL:http://www.cdc.gov/nchs/about/major/dvs/handbk.htm

Thank you for your attention.