Embed Size (px)
Citation preview

Training in basic drug abuse data management and analysis
Training in basic
drug abuse
data management
and analysis
Global Assessment Programmeon Drug Abuse (GAP)
Toolkit Module 5
�back
to navigation page
UNITED NATIONS OFFICE ON DRUGS AND CRIME
Vienna
Training in basic drugabuse data managementand analysis
Global Assessment Programme on Drug Abuse
Toolkit Module 5
UNITED NATIONSNew York, 2005

The content of GAP Toolkit Module 5: Training in basic drug abuse data management and
analysis was produced by the United Nations Office on Drugs and Crime as part of the
activities conducted under the Global Assessment Programme on Drug Abuse (GAP).
Other GAP activities include providing technical and financial support for the establish-
ment of drug information systems and supporting and coordinating global data collection
activities.
For further information, visit the GAP web site at www.unodc.org, e-mail [email protected],
or contact the Demand Reduction Section, UNODC, P.O. Box 500, 1400 Vienna, Austria.
United Nations Office on Drugs and Crime
Printed in Austria, 2005
UNITED NATIONS PUBLICATIONSales No. E.03.XI.18ISBN 92-1-148171-6

Preface
The Global Assessment Programme on Drug Abuse Toolkit Module 5: Training in basic
drug abuse data management and analysis has been produced by the United Nations
Office on Drugs and Crime as part of the activities conducted under the Global
Assessment Programme on Drug Abuse (GAP). The main objective of GAP is to
assist countries in collecting reliable and internationally comparable drug abuse data,
in building capacity at the local level to collect data that can guide demand reduc-
tion activities and in improving cross-national, regional and global reporting on drug
trends. To support that process, GAP Toolkit Module 5 provides a hands-on intro-
duction to the range of skills required for effective data management and analysis
in the format of a training course. GAP Toolkit Module 5 consists of an introduc-
tion describing the context and rationale of the course and a set of 12 training ses-
sions built around PowerPoint files with accompanying data sets, exercises and
commentary.
The purpose of GAP Toolkit Module 5 is to provide a practical and accessible guide
to implementing data collection in the core areas of drug epidemiology. Models and
examples presented in the modules are based on those that have been found to be
effective, but a key principle is that approaches will be adapted to meet local needs
and conditions.
Other GAP Epidemiological Toolkit modules include the provision of support for the
development of an integrated drug information system, indirect methods for esti-
mating prevalence, school surveys, data interpretation and management for policy
formation, focused assessment studies using qualitative methods and ethical issues.
iii


Acknowledgements
GAP Toolkit Module 5: Training in basic drug abuse data management and analysis
was prepared by André Noor with the support of the United Nations Office on Drugs
and Crime (UNODC) as part of the activities conducted under the Global Assessment
Programme on Drug Abuse (GAP).
The Office would like to thank the participants of the Southern African Development
Community Epidemiology Network on Drug Use (SENDU) and the East African Drug
Information System (EADIS) for their valuable assistance in piloting the training
course in March and September 2002.
v

Contents
Preface . . . . . . . . . . . . . . . . . . . . . . . . . . . . . . . . . . . . . . . . . . . . . . . . . . . . . . . . . . . . . . iii
Acknowledgements . . . . . . . . . . . . . . . . . . . . . . . . . . . . . . . . . . . . . . . . . . . . . . . . . . . . v
INTRODUCTION . . . . . . . . . . . . . . . . . . . . . . . . . . . . . . . . . . . . . . . . . . . . . . . . . . . . . . . 1
Background . . . . . . . . . . . . . . . . . . . . . . . . . . . . . . . . . . . . . . . . . . . . . . . . . . . . . . 1
Scope . . . . . . . . . . . . . . . . . . . . . . . . . . . . . . . . . . . . . . . . . . . . . . . . . . . . . . . . . . . 2
I. ORGANIZING THE COURSE . . . . . . . . . . . . . . . . . . . . . . . . . . . . . . . . . . . . . . . . . 3
Target audience . . . . . . . . . . . . . . . . . . . . . . . . . . . . . . . . . . . . . . . . . . . . . . . . . . 3
Class size . . . . . . . . . . . . . . . . . . . . . . . . . . . . . . . . . . . . . . . . . . . . . . . . . . . . . . . 3
Software and hardware . . . . . . . . . . . . . . . . . . . . . . . . . . . . . . . . . . . . . . . . . . . 3
Format of the course . . . . . . . . . . . . . . . . . . . . . . . . . . . . . . . . . . . . . . . . . . . . . 4
Practicalities . . . . . . . . . . . . . . . . . . . . . . . . . . . . . . . . . . . . . . . . . . . . . . . . . . . . . 5
Content . . . . . . . . . . . . . . . . . . . . . . . . . . . . . . . . . . . . . . . . . . . . . . . . . . . . . . . . . 6
Timetable . . . . . . . . . . . . . . . . . . . . . . . . . . . . . . . . . . . . . . . . . . . . . . . . . . . . . . . 6
Role of the trainer . . . . . . . . . . . . . . . . . . . . . . . . . . . . . . . . . . . . . . . . . . . . . . . 8
II. INTRODUCTION AND NOTES ON TRAINING SESSIONS 2-13 . . . . . . . . . . . . . 9
Session 1. Introduction and welcome . . . . . . . . . . . . . . . . . . . . . . . . . . . . . . . 10
Notes on session 2. File management . . . . . . . . . . . . . . . . . . . . . . . . . . . . . . . 14
Notes on session 3. SPSS data entry . . . . . . . . . . . . . . . . . . . . . . . . . . . . . . . . 15
Notes on session 4. Types of question and types of variable . . . . . . . . . . . 17
Notes on session 5. Coding closed questions . . . . . . . . . . . . . . . . . . . . . . . . . 18
Notes on session 6. Coding open questions . . . . . . . . . . . . . . . . . . . . . . . . . . 20
Notes on session 7. Recode and compute . . . . . . . . . . . . . . . . . . . . . . . . . . . 23
Notes on session 8. Data analysis: frequencies . . . . . . . . . . . . . . . . . . . . . . . 25
Notes on session 9. Data analysis: “Explore" . . . . . . . . . . . . . . . . . . . . . . . . . 26
Notes on session 10. Table manners . . . . . . . . . . . . . . . . . . . . . . . . . . . . . . . . 27
Notes on session 11. Data analysis: cross-tabulation . . . . . . . . . . . . . . . . . . 29
Notes on session 12. Data cleaning . . . . . . . . . . . . . . . . . . . . . . . . . . . . . . . . . 30
Notes on session 13. Documentation and “Help" . . . . . . . . . . . . . . . . . . . . . . 32
ANNEXES
I. Model student questionnaire: Exercises 1, 2 and 3 . . . . . . . . . . . . . . . 35
II. The pre- and post-test . . . . . . . . . . . . . . . . . . . . . . . . . . . . . . . . . . . . . . . . 51
III. Questionnaires . . . . . . . . . . . . . . . . . . . . . . . . . . . . . . . . . . . . . . . . . . . . . . . 53
IV. Checklists . . . . . . . . . . . . . . . . . . . . . . . . . . . . . . . . . . . . . . . . . . . . . . . . . . . 81
Note: The present publication should be used in conjunction with the accompanyingPowerPoint presentations, which contain trainer’s notes and slides for sessions 2-13of the training course.
vii


1
Introduction
Data management and data analysis is multidisciplinary, requiring
subject knowledge, computing expertise and a sound understanding
of statistical principles. This course aims to provide instruction and
hands-on practice in basic data management and data analysis to
enable information on drug use to be summarized more effectively.
Background
The training course has been piloted twice: in March 2002 with mem-
bers of the Southern African Development Community Epidemiology
Network on Drug Use (SENDU) and in September 2002 with two
groups from the East African Drug Information System (EADIS) (one
English-speaking and the other French-speaking, each with approxi-
mately 10 participants). In both instances, the training took place in
Pretoria under the aegis of the Global Assessment Programme on Drug
Abuse (GAP). The pilot courses provided valuable information on the
needs of the participants and the practicalities of presenting a course
on data management and analysis.
Data, both quantitative and qualitative, are central to the work of the
Integrated Drug Information Systems (IDIS) and the focal groups that
coordinate this work. More information on IDIS is presented in GAP
Toolkit Module 1: Developing an Integrated Drug Information System,
available at www.undcp.org/drug_demand_gap_m-toolkit.html.
In outline, IDIS consists of parties from a broad range of disciplines
and agencies. These may include drug treatment centres, law enforce-
ment agencies and health services in their various forms. The task of
IDIS is to gather and summarize the available information on drug
use in a coherent and standard manner. The overriding goal is to
monitor accurately the scale and nature of and trends in drug use in
a country or region and thus improve the effectiveness of drug demand
reduction responses.
The need for support in basic data analysis has been identified as
part of the Information, Needs and Resources Analysis (INRA) com-
pleted by GAP in Africa, the Caribbean and Central Asia. The pres-
ent GAP Toolkit Module 5 is intended to meet, at least in part, this
identified need.

Scope
Toolkit Module 5 provides an introduction to basic data management and data analy-
sis. It brings together the necessary computing and statistical skills to organize data
and generate standard descriptive statistics. Basic statistical principles are discussed
in context, that is, where they clarify the data management and analysis process.
The course does not cover the principles of inferential statistics nor the methods of
survey sampling.
There are a number of reasons for limiting the scope of the course to data man-
agement and descriptive statistics. First, careful data management is important for
data validity. Errors can be identified through careful data management. Equally,
errors can creep into the data through haphazard data management.
Second, the topics covered match the immediate needs and abilities of the partici-
pants. The GAP Toolkit modules provide a starting point for developing good prac-
tices in data collection, management and analysis and are intended to be appropriate
to the existing level of expertise of the participants in IDIS. The course attempts to
meet these principles. It is envisaged that participants will use the skills presented
in the course to manage and present data to their network meetings, to enhance
the comparability of data and to organize the raw information needed to complete
the drug abuse data component, that is, part II of the Annual Reports Questionnaire
of the United Nations Commission on Narcotic Drugs.
Finally, the nature of much of the data collected by IDIS makes the application of
inferential techniques problematic. Drug use is by nature clandestine. Standard sur-
vey techniques require careful consideration and adjustment to meet the require-
ments of the subject matter. The selection of interviewees is frequently not random
and only representative of a limited population. Where surveys are designed to be
representative of a larger population, it is generally necessary to consider the indi-
vidual circumstances and turn to experts with a broader background in statistics.
2
GAP Toolkit Module 3 Training in basic drug abuse data management and analysis

Organizing the course
Chapter I
3
Target audience
The target audience for the module is those who wish to present a
course on data management and analysis to members of the drug
information networks. It is hoped that those taking the course may
go on to train others within their drug information network.
Class size
The pilot courses were run with approximately 10 participants in each,
which is a manageable number for a single trainer. The greater the
number of participants, the longer it will take to complete the exer-
cises and the greater will be the demands on the trainer. Class sizes
greater than 14 would make it difficult for the trainer to devote suf-
ficient time to resolving individual problems, in particular as partici-
pants are likely to have different levels of experience of computers
and statistics.
Software and hardware
Modern data management and analysis relies on the use of compu-
ter packages. The software required on each machine is Statistical
Package for the Social Sciences (SPSS), Adobe Acrobat (for the SPSS
“Help” files), Word, PowerPoint and Excel. It is assumed that the
machines are running a Microsoft Windows operating system. When
loading SPSS, trainers should complete a custom installation and
install the SPSS “Syntax Guide”. The “Syntax Guide” will be used
from session 7 onwards.
The version of SPSS used in the course is version 11. However, the
course is directly applicable to all versions of SPSS from version 10
onwards.

The individual presentations or sessions state which software packages should be
open for that presentation or session. PowerPoint and SPSS should be opened as a
minimum. Windows Explorer is used extensively in session 2 on file management.
Excel and Word are used to demonstrate copying SPSS output to other packages
and used extensively in session 10 on table manners.* Adobe Acrobat is necessary
to display the SPSS “Syntax Guide” and should open automatically whenever the
“Syntax Guide” is invoked.
The participants will need at least two diskettes to save their work during the course.
At the end of the course, ideally, the participants should receive a compact disk
(CD) containing all of the PowerPoint presentations, data files, exercises and their
own files from the course. A computer with a CD-writer and a stock of blank CDs
would be needed.
One final point on hardware: within many developing countries, the electrical sup-
ply is not reliable, necessitating the use of uninterrupted power supply batteries to
provide enough time to turn the computers off if the power supply fails. Trainers
should also check whether transformers are needed to match local electricity plugs.
A checklist of the hardware and software required by trainers and suggestions as to
the documentation that participants should bring to the course are given in annex
IV, at the end of the present publication.
The trainer should review the hardware and software available to the students, draw
their attention at the beginning of the course to any differences that might be found
during the course of the presentation and try to compensate for them during the
presentations. This should prevent participants becoming confused if their compu-
ter and the presentation do not match perfectly.
Format of the course
A typical session would involve the trainer presenting a topic using a PowerPoint
presentation and demonstrating various SPSS techniques. Participants are expected
to complete various exercises during or at the end of the session.
The exercises provide an opportunity for the participants to obtain hands-on expe-
rience of using the software. During the exercises, the trainer should move around
the class helping individuals to get started and answering specific questions.
4
GAP Toolkit Module 5 Training in basic drug abuse data management and analysis
* It is assumed that Microsoft products are being used as they are the most common and can be usedas intermediaries between SPSS and more obscure software packages. SPSS will output to other file for-mats, although it should also be possible to output to Excel and Word files, which will in turn be readby most other spreadsheet or word-processing packages.

5
Chapter I Organizing the course
In addition to the exercises within the sessions, there are three larger exercises that
bring together a range of topics. The exercise sheets for the three larger exercises
and accompanying trainer’s notes are given in annex I. A 90-minute session should
be devoted to each of these exercises.
Practicalities
The format of the course raises a number of practical considerations.
First, in order for the students to follow a PowerPoint presentation and SPSS demon-
strations, there must be some method of displaying the trainer’s computer screen
to the audience. The simplest method is a data projector, which was used effectively
during the pilot sessions, although there are more sophisticated systems for this
task. The trainer should acquaint himself or herself with the presentation hardware,
ensuring, in particular, that necessary back-ups, such as replacement bulbs, are avail-
able.
Second, the trainer will be required to switch between software packages during a
presentation, primarily between PowerPoint and SPSS, although in some instances,
Adobe Acrobat, Windows Explorer, Word and Excel will also be used. The simplest
method of switching between software packages running on a computer is to start
by opening all the packages that will be required. Once all the necessary software
packages are open, holding down the Alt key on the keyboard and pressing the Tab
key will move control between them.
Third, to complete the exercises, the participants must have access to a computer
loaded with the relevant software. There is no strict rule for the number of students
per computer. One student to a computer ensures that each student completes the
exercises. However, working in pairs allows the participants to share their knowl-
edge and tends to speed up the exercises. The danger of sharing is that one of the
pair becomes passive, allowing the more competent or more forthright of the pair
to do most of the work. If participants are working in pairs, the trainer should ensure
that the hands on the keyboard change by establishing a rotation system, either
between sessions or halfway through the exercise. Three or more to a computer is
not advisable, as either the training will take far longer or the participants will not
receive the necessary hands-on practice. The particular conditions where the train-
ing is held will of course be the determining factor, although where there are more
than two to a computer, additional practical sessions may be desirable in order to
stagger the use and ensure every participant obtains hands-on experience.
The experience of the pilot sessions was that participants tended to start the course
working individually, but, as the exercises became longer and more detailed, a sub-
stantial proportion worked together in pairs, some then duplicating the results on
the second computer. This could be a result of the country focal points sending two
6
GAP Toolkit Module 5 Training in basic drug abuse data management and analysis
participants to the training sessions, but it is a positive outcome as it reflects the
sharing of expertise that is integral to the work of the drug information networks.
Content
The course can be broken into three broad, interconnected areas: basic computing,
data management and data analysis.
Basic computing skills cannot be assumed for participants from developing coun-
tries. In the pilot sessions there were participants who had never used a computer
before. Session 2 on file management covers the fundamental computing skills that
are required to complete the course.
Data management is the primary topic in the following sessions:
Session 3. SPSS data entry
Session 4. Types of question and types of variable
Session 5. Coding closed questions
Session 6. Coding open questions
Session 7. Recode and compute
Session 12. Data cleaning
Session 13. Documentation and “Help"
Data analysis is the primary topic in the following sessions:
Session 8. Data analysis: frequencies
Session 9. Data analysis: “Explore”
Session 10. Table manners
Session 11. Data analysis: cross-tabulation
The topics are interrelated, so each of the sessions contains, in varying amounts,
instruction in statistical principles, in the use of SPSS and in general computer use.
Timetable
The course is intended to be adapted by trainers to their own needs. The individ-
ual timetable will be determined by the adaptation. Some comments on adapting
the course appear next, followed by a proposal for a timetable for the full course
and observations on the experiences in the pilot workshops.
The course is designed to be run over five days, with approximately six hours of
contact time a day. However, the speed at which the topics can be covered will
7
Chapter I Organizing the course
depend largely on the level of expertise of the participants. It is conceivable that,
with experienced computer users and some tailoring of the topics, the workshop
could be completed in four days. When adapting the course for a particular work-
shop, the trainer should consider carefully the amount of time that will be required
to deliver the topics. For novices, five days will be needed.
The circumstances of the individual workshop will determine how best to break up
the day. It is not advisable to have time slots that are too long, as both participants
and trainers become weary and bored. Time slots of 90 minutes are reasonable, bear-
ing in mind that there will be some differentiation within the session between pres-
entation and hands-on exercises.
Some flexibility is needed in matching presentations to the 90-minute time slots. There
are 13 sessions in the course and three long exercises, giving a total of 16 defined
units to fit in a total of 20 time slots. The sessions and exercises are not uniform in
time. In particular, sessions 1, 2 and 10 are likely to take longer than the designated
90 minutes. The time needed for the exercises is largely dependent on the participants’
previous experience, although exercise 1 is likely to take longer than 90 minutes.
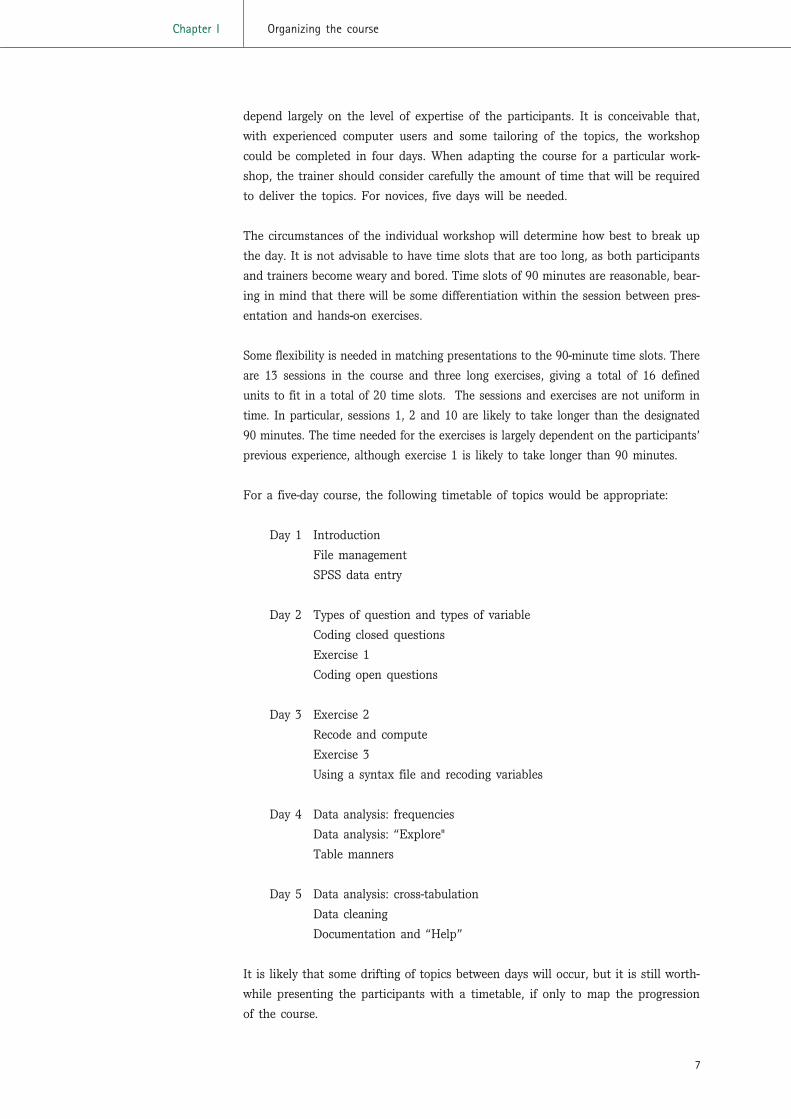
For a five-day course, the following timetable of topics would be appropriate:
Day 1 Introduction
File management
SPSS data entry
Day 2 Types of question and types of variable
Coding closed questions
Exercise 1
Coding open questions
Day 3 Exercise 2
Recode and compute
Exercise 3
Using a syntax file and recoding variables
Day 4 Data analysis: frequencies
Data analysis: “Explore"
Table manners
Day 5 Data analysis: cross-tabulation
Data cleaning
Documentation and “Help”
It is likely that some drifting of topics between days will occur, but it is still worth-
while presenting the participants with a timetable, if only to map the progression
of the course.

8
GAP Toolkit Module 5 Training in basic drug abuse data management and analysis
Role of the trainer
The trainer will adapt the teaching materials to the demands of the specific course
they are presenting, bearing in mind the time available for the course and the level
of expertise of the participants. The trainer is responsible for ensuring that the nec-
essary hardware, software and documentation to complete the course are available.
The trainer will present the PowerPoint presentations to the class, elaborate on the
information provided in the slides and the slide notes, answer specific questions
from the participants and demonstrate the computing techniques, where appropri-
ate. In addition, the trainer is expected to comment on the questionnaires and data
brought by participants, if requested.
The demands on the trainer are substantial. Teaching computing, statistics and data
analysis techniques requires detailed knowledge on the part of the trainer and a will-
ingness to help the participants at a level beyond that of a standard university course.
The participants are likely to be a heterogeneous group, necessitating a high level
of individual attention. The size of the group must be small enough to ensure this
is a feasible proposition.

Introduction and notes ontraining sessions 2-13
Chapter II
9
The notes on sessions 2-13 below are to be used in conjunction with
training sessions 2-13 contained in the accompanying PowerPoint pre-
sentations.
Teaching is as much an art as a science and much of what follows
will reflect the personal approach of the author. Trainers adopting the
course will bring their own approach to the materials and will enhance
and reject various components. The following discussion describes the
course in greater detail and should help trainers to arrive at their per-
sonal decisions as to how to use the materials.
A set structure has been adopted for the following discussion, centred
on the aims, objectives and learning outcomes of each session. The aims
and objectives define the educational goals that are to be achieved [1].
Aims represent broad, expansive goals, while objectives are narrower
specific topics that are to be covered. Learning skills are specific skills
that the student is expected to have attained at the end of the session.
Having defined the aims, objectives and learning outcomes of the ses-
sion, the pilot workshops will be used as case studies to highlight any
particular costs or benefits.
The course consists of 13 sessions, each described below. The con-
tent of the sessions can be broken into three distinct but interlinked
topics: computer expertise, data management and data analysis. Each
topic is made up of both practical hands-on instruction and discus-
sions of the underlying principles.
Computer expertise is developed throughout the course. The main
computing principles and skills needed to complete the course are
related to file management and are presented in session 2. These are
reinforced by repeated use throughout the course. The amount of
emphasis given to this part of the course will depend largely on the
level of expertise the participants bring to the course. An inability to
comprehend how and where to save files will disrupt the course and
lead to confusion. It is not advisable to omit this component unless
absolutely certain that the participants can complete all the basic file
management tasks. Trainers should be aware that participants are frequently unwill-
ing to admit gaps in their knowledge so an objective measure of their abilities should
be used rather than a reported measure.
The instruction in data management covers how to code open, closed and compound
questions. The principles underlying the data management topics are discussed, then
put into practice using SPSS and a range of both real and constructed data. Data
management is the topic of sessions 3 to 7. Data management is revisited in the last
two sessions, 12 and 13. Session 12 describes and demonstrates data cleaning. Session
13 discusses documentation. Data cleaning and documentation appear at the end of
the course as they require a fluency in SPSS and an understanding of the coding
process that is built up in the earlier stages of the course. A positive externality is
that these two topics provide reinforcement of the practical SPSS skills presented in
the course and can be used by the trainer to gauge the participants’ progress.
Data analysis is the topic of sessions 8 to 11. The focus is on description rather
than inference. Instruction is provided in describing single categorical and continu-
ous variables. Two types of bivariate analysis are mentioned. First, an informal com-
parison of statistics on a continuous variable for each of the categories of a nominal
variable. Second, cross-tabulation of categorical variables. For each of the topics, a
brief discussion of statistical principles is followed by hands-on practice.
The course has been tailored to the needs of the members of the drug information
focal groups. Where possible, examples relevant to the collection of drug use infor-
mation and the Annual Reports Questionnaire have been adopted. The level of the
training has been set to match the likely prior knowledge of the participants on the
basis of information provided by GAP regional epidemiological advisers and the expe-
rience of two pilot workshops in South Africa.
The course should be seen as the start rather than the end of the participants’ train-
ing in data management and analysis. Those attending the course are encouraged
to use the available “Help” facilities in SPSS to further develop their knowledge
independently. The course provides participants with the necessary skills to under-
take simple data management and analysis of drug use data and prepares the par-
ticipants for independent study and/or further instruction in inferential statistics
and more sophisticated statistical techniques.
Session 1. Introduction and welcome
The aim of session 1 is to present a preview of the course and put the participants
at ease.
The objectives of session 1 are as follows:
1. To introduce the trainer.
2. To introduce the participants.
10
GAP Toolkit Module 5 Training in basic drug abuse data management and analysis
11
Chapter II Introduction and notes on training sessions 2-13
3. To describe the nature and structure of the course.
4. To highlight the consequences of the heterogeneous nature of the partici-
pants.
5. To agree a set of rules for questions and participation in the course.
6. To deliver a short test.
Learning outcomes are not applicable for this session.
The first session differs greatly from the other sessions in that it is not centred
around a PowerPoint presentation or an exercise. Nevertheless, it is of great impor-
tance in ensuring the effective completion of the course. The participants are likely
to approach the first session with a certain amount of trepidation. Establishing a
common ground with the participants and a non-threatening environment is essen-
tial. It is generally the unknown that is discomforting, so the first session is designed
to allay many of the participants’ anxieties.
Introductions
Introductions answer the question of who is attending the course. They also pro-
vide an opportunity to gauge the abilities of the class.
The pattern adopted in the pilot courses was for the trainer to introduce himself or
herself first. The trainer’s introduction included a reminder that the need for train-
ing in basic data management and analysis was identified by the focal groups and
that the course was intended to meet this identified need. A basic outline of the com-
puting and statistical background of the trainer was given as a personal introduction,
effectively answering the question “Why should this person be offering the training?”.
Participants were asked to briefly introduce themselves and answer the following
three questions:
1. What was their role in the data collection/analysis/reporting process?
2. Did they have a computer on their desk at work and, if so, was it shared
with anyone else?
3. Did they use SPSS or MS Excel or any similar spreadsheet in their work?
The first question identifies the participant’s position in the focal group or wider
drug information network. The second question provides information on their com-
puter literacy and will guide the pace and, in some instances, the content of the
training. The final question is an indicator of the participant’s data manipulation
skills. Unfortunately, it is a very weak indicator, given the range of tasks that fall
under the category “Using Excel”. The term can mean the ability to add a column
of numbers or, equally, it could mean writing Visual Basic applications. Experience
suggests the former is the more appropriate interpretation.
12
GAP Toolkit Module 5 Training in basic drug abuse data management and analysis
Nature and structure of the course
A summary of the nature and structure of the course prepares the participants for
the days to come.
The points emphasized in the pilot courses were as follows:
1. The course is a practical course on using SPSS to complete basic data
management and analysis.
2. Perhaps most importantly, the course provides an opportunity for the par-
ticipants to undertake data analysis in a supportive environment. The course
is not a competition between the various focal groups and, in fact, should
prove to be a collaborative effort.
3. The course consists of expositions of topics built around PowerPoint pre-
sentations. The topics will be interspersed with short exercises to practise
the techniques demonstrated. The trainer will provide individual support
during the exercises. Once a number of techniques have been discussed, a
longer exercise will bring these together in a more realistic form.
4. The participants have access to the PowerPoint slides as notes, but should
also take their own notes, as appropriate.
Level of ability
Given the diverse backgrounds of individuals involved in IDIS, a range of comput-
ing and data analysis abilities in the group is highly probable, if not inevitable. At
the pilot workshops, there were individuals who had never used a computer before
and others who had degrees in computer science. Training groups of heterogeneous
ability can be complicated, but a little preparation will ease the process.
First, the attention of the participants should be drawn to the different levels of
ability in the group. Second, it should be explained that the goal of the course is
to help all of them improve. Those with little prior knowledge should be reassured
that the course starts from first principles and that they will be able to follow. The
help of the more experienced should be enlisted by acknowledging that some of the
topics will be familiar to them. The more experienced should be assured that not
all the topics will be familiar and should be encouraged to be patient and help their
neighbour when they already know a topic. The composition of the pilot workshops
suggests the trainer’s overriding concern should be to not leave anyone behind rather
than to cater for the few more experienced participants.

13
Chapter II Introduction and notes on training sessions 2-13
Class rules
Class management can be approached from a number of directions, ranging from
the collaborative to the authoritarian. However, establishing a set of rules or eti-
quette for the class will help the course run smoothly. Given that the participants
are professionals within their own fields, agreeing the rules with the participants is
appropriate. In the pilot workshops, the group freely accepted that engaging 12 to
16 participants in a discussion on statistics while they face the temptation of play-
ing with the computer in front of them required some framework or management.
The rules agreed were as follows:
1. While topics are being discussed or demonstrations presented, participants
should refrain from using the computers. The participants are expected to
watch the demonstration and then complete the exercise, aided if neces-
sary; participants should not try to complete the exercise while a demon-
stration is being made. The trainer should be flexible on the application
of this rule. Experience suggests that, regardless of any prior agreement,
participants will play with the computer while the trainer presents a topic
or demonstration. Participants with computer experience may well be able
to complete a task at the same time as the trainer. However, a problem
arises when participants complete one step but miss the next or fail to
complete a step and then are lost. The temptation is then to ask the trainer,
thus stopping the flow of the presentation. At this point, a judicious
reminder of the rules can help.
2. Participants are free to ask questions during the presentation of a topic or
a demonstration, provided that they are relevant.
3. Participants will try to exercise patience when waiting for the trainer to
help them individually during the exercises. Computer training is invari-
ably trainer-intensive as many of the problems are individual. Given the
class sizes, the participants must realize that there is going to be a delay
in getting the trainer’s attention. Class sizes should be kept to a maximum
of 14 participants to ensure that the trainer can devote sufficient time to
individual problems.
Pre- and post-test
One formal component of the first session is the completion of a pre-test. The pre-
test has a dual function: first, it is intended to help establish the level of skills of
the participants. Second, it is used as a measure of the efficacy of the course. The
same test is presented at the end of the course and the results are compared with
the pre-test.
The merit of this method is that it is easy to administer and therefore popular. The
weakness of the method is that the criteria for the questions are subjective. A pro-
14
GAP Toolkit Module 5 Training in basic drug abuse data management and analysis
posed pre-test is given in annex II, but it is envisaged that the trainers or their
employers will wish to set their own tests.
The following should be considered in constructing or evaluating a test: the partici-
pants are not expected to know SPSS and questions are thus limited to basic sta-
tistics and coding; any measurement of their computing skills is thus absent. The
time for the test is limited. Questions will, by their nature, need to be ones requir-
ing short answers. Finally, trainers should be aware that the comparison of the pre-
and post-test results is a very blunt measurement instrument.
In the training workshops, the tests were a cause of consternation for some partici-
pants. It is unfortunate that the pre-test has to be delivered in the first session as
it weakens the presentation of the course as a non-competitive forum. Nevertheless,
the first session is the appropriate point for a pre-test. Stressing the role of the pre-
test as a method of gauging the participants’ initial ability in order to tailor the
course to their needs should reduce any negative effects. Equally, describing the pre-
test as a measure of the course and the trainer rather than the participants should
reassure the participants.
To conclude, a couple of general observations: presenting the course as a collabo-
rative effort enhances the opportunities for the participants to learn from each other,
which is a large positive externality. Second, there is a tendency for participants to
expect a set of steps/thoughts/techniques that always generate a correct answer to
be presented. This cookbook approach to data analysis and statistics is of limited
use. The challenge is to present the topics as a toolbox, which can then be used to
solve the problems of data management and analysis.
Session 2. File management
The aim of session 2 is to establish a framework for storing files on a computer.
The objectives of session 2 are as follows:
1. To review the physical storage of information on a computer.
2. To review the referencing of storage mediums.
3. To describe the software partition of the storage space into directories.
4. To establish a taxonomy of files.
5. To review the file management facilities in Windows.
The learning outcomes of session 2 are summarized below:
1. An understanding of the hierarchical storage structure used in computers.
2. An understanding of file-naming conventions.
3. A familiarity with Windows Explorer, including the ability to complete the
following tasks:

15
Chapter II Introduction and notes on training sessions 2-13
• Adjusting the appearance of Windows Explorer
• Creating/deleting/moving directories
• Creating/deleting/moving files
• Using the “Find” facility to locate a lost file
4. Opening and saving files from a software package other than Windows
Explorer.
Session 2 contains three exercises for the participants to complete. The first covers
the use of Windows Explorer and changing its default appearance. The second prac-
tises the creation of directories through the construction of a hierarchy of directo-
ries to store the files created and used during the course. The third practises saving,
copying and finding a file and creating a shortcut on the desktop.
The storage system on a computer is a common source of confusion for both novice
and experienced computer users. This can result in files being “lost”, thus under-
mining the confidence of the user and encouraging the perception of a computer as
a black box whose mysterious, perhaps magical, workings defy logic.
In truth, computer storage is very logical. Once the logic of the storage space is
understood, use of the management tools becomes a matter of practice. The pres-
entation describes the hierarchical structure of storage on the computer at some
length and then reviews the various tools to manage the storage space.
It is tempting to argue that many participants will already possess the skills in this
session and that the session could be omitted from the course if the length of the
course needed to be reduced. However, the importance of these skills for effective
use of the computer suggests that the trainer would have to be certain of the par-
ticipants’ skills to omit this session. The skills that are described in this session
provide the foundations for the work that follows and are essential to the smooth
completion of the course.
The pilot workshops suggest that even those participants who profess a familiarity
with computers benefited from a review of the topics in the session. It proved invalu-
able for those with little or no experience and helpful for regular computer users.
On this basis, the session should only be omitted if the trainer is absolutely certain
that the participants are able to complete the tasks described
Session 3. SPSS data entry
The aim of session 3 is to introduce the SPSS user interface and outline the data
entry process.
The objectives of session 3 are as follows:

16
GAP Toolkit Module 5 Training in basic drug abuse data management and analysis
1. To describe opening and closing SPSS.
2. To introduce the look and structure of SPSS.
3. To introduce the data entry windows “Data View” and “Variable View”.
4. To outline the components necessary to define a variable.
5. To introduce the SPSS online tutorial.
The learning outcomes of session 3 include the following abilities:
1. To open SPSS.
2. To define a variable in SPSS.
3. To enter data from the keyboard into a defined variable.
4. To save an SPSS file.
5. To use the SPSS online tutorial.
Session 3 includes an extended example of defining variables, completed by the
trainer, and exercises on defining variables and entering raw, not coded, data.
This first session on SPSS acts as a general introduction to the software package
and establishes the framework for the data entry process. The session starts with a
description of how to open SPSS and of the screens that appear. It continues by
focusing on the data entry process. The “Data Editor” is defined as having two win-
dows, “Data View”, in which actual numbers are entered, and “Variable View”, in
which variables are defined. The remainder of the session concentrates on the var-
ious characteristics required by SPSS to define a variable, specifically: name, type,
width, decimals, label, values, missing, column, align and measure.
Session 3 is the first opportunity for the participants to try SPSS. It provides a taste
of the topics that are to follow. The definition of a variable is developed in sessions
4 to 6, in which taxonomies of variables and coding are discussed.
Trainers should be aware that the version of SPSS described in the course materi-
als is version 11. The principles presented are the same regardless of the version,
although some particular screens will differ. The participants should be told that
different versions of the software will have a slightly different appearance and dif-
ferent facilities in some instances.
Trainers should take the opportunity at this point to introduce briefly the SPSS
online tutorial. The online tutorial provides an excellent self-learning resource that
complements the course. Each presentation has a summary slide as the final slide,
outlining the topics covered. The notes for the summary slide contain references to
topics in the online tutorial that complement the presentation. Participants should
be encouraged to investigate these topics when they have any spare time; for exam-
ple, if they finish the exercises before the rest of the class.
17
Chapter II Introduction and notes on training sessions 2-13
Session 4. Types of question and types of variable
The aim of session 4 is to provide the participants with a framework for analysing
questions and variables.
The main objective of session 4 is to define a range of classifications for questions
and variables, including the following:
• Closed/open
• Factual/attitudinal
• Direct/indirect
• Dichotomous
• Multiple-response
• Levels of measurement
• Types of variation
• Discrete (categorical)/continuous
• Quantitative/qualitative
A second objective is to establish the use of levels of measurement in defining vari-
ables within SPSS.
The learning outcomes of session 4 are similarly twofold. First, participants should
be able to categorize a question or variable according to the classification described
under the main objective above. Second, participants should be able to define the
level of measurement for a variable within SPSS.
The exercises in session 4 reflect the learning objectives: exercise 1 is a discussion
of whether open or closed questions appear more frequently in the questionnaires
used by the focal groups. Some of the participants may not have dealt with ques-
tionnaires at the time of training, but the questionnaires used in Namibia (Namibia:
Treatment Data Collection Form, January-June 2002) or by the Caribbean Drug
Information Network (CARIDIN) can be used as examples (see annex III). Exer-
cise 2 asks the participants to describe the characteristics of 10 variables using the
taxonomies discussed. Exercise 3 involves defining the level of measurement for
the variables entered in SPSS in session 3.
The emphasis of this session is on principles rather than computer use. Establishing
a framework for analysing questions and variables will place the practical work of
coding and data analysis within a theoretical context.
The primary instrument of measurement used by the focal groups is the question-
naire. The responses to questions are held in variables. The information collected
must be processed, entered into a computer file and analysed. The ability to iden-
tify question and variable types will inform and facilitate this translation of a ques-
tionnaire into a data file.

18
GAP Toolkit Module 5 Training in basic drug abuse data management and analysis
The taxonomies presented prove useful both in the coding of questionnaires, (ses-
sions 5 and 6) and the choice of data analysis techniques (sessions 8 to 11).
The topic is somewhat confusing in that the categories of questions and variables
are not mutually exclusive and hence not tidy. For example, a categorical variable
can be nominal or ordinal. In both cases it will be discrete, taking a fixed number
of values. If nominal, it is a qualitative variable in that it varies in terms of some
quality defined by the categories. If ordinal, it can be quantitative or qualitative,
depending on the interpretation of the meaning of the ordering. The question gen-
erating the variable may be eliciting a fact or an attitude. The question may be
open/unstructured or closed/structured. However, even closed questions may have
an open component, in the form of an “Other” category. Despite the taxonomy’s
failure to result in mutually exclusive categories, an understanding of these concepts
is essential to effective data management and analysis.
Throughout session 4, participants should be encouraged to reflect on their own work.
Unlike many of the sessions, this topic can be usefully discussed by the group, with
participants reflecting upon the nature of the questions and variables in their own work.
Session 5. Coding closed questions
The main aim of session 5 is to investigate the coding of closed questions. Two
important subsidiary goals are as follows:
1. To establish the importance of non-response to the validity of estimates.
2. To stress the obligation of researchers to ensure the anonymity of respon-
dents.
The objectives of session 5 are as follows:
1. To explain the importance of assigning numbers to characteristics.
2. To establish a set of practical coding rules.
3. To construct a framework for recording missing values.
4. To introduce identification numbers as a method of ensuring the anonym-
ity of respondents, while maintaining a link between files and questionnaires.
The learning outcomes for session 5 include the following:
1. The ability to recognize open and closed questions.
2. An understanding of when to code closed questions, that is, to prepare the
codes for closed questions before delivery of the questionnaire and to set
out the codes on the questionnaire.
3. An understanding of the terms “mutually exclusive” and “collectively
exhaustive” and their relevance to coding.
4. The importance of differentiating between types of missing value and of
coding missing values before delivering the questionnaire.
5. An understanding of the importance and use of identification numbers.

19
Chapter II Introduction and notes on training sessions 2-13
6. How to generate a simple frequency distribution in SPSS.
7. How to declare value labels and missing values in SPSS.
8. How to delete and rename a variable in SPSS.
9. The use of “Drop” and “Keep” in SPSS.
The coding process, missing values and identification numbers are demonstrated
through detailed examples. The first exercise in session 5 requires the participants
to code the variables entered in the exercise in session 3. The second exercise
requires the participants to declare missing values for the variables entered in ses-
sion 3. Session 5 is followed by the first long exercise, exercise 1 on coding open
questions. Sessions 5, 6 and 7 can be seen as a group, covering coding closed ques-
tions, open questions and the related SPSS techniques. Sessions 5 and 6 provide
the participants with guidance and practice in coding open and closed questions.
They cover the underlying nature of the answers to these questions and the practi-
cal considerations in recording the answers in a data file. The emphasis in sessions
5 and 6 are the principles behind the coding. Session 7 concentrates on the SPSS
techniques necessary to put these principles into operation.
Session 7 focuses on the coding of closed questions. It starts with a discussion of
the rationale behind coding characteristics or categories into numbers. The basic
rules of coding are then established: the codes applied to a variable should be mutu-
ally exclusive, collectively exhaustive and consistent across variables. Finally, the
practical considerations of coding are discussed, in particular the necessary SPSS
techniques, the usefulness of pre-coding closed questions and the importance of
including the codes on the questionnaires.
Two subsidiary topics are introduced. The first is the importance of missing values
to the validity of any estimates. A framework for accounting for missing data is pre-
sented, including “not applicable”, “don’t know”, “refusal” and “missing”.
Participants are advised to pre-code the range of missing values, include them on
the questionnaire and instruct interviewers on how to record missing values during
the data collection process.
The second topic is the use of identification numbers to ensure anonymity and pro-
vide a link between computer files and the paper questionnaires. Anonymity and
informed consent are two of the foundations of research ethics. The identification
numbers should provide a means of ensuring the former, while maintaining a link
between the computer file and the paper questionnaire. This link will allow sus-
pected errors in the data file to be checked against the paper questionnaire and is
therefore integral to data quality.
Exercise 1. Coding a questionnaire
Exercise 1 and accompanying trainer’s notes appear in annex I.
The exercise requires the participants to code a questionnaire. The questionnaire used
is the Namibia: Treatment Data Collection Form, January-June 2002 (see annex III).
20
GAP Toolkit Module 5 Training in basic drug abuse data management and analysis
This extended exercise practises the skills learned up to and including session 5 and
replicates the type of task the participants are likely to face within their focal groups.
The participants should recognize which variables they can easily pre-code and which
they cannot code before the results of the questionnaire are available. Attention to
the definition of missing values is essential, as is the construction of an effective iden-
tification system to link the cases in the computer file to the paper questionnaires.
Of particular interest is the coding of multiple or compound questions. Multiple
questions appear frequently in the questionnaires used by the participants. Question
13 of the Namibia: Treatment Data Collection Form, January-June 2002, provides an
example of a multiple question. The interviewee is asked to list the top three drugs
used in order of greatest frequency and to check the methods (plural) of ingestion.
The question appears as one question on the questionnaire, but would require a
number of variables to be defined in the data file. Participants should be able to
recognize compound questions, understand the alternative coding schemes and be
able to construct the necessary number of variables within the data file to hold all
the information in the question.
The experience of the pilot workshops highlights the importance of hands-on prac-
tice of the techniques presented. Many of the participants had yet to engage in the
coding of a questionnaire and were somewhat dismayed at the time it took to com-
plete. It is useful to stress that the only way for them to identify problems in the
coding of a questionnaire is to learn the pitfalls by doing it themselves.
Session 6. Coding open questions
The aim of session 6 is to investigate the coding of open questions. Participants
should develop an understanding of the differing nature of open and closed ques-
tions and how that is reflected in the coding process.
The objectives of session 6 are as follows:
1. To distinguish between the coding of open and closed questions.
2. To establish a set of practical coding rules.
3. To describe standard coding schemes, in particular those required by the
Annual Reports Questionnaire.
The learning outcomes for session 6 include the following:
1. The ability to recognize open and closed questions.
2. An understanding of the constrained, structured response of a closed ques-
tion in comparison to the unconstrained, unstructured response of an open
question.
3. Recognition that closed questions can be coded prior to delivery of the
questionnaire, whereas open questions must be coded after the results have
been collected and before any analysis.

21
Chapter II Introduction and notes on training sessions 2-13
4. The importance of maintaining the highest level of measurement possible
when coding.
5. The flexibility of analysis made possible through recoding.
6. Coding and use of the “Other” category.
7. Coding drugs, age, time periods and modes of ingestion according to the
standard Annual Reports Questionnaire categories.
A number of examples of different types of open question are provided in the pres-
entation. The second extended exercise, exercise 2, to be completed directly after
this presentation, provides the participants with the opportunity to practise coding
open questions. Exercise 2 on coding open questions is described below.
Session 6 concentrates on the coding of open questions. The researcher is required
to apply his or her judgement in coding the unstructured answers to open ques-
tions. The nature of the response to an open question defines the complexity of the
coding task. Those questions eliciting paragraphs or even pages of text require sub-
stantial evaluation and painstaking attention to detail. Those resulting in a list of
mutually exclusive, collectively exhaustive values can be coded similarly to closed
questions, the difference being that the set of values are provided by the interviewee
rather than the interviewer.
Using pre-defined coding schemes will ensure the comparability of the data with
other sources in IDIS. Session 6 focuses on the standard categories for drugs, age,
time and mode of ingestion required for the Annual Reports Questionnaire. This
again mimics the practical tasks facing the participants.
Exercise 2. Coding open questions
Exercise 2 and the accompanying trainer’s notes appear in annex I.
Participants will need access to two data files in order to complete the exercise:
“Exercise2.sav” and “Ex2supp.sav”. These should be loaded into the directory called
“GAP/Data” (created in session 2) on the participants’ computers.
The second long exercise looks at coding an open question. The open question asks
the interviewee to report his or her first most frequently used drug, the second most
frequently used drug and the third most frequently used drug.
The question is quite simple, in the sense that the answers will be single drug names
rather than paragraphs or pages of text. Coding the answers is just a matter of decid-
ing on the best way to code a fixed list of drugs.
The task is complex in that the question requires three variables to hold the answers,
one for the first most frequently used drug, one for the second most frequently used
drug and one for the third most frequently used drug. For any given case, the first
drug must appear, drug use being the defining factor of administering the ques-
tionnaire. However, for any given case, the second and third drugs need not appear.
The interviewee may only take one problem drug.

22
GAP Toolkit Module 5 Training in basic drug abuse data management and analysis
The complexity is deepened by the absence of a coding scheme when the data were
entered into the data file. The drug names were entered directly into an alphanumeric
field. The data suffer from simple coding errors, such as misspelled drug names.
They suffer from data definition errors, in that commercial pharmaceutical names
and slang names are both used. They also suffer from conceptual errors, in that no
code appears to signify that no second most frequent drug or third most frequent
drug were specified by the respondent.
The data are messy but realistic. In fact, the data are real data collected by a drug
information network in Southern Africa. The data have been adjusted slightly to
ensure anonymity, but otherwise they are as received. The purpose of using these
data is to address the real problems that participants are likely to face in their focal
groups. These include making sense of messy information.
The exercise is to construct a reasonable coding scheme for the data. In terms of prac-
tical SPSS skills, in constructing the coding scheme, the participants must make use
of repeated frequency distributions and use two different files. In terms of conceptual
skills, the participants must use their knowledge to decide what are important cate-
gories. The need for flexibility, consideration of the Annual Reports Questionnaire
requirements and theoretical issues such as a desire to investigate a particular drug
will all need to be considered in deciding an appropriate coding scheme.
The participants are not required to construct a file for the data, but to develop a
coding scheme on paper.
Once the participants have attempted the exercise, the trainer should lead a dis-
cussion on how best to deal with data like these. Are there structures that could be
put in place to improve or avoid some of the problems that occur?
Handling missing values is a problem in this data set: the data do not distinguish
between types of missing value. A missing value is recorded as a blank. There are
a number of consequences. First, a simple technical problem: SPSS takes a blank
value in an alphanumeric field as a valid value. For example, SPSS counts the num-
ber of occurrences of a blank in a frequency distribution. The blank would have to
be coded as missing specifically or it will be included in the calculation of any sta-
tistics. Second, a conceptual problem: as a respondent does not need to report a
second or third most frequently used drug, it would have been desirable to have a
value defined for “Not applicable”, thus distinguishing between valid missing val-
ues and truly missing values. Third, an organizational problem: to improve the
reporting of missing values, a set of values has to be defined, set out on the ques-
tionnaire and the interviewers informed. There is little that can be done after the
questionnaire has been delivered.
The discussion on how to improve the administration of questionnaires proved par-
ticularly useful in the pilot workshops, raising the importance of planning in col-
lecting information.

23
Chapter II Introduction and notes on training sessions 2-13
Session 7. Recode and compute
The aim of session 7 is to introduce a range of SPSS techniques to implement the
coding rules discussed in sessions 5 and 6.
The objectives of session 7 are as follows:
1. To introduce and demonstrate SPSS tools for recoding variables and cre-
ating new variables.
2. To introduce and demonstrate the use of SPSS command syntax.
3. To introduce and demonstrate the dialogue box “Help” features in SPSS.
The learning outcomes of session 7 are as follows:
1. Use of the “Compute” facility in SPSS.
2. Use of the “Recode” facility in SPSS.
3. Opening, saving and writing to a syntax file.
4. Recoding a continuous variable into quantiles using the “Categorize”
facility.
5. A basic understanding of the “Explore” facility for continuous variables.
6. An understanding of how dates are stored in SPSS.
7. Using the standard “Help” facility in a dialogue box.
8. Using context-sensitive “Help”.
9. Using the “Syntax Guide”.
A number of detailed examples appear in the presentation. These cover recoding
into user-defined categories and recoding into quantiles. The file “Session 7
Examples.sav” should be loaded into the directory called “GAP\Data” (created in
session 2) on the participants’ computers. Participants have the opportunity to try
the various techniques in the completion of extended exercise 3, described below.
Session 7 focuses on SPSS techniques. The trainer should be prepared to illustrate
the techniques in SPSS and use the PowerPoint slides for reinforcement.
In particular, session 7 concentrates on recoding and creating new variables. Data
are seldom in the desired categories for analysis, even after careful coding. It is com-
mon to compute new variables and recode existing variables in preparation for data
analysis. The specific SPSS options covered include “Compute”, “Recode” and
“Categorize”, under the “Transformation” menu.
The opportunity is taken to introduce SPSS command syntax as an alternative to
using the Windows interfaces for SPSS. The main benefits are that there is a record
of any data manipulation and that the same task can be applied to different data
sets without the need to duplicate work. In addition, there are some commands with
options that only appear in syntax.
Three “Help” facilities are introduced in the presentation. Two “Help” options
are available from individual dialogue boxes: context-sensitive “Help”, obtained

24
GAP Toolkit Module 5 Training in basic drug abuse data management and analysis
by right-clicking on the appropriate part of the dialogue box; and the standard
“Help” facility, accessed through the “Help” button on the dialogue box. The
“Syntax Guide” is a third “Help” option, which provides detailed information
and examples of SPSS syntax.
Unfortunately, the “Syntax Guide” is not loaded as a matter of course when SPSS
is loaded. The trainer should ensure that the participants’ computers are loaded with
the “Syntax Guide”. On the SPSS installation CD, “Custom Installation” should be
selected and the box for the “Syntax Guide” should be checked. This is essential,
as it is not possible to use the SPSS syntax without access to the “Syntax Guide".
The SPSS “Help” facilities are introduced throughout the course, then brought
together in session 13. It is important that the participants recognize that they can
develop their expertise through the use of the “Help” facilities. Realistically, the
course can only start the participants on the road to developing expertise in these
areas. Practice and application after the course will improve the participants’ skills.
The “Help” facilities will be invaluable in any independent study.
Exercise 3
Exercise 3 and the accompanying trainer’s notes appear in annex I.
Participants will need access to three files in order to complete exercise 3, which is
itself in three parts. Part A requires the data file “Exercise2.sav” and the syntax file
“Recode and Label.sps”. “Exercise2.sav” should already be loaded into the “GAP/Data”
directory on the participants’ computers as it was used in exercise 2. The syntax files
can be stored on the participants’ computers in the directory called “GAP/Exercises”,
created in session 2. Parts B and C require the data file “Main.sav”, which, again,
should be loaded into the directory called “GAP/Data”. The syntax files to complete
parts B and C are “Ex3 qB1.sps”, “Ex3 qB2.sps” and “Ex3 qC.sps”. Ideally, these
should be provided to the participants after they have attempted the exercise.
Part A simply requires the participants to run a syntax file and examine the vari-
ables that have been created.
Part B practises recoding a continuous variable. First, a continuous variable is recoded
into quintiles. Second, the same variable is recoded into a set of fixed or previously
defined categories. The variable in this case is “Age” and the fixed categories are
the Annual Reports Questionnaire age definitions (see session 6, slide 14).
Part C practises the recoding of a categorical variable into a new set of categories.
In this case, it is the recoding of drug types into Annual Reports Questionnaire-
defined drug classes.
The exercise is intended to practise the skills presented in sessions 6 and 7 and
present participants with a realistic task. The following three general points should
be raised with the participants:
25
Chapter II Introduction and notes on training sessions 2-13
1. Missing values can frequently cause problems in recoding. The participants’
attention should be drawn in each case to how the missing values have
been handled and the benefits and costs should be discussed.
2. Errors can easily creep into the data during the recoding process. It is
important to impress upon the participants the importance of checking the
data after any recode.
3. The (ELSE=COPY) statement is preferred to (ELSE=SYSMIS) as the final
statement in the RECODE expression, as it retains the original values that
have not been recoded. ELSE=SYSMIS will convert any values not recoded
into systems missing, which can obscure errors.
The file “Main.sav” will be used from this point onwards for examples. The data
are for the first six months of 2001 and from treatment centres in Southern Africa.
The questionnaire is similar to the Namibia: Treatment Data Collection Form,
January-June 2002. The file has been kept largely as it was received in order to illus-
trate some of the pitfalls that arise when using real data.
By the end of exercise 3, the participants should have an understanding of con-
verting questionnaires into data files, coding open and closed questions, computing
new variables and recoding existing variables in SPSS, identification numbers, miss-
ing values, syntax files and basic “Help” facilities. They will have been introduced
to frequency tables and the “Explore” facility in passing.
This marks the completion of the main data management component of the course.
Data management does not return until sessions 12 and 13, in which data cleaning
and documentation are discussed. The following four sessions, sessions 8 to 11, are
concerned with data analysis.
Session 8. Data analysis: frequencies
The aims of session 8 are to introduce descriptive statistics for a single categorical
variable and to encourage the participants to consider how best to explore and pres-
ent data.
The objectives of session 8 are as follows:
1. To introduce univariate, descriptive statistics as the first step in a process
of data analysis, starting from exploration and moving towards more sophis-
ticated techniques.
2. To distinguish between frequencies and relative frequencies.
3. To introduce frequency and probability distributions as data models.
4. To reinforce the use of SPSS syntax.
The learning outcomes of session 8 are as follows:
1. Calculating proportions and percentages.
2. Constructing a frequency distribution in SPSS.
26
GAP Toolkit Module 5 Training in basic drug abuse data management and analysis
3. Formatting a frequency table in SPSS to improve clarity.
4. Displaying the information in a frequency distribution as a bar chart, a pie
chart and a histogram and distinguishing which is appropriate.
5. Generating statistics for nominal data.
The exercises in session 8 involve constructing, formatting and graphing frequency
distributions in SPSS. The emphasis is on trying to understand or explore the data
using statistical tools. The variables investigated in the exercises are referral source,
race, level of education and employment.
Session 8 describes the SPSS facilities for summarizing a single categorical variable
and how these measures are used to understand the data. The options available in
creating a frequency distribution or graph are covered in detail
The participants are likely to use frequency counts extensively in their work. The
data collected are primarily categorical and the drug information networks’ main pur-
pose at this stage is description. Frequency counts are ideal for this purpose,
although care has to be taken in deciding how best to present the data. Participants
are encouraged to think of the statistics as evidence for an argument.
Session 9. Data analysis: “Explore”
The aim of session 9 is to introduce descriptive statistics for variables with an inter-
val or ratio level of measurement. The focus is on continuous data. Ordinal data can
be considered continuous when the distance between the categories is assumed to
be measurable and they are discussed in this context. In a move towards bivariate
analysis, the relationship between a continuous dependent variable and a categori-
cal independent variable is considered.
The objectives of session 9 are as follows:
1. To define a standard set of descriptive statistics used to analyse continu-
ous variables.
2. To examine the “Explore” facility in SPSS.
3. To introduce the analysis of a continuous variable according to values of a
categorical variable as an example of bivariate analysis.
4. To introduce the available “Help” for interpreting SPSS output.
5. To reinforce the use of SPSS syntax.
The learning outcomes of session 9 are as follows:
1. An understanding of the most common measures of central tendency and
their application.
2. An understanding of the most common measures of dispersion and their
application.
3. An understanding of the common measures for the shape of a distribution.
4. An appreciation of the effect of outliers and skew on the standard descrip-
tive statistics.

27
Chapter II Introduction and notes on training sessions 2-13
5. The ability to generate a standard set of summary statistics for a continu-
ous variable using the “Explore” facility in SPSS.
6. The ability to generate a standard set of summary statistics for a continu-
ous variable for each value of a factor (a categorical variable) using
“Explore".
7. The ability to generate and interpret histograms and box-plots.
8. The ability to use the “Results Coach” and “Case Studies” to aid in the
interpretation of SPSS output.
Numerous examples and exercises of generating statistics for continuous variables
are included in the presentation. An exercise on using the output “Help” facilities,
the “Results Coach” and “Case Studies” also appears in the presentation.
Session 9 describes the equations used in calculating a basic set of descriptive sta-
tistics for a continuous variable. It goes on to demonstrate how to generate these
statistics in SPSS and finally makes some suggestions and gives warnings on the
interpretation of these statistics.
The participants must understand how the various statistics are calculated if they
are to use them appropriately. It is not much use illustrating how to generate a
range of statistics in SPSS if the participants do not know what these statistics rep-
resent. A view of the computer as a black box out of which magical numbers appear
is to be avoided. Hence, the session starts by describing the various formulas for
the standard statistics that SPSS generates to describe a continuous variable. The
session continues by demonstrating how to generate the standard summary statis-
tics in SPSS, providing opportunities for the participants to gain hands-on practice.
Finally, more general issues of data analysis, such as the effect of the shape of a
distribution on the appropriateness of various statistics, are discussed.
As in session 7, new “Help” options are introduced. In this session, the “Results
Coach”, used to aid the analysis of SPSS output and case studies providing exam-
ples of the analysis of SPSS output are discussed. Both are accessed through the
quick menu obtained by right-clicking the output.
Session 9 includes the first foray into bivariate analysis. The use of “Explore” to
generate statistics for a continuous variable for each of the categories of a categor-
ical variable is described. A comparison of the statistics is the simplest form of inves-
tigating whether the values of the categorical variable affect the continuous variable.
The participants are encouraged to start thinking about how the relationship between
variables can be measured.
Session 10. Table manners
The aim of session 10 is to investigate methods of presenting statistics concisely,
coherently and with sufficient information for the audience to evaluate their

28
GAP Toolkit Module 5 Training in basic drug abuse data management and analysis
validity. The session consists of two parts. The first is a discussion of the informa-
tion that should be provided as a matter of course on any statistical output. The
second is a description of how to put these principles into practice by editing the
output in the SPSS “Output Viewer”.
The objectives of session 10 are as follows:
1. To define the common terminology used to evaluate survey data.
2. To establish the information that should be reported with the data, whether
the data take the form of a table, a graph or numerical summaries.
3. To introduce the “Output Viewer” in SPSS.
4. To describe formatting charts and tables.
The learning outcomes of session 10 are as follows:
1. An understanding of reliability, validity and generalizability.
2. The importance of titles, data sources, variable definitions and units.
3. The importance of providing information on the data collection procedure,
including sampling methods.
4. Competence in using the “Output Viewer” in SPSS.
5. The ability to format tables and charts in the “Output Viewer”.
6. The ability to copy output from SPSS to other software packages.
The examples and exercises in session 10 cover saving, retrieving, formatting and
annotating output files. Simple frequency tables and a bar chart are used to illus-
trate the formatting techniques in the presentation, but the principles hold for all
types of output.
Much of session 10 draws on two extremely useful and accessible books. The title
of the session, “Table manners”, and much of the content has been adapted from
a book on exploratory data analysis by Catherine Marsh, entitled Exploring Data: An
Introduction to Data Analysis for Social Scientists [2]. The second source is a simi-
larly clear book on statistics by David S. Moore, entitled Statistics: Concepts and
Controversies [3]. The book by Moore is now in its fifth edition. Both of these
authors have the enviable ability to make the complex appear simple.
A session on output is appropriate at this point in the course. Having managed and
described a data set, the logical next step is to present the results in a clear and
coherent fashion.
Session 10 depends heavily on the trainer illustrating the various formatting tech-
niques. Slides illustrating the techniques are provided in the session, making for a
particularly large presentation, but the emphasis should be on the trainer using SPSS
to demonstrate the techniques and using the slides as support.
SPSS provides myriad ways of formatting output. Time only allows the most com-
mon techniques to be presented. Participants should be encouraged to investigate
the range of facilities available in SPSS independently, using the online “Help” and

29
Chapter II Introduction and notes on training sessions 2-13
tutorials for support. The presentation introduces the formatting techniques and
hopefully will encourage the participants to investigate the formatting options when
they require them for their work.
Session 11. Data analysis: cross-tabulation
The aim of session 11 is to consider how to describe the relationship between two
categorical variables. The technique adopted is a simple cross-tabulation. This tech-
nique will have a wide application in the work of the drug information networks,
given that the majority of variables collected by these networks is categorical.
The objectives of session 11 are as follows:
1. To introduce cross-tabulation as a method of investigating the relationship
between two categorical variables.
2. To describe the SPSS facilities for cross-tabulation.
3. To discuss a range of simple statistics to describe the relationship between
two categorical variables.
4. To reinforce the range of SPSS skills learnt to date.
The learning outcomes of session 11 are as follows:
1. Recognition of the need to investigate each of the variables individually
before attempting a bivariate analysis.
2. An understanding of marginal, joint and total frequencies.
3. The use of row, column and total percentages in analysing a cross-
tabulation.
4. An understanding of relative risks, odds and odds ratios for two-by-two
tables.
5. The ability to generate cross-tabulations and associated statistics and graphs
within SPSS.
The presentation for session 11 is built around an extended example of investigat-
ing the relationship between “Gender” and “Mode of ingestion”. The example meets
the practical requirements of illustrating the various techniques of showing a rela-
tionship between two categorical variables. That gender influences the mode of inges-
tion is not necessarily a defendable research hypothesis, given that “Type of drug”
is likely to be an intervening variable. However, this can be used in the presenta-
tion to discuss elaboration, the development of an understanding of the causal rela-
tionship between two variables on the basis of introducing additional variables [4].
The trainer can decide whether to develop a discussion of elaboration, given the
available time and level of expertise of the participants.
The data are found to contain invalid entries, as would be expected from real data
that have not been cleaned. Participants are encouraged to consider how best to
30
GAP Toolkit Module 5 Training in basic drug abuse data management and analysis
handle the invalid data values and referred to session 12 on data cleaning. As this
is an exercise and the original questionnaires are not available, the data have been
recoded as out-of-range. The syntax file containing the necessary instructions is
“Clean Mode1.sps”.
Exercises include generating a number of cross-tabulations, recoding variables and
generating and interpreting relative risk values and odds ratios. The syntax file
“Whitepipe.sps” contains the necessary commands to generate a dichotomous vari-
able indicating whether or not white pipe is reported as the main drug of use. The
syntax file “Ex3 QB2.sps” can be used to establish Annual Reports Questionnaire
age categories for the final exercise.
Session 11 considers cross-tabulation as a method of establishing the relationship
between two categorical variables. Cross-tabulation extends the frequency distribu-
tions for a single variable to more than one variable. It is appropriate for nominal
and ordinal levels of measurement as it is based on counting the number of cases
within the combined categories of the variables. Relative risk and odds ratios are
introduced as summary measures of the relationship between two dichotomous cat-
egorical variables.
As the end of the course approaches, the participants are expected to complete the
tasks covered in the course to date without prompting. This should reinforce the
skills presented so far and provide an opportunity for the trainer to evaluate the
participants’ progress and review any topics that are unclear.
This brief foray into bivariate analysis brings to an end the data analysis compo-
nent of the course. Participants have been introduced to descriptive statistics for
continuous and categorical variables and a number of associated graphs. Two types
of bivariate analysis were discussed. First, the informal comparison of descriptive
statistics for a continuous variable at different levels of a categorical variable.
Second, the use of cross-tabulation to describe the relationship between two cate-
gorical variables.
The remaining two sessions return to data management. The participants should
now be comfortable using SPSS and the final sessions make use of their new
abilities.
Session 12. Data cleaning
The aim of session 12 is to describe and practise the common methods of remov-
ing errors from the data. The goal should be to have a data file that contains only
valid values. These values may include missing values in their various forms, but no

31
Chapter II Introduction and notes on training sessions 2-13
undefined values should appear in the data file. Data cleaning should be undertaken
before any data analysis. Discussion of data cleaning has been delayed until the end
of the course as it requires the participants to use many of the SPSS techniques
covered earlier in the course.
The objectives of session 12 are as follows:
1. To establish methods of uncovering coding errors.
2. To discuss techniques for implementing logical tests.
3. To present methods of selecting cases.
4. To reinforce the SPSS skills presented to date.
The learning outcomes of session 12 are as follows:
1. An understanding of the Boolean operators AND and OR.
2. An understanding of the types and sources of error that can occur in a
data file, that is, logical and coding errors, data entry, the coding scheme,
interviewer error, and so forth.
3. The ability to locate out-of-range values in the data set.
4. The ability to set up simple logical tests across variables.
5. The SPSS techniques necessary for selecting cases and generating statistics
on subsets of data.
6. The ability to generate reports in SPSS.
The exercises and examples of session 12 illustrate locating and correcting invalid
entries in both categorical and continuous variables. An example selects cases on
the basis of the values in the “Age” variable. The syntax for the example is found
in “Select Cases Age.sps”. Conditional statements are used in a “Compute” com-
mand to set up a logical test to ensure no duplication of drugs in the variables
“Drugs1”, “Drugs2” and “Drugs3”. The code for the test appears in the syntax file
“Clean Logic.sps".
Session 12 concentrates on convincing the participants of the importance of clean-
ing the data and demonstrating common methods of identifying errors in the data.
Any analysis is only as good as the data it is based upon. In addition, removing sim-
ple errors will also ease the analysis process. Invalid entries generate confusion in
the standard numerical summaries and tables.
The principle message is that, where errors occur, an effort should be made to uncover
the correct value. This may involve simply returning to the paper questionnaire. In
more extreme cases it may involve returning to the interviewer or interviewee. Care
must be taken before recoding any errors to missing as this can distort the data.
The data cleaning process can delay the analysis, but is essential for validity.
Unfortunately, the paper questionnaires on which the data are based are not avail-
able. The process of checking the questionnaire cannot be demonstrated, but should
be easy enough for the participants to comprehend through description.

32
GAP Toolkit Module 5 Training in basic drug abuse data management and analysis
The exercises require participants to use many of the SPSS skills learned earlier in
the course. It is therefore an ideal opportunity to reinforce these skills. By this point
in the course, the participants should be conversant with recoding, computing new
variables, frequency distributions, summary statistics and cross-tabulation. The par-
ticipants should be encouraged to complete the exercises with a minimum amount
of instruction. Only once the exercises have been attempted should the trainer review
the topics.
A number of new SPSS techniques are introduced during the presentation. The use
of Boolean statements to select cases is demonstrated, using the “Data\Select cases”
menu options. The participants should be told that the use of Boolean statements
in SPSS stretches to a number of dialogue boxes, not only the “Select cases” menu
option. For example, the “Compute” command also uses Boolean statements. The
use of the “Reports” facility to generate lists of cases and quick methods of locat-
ing an individual case are demonstrated.
Data cleaning falls within data management. The importance of thorough data man-
agement before undertaking serious analysis should be impressed upon the partici-
pants once again.
Session 13. Documentation and “Help"
The aims of the thirteenth and final session are twofold. First, to investigate the
need for and the methods of constructing documentation. Second, to encourage the
participants to use the SPSS “Help” facilities to develop their knowledge of data
analysis and management.
The objectives of session 13 are as follows:
1. To establish the importance to professional research of thorough
documentation.
2. To describe the SPSS facilities for documentation.
3. To describe the range of “Help” facilities available in SPSS.
The learning outcomes of session 13 are as follows:
1. An understanding of the components of a code book.
2. An awareness of the use of the SPSS journal file and SPSS syntax files in
the documentation process.
3. The ability to print out the definitions of the variables in a data file.
4. A familiarity with the range of “Help” facilities in SPSS and their use.
The SPSS facilities for documentation and “Help” are explored using examples.
The trainer should illustrate the facilities in SPSS, using the PowerPoint slides for
reinforcement.

33
Chapter II Introduction and notes on training sessions 2-13
Thorough documentation is essential to professional research. Documenting work
often appears as an irrelevant additional chore in the heat of the coding process.
The data management decisions appear obvious when one is in the middle of com-
pleting them. However, long periods of time frequently intervene between the ini-
tial data management and the data analysis. Clear documentation is invaluable when
returning to a data set. It should be possible to return to a data set at any time
and piece together the steps that have been taken in data management using the
documentation. Equally, when constructing a report, the documentation provides the
raw material for describing the data management process.
The “Help” facilities in SPSS provide the opportunity for participants to develop
their SPSS and statistical expertise independently. A short course can, at best, intro-
duce topics and provide a structure to the learning process. The participants should
be made aware that the course represents the beginning of the development of the
participant’s expertise in data management and analysis, not the end.


Annex I
35
Model student questionnnaire:Exercises 1, 2 and 3
Exercise 1. Coding a questionnaire
Exercise 1 is designed to provide an opportunity to practise the skills pre-
sented in the course up to the end of session 5.
The task is to construct an SPSS data file to hold the information collected
through the Namibia: Treatment Data Collection Form, January-June 2002,
which is reproduced in annex III, together with guidelines for filling it in.
Suggestions:
• At the present time no data has been collected, so only
“Closed” questions can be fully coded
• To prepare the file for “Open” questions, alphanumeric vari-
ables should be constructed to contain the written respon-
ses on the questionnaire
• Identifying the type and level measurement of the variable
will help in deciding which variables need to be coded and
which do not
• The trainer should make notes of any queries that arise dur-
ing the exercise
Trainer’s notes for exercise 1
Trainers should be wary of being overcritical. It is far easier to criticize some-
one else’s questionnaire than to construct one’s own. The focal groups will
frequently be the recipients of data rather than involved in direct data col-
lection, which makes this a realistic exercise. The notes below make sugges-
tions for each of the questions. Many of these are value judgements and are
open to criticism and elaboration.
Identity (ID) number. There is space for an ID number at the bottom right
of the questionnaire. A four-digit numeric field for the ID number should
appear as the first variable in the file. Each value must be unique and there
should be no missing values.

36
GAP Toolkit Module 5 Training in basic drug abuse data management and analysis
1. Interviewer’s initials. A two-digit alphanumeric field will hold this information. The level
of measurement is nominal. There will be a discrete, countable number of entries. If there
are a limited number of interviewers, coding would reduce errors and speed up the process.
As an alphanumeric variable, if a missing value is indicated by a blank entry, set the blank
entry as a user missing value.
2. Date form completed. A date variable. The instructions declare the format as
Day/Month/Year. It would be better if this were included on the questionnaire. The data will
be continuous and not require coding. Leave blank for missing. Date variables are numeric
variables so a blank will be seen as a missing value and be replaced by the SPSS system’s
missing value (.).
3. Name of treatment centre. The level of measurement is nominal. The question is an open
question. If there are a limited number of treatment centres, code and construct a numeric
field to hold the codes. If the actual names are to be entered, construct an alphanumeric field
of at least size 20. If using a numeric variable and coding, declare a missing value such as
99. If an alphanumeric variable is being used and a missing value is indicated by a blank
entry, set the blank entry as a user missing value.
4. Referral source (X one only). A two-digit numeric field will hold this information. The
level of measurement is nominal. The resulting data will be categorical. The question is closed
and requires coding. The codes appear on the questionnaire. “Unknown” is coded as 10. The
codes should include “11=Other”. Declare 99 as a missing value. Construct an alphanumeric
variable to contain the contents of the “Other (specify)” category.
5. Gender. A one-digit numeric field will hold the information. The data result in a dichoto-
mous nominal variable. With only two categories, it should be coded, arguably using 0 and
1 as the codes. Declare 9 as a missing value.
6. Age. This is presumably in years, although there is no indication in the instructions
other than to check the respondent’s identification card. Calculating “Age” puts an onus on
the interviewer and interviewee. “Date of birth” may be a more appropriate question, although
in the developing world date of birth is subject to error. A two-digit numeric field would be
sufficient to hold “Age” in years. With so many possible answers, coding is not necessary.
Leave blank for missing and thus use the SPSS system’s missing value.
7. Home language. An alphanumeric of 20 characters minimum would allow the informa-
tion to be typed in. This is an open question. It would be worth considering what responses
are likely and changing the question into a coded question with an “Other” category. Leave
blank for missing.
8. Region of permanent residence. An alphanumeric of 20 characters minimum would allow
the information to be typed in. This is an open question although again it should be possi-
ble to anticipate the regions and code accordingly. Leave blank for missing and use the SPSS
system’s missing value.
9. Highest level of education completed. A one-digit numeric would hold the information.
This is a closed question which has been pre-coded with the codes on the questionnaire. The
number 9 should be declared as a missing value. No “Other” category appears.
10. Employment status. A two-digit numeric field would hold the information. This is a closed
question which has been pre-coded with the codes on the questionnaire. Code as on the sheet
for 1 to 9. “9=Other”. Declare 99 as missing. Construct an alphanumeric variable with a min-
imum of 20 characters to contain the contents of the “Other” field.
11. Current marital status. A one-digit numeric field will hold the information. This is a
closed question that has been pre-coded with the codes on the questionnaire. Code as on the
37
Annex I Model student questionnaire
sheet with “7=Other”. Declare 9 as a missing value. Construct an alphanumeric variable with
a minimum of 20 characters to contain the contents of the “Other” field.
12. Indicate type of treatment patient received. A one-digit numeric field will hold the infor-
mation. This is a closed question that has been pre-coded with the codes on the question-
naire. No “Other” category, as the options are exhaustive. Declare 9 as a missing value.
13. Indicate primary substance of abuse ... and the mode of ingestion. This is a multiple-
response or compound question and by far the most interesting in terms of constructing the
data file. There are three open questions, for the first, second and third most frequently used
drugs. These should be declared as alphanumeric, with a minimum of 25 characters.
Each of the drug variables has a mode of ingestion associated with it. The mode of ingestion
is a multiple-response variable and converts to five dichotomous variables: “Swallow”,
“Smoke”, “Snort”, “Inject” and “Other”. The dichotomous variables are one-digit numeric,
with “0=No” and “1=Yes”. No missing values are needed as the options are exhaustive.
Each of the drug variables will potentially take a non-listed mode of ingestion, written in the
“Other” category. An alphanumeric field with a minimum of 20 characters is required for the
“Other” mode of ingestion for each drug.
To recap: three alphanumeric variables for the open question on drug of use; five dichotomous
closed variables for each drug of use, one-digit numeric; one alphanumeric variable for each
drug of use to hold the “Other” category. The question generates 21 fields in the data file.
As this information is likely to be aggregated, it is essential to ensure that the coding is iden-
tical for each drug of use.
14. How old was the patient when he or she first began using alcohol regularly? See ques-
tion 6 (Age) above.
15. How old was the patient when he or she first began using other drugs regularly? See ques-
tion 6 (Age) above.
16. Has the patient ever been in treatment prior to this episode? A one-digit numeric field
will hold this information. Code as on the sheet. Declare 9 as a missing value.
17. What source(s) will be used to cover treatment expenses? (X all that apply) Again, a
multiple-response question. Declare 10, one-digit, numeric fields and code “0=No”, “1=Yes”.
An alphanumeric field with a minimum of 20 characters should be declared to hold the con-
tents of the “Other” category, if it appears.
Exercise 2. Coding open questions
Working with real data is seldom as straightforward as theory or textbook examples make it
appear. The advice of theory provides the guidelines for difficult decisions, not solutions for
every eventuality. Real data often present problems that do not appear in the textbooks.
The drug information networks will be collecting information from a disparate number of
sources and may not always be involved in the various stages of the data collection process.
The questionnaires may have already been written and delivered. The data may have been
entered into a data file according to an unknown or ill-defined plan. The coding system may
be obscure.

38
GAP Toolkit Module 5 Training in basic drug abuse data management and analysis
Nevertheless, the data may contain useful information that justifies the effort to extract it.
In addition, the only way to get to know a data set is to work with it, headaches and all.
Anonymity is an essential consideration in using real data, but, as this is simply an exercise,
only a limited amount of background information on the data is given here and so preserva-
tion of anonymity is not a primary concern. The exercise looks at data collected in the
Southern African region. The data consist of information from 23 treatment centres located
in one region of a country and cover the first six months of 2001. The data were collected
using a form similar to the Namibia: Treatment Data Collection Form, January-June 2002.
Question 13 was identical to question 13 of the Namibia: Treatment Data Collection Form,
that is, three open questions on the first, second and third most frequently used drug.
A file has been constructed containing information on these drugs and an ID number. The
variables “Drug1”, “Drug2” and “Drug 3” contain the information on first, second and third
most frequently used drug. The data file is called “Exercise2.sav” and will be made available
by the trainer.
1. Start by creating frequency distributions of the three drugs. Comment on the results.
The frequency distribution is obtained through the menu option “Analyze/Descriptives/
Frequencies”. Move “Drug1”, “Drug2” and “Drug3” from the left-hand column into the box
on the right by highlighting the variable name and clicking the right-pointing arrow.
There are clearly problems here. The immediate comment is that the drug fields are alpha-
numeric. The contents of the questionnaire have been typed into the field. No codes have
been used. This results in the following problems for analysis:
(a) Far more categories appear than necessary. Spelling errors account for some of
these. Looking at the frequency distribution for “Drug2”, it is a reasonable assump-
tion that “Codeine”, “Codein”, “Codien” and “Codin” are all “Codeine”. The com-
bination of medical and slang names for various drugs adds to the confusion.
Again, “Drug2” lists “crack” and “rocks”. Care has to be taken to avoid falsely
correcting information and, in this case, there is some ambiguity in that heroin
may also come in rocks. It would be necessary to edit the file, correcting obvious
spelling mistakes and checking back to the questionnaires on certain drug types.
This would be a long, painstaking task requiring care and attention;
(b) As an alphanumeric field has been used, there is no default code for missing val-
ues. A blank space is counted as a valid value. Looking at the first row of the fre-
quency distributions of “Drug2” and “Drug3”, a blank space appears next to a
number. For “Drug2” the number is 907 and for “Drug3” the number is 1244.
This is as would be expected. The second and third most frequently used drugs
are more likely to be left unanswered as individuals may not regularly take a sin-
gle type of second or third drug. “Drug1” must be completed as the whole pur-
pose is to collect information on drug use and, if “Drug1” were empty, there would
be no record of drug use;
(c) When defining the width of the field, not enough space was left for the entries
and, for many, the ends of the words have been cut-off.
Commenting on the frequencies, there is a total of 1,570 cases. Of these, most fall within a
handful of major drugs. The remainder are primarily prescription drugs with one or two respon-

39
Annex I Model student questionnaire
dents. This suggests that in the coding, “Prescription drugs” and an “Other” category may
be useful.
Establishing a set of codes for anticipated drugs before the questionnaire was completed would
have avoided many of the spelling mistakes and vague classifications here. However, the infor-
mation is available, just not coherent.
The first step would be to clear up the most obvious errors in the data file. This takes a sub-
stantial amount of time and has been done, the new drug variables being “Drug12”, “Drug22”
and “Drug32”. The alphanumeric fields are retained, the obvious errors edited. If this were a
real analysis rather than an exercise, the questionnaires would have to be available for cross-
checking. In addition, this would need to be done by a researcher with knowledge of the
drugs and the project, not a typist.
2. Devise a coding scheme for the variables “Drug12”, “Drug22” and “Drug32".
A consideration is that the same coding scheme should be used for all three variables. The
variables are all measuring drugs and as a matter of consistency they should be assigned the
same codes. In addition, assigning the same codes will allow the variables to be grouped at
a later point to obtain frequency distributions on all drugs without restructuring the file.
To aid the coding process, an additional file, entitled “Ex2supp.sav”, has been created. This
file contains three variables: “ID": the original ID of the case from which the value in “trans1”
is taken; “Index": the name of the variable from which the value in “Trans1” is taken, that
is, “Drug12”, “Drug22” or “Drug32"; and “Trans1": this contains all the drugs used, that is,
all the entries in “Drug12”, “Drug22” and “Drug32".
A frequency distribution of “Trans1” displays the occurrence of all drugs used.
When deciding on a coding scheme, the following considerations are necessary:
(a) Retain as much information as possible. Recoding to a lower level of detail is pos-
sible. Recoding to a greater level of detail is not possible without additional infor-
mation. For example, it is easy to recode ages into age categories; it is not possible
to recode age categories into specific ages;
(b) Bear in mind the requirements of the Annual Reports Questionnaire. It does not
make sense to code dagga (marijuana herbal) with hashish when the Annual
Reports Questionnaire requires individual listings for both of these;
(c) The frequency of occurrence of the drug indicates its importance in the local con-
text. It does not make sense to combine white pipe and Mandrax for convenience
as important information on the local drug situation is lost.[[new page here please
Trainer’s notes for exercise 2
Exercise 2 requires “Exercise2.sav” and “Ex2supp.sav” to be loaded onto the students’ com-
puters, preferably in the directory called “Exercises".
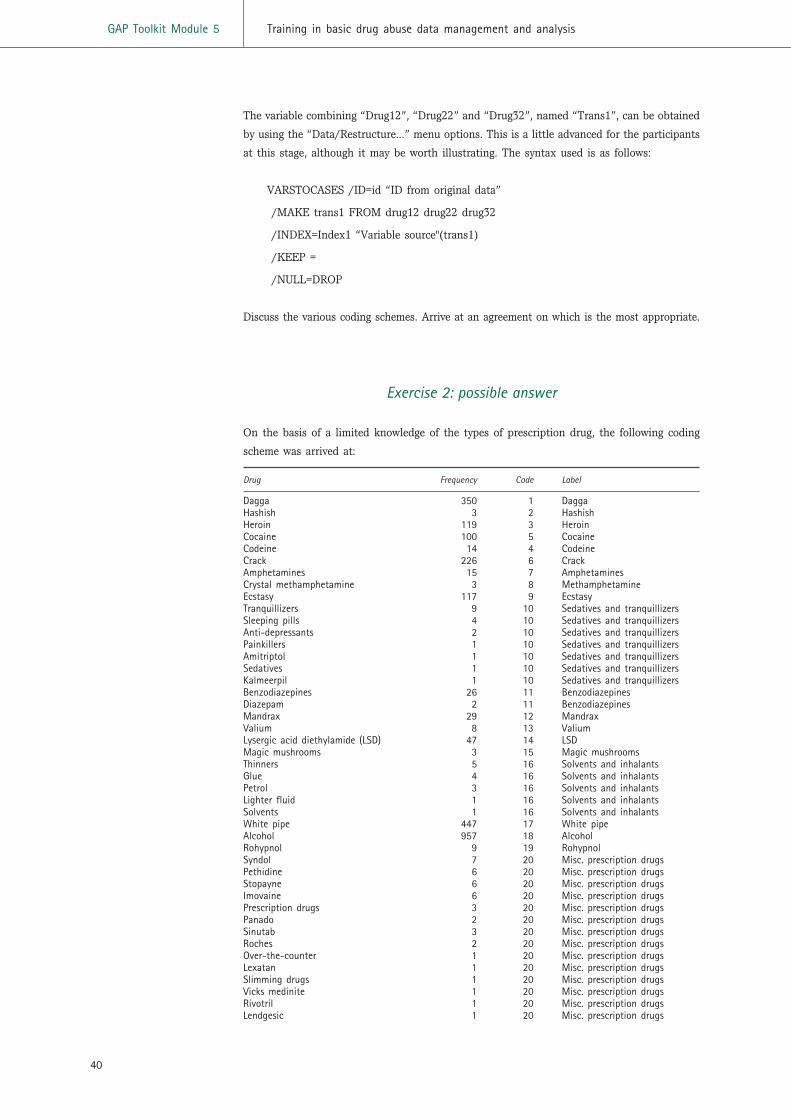
40
GAP Toolkit Module 5 Training in basic drug abuse data management and analysis
The variable combining “Drug12”, “Drug22” and “Drug32”, named “Trans1”, can be obtained
by using the “Data/Restructure…” menu options. This is a little advanced for the participants
at this stage, although it may be worth illustrating. The syntax used is as follows:
VARSTOCASES /ID=id “ID from original data”
/MAKE trans1 FROM drug12 drug22 drug32
/INDEX=Index1 “Variable source"(trans1)
/KEEP =
/NULL=DROP
Discuss the various coding schemes. Arrive at an agreement on which is the most appropriate.
Exercise 2: possible answer
On the basis of a limited knowledge of the types of prescription drug, the following coding
scheme was arrived at:
Drug Frequency Code Label
Dagga 350 1 DaggaHashish 3 2 HashishHeroin 119 3 HeroinCocaine 100 5 CocaineCodeine 14 4 CodeineCrack 226 6 CrackAmphetamines 15 7 AmphetaminesCrystal methamphetamine 3 8 MethamphetamineEcstasy 117 9 EcstasyTranquillizers 9 10 Sedatives and tranquillizersSleeping pills 4 10 Sedatives and tranquillizersAnti-depressants 2 10 Sedatives and tranquillizersPainkillers 1 10 Sedatives and tranquillizersAmitriptol 1 10 Sedatives and tranquillizersSedatives 1 10 Sedatives and tranquillizersKalmeerpil 1 10 Sedatives and tranquillizersBenzodiazepines 26 11 BenzodiazepinesDiazepam 2 11 BenzodiazepinesMandrax 29 12 MandraxValium 8 13 ValiumLysergic acid diethylamide (LSD) 47 14 LSDMagic mushrooms 3 15 Magic mushroomsThinners 5 16 Solvents and inhalantsGlue 4 16 Solvents and inhalantsPetrol 3 16 Solvents and inhalantsLighter fluid 1 16 Solvents and inhalantsSolvents 1 16 Solvents and inhalantsWhite pipe 447 17 White pipeAlcohol 957 18 AlcoholRohypnol 9 19 RohypnolSyndol 7 20 Misc. prescription drugsPethidine 6 20 Misc. prescription drugsStopayne 6 20 Misc. prescription drugsImovaine 6 20 Misc. prescription drugsPrescription drugs 3 20 Misc. prescription drugsPanado 2 20 Misc. prescription drugsSinutab 3 20 Misc. prescription drugsRoches 2 20 Misc. prescription drugsOver-the-counter 1 20 Misc. prescription drugsLexatan 1 20 Misc. prescription drugsSlimming drugs 1 20 Misc. prescription drugsVicks medinite 1 20 Misc. prescription drugsRivotril 1 20 Misc. prescription drugsLendgesic 1 20 Misc. prescription drugs

41
Annex I Model student questionnaire
Painagon 1 20 Misc. prescription drugsRsd 1 20 Misc. prescription drugsCough mixture 1 20 Misc. prescription drugsEphedrine 1 20 Misc. prescription drugsHeadache 1 20 Misc. prescription drugsSudaaphedn 1 20 Misc. prescription drugsSoltran 1 20 Misc. prescription drugsPax 1 21 Misc. drugsKhat 1 21 Misc. drugsKlitpyp 1 21 Misc. drugs
The justification for the coding scheme is as follows:
(a) All drugs which occur with a frequency greater than 10 received their own code;
(b) The coding order matches the order of drug types listed in question Q4 of the
Annual Reports Questionnaire. Frequency tables in SPSS can easily be ordered by
value, that is, matching the Annual Reports Questionnaire requirement, or by
count, reflecting relative importance;
(c) The original 54 categories have been reduced to 21. The smaller number of cate-
gories makes the overall picture clearer. Annual Reports Questionnaire drug types
provide the basis of the categories, although, where a large number of drugs
appear with small counts, they have been combined into drug classes;
(d) The coding is flexible. If a smaller number of categories is needed, a new variable
can be created on the basis of drug classes. For example, a new variable could be
created combining codes 10 to 13, which would constitute the class “Sedatives
and tranquillizers”. If details of the class types are needed, a list of those cases
comprising the aggregate codes can be generated. For example, a list of those cases
that made up “Miscellaneous prescription drugs” could be obtained by selecting
cases on the basis that the new variable equals 20, then listing.
Missing values should be considered at this stage. Unfortunately, the data does not provide
any information on missing values. A missing value is indicated by a blank entry in the
alphanumeric field. These are counted in the frequency distributions as a valid entry, but
should be defined as missing. In SPSS, this would have to be done explicitly in the “Missing”
column of the “Data Editor/Variable View”.
The amount of information on the missing values makes it impossible to differentiate between
the reasons why a value is missing. This is particularly frustrating given that a respondent
may validly not report a second and third most frequently used drug. Respondents not report-
ing a second or third most frequently used drug could have been reported by including a
value for “Not applicable” in the coding scheme and instructing the interviewers on its use.
This problem should be drawn to the participants’ notice
Exercise 3. Using a syntax file and recoding variables
Exercise 3 is designed to provide the opportunity to practise the techniques covered in ses-
sions 6 and 7. The exercise consists of three parts:

42
GAP Toolkit Module 5 Training in basic drug abuse data management and analysis
A. Using a syntax file.
B. Recoding a continuous variable.
C. Recoding a categorical variable.
Part A uses the files “Exercise2.sav” and “Recode and Label.sps”.
Parts B and C use a new file called “Main.sav”. This file will be used for the remainder of
the course. The file has been adapted from real data from treatment centres in Southern
Africa for the first six months of 2001. The benefit of using real data is that realistic issues
arise. The data have been tidied up a little, but are fundamentally as they were when initially
collected.
The questions for the Southern African data are almost identical to those of the Namibia:
Treatment Data Collection Form, January-June 2002. The differences are as follows:
(a) Question Q3, “Name of treatment centre”, remains, but the names have been
changed to suburbs of London;
(b) Question Q7, rather than “Home language”, a question on “Race” was included;
(c) Question Q8, “Region of permanent residence” has been excluded;
(d) Question Q13, “Drug1”, “Drug2” and “Drug3” hold the first most frequently used
drug, the second most frequently used drug, and so forth. The drugs have been
coded as described in the suggested answer for exercise 2. “Mode1”, “Mode2” and
“Mode3” hold the mode of ingestion for “Drug1”, “Drug2” and “Drug3” respectively;
(e) Question Q14 has been omitted;
(f) Question Q15 has been omitted.
It should be noted that there are no variables to hold the information in an “Other” cate-
gory. The data were received in this format. A consequence is that mode of ingestion becomes
a single closed question rather than five dichotomous questions.
A. Using a syntax file
Exercise 2, question 2, involved constructing a coding scheme for the variables “Drug11”,
“Drug22” and “Drug32” in the file “Exercise2.sav”. A coding scheme was proposed in the
trainer’s notes at the end of the exercise.
The file “Recode and label.sps” contains annotated SPSS command syntax to recode the vari-
ables “Drug12”, “Drug22” and “Drug32” according to the proposed scheme, to label the vari-
ables and to label the values.
Complete the following six steps:
1. Open the SPSS data file “Exercise2.sav”.
2. Open the SPSS syntax file “Recode and label.sps”.
3. Read the syntax file and see if the commands make sense.

43
Annex I Model student questionnaire
4. Run the syntax file.
5. Investigate the new variables that have been created.
6. Save the new file to an appropriate directory.
B. Recoding a continuous variable
Recode the variable “Age” into the following new categories:
1. Five categories, each containing an equal number of cases.
2. A categorical variable using the age categories required by the Annual Reports
Questionnaire.
C. Recoding a categorical variable
Recode the variable “Drug1” into the drug classes identified in the Annual Reports
Questionnaire.
Trainer’s notes for exercise 3
Question A
Question A involves running the syntax file “Recode and label.sps.”
Draw the participants’ attention to what happens to the blank values in the alphanumeric
field when the data are recoded to a numeric field. SPSS takes a blank value as a valid value
in an alphanumeric variable, but it is a missing value in a numeric variable. All the blanks
are converted to missing values.
Question B1
Question B1 is completed using the Windows options as follows:
1. "Transform/Categorize Variables…” Set the number of categories to 5.
2. Rename the automatically generated variable “Nage” to “Agecat5".
3. Use “Analyze/Descriptive Statistics/Explore”, setting the dependent variable to
“Age” and the factor to “Agecat5” to obtain the maximum and minimum age for
each category.
4. Label the values of “Agecat5” with the appropriate age ranges.
5. Run a frequency count of “Agecat5” to make sure all is well. “Analyze/Descriptive
Statistics/Frequencies”.

44
GAP Toolkit Module 5 Training in basic drug abuse data management and analysis
The syntax file “Ex3 qB1.sps” contains the annotated commands for this exercise, which are
reproduced below.
*Exercise 3, question B1.
*"Transformation/Categorize Variables”, set the number of groups to 5.
RANK
VARIABLES=age
/NTILES(5)
/PRINT=NO
/TIES=MEAN .
EXECUTE.
*Rename the variable to “Agecat5".
RENAME VARIABLES (NAGE=AGECAT5).
EXECUTE.
VARIABLE LABELS AGECAT5 “Age Categories".
EXECUTE.
*An easy way to find out the boundaries of the groups is to obtain summary statis-
tics for “Age” compiled by each of the groups.
*"Analyze/Descriptive Statistics/Explore” generates summary statistics.
*Select “Age” as the dependent variable and “Agecat5” as the factor list.
EXAMINE
VARIABLES=age BY agecat5
/PLOT NONE
/STATISTICS DESCRIPTIVES
/CINTERVAL 95
/MISSING LISTWISE
/NOTOTAL.
EXECUTE.
*Label the categories.
VALUE LABELS AGECAT5
1 ’1 <= X <= 19’
2 ’20 <= X <= 26’
3 ’27 <= X <= 34’
4 ’35 <= X <= 42’
5 ’43 <= X <= 77’
EXECUTE.

45
Annex I Model student questionnaire
*Run a frequency count on the new variable as a check.
FREQUENCIES
VARIABLES=agecat5
/ORDER= ANALYSIS .
EXECUTE.
The frequency distribution of “Agecat5” appears below.
Age Categories
Frequency Per cent Valid per cent Cumulative per cent
Valid 1 <= X <= 19 326 20.8 20.9 20.920 <= X <= 26 278 17.7 17.8 38.627 <= X <= 34 317 20.2 20.3 58.935 <= X <= 42 316 20.1 20.2 79.143 <= X <= 77 326 20.8 20.9 100.0Total 1563 99.5 100.0
Missing System 8 0.5Total 1571 100.0
Question B2
Question B2 involves recoding age according to the recommended Annual Reports
Questionnaire categories.
X Age in years
Children X <= 12Young teens 13 <= X <= 14Late teens 15 <= X <= 16Young adults 17 <= X <= 24Adults 25 <= X <= 34Older adults 35 <= X
This can be completed using “Transform/Recode Into Different Variables”. Care is needed in
declaring the systems missing. Having declared all valid values, set “All other values” to
“Systems-missing”.
The syntax commands to complete the recode and generate a frequency distribution are in
the syntax file “Ex3 qB2.sav” and are reproduced below.
*Exercise 3, question B2. Recode “Age” using the Annual Reports Questionnaire age
definitions.
*Recode “Age".
RECODE AGE (LO THRU 12=1) (13 THRU 14=2) (15 THRU 16=3)
(17 THRU 24=4) (25 THRU 34=5) (5 THRU HI=6) (ELSE=SYSMIS)
INTO ARQAGE.
* Missing values are all set to systems missing using the “Else” statement.
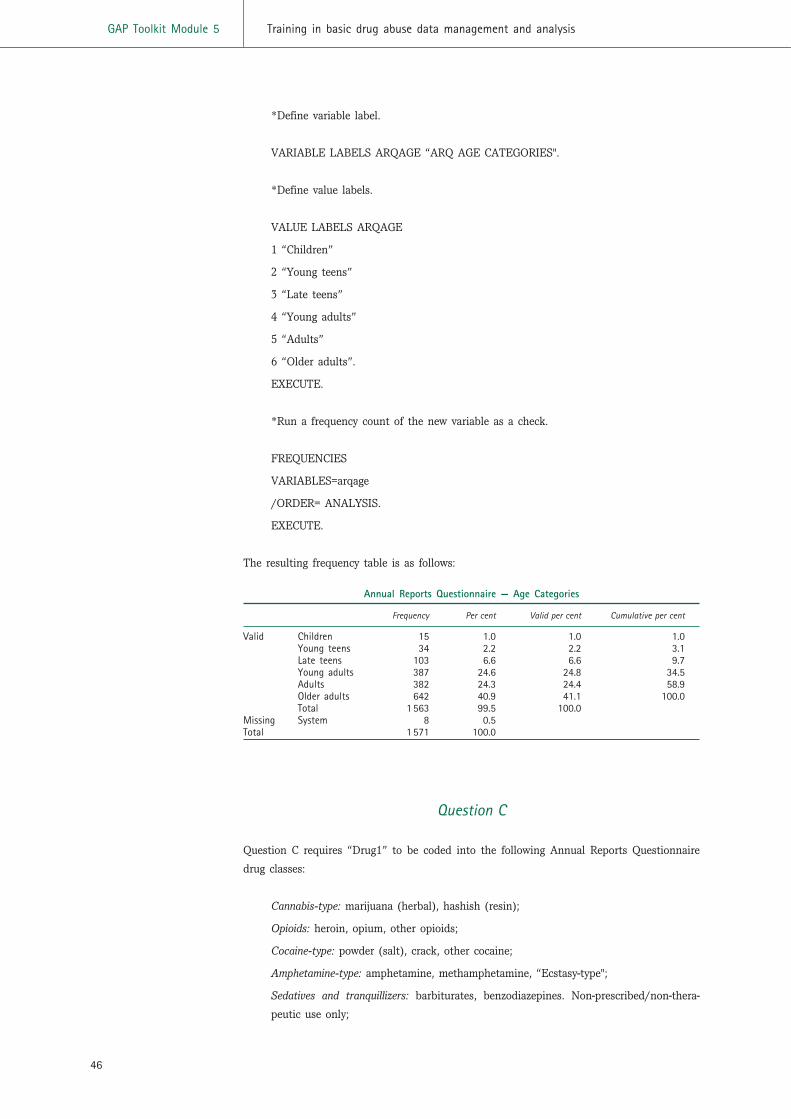
46
GAP Toolkit Module 5 Training in basic drug abuse data management and analysis
*Define variable label.
VARIABLE LABELS ARQAGE “ARQ AGE CATEGORIES".
*Define value labels.
VALUE LABELS ARQAGE
1 “Children”
2 “Young teens”
3 “Late teens”
4 “Young adults”
5 “Adults”
6 “Older adults”.
EXECUTE.
*Run a frequency count of the new variable as a check.
FREQUENCIES
VARIABLES=arqage
/ORDER= ANALYSIS.
EXECUTE.
The resulting frequency table is as follows:
Annual Reports Questionnaire — Age Categories
Frequency Per cent Valid per cent Cumulative per cent
Valid Children 15 1.0 1.0 1.0Young teens 34 2.2 2.2 3.1Late teens 103 6.6 6.6 9.7Young adults 387 24.6 24.8 34.5Adults 382 24.3 24.4 58.9Older adults 642 40.9 41.1 100.0Total 1 563 99.5 100.0
Missing System 8 0.5Total 1 571 100.0
Question C
Question C requires “Drug1” to be coded into the following Annual Reports Questionnaire
drug classes:
Cannabis-type: marijuana (herbal), hashish (resin);
Opioids: heroin, opium, other opioids;
Cocaine-type: powder (salt), crack, other cocaine;
Amphetamine-type: amphetamine, methamphetamine, “Ecstasy-type";
Sedatives and tranquillizers: barbiturates, benzodiazepines. Non-prescribed/non-thera-
peutic use only;

47
Annex I Model student questionnaire
Hallucinogens: LSD, other hallucinogens;
Solvents and Inhalants: gasoline/petrol, adhesives, aerosol products;
Other drugs: drugs not specifically listed under the classes above, but which occur in
substantial amounts within the area and time period.
The table in exercise 2 listing the recoding of the drugs should be used in establishing new
categories. Categorizing some of the less obvious drugs requires specialist skills. The expert-
ise of the participants is likely to be greater here than that of the trainer. The following is
the categorization adopted and is open to criticism:
1. Cannabis-type: 1. Dagga 2. Hashish2. Opioids: 3. Heroin 4. Codeine3. Cocaine-type: 5. Cocaine 6. Crack4. Amphetamine-type: 7. Amphetamines 8. Methamphetamine
9. Ecstasy5. Sedatives and 10. Sedatives and tranquillizers
tranquillizers: 11. Benzodiazepines 12. Mandrax13. Valium 19. Rohypnol20. Miscellaneous prescription drugs
6. Hallucinogens: 14. LSD 15. Magic mushrooms7. Solvents and inhalants: 16. Solvents and inhalants8. White pipe: 17. White pipe9. Alcohol: 18. Alcohol
10. Miscellaneous drugs: 21. Miscellaneous drugs
Possible points of discussion are as follows:
(a) Should codeine appear as an opioid or as a sedative?;
(b) Are the miscellaneous prescription drugs all sedatives? Refer to the list in ques-
tion 2 for what has been labelled a miscellaneous prescription drug. These appear
to be all sedatives. One in question is Ephidrine, which may need recoding;
(c) The “Other drugs” category has been replaced with the actual drug types: white
pipe and alcohol. These are major drug types, occurring frequently in the data and
have therefore not been combined;
(d) Miscellaneous drugs is a catch-all category which is very small. The occurrences
of the drug here as so small as not to merit their own categories. It may be pos-
sible to re-categorize the drugs in this class to more appropriate classes;
(e) Rohypnol is an interesting case. Apparently, the drug known for date rape in
Europe is used as a sedative by crack users. Cross-tabulations will be used to inves-
tigate multiple drug use later in the course.
The recoding can be done using the “Transform/Recode” into different variable” menu options.
The output variable should be labelled. The values should be defined. A frequency distribu-
tion of the output variable should be compared with a frequency distribution of the input
variable to ensure no mistakes have occurred.
This is a good example of why it is important to be consistent in coding and how syntax can
be useful. “Drug1”, “Drug2” and “Drug3” all need to be recoded. Each of the input variables
has the same codes and each of the output variables should have the same codes. The anno-
tated syntax to complete the recoding, labelling and frequency counts for all three variables

48
GAP Toolkit Module 5 Training in basic drug abuse data management and analysis
is in “Ex3 qC.sps” and is reproduced below. Highlight to the participants how all three vari-
ables were processed together. Check how participants handled missing values and the “Not
applicable” category in particular.
*Exercise 3, question C.
*Recoding Drug types into drug classes.
*Recode all three drug variables at once by listing the input variables first and their
associated output variable after the “INTO”.
RECODE
drug1 drug2 drug3
(1 thru 2=1) (3 thru 4=2) (5 thru 6=3) (7 thru 9=4) (10 thru 13=5) (19 thru 20=5)
(14 thru 15=6) (16=7) (17=8) (18=9) (21=10) (ELSE=COPY)
INTO dclass1 dclass2 dclass3 .
*The ELSE=COPY statement signifies that all values not specifically changed should be
copied.
*Label all three new variables.
VARIABLE LABELS
dclass1 “Drug Classes Drug 1”
dclass2 “Drug Classes Drug 2”
dclass3 “Drug Classes Drug 3”.
*Value labels for all three new variables.
VALUE LABELS dclass1 dclass2 dclass3
1 “Cannabis Types”
2 “Opioids”
3 “Cocaine -type”
4 “Amphetamine-type”
5 “Sedatives and tranquillizers”
6 “Hallucinogens”
7 “Solvents and inhalants”
8 “White pipe”
9 “Alcohol”
10 “Misc. drugs”
77 “Not applicable”.
EXECUTE.
MISSING VALUES dclass1 dclass2 dclass3 (77).
*Run a frequency count on each variable.
FREQUENCIES
VARIABLES=dclass1 dclass2 dclass3
/ORDER= ANALYSIS .
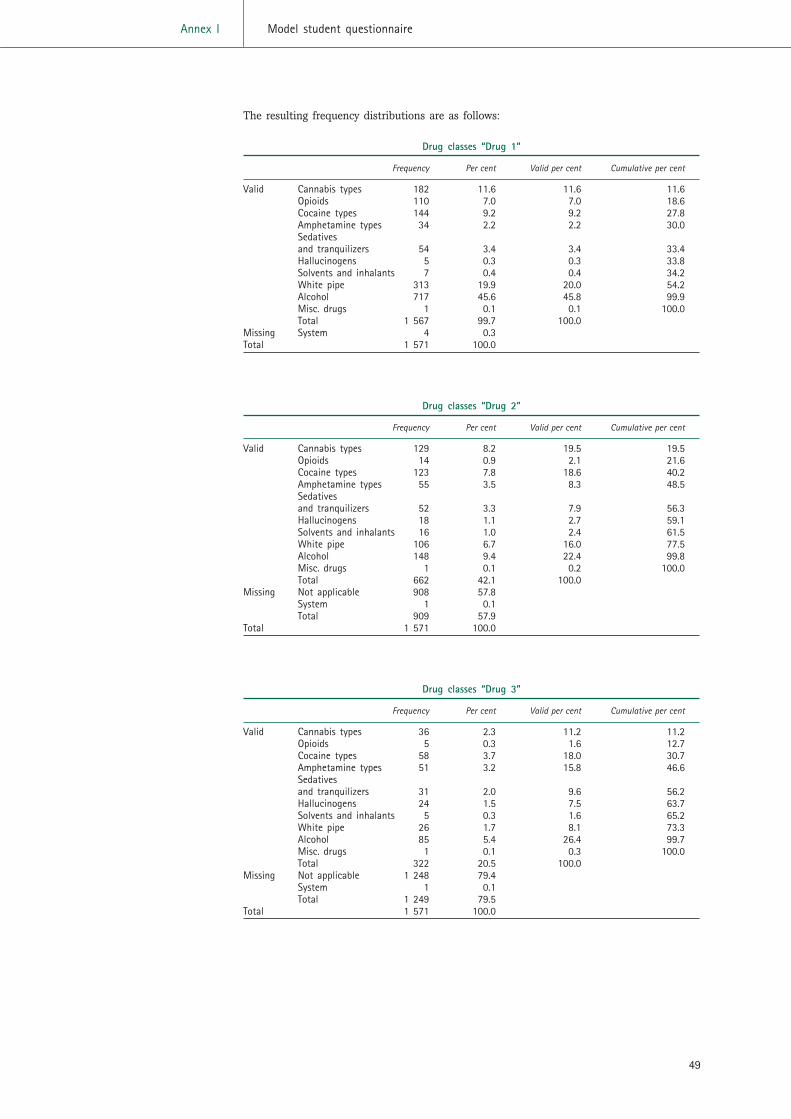
49
Annex I Model student questionnaire
The resulting frequency distributions are as follows:
Drug classes “Drug 1”
Frequency Per cent Valid per cent Cumulative per cent
Valid Cannabis types 182 11.6 11.6 11.6Opioids 110 7.0 7.0 18.6Cocaine types 144 9.2 9.2 27.8Amphetamine types 34 2.2 2.2 30.0Sedatives and tranquilizers 54 3.4 3.4 33.4Hallucinogens 5 0.3 0.3 33.8Solvents and inhalants 7 0.4 0.4 34.2White pipe 313 19.9 20.0 54.2Alcohol 717 45.6 45.8 99.9Misc. drugs 1 0.1 0.1 100.0Total 1 567 99.7 100.0
Missing System 4 0.3Total 1 571 100.0
Drug classes “Drug 2”
Frequency Per cent Valid per cent Cumulative per cent
Valid Cannabis types 129 8.2 19.5 19.5Opioids 14 0.9 2.1 21.6Cocaine types 123 7.8 18.6 40.2Amphetamine types 55 3.5 8.3 48.5Sedatives and tranquilizers 52 3.3 7.9 56.3Hallucinogens 18 1.1 2.7 59.1Solvents and inhalants 16 1.0 2.4 61.5White pipe 106 6.7 16.0 77.5Alcohol 148 9.4 22.4 99.8Misc. drugs 1 0.1 0.2 100.0Total 662 42.1 100.0
Missing Not applicable 908 57.8System 1 0.1Total 909 57.9
Total 1 571 100.0
Drug classes “Drug 3”
Frequency Per cent Valid per cent Cumulative per cent
Valid Cannabis types 36 2.3 11.2 11.2Opioids 5 0.3 1.6 12.7Cocaine types 58 3.7 18.0 30.7Amphetamine types 51 3.2 15.8 46.6Sedatives and tranquilizers 31 2.0 9.6 56.2Hallucinogens 24 1.5 7.5 63.7Solvents and inhalants 5 0.3 1.6 65.2White pipe 26 1.7 8.1 73.3Alcohol 85 5.4 26.4 99.7Misc. drugs 1 0.1 0.3 100.0Total 322 20.5 100.0
Missing Not applicable 1 248 79.4System 1 0.1Total 1 249 79.5
Total 1 571 100.0


51
Pre- and post test
Annex IIThe purpose of the pre- and post test is to provide a measure of the effec-
tiveness of the course in conveying the basic skills of data management and
data analysis. The test is presented to the participants before and after the
course and the results compared. This type of measurement is very blunt and
interpretation should be subject to provisos on the strength of any conclu-
sion. A positive side effect is that the results of the pre-test provide the
trainer with an opportunity to gauge the ability of the participants.
The test should be evaluated by someone other than the trainer. In the pilot
workshops, the test was administered and evaluated by the GAP Regional
Epidemiological Adviser, Matthew Warner-Smith. However, the trainer should
construct the test as he or she is best placed to know which topics are being
presented.
The test should be short and cannot reasonably include questions on SPSS
software or the operating system as these are not prerequisites for the course.
The following example questions are similar to those used in the pilot work-
shops:
1. Describe the purpose of a code book and list its main components.
2. The following is a cross-tabulation of “Gender” against “Occupation” for
a hypothetical data set of persons convicted of drug-related offences.
Gender
Occupation Male Female
Professional 350 50Skilled 300 100Unskilled 200 150Student 150 200
Compare the occupations of those convicted of drug-related offences, by gen-
der, by calculating the appropriate percentages.
3. The following is a question from the CARIDIN Data Collection Form for
the National Drug Information Network (p. 17). Suggest a coding scheme for
the question and describe how it would be represented in a data file.

52
GAP Toolkit Module 5 Training in basic drug abuse data management and analysis
PriceDrug Purity (local currency)
Marijuana
Cocaine powder
Crack
Heroin
Amphetamines
Other (please specify):
4. The following is question Q30 of the Annual Reports Questionnaire. Suggest how the
answers to the question could be coded.
Q30. Which new drugs or new patterns of use have been reported?
5. Information is collected from patients at treatment centres in the London area for the
first three months of 2002. Suggest how to summarize the information in each of the fol-
lowing variables:
(a) A categorical variable called “Employment”, which can take the following four val-
ues only: “Employed”, “Self-employed”, “Unemployed/homemaker”, “Retired”’;
(b) The variable “Date of birth”.

53
Questionnaires
The Namibia: Treatment Data Collection Form, January-June 2002 is repro-
duced below, together with guidelines for completing the form.
The CARIDIN Data Collection Form for the National Drug Information Network
is reproduced on pages 57 to 79.
Annex III

54
GAP Toolkit Module 5 Training in basic drug abuse data management and analysis
1. Interviewer’s initials: _________ 2. Date form completed : ______/______/_____
3. Name of treatment centre: __________________________________________________________
4. Referral source (X one only):
1 Self/family/friends 4 Religious group 7 Courts/correctional services
2 Employer/work 5 Hospital/clinic 8 School
3 Private health professional 6 Social services/welfare 9 Support group
10 Unknown 11 Other (specify): __________________________
5. Gender: Male Female 6. Age: _______________
7. Home language:________________________________________
8. Region of permanent residence: _________________________________________________
9. Highest level of education completed:
1 None/pre-primary 3 Grades 8-10 5 Tertiary
2 Primary 4 Grades 11-12
10. Employment status:
1 Working full-time 4 Apprenticeship/internship 7 Housewife
2 Working part-time 5 Student/pupil 8 Pensioner
3 Not working 6 Disabled/medically boarded 9 Other: ____________________
11. Current marital status:
1 Married (civil/traditional) living with spouse 4 Divorced
2 Married (civil/traditional) not living with spouse 5 Widowed
3 Living in a non-married intimate relationship 6 Never married (and not living in
7 Other: ____________________ non-married intimate relationship)
12. Indicate type of treatment patient received: Inpatient Outpatient Both
13. Indicate primary substance(s) of abuse (in order of most frequently us ed if more than one substance is presently abused) and the
mode of ingestion (X all that apply). Note: refer to dagga and Mandrax used together as “white pipe”. Please specify the trade
name of medicines abused: Note cocaine (powder) and crack separately.
1st most frequently used
2nd
most frequently used
3rd
most frequently used
14. How old was the patient when he or she fi rst began using alcohol regularly? __________
15. How old was the patient when he or she firs t began using other drugs regularly? __________
16. Has the patient ever been in treatment prior to this episode?
17. What source(s) will be used to cover treatment expenses? (X all that apply)
1 State 4 Friends 7 Church
2 Medical aid 5 Employer 8 Support groups
3 Family 6 Self 9 Unknown
10 Other: ____________________
Swallow
Smoke
Inject Other:
Swallow
Swallow Smoke
Snort
Snort
Snort
Inject
Inject
Other:
Other:
Yes No
Smoke
Namibia: Treatment Data Collection Form, January-June 2002

55
Annex III Model student questionnaire
Guidelines for completing the data collection form
The following guidelines are to provide the interviewer with a clear sense of the intent of
each question on the Namibia: Treatment Data Collection Form, January-June 2002. The pur-
pose of the guidelines is to ensure that the information collected is correct, with a minimal
error rate. Please read through the guide before conducting interviews with patients. It may
be helpful to keep the guide nearby during the interview session to use as a reference.
1. Interviewer’s initials. These are the interviewer’s initials, not those of the patient.
2. Date form completed. Day/Month/Year in the spaces provided (for example,
09/07/2001). This information is required to make certain calculations.
3. Name of treatment centre. Indicate the complete name of the treatment centre in the
space provided.
4. Referral source. Mark the number for the patient’s response. If the patient mentions
more than one referral, ask which referral came last. For instance, if the patient says that his
or her family referred him or her to a doctor and the doctor did the referral to the treatment
programme, put a cross (X) against number 3, “Private health professional”. “Support group”
includes Alcoholics Anonymous, Narcotics Anonymous, and so forth.
5. Gender. Put a cross (X) in the appropriate box, as observed.
6. Age. Record the patient’s age in the space provided. If there is uncertainty about the
patient’s age, ask the patient to check his or her ID book, otherwise ask the patient to esti-
mate. Please do not forget to record age.
7. Home language. Indicate patient’s home language.
8. Region of permanent residence. Permanent residence refers to the place considered by
the patient to be his or her main residential address, not a temporary abode. If outside
Namibia, state the country of residence.
9. Highest level of education completed. Record the highest level of education completed:
pre-primary, primary, secondary or tertiary.
10. Employment status. Put a cross (X) against the appropriate number according to the
patient’s response. If the patient gives two responses, such as “Student/pupil” and “Working
part-time”, put the cross (X) against the choice that appears first on the list (that is, “Working
part-time”). “Working” includes working for an employer, being self-employed, doing piece-
work or odd jobs, informal and formal, legal and illegal. “Disabled” refers to any condition,
temporary or permanent, that prevents the patient from working and includes a subsidy.
11. Current marital status. Put a cross (X) against one number according to the patient’s
response to current status. If the patient is separated but is living in a de facto relationship
(3), put a cross (X) against box (3). If the patient is divorced (4) or widowed (5), but is liv-
ing in a de facto relationship (3), then put a cross (X) against box (3).
12. Indicate type of treatment patient is receiving.
13. Indicate patient’s primary substance of abuse. Indicate the patient’s primary substance
of abuse in order of most frequently used if more than one primary substance is presently
being abused. Put a cross (X) against the mode(s) of ingestion of each primary substance
indicated. Alcohol includes all beers, home brews, concoctions, methylated spirits, spirits,
liqueurs, wine, and so forth. Include prescription drugs, noting the specific type, if they are
one of the primary substances of abuse.

56
GAP Toolkit Module 5 Training in basic drug abuse data management and analysis
14. How old was the patient when he or she first began using alcohol regularly? Indicate how
old (in years) the patient was when he or she first began drinking on a regular basis, that
is, at least monthly.
15. How old was the patient when he or she first began using other drugs regularly? Indicate
how old (in years) the patient was when he or she first began using other drugs on a regu-
lar basis, that is at least monthly.
16. Has the patient ever been in treatment prior to this episode? “Treatment” includes out-
patient, inpatient or residential, private counselling, hospital detoxifications, Alcoholics
Anonymous, Narcotics Anonymous, prison-based treatment and traditional healers. Put a cross
(X) against the appropriate box according to the patient’s response.
17. What source(s) will be used to cover treatment expenses? (X all that apply) Treatment
expenses are those expenses directly related to treatment such as treatment programme fees.
It does not include the patient’s personal expenses incurred while in treatment, such as trans-
port costs, loss of earnings, telephone calls or other treatment or medical expenses inde-
pendent of the current treatment programme. If the patient is uncertain as to the source, put
a cross (X) against box number 9. All relevant sources contributing must be marked.
Ca
rib
bea
n D
rug
In
form
ati
on
Net
wo
rk
(CA
RID
IN)
Data collection form for National Drug
Information Network
Name, title/position, address, telephone, fax and e-mail of the person responsible for data submitted to
the National Drug Information System
Name
Title/position
Address
Telephone
Fax Email
57
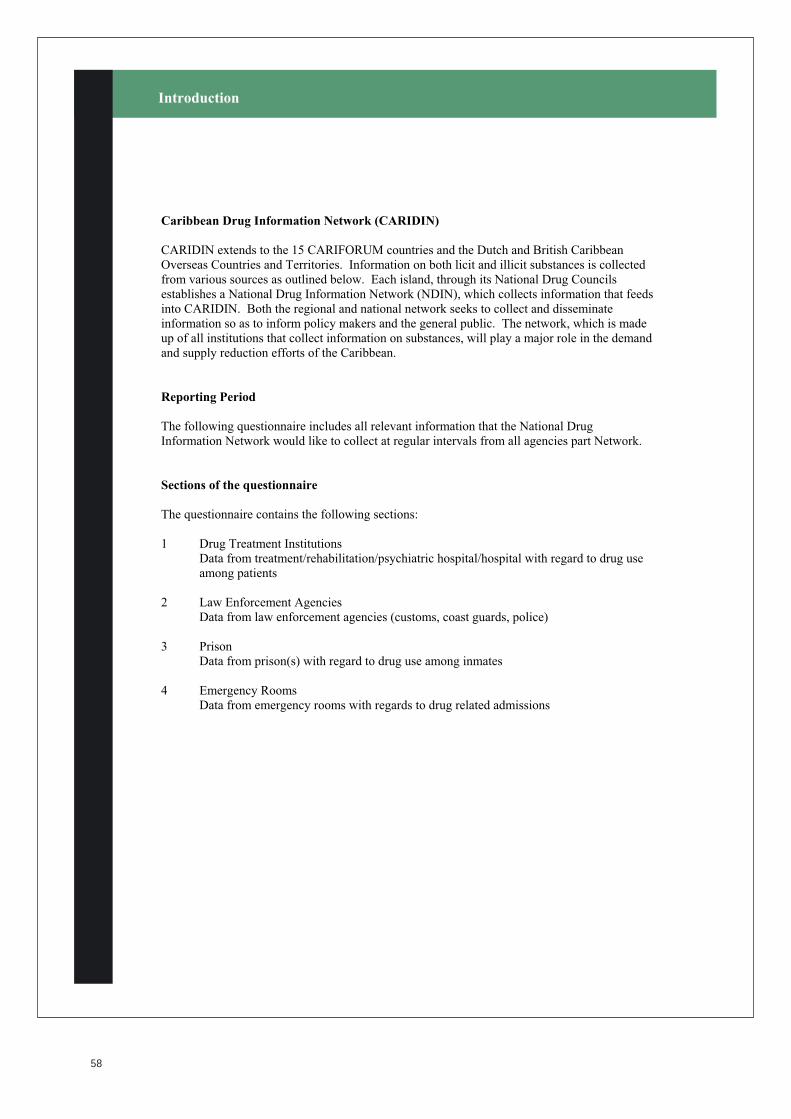
Introduction
Caribbean Drug Information Network (CARIDIN)
CARIDIN extends to the 15 CARIFORUM countries and the Dutch and British Caribbean
Overseas Countries and Territories. Information on both licit and illicit substances is collected
from various sources as outlined below. Each island, through its National Drug Councils
establishes a National Drug Information Network (NDIN), which collects information that feeds
into CARIDIN. Both the regional and national network seeks to collect and disseminate
information so as to inform policy makers and the general public. The network, which is made
up of all institutions that collect information on substances, will play a major role in the demand
and supply reduction efforts of the Caribbean.
Reporting Period
The following questionnaire includes all relevant information that the National Drug
Information Network would like to collect at regular intervals from all agencies part Network.
Sections of the questionnaire
The questionnaire contains the following sections:
1 Drug Treatment Institutions
Data from treatment/rehabilitation/psychiatric hospital/hospital with regard to drug use
among patients
2 Law Enforcement Agencies
Data from law enforcement agencies (customs, coast guards, police)
3 Prison
Data from prison(s) with regard to drug use among inmates
4 Emergency Rooms
Data from emergency rooms with regards to drug related admissions
58
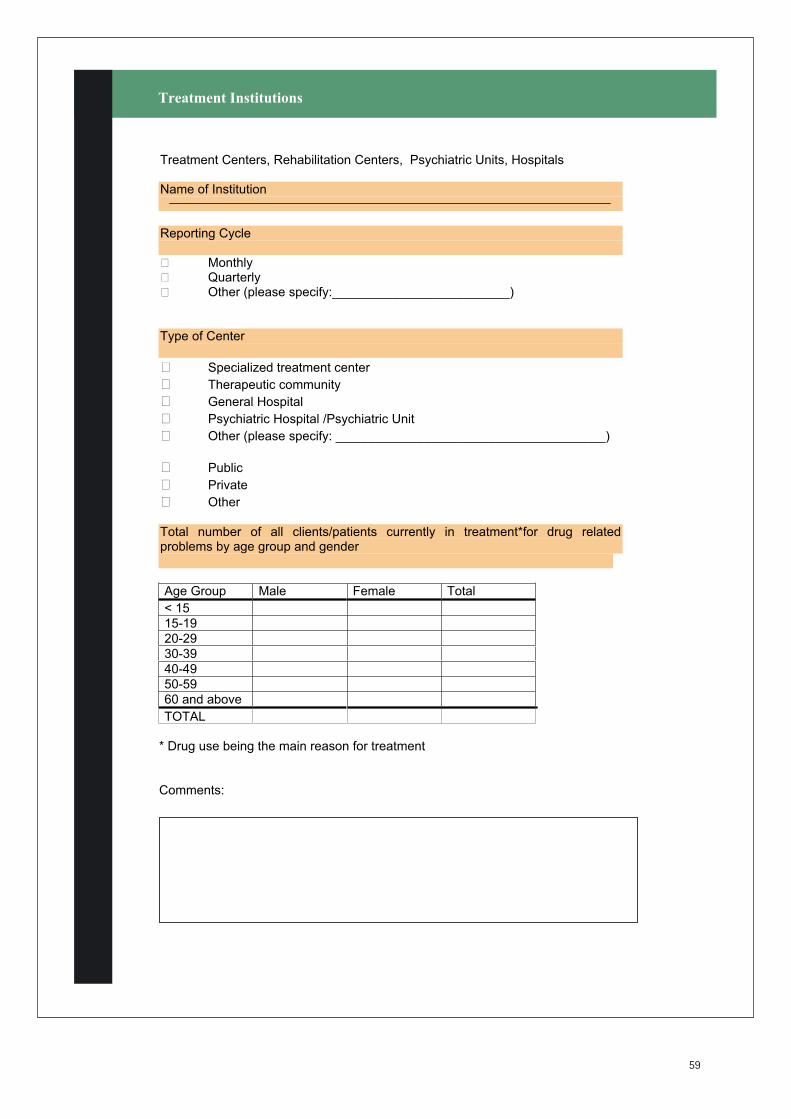
Treatment Centers, Rehabilitation Centers, Psychiatric Units, Hospitals
Name of Institution
Reporting Cycle
Monthly Quarterly Other (please specify:_________________________)
Type of Center
Specialized treatment center
Therapeutic community
General Hospital
Psychiatric Hospital /Psychiatric Unit
Other (please specify: ______________________________________)
Public
Private
Other
Total number of all clients/patients currently in treatment*for drug related problems by age group and gender
Age Group Male Female Total
< 15
15-19
20-29
30-39
40-49
50-59
60 and above
TOTAL
* Drug use being the main reason for treatment
Comments:
Treatment Institutions
59

Number of primary* drugs used by clients/patients, by drug, by gender and by way of administration
Drug Way most frequently administered
Male Female Total Oral Smoked Inhaled Intramuscular Intravenous Other
Alcohol
Tobacco
Marijuana
Cocaine Powder
Crack
Hallucinogens
Inhalants/Solvents
Heroin
Benzodiazepines
Barbiturates
Amphetamines
Ecstasy
Other (please specify) _______________
* Type of drug having greatest damage or main reason for admission
Total number of new admissions over the last month (please indicate month_________) by age group and by gender
Age Group Male Female Total
< 15
15-19
20-29
30-39
40-49
50-59
60 and above
TOTAL
Treatment Institutions
60
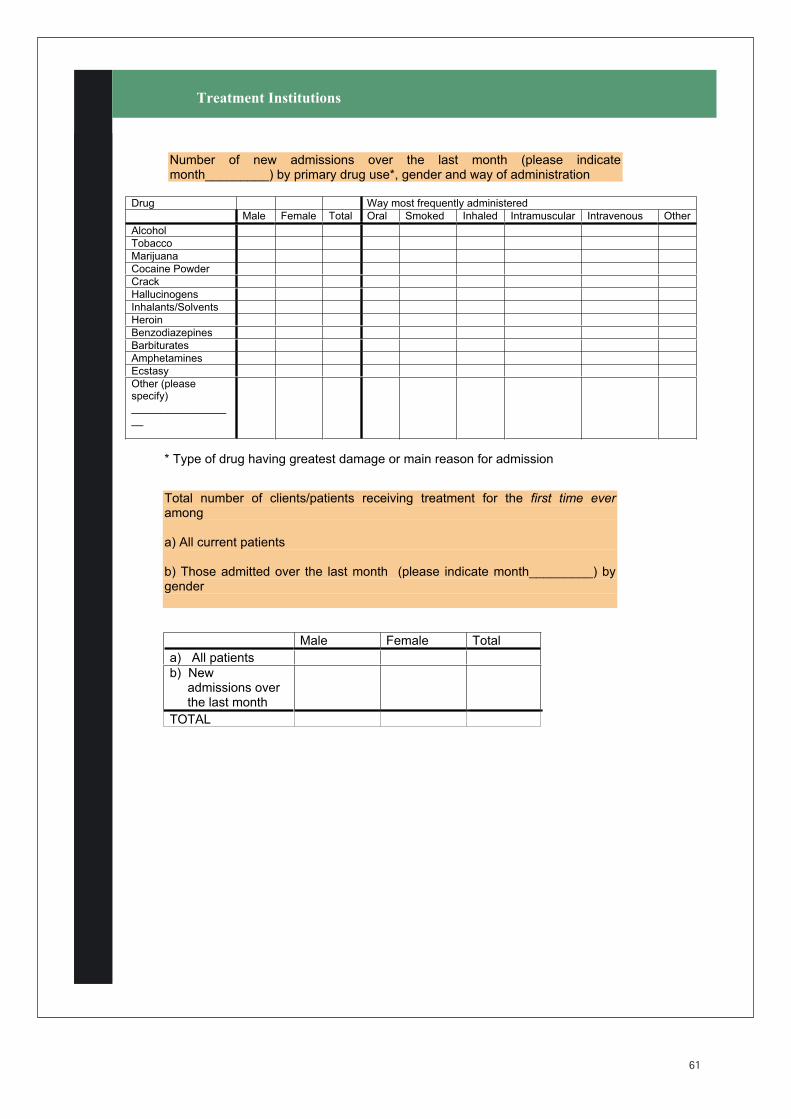
Number of new admissions over the last month (please indicate month_________) by primary drug use*, gender and way of administration
Drug Way most frequently administered
Male Female Total Oral Smoked Inhaled Intramuscular Intravenous Other
Alcohol
Tobacco
Marijuana
Cocaine Powder
Crack
Hallucinogens
Inhalants/Solvents
Heroin
Benzodiazepines
Barbiturates
Amphetamines
Ecstasy
Other (please specify) __________________
* Type of drug having greatest damage or main reason for admission
Total number of clients/patients receiving treatment for the first time ever
among
a) All current patients
b) Those admitted over the last month (please indicate month_________) by gender
Male Female Total
a) All patients
b) New admissions over the last month
TOTAL
Treatment Institutions
61
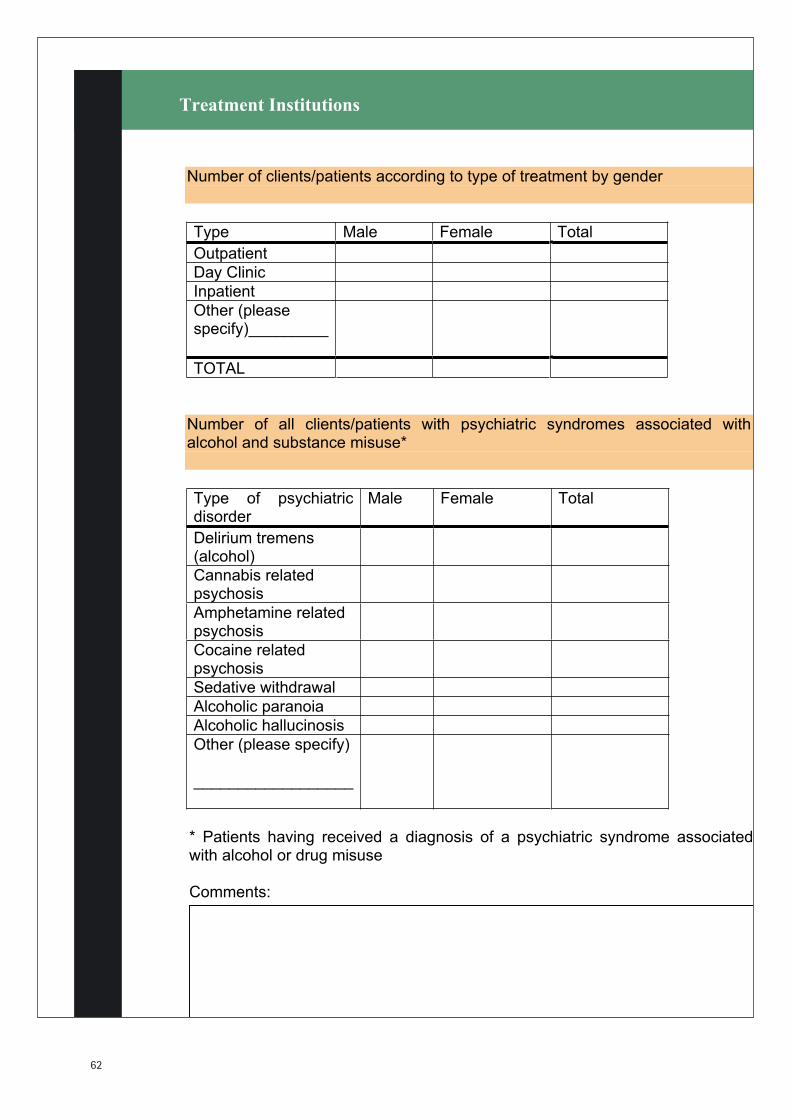
Number of clients/patients according to type of treatment by gender
Type Male Female Total
Outpatient
Day Clinic
Inpatient
Other (please specify)_________
TOTAL
Number of all clients/patients with psychiatric syndromes associated with alcohol and substance misuse*
Type of psychiatric disorder
Male Female Total
Delirium tremens (alcohol)
Cannabis related psychosis
Amphetamine related psychosis
Cocaine related psychosis
Sedative withdrawal
Alcoholic paranoia
Alcoholic hallucinosis
Other (please specify)
__________________
* Patients having received a diagnosis of a psychiatric syndrome associated with alcohol or drug misuse
Comments:
Treatment Institutions
62

Name of Reporting Institution
Type of Institution Customs Police Coast Guard Other (please specify:_________________________)
Reporting Cycle
Monthly Quarterly Other (please specify:_________________________)
Number of seizures
DrugMeasureUnit(Kg., Lt., Un., Ds.)
QuantitySeized
Number of seizures
Purity(%)
Cannabis Plant
Cannabis Leaf
Cannabis Resin
Hashish Oil
Cannabis Seeds
Opium (raw or prepared)
Liquid Opium
Poppy Plants
Poppy Seeds
Morphine
Heroin
Coca Leaf
Coca Paste
Cocaine Base
Cocaine Salts
Crack
Basuco (residues or impurities)
Depressants
LSD
Amphteamines
Metamaphetamines
Ecstasy Tablets
Other (please specify):
Law Enforcement
63
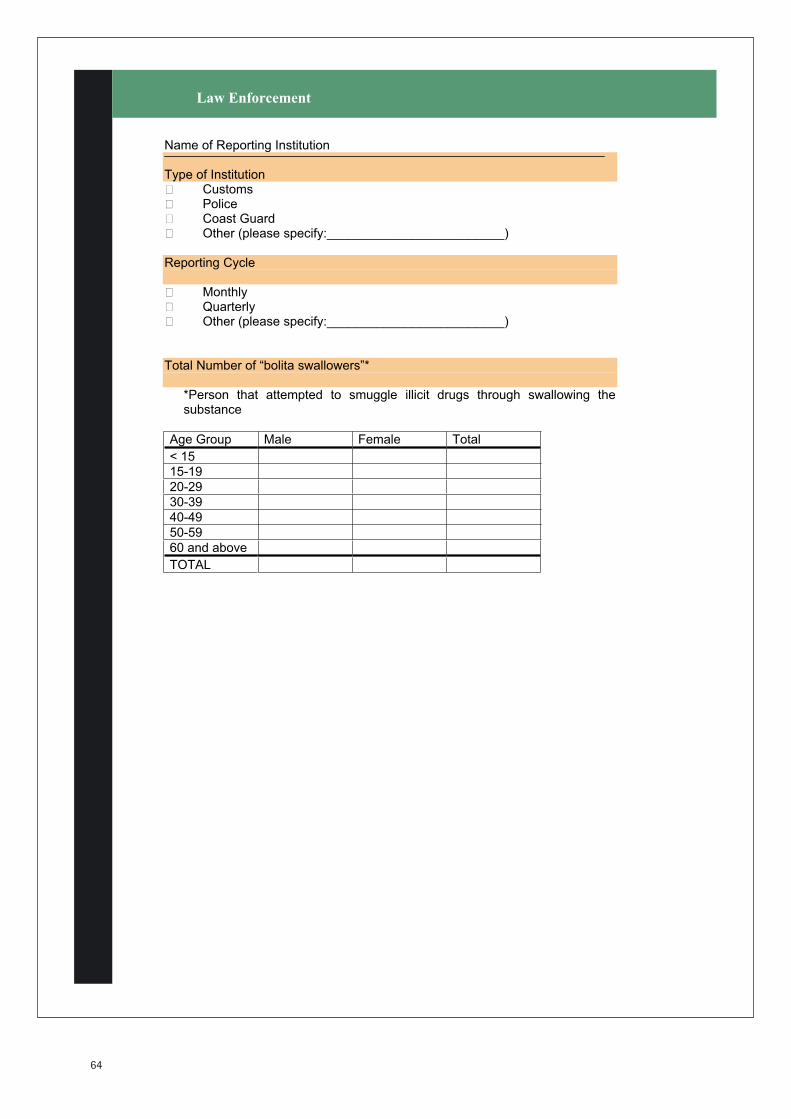
Name of Reporting Institution
Type of Institution Customs Police Coast Guard Other (please specify:_________________________)
Reporting Cycle
Monthly Quarterly Other (please specify:_________________________)
Total Number of “bolita swallowers”*
*Person that attempted to smuggle illicit drugs through swallowing the substance
Age Group Male Female Total
< 15
15-19
20-29
30-39
40-49
50-59
60 and above
TOTAL
Law Enforcement
64

Name of Reporting Institution
Type of Institution Customs Police Coast Guard Other (please specify:_________________________)
Reporting Cycle
Monthly Quarterly Other (please specify:_________________________)
Seizures of pharmaceutical products
Type of pharmaceuticalproduct
MeasureUnit (Kg., Lt., Un., Ds.)
QuantitySeized
Number of seizures
QuantityDisposed
Comments:
Law Enforcement
65
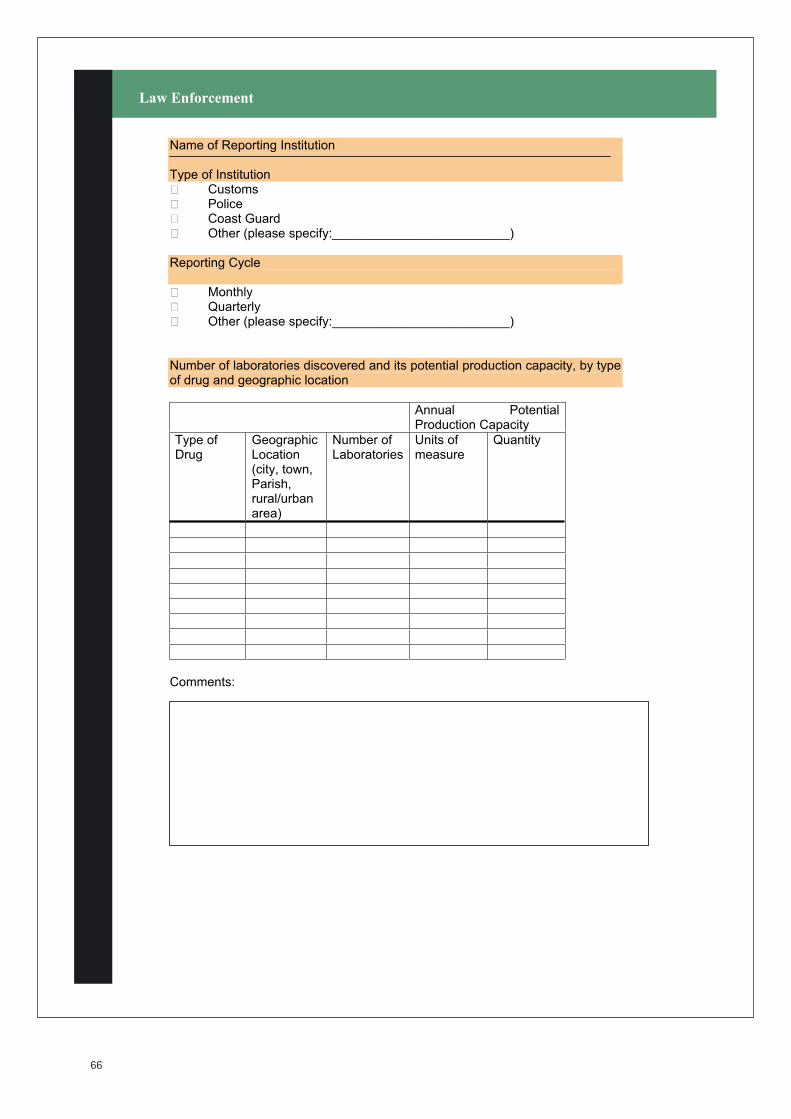
Name of Reporting Institution
Type of Institution Customs Police Coast Guard Other (please specify:_________________________)
Reporting Cycle
Monthly Quarterly Other (please specify:_________________________)
Number of laboratories discovered and its potential production capacity, by type of drug and geographic location
Annual PotentialProduction Capacity
Type of Drug
GeographicLocation(city, town, Parish,rural/urbanarea)
Number of Laboratories
Units of measure
Quantity
Comments:
Law Enforcement
66
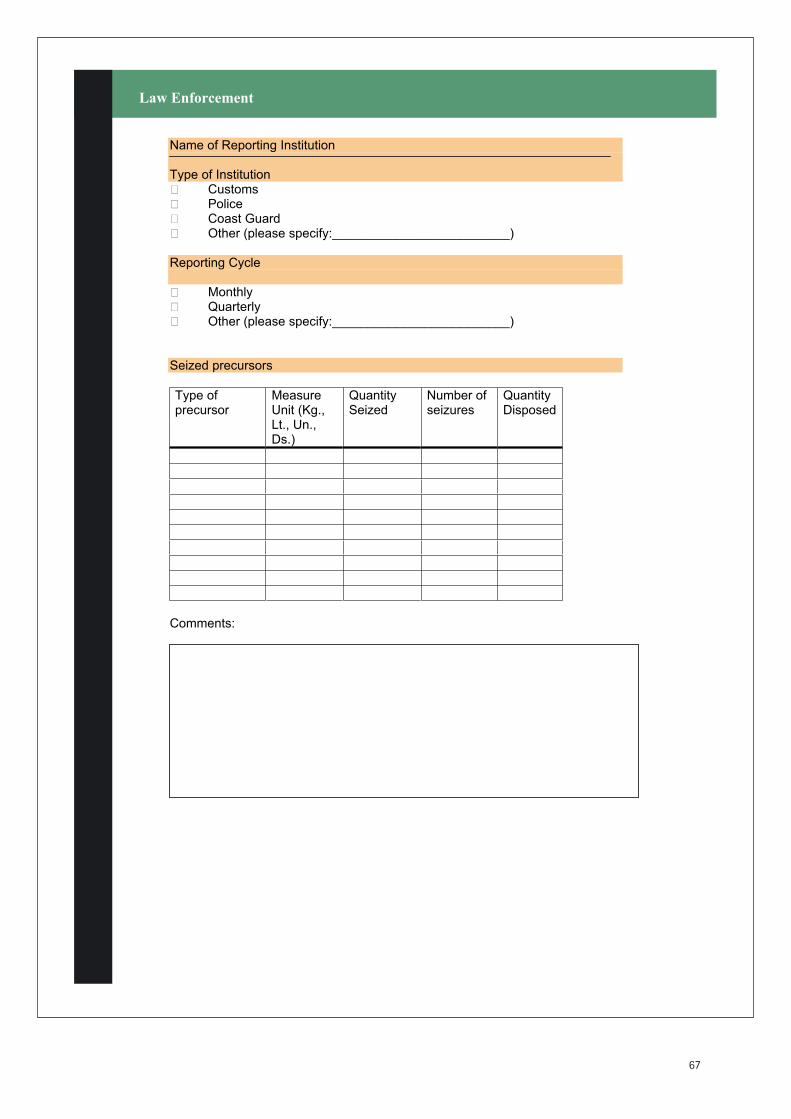
Name of Reporting Institution
Type of Institution Customs Police Coast Guard Other (please specify:_________________________)
Reporting Cycle
Monthly Quarterly Other (please specify:_________________________)
Seized precursors
Type of precursor
MeasureUnit (Kg., Lt., Un., Ds.)
QuantitySeized
Number of seizures
QuantityDisposed
Comments:
Law Enforcement
67
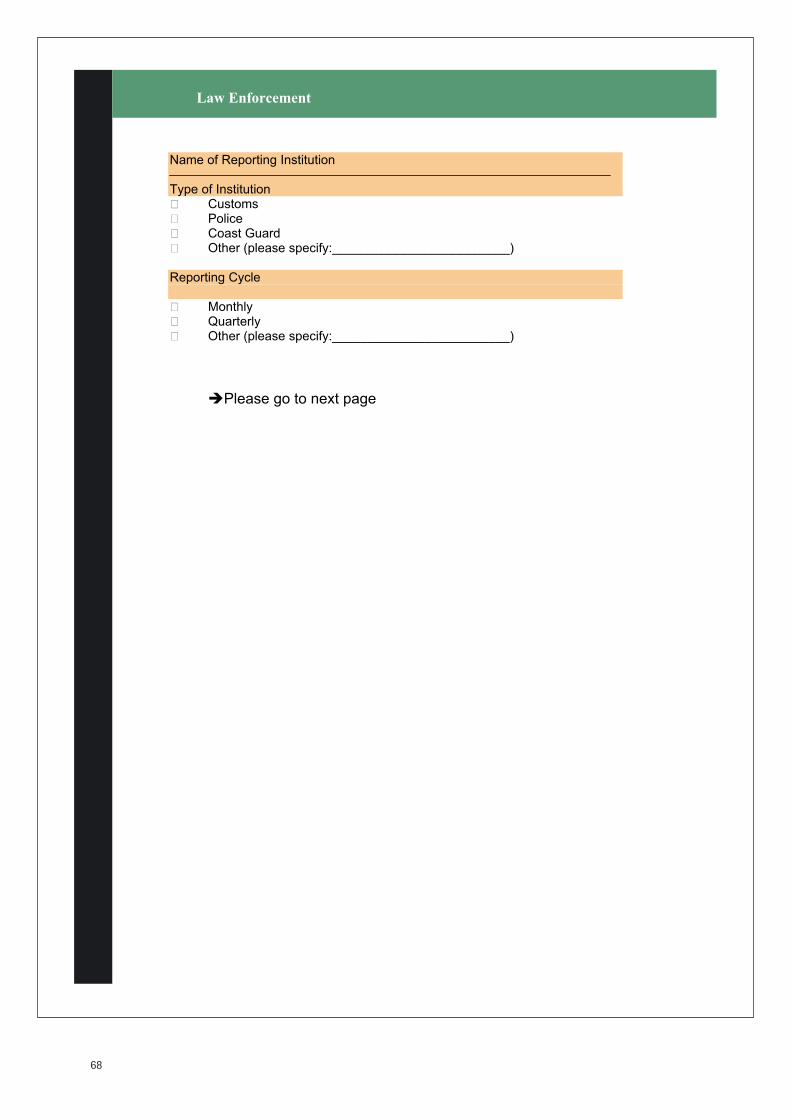
Name of Reporting Institution
Type of Institution Customs Police Coast Guard Other (please specify:_________________________)
Reporting Cycle
Monthly Quarterly Other (please specify:_________________________)
Please go to next page
Law Enforcement
68
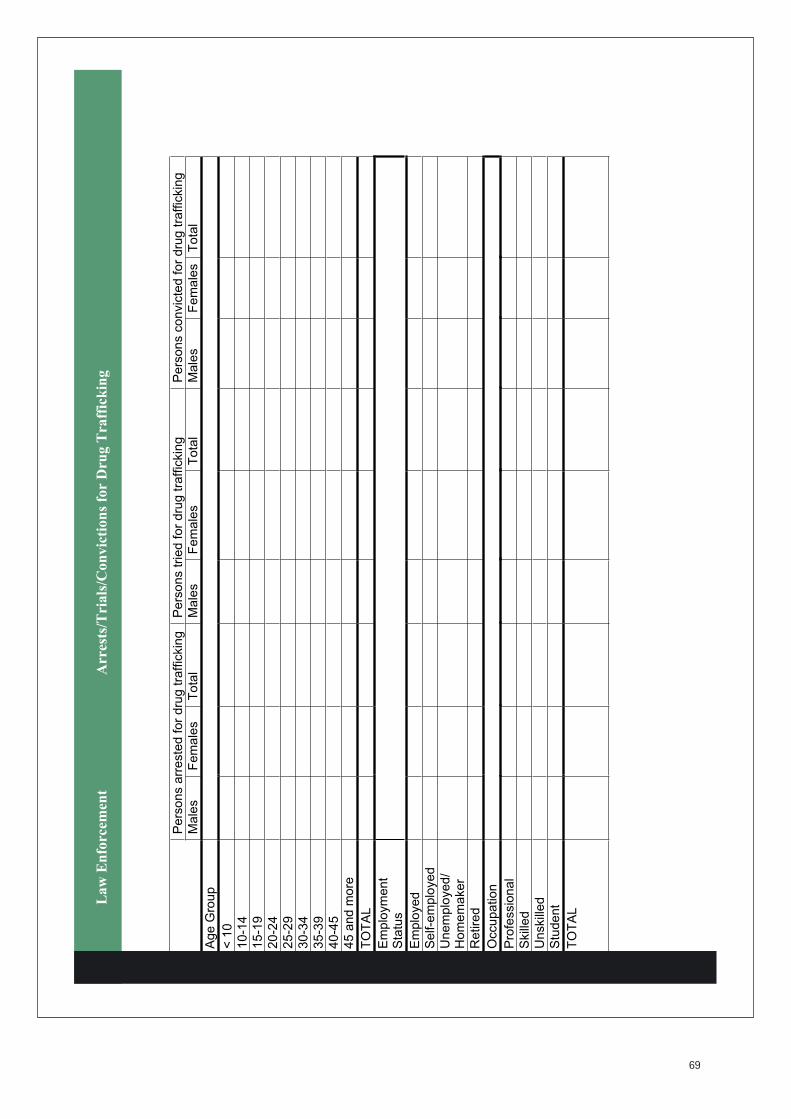
Pers
ons a
rreste
d f
or
dru
g t
raffic
kin
g
Pers
ons t
ried f
or
dru
g t
raffic
kin
g
Pers
ons c
onvic
ted f
or
dru
g t
raffic
kin
g
Male
s
Fem
ale
s
Tota
l M
ale
s
Fem
ale
s
Tota
l M
ale
s
Fem
ale
sT
ota
l
Age G
roup
< 1
0
10-1
4
15-1
9
20-2
4
25-2
9
30-3
4
35-3
9
40-4
5
45 a
nd m
ore
TO
TA
L
Em
plo
ym
ent
Sta
tus
Em
plo
yed
Self-e
mplo
yed
Un
em
plo
ye
d/
Ho
me
ma
ke
r
Retire
d
Occu
pa
tio
n
Pro
fessio
nal
Skill
ed
Unskill
ed
Stu
dent
TO
TA
L
La
w E
nfo
rcem
ent
Arr
ests
/Tri
als
/Co
nv
icti
on
s fo
r D
rug
Tra
ffic
kin
g
69
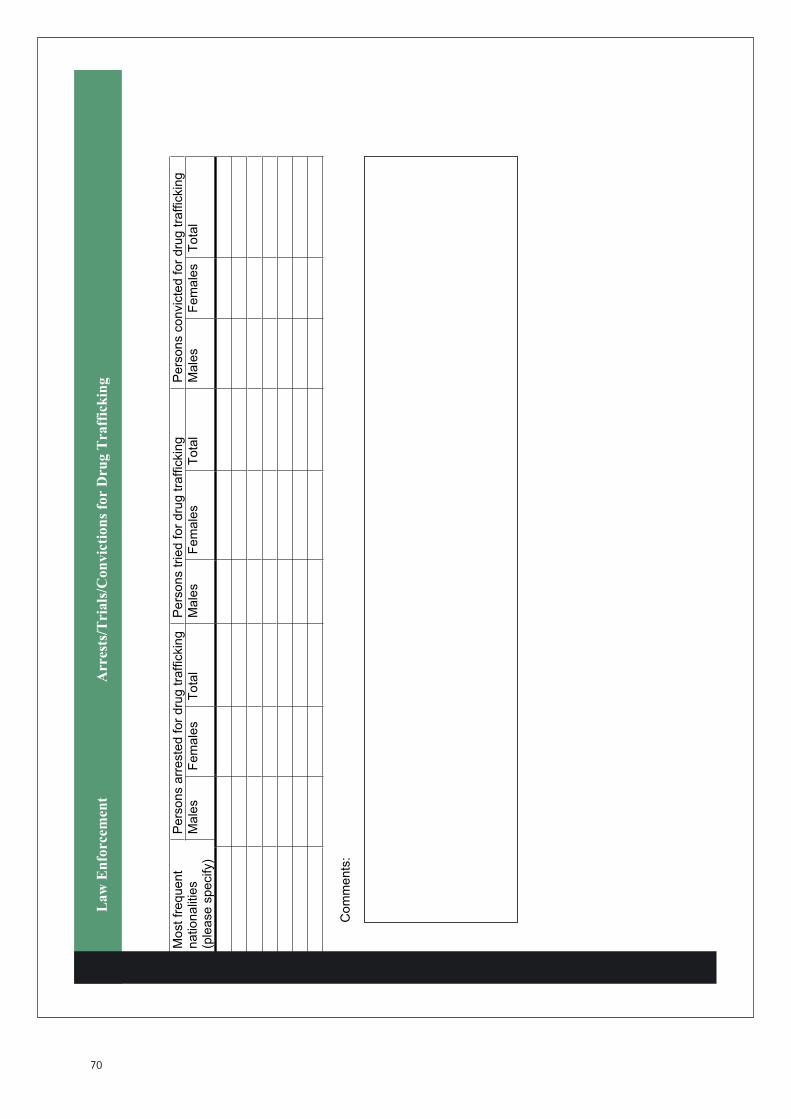
Pers
ons a
rreste
d f
or
dru
g t
raffic
kin
g
Pers
ons t
ried f
or
dru
g t
raffic
kin
g
Pers
ons c
onvic
ted f
or
dru
g t
raffic
kin
gM
ost
frequent
nationalit
ies
(ple
ase s
pecify)
Male
s
Fem
ale
s
Tota
l M
ale
s
Fem
ale
s
Tota
l M
ale
s
Fem
ale
sT
ota
l
Com
ments
:
La
w E
nfo
rcem
ent
Arr
ests
/Tri
als
/Co
nv
icti
on
s fo
r D
rug
Tra
ffic
kin
g
70
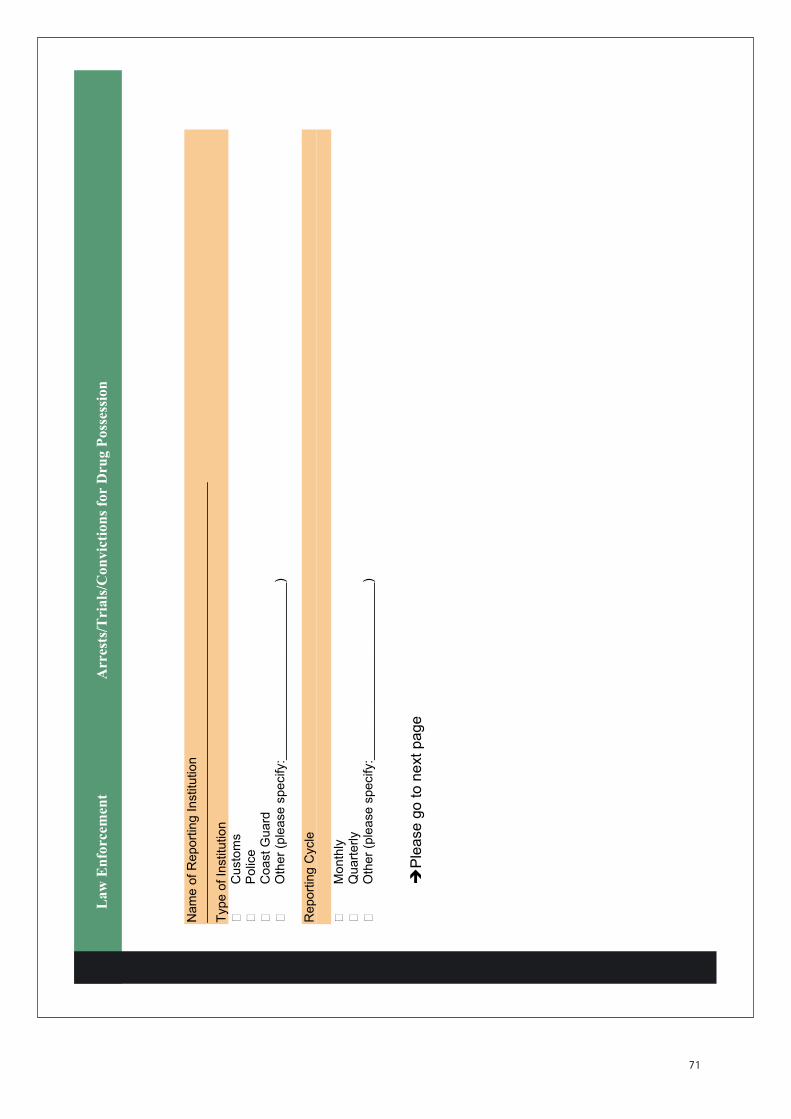
Nam
e o
f R
eport
ing I
nstitu
tion
Type o
f In
stitu
tion
C
usto
ms
P
olic
e
C
oast
Guard
Oth
er
(ple
ase s
pecify:_
______________
__________)
Report
ing C
ycle
M
onth
ly
Q
ua
rte
rly
O
ther
(ple
ase s
pecify:_
______________
__________)
Ple
ase
go
to
ne
xt
pa
ge
La
w E
nfo
rcem
ent
Arr
ests
/Tri
als
/Co
nv
icti
on
s fo
r D
rug
Po
sses
sio
n
71
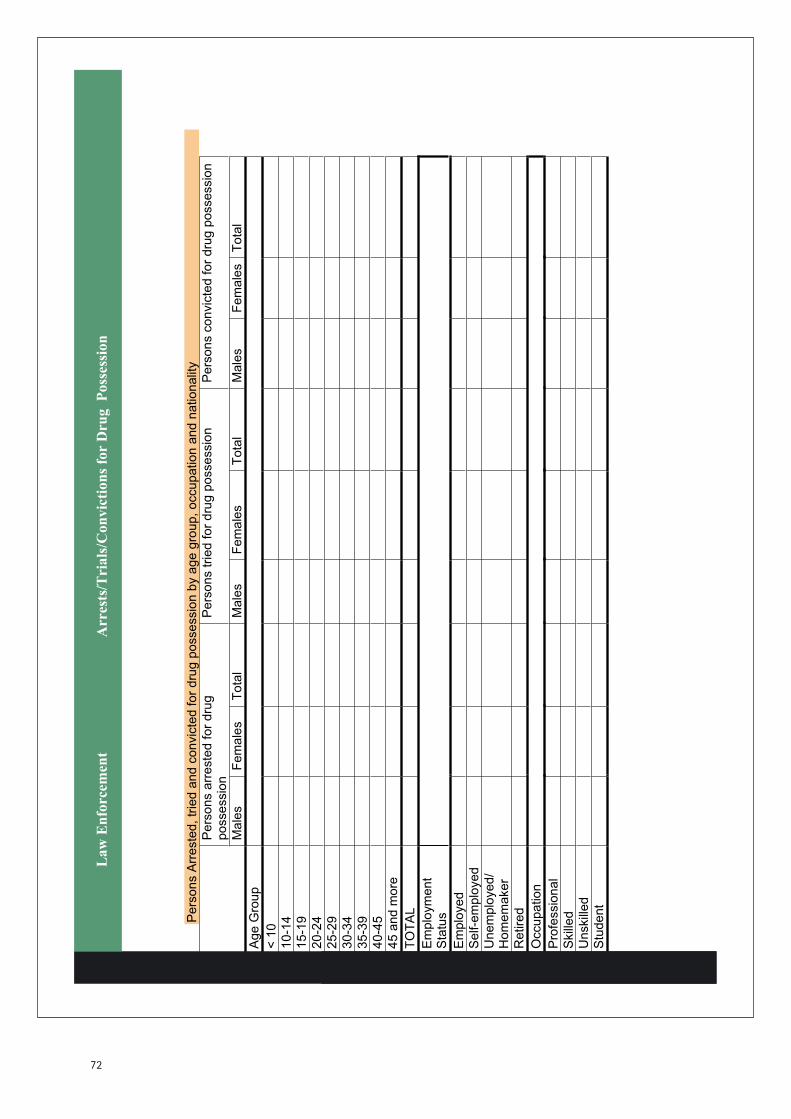
Pers
ons A
rreste
d,
trie
d a
nd c
onvic
ted f
or
dru
g p
ossessio
n b
y a
ge g
roup,
occupation a
nd n
ationalit
y
Pers
ons a
rreste
d f
or
dru
g
po
sse
ssio
nP
ers
ons t
ried f
or
dru
g p
ossessio
n
Pers
ons c
onvic
ted f
or
dru
g p
ossessio
n
Male
s
Fem
ale
s
Tota
l M
ale
s
Fem
ale
s
Tota
l M
ale
s
Fem
ale
sT
ota
l
Age G
roup
< 1
0
10-1
4
15-1
9
20-2
4
25-2
9
30-3
4
35-3
9
40-4
5
45 a
nd m
ore
TO
TA
L
Em
plo
ym
ent
Sta
tus
Em
plo
yed
Self-e
mplo
yed
Un
em
plo
ye
d/
Ho
me
ma
ke
r
Retire
d
Occu
pa
tio
n
Pro
fessio
nal
Skill
ed
Unskill
ed
Stu
dent
La
w E
nfo
rcem
ent
Arr
ests
/Tri
als
/Co
nv
icti
on
s fo
r D
rug
P
oss
essi
on
72
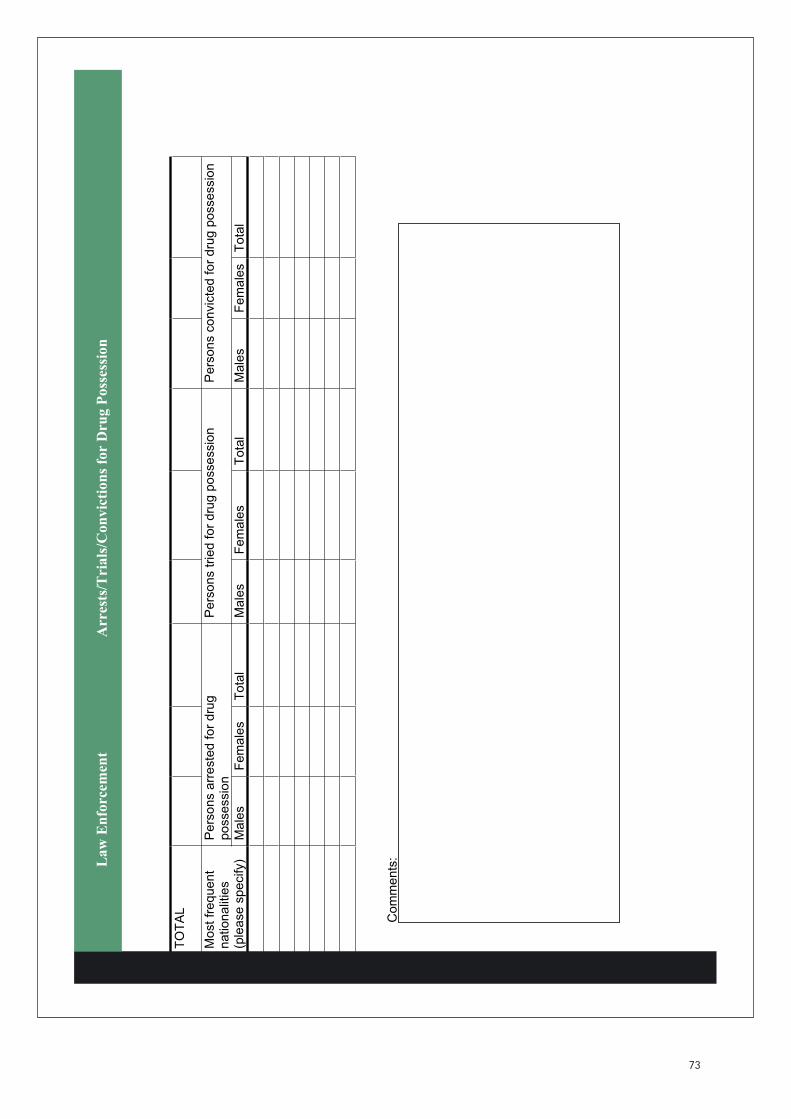
TO
TA
L
Pers
ons a
rreste
d f
or
dru
g
po
sse
ssio
nP
ers
ons t
ried f
or
dru
g p
ossessio
n
Pers
ons c
onvic
ted f
or
dru
g p
ossessio
n
Most
frequent
nationalit
ies
(ple
ase s
pecify)
Male
s
Fem
ale
s
Tota
l M
ale
s
Fem
ale
s
Tota
l M
ale
s
Fem
ale
sT
ota
l
Com
ments
:
La
w E
nfo
rcem
ent
Arr
ests
/Tri
als
/Co
nv
icti
on
s fo
r D
rug
Po
sses
sio
n
73

Name of Reporting Institution
Type of Institution Customs Police Coast Guard Other (please specify:_________________________)
Please specify what amount is permitted for recreational use (does the legislation distinguish between trafficable quantity and personal use) in your country? Please specify:
_________________________________________________________________________________________________________________________________________________________________________________________________________________________________________________________________________________________________________________________________________________________
Law Enforcement Legislation
74
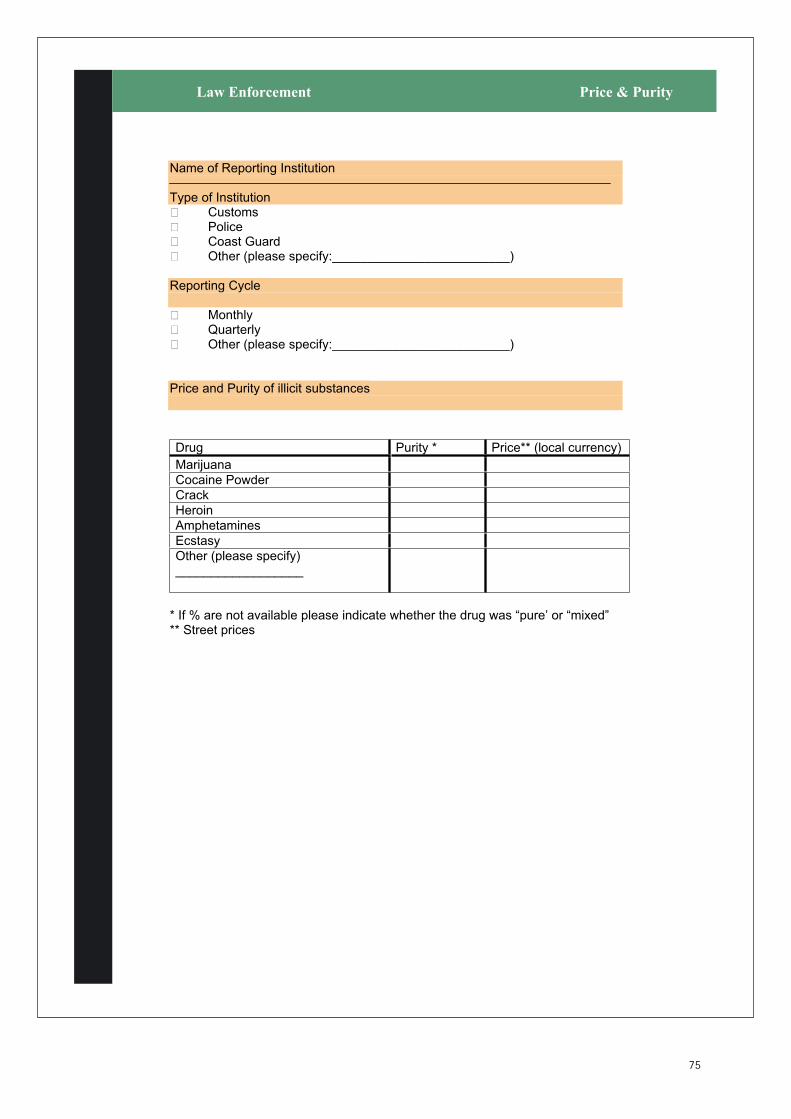
Name of Reporting Institution
Type of Institution Customs Police Coast Guard Other (please specify:_________________________)
Reporting Cycle
Monthly Quarterly Other (please specify:_________________________)
Price and Purity of illicit substances
Drug Purity * Price** (local currency)
Marijuana
Cocaine Powder
Crack
Heroin
Amphetamines
Ecstasy
Other (please specify) __________________
* If % are not available please indicate whether the drug was “pure’ or “mixed” ** Street prices
Law Enforcement Price & Purity
75
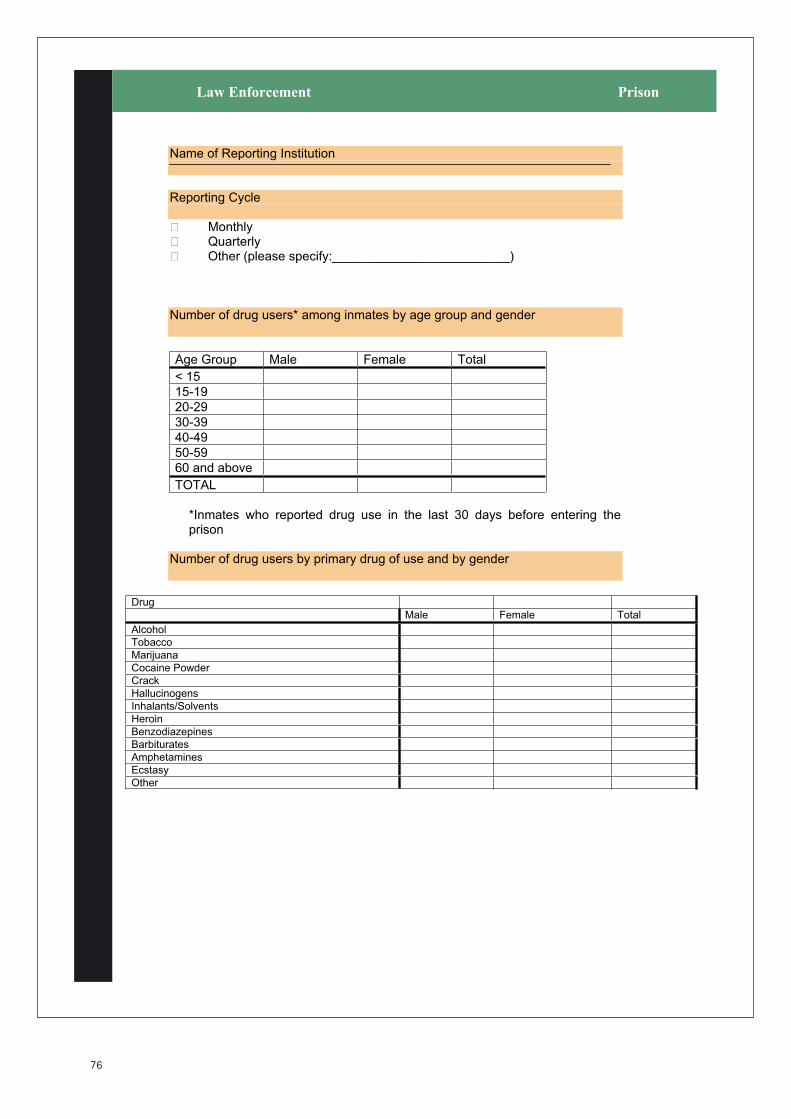
Name of Reporting Institution
Reporting Cycle
Monthly Quarterly Other (please specify:_________________________)
Number of drug users* among inmates by age group and gender
Age Group Male Female Total
< 15
15-19
20-29
30-39
40-49
50-59
60 and above
TOTAL
*Inmates who reported drug use in the last 30 days before entering the prison
Number of drug users by primary drug of use and by gender
Drug
Male Female Total
Alcohol
Tobacco
Marijuana
Cocaine Powder
Crack
Hallucinogens
Inhalants/Solvents
Heroin
Benzodiazepines
Barbiturates
Amphetamines
Ecstasy
Other
Law Enforcement Prison
76
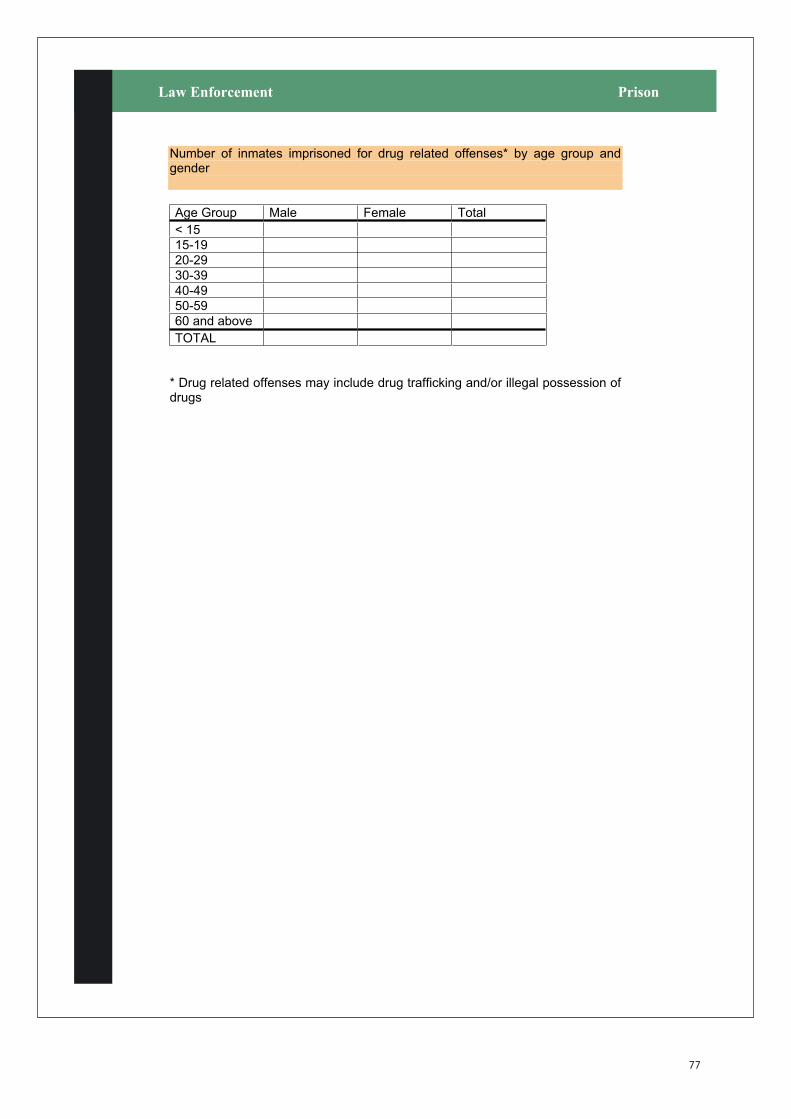
Number of inmates imprisoned for drug related offenses* by age group and gender
Age Group Male Female Total
< 15
15-19
20-29
30-39
40-49
50-59
60 and above
TOTAL
* Drug related offenses may include drug trafficking and/or illegal possession of drugs
Law Enforcement Prison
77

Name of Reporting Institution
Reporting Cycle
Monthly Quarterly Other (please specify:_________________________)
Type of Center
Public
Private
Other
Total number of clients admitted for drug related problems* by age group and gender
Age Group Male Female Total
< 15
15-19
20-29
30-39
40-49
50-59
60 and above
TOTAL
* Drug related problems may refer to injuries, violence, attempted suicide that occurred under the influence of drugs.
Emergency Room
78
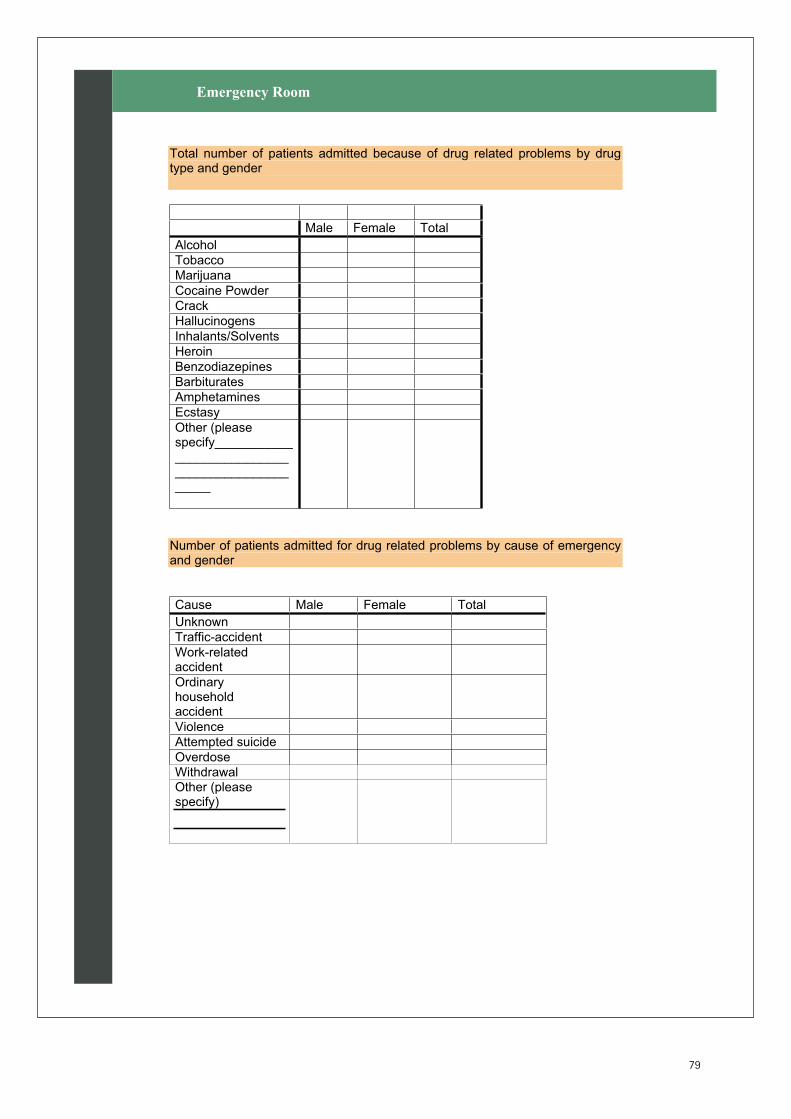
Total number of patients admitted because of drug related problems by drug type and gender
Male Female Total
Alcohol
Tobacco
Marijuana
Cocaine Powder
Crack
Hallucinogens
Inhalants/Solvents
Heroin
Benzodiazepines
Barbiturates
Amphetamines
Ecstasy
Other (please specify________________________________________________
Number of patients admitted for drug related problems by cause of emergency and gender
Cause Male Female Total
Unknown
Traffic-accident
Work-relatedaccident
Ordinaryhouseholdaccident
Violence
Attempted suicide
Overdose
Withdrawal Other (please specify)
Emergency Room
79


Annex IV
81
Checklist
Trainer’s checklist
Hardware
1. Data projector, with spare bulbs, extension lead and peripheries.
2. Laptop or desktop computer for use by the trainer.
3. Sufficient computers to meet the requirements of the course, that
is, enough to serve the number of participants, with at most two
sharing a computer.
4. Necessary power supply support, such as uninterrupted power sup-
plies and appropriate transformers.
5. 2 X 1.44 MB diskettes (a minimum of two per participant).
Software
The software used during the course is described below and should be loaded
on the trainer’s and students’ machines:
1. SPSS 11, including the “Syntax Guide”.
2. Adobe Acrobat.
3. Microsoft Excel, Word and PowerPoint.
4. Internet Explorer.
5. Copies of the PowerPoint presentations of the course on CD, one
for each member of the course.
Documentation
A hard copy of the PowerPoint presentations in “Note view” for each of the
participants.

82
GAP Toolkit Module 5 Training in basic drug abuse data management and analysis
Participants’ checklist
If available, it would be useful for the participants to bring to the sessions any questionnaires
and/or data they are currently working on as part of their drug information network.
1. Questionnaires/data collection forms used within your drug information network.
2. Data files of any data collected as part of your drug information network.

General resources
83
References
1. C. Wringe, Understanding Educational Aims (London, Unwin Hyman,
1988).
2. C. Marsh, Exploring Data: An Introduction to Data Analysis for Social
Scientists (Cambridge, Polity Press, 1988).
3. D. S. Moore, Statistics: Concepts and Controversies, 5th ed. (New York,
W. H. Freeman Press, 2000).
4. E. Babbie, The Practice of Social Research (Belmont, California,
Wadsworth/Thomson Learning, 2001), chap. 16.
Further reading
A. Agresti, An Introduction to Categorical Data Analysis (New York, John
Wiley and Sons, 1996).
A. Agresti and B. Finlay, Statistical Methods for the Social Sciences (Upper
Saddle River, New Jersey, Pearson Education/Prentice Hall, 1997).
A. Bowling, Research Methods in Health: Investigating Health and Health
Services (Milton Keynes, Open University Press, 2002).
D. De Vaus, Surveys in Social Research (London, Routledge, 2002).
J. Fielding, “Coding and managing data”, Researching Social Life, N. Gilbert,
ed. (London, Sage Publications, 1993).
N. Gilbert, Researching Social Life (London, Sage Publications, 1993).
C. A. Moser and G. Kalton, Survey Methods in Social Investigation (Aldershot,
Dartmouth Publishing, 1993).
United Nations Office on Drugs and Crime, Global Assessment Programme on
Drug Abuse: Toolkit Module 1: Developing an Integrated Drug Information
System (United Nations publication, 2003) (available at
www.unodc.org/unodc/drug_demand_gap_m-toolkit.html).

84
GAP Toolkit Module 5 Training in basic drug abuse data management and analysis
United Nations Office on Drugs and Crime, Global Assessment Programme on Drug Abuse:
Toolkit Module 2: Estimating Prevalence: Indirect Methods for Estimating the Size of the Drug
Problem (United Nations publication, 2003) (available at www.unodc.org/unodc/
drug_demand_gap_m-toolkit.html).
United Nations Office on Drugs and Crime, Global Assessment Programme on Drug Abuse:
Toolkit Module 3: Conducting School Surveys on Drug Abuse (United Nations publication,
Sales No. E.03.XI.18) (available at www.unodc.org/unodc/drug_demand_gap_m-toolkit.html).

*0456595*Printed in AustriaV.04-56595—August 2005—1,150United Nations publicationSales No. E.05.XI.11ISBN 92-1-148204-6

�Back to first page