Embed Size (px)
DESCRIPTION
GAP Toolkit 5 Training in basic drug abuse data management and analysis. Training session 7 SPSS: Recode and Compute. Objectives. To introduce and demonstrate SPSS tools for recoding variables and creating new variables To introduce and demonstrate the use of SPSS command syntax - PowerPoint PPT Presentation
Citation preview

GAP Toolkit 5 Training in basic drug abuse data management and analysis
Training session 7
SPSS: Recode and Compute

Objectives
• To introduce and demonstrate SPSS tools for recoding variables and creating new variables
• To introduce and demonstrate the use of SPSS command syntax
• To introduce and demonstrate Help features in SPSS from a dialogue box

Types of recode
• A categorical variable into a new set of categories• A continuous variable into a categorical variable

Recode approaches
• Into pre-defined categories of interest• Into categories of equal size

Example: pre-defined categories
• Recode weekly expenditure on drugs into the following categories:– Low expenditure <= £100 a week– High expenditure >= £101 a week


select variable for recoding and click


click here to map old new values


Frequency Percent Valid percent
Cumulative percent
Valid Low 31 62.0 62.0 62.0
High 19 38.0 38.0 100.0
Total 50 100.0 100.0
Weekly drug expenditure

Example: quantiles
• Recode weekly expenditure into the following:– 4 categories, each with approximately the same number of
cases (quartiles)– 10 categories, each with approximately the same number of
cases (deciles)

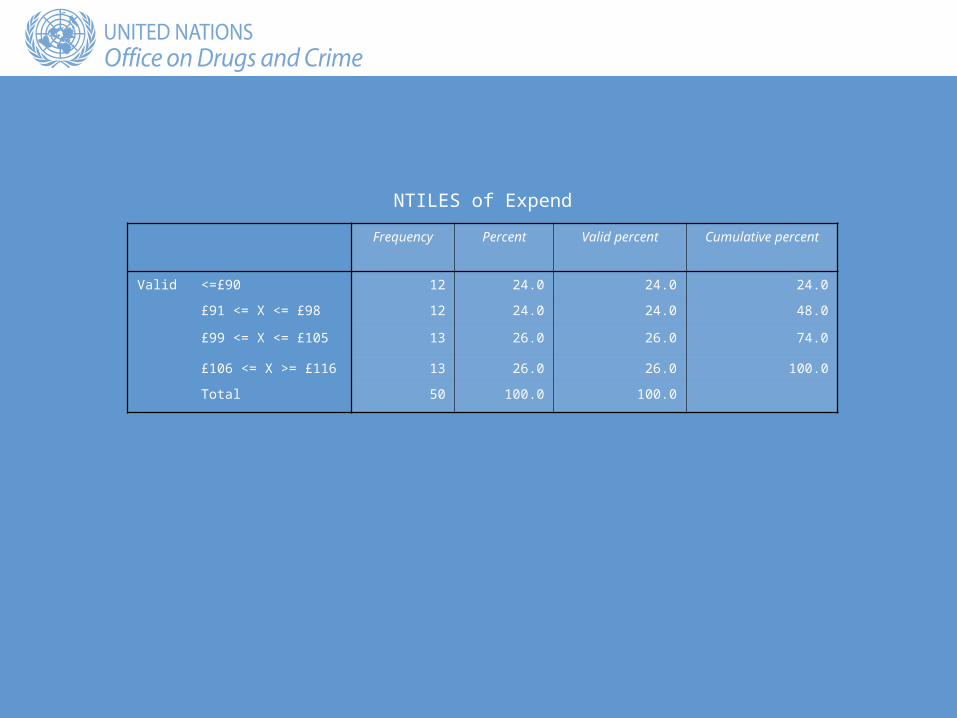
Frequency Percent Valid percent Cumulative percent
Valid <=£90 12 24.0 24.0 24.0
£91 <= X <= £98 12 24.0 24.0 48.0
£99 <= X <= £105 13 26.0 26.0 74.0
£106 <= X >= £116 13 26.0 26.0 100.0
Total 50 100.0 100.0
NTILES of Expend

Frequency Percentage Valid percentage Cumulative percentage
Valid 1 5 10.0 10.0 10.0
2 4 8.0 8.0 18.0
3 7 14.0 14.0 32.0
4 4 8.0 8.0 40.0
5 4 8.0 8.0 48.0
6 6 12.0 12.0 60.0
7 5 10.0 10.0 70.0
8 5 10.0 10.0 80.0
9 6 12.0 12.0 92.0
10 4 8.0 8.0 100.0
Total 50 100.0 100.0
NTILES of EXPEND
Compute
• Creates new variables using:– Standard mathematical operators– A full range of functions– Conditional statements
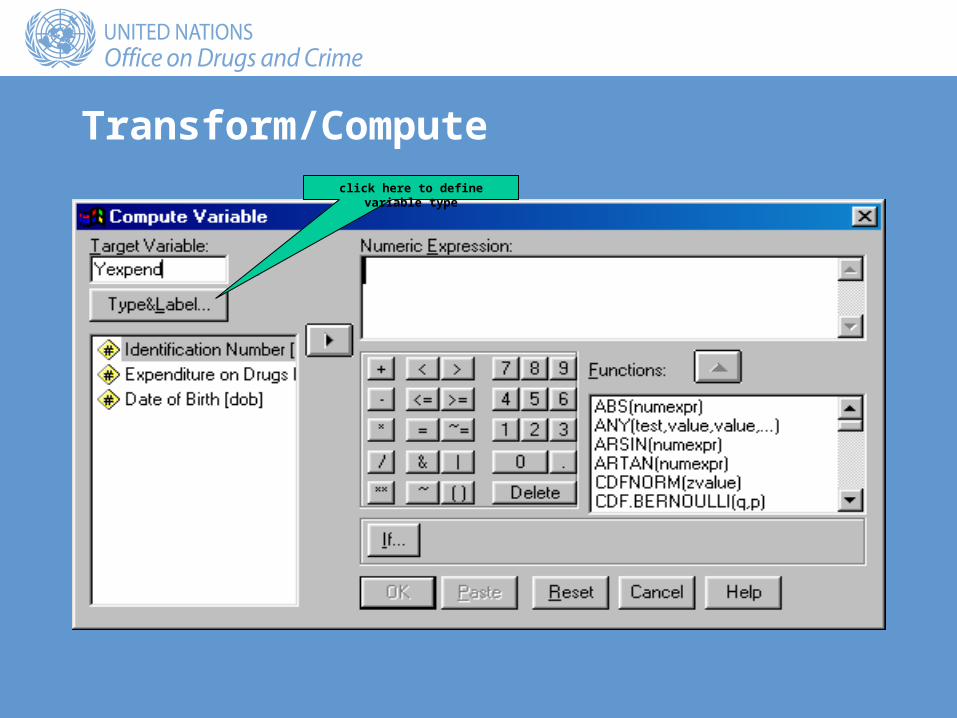
Transform/Computeclick here to define variable type
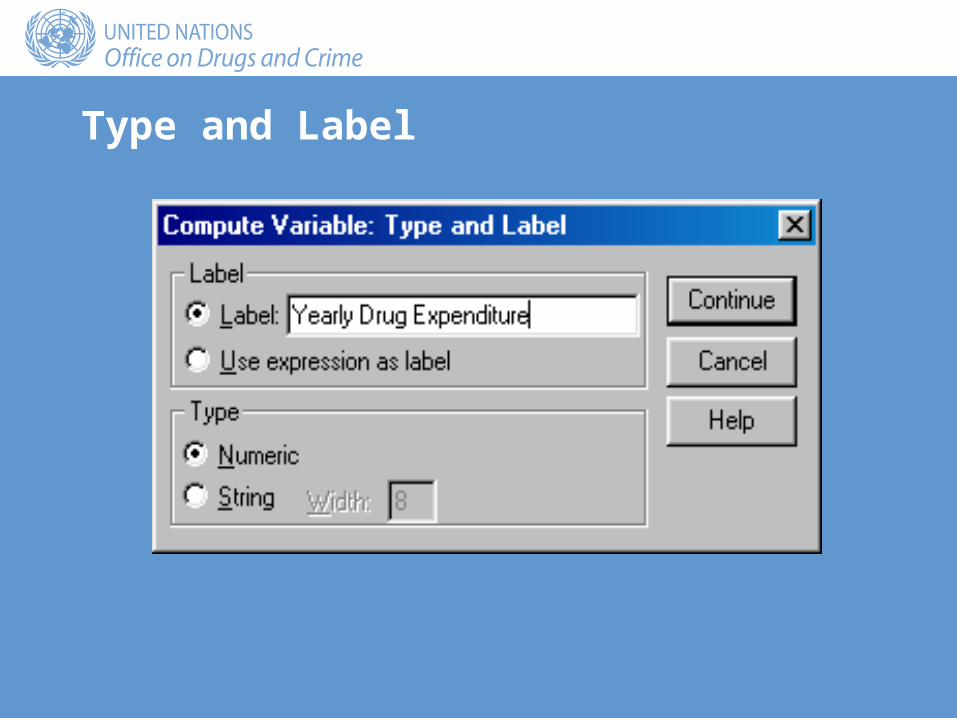
Type and Label
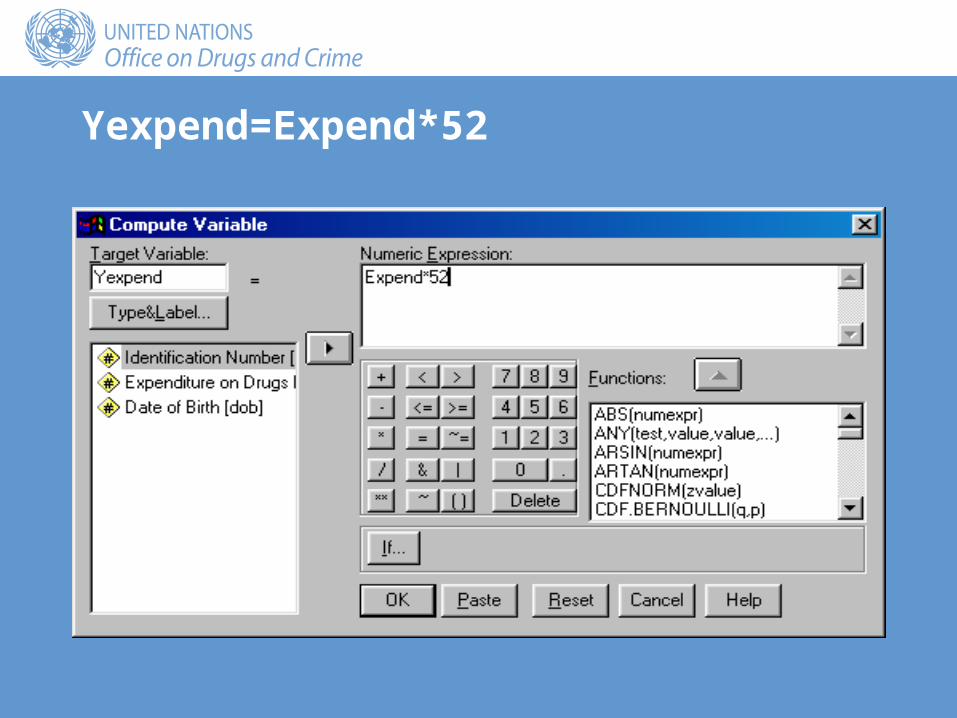
Yexpend=Expend*52

Explore: Yexpend
Statistic Std. error
Yearly drug expenditure Mean 5062.72 77.468
95% Confidence Interval for Mean
Lower Bound 4907.04
Upper Bound 5218.40
5% Trimmed Mean 5072.89
Median 5148.00
Variance 300062.3
Std. Deviation 547.779
Minimum 3848
Maximum 6032
Range 2184
Interquartile Range 754.00
Skewness -.333 .337
Kurtosis -.446 .662
Descriptives

Example 2: Age
• Convert date of birth to age in years
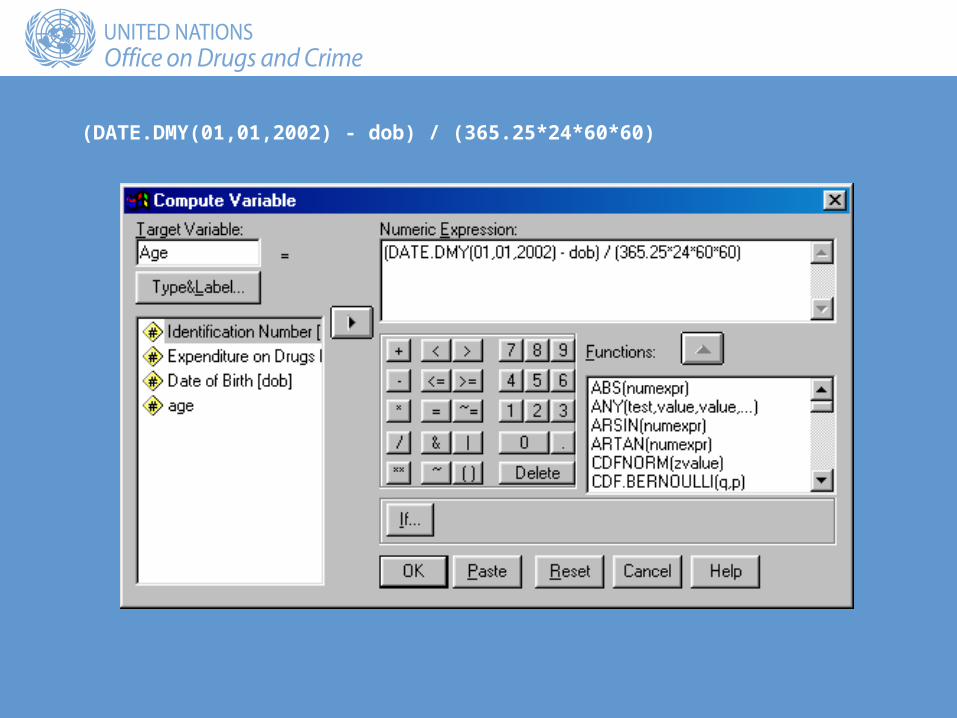
(DATE.DMY(01,01,2002) - dob) / (365.25*24*60*60)

Explore: Age
Statistic Std. error
AGE Mean 25.43 1.219
95% Confidence Interval for Mean
Lower Bound 22.97
Upper Bound 27.88
5% Trimmed Mean 25.21
Median 22.84
Variance 72.867
Std. Deviation 8.536
Minimum 11
Maximum 44
Range 32
Interquartile Range 12.77
Skewness .579 .340
Kurtosis -.518 .668
Descriptives
Help
• Context-sensitive Help:– Right click on any part of a dialogue box to obtain help
• Dialogue box Help button


Command language
• Command-line rather than Windows interface• More flexible• Reusable• Saved as text files

Syntax window
• Enter SPSS commands:– Type directly– Paste from a dialogue box
• Run SPSS commands• Save as a text file

The Paste button
click to copy command into Syntax Window


The Run menu

Syntax for Age

Summary
• Recode:– Into same variable– Into different variable
• Compute:– Mathematical operators– Functions
• Dialogue box Help:– Context-sensitive Help– Dialogue box Help button
• Command language:– Syntax Window– Dialogue box Paste button