Embed Size (px)
Citation preview
APPENDIX E
Traffi c Study

CENTER AVENUE SKATE PARK Traffic Analysis December 2011

DRAFT
City Of Huntington Beach
CENTER AVENUE SKATE PARK Prepared by: Austin-Foust Associates, Inc. 2223 Wellington Avenue, Suite 300 Santa Ana, California 92701-3161 (714) 667-0496 December 23, 2011

CONTENTS Page
1.0 INTRODUCTION Background and Scope ............................................................................................................ 1-1 Performance Criteria ............................................................................................................... 1-4 Study Area ............................................................................................................................... 1-8 References ............................................................................................................................... 1-8
2.0 TRANSPORTATION SETTING Existing Conditions ................................................................................................................. 2-1 Future Conditions .................................................................................................................... 2-9
3.0 PROJECT DESCRIPTION Project Description .................................................................................................................. 3-1 Trip Generation ....................................................................................................................... 3-1 General Plan Comparison ....................................................................................................... 3-4 Trip Distribution ..................................................................................................................... 3-4
4.0 IMPACT ANALYSIS Existing Plus Project Conditions ............................................................................................. 4-1 Short-Range Analysis ............................................................................................................. 4-4 Long-Range Analysis .............................................................................................................. 4-4 Freeway Ramp Volumes ......................................................................................................... 4-9
5.0 OTHER ITEMS Parking Management Plan ...................................................................................................... 5-1 Project Access ......................................................................................................................... 5-2 Alternative Modes of Travel ................................................................................................... 5-3 APPENDICES: A: Peak Hour Volume Diagrams B: Intersection Capacity Utilization Worksheets C: HCM Worksheets D: Derivation of Trip Rates for Skate Park E: Project Share Contribution Worksheets

LIST OF FIGURES AND TABLES Page FIGURES 1-1 Project Location ............................................................................................................................. 1-2 1-2 Intersections in Study Area ............................................................................................................ 1-9 2-1 Existing Midblock Lanes ............................................................................................................... 2-2 2-2 Existing ADT Volumes ................................................................................................................. 2-3 2-3 Existing AM Peak Hour Volumes ................................................................................................. 2-4 2-4 Existing PM Peak Hour Volumes .................................................................................................. 2-5 2-5 Intersection Location Map ............................................................................................................. 2-7 2-6 Master Plan of Arterial Highways ............................................................................................... 2-10 3-1 Project Site Map ............................................................................................................................ 3-2 3-2 Trip Distribution ............................................................................................................................ 3-5 3-3 ADT Volumes – Project Only ....................................................................................................... 3-6 4-1 Existing Plus Project ADT Volumes ............................................................................................. 4-2 4-2 2016 ADT Volumes – With Project .............................................................................................. 4-5 4-3 2030 ADT Volumes – Current General Plan ................................................................................. 4-7 4-4 2030 ADT Volume – With Proposed Project ................................................................................ 4-8 5-1 Proposed Shuttle Route For Skate Park ......................................................................................... 5-3 5-2 Project Access Volumes ................................................................................................................ 5-4 5-3 Existing Bikeways ......................................................................................................................... 5-7 5-4 Bus Routes ..................................................................................................................................... 5-8 TABLES 1-1 Performance Criteria – Intersections ............................................................................................. 1-5 1-2 Level of Service Descriptions – Signalized Intersections .............................................................. 1-6 1-3 Freeway Ramp Performance Criteria ............................................................................................ 1-7 2-1 Existing Intersection Level of Service Summary .......................................................................... 2-6 2-2 Existing Freeway Ramp V/C Summary ......................................................................................... 2-8 3-1 Center Avenue Skate Park Trip Generation .................................................................................. 3-3 4-1 Existing-Plus-Project ICU Summary ............................................................................................. 4-3 4-2 2016 ICU Summary ....................................................................................................................... 4-6 4-3 2030 ICU Summary ..................................................................................................................... 4-10 4-4 Future Freeway Ramp V/C Summary ......................................................................................... 4-11 5-1 Center Avenue Skate Park Trip Generation ................................................................................. 5-6

City of Huntington Beach 1-1 Austin-Foust Associates, Inc. Center Avenue Skate Park 503008rpt.doc
Chapter 1.0 INTRODUCTION
This report summarizes the results of a traffic study for the proposed Center Avenue Skate Park
Project in the City of Huntington Beach. The study provides the technical information for the
environmental impact report (EIR) being prepared for this project.
BACKGROUND AND SCOPE
The proposed project will occupy a 2.718-acre site located on Center Avenue, approximately 500
feet east of Gothard Street. Figure 1-1 illustrates the project location, and the site is currently vacant.
Access will be from Center Avenue, just east of the intersection of Gothard Street and Center Avenue.
The proposed project comprises 45,500 square feet of skate park activities, including 13,000
square feet of skate bowl area, 14,000 square feet of skate park plaza area, a 3,500 square foot skate
shop/concession/restroom building, and 15,000 square feet of turf/walking area. The skate park will be
open to the public and operate seven days a week. Times of operation will be weekdays from 10:00 AM
to 10:00 PM and weekends from 10:00 AM to 10:00 PM.
The traffic study provides a near term (existing year) analysis, and short-range and long-range
impact analyses of the proposed project. The near term analysis examines the existing-plus-project
impacts and is compared against existing conditions to satisfy the California Environmental Quality Act
(CEQA) requirements. The short-range analysis addresses conditions shortly after project completion and
identifies project impacts related to additional traffic on the surrounding area street system in this
timeframe. The long-range analyzes the project in a General Plan context.
Traffic analysis data sets presented in this traffic study are thereby as follows:
1. Existing Conditions
2. Existing plus project
3. Short-range no-project


City of Huntington Beach 1-3 Austin-Foust Associates, Inc. Center Avenue Skate Park 503008rpt.doc
4. Short-range with-project
5. Long-range with-project
6. Long-range with current General Plan uses on the site
For the short-range impact analysis, the additional trips that will be generated by the proposed
uses are added to the no-project background traffic conditions to show the impacts of the proposed
project. The background (no-project) conditions are established by interpolating between existing and
long-range traffic volumes. This accounts for ambient growth, including development anticipated to
occur in the surrounding area in this short-range time frame. The short-range analysis time frame is
referred to as 2016, which is after anticipated project occupancy (expected in 2012). It thereby fully
accounts for project buildout and also addresses Growth Management Plan (GMP) and Congestion
Management Program (CMP) needs for a short-range (five to seven years) time frame.
The long-range analysis compares the current General Plan land uses with those proposed by the
project. A year 2030 time frame is used for this analysis. The year 2030 forecasts are produced using the
Huntington Beach Traffic Model (HBTM). This is a certified subarea model derived from the Orange
County Transportation Analysis Model (OCTAM), following the consistency guidelines established by
the Orange County Transportation Authority (OCTA).
Performance criteria appropriate for the jurisdictions involved (City of Westminster, Caltrans and
the City of Huntington Beach) are applied to the traffic volume data. These performance criteria use peak
hour intersection volumes to measure level of service (LOS) and to define levels of significance for EIR
purposes (see later section of this chapter).
To establish the trip generation estimates for the project, a special analysis has been carried out to
identify applicable trip rates for the proposed skate park. Local skate parks within Orange County were
surveyed, and a trip rate derived from the count data.
Consistent with the requirements of an EIR, only committed roadway improvements have been
assumed, even for the long-range analysis using General Plan buildout land uses. A discussion of the
assumptions in the committed network is provided in Chapter 2.0.
City of Huntington Beach 1-4 Austin-Foust Associates, Inc. Center Avenue Skate Park 503008rpt.doc
PERFORMANCE CRITERIA
The performance criteria used for evaluating traffic volumes and capacities on the study area
street system are based on peak hour volumes. Using peak hour intersection turn movement volumes and
the intersection lane geometry, intersection capacity utilization (ICU) values are calculated for each of the
AM and PM peak hours. The ICU values represent volume/capacity (V/C) ratios for these time periods,
and thereby provide a suitable measure of system performance. For Caltrans intersections, the delay-
based methodology, as contained in the Highway Capacity Manual (HCM), is also used (i.e., both ICU
values and average delay are calculated for these intersections).
Table 1-1 summarizes the criteria used for the intersection LOS calculations and the relationship
between ICU, average vehicle delay, and LOS. The significance criteria for intersections based on ICU
contribution is also listed in the table. This is used for both City and Caltrans intersections (the delay
calculations are used only to verify the LOS results as calculated from the ICU values).
Table 1-2 describes traffic flow quality for different V/C and vehicle delay ranges. Traffic levels
of service are designated “A” through “F”, with LOS “A” representing free flow conditions and LOS “F”
representing severe traffic congestion. As listed in the previously referenced performance criteria table,
LOS “D” (ICU not to exceed .90) is the performance standard that has been adopted by the Cities of
Huntington Beach and Westminster, whereas LOS “E” (ICU not to exceed 1.00) is the performance
standard for Orange County CMP (CMP) intersections. One CMP intersection is located in the study
area:
Beach Boulevard at Edinger Avenue
Although LOS “E” is acceptable for CMP purposes at this location, the City performance
standard of LOS “D” is typically used in traffic analysis applications.
Freeway interchange ramps are also included in the analysis and Table 1-3 summarizes the
criteria used for freeway ramps. The analysis is based on peak hour V/C ratios, with capacity being a
function of the particular operating characteristics of each ramp.

City of Huntington Beach 1-5 Austin-Foust Associates, Inc. Center Avenue Skate Park 503008rpt.doc
Table 1-1
PERFORMANCE CRITERIA - INTERSECTIONS
The following are the performance criteria used for comparing volumes and capacities on the study area intersection:
I. PEAK HOUR INTERSECTION VOLUMES Intersection capacity utilization (ICU) values calculated as follows: Saturation Flow Rate: 1,700 vehicles per hour (VPH). Clearance Interval: .05 ICU Performance Standard
Arterial intersections to achieve level of service (LOS) D or better (ICU not to exceed .90)
Orange County Congestion Management Program (CMP) designated intersections to
achieve LOS E or better (ICU not to exceed 1.00) LOS ranges for ICU values are as follows: ICU LOS 0.00 – 0.60 A 0.61 – 0.70 B 0.71 – 0.80 C 0.81 – 0.90 D 0.91 – 1.00 E Above 1.00 F
Significance Criteria
Project causes a significant impact if it contributes .01 or more to an ICU when the performance standard is exceeded.
II. CALTRANS INTERSECTIONS AND UNSIGNALIZED ACCESS INTERSECTIONS
Intersection LOS based on average vehicle delay in seconds as calculated using Highway Capacity Manual (HCM) procedures. Performance standard as above, and LOS values for average vehicle delay are as follows:
Level of Service Signalized Unsignalized A 0 – 10.00 0 – 10.00 B 10.01 – 20.00 10.01 – 15.00 C 20.01 – 35.00 15.01 – 25.00 D 35.01 – 55.00 25.01 – 35.00 E 55.01 – 80.00 35.01 – 50.00 F 80.01 and up 50.01 and up

City of Huntington Beach 1-6 Austin-Foust Associates, Inc. Center Avenue Skate Park 503008rpt.doc
Table 1-2
LEVEL OF SERVICE DESCRIPTIONS – SIGNALIZED INTERSECTIONS
Levels of service (LOS) for signalized intersections are defined in terms of control delay as follows:
LOS
Description
Delay Per Vehicle (secs)
A
LOS A describes operations with low control delay, up to 10 seconds per vehicle. This LOS occurs when progression is extremely favorable and most vehicles arrive during the green phase. Many vehicles do not stop at all. Short cycle lengths may tend to contribute to low delay values.
< 10
B LOS B describes operations with control delay greater than 10 and up to 20 seconds per vehicle. This level generally occurs with good progression, short cycle lengths, or both. More vehicles stop than the LOS A, causing higher levels of delay.
10 – 20
C LOS C describes operations with control delay greater than 20 and up to 35 seconds per vehicle. These higher delays may result from only fair progression, longer cycle lengths, or both. Individual cycle failures may begin to appear at this level. Cycle failure occurs when a given green phase does not serve queued vehicles, and overflows occur. The number of vehicles stopping is significant at this level, though many still pass through the intersection without stopping.
20 – 35
D LOS D describes operations with control delay greater than 35 and up to 55 seconds per vehicle. At LOS D, the influence of congestion becomes more noticeable. Longer delays may result from some combination of unfavorable progression, long cycle lengths, and high V/C ratios. Many vehicles stop, and the proportion of vehicles not stopping declines. Individual cycle failures are noticeable.
35 – 55
E LOS E describes operations with control delay greater than 55 and up to 80 seconds per vehicle. These high delay values generally indicate poor progression, long cycle lengths, and high V/C ratios. Individual cycle failures are frequent.
55 – 80
F LOS F describes operations with control delay in excess of 80 seconds per vehicle. This level, considered unacceptable to most drivers, often occurs with oversaturation, that is, when arrival flow rates exceed the capacity of lane groups. It may also occur at high V/C ratios with many individual cycle failures. Poor progression and long cycle lengths may also contribute significantly to high delay levels.
> 80
Source: Highway Capacity Manual 2000, Transportation Research Board, National Research Council

City of Huntington Beach 1-7 Austin-Foust Associates, Inc. Center Avenue Skate Park 503008rpt.doc
Table 1-3
FREEWAY RAMP PERFORMANCE CRITERIA
V/C Calculation Methodology
Level of service to be based on peak hour volume/capacity (V/C) ratios calculated using the following ramp capacities:
Metered On-Ramps
A maximum capacity of 900 vehicles per hour (vph) for a one-lane metered on-ramp with only one mixed-flow lane at the meter.
A maximum capacity of 1,080 (20 percent greater than 900) vph for a one-lane metered on-ramp with one mixed-flow lane at the meter plus one HOV preferential lane at the meter.
A maximum capacity of 1,500 vph for a one-lane metered on-ramp with two mixed-flow lanes at the meter.
A maximum capacity of 1,800 vph for a two-lane metered on-ramp with two mixed-flow lanes at the meter.
Non-Metered On-Ramps and Off-Ramps A maximum capacity of 1,500 vph for a one-lane ramp.
A maximum capacity of 2,250 (50 percent greater than 1,500) vph for a two-lane on-ramp that tapers to one merge lane at or beyond the freeway mainline gore point and for a two-lane off-ramp with only one auxiliary lane.
A maximum capacity of 3,000 vph for a two-lane on-ramp that does not taper to one merge lane and for a two-lane off-ramp with two auxiliary lanes.
Performance Standard Level of Service “E” (peak hour V/C less than or equal to 1.00). Significance Criteria
Project causes a significant impact if it contributes .01 or more to a ramp V/C ratio when the performance standard is exceeded.

City of Huntington Beach 1-8 Austin-Foust Associates, Inc. Center Avenue Skate Park 503008rpt.doc
STUDY AREA
A study area has been defined according to the potential impacts of the proposed project. For
peak hour intersection analyses, the one percent significance threshold generally translates to around 20
peak hour vehicles or more entering an intersection (since most intersections in the area have more than
2,000 vehicles per hour entering the intersection). Hence, this criterion has been used in selecting
intersections for the impact analysis. Performance criteria appropriate for the jurisdictions involved
(Cities of Huntington Beach and Westminster, and Caltrans) are applied to the traffic volume data.
The intersections studied here are shown in Figure 1-2. One is in the City of Westminster and the
remainder are in the City of Huntington Beach.
REFERENCES
1. “Highway Capacity Manual 2000,” Transportation Research Board, National Research Council, 2000.
2. “Huntington Beach Traffic Model (HBTM) Description and Validation,” Austin-Foust
Associates, April 2008.


City of Huntington Beach 2-1 Austin-Foust Associates, Inc. Center Avenue Skate Park 503008rpt.doc
Chapter 2.0 TRANSPORTATION SETTING
This chapter describes the transportation setting for the proposed project. Existing conditions for
the study area circulation system are first summarized, followed by the future background setting against
which project impacts are evaluated.
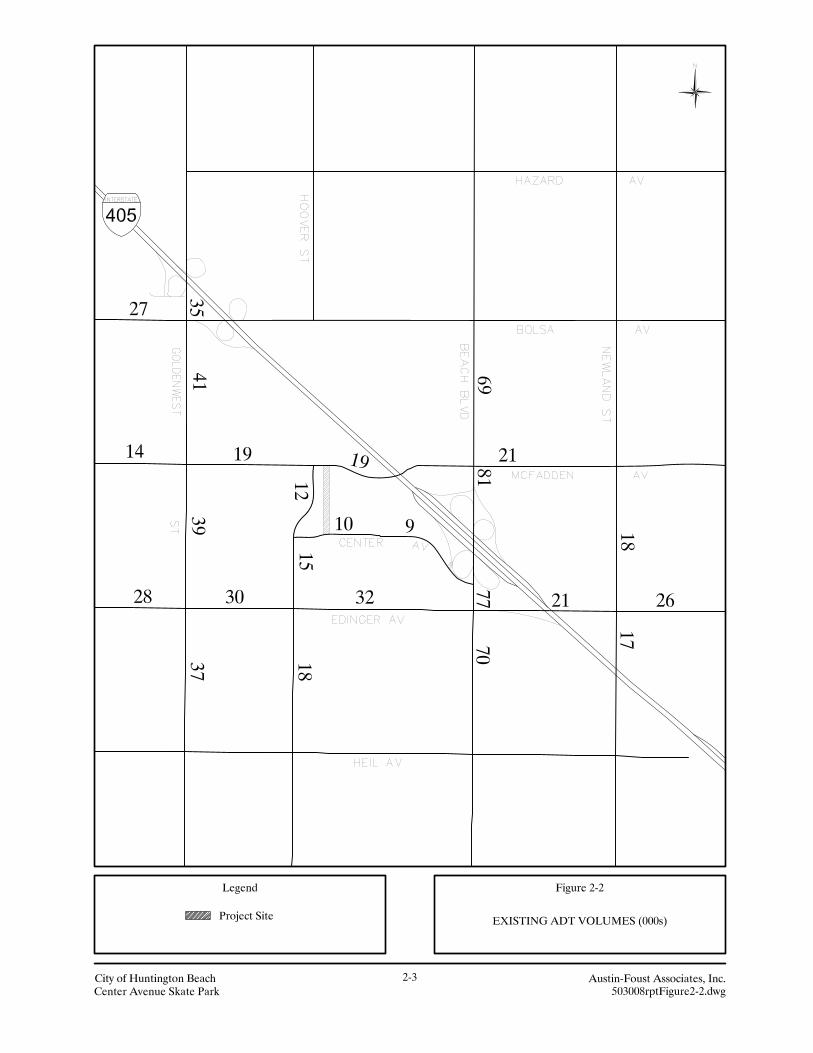
EXISTING CONDITIONS
The study area circulation system is shown in Figure 2-1 along with existing midblock lanes and
intersection controls. The existing (2009) average daily traffic (ADT) volumes in the study area are
presented in Figure 2-2. Arterial roadways in the vicinity of the project include Gothard Street with
15,000 ADT, Center Avenue with 10,000 ADT, and Edinger Avenue with 30,000 ADT.
As described in the performance criteria section in Chapter 1.0, the intersection levels of service
(LOS) are measured by peak hour intersection capacity utilization (ICU) values. For Caltrans
intersections (along Beach Boulevard) average vehicle delay calculations are also made using the
Highway Capacity Manual (HCM) methodology.
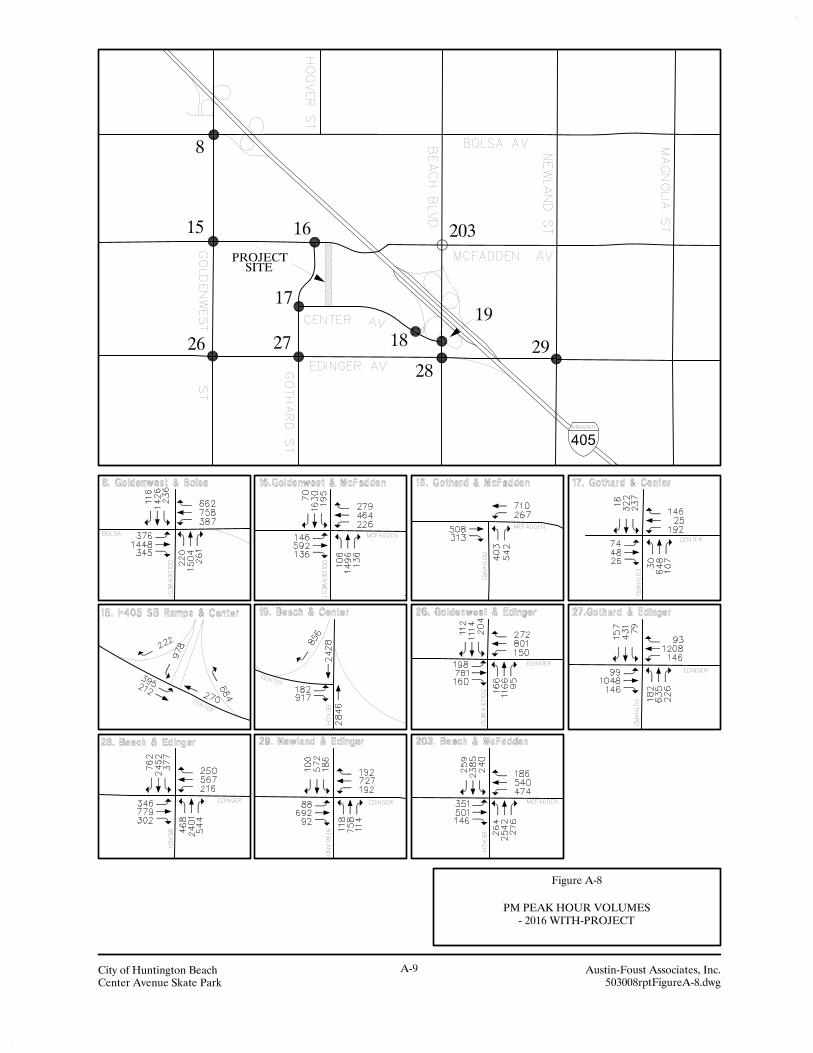
Existing peak hour intersection volumes are illustrated in Figures 2-3 and 2-4 for the AM and PM
peak hours, respectively. The corresponding levels of service are summarized in Table 2-1 (an
intersection location diagram is provided in Figure 2-5). The calculations for the ICU values in this table
can be found in Appendix A and the HCM calculations are in Appendix B.
The existing conditions summary shows all intersections to be operating at LOS “D” or better
during the AM and PM peak hours.
Existing conditions on the freeway ramps that would be affected by the proposed project are
summarized in Table 2-2. The I-405 northbound loop ramp from Beach Boulevard exceeds the V/C
threshold of 1.0 in both the AM and PM peak hours.


City of Huntington Beach 2-6 Austin-Foust Associates, Inc. Center Avenue Skate Park 503008rpt.doc
Table 2-1
EXISTING INTERSECTION LEVEL OF SERVICE SUMMARY
Intersection Capacity Utilization (ICU) AM Peak Hour PM Peak Hour Location* ICU LOS ICU LOS 8. Goldenwest St & Bolsa Ave .64 B .86 D 15. Goldenwest St & McFadden Ave .68 B .72 C 16. Gothard St & McFadden Ave .48 A .51 A 17. Gothard St & Center Ave .28 A .47 A 18. I-405 SB Ramps & Center Ave .40 A .75 C 19. Beach Blvd & Center Ave. .54 B .63 B 26. Goldenwest St & Edinger Ave .62 B .60 A 27. Gothard St & Edinger Ave .41 A .57 A 28. Beach Blvd & Edinger Ave .64 C .78 C 29. Newland St & Edinger Ave .61 C .61 B 203. Beach Blvd & McFadden Ave .78 C .81 D Highway Capacity Manual (HCM) Delay (Caltrans Intersections) AM Peak Hour PM Peak Hour Location* Delay LOS Delay LOS 18. I-405 SB Ramps & Center Ave 27.0 C 41.4 D 19. Beach Blvd & Center Ave 8.4 A 7.8 A 28. Beach Blvd & Edinger Ave 28.2 C 33.2 C 203. Beach Blvd & McFadden Ave 34.6 C 40.4 D * See intersection locations in Figure 2-5


City of Huntington Beach 2-8 Austin-Foust Associates, Inc. Center Avenue Skate Park 503008rpt.doc
Table 2-2
EXISTING FREEWAY RAMP V/C SUMMARY
AM Peak Hour PM Peak Hour Location Capacity Volume V/C Capacity Volume V/C
I-405/Beach Blvd NB loop on-ramp (from NB Beach Blvd)
900 1,240 1.38 900 1,510 1.68
I-405/Beach Blvd NB loop off-ramp (to SB Beach Blvd)
1,500 690 .46 1,500 880 .59
I-405/Beach Blvd SB on-ramp at Center Ave
1,800 360 .20 1,800 960 .53
I-405/Beach Blvd SB off-ramp at Center Ave
1,500 950 .63 1,500 1,130 .75
I-405/Edinger Ave SB direct on-ramp
1,080 570 .53 1,080 570 .53
Sources: 1: Caltrans California Freeway Performance Measurement System (PEMS) Sept. – Nov. 2008 2: I-405 PSR/PDS 2005 Freeway Ramp Volumes
City of Huntington Beach 2-9 Austin-Foust Associates, Inc. Center Avenue Skate Park 503008rpt.doc
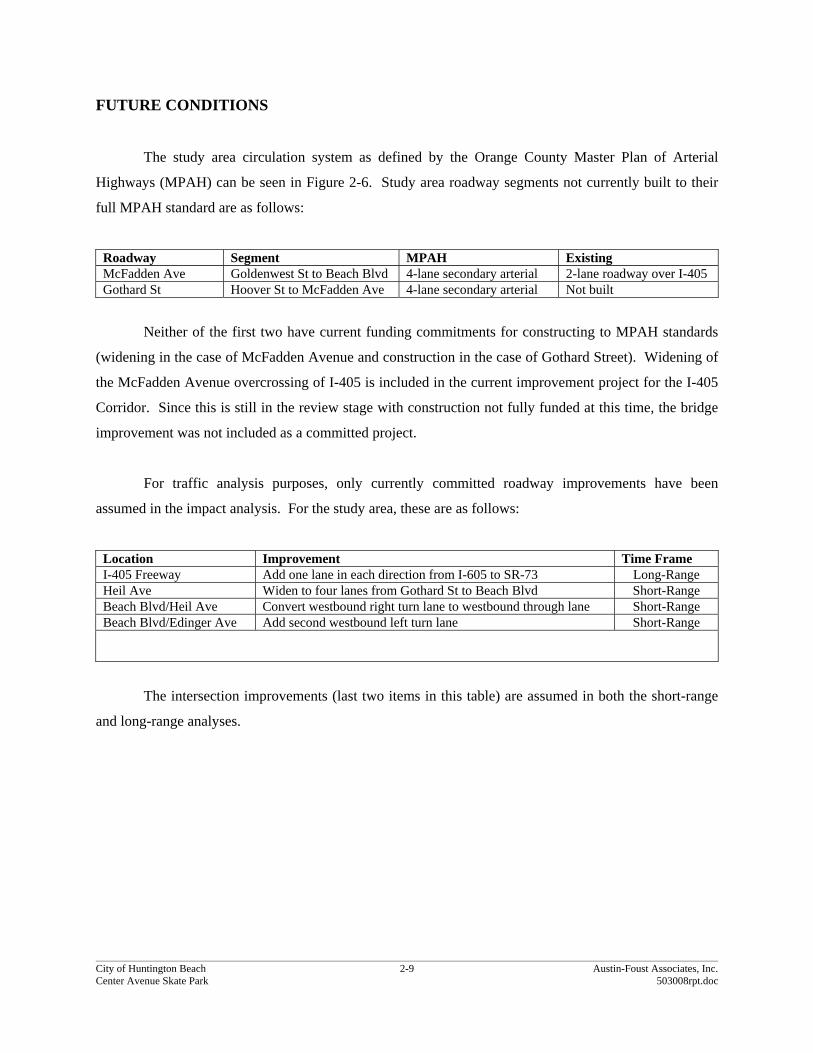
FUTURE CONDITIONS
The study area circulation system as defined by the Orange County Master Plan of Arterial
Highways (MPAH) can be seen in Figure 2-6. Study area roadway segments not currently built to their
full MPAH standard are as follows:
Roadway Segment MPAH Existing McFadden Ave Goldenwest St to Beach Blvd 4-lane secondary arterial 2-lane roadway over I-405 Gothard St Hoover St to McFadden Ave 4-lane secondary arterial Not built
Neither of the first two have current funding commitments for constructing to MPAH standards
(widening in the case of McFadden Avenue and construction in the case of Gothard Street). Widening of
the McFadden Avenue overcrossing of I-405 is included in the current improvement project for the I-405
Corridor. Since this is still in the review stage with construction not fully funded at this time, the bridge
improvement was not included as a committed project.
For traffic analysis purposes, only currently committed roadway improvements have been
assumed in the impact analysis. For the study area, these are as follows:
Location Improvement Time Frame I-405 Freeway Add one lane in each direction from I-605 to SR-73 Long-Range Heil Ave Widen to four lanes from Gothard St to Beach Blvd Short-Range Beach Blvd/Heil Ave Convert westbound right turn lane to westbound through lane Short-Range Beach Blvd/Edinger Ave Add second westbound left turn lane Short-Range
The intersection improvements (last two items in this table) are assumed in both the short-range
and long-range analyses.

City of Huntington Beach 2-11 Austin-Foust Associates, Inc. Center Avenue Skate Park 503008rpt.doc
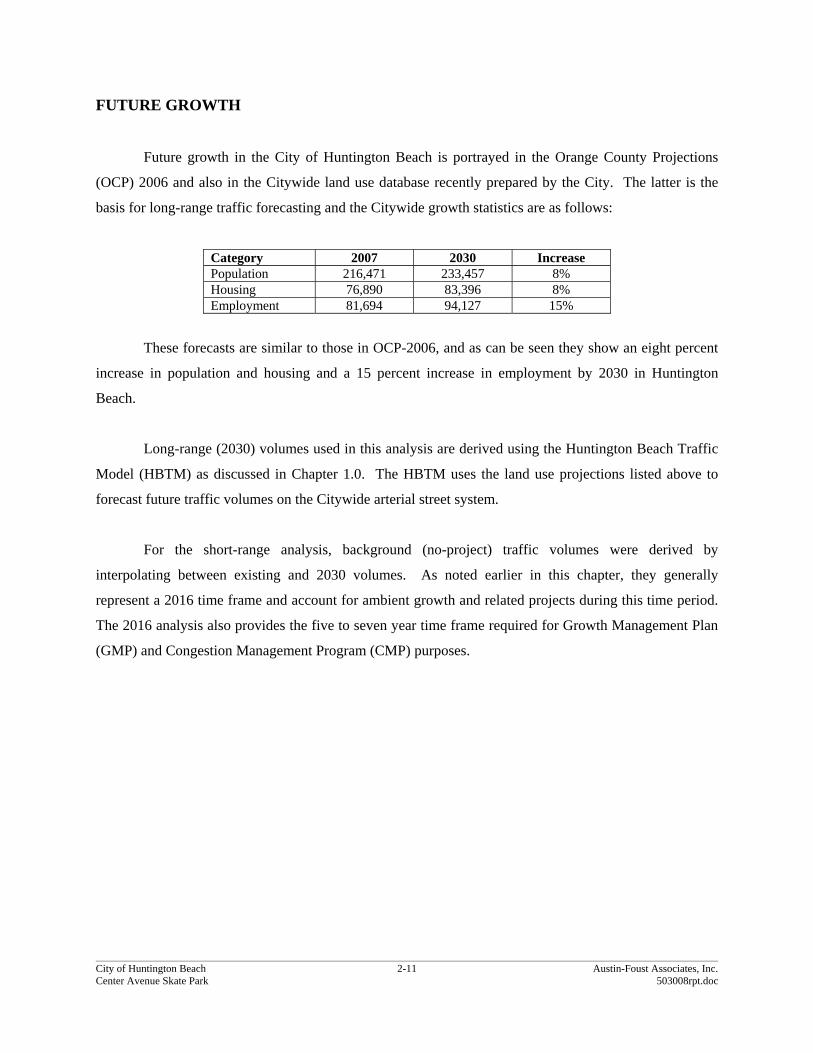
FUTURE GROWTH
Future growth in the City of Huntington Beach is portrayed in the Orange County Projections
(OCP) 2006 and also in the Citywide land use database recently prepared by the City. The latter is the
basis for long-range traffic forecasting and the Citywide growth statistics are as follows:
Category 2007 2030 Increase Population 216,471 233,457 8% Housing 76,890 83,396 8% Employment 81,694 94,127 15%
These forecasts are similar to those in OCP-2006, and as can be seen they show an eight percent
increase in population and housing and a 15 percent increase in employment by 2030 in Huntington
Beach.
Long-range (2030) volumes used in this analysis are derived using the Huntington Beach Traffic
Model (HBTM) as discussed in Chapter 1.0. The HBTM uses the land use projections listed above to
forecast future traffic volumes on the Citywide arterial street system.
For the short-range analysis, background (no-project) traffic volumes were derived by
interpolating between existing and 2030 volumes. As noted earlier in this chapter, they generally
represent a 2016 time frame and account for ambient growth and related projects during this time period.
The 2016 analysis also provides the five to seven year time frame required for Growth Management Plan
(GMP) and Congestion Management Program (CMP) purposes.

City of Huntington Beach 3-1 Austin-Foust Associates, Inc. Center Avenue Skate Park 503008rpt.doc
Chapter 3.0 PROJECT DESCRIPTION
This chapter describes the proposed project in terms of its traffic-related characteristics. The
project trip generation, trip distribution and resulting project-generated traffic volumes on the study area
circulation system are presented.
PROJECT DESCRIPTION
The Center Avenue Skate Park is proposed to be located on a 2.7-acre parcel on Center Avenue,
approximately 500 feet east of Gothard Street (see project site with access locations in Figure 3-1). The
project site is bounded by McFadden Avenue to the north, a Pacific Electric Railroad track to the east,
Center Avenue to the south, and a Southern California Edison electrical transmission line easement to the
west. The project site is currently vacant land owned by the City of Huntington Beach.
The proposed project is 45,500 square feet of skate park uses comprising 27,000 square feet of
skate park and skate bowl areas, 15,000 square foot turf/walking area, and a 3,500 square foot skate
shop/concession/restroom building. The main parking lot will front Center Avenue and a secondary
parking area will be accessed via McFadden Avenue for special events only.
TRIP GENERATION
Table 3-1 summarizes the trip generation for the proposed project. As shown, the proposed
project will generate 416 daily weekday trips at buildout, with 13 trips in the AM peak hour and 62 trips
in the PM peak hour. Trip generation rates for the project land uses were derived from surveys of local
skate parks located within Orange County that have similar characteristics to the proposed project (see
discussion in Appendix D).


City of Huntington Beach 3-3 Austin-Foust Associates, Inc. Center Avenue Skate Park 503008rpt.doc
Table 3-1
CENTER AVENUE SKATE PARK TRIP GENERATION
Project Description Amount AM Peak Hour PM Peak Hour
ADTIn Out Total In Out Total
PROPOSED PROJECT Skate Park1 45.5 TSF 7 6 13 29 33 62 416 Total 7 6 13 29 33 62 416
CURRENT GENERAL PLAN Residential Units 2 175 DU 17 72 89 70 39 109 1,176Total 17 72 89 70 39 109 1,176Proposed Project Difference from General Plan (%) -85% -43% -65%
Trip Rates AM Peak Hour PM Peak Hour Land Use Unit In Out Total In Out Total ADT Skate Park1 TSF .16 .14 .30 .63 .73 1.36 9.14 Apartments2 DU .10 .41 .51 .40 .22 .62 6.72
Notes: 1 Derived from trip survey data for similar skate parks. 2 Trips based on ITE (8th Ed.) Apartment (220) rates.

City of Huntington Beach 3-4 Austin-Foust Associates, Inc. Center Avenue Skate Park 503008rpt.doc
GENERAL PLAN COMPARISON
The project site has a General Plan designation of Mixed-Use Specific Plan Overlay – Design
Overlay). The General Plan Housing Element specifies that the site shall be shall be designated as
“Residential Only” in the Beach and Edinger Corridors Specific Plan and that the Agency intends to
develop a minimum of 175 affordable units on the site. The project applicant proposes a General Plan
Amendment (GPA) to allow the development of the skate park by lifting the “Residential Only”
requirement. The trip generation for the 175 residential units under the General Plan is also summarized
in previously referenced Table 3-1. As shown, the General Plan will generate 1,176 daily weekday trips
at buildout, with 89 trips in the AM peak hour and 109 trips in the PM peak hour. The proposed project is
a 65 percent reduction in daily trips when compared to the current General Plan. The AM and PM peak
hours show similar reductions.
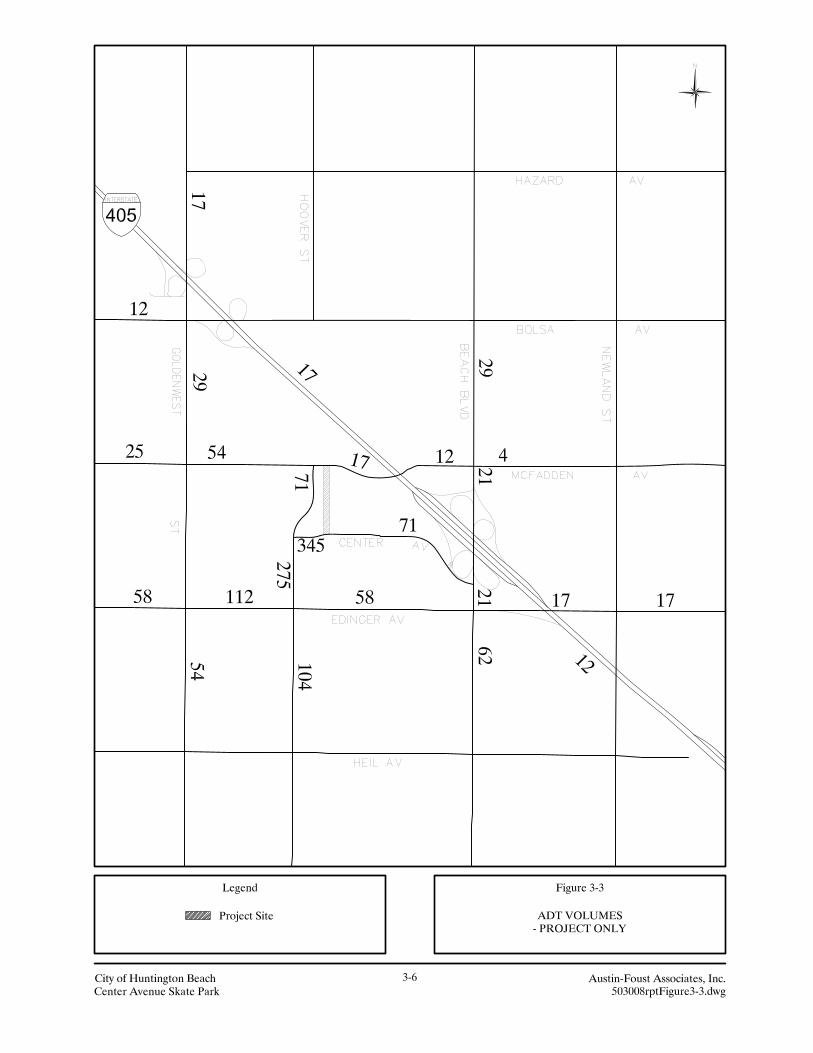
TRIP DISTRIBUTION
The geographic distribution of trips in the study area to and from the project was estimated using
regional distribution patterns derived from the Huntington Beach Traffic Model (HBTM) and then
adjusted to reflect a higher distribution from the local area. These adjustments reflect the special
characteristics of the skate park users. The resulting project trip distribution pattern is illustrated in
Figure 3-2. It is based on the distribution of daily trips generated by the project as assigned to the study
area street system. Peak hour project trips differ slightly with respect to their distribution patterns, as do
the inbound versus outbound distribution of those peak hour project trips. These differences are reflected
in the actual project volumes used in the impact analysis.
Figure 3-3 shows the ADT project trips for the proposed project. These ADT project trips and the
project peak hour intersection volumes given in Appendix A are used in the short-range and long-range
analyses to estimate project impacts.


City of Huntington Beach 4-1 Austin-Foust Associates, Inc Center Avenue Skate Park 503008rpt.doc
Chapter 4.0 IMPACT ANALYSIS
This chapter discusses the traffic impacts of the project. The results are presented for three
scenarios: existing plus project, short-range, and long-range analyses using the methodologies and
performance criteria described in Chapter 1.0.
EXISTING PLUS PROJECT CONDITIONS
The purpose of the existing plus project analysis is to comply with the California Environmental
Quality Act (CEQA), which requires that the baseline for assessing environmental impacts is the existing
conditions at the time the notice of preparation (NOP) is prepared. The information presented in this
section shows the traffic volumes obtained by adding traffic from the proposed project to existing traffic
data. The analysis is hypothetical because the actual buildout timeframe of the project is year 2012 or
later.
The average daily traffic (ADT) forecasts were prepared for a scenario in which traffic generated
by the project is added to the existing traffic conditions based on the project trip distribution defined in
Chapter 3.0. Figure 4-1 shows the ADT volumes for existing plus project conditions.
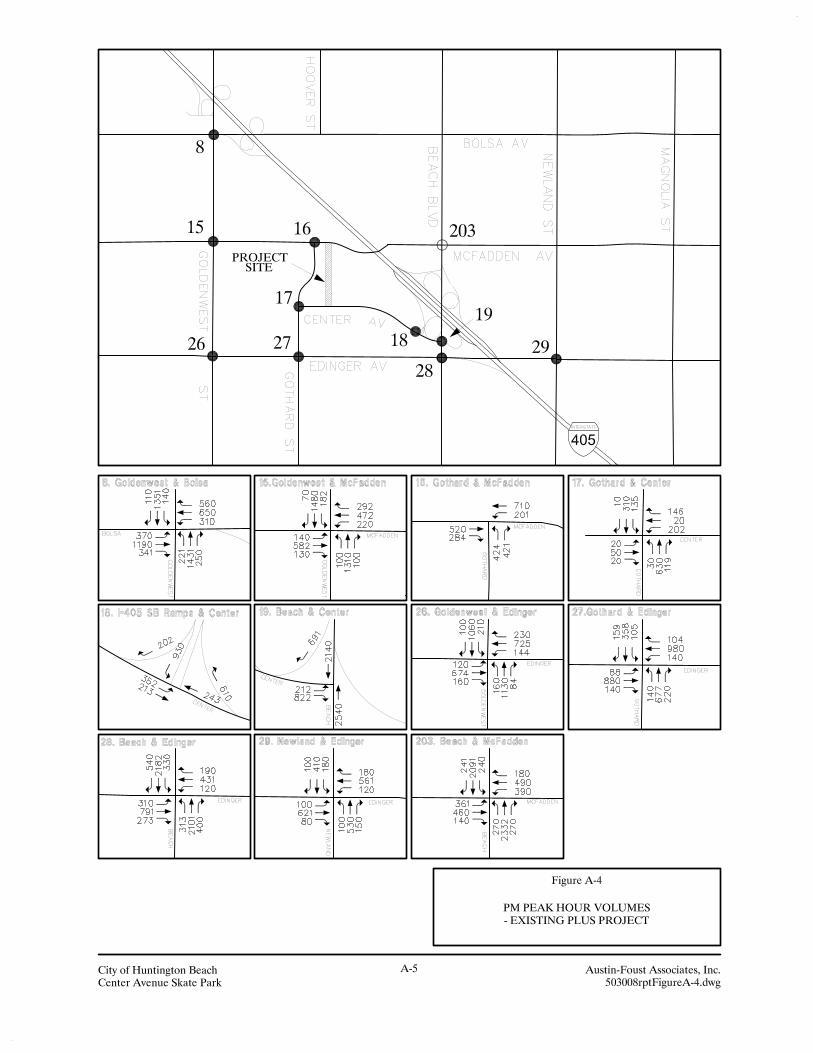
The corresponding AM and PM peak hour intersection volumes for existing-plus-project can be
found in Appendix A. To derive the with-project volumes, the project-only peak hour intersection
volumes (also shown in Appendix A) were added to the existing (no-project) conditions volumes. The
corresponding intersection capacity utilization (ICU) values were then calculated and used to identify
project impacts. For Caltrans intersections, separate calculations were made using the Highway Capacity
Manual (HCM) delay methodology, and the HCM worksheets can be found in Appendix C.
A summary of existing and existing-plus-project intersection performance is based on existing
lane configurations. Table 4-1 lists the ICU values, the average vehicle delay for Caltrans intersections,
and the level of service (LOS) for the study area intersections. As can be seen here, all intersections meet
the performance criteria and there are no significant project impacts.


City of Huntington Beach 4-3 Austin-Foust Associates, Inc Center Avenue Skate Park 503008rpt.doc
Table 4-1
EXISTING-PLUS-PROJECT ICU SUMMARY
No-Project With Project AM PM AM PM Intersection ICU LOS ICU LOS ICU LOS ICU LOS 8. Goldenwest St & Bolsa Ave .64 B .86 D .64 B .86 D 15. Goldenwest St & McFadden Ave .68 B .72 C .68 B .72 C 16. Gothard St & McFadden Ave .48 A .51 A .48 A .51 A 17. Gothard St & Center Ave .28 A .47 A .28 A .48 A 18. I-405 SB Ramps & Center Ave .40 A .75 C .40 A .75 C 19. Beach Blvd & Center Ave. .54 B .63 B .54 B .63 B 26. Goldenwest St & Edinger Ave .62 B .60 A .62 B .60 A 27. Gothard St & Edinger Ave .41 A .57 A .41 A .57 A 28. Beach Blvd & Edinger Ave .64 C .78 D .64 C .78 D 29. Newland St & Edinger Ave .61 C .61 B .61 C .61 B 203. Beach Blvd & McFadden Ave .78 C .81 D .78 C .81 D Highway Capacity Manual (HCM) Delay (Caltrans Intersections) AM PM AM PM Location Delay LOS Delay LOS Delay LOS Delay LOS 18. I-405 SB Ramps & Center Ave 27.0 C 41.4 D 27.0 C 41.4 D 19. Beach Blvd & Center Ave 8.4 A 7.8 A 8.4 A 7.8 A 28. Beach Blvd & Edinger Ave 28.2 C 33.2 C 28.3 C 33.2 C 203. Beach Blvd & McFadden Ave 34.6 C 40.4 D 34.6 C 40.4 D
Note: Shading with bold font denotes intersection that exceeds the performance standard.

City of Huntington Beach 4-4 Austin-Foust Associates, Inc Center Avenue Skate Park 503008rpt.doc
SHORT-RANGE ANALYSIS
The short-range analysis compares no development on the project site to buildout of the project
for a 2016 time frame. As noted in Chapter 2.0, 2016 no-project volumes were estimated by interpolating
between existing and 2030, and then project traffic was added to these background volumes. Average
daily traffic (ADT) volumes for 2016 are illustrated in Figure 4-2.
Table 4-2 lists the ICU values, the average vehicle delay for Caltrans intersections, and LOS for
the study area intersections. As can be seen here, all intersections with one exception meet the
performance criteria and the project does not have a significant impact at this deficient location.
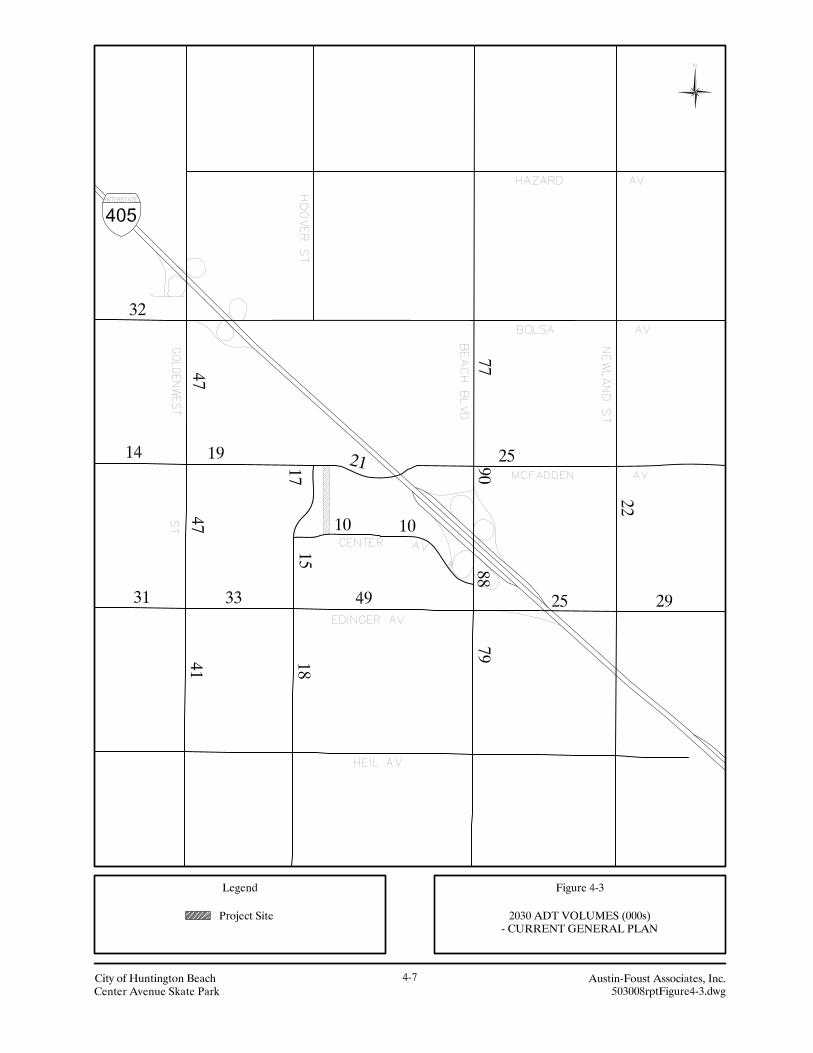
LONG-RANGE ANALYSIS
As discussed in the methodology section, the long-range analysis compares the current General
Plan to the proposed project. The 2030 ADT volumes for the current General Plan can be seen in Figure
4-3 and intersection volumes for current General Plan conditions can be found in Appendix A. These
form the baseline against which the proposed project is compared. Figure 4-4 shows the actual 2030
ADT volumes with the proposed project.
With-project 2030 AM and PM peak hour intersection volumes were derived by first subtracting
out the trips associated with the 175 residential units (allowed under the current General Plan) to give no-
project volumes. The project volumes were then added to the 2030 no-project volumes. Appendix A
illustrates the peak hour diagrams for the current General Plan, 2030 no-project and 2030 with-project
scenarios.
A summary of the 2030 ICU values, average vehicle delay for Caltrans intersections, and LOS
can be found in Table 4-3 (see Appendix B for actual ICU calculations). As shown, all but three
intersections meet the performance criteria, and the project does not have a significant impact at these
deficient locations. The three intersections show a cumulative deficiency (i.e., location is deficient both
without- and with-proposed project).


City of Huntington Beach 4-6 Austin-Foust Associates, Inc Center Avenue Skate Park 503008rpt.doc
Table 4-2
2016 ICU SUMMARY
No-Project With Project AM PM AM PM Intersection ICU LOS ICU LOS ICU LOS ICU LOS 8. Goldenwest St & Bolsa Ave .82 D .97 E .82 D .97 E 15. Goldenwest St & McFadden Ave .71 C .75 C .71 C .75 C 16. Gothard St & McFadden Ave .57 A .60 A .57 A .60 A 17. Gothard St & Center Ave .32 A .52 A .32 A .53 A 18. I-405 SB Ramps & Center Ave .47 A .81 D .47 A .81 D 19. Beach Blvd & Center Ave. .64 B .71 C .64 B .71 C 26. Goldenwest St & Edinger Ave .62 B .68 B .62 B .68 B 27. Gothard St & Edinger Ave .49 A .58 A .49 A .61 B 28. Beach Blvd & Edinger Ave .80 C .90 D .80 C .90 D 29. Newland St & Edinger Ave .76 C .73 C .76 C .73 C 203. Beach Blvd & McFadden Ave .81 D .86 D .81 D .86 D Highway Capacity Manual (HCM) Delay (Caltrans Intersections) AM PM AM PM Location* Delay LOS Delay LOS Delay LOS Delay LOS 18. I-405 SB Ramps & Center Ave 28.2 C 46.3 D 28.2 C 46.3 D 19. Beach Blvd & Center Ave 8.3 A 9.1 A 8.3 A 9.1 A 28. Beach Blvd & Edinger Ave 32.1 C 43.3 D 32.2 C 43.4 D 203. Beach Blvd & McFadden Ave 35.3 D 44.8 D 35.3 D 44.8 D
Note: Shading with bold font denotes intersection that exceeds the performance standard.


City of Huntington Beach 4-9 Austin-Foust Associates, Inc Center Avenue Skate Park 503008rpt.doc
For the intersections at LOS “E” or worse, a determination was made as to whether the project
contribution to the ICU amounted to one percent or more. This was carried out by summing the project
traffic ICU contribution to each critical movement in the ICU calculation. It should be noted that this is
different than the project versus General Plan traffic volumes used in the ICU comparisons since it uses
actual project volumes rather than difference volumes (i.e., General Plan versus proposed project). It is
intended to show how development of this site will contribute to long-range deficiencies at the identified
locations.
The project contribution results for the proposed project are as follows:
Location AM/PM PROJECT ICU 8. Goldenwest & Bolsa AM
PM .000 .000
28. Beach & Edinger PM .000 203. Beach & McFadden PM .001
Hence, the project does not have a significant contribution to the three long-range deficiencies.
FREEWAY RAMP VOLUMES
A summary of the 2016 and 2030 peak hour volumes and volume/capacity (V/C) ratios for
freeway ramps that would be affected by the proposed project can be found in Table 4-4. Included in the
table are the project contributions to the ramp V/C ratios.
As can be seen, the project does not have a significant impact to the freeway ramps under either
scenario (2016 or long-range).

City of Huntington Beach 4-10 Austin-Foust Associates, Inc Center Avenue Skate Park 503008rpt.doc
Table 4-3
2030 ICU SUMMARY
General Plan Proposed Project AM PM AM PM Intersection ICU LOS ICU LOS ICU LOS ICU LOS 8. Goldenwest St & Bolsa Ave .93 E 1.04 F .92 E 1.04 F 15. Goldenwest St & McFadden Ave .73 C .81 D .73 C .81 D 16. Gothard St & McFadden Ave .65 B .67 B .64 B .66 B 17. Gothard St & Center Ave .37 A .59 A .37 A .58 A 18. I-405 SB Ramps & Center Ave .55 A .86 D .54 A .86 D 19. Beach Blvd & Center Ave. .71 C .76 C .71 C .76 C 26. Goldenwest St & Edinger Ave .66 B .72 C .66 B .72 C 27. Gothard St & Edinger Ave .57 A .65 B .57 A .65 B 28. Beach Blvd & Edinger Ave .90 D .98 E .90 D .98 E 29. Newland St & Edinger Ave .87 D .81 D .87 D .81 D 203. Beach Blvd & McFadden Ave .86 D .92 E .85 D .92 E Highway Capacity Manual (HCM) Delay (Caltrans Intersections) AM PM AM PM Location* Delay LOS Delay LOS Delay LOS Delay LOS 18. I-405 SB Ramps & Center Ave 28.6 C 44.9 D 28.6 C 44.9 D 19. Beach Blvd & Center Ave 11.2 B 10.0 B 11.2 B 10.1 B 28. Beach Blvd & Edinger Ave 37.5 D 58.6 E 37.5 D 58.7 E 203. Beach Blvd & McFadden Ave 38.2 D 52.4 D 38.2 D 52.5 D
Note: Shading with bold font denotes intersection that exceeds the performance standard.

City of Huntington Beach 4-11 Austin-Foust Associates, Inc Center Avenue Skate Park 503008rpt.doc
Table 4-4
FUTURE FREEWAY RAMP V/C SUMMARY
AM Peak Hour PM Peak Hour Location
Capacity
Total Volume
Total V/C
Project Volume
Project V/C *
Total Volume
Total V/C
Project Volume
Project V/C *
YEAR 2016 I-405/Beach Blvd NB loop on-ramp (from NB Beach Blvd)
900 1,450 1.61 0 .00 1,510 1.68 1 .00
I-405/Beach Blvd NB loop off-ramp (to SB Beach Blvd)
1,500 770 .51 0 .00 960 .64 1 .00
I-405/Beach Blvd SB on-ramp at Center Ave
1,800 520 .29 0 .00 1,100 .61 1 .00
I-405/Beach Blvd SB off-ramp at Center Ave
1,500 960 .64 0 .00 1,180 .79 1 .00
I-405/Edinger Ave SB direct on-ramp 1,080 660 .61 0 .00 640 .59 0 .00
YEAR 2030
I-405/Beach Blvd NB loop on-ramp (from NB Beach Blvd)
900 1,470 1.63 0 .00 1,520 1.69 1 .00
I-405/Beach Blvd NB loop off-ramp (to SB Beach Blvd)
1,500 820 .55 0 .00 1,010 .67 1 .00
I-405/Beach Blvd SB on-ramp at Center Ave
1,800 610 .34 0 .00 1,120 .62 1 .00
I-405/Beach Blvd SB off-ramp at Center Ave
1,500 970 .65 0 .00 1,270 .85 1 .00
I-405/Edinger Ave SB direct on-ramp 1,080 700 .65 0 .00 680 .63 0 .00
* Project contribution to the total V/C ratio.
City of Huntington Beach 5-1 Austin-Foust Associates, Inc. Center Avenue Skate Park 503008rpt.doc
Chapter 5.0 OTHER ITEMS
This chapter discusses related traffic items such as special events, project access, and
weekend/summer trip generation.
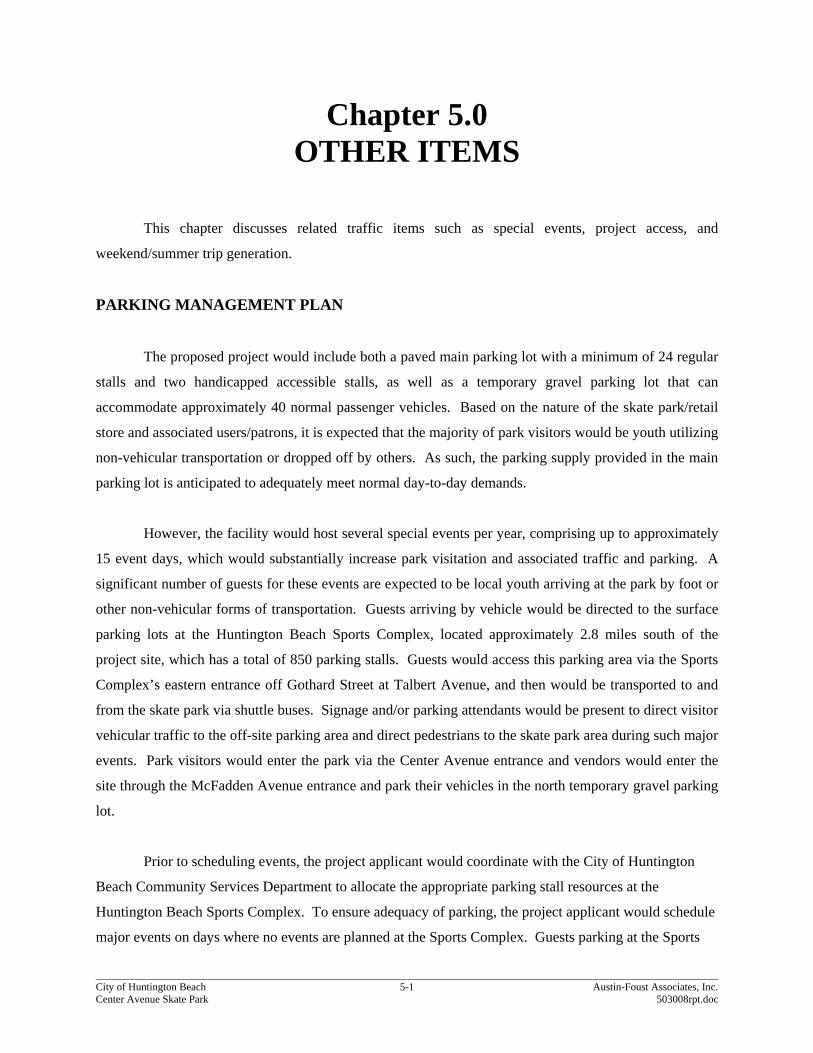
PARKING MANAGEMENT PLAN
The proposed project would include both a paved main parking lot with a minimum of 24 regular
stalls and two handicapped accessible stalls, as well as a temporary gravel parking lot that can
accommodate approximately 40 normal passenger vehicles. Based on the nature of the skate park/retail
store and associated users/patrons, it is expected that the majority of park visitors would be youth utilizing
non-vehicular transportation or dropped off by others. As such, the parking supply provided in the main
parking lot is anticipated to adequately meet normal day-to-day demands.
However, the facility would host several special events per year, comprising up to approximately
15 event days, which would substantially increase park visitation and associated traffic and parking. A
significant number of guests for these events are expected to be local youth arriving at the park by foot or
other non-vehicular forms of transportation. Guests arriving by vehicle would be directed to the surface
parking lots at the Huntington Beach Sports Complex, located approximately 2.8 miles south of the
project site, which has a total of 850 parking stalls. Guests would access this parking area via the Sports
Complex’s eastern entrance off Gothard Street at Talbert Avenue, and then would be transported to and
from the skate park via shuttle buses. Signage and/or parking attendants would be present to direct visitor
vehicular traffic to the off-site parking area and direct pedestrians to the skate park area during such major
events. Park visitors would enter the park via the Center Avenue entrance and vendors would enter the
site through the McFadden Avenue entrance and park their vehicles in the north temporary gravel parking
lot.
Prior to scheduling events, the project applicant would coordinate with the City of Huntington
Beach Community Services Department to allocate the appropriate parking stall resources at the
Huntington Beach Sports Complex. To ensure adequacy of parking, the project applicant would schedule
major events on days where no events are planned at the Sports Complex. Guests parking at the Sports

City of Huntington Beach 5-2 Austin-Foust Associates, Inc. Center Avenue Skate Park 503008rpt.doc
Complex would be shuttled to the skate park via shuttle buses. Shuttle drivers would follow a specified
shuttle route (i.e., Gothard Street between Center Avenue and Talbert Avenue) as illustrated in Figure 5-
1.
Special events have the potential to create parking impacts for adjacent neighbors. Potential
mitigation measures to address the overflow parking for special events will be provided to reduce the
impact for neighboring uses. These measures can include, but are not limited to:
Access management for the staging area – where the project will provide personnel to
guide/direct visitors
Management techniques for use of the overflow parking – including the use of valet
parking in a portion of the remote lot (Huntington Beach Sports Complex
Permit parking for residential neighborhoods adjacent to the project site
Effective signage which will direct visitors to the remote lot and will discourage visitors
from parking in adjacent residential neighborhoods and the Bella Terra commercial area.
PROJECT ACCESS
A preliminary site layout was presented in Chapter 3.0. This shows two project access points.
The access fronting Center Avenue will serve as the main entrance into the skate park, with parking lots
and drop-off. The access from McFadden Avenue will serve as temporary access for vendor parking
during special events (about 15 events per year).
Figure 5-2 shows the short-range and long-range (2030) peak hour volumes for the main access
fronting Center Avenue. Level of service is calculated using the Highway Capacity Manual (HCM)
methodology for the unsignalized intersection. The results are summarized in the table below and actual
calculations can be found in the last section of Appendix B.

Legend
Austin-Foust Associates, Inc.503008rptFigure5-1.dwg
5-3
PROPOSED SHUTTLE ROUTE FORSKATE PARK
Figure 5-1
City of Huntington BeachCenter Avenue Skate Park
Project Site
Proposed shuttle route
HB SPORTSCOMPLEX
PROPOSEDPROJECT


City of Huntington Beach 5-5 Austin-Foust Associates, Inc. Center Avenue Skate Park 503008rpt.doc
PROJECT DRIVEWAY LEVELS OF SERVICE
Year 2016 Year 2030 Unsignalized Driveway AM Peak Hour PM Peak Hour AM Peak Hour PM Peak Hour Location Delay LOS Delay LOS Delay LOS Delay LOS Center Ave 9.2 A 9.7 A 9.3 A 9.8 A
As can be seen, the project access intersection is shown to operate at an acceptable level of
service.
WEEKEND AND SUMMER TRIP GENERATION
The future trip generation presented in Chapter 3.0 represents average weekday non-summer
conditions. As discussed previously, the trip generation rates were based on survey data of similar skate
parks in Orange County. Since weekend and summer usage can result in higher visitor/traffic volumes,
counts were taken during the weekend and summer for similar skate parks in Orange County (see
Appendix D) and trip rates were derived for weekend and summer usage.
Table 5-1 summarizes the trip generation estimates for weekend and summer. As shown, the
weekend trip generation shows increases over the corresponding weekday trip generation for midday
(12:00 – 1:00 PM), PM peak hour (4:00 – 6:00 PM) and daily trip generation. For summer, the daily trip
generation is higher than the weekday daily trip generation; however the peak hour traffic is lower since
the traffic is spread out over a longer period during the day. Peak hours for weekday summer are the
same for traditional weekday (7:00 – 9:00 AM and 4:00 – 6:00 PM).
ALTERNATIVE MODES OF TRAVEL
Due to the unique nature of the proposed skate park, a percentage of the patrons are estimated to
travel to/from the site using alternative modes of travel (i.e., biking, walking and skateboarding). The
patrons will primarily be local youth from the nearby residential areas and the adjacent Golden West
College. These alternative modes of travel are provided to the project site via public sidewalks and
existing roadways. Class II bike lanes exist on most streets immediately surrounding the project, as
illustrated in Figure 5-3. Access to and from the actual site would occur via Center Avenue, where

City of Huntington Beach 5-6 Austin-Foust Associates, Inc. Center Avenue Skate Park 503008rpt.doc
Table 5-1
CENTER AVENUE SKATE PARK TRIP GENERATION
AM Peak Hour* PM Peak Hour Land Use Amount In Out Total In Out Total ADT WEEKDAY Skate Park1 45.5 TSF 7 6 13 29 33 62 416 Total 7 6 13 29 33 62 416 WEEKEND Skate Park2 45.5 TSF 44 40 85 33 32 64 756 Total 45 40 85 33 32 64 756 Difference from Weekday (%) 553% 3% 82% SUMMER WEEKDAY Skate Park1 45.5 TSF 4 8 12 14 17 31 535 Total 4 8 12 14 17 31 535 Difference from Weekday (%) -8% -50% 29% TRIP RATES Weekday1 TSF .16 .14 .30 .63 .73 1.36 9.14 Weekend2 TSF .98 .89 1.86 .72 .69 1.41 16.61 Summer Weekday3 TSF .09 .18 .27 .30 .37 .67 11.75 * Midday peak hour for weekend trip generation Notes: 1 and 2 Derived from trip survey data for similar skate parks (survey data collected in April and June 2011).

Legend
Austin-Foust Associates, Inc.503008rptFigure5-3.dwg
5-7
EXISTING BIKEWAYS
Figure 5-3
City of Huntington BeachCenter Avenue Skate Park
Project SiteClass II Bike Path
Share-the-road

City of Huntington Beach 5-8 Austin-Foust Associates, Inc. Center Avenue Skate Park 503008rpt.doc
designated bike lanes are not provided but bicycles and motor vehicles will be asked to share the road.
Public sidewalks also provide a safe means of alternative access to the site for pedestrians and skateboard
riders. The sidewalks immediately surrounding the project site all provide continuous access, with
pedestrian friendly sidewalks located on the north side of Center Avenue. The intersection of Center
Avenue and Gothard Street is signalized and provides marked crosswalks on all four legs, providing a
safe route for patrons from the west and south.
The project site is served by two OCTA bus routes. Hence, public transit also provides an
alternative mode of travel for the skate park patrons. Figure 5-4 illustrates the existing bus routes that
would also serve the skate park.
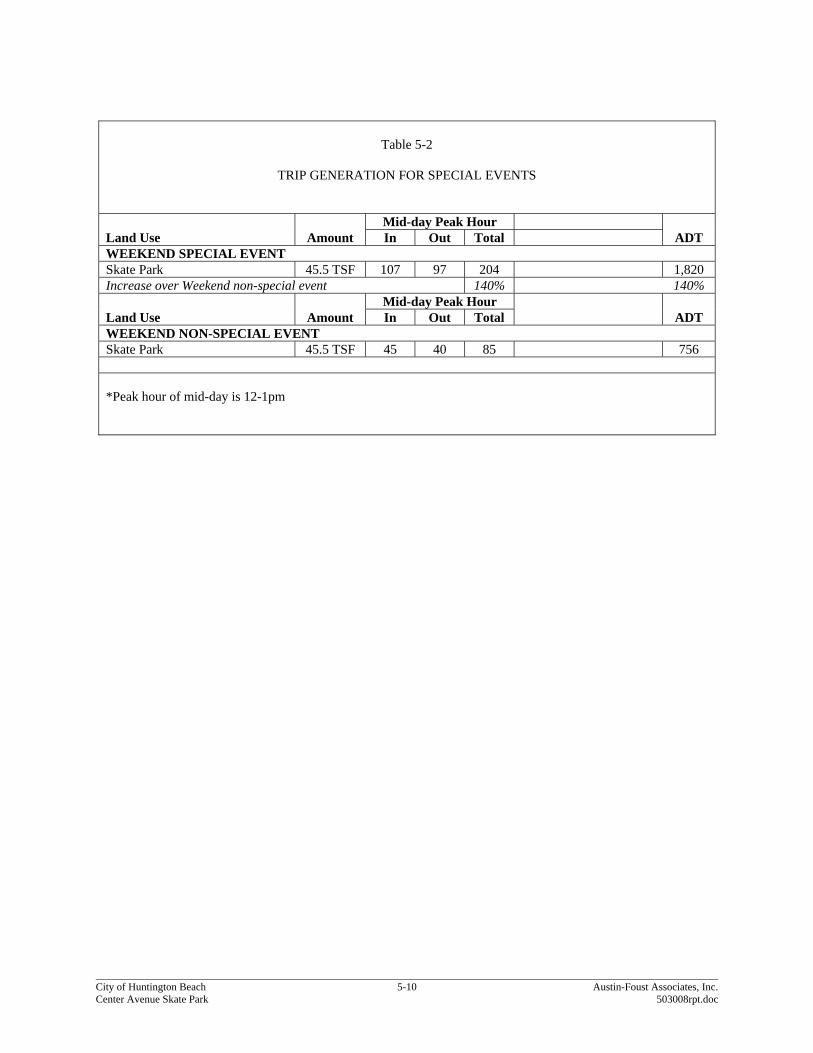
SPECIAL EVENT TRIP GENERATION AND DISTRIBUTION
A special analysis was made of the traffic impacts for major special events, which are expected to
draw up to 2,500 spectators per event day. These visitors will arrive in 910 cars (based on an estimated
2.75 vehicle occupancy), which results in 1,820 total daily trips. This is a 140 percent increase over the
typical weekend daily trips. This 140 percent increase was then applied to the mid-day weekend peak
hour trip generation to derive the special event mid-day trip generation. Table 5-2 summarizes the mid-
day trip generation for the special events.
During these special events, visitors would be directed to park their vehicles at the Huntington
Beach Sports Complex located at 18100 Goldenwest Street. The trip distribution for such special events
is assumed to be different for typical weekday/weekend distribution due to the regional attraction of these
events and because visitors will be directed to the remote parking lot at the Sports Complex. Figure 5-5
illustrates the trip distribution for the special events traffic. The trip distribution assumes that five percent
of the trips to/from project site will be drop-offs and that 95 percent of the trips will use the remote
parking lot. The 910 vehicles are not expected to cause an overflow at this location due to variable
arrivals and departures, and hence the maximum parking demand is somewhat less than the 910 vehicle
arrivals.

25
66
Legend
Austin-Foust Associates, Inc.503008rptFigure5-4.dwg
5-9
BUS ROUTES
Figure 5-4
City of Huntington BeachCenter Avenue Skate Park
Project Site
Bus Routes
City of Huntington Beach 5-10 Austin-Foust Associates, Inc. Center Avenue Skate Park 503008rpt.doc
Table 5-2
TRIP GENERATION FOR SPECIAL EVENTS
Mid-day Peak Hour Land Use Amount In Out Total ADT WEEKEND SPECIAL EVENT Skate Park 45.5 TSF 107 97 204 1,820 Increase over Weekend non-special event 140% 140%
Mid-day Peak Hour Land Use Amount In Out Total ADT WEEKEND NON-SPECIAL EVENT Skate Park 45.5 TSF 45 40 85 756 *Peak hour of mid-day is 12-1pm

5 3 3
3
11 4 3
211
4
6
18
2
3
2
12
25
5 1 3
17 22
6
2
2 1
3
12
1820
4
423 26 22
27 29
23
5 1 3 2
3 1 2 1
100 33 3
HB SportsComplex
711
10
Legend
Austin-Foust Associates, Inc.503008rptFigure5-5.dwg
5-11
SPECIAL EVENT TRIP DISTRIBUTION
Figure 5-5
Project Site
City of Huntington BeachCenter Avenue Skate Park
XX Percent of project trip distribution

City of Huntington Beach 5-12 Austin-Foust Associates, Inc. Center Avenue Skate Park 503008rpt.doc
SPECIAL EVENT TRAFFIC ANALYSIS
The 2030 no-project daily volumes were derived by applying a factor of .85 to the weekday ADT
to estimate weekend ADT volumes. The special event project volumes were then added to the 2030 no-
project weekend volumes by assigning the special event trips according to the trip distribution defined
earlier. Figure 5-6 illustrates the ADT volumes for without- and with-special event project. As can be
seen, the difference in the ADT volumes is 1,000 vehicles per day on all roadway segments.
A weekend survey of four intersections was performed in November 2011 to assist in the forecast
of the 2030 no-project peak hour volumes. The four intersections were chosen because of the confluence
of weekend activity that occurs near the proposed project: Goldenwest swap meet, Westminster mall
activity and Bella Terra mall activity. Factors were derived for each turning movement based on the
relationship between the existing weekday/weekend count data. These same factors were then applied to
the 2030 no-project weekday peak hour volumes to derive the 2030 no-project weekend volumes
(Appendix D summarizes the individual factors). The special event traffic was then added to the no-
project data to derive the 2030 with-special event scenario.
A summary of the 2030 ICU values and LOS can be found in Table 5-3 (see Appendix B for
actual ICU calculations). As shown, all intersections are forecast to operate at level of service D or better.
QUALITATIVE ANALYSIS OF SHUTTLE ROUTE
A qualitative analysis was performed to identify the potential impact of the proposed shuttle
route. The arrival and departures of shuttled passengers with their staggered arrival pattern will result in
the shuttle buses serving up to 620 passengers per hour during the peak period. As discussed previously,
95 percent of the passengers will need to be shuttled to/from the project site and five percent were
assumed to be drop-off and pick-ups at the project site. The travel time between the project site and
remote parking lot is estimated at five minutes. Allowing an additional five minutes to move through the
staging areas, the total travel time is estimated at 10 to 12 minutes. This is the maximum recommended
travel time needed to ensure optimal use of the shuttle.

11.8 14.1
25.4 26.338.9
39.134.0
10.713.0
(39.3)
(12.0) (14.1)
(25.6) (26.4)(39.2)
(34.2)
(10.8)(13.0)
Legend
Austin-Foust Associates, Inc.503008rptFigure5-6.dwg
5-12
2030 WEEKEND ADT VOLUMES (000s)- WITH SPECIAL EVENT TRAFFIC
Figure 5-6
Project Site
City of Huntington BeachCenter Avenue Skate Park
Without Special Event ADT VolumeWith Special Event ADT Volume
XX
YY

City of Huntington Beach 5-14 Austin-Foust Associates, Inc. Center Avenue Skate Park 503008rpt.doc
Table 5-3
2030 WITH SPECIAL EVENT ICU SUMMARY
No-Project With Project Mid-day Peak Hour Mid-day Peak Hour Intersection ICU LOS ICU LOS 15. Goldenwest St & McFadden Ave .80 C .81 D 16. Gothard St & McFadden Ave .54 A .54 A 26. Goldenwest St & Edinger Ave .83 D .83 D 27. Gothard St & Edinger Ave .70 B .70 B

City of Huntington Beach 5-15 Austin-Foust Associates, Inc. Center Avenue Skate Park 503008rpt.doc
It is estimated that up to 10 shuttle buses with 40-seat capacity (allowing for 20 standing passengers) will
be needed during the special event. Each shuttle would complete 2.5 circuits during the mid-day peak
hour. This results in a total of 100 trips per day (50 northbound and 50 southbound), which would have a
less than significant impact on the ICU values for intersections located along the shuttle route.

City of Huntington Beach A-1 Austin-Foust Associates, Inc. Center Avenue Skate Park 503008rpt.doc
Appendix A PEAK HOUR VOLUME DIAGRAMS


City of Huntington Beach B-1 Austin-Foust Associates, Inc. Center Avenue Skate Park 503008rpt.doc
Appendix B INTERSECTION CAPACITY
UTILIZATION WORKSHEETS


8. Goldenwest St & Bolsa Ave ┌─────────────────────────────────────────────────────────┐ ┌─────────────────────────────────────────────────────────┐ │ Existing │ │ Existing Plus Project │ │ │ │ │ │ AM PK HOUR PM PK HOUR │ │ AM PK HOUR PM PK HOUR │ │ LANES CAPACITY VOL V/C VOL V/C │ │ LANES CAPACITY VOL V/C VOL V/C │ │ │ │ │ │ NBL 2 3400 100 .03 220 .06 │ │ NBL 2 3400 100 .03 221 .07 │ │ NBT 3 5100 1120 .25* 1430 .33* │ │ NBT 3 5100 1120 .25* 1431 .33* │ │ NBR 0 0 180 250 │ │ NBR 0 0 180 250 │ │ │ │ │ │ SBL 1 1700 160 .09* 140 .08* │ │ SBL 1 1700 160 .09* 140 .08* │ │ SBT 3 5100 1470 .29 1350 .26 │ │ SBT 3 5100 1470 .29 1351 .26 │ │ SBR d 1700 100 .06 110 .06 │ │ SBR d 1700 100 .06 110 .06 │ │ │ │ │ │ EBL 2 3400 140 .04* 370 .11 │ │ EBL 2 3400 140 .04* 370 .11 │ │ EBT 3 5100 590 .12 1190 .23* │ │ EBT 3 5100 590 .12 1190 .23* │ │ EBR 1 1700 120 .07 340 .20 │ │ EBR 1 1700 120 .07 341 .20 │ │ │ │ │ │ WBL 2 3400 280 .08 310 .09* │ │ WBL 2 3400 280 .08 310 .09* │ │ WBT 3 5100 1060 .21* 650 .13 │ │ WBT 3 5100 1060 .21* 650 .13 │ │ WBR 1 1700 380 .22 560 .33 │ │ WBR 1 1700 380 .22 560 .33 │ │ │ │ │ │ Right Turn Adjustment WBR .08* │ │ Right Turn Adjustment WBR .08* │ │ Clearance Interval .05* .05* │ │ Clearance Interval .05* .05* │ └─────────────────────────────────────────────────────────┘ └─────────────────────────────────────────────────────────┘ TOTAL CAPACITY UTILIZATION .64 .86 TOTAL CAPACITY UTILIZATION .64 .86 ┌─────────────────────────────────────────────────────────┐ ┌─────────────────────────────────────────────────────────┐ │ 2016 No Project │ │ 2016 With Project │ │ │ │ │ │ AM PK HOUR PM PK HOUR │ │ AM PK HOUR PM PK HOUR │ │ LANES CAPACITY VOL V/C VOL V/C │ │ LANES CAPACITY VOL V/C VOL V/C │ │ │ │ │ │ NBL 2 3400 104 .03 219 .06 │ │ NBL 2 3400 104 .03 220 .06 │ │ NBT 3 5100 1265 .29* 1503 .35* │ │ NBT 3 5100 1265 .29* 1504 .35* │ │ NBR 0 0 239 261 │ │ NBR 0 0 239 261 │ │ │ │ │ │ SBL 1 1700 298 .18* 236 .14* │ │ SBL 1 1700 298 .18* 236 .14* │ │ SBT 3 5100 1470 .29 1425 .28 │ │ SBT 3 5100 1470 .29 1426 .28 │ │ SBR d 1700 142 .08 116 .07 │ │ SBR d 1700 142 .08 116 .07 │ │ │ │ │ │ EBL 2 3400 188 .06* 376 .11 │ │ EBL 2 3400 188 .06* 376 .11 │ │ EBT 3 5100 638 .13 1448 .28* │ │ EBT 3 5100 638 .13 1448 .28* │ │ EBR 1 1700 126 .07 344 .20 │ │ EBR 1 1700 126 .07 345 .20 │ │ │ │ │ │ WBL 2 3400 322 .09 387 .11* │ │ WBL 2 3400 322 .09 387 .11* │ │ WBT 3 5100 1228 .24* 758 .15 │ │ WBT 3 5100 1228 .24* 758 .15 │ │ WBR 1 1700 428 .25 662 .39 │ │ WBR 1 1700 428 .25 662 .39 │ │ │ │ │ │ Right Turn Adjustment WBR .04* │ │ Right Turn Adjustment WBR .04* │ │ Clearance Interval .05* .05* │ │ Clearance Interval .05* .05* │ └─────────────────────────────────────────────────────────┘ └─────────────────────────────────────────────────────────┘ TOTAL CAPACITY UTILIZATION .82 .97 TOTAL CAPACITY UTILIZATION .82 .97
B-3

8. Goldenwest St & Bolsa Ave ┌─────────────────────────────────────────────────────────┐ ┌─────────────────────────────────────────────────────────┐ │ 2030 General Plan │ │ 2030 with Proposed Project │ │ │ │ │ │ AM PK HOUR PM PK HOUR │ │ AM PK HOUR PM PK HOUR │ │ LANES CAPACITY VOL V/C VOL V/C │ │ LANES CAPACITY VOL V/C VOL V/C │ │ │ │ │ │ NBL 2 3400 110 .03 220 .06 │ │ NBL 2 3400 107 .03 220 .06 │ │ NBT 3 5100 1380 .33* 1560 .36* │ │ NBT 3 5100 1361 .32* 1553 .36* │ │ NBR 0 0 280 270 │ │ NBR 0 0 279 269 │ │ │ │ │ │ SBL 1 1700 390 .23* 300 .18* │ │ SBL 1 1700 390 .23* 300 .18* │ │ SBT 3 5100 1470 .29 1480 .29 │ │ SBT 3 5100 1470 .29 1476 .29 │ │ SBR d 1700 170 .10 120 .07 │ │ SBR d 1700 170 .10 120 .07 │ │ │ │ │ │ EBL 2 3400 220 .06* 380 .11 │ │ EBL 2 3400 220 .06* 380 .11 │ │ EBT 3 5100 670 .13 1620 .32* │ │ EBT 3 5100 670 .13 1620 .32* │ │ EBR 1 1700 130 .08 350 .21 │ │ EBR 1 1700 130 .08 348 .20 │ │ │ │ │ │ WBL 2 3400 350 .10 440 .13* │ │ WBL 2 3400 350 .10 439 .13* │ │ WBT 3 5100 1340 .26* 830 .16 │ │ WBT 3 5100 1340 .26* 830 .16 │ │ WBR 1 1700 460 .27 730 .43 │ │ WBR 1 1700 460 .27 730 .43 │ │ │ │ │ │ Clearance Interval .05* .05* │ │ Clearance Interval .05* .05* │ └─────────────────────────────────────────────────────────┘ └─────────────────────────────────────────────────────────┘ TOTAL CAPACITY UTILIZATION .93 1.04 TOTAL CAPACITY UTILIZATION .92 1.04
B-4

15. Goldenwest St & Mcfadden Ave ┌─────────────────────────────────────────────────────────┐ ┌─────────────────────────────────────────────────────────┐ │ Existing │ │ Existing Plus Project │ │ │ │ │ │ AM PK HOUR PM PK HOUR │ │ AM PK HOUR PM PK HOUR │ │ LANES CAPACITY VOL V/C VOL V/C │ │ LANES CAPACITY VOL V/C VOL V/C │ │ │ │ │ │ NBL 1 1700 100 .06* 100 .06 │ │ NBL 1 1700 100 .06* 100 .06 │ │ NBT 3 5100 1020 .20 1310 .26* │ │ NBT 3 5100 1020 .20 1310 .26* │ │ NBR d 1700 70 .04 100 .06 │ │ NBR d 1700 70 .04 100 .06 │ │ │ │ │ │ SBL 1 1700 220 .13 180 .11* │ │ SBL 1 1700 220 .13 182 .11* │ │ SBT 3 5100 1490 .31* 1480 .30 │ │ SBT 3 5100 1490 .31* 1480 .30 │ │ SBR 0 0 70 70 │ │ SBR 0 0 70 70 │ │ │ │ │ │ EBL 1 1700 140 .08 140 .08 │ │ EBL 1 1700 140 .08 140 .08 │ │ EBT 2 3400 520 .15* 580 .17* │ │ EBT 2 3400 520 .15* 582 .17* │ │ EBR d 1700 190 .11 130 .08 │ │ EBR d 1700 190 .11 130 .08 │ │ │ │ │ │ WBL 1 1700 180 .11* 220 .13* │ │ WBL 1 1700 180 .11* 220 .13* │ │ WBT 2 3400 550 .16 470 .14 │ │ WBT 2 3400 550 .16 472 .14 │ │ WBR d 1700 140 .08 290 .17 │ │ WBR d 1700 140 .08 292 .17 │ │ │ │ │ │ Clearance Interval .05* .05* │ │ Clearance Interval .05* .05* │ └─────────────────────────────────────────────────────────┘ └─────────────────────────────────────────────────────────┘ TOTAL CAPACITY UTILIZATION .68 .72 TOTAL CAPACITY UTILIZATION .68 .72 ┌─────────────────────────────────────────────────────────┐ ┌─────────────────────────────────────────────────────────┐ │ 2016 No Project │ │ 2016 With Project │ │ │ │ │ │ AM PK HOUR PM PK HOUR │ │ AM PK HOUR PM PK HOUR │ │ LANES CAPACITY VOL V/C VOL V/C │ │ LANES CAPACITY VOL V/C VOL V/C │ │ │ │ │ │ NBL 1 1700 112 .07* 106 .06 │ │ NBL 1 1700 112 .07* 106 .06 │ │ NBT 3 5100 1212 .24 1496 .29* │ │ NBT 3 5100 1212 .24 1496 .29* │ │ NBR d 1700 76 .04 136 .08 │ │ NBR d 1700 76 .04 136 .08 │ │ │ │ │ │ SBL 1 1700 226 .13 193 .11* │ │ SBL 1 1700 226 .13 195 .11* │ │ SBT 3 5100 1556 .32* 1630 .33 │ │ SBT 3 5100 1556 .32* 1630 .33 │ │ SBR 0 0 76 70 │ │ SBR 0 0 76 70 │ │ │ │ │ │ EBL 1 1700 152 .09 146 .09 │ │ EBL 1 1700 152 .09 146 .09 │ │ EBT 2 3400 512 .15* 590 .17* │ │ EBT 2 3400 512 .15* 592 .17* │ │ EBR d 1700 196 .12 136 .08 │ │ EBR d 1700 196 .12 136 .08 │ │ │ │ │ │ WBL 1 1700 204 .12* 226 .13* │ │ WBL 1 1700 204 .12* 226 .13* │ │ WBT 2 3400 562 .17 462 .14 │ │ WBT 2 3400 562 .17 464 .14 │ │ WBR d 1700 168 .10 277 .16 │ │ WBR d 1700 168 .10 279 .16 │ │ │ │ │ │ Clearance Interval .05* .05* │ │ Clearance Interval .05* .05* │ └─────────────────────────────────────────────────────────┘ └─────────────────────────────────────────────────────────┘ TOTAL CAPACITY UTILIZATION .71 .75 TOTAL CAPACITY UTILIZATION .71 .75
B-5

15. Goldenwest St & Mcfadden Ave ┌─────────────────────────────────────────────────────────┐ ┌─────────────────────────────────────────────────────────┐ │ 2030 General Plan │ │ 2030 with Proposed Project │ │ │ │ │ │ AM PK HOUR PM PK HOUR │ │ AM PK HOUR PM PK HOUR │ │ LANES CAPACITY VOL V/C VOL V/C │ │ LANES CAPACITY VOL V/C VOL V/C │ │ │ │ │ │ NBL 1 1700 120 .07* 110 .06 │ │ NBL 1 1700 120 .07* 110 .06 │ │ NBT 3 5100 1340 .26 1620 .32* │ │ NBT 3 5100 1340 .26 1620 .32* │ │ NBR d 1700 80 .05 160 .09 │ │ NBR d 1700 80 .05 160 .09 │ │ │ │ │ │ SBL 1 1700 230 .14 210 .12* │ │ SBL 1 1700 230 .14 204 .12* │ │ SBT 3 5100 1600 .33* 1730 .35 │ │ SBT 3 5100 1600 .33* 1730 .35 │ │ SBR 0 0 80 70 │ │ SBR 0 0 80 70 │ │ │ │ │ │ EBL 1 1700 160 .09 150 .09 │ │ EBL 1 1700 160 .09 150 .09 │ │ EBT 2 3400 510 .15* 610 .18* │ │ EBT 2 3400 507 .15* 599 .18* │ │ EBR d 1700 200 .12 140 .08 │ │ EBR d 1700 200 .12 140 .08 │ │ │ │ │ │ WBL 1 1700 220 .13* 230 .14* │ │ WBL 1 1700 220 .13* 230 .14* │ │ WBT 2 3400 580 .17 460 .14 │ │ WBT 2 3400 570 .17 458 .13 │ │ WBR d 1700 210 .12 280 .16 │ │ WBR d 1700 187 .11 271 .16 │ │ │ │ │ │ Clearance Interval .05* .05* │ │ Clearance Interval .05* .05* │ └─────────────────────────────────────────────────────────┘ └─────────────────────────────────────────────────────────┘ TOTAL CAPACITY UTILIZATION .73 .81 TOTAL CAPACITY UTILIZATION .73 .81
B-6

16. Gothard St & Mcfadden Ave ┌─────────────────────────────────────────────────────────┐ ┌─────────────────────────────────────────────────────────┐ │ Existing │ │ Existing Plus Project │ │ │ │ │ │ AM PK HOUR PM PK HOUR │ │ AM PK HOUR PM PK HOUR │ │ LANES CAPACITY VOL V/C VOL V/C │ │ LANES CAPACITY VOL V/C VOL V/C │ │ │ │ │ │ NBL 2 3400 190 .06* 420 .12* │ │ NBL 2 3400 191 .06* 424 .12* │ │ NBT 0 0 0 0 │ │ NBT 0 0 0 0 │ │ NBR 1 1700 240 .14 420 .25 │ │ NBR 1 1700 240 .14 421 .25 │ │ │ │ │ │ SBL 0 0 0 0 │ │ SBL 0 0 0 0 │ │ SBT 0 0 0 0 │ │ SBT 0 0 0 0 │ │ SBR 0 0 0 0 │ │ SBR 0 0 0 0 │ │ │ │ │ │ EBL 0 0 0 0 │ │ EBL 0 0 0 0 │ │ EBT 2 3400 660 .19* 520 .15* │ │ EBT 2 3400 660 .19* 520 .15* │ │ EBR d 1700 360 .21 280 .16 │ │ EBR d 1700 361 .21 284 .17 │ │ │ │ │ │ WBL 1 1700 300 .18* 200 .12* │ │ WBL 1 1700 300 .18* 201 .12* │ │ WBT 2 3400 570 .17 710 .21 │ │ WBT 2 3400 570 .17 710 .21 │ │ WBR 0 0 0 0 │ │ WBR 0 0 0 0 │ │ │ │ │ │ Right Turn Adjustment NBR .07* │ │ Right Turn Adjustment NBR .07* │ │ Clearance Interval .05* .05* │ │ Clearance Interval .05* .05* │ └─────────────────────────────────────────────────────────┘ └─────────────────────────────────────────────────────────┘ TOTAL CAPACITY UTILIZATION .48 .51 TOTAL CAPACITY UTILIZATION .48 .51 ┌─────────────────────────────────────────────────────────┐ ┌─────────────────────────────────────────────────────────┐ │ 2016 No Project │ │ 2016 With Project │ │ │ │ │ │ AM PK HOUR PM PK HOUR │ │ AM PK HOUR PM PK HOUR │ │ LANES CAPACITY VOL V/C VOL V/C │ │ LANES CAPACITY VOL V/C VOL V/C │ │ │ │ │ │ NBL 2 3400 225 .07* 399 .12* │ │ NBL 2 3400 226 .07* 403 .12* │ │ NBT 0 0 0 0 │ │ NBT 0 0 0 0 │ │ NBR 1 1700 313 .18 541 .32 │ │ NBR 1 1700 313 .18 542 .32 │ │ │ │ │ │ SBL 0 0 0 0 │ │ SBL 0 0 0 0 │ │ SBT 0 0 0 0 │ │ SBT 0 0 0 0 │ │ SBR 0 0 0 0 │ │ SBR 0 0 0 0 │ │ │ │ │ │ EBL 0 0 0 0 │ │ EBL 0 0 0 0 │ │ EBT 2 3400 678 .20* 508 .15* │ │ EBT 2 3400 678 .20* 508 .15* │ │ EBR d 1700 442 .26 309 .18 │ │ EBR d 1700 443 .26 313 .18 │ │ │ │ │ │ WBL 1 1700 386 .23* 266 .16* │ │ WBL 1 1700 386 .23* 267 .16* │ │ WBT 2 3400 588 .17 710 .21 │ │ WBT 2 3400 588 .17 710 .21 │ │ WBR 0 0 0 0 │ │ WBR 0 0 0 0 │ │ │ │ │ │ Right Turn Adjustment EBR .02* NBR .12* │ │ Right Turn Adjustment EBR .02* NBR .12* │ │ Clearance Interval .05* .05* │ │ Clearance Interval .05* .05* │ └─────────────────────────────────────────────────────────┘ └─────────────────────────────────────────────────────────┘ TOTAL CAPACITY UTILIZATION .57 .60 TOTAL CAPACITY UTILIZATION .57 .60
B-7

16. Gothard St & Mcfadden Ave ┌─────────────────────────────────────────────────────────┐ ┌─────────────────────────────────────────────────────────┐ │ 2030 General Plan │ │ 2030 with Proposed Project │ │ │ │ │ │ AM PK HOUR PM PK HOUR │ │ AM PK HOUR PM PK HOUR │ │ LANES CAPACITY VOL V/C VOL V/C │ │ LANES CAPACITY VOL V/C VOL V/C │ │ │ │ │ │ NBL 2 3400 280 .08* 400 .12* │ │ NBL 2 3400 249 .07* 389 .11* │ │ NBT 0 0 0 0 │ │ NBT 0 0 0 0 │ │ NBR 1 1700 380 .22 630 .37 │ │ NBR 1 1700 361 .21 623 .37 │ │ │ │ │ │ SBL 0 0 0 0 │ │ SBL 0 0 0 0 │ │ SBT 0 0 0 0 │ │ SBT 0 0 0 0 │ │ SBR 0 0 0 0 │ │ SBR 0 0 0 0 │ │ │ │ │ │ EBL 0 0 0 0 │ │ EBL 0 0 0 0 │ │ EBT 2 3400 690 .20* 500 .15* │ │ EBT 2 3400 690 .20* 500 .15* │ │ EBR d 1700 500 .29 350 .21 │ │ EBR d 1700 498 .29 333 .20 │ │ │ │ │ │ WBL 1 1700 450 .26* 340 .20* │ │ WBL 1 1700 444 .26* 311 .18* │ │ WBT 2 3400 600 .18 710 .21 │ │ WBT 2 3400 600 .18 710 .21 │ │ WBR 0 0 0 0 │ │ WBR 0 0 0 0 │ │ │ │ │ │ Right Turn Adjustment Multi .06* NBR .15* │ │ Right Turn Adjustment Multi .06* NBR .17* │ │ Clearance Interval .05* .05* │ │ Clearance Interval .05* .05* │ └─────────────────────────────────────────────────────────┘ └─────────────────────────────────────────────────────────┘ TOTAL CAPACITY UTILIZATION .65 .67 TOTAL CAPACITY UTILIZATION .64 .66
B-8

17. Gothard St & Center Ave ┌─────────────────────────────────────────────────────────┐ ┌─────────────────────────────────────────────────────────┐ │ Existing │ │ Existing Plus Project │ │ │ │ │ │ AM PK HOUR PM PK HOUR │ │ AM PK HOUR PM PK HOUR │ │ LANES CAPACITY VOL V/C VOL V/C │ │ LANES CAPACITY VOL V/C VOL V/C │ │ │ │ │ │ NBL 1 1700 70 .04 30 .02 │ │ NBL 1 1700 70 .04 30 .02 │ │ NBT 2 3400 360 .11* 630 .19* │ │ NBT 2 3400 360 .11* 630 .19* │ │ NBR d 1700 90 .05 100 .06 │ │ NBR d 1700 95 .06 119 .07 │ │ │ │ │ │ SBL 1 1700 90 .05* 130 .08* │ │ SBL 1 1700 91 .05* 135 .08* │ │ SBT 2 3400 350 .10 310 .09 │ │ SBT 2 3400 350 .10 310 .09 │ │ SBR d 1700 40 .02 10 .01 │ │ SBR d 1700 40 .02 10 .01 │ │ │ │ │ │ EBL 1 1700 10 .01 20 .01 │ │ EBL 1 1700 10 .01 20 .01 │ │ EBT 1 1700 10 .02* 50 .04* │ │ EBT 1 1700 10 .02* 50 .04* │ │ EBR 0 0 20 20 │ │ EBR 0 0 20 20 │ │ │ │ │ │ WBL 1 1700 80 .05* 180 .11* │ │ WBL 1 1700 84 .05* 202 .12* │ │ WBT 2 3400 50 .03 20 .01 │ │ WBT 2 3400 50 .03 20 .01 │ │ WBR 0 0 40 140 .08 │ │ WBR 0 0 41 146 .09 │ │ │ │ │ │ Clearance Interval .05* .05* │ │ Clearance Interval .05* .05* │ └─────────────────────────────────────────────────────────┘ └─────────────────────────────────────────────────────────┘ TOTAL CAPACITY UTILIZATION .28 .47 TOTAL CAPACITY UTILIZATION .28 .48 ┌─────────────────────────────────────────────────────────┐ ┌─────────────────────────────────────────────────────────┐ │ 2016 No Project │ │ 2016 With Project │ │ │ │ │ │ AM PK HOUR PM PK HOUR │ │ AM PK HOUR PM PK HOUR │ │ LANES CAPACITY VOL V/C VOL V/C │ │ LANES CAPACITY VOL V/C VOL V/C │ │ │ │ │ │ NBL 1 1700 130 .08* 30 .02 │ │ NBL 1 1700 130 .08* 30 .02 │ │ NBT 2 3400 374 .11 648 .19* │ │ NBT 2 3400 374 .11 648 .19* │ │ NBR d 1700 96 .06 88 .05 │ │ NBR d 1700 101 .06 107 .06 │ │ │ │ │ │ SBL 1 1700 120 .07 232 .14* │ │ SBL 1 1700 121 .07 237 .14* │ │ SBT 2 3400 424 .12* 322 .09 │ │ SBT 2 3400 424 .12* 322 .09 │ │ SBR d 1700 94 .06 16 .01 │ │ SBR d 1700 94 .06 16 .01 │ │ │ │ │ │ EBL 1 1700 28 .02* 74 .04 │ │ EBL 1 1700 28 .02* 74 .04 │ │ EBT 1 1700 10 .02 48 .04* │ │ EBT 1 1700 10 .02 48 .04* │ │ EBR 0 0 20 26 │ │ EBR 0 0 20 26 │ │ │ │ │ │ WBL 1 1700 80 .05 170 .10* │ │ WBL 1 1700 84 .05 192 .11* │ │ WBT 2 3400 78 .05* 25 .01 │ │ WBT 2 3400 78 .05* 25 .01 │ │ WBR 0 0 82 .05 140 .08 │ │ WBR 0 0 83 .05 146 .09 │ │ │ │ │ │ Clearance Interval .05* .05* │ │ Clearance Interval .05* .05* │ └─────────────────────────────────────────────────────────┘ └─────────────────────────────────────────────────────────┘ TOTAL CAPACITY UTILIZATION .32 .52 TOTAL CAPACITY UTILIZATION .32 .53
B-9

17. Gothard St & Center Ave ┌─────────────────────────────────────────────────────────┐ ┌─────────────────────────────────────────────────────────┐ │ 2030 General Plan │ │ 2030 with Proposed Project │ │ │ │ │ │ AM PK HOUR PM PK HOUR │ │ AM PK HOUR PM PK HOUR │ │ LANES CAPACITY VOL V/C VOL V/C │ │ LANES CAPACITY VOL V/C VOL V/C │ │ │ │ │ │ NBL 1 1700 170 .10* 30 .02 │ │ NBL 1 1700 170 .10* 30 .02 │ │ NBT 2 3400 390 .11 680 .20* │ │ NBT 2 3400 383 .11 660 .19* │ │ NBR d 1700 100 .06 80 .05 │ │ NBR d 1700 105 .06 99 .06 │ │ │ │ │ │ SBL 1 1700 140 .08 300 .18* │ │ SBL 1 1700 141 .08 305 .18* │ │ SBT 2 3400 490 .14* 330 .10 │ │ SBT 2 3400 473 .14* 330 .10 │ │ SBR d 1700 130 .08 20 .01 │ │ SBR d 1700 130 .08 20 .01 │ │ │ │ │ │ EBL 1 1700 40 .02* 110 .06 │ │ EBL 1 1700 40 .02* 110 .06 │ │ EBT 1 1700 10 .02 50 .05* │ │ EBT 1 1700 10 .02 47 .05* │ │ EBR 0 0 20 30 │ │ EBR 0 0 20 30 │ │ │ │ │ │ WBL 1 1700 80 .05 180 .11* │ │ WBL 1 1700 84 .05 186 .11* │ │ WBT 2 3400 100 .06* 30 .02 │ │ WBT 2 3400 96 .06* 29 .02 │ │ WBR 0 0 110 .06 140 .08 │ │ WBR 0 0 111 .07 146 .09 │ │ │ │ │ │ Clearance Interval .05* .05* │ │ Clearance Interval .05* .05* │ └─────────────────────────────────────────────────────────┘ └─────────────────────────────────────────────────────────┘ TOTAL CAPACITY UTILIZATION .37 .59 TOTAL CAPACITY UTILIZATION .37 .58
B-10

18. I-405 SB Ramps & Center Ave ┌─────────────────────────────────────────────────────────┐ ┌─────────────────────────────────────────────────────────┐ │ Existing │ │ Existing Plus Project │ │ │ │ │ │ AM PK HOUR PM PK HOUR │ │ AM PK HOUR PM PK HOUR │ │ LANES CAPACITY VOL V/C VOL V/C │ │ LANES CAPACITY VOL V/C VOL V/C │ │ │ │ │ │ NBL 0 0 0 0 │ │ NBL 0 0 0 0 │ │ NBT 0 0 0 0 │ │ NBT 0 0 0 0 │ │ NBR 0 0 0 0 │ │ NBR 0 0 0 0 │ │ │ │ │ │ SBL 2 3400 800 .24* 930 .27* │ │ SBL 2 3400 800 .24* 930 .27* │ │ SBT 0 0 0 0 │ │ SBT 0 0 0 0 │ │ SBR 1 1700 150 .09 200 .12 │ │ SBR 1 1700 150 .09 202 .12 │ │ │ │ │ │ EBL 1 1700 50 .03* 350 .21* │ │ EBL 1 1700 50 .03* 352 .21* │ │ EBT 2 3400 90 .03 210 .06 │ │ EBT 2 3400 91 .03 213 .06 │ │ EBR 0 0 0 0 │ │ EBR 0 0 0 0 │ │ │ │ │ │ WBL 0 0 0 0 │ │ WBL 0 0 0 0 │ │ WBT 2 3400 260 .08* 240 .07* │ │ WBT 2 3400 261 .08* 243 .07* │ │ WBR 1 1700 310 .18 610 .36 │ │ WBR 1 1700 310 .18 610 .36 │ │ │ │ │ │ Right Turn Adjustment WBR .15* │ │ Right Turn Adjustment WBR .15* │ │ Clearance Interval .05* .05* │ │ Clearance Interval .05* .05* │ └─────────────────────────────────────────────────────────┘ └─────────────────────────────────────────────────────────┘ TOTAL CAPACITY UTILIZATION .40 .75 TOTAL CAPACITY UTILIZATION .40 .75 ┌─────────────────────────────────────────────────────────┐ ┌─────────────────────────────────────────────────────────┐ │ 2016 No Project │ │ 2016 With Project │ │ │ │ │ │ AM PK HOUR PM PK HOUR │ │ AM PK HOUR PM PK HOUR │ │ LANES CAPACITY VOL V/C VOL V/C │ │ LANES CAPACITY VOL V/C VOL V/C │ │ │ │ │ │ NBL 0 0 0 0 │ │ NBL 0 0 0 0 │ │ NBT 0 0 0 0 │ │ NBT 0 0 0 0 │ │ NBR 0 0 0 0 │ │ NBR 0 0 0 0 │ │ │ │ │ │ SBL 2 3400 812 .24* 978 .29* │ │ SBL 2 3400 812 .24* 978 .29* │ │ SBT 0 0 0 0 │ │ SBT 0 0 0 0 │ │ SBR 1 1700 155 .09 220 .13 │ │ SBR 1 1700 155 .09 222 .13 │ │ │ │ │ │ EBL 1 1700 57 .03* 393 .23* │ │ EBL 1 1700 57 .03* 395 .23* │ │ EBT 2 3400 121 .04 209 .06 │ │ EBT 2 3400 122 .04 212 .06 │ │ EBR 0 0 0 0 │ │ EBR 0 0 0 0 │ │ │ │ │ │ WBL 0 0 0 0 │ │ WBL 0 0 0 0 │ │ WBT 2 3400 301 .09* 267 .08* │ │ WBT 2 3400 302 .09* 270 .08* │ │ WBR 1 1700 460 .27 664 .39 │ │ WBR 1 1700 460 .27 664 .39 │ │ │ │ │ │ Right Turn Adjustment WBR .06* WBR .16* │ │ Right Turn Adjustment WBR .06* WBR .16* │ │ Clearance Interval .05* .05* │ │ Clearance Interval .05* .05* │ └─────────────────────────────────────────────────────────┘ └─────────────────────────────────────────────────────────┘ TOTAL CAPACITY UTILIZATION .47 .81 TOTAL CAPACITY UTILIZATION .47 .81
B-11

18. I-405 SB Ramps & Center Ave ┌─────────────────────────────────────────────────────────┐ ┌─────────────────────────────────────────────────────────┐ │ 2030 General Plan │ │ 2030 with Proposed Project │ │ │ │ │ │ AM PK HOUR PM PK HOUR │ │ AM PK HOUR PM PK HOUR │ │ LANES CAPACITY VOL V/C VOL V/C │ │ LANES CAPACITY VOL V/C VOL V/C │ │ │ │ │ │ NBL 0 0 0 0 │ │ NBL 0 0 0 0 │ │ NBT 0 0 0 0 │ │ NBT 0 0 0 0 │ │ NBR 0 0 0 0 │ │ NBR 0 0 0 0 │ │ │ │ │ │ SBL 2 3400 820 .24* 1010 .30* │ │ SBL 2 3400 820 .24* 1010 .30* │ │ SBT 0 0 0 0 │ │ SBT 0 0 0 0 │ │ SBR 1 1700 160 .09 240 .14 │ │ SBR 1 1700 159 .09 235 .14 │ │ │ │ │ │ EBL 1 1700 80 .05* 430 .25* │ │ EBL 1 1700 61 .04* 423 .25* │ │ EBT 2 3400 150 .04 210 .06 │ │ EBT 2 3400 143 .04 212 .06 │ │ EBR 0 0 0 0 │ │ EBR 0 0 0 0 │ │ │ │ │ │ WBL 0 0 0 0 │ │ WBL 0 0 0 0 │ │ WBT 2 3400 330 .10* 300 .09* │ │ WBT 2 3400 329 .10* 288 .08* │ │ WBR 1 1700 560 .33 700 .41 │ │ WBR 1 1700 560 .33 700 .41 │ │ │ │ │ │ Right Turn Adjustment WBR .11* WBR .17* │ │ Right Turn Adjustment WBR .11* WBR .18* │ │ Clearance Interval .05* .05* │ │ Clearance Interval .05* .05* │ └─────────────────────────────────────────────────────────┘ └─────────────────────────────────────────────────────────┘ TOTAL CAPACITY UTILIZATION .55 .86 TOTAL CAPACITY UTILIZATION .54 .86
B-12
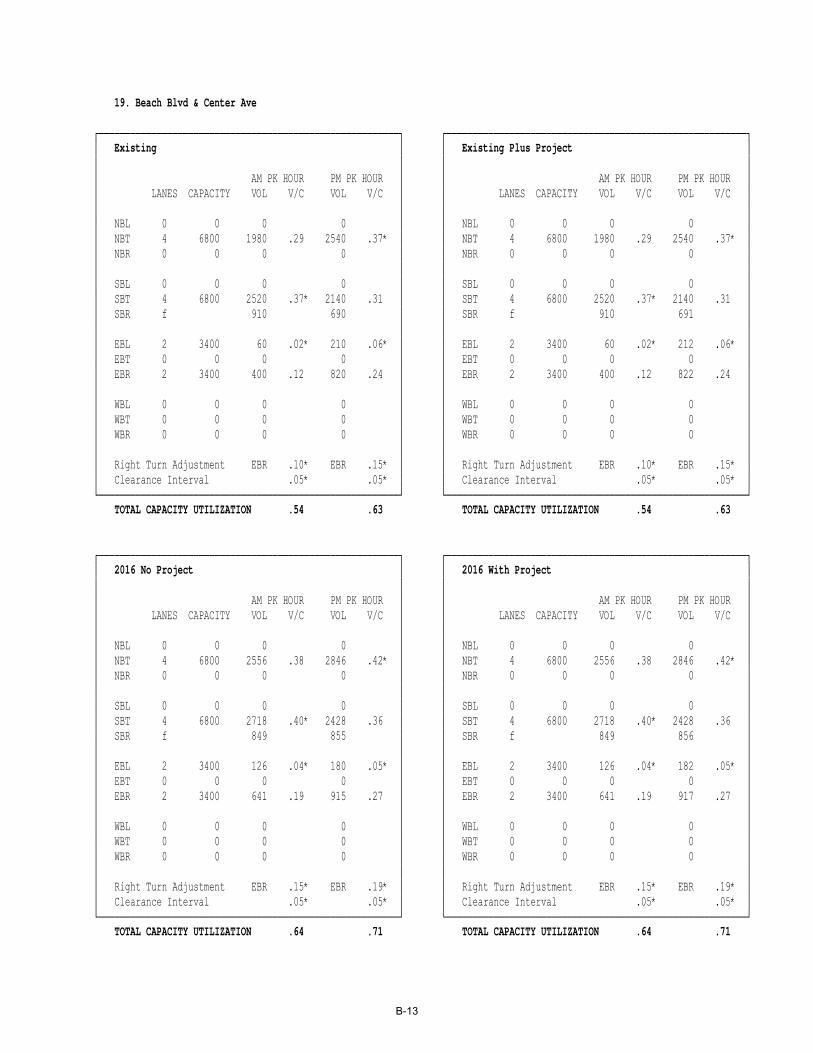
19. Beach Blvd & Center Ave ┌─────────────────────────────────────────────────────────┐ ┌─────────────────────────────────────────────────────────┐ │ Existing │ │ Existing Plus Project │ │ │ │ │ │ AM PK HOUR PM PK HOUR │ │ AM PK HOUR PM PK HOUR │ │ LANES CAPACITY VOL V/C VOL V/C │ │ LANES CAPACITY VOL V/C VOL V/C │ │ │ │ │ │ NBL 0 0 0 0 │ │ NBL 0 0 0 0 │ │ NBT 4 6800 1980 .29 2540 .37* │ │ NBT 4 6800 1980 .29 2540 .37* │ │ NBR 0 0 0 0 │ │ NBR 0 0 0 0 │ │ │ │ │ │ SBL 0 0 0 0 │ │ SBL 0 0 0 0 │ │ SBT 4 6800 2520 .37* 2140 .31 │ │ SBT 4 6800 2520 .37* 2140 .31 │ │ SBR f 910 690 │ │ SBR f 910 691 │ │ │ │ │ │ EBL 2 3400 60 .02* 210 .06* │ │ EBL 2 3400 60 .02* 212 .06* │ │ EBT 0 0 0 0 │ │ EBT 0 0 0 0 │ │ EBR 2 3400 400 .12 820 .24 │ │ EBR 2 3400 400 .12 822 .24 │ │ │ │ │ │ WBL 0 0 0 0 │ │ WBL 0 0 0 0 │ │ WBT 0 0 0 0 │ │ WBT 0 0 0 0 │ │ WBR 0 0 0 0 │ │ WBR 0 0 0 0 │ │ │ │ │ │ Right Turn Adjustment EBR .10* EBR .15* │ │ Right Turn Adjustment EBR .10* EBR .15* │ │ Clearance Interval .05* .05* │ │ Clearance Interval .05* .05* │ └─────────────────────────────────────────────────────────┘ └─────────────────────────────────────────────────────────┘ TOTAL CAPACITY UTILIZATION .54 .63 TOTAL CAPACITY UTILIZATION .54 .63 ┌─────────────────────────────────────────────────────────┐ ┌─────────────────────────────────────────────────────────┐ │ 2016 No Project │ │ 2016 With Project │ │ │ │ │ │ AM PK HOUR PM PK HOUR │ │ AM PK HOUR PM PK HOUR │ │ LANES CAPACITY VOL V/C VOL V/C │ │ LANES CAPACITY VOL V/C VOL V/C │ │ │ │ │ │ NBL 0 0 0 0 │ │ NBL 0 0 0 0 │ │ NBT 4 6800 2556 .38 2846 .42* │ │ NBT 4 6800 2556 .38 2846 .42* │ │ NBR 0 0 0 0 │ │ NBR 0 0 0 0 │ │ │ │ │ │ SBL 0 0 0 0 │ │ SBL 0 0 0 0 │ │ SBT 4 6800 2718 .40* 2428 .36 │ │ SBT 4 6800 2718 .40* 2428 .36 │ │ SBR f 849 855 │ │ SBR f 849 856 │ │ │ │ │ │ EBL 2 3400 126 .04* 180 .05* │ │ EBL 2 3400 126 .04* 182 .05* │ │ EBT 0 0 0 0 │ │ EBT 0 0 0 0 │ │ EBR 2 3400 641 .19 915 .27 │ │ EBR 2 3400 641 .19 917 .27 │ │ │ │ │ │ WBL 0 0 0 0 │ │ WBL 0 0 0 0 │ │ WBT 0 0 0 0 │ │ WBT 0 0 0 0 │ │ WBR 0 0 0 0 │ │ WBR 0 0 0 0 │ │ │ │ │ │ Right Turn Adjustment EBR .15* EBR .19* │ │ Right Turn Adjustment EBR .15* EBR .19* │ │ Clearance Interval .05* .05* │ │ Clearance Interval .05* .05* │ └─────────────────────────────────────────────────────────┘ └─────────────────────────────────────────────────────────┘ TOTAL CAPACITY UTILIZATION .64 .71 TOTAL CAPACITY UTILIZATION .64 .71
B-13

19. Beach Blvd & Center Ave ┌─────────────────────────────────────────────────────────┐ ┌─────────────────────────────────────────────────────────┐ │ 2030 General Plan │ │ 2030 with Proposed Project │ │ │ │ │ │ AM PK HOUR PM PK HOUR │ │ AM PK HOUR PM PK HOUR │ │ LANES CAPACITY VOL V/C VOL V/C │ │ LANES CAPACITY VOL V/C VOL V/C │ │ │ │ │ │ NBL 0 0 0 0 │ │ NBL 0 0 0 0 │ │ NBT 4 6800 2940 .43* 3050 .45* │ │ NBT 4 6800 2940 .43* 3050 .45* │ │ NBR 0 0 0 0 │ │ NBR 0 0 0 0 │ │ │ │ │ │ SBL 0 0 0 0 │ │ SBL 0 0 0 0 │ │ SBT 4 6800 2850 .42 2620 .39 │ │ SBT 4 6800 2850 .42 2620 .39 │ │ SBR f 810 980 │ │ SBR f 808 966 │ │ │ │ │ │ EBL 2 3400 170 .05* 160 .05* │ │ EBL 2 3400 170 .05* 162 .05* │ │ EBT 0 0 0 0 │ │ EBT 0 0 0 0 │ │ EBR 2 3400 810 .24 980 .29 │ │ EBR 2 3400 802 .24 981 .29 │ │ │ │ │ │ WBL 0 0 0 0 │ │ WBL 0 0 0 0 │ │ WBT 0 0 0 0 │ │ WBT 0 0 0 0 │ │ WBR 0 0 0 0 │ │ WBR 0 0 0 0 │ │ │ │ │ │ Right Turn Adjustment EBR .18* EBR .21* │ │ Right Turn Adjustment EBR .18* EBR .21* │ │ Clearance Interval .05* .05* │ │ Clearance Interval .05* .05* │ └─────────────────────────────────────────────────────────┘ └─────────────────────────────────────────────────────────┘ TOTAL CAPACITY UTILIZATION .71 .76 TOTAL CAPACITY UTILIZATION .71 .76
B-14

26. Goldenwest St & Edinger Ave ┌─────────────────────────────────────────────────────────┐ ┌─────────────────────────────────────────────────────────┐ │ Existing │ │ Existing Plus Project │ │ │ │ │ │ AM PK HOUR PM PK HOUR │ │ AM PK HOUR PM PK HOUR │ │ LANES CAPACITY VOL V/C VOL V/C │ │ LANES CAPACITY VOL V/C VOL V/C │ │ │ │ │ │ NBL 1 1700 130 .08 160 .09 │ │ NBL 1 1700 130 .08 160 .09 │ │ NBT 3 5100 1130 .22* 1130 .22* │ │ NBT 3 5100 1130 .22* 1130 .22* │ │ NBR d 1700 100 .06 80 .05 │ │ NBR d 1700 101 .06 84 .05 │ │ │ │ │ │ SBL 1 1700 190 .11* 210 .12* │ │ SBL 1 1700 190 .11* 210 .12* │ │ SBT 3 5100 1110 .22 1060 .21 │ │ SBT 3 5100 1110 .22 1060 .21 │ │ SBR d 1700 110 .06 100 .06 │ │ SBR d 1700 110 .06 100 .06 │ │ │ │ │ │ EBL 1 1700 150 .09 120 .07* │ │ EBL 1 1700 150 .09 120 .07* │ │ EBT 3 5100 1000 .20* 670 .13 │ │ EBT 3 5100 1001 .20* 674 .13 │ │ EBR d 1700 110 .06 160 .09 │ │ EBR d 1700 110 .06 160 .09 │ │ │ │ │ │ WBL 1 1700 60 .04* 140 .08 │ │ WBL 1 1700 61 .04* 144 .08 │ │ WBT 3 5100 480 .09 720 .14* │ │ WBT 3 5100 481 .09 725 .14* │ │ WBR d 1700 80 .05 230 .14 │ │ WBR d 1700 80 .05 230 .14 │ │ │ │ │ │ Clearance Interval .05* .05* │ │ Clearance Interval .05* .05* │ └─────────────────────────────────────────────────────────┘ └─────────────────────────────────────────────────────────┘ TOTAL CAPACITY UTILIZATION .62 .60 TOTAL CAPACITY UTILIZATION .62 .60 ┌─────────────────────────────────────────────────────────┐ ┌─────────────────────────────────────────────────────────┐ │ 2016 No Project │ │ 2016 With Project │ │ │ │ │ │ AM PK HOUR PM PK HOUR │ │ AM PK HOUR PM PK HOUR │ │ LANES CAPACITY VOL V/C VOL V/C │ │ LANES CAPACITY VOL V/C VOL V/C │ │ │ │ │ │ NBL 1 1700 154 .09 166 .10 │ │ NBL 1 1700 154 .09 166 .10 │ │ NBT 3 5100 1244 .24* 1166 .23* │ │ NBT 3 5100 1244 .24* 1166 .23* │ │ NBR d 1700 130 .08 91 .05 │ │ NBR d 1700 131 .08 95 .06 │ │ │ │ │ │ SBL 1 1700 178 .10* 204 .12* │ │ SBL 1 1700 178 .10* 204 .12* │ │ SBT 3 5100 1242 .24 1114 .22 │ │ SBT 3 5100 1242 .24 1114 .22 │ │ SBR d 1700 116 .07 112 .07 │ │ SBR d 1700 116 .07 112 .07 │ │ │ │ │ │ EBL 1 1700 162 .10* 198 .12* │ │ EBL 1 1700 162 .10* 198 .12* │ │ EBT 3 5100 969 .19 777 .15 │ │ EBT 3 5100 970 .19 781 .15 │ │ EBR d 1700 110 .06 160 .09 │ │ EBR d 1700 110 .06 160 .09 │ │ │ │ │ │ WBL 1 1700 71 .04 146 .09 │ │ WBL 1 1700 72 .04 150 .09 │ │ WBT 3 5100 646 .13* 796 .16* │ │ WBT 3 5100 647 .13* 801 .16* │ │ WBR d 1700 104 .06 272 .16 │ │ WBR d 1700 104 .06 272 .16 │ │ │ │ │ │ Clearance Interval .05* .05* │ │ Clearance Interval .05* .05* │ └─────────────────────────────────────────────────────────┘ └─────────────────────────────────────────────────────────┘ TOTAL CAPACITY UTILIZATION .62 .68 TOTAL CAPACITY UTILIZATION .62 .68
B-15

26. Goldenwest St & Edinger Ave ┌─────────────────────────────────────────────────────────┐ ┌─────────────────────────────────────────────────────────┐ │ 2030 General Plan │ │ 2030 with Proposed Project │ │ │ │ │ │ AM PK HOUR PM PK HOUR │ │ AM PK HOUR PM PK HOUR │ │ LANES CAPACITY VOL V/C VOL V/C │ │ LANES CAPACITY VOL V/C VOL V/C │ │ │ │ │ │ NBL 1 1700 170 .10* 170 .10 │ │ NBL 1 1700 170 .10* 170 .10 │ │ NBT 3 5100 1320 .26 1190 .23* │ │ NBT 3 5100 1320 .26 1190 .23* │ │ NBR d 1700 150 .09 100 .06 │ │ NBR d 1700 151 .09 103 .06 │ │ │ │ │ │ SBL 1 1700 170 .10 200 .12* │ │ SBL 1 1700 170 .10 200 .12* │ │ SBT 3 5100 1330 .26* 1150 .23 │ │ SBT 3 5100 1330 .26* 1150 .23 │ │ SBR d 1700 120 .07 120 .07 │ │ SBR d 1700 120 .07 120 .07 │ │ │ │ │ │ EBL 1 1700 170 .10* 250 .15* │ │ EBL 1 1700 170 .10* 250 .15* │ │ EBT 3 5100 950 .19 850 .17 │ │ EBT 3 5100 950 .19 853 .17 │ │ EBR d 1700 110 .06 160 .09 │ │ EBR d 1700 110 .06 160 .09 │ │ │ │ │ │ WBL 1 1700 80 .05 150 .09 │ │ WBL 1 1700 80 .05 154 .09 │ │ WBT 3 5100 760 .15* 850 .17* │ │ WBT 3 5100 758 .15* 852 .17* │ │ WBR d 1700 120 .07 300 .18 │ │ WBR d 1700 120 .07 300 .18 │ │ │ │ │ │ Clearance Interval .05* .05* │ │ Clearance Interval .05* .05* │ └─────────────────────────────────────────────────────────┘ └─────────────────────────────────────────────────────────┘ TOTAL CAPACITY UTILIZATION .66 .72 TOTAL CAPACITY UTILIZATION .66 .72
B-16
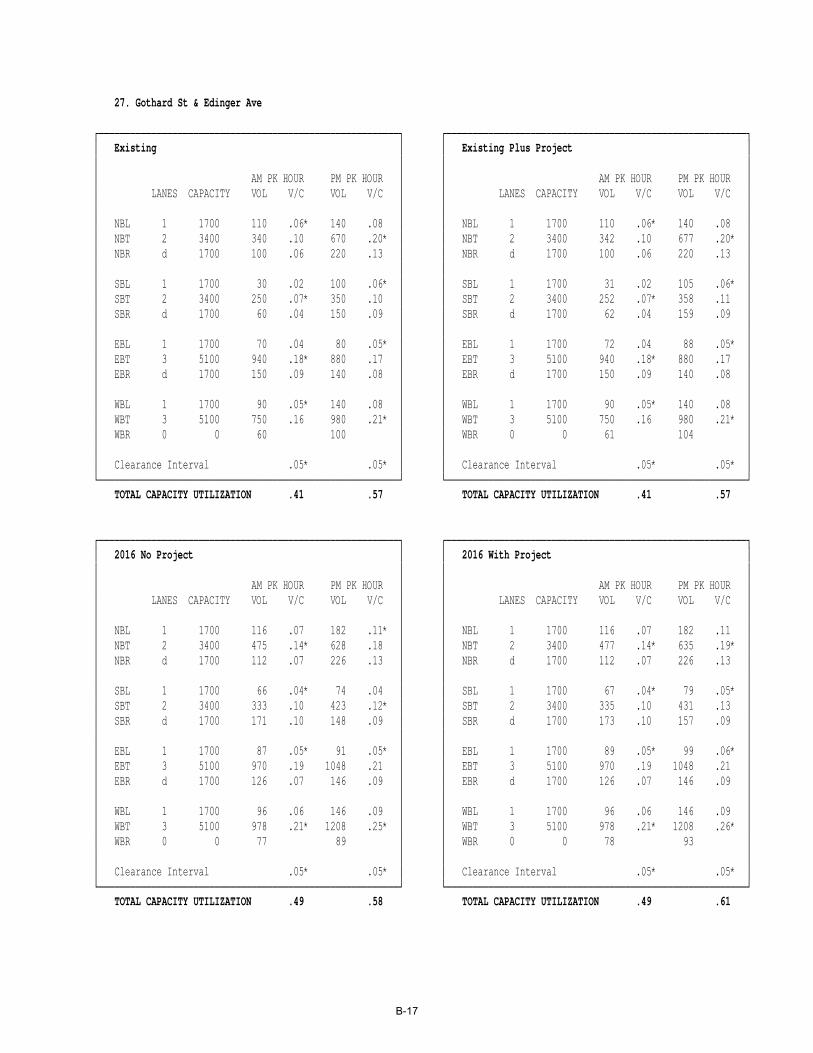
27. Gothard St & Edinger Ave ┌─────────────────────────────────────────────────────────┐ ┌─────────────────────────────────────────────────────────┐ │ Existing │ │ Existing Plus Project │ │ │ │ │ │ AM PK HOUR PM PK HOUR │ │ AM PK HOUR PM PK HOUR │ │ LANES CAPACITY VOL V/C VOL V/C │ │ LANES CAPACITY VOL V/C VOL V/C │ │ │ │ │ │ NBL 1 1700 110 .06* 140 .08 │ │ NBL 1 1700 110 .06* 140 .08 │ │ NBT 2 3400 340 .10 670 .20* │ │ NBT 2 3400 342 .10 677 .20* │ │ NBR d 1700 100 .06 220 .13 │ │ NBR d 1700 100 .06 220 .13 │ │ │ │ │ │ SBL 1 1700 30 .02 100 .06* │ │ SBL 1 1700 31 .02 105 .06* │ │ SBT 2 3400 250 .07* 350 .10 │ │ SBT 2 3400 252 .07* 358 .11 │ │ SBR d 1700 60 .04 150 .09 │ │ SBR d 1700 62 .04 159 .09 │ │ │ │ │ │ EBL 1 1700 70 .04 80 .05* │ │ EBL 1 1700 72 .04 88 .05* │ │ EBT 3 5100 940 .18* 880 .17 │ │ EBT 3 5100 940 .18* 880 .17 │ │ EBR d 1700 150 .09 140 .08 │ │ EBR d 1700 150 .09 140 .08 │ │ │ │ │ │ WBL 1 1700 90 .05* 140 .08 │ │ WBL 1 1700 90 .05* 140 .08 │ │ WBT 3 5100 750 .16 980 .21* │ │ WBT 3 5100 750 .16 980 .21* │ │ WBR 0 0 60 100 │ │ WBR 0 0 61 104 │ │ │ │ │ │ Clearance Interval .05* .05* │ │ Clearance Interval .05* .05* │ └─────────────────────────────────────────────────────────┘ └─────────────────────────────────────────────────────────┘ TOTAL CAPACITY UTILIZATION .41 .57 TOTAL CAPACITY UTILIZATION .41 .57 ┌─────────────────────────────────────────────────────────┐ ┌─────────────────────────────────────────────────────────┐ │ 2016 No Project │ │ 2016 With Project │ │ │ │ │ │ AM PK HOUR PM PK HOUR │ │ AM PK HOUR PM PK HOUR │ │ LANES CAPACITY VOL V/C VOL V/C │ │ LANES CAPACITY VOL V/C VOL V/C │ │ │ │ │ │ NBL 1 1700 116 .07 182 .11* │ │ NBL 1 1700 116 .07 182 .11 │ │ NBT 2 3400 475 .14* 628 .18 │ │ NBT 2 3400 477 .14* 635 .19* │ │ NBR d 1700 112 .07 226 .13 │ │ NBR d 1700 112 .07 226 .13 │ │ │ │ │ │ SBL 1 1700 66 .04* 74 .04 │ │ SBL 1 1700 67 .04* 79 .05* │ │ SBT 2 3400 333 .10 423 .12* │ │ SBT 2 3400 335 .10 431 .13 │ │ SBR d 1700 171 .10 148 .09 │ │ SBR d 1700 173 .10 157 .09 │ │ │ │ │ │ EBL 1 1700 87 .05* 91 .05* │ │ EBL 1 1700 89 .05* 99 .06* │ │ EBT 3 5100 970 .19 1048 .21 │ │ EBT 3 5100 970 .19 1048 .21 │ │ EBR d 1700 126 .07 146 .09 │ │ EBR d 1700 126 .07 146 .09 │ │ │ │ │ │ WBL 1 1700 96 .06 146 .09 │ │ WBL 1 1700 96 .06 146 .09 │ │ WBT 3 5100 978 .21* 1208 .25* │ │ WBT 3 5100 978 .21* 1208 .26* │ │ WBR 0 0 77 89 │ │ WBR 0 0 78 93 │ │ │ │ │ │ Clearance Interval .05* .05* │ │ Clearance Interval .05* .05* │ └─────────────────────────────────────────────────────────┘ └─────────────────────────────────────────────────────────┘ TOTAL CAPACITY UTILIZATION .49 .58 TOTAL CAPACITY UTILIZATION .49 .61
B-17

27. Gothard St & Edinger Ave ┌─────────────────────────────────────────────────────────┐ ┌─────────────────────────────────────────────────────────┐ │ 2030 General Plan │ │ 2030 with Proposed Project │ │ │ │ │ │ AM PK HOUR PM PK HOUR │ │ AM PK HOUR PM PK HOUR │ │ LANES CAPACITY VOL V/C VOL V/C │ │ LANES CAPACITY VOL V/C VOL V/C │ │ │ │ │ │ NBL 1 1700 120 .07 210 .12* │ │ NBL 1 1700 120 .07 210 .12* │ │ NBT 2 3400 570 .17* 610 .18 │ │ NBT 2 3400 567 .17* 607 .18 │ │ NBR d 1700 120 .07 230 .14 │ │ NBR d 1700 120 .07 230 .14 │ │ │ │ │ │ SBL 1 1700 90 .05* 60 .04 │ │ SBL 1 1700 91 .05* 62 .04 │ │ SBT 2 3400 400 .12 480 .14* │ │ SBT 2 3400 390 .11 479 .14* │ │ SBR d 1700 250 .15 150 .09 │ │ SBR d 1700 247 .15 156 .09 │ │ │ │ │ │ EBL 1 1700 100 .06* 100 .06* │ │ EBL 1 1700 101 .06* 106 .06* │ │ EBT 3 5100 990 .19 1160 .23 │ │ EBT 3 5100 990 .19 1160 .23 │ │ EBR d 1700 110 .06 150 .09 │ │ EBR d 1700 110 .06 150 .09 │ │ │ │ │ │ WBL 1 1700 100 .06 150 .09 │ │ WBL 1 1700 100 .06 150 .09 │ │ WBT 3 5100 1130 .24* 1360 .28* │ │ WBT 3 5100 1130 .24* 1360 .28* │ │ WBR 0 0 90 90 │ │ WBR 0 0 90 86 │ │ │ │ │ │ Clearance Interval .05* .05* │ │ Clearance Interval .05* .05* │ └─────────────────────────────────────────────────────────┘ └─────────────────────────────────────────────────────────┘ TOTAL CAPACITY UTILIZATION .57 .65 TOTAL CAPACITY UTILIZATION .57 .65
B-18
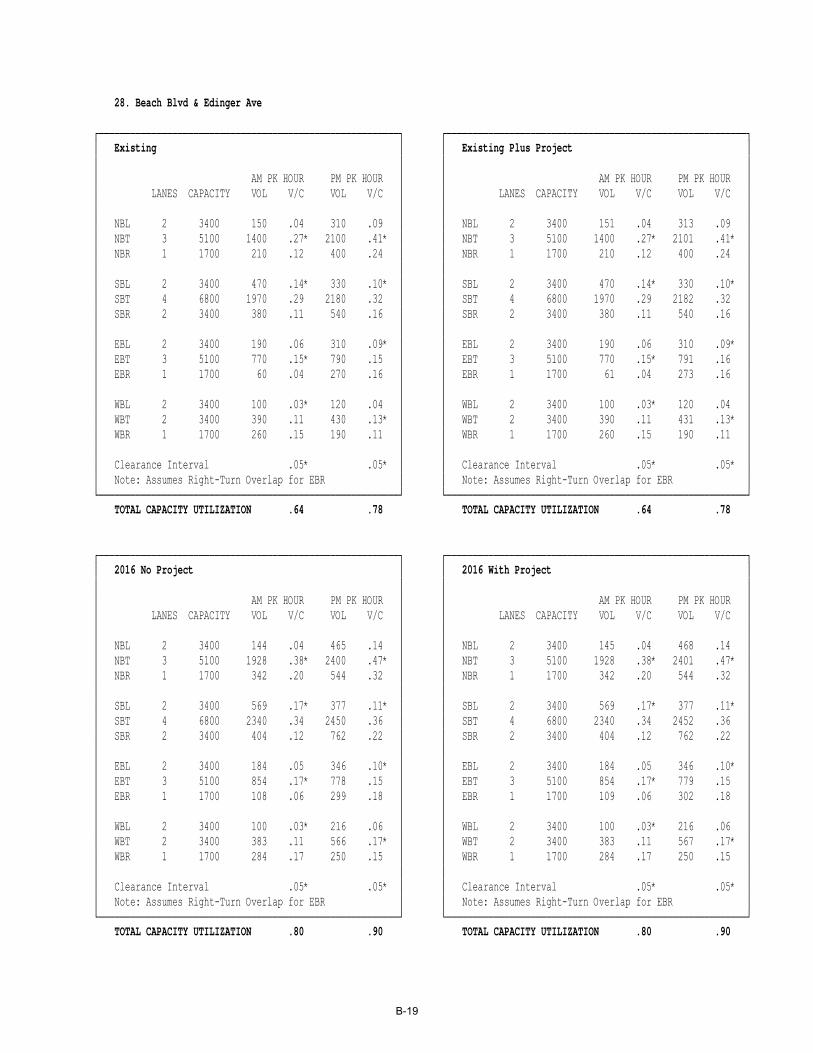
28. Beach Blvd & Edinger Ave ┌─────────────────────────────────────────────────────────┐ ┌─────────────────────────────────────────────────────────┐ │ Existing │ │ Existing Plus Project │ │ │ │ │ │ AM PK HOUR PM PK HOUR │ │ AM PK HOUR PM PK HOUR │ │ LANES CAPACITY VOL V/C VOL V/C │ │ LANES CAPACITY VOL V/C VOL V/C │ │ │ │ │ │ NBL 2 3400 150 .04 310 .09 │ │ NBL 2 3400 151 .04 313 .09 │ │ NBT 3 5100 1400 .27* 2100 .41* │ │ NBT 3 5100 1400 .27* 2101 .41* │ │ NBR 1 1700 210 .12 400 .24 │ │ NBR 1 1700 210 .12 400 .24 │ │ │ │ │ │ SBL 2 3400 470 .14* 330 .10* │ │ SBL 2 3400 470 .14* 330 .10* │ │ SBT 4 6800 1970 .29 2180 .32 │ │ SBT 4 6800 1970 .29 2182 .32 │ │ SBR 2 3400 380 .11 540 .16 │ │ SBR 2 3400 380 .11 540 .16 │ │ │ │ │ │ EBL 2 3400 190 .06 310 .09* │ │ EBL 2 3400 190 .06 310 .09* │ │ EBT 3 5100 770 .15* 790 .15 │ │ EBT 3 5100 770 .15* 791 .16 │ │ EBR 1 1700 60 .04 270 .16 │ │ EBR 1 1700 61 .04 273 .16 │ │ │ │ │ │ WBL 2 3400 100 .03* 120 .04 │ │ WBL 2 3400 100 .03* 120 .04 │ │ WBT 2 3400 390 .11 430 .13* │ │ WBT 2 3400 390 .11 431 .13* │ │ WBR 1 1700 260 .15 190 .11 │ │ WBR 1 1700 260 .15 190 .11 │ │ │ │ │ │ Clearance Interval .05* .05* │ │ Clearance Interval .05* .05* │ │ Note: Assumes Right-Turn Overlap for EBR │ │ Note: Assumes Right-Turn Overlap for EBR │ └─────────────────────────────────────────────────────────┘ └─────────────────────────────────────────────────────────┘ TOTAL CAPACITY UTILIZATION .64 .78 TOTAL CAPACITY UTILIZATION .64 .78 ┌─────────────────────────────────────────────────────────┐ ┌─────────────────────────────────────────────────────────┐ │ 2016 No Project │ │ 2016 With Project │ │ │ │ │ │ AM PK HOUR PM PK HOUR │ │ AM PK HOUR PM PK HOUR │ │ LANES CAPACITY VOL V/C VOL V/C │ │ LANES CAPACITY VOL V/C VOL V/C │ │ │ │ │ │ NBL 2 3400 144 .04 465 .14 │ │ NBL 2 3400 145 .04 468 .14 │ │ NBT 3 5100 1928 .38* 2400 .47* │ │ NBT 3 5100 1928 .38* 2401 .47* │ │ NBR 1 1700 342 .20 544 .32 │ │ NBR 1 1700 342 .20 544 .32 │ │ │ │ │ │ SBL 2 3400 569 .17* 377 .11* │ │ SBL 2 3400 569 .17* 377 .11* │ │ SBT 4 6800 2340 .34 2450 .36 │ │ SBT 4 6800 2340 .34 2452 .36 │ │ SBR 2 3400 404 .12 762 .22 │ │ SBR 2 3400 404 .12 762 .22 │ │ │ │ │ │ EBL 2 3400 184 .05 346 .10* │ │ EBL 2 3400 184 .05 346 .10* │ │ EBT 3 5100 854 .17* 778 .15 │ │ EBT 3 5100 854 .17* 779 .15 │ │ EBR 1 1700 108 .06 299 .18 │ │ EBR 1 1700 109 .06 302 .18 │ │ │ │ │ │ WBL 2 3400 100 .03* 216 .06 │ │ WBL 2 3400 100 .03* 216 .06 │ │ WBT 2 3400 383 .11 566 .17* │ │ WBT 2 3400 383 .11 567 .17* │ │ WBR 1 1700 284 .17 250 .15 │ │ WBR 1 1700 284 .17 250 .15 │ │ │ │ │ │ Clearance Interval .05* .05* │ │ Clearance Interval .05* .05* │ │ Note: Assumes Right-Turn Overlap for EBR │ │ Note: Assumes Right-Turn Overlap for EBR │ └─────────────────────────────────────────────────────────┘ └─────────────────────────────────────────────────────────┘ TOTAL CAPACITY UTILIZATION .80 .90 TOTAL CAPACITY UTILIZATION .80 .90
B-19

28. Beach Blvd & Edinger Ave ┌─────────────────────────────────────────────────────────┐ ┌─────────────────────────────────────────────────────────┐ │ 2030 General Plan │ │ 2030 with Proposed Project │ │ │ │ │ │ AM PK HOUR PM PK HOUR │ │ AM PK HOUR PM PK HOUR │ │ LANES CAPACITY VOL V/C VOL V/C │ │ LANES CAPACITY VOL V/C VOL V/C │ │ │ │ │ │ NBL 2 3400 140 .04 570 .17 │ │ NBL 2 3400 141 .04 571 .17 │ │ NBT 3 5100 2280 .45* 2600 .51* │ │ NBT 3 5100 2280 .45* 2601 .51* │ │ NBR 1 1700 430 .25 640 .38 │ │ NBR 1 1700 430 .25 640 .38 │ │ │ │ │ │ SBL 2 3400 640 .19* 410 .12* │ │ SBL 2 3400 635 .19* 409 .12* │ │ SBT 4 6800 2590 .38 2630 .39 │ │ SBT 4 6800 2587 .38 2632 .39 │ │ SBR 2 3400 420 .12 910 .27 │ │ SBR 2 3400 420 .12 910 .27 │ │ │ │ │ │ EBL 2 3400 180 .05 370 .11* │ │ EBL 2 3400 180 .05 370 .11* │ │ EBT 3 5100 910 .18* 770 .15 │ │ EBT 3 5100 910 .18* 771 .15 │ │ EBR 1 1700 140 .08 320 .19 │ │ EBR 1 1700 141 .08 321 .19 │ │ │ │ │ │ WBL 2 3400 100 .03* 280 .08 │ │ WBL 2 3400 100 .03* 280 .08 │ │ WBT 2 3400 380 .11 660 .19* │ │ WBT 2 3400 379 .11 657 .19* │ │ WBR 1 1700 300 .18 290 .17 │ │ WBR 1 1700 300 .18 290 .17 │ │ │ │ │ │ Clearance Interval .05* .05* │ │ Clearance Interval .05* .05* │ │ Note: Assumes Right-Turn Overlap for EBR │ │ Note: Assumes Right-Turn Overlap for EBR │ └─────────────────────────────────────────────────────────┘ └─────────────────────────────────────────────────────────┘ TOTAL CAPACITY UTILIZATION .90 .98 TOTAL CAPACITY UTILIZATION .90 .98
B-20
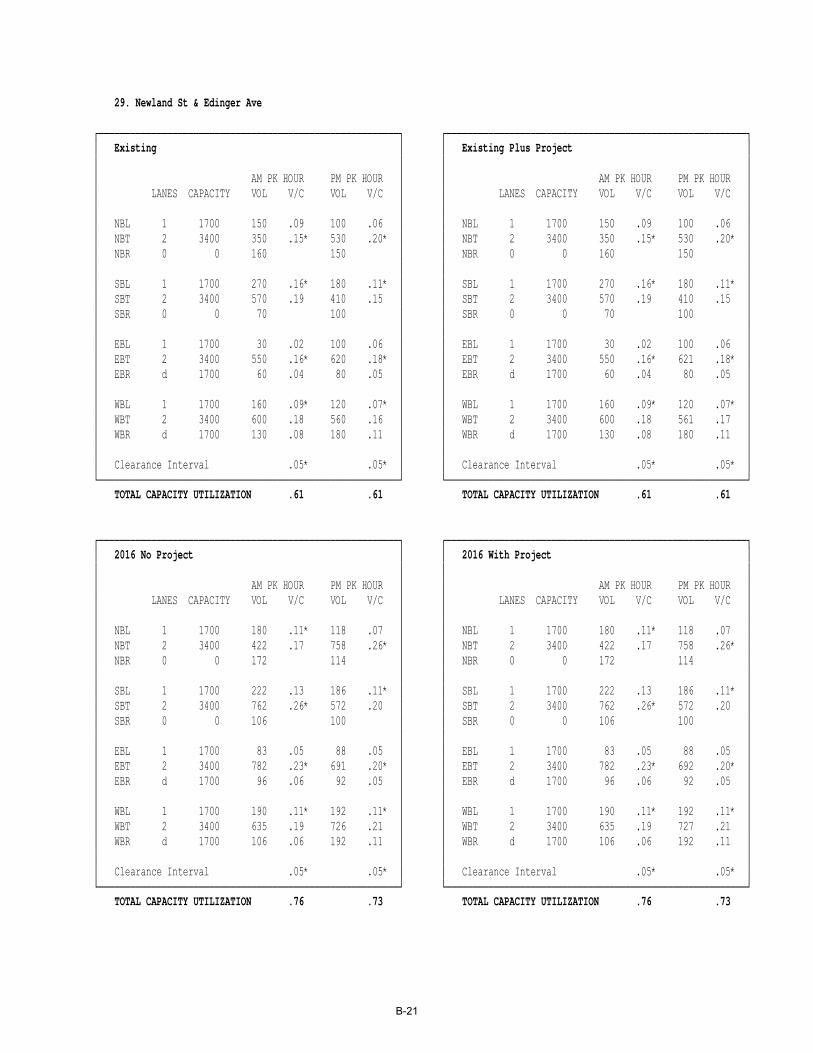
29. Newland St & Edinger Ave ┌─────────────────────────────────────────────────────────┐ ┌─────────────────────────────────────────────────────────┐ │ Existing │ │ Existing Plus Project │ │ │ │ │ │ AM PK HOUR PM PK HOUR │ │ AM PK HOUR PM PK HOUR │ │ LANES CAPACITY VOL V/C VOL V/C │ │ LANES CAPACITY VOL V/C VOL V/C │ │ │ │ │ │ NBL 1 1700 150 .09 100 .06 │ │ NBL 1 1700 150 .09 100 .06 │ │ NBT 2 3400 350 .15* 530 .20* │ │ NBT 2 3400 350 .15* 530 .20* │ │ NBR 0 0 160 150 │ │ NBR 0 0 160 150 │ │ │ │ │ │ SBL 1 1700 270 .16* 180 .11* │ │ SBL 1 1700 270 .16* 180 .11* │ │ SBT 2 3400 570 .19 410 .15 │ │ SBT 2 3400 570 .19 410 .15 │ │ SBR 0 0 70 100 │ │ SBR 0 0 70 100 │ │ │ │ │ │ EBL 1 1700 30 .02 100 .06 │ │ EBL 1 1700 30 .02 100 .06 │ │ EBT 2 3400 550 .16* 620 .18* │ │ EBT 2 3400 550 .16* 621 .18* │ │ EBR d 1700 60 .04 80 .05 │ │ EBR d 1700 60 .04 80 .05 │ │ │ │ │ │ WBL 1 1700 160 .09* 120 .07* │ │ WBL 1 1700 160 .09* 120 .07* │ │ WBT 2 3400 600 .18 560 .16 │ │ WBT 2 3400 600 .18 561 .17 │ │ WBR d 1700 130 .08 180 .11 │ │ WBR d 1700 130 .08 180 .11 │ │ │ │ │ │ Clearance Interval .05* .05* │ │ Clearance Interval .05* .05* │ └─────────────────────────────────────────────────────────┘ └─────────────────────────────────────────────────────────┘ TOTAL CAPACITY UTILIZATION .61 .61 TOTAL CAPACITY UTILIZATION .61 .61 ┌─────────────────────────────────────────────────────────┐ ┌─────────────────────────────────────────────────────────┐ │ 2016 No Project │ │ 2016 With Project │ │ │ │ │ │ AM PK HOUR PM PK HOUR │ │ AM PK HOUR PM PK HOUR │ │ LANES CAPACITY VOL V/C VOL V/C │ │ LANES CAPACITY VOL V/C VOL V/C │ │ │ │ │ │ NBL 1 1700 180 .11* 118 .07 │ │ NBL 1 1700 180 .11* 118 .07 │ │ NBT 2 3400 422 .17 758 .26* │ │ NBT 2 3400 422 .17 758 .26* │ │ NBR 0 0 172 114 │ │ NBR 0 0 172 114 │ │ │ │ │ │ SBL 1 1700 222 .13 186 .11* │ │ SBL 1 1700 222 .13 186 .11* │ │ SBT 2 3400 762 .26* 572 .20 │ │ SBT 2 3400 762 .26* 572 .20 │ │ SBR 0 0 106 100 │ │ SBR 0 0 106 100 │ │ │ │ │ │ EBL 1 1700 83 .05 88 .05 │ │ EBL 1 1700 83 .05 88 .05 │ │ EBT 2 3400 782 .23* 691 .20* │ │ EBT 2 3400 782 .23* 692 .20* │ │ EBR d 1700 96 .06 92 .05 │ │ EBR d 1700 96 .06 92 .05 │ │ │ │ │ │ WBL 1 1700 190 .11* 192 .11* │ │ WBL 1 1700 190 .11* 192 .11* │ │ WBT 2 3400 635 .19 726 .21 │ │ WBT 2 3400 635 .19 727 .21 │ │ WBR d 1700 106 .06 192 .11 │ │ WBR d 1700 106 .06 192 .11 │ │ │ │ │ │ Clearance Interval .05* .05* │ │ Clearance Interval .05* .05* │ └─────────────────────────────────────────────────────────┘ └─────────────────────────────────────────────────────────┘ TOTAL CAPACITY UTILIZATION .76 .73 TOTAL CAPACITY UTILIZATION .76 .73
B-21

29. Newland St & Edinger Ave ┌─────────────────────────────────────────────────────────┐ ┌─────────────────────────────────────────────────────────┐ │ 2030 General Plan │ │ 2030 with Proposed Project │ │ │ │ │ │ AM PK HOUR PM PK HOUR │ │ AM PK HOUR PM PK HOUR │ │ LANES CAPACITY VOL V/C VOL V/C │ │ LANES CAPACITY VOL V/C VOL V/C │ │ │ │ │ │ NBL 1 1700 200 .12* 130 .08 │ │ NBL 1 1700 200 .12* 130 .08 │ │ NBT 2 3400 470 .19 910 .29* │ │ NBT 2 3400 470 .19 910 .29* │ │ NBR 0 0 180 90 │ │ NBR 0 0 180 90 │ │ │ │ │ │ SBL 1 1700 190 .11 190 .11* │ │ SBL 1 1700 190 .11 190 .11* │ │ SBT 2 3400 890 .30* 680 .23 │ │ SBT 2 3400 890 .30* 680 .23 │ │ SBR 0 0 130 100 │ │ SBR 0 0 130 100 │ │ │ │ │ │ EBL 1 1700 120 .07 80 .05 │ │ EBL 1 1700 119 .07 80 .05 │ │ EBT 2 3400 940 .28* 740 .22* │ │ EBT 2 3400 936 .28* 740 .22* │ │ EBR d 1700 120 .07 100 .06 │ │ EBR d 1700 120 .07 100 .06 │ │ │ │ │ │ WBL 1 1700 210 .12* 240 .14* │ │ WBL 1 1700 210 .12* 240 .14* │ │ WBT 2 3400 660 .19 840 .25 │ │ WBT 2 3400 659 .19 837 .25 │ │ WBR d 1700 90 .05 200 .12 │ │ WBR d 1700 90 .05 200 .12 │ │ │ │ │ │ Clearance Interval .05* .05* │ │ Clearance Interval .05* .05* │ └─────────────────────────────────────────────────────────┘ └─────────────────────────────────────────────────────────┘ TOTAL CAPACITY UTILIZATION .87 .81 TOTAL CAPACITY UTILIZATION .87 .81
B-22

203. Beach Blvd & McFadden Ave ┌─────────────────────────────────────────────────────────┐ ┌─────────────────────────────────────────────────────────┐ │ Existing │ │ Existing Plus Project │ │ │ │ │ │ AM PK HOUR PM PK HOUR │ │ AM PK HOUR PM PK HOUR │ │ LANES CAPACITY VOL V/C VOL V/C │ │ LANES CAPACITY VOL V/C VOL V/C │ │ │ │ │ │ NBL 2 3400 190 .06* 270 .08 │ │ NBL 2 3400 190 .06* 270 .08 │ │ NBT 4 6800 1910 .30 2330 .38* │ │ NBT 4 6800 1910 .30 2332 .38* │ │ NBR 0 0 120 270 │ │ NBR 0 0 120 270 │ │ │ │ │ │ SBL 2 3400 200 .06 240 .07* │ │ SBL 2 3400 200 .06 240 .07* │ │ SBT 4 6800 2360 .39* 2090 .34 │ │ SBT 4 6800 2360 .39* 2091 .34 │ │ SBR 0 0 270 240 │ │ SBR 0 0 270 241 │ │ │ │ │ │ EBL 2 3400 270 .08* 360 .11* │ │ EBL 2 3400 270 .08* 361 .11* │ │ EBT 2 3400 370 .15 460 .18 │ │ EBT 2 3400 370 .15 460 .18 │ │ EBR 0 0 130 140 │ │ EBR 0 0 130 140 │ │ │ │ │ │ WBL 2 3400 350 .10 390 .11 │ │ WBL 2 3400 350 .10 390 .11 │ │ WBT 2 3400 520 .20* 490 .20* │ │ WBT 2 3400 520 .20* 490 .20* │ │ WBR 0 0 170 180 │ │ WBR 0 0 170 180 │ │ │ │ │ │ Clearance Interval .05* .05* │ │ Clearance Interval .05* .05* │ └─────────────────────────────────────────────────────────┘ └─────────────────────────────────────────────────────────┘ TOTAL CAPACITY UTILIZATION .78 .81 TOTAL CAPACITY UTILIZATION .78 .81 ┌─────────────────────────────────────────────────────────┐ ┌─────────────────────────────────────────────────────────┐ │ 2016 No Project │ │ 2016 With Project │ │ │ │ │ │ AM PK HOUR PM PK HOUR │ │ AM PK HOUR PM PK HOUR │ │ LANES CAPACITY VOL V/C VOL V/C │ │ LANES CAPACITY VOL V/C VOL V/C │ │ │ │ │ │ NBL 2 3400 184 .05* 264 .08 │ │ NBL 2 3400 184 .05* 264 .08 │ │ NBT 4 6800 2198 .35 2540 .41* │ │ NBT 4 6800 2198 .35 2542 .41* │ │ NBR 0 0 180 276 │ │ NBR 0 0 180 276 │ │ │ │ │ │ SBL 2 3400 212 .06 240 .07* │ │ SBL 2 3400 212 .06 240 .07* │ │ SBT 4 6800 2546 .42* 2384 .39 │ │ SBT 4 6800 2546 .42* 2385 .39 │ │ SBR 0 0 279 258 │ │ SBR 0 0 279 259 │ │ │ │ │ │ EBL 2 3400 261 .08 350 .10 │ │ EBL 2 3400 261 .08 351 .10 │ │ EBT 2 3400 428 .17* 501 .19* │ │ EBT 2 3400 428 .17* 501 .19* │ │ EBR 0 0 136 146 │ │ EBR 0 0 136 146 │ │ │ │ │ │ WBL 2 3400 416 .12* 474 .14* │ │ WBL 2 3400 416 .12* 474 .14* │ │ WBT 2 3400 495 .20 540 .21 │ │ WBT 2 3400 495 .20 540 .21 │ │ WBR 0 0 176 186 │ │ WBR 0 0 176 186 │ │ │ │ │ │ Clearance Interval .05* .05* │ │ Clearance Interval .05* .05* │ └─────────────────────────────────────────────────────────┘ └─────────────────────────────────────────────────────────┘ TOTAL CAPACITY UTILIZATION .81 .86 TOTAL CAPACITY UTILIZATION .81 .86
B-23

203. Beach Blvd & McFadden Ave ┌─────────────────────────────────────────────────────────┐ ┌─────────────────────────────────────────────────────────┐ │ 2030 General Plan │ │ 2030 with Proposed Project │ │ │ │ │ │ AM PK HOUR PM PK HOUR │ │ AM PK HOUR PM PK HOUR │ │ LANES CAPACITY VOL V/C VOL V/C │ │ LANES CAPACITY VOL V/C VOL V/C │ │ │ │ │ │ NBL 2 3400 180 .05* 260 .08 │ │ NBL 2 3400 180 .05* 260 .08 │ │ NBT 4 6800 2390 .38 2680 .44* │ │ NBT 4 6800 2390 .38 2682 .44* │ │ NBR 0 0 220 280 │ │ NBR 0 0 220 280 │ │ │ │ │ │ SBL 2 3400 220 .06 240 .07* │ │ SBL 2 3400 220 .06 240 .07* │ │ SBT 4 6800 2670 .44* 2580 .42 │ │ SBT 4 6800 2670 .43* 2581 .42 │ │ SBR 0 0 290 290 │ │ SBR 0 0 285 271 │ │ │ │ │ │ EBL 2 3400 270 .08 350 .10 │ │ EBL 2 3400 255 .08 345 .10 │ │ EBT 2 3400 470 .18* 530 .20* │ │ EBT 2 3400 466 .18* 528 .20* │ │ EBR 0 0 140 150 │ │ EBR 0 0 140 150 │ │ │ │ │ │ WBL 2 3400 460 .14* 530 .16* │ │ WBL 2 3400 460 .14* 530 .16* │ │ WBT 2 3400 480 .19 580 .23 │ │ WBT 2 3400 479 .19 573 .22 │ │ WBR 0 0 180 190 │ │ WBR 0 0 180 190 │ │ │ │ │ │ Clearance Interval .05* .05* │ │ Clearance Interval .05* .05* │ └─────────────────────────────────────────────────────────┘ └─────────────────────────────────────────────────────────┘ TOTAL CAPACITY UTILIZATION .86 .92 TOTAL CAPACITY UTILIZATION .85 .92
B-24
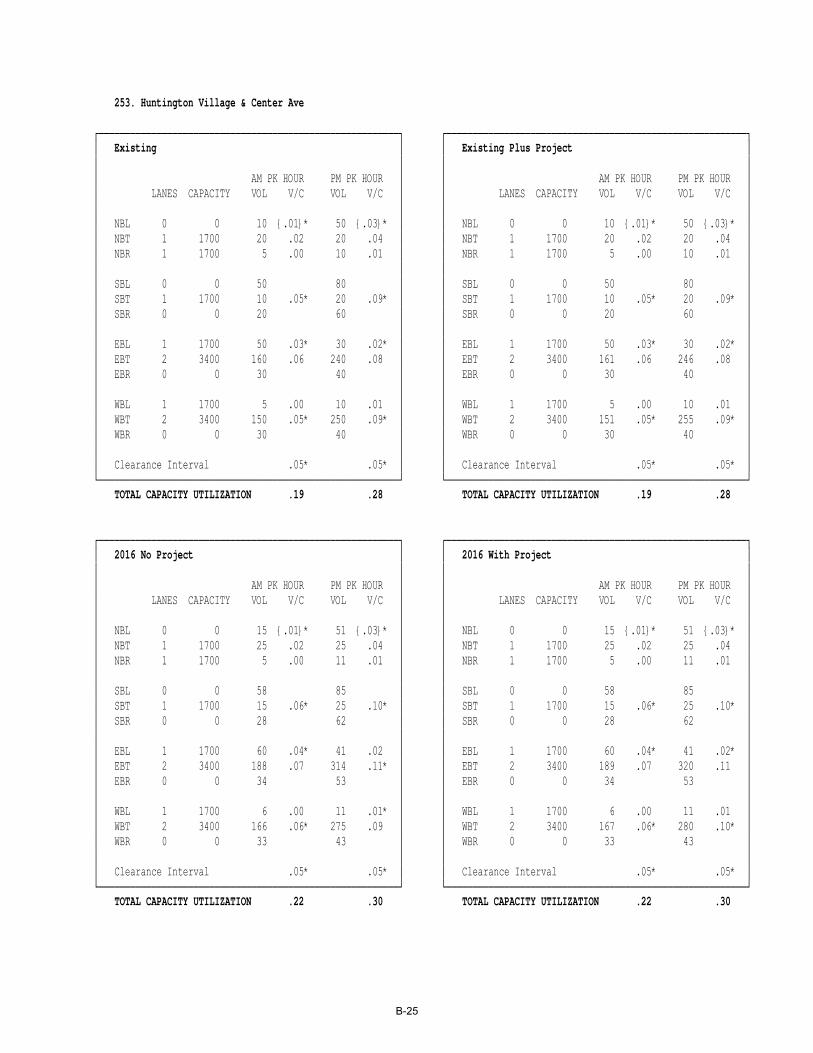
253. Huntington Village & Center Ave ┌─────────────────────────────────────────────────────────┐ ┌─────────────────────────────────────────────────────────┐ │ Existing │ │ Existing Plus Project │ │ │ │ │ │ AM PK HOUR PM PK HOUR │ │ AM PK HOUR PM PK HOUR │ │ LANES CAPACITY VOL V/C VOL V/C │ │ LANES CAPACITY VOL V/C VOL V/C │ │ │ │ │ │ NBL 0 0 10 {.01}* 50 {.03}* │ │ NBL 0 0 10 {.01}* 50 {.03}* │ │ NBT 1 1700 20 .02 20 .04 │ │ NBT 1 1700 20 .02 20 .04 │ │ NBR 1 1700 5 .00 10 .01 │ │ NBR 1 1700 5 .00 10 .01 │ │ │ │ │ │ SBL 0 0 50 80 │ │ SBL 0 0 50 80 │ │ SBT 1 1700 10 .05* 20 .09* │ │ SBT 1 1700 10 .05* 20 .09* │ │ SBR 0 0 20 60 │ │ SBR 0 0 20 60 │ │ │ │ │ │ EBL 1 1700 50 .03* 30 .02* │ │ EBL 1 1700 50 .03* 30 .02* │ │ EBT 2 3400 160 .06 240 .08 │ │ EBT 2 3400 161 .06 246 .08 │ │ EBR 0 0 30 40 │ │ EBR 0 0 30 40 │ │ │ │ │ │ WBL 1 1700 5 .00 10 .01 │ │ WBL 1 1700 5 .00 10 .01 │ │ WBT 2 3400 150 .05* 250 .09* │ │ WBT 2 3400 151 .05* 255 .09* │ │ WBR 0 0 30 40 │ │ WBR 0 0 30 40 │ │ │ │ │ │ Clearance Interval .05* .05* │ │ Clearance Interval .05* .05* │ └─────────────────────────────────────────────────────────┘ └─────────────────────────────────────────────────────────┘ TOTAL CAPACITY UTILIZATION .19 .28 TOTAL CAPACITY UTILIZATION .19 .28 ┌─────────────────────────────────────────────────────────┐ ┌─────────────────────────────────────────────────────────┐ │ 2016 No Project │ │ 2016 With Project │ │ │ │ │ │ AM PK HOUR PM PK HOUR │ │ AM PK HOUR PM PK HOUR │ │ LANES CAPACITY VOL V/C VOL V/C │ │ LANES CAPACITY VOL V/C VOL V/C │ │ │ │ │ │ NBL 0 0 15 {.01}* 51 {.03}* │ │ NBL 0 0 15 {.01}* 51 {.03}* │ │ NBT 1 1700 25 .02 25 .04 │ │ NBT 1 1700 25 .02 25 .04 │ │ NBR 1 1700 5 .00 11 .01 │ │ NBR 1 1700 5 .00 11 .01 │ │ │ │ │ │ SBL 0 0 58 85 │ │ SBL 0 0 58 85 │ │ SBT 1 1700 15 .06* 25 .10* │ │ SBT 1 1700 15 .06* 25 .10* │ │ SBR 0 0 28 62 │ │ SBR 0 0 28 62 │ │ │ │ │ │ EBL 1 1700 60 .04* 41 .02 │ │ EBL 1 1700 60 .04* 41 .02* │ │ EBT 2 3400 188 .07 314 .11* │ │ EBT 2 3400 189 .07 320 .11 │ │ EBR 0 0 34 53 │ │ EBR 0 0 34 53 │ │ │ │ │ │ WBL 1 1700 6 .00 11 .01* │ │ WBL 1 1700 6 .00 11 .01 │ │ WBT 2 3400 166 .06* 275 .09 │ │ WBT 2 3400 167 .06* 280 .10* │ │ WBR 0 0 33 43 │ │ WBR 0 0 33 43 │ │ │ │ │ │ Clearance Interval .05* .05* │ │ Clearance Interval .05* .05* │ └─────────────────────────────────────────────────────────┘ └─────────────────────────────────────────────────────────┘ TOTAL CAPACITY UTILIZATION .22 .30 TOTAL CAPACITY UTILIZATION .22 .30
B-25

253. Huntington Village & Center Ave ┌─────────────────────────────────────────────────────────┐ ┌─────────────────────────────────────────────────────────┐ │ 2030 General Plan │ │ 2030 with Proposed Project │ │ │ │ │ │ AM PK HOUR PM PK HOUR │ │ AM PK HOUR PM PK HOUR │ │ LANES CAPACITY VOL V/C VOL V/C │ │ LANES CAPACITY VOL V/C VOL V/C │ │ │ │ │ │ NBL 0 0 18 {.01}* 52 {.03}* │ │ NBL 0 0 18 {.01}* 52 {.03}* │ │ NBT 1 1700 30 .03 27 .05 │ │ NBT 1 1700 30 .03 27 .05 │ │ NBR 1 1700 7 .00 12 .01 │ │ NBR 1 1700 6 .00 12 .01 │ │ │ │ │ │ SBL 0 0 81 91 │ │ SBL 0 0 72 89 │ │ SBT 1 1700 20 .08* 28 .11* │ │ SBT 1 1700 20 .07* 28 .11* │ │ SBR 0 0 34 63 │ │ SBR 0 0 33 63 │ │ │ │ │ │ EBL 1 1700 66 .04* 48 .03 │ │ EBL 1 1700 66 .04* 47 .03 │ │ EBT 2 3400 208 .07 367 .13* │ │ EBT 2 3400 209 .07 371 .13* │ │ EBR 0 0 38 62 │ │ EBR 0 0 38 62 │ │ │ │ │ │ WBL 1 1700 7 .00 12 .01* │ │ WBL 1 1700 7 .00 12 .01* │ │ WBT 2 3400 178 .06* 305 .10 │ │ WBT 2 3400 178 .06* 297 .10 │ │ WBR 0 0 35 48 │ │ WBR 0 0 35 46 │ │ │ │ │ │ Clearance Interval .05* .05* │ │ Clearance Interval .05* .05* │ └─────────────────────────────────────────────────────────┘ └─────────────────────────────────────────────────────────┘ TOTAL CAPACITY UTILIZATION .24 .33 TOTAL CAPACITY UTILIZATION .23 .33
B-26

15. Goldenwest St & Mcfadden Ave ┌─────────────────────────────────────────────────────────┐ ┌─────────────────────────────────────────────────────────┐ │ 2030 No Project (Weekend) │ │ 2030 with Special Events (Weekend) │ │ │ │ │ │ PM PK HOUR │ │ PM PK HOUR │ │ LANES CAPACITY VOL V/C VOL V/C │ │ LANES CAPACITY VOL V/C VOL V/C │ │ │ │ │ │ NBL 1 1700 0 .00 100 .06 │ │ NBL 1 1700 0 .00 105 .06 │ │ NBT 3 5100 0 .00 1730 .34* │ │ NBT 3 5100 0 .00 1732 .34* │ │ NBR d 1700 0 .00 240 .14 │ │ NBR d 1700 0 .00 240 .14 │ │ │ │ │ │ SBL 1 1700 0 .00 280 .16* │ │ SBL 1 1700 0 .00 281 .17* │ │ SBT 3 5100 0 .00* 1540 .32 │ │ SBT 3 5100 0 .00* 1543 .32 │ │ SBR 0 0 0 80 │ │ SBR 0 0 0 80 │ │ │ │ │ │ EBL 1 1700 0 .00 160 .09 │ │ EBL 1 1700 0 .00 160 .09 │ │ EBT 2 3400 0 .00 490 .14* │ │ EBT 2 3400 0 .00 491 .14* │ │ EBR d 1700 0 .00 90 .05 │ │ EBR d 1700 0 .00 92 .05 │ │ │ │ │ │ WBL 1 1700 0 .00 180 .11* │ │ WBL 1 1700 0 .00 180 .11* │ │ WBT 2 3400 0 .00* 300 .09 │ │ WBT 2 3400 0 .00* 301 .09 │ │ WBR d 1700 0 .00 200 .12 │ │ WBR d 1700 0 .00 201 .12 │ │ │ │ │ │ Clearance Interval .00* .05* │ │ Clearance Interval .00* .05* │ └─────────────────────────────────────────────────────────┘ └─────────────────────────────────────────────────────────┘ TOTAL CAPACITY UTILIZATION .00 .80 TOTAL CAPACITY UTILIZATION .00 .81 17. Gothard St & Center Ave ┌─────────────────────────────────────────────────────────┐ ┌─────────────────────────────────────────────────────────┐ │ 2030 No Project (Weekend) │ │ 2030 with Special Events (Weekend) │ │ │ │ │ │ PM PK HOUR │ │ PM PK HOUR │ │ LANES CAPACITY VOL V/C VOL V/C │ │ LANES CAPACITY VOL V/C VOL V/C │ │ │ │ │ │ NBL 1 1700 0 .00 10 .01 │ │ NBL 1 1700 0 .00 12 .01 │ │ NBT 2 3400 0 .00 410 .12* │ │ NBT 2 3400 0 .00 410 .12* │ │ NBR d 1700 0 .00 130 .08 │ │ NBR d 1700 0 .00 130 .08 │ │ │ │ │ │ SBL 1 1700 0 .00 370 .22* │ │ SBL 1 1700 0 .00 370 .22* │ │ SBT 2 3400 0 .00* 250 .07 │ │ SBT 2 3400 0 .00* 250 .07 │ │ SBR d 1700 0 .00 40 .02 │ │ SBR d 1700 0 .00 40 .02 │ │ │ │ │ │ EBL 1 1700 0 .00 220 .13* │ │ EBL 1 1700 0 .00 220 .13* │ │ EBT 1 1700 0 .00 20 .02 │ │ EBT 1 1700 0 .00 20 .02 │ │ EBR 0 0 0 20 │ │ EBR 0 0 0 22 │ │ │ │ │ │ WBL 1 1700 0 .00 200 .12 │ │ WBL 1 1700 0 .00 200 .12 │ │ WBT 2 3400 0 .00* 30 .02* │ │ WBT 2 3400 0 .00* 30 .02* │ │ WBR 0 0 0 100 .06 │ │ WBR 0 0 0 100 .06 │ │ │ │ │ │ Clearance Interval .00* .05* │ │ Clearance Interval .00* .05* │ └─────────────────────────────────────────────────────────┘ └─────────────────────────────────────────────────────────┘ TOTAL CAPACITY UTILIZATION .00 .54 TOTAL CAPACITY UTILIZATION .00 .54
B-27

26. Goldenwest St & Edinger Ave ┌─────────────────────────────────────────────────────────┐ ┌─────────────────────────────────────────────────────────┐ │ 2030 No Project (Weekend) │ │ 2030 with Special Events (Weekend) │ │ │ │ │ │ PM PK HOUR │ │ PM PK HOUR │ │ LANES CAPACITY VOL V/C VOL V/C │ │ LANES CAPACITY VOL V/C VOL V/C │ │ │ │ │ │ NBL 1 1700 0 .00 130 .08 │ │ NBL 1 1700 0 .00 136 .08 │ │ NBT 3 5100 0 .00 1060 .21* │ │ NBT 3 5100 0 .00 1067 .21* │ │ NBR d 1700 0 .00 210 .12 │ │ NBR d 1700 0 .00 210 .12 │ │ │ │ │ │ SBL 1 1700 0 .00 350 .21* │ │ SBL 1 1700 0 .00 350 .21* │ │ SBT 3 5100 0 .00* 1290 .25 │ │ SBT 3 5100 0 .00* 1295 .25 │ │ SBR d 1700 0 .00 180 .11 │ │ SBR d 1700 0 .00 180 .11 │ │ │ │ │ │ EBL 1 1700 0 .00 330 .19* │ │ EBL 1 1700 0 .00 330 .19* │ │ EBT 3 5100 0 .00 1060 .21 │ │ EBT 3 5100 0 .00 1060 .21 │ │ EBR d 1700 0 .00 100 .06 │ │ EBR d 1700 0 .00 111 .07 │ │ │ │ │ │ WBL 1 1700 0 .00 170 .10 │ │ WBL 1 1700 0 .00 170 .10 │ │ WBT 3 5100 0 .00* 750 .15* │ │ WBT 3 5100 0 .00* 754 .15* │ │ WBR d 1700 0 .00 470 .28 │ │ WBR d 1700 0 .00 470 .28 │ │ │ │ │ │ Right Turn Adjustment WBR .02* │ │ Right Turn Adjustment WBR .02* │ │ Clearance Interval .00* .05* │ │ Clearance Interval .00* .05* │ └─────────────────────────────────────────────────────────┘ └─────────────────────────────────────────────────────────┘ TOTAL CAPACITY UTILIZATION .00 .83 TOTAL CAPACITY UTILIZATION .00 .83 27. Gothard St & Edinger Ave ┌─────────────────────────────────────────────────────────┐ ┌─────────────────────────────────────────────────────────┐ │ 2030 No Project (Weekend) │ │ 2030 with Special Events (Weekend) │ │ │ │ │ │ PM PK HOUR │ │ PM PK HOUR │ │ LANES CAPACITY VOL V/C VOL V/C │ │ LANES CAPACITY VOL V/C VOL V/C │ │ │ │ │ │ NBL 1 1700 0 .00 180 .11* │ │ NBL 1 1700 0 .00 184 .11* │ │ NBT 2 3400 0 .00 320 .09 │ │ NBT 2 3400 0 .00 320 .09 │ │ NBR d 1700 0 .00 260 .15 │ │ NBR d 1700 0 .00 260 .15 │ │ │ │ │ │ SBL 1 1700 0 .00 90 .05 │ │ SBL 1 1700 0 .00 90 .05 │ │ SBT 2 3400 0 .00* 460 .14* │ │ SBT 2 3400 0 .00* 484 .14* │ │ SBR d 1700 0 .00 130 .08 │ │ SBR d 1700 0 .00 130 .08 │ │ │ │ │ │ EBL 1 1700 0 .00 120 .07 │ │ EBL 1 1700 0 .00 120 .07 │ │ EBT 3 5100 0 .00 1520 .30* │ │ EBT 3 5100 0 .00 1520 .30* │ │ EBR d 1700 0 .00 150 .09 │ │ EBR d 1700 0 .00 150 .09 │ │ │ │ │ │ WBL 1 1700 0 .00 170 .10* │ │ WBL 1 1700 0 .00 172 .10* │ │ WBT 3 5100 0 .00* 1490 .32 │ │ WBT 3 5100 0 .00* 1490 .32 │ │ WBR 0 0 0 130 │ │ WBR 0 0 0 130 │ │ │ │ │ │ Clearance Interval .00* .05* │ │ Clearance Interval .00* .05* │ └─────────────────────────────────────────────────────────┘ └─────────────────────────────────────────────────────────┘ TOTAL CAPACITY UTILIZATION .00 .70 TOTAL CAPACITY UTILIZATION .00 .70
B-28

City of Huntington Beach C-1 Austin-Foust Associates, Inc. Center Avenue Skate Park 503008rpt.doc
Appendix C HCM WORKSHEETS

Existing No Project18: Center & I-405 SB Ramps AM Peak Hour
HCM Signalized Intersection Capacity Analysis Synchro 7 - ReportHuntington Beach, Center Ave Skate Park (503.008)
Movement SEL SET NWT NWR SWL SWRLane ConfigurationsVolume (vph) 50 90 260 310 800 150Ideal Flow (vphpl) 1900 1900 1900 1900 1900 1900Total Lost time (s) 4.0 4.0 4.0 4.0 4.0 4.0Lane Util. Factor 1.00 0.95 0.95 1.00 0.97 1.00Frt 1.00 1.00 1.00 0.85 1.00 0.85Flt Protected 0.95 1.00 1.00 1.00 0.95 1.00Satd. Flow (prot) 1770 3539 3539 1583 3433 1583Flt Permitted 0.95 1.00 1.00 1.00 0.95 1.00Satd. Flow (perm) 1770 3539 3539 1583 3433 1583Peak-hour factor, PHF 1.00 1.00 1.00 1.00 1.00 1.00Adj. Flow (vph) 50 90 260 310 800 150RTOR Reduction (vph) 0 0 0 144 0 105Lane Group Flow (vph) 50 90 260 166 800 45Turn Type Prot Perm PermProtected Phases 1 6 2 8Permitted Phases 2 8Actuated Green, G (s) 7.7 75.9 64.2 64.2 36.1 36.1Effective Green, g (s) 7.7 75.9 64.2 64.2 36.1 36.1Actuated g/C Ratio 0.06 0.63 0.54 0.54 0.30 0.30Clearance Time (s) 4.0 4.0 4.0 4.0 4.0 4.0Vehicle Extension (s) 3.0 3.0 3.0 3.0 3.0 3.0Lane Grp Cap (vph) 114 2238 1893 847 1033 476v/s Ratio Prot c0.03 0.03 0.07 c0.23v/s Ratio Perm c0.10 0.03v/c Ratio 0.44 0.04 0.14 0.20 0.77 0.09Uniform Delay, d1 54.1 8.3 14.0 14.5 38.2 30.2Progression Factor 1.00 1.00 0.47 0.29 1.00 1.00Incremental Delay, d2 2.7 0.0 0.1 0.4 3.7 0.1Delay (s) 56.8 8.3 6.7 4.7 41.9 30.3Level of Service E A A A D CApproach Delay (s) 25.6 5.6 40.1Approach LOS C A D
Intersection SummaryHCM Average Control Delay 27.0 HCM Level of Service CHCM Volume to Capacity ratio 0.41Actuated Cycle Length (s) 120.0 Sum of lost time (s) 12.0Intersection Capacity Utilization 43.3% ICU Level of Service AAnalysis Period (min) 15c Critical Lane Group
C-2

Existing No Project19: Center & Beach AM Peak Hour
HCM Signalized Intersection Capacity Analysis Synchro 7 - ReportHuntington Beach, Center Ave Skate Park (503.008)
Movement EBL EBR NBL NBT SBT SBRLane ConfigurationsVolume (vph) 60 400 0 1980 2520 910Ideal Flow (vphpl) 1900 1900 1900 1900 1900 1900Total Lost time (s) 4.0 4.0 4.0 4.0 4.0Lane Util. Factor 0.97 0.88 0.86 0.86 1.00Frt 1.00 0.85 1.00 1.00 0.85Flt Protected 0.95 1.00 1.00 1.00 1.00Satd. Flow (prot) 3433 2787 6408 6408 1583Flt Permitted 0.95 1.00 1.00 1.00 1.00Satd. Flow (perm) 3433 2787 6408 6408 1583Peak-hour factor, PHF 1.00 1.00 1.00 1.00 1.00 1.00Adj. Flow (vph) 60 400 0 1980 2520 910RTOR Reduction (vph) 0 7 0 0 0 0Lane Group Flow (vph) 60 393 0 1980 2520 910Turn Type Perm FreeProtected Phases 4 2 6Permitted Phases 4 FreeActuated Green, G (s) 22.4 22.4 89.6 89.6 120.0Effective Green, g (s) 22.4 22.4 89.6 89.6 120.0Actuated g/C Ratio 0.19 0.19 0.75 0.75 1.00Clearance Time (s) 4.0 4.0 4.0 4.0Vehicle Extension (s) 3.0 3.0 3.0 3.0Lane Grp Cap (vph) 641 520 4785 4785 1583v/s Ratio Prot 0.02 0.31 0.39v/s Ratio Perm c0.14 c0.57v/c Ratio 0.09 0.76 0.41 0.53 0.57Uniform Delay, d1 40.4 46.2 5.6 6.3 0.0Progression Factor 0.30 0.36 0.29 2.14 1.00Incremental Delay, d2 0.1 5.5 0.2 0.3 1.1Delay (s) 12.3 22.4 1.8 13.9 1.1Level of Service B C A B AApproach Delay (s) 21.0 1.8 10.5Approach LOS C A B
Intersection SummaryHCM Average Control Delay 8.4 HCM Level of Service AHCM Volume to Capacity ratio 0.61Actuated Cycle Length (s) 120.0 Sum of lost time (s) 4.0Intersection Capacity Utilization 57.2% ICU Level of Service BAnalysis Period (min) 15c Critical Lane Group
C-3

Existing No Project28: Edinger & Beach AM Peak Hour
HCM Signalized Intersection Capacity Analysis Synchro 7 - ReportHuntington Beach, Center Ave Skate Park (503.008)
Movement EBL EBT EBR WBL WBT WBR NBL NBT NBR SBL SBT SBRLane ConfigurationsVolume (vph) 190 770 60 100 390 260 150 1400 210 470 1970 380Ideal Flow (vphpl) 1900 1900 1900 1900 1900 1900 1900 1900 1900 1900 1900 1900Total Lost time (s) 4.0 4.0 4.0 4.0 4.0 4.0 4.0 4.0 4.0 4.0 4.0 4.0Lane Util. Factor 0.97 *0.90 1.00 0.97 0.95 1.00 0.97 *0.90 1.00 *1.00 0.86 0.88Frt 1.00 1.00 0.85 1.00 1.00 0.85 1.00 1.00 0.85 1.00 1.00 0.85Flt Protected 0.95 1.00 1.00 0.95 1.00 1.00 0.95 1.00 1.00 0.95 1.00 1.00Satd. Flow (prot) 3433 5029 1583 3433 3539 1583 3433 5029 1583 3539 6408 2787Flt Permitted 0.95 1.00 1.00 0.95 1.00 1.00 0.95 1.00 1.00 0.95 1.00 1.00Satd. Flow (perm) 3433 5029 1583 3433 3539 1583 3433 5029 1583 3539 6408 2787Peak-hour factor, PHF 1.00 1.00 1.00 1.00 1.00 1.00 1.00 1.00 1.00 1.00 1.00 1.00Adj. Flow (vph) 190 770 60 100 390 260 150 1400 210 470 1970 380RTOR Reduction (vph) 0 0 11 0 0 218 0 0 108 0 0 163Lane Group Flow (vph) 190 770 49 100 390 42 150 1400 102 470 1970 217Turn Type Prot pm+ov Prot Perm Prot Perm Prot PermProtected Phases 7 4 5 3 8 5 2 1 6Permitted Phases 4 8 2 6Actuated Green, G (s) 17.8 30.3 39.0 6.9 19.4 19.4 8.7 44.1 44.1 22.7 58.1 58.1Effective Green, g (s) 17.8 30.3 39.0 6.9 19.4 19.4 8.7 44.1 44.1 22.7 58.1 58.1Actuated g/C Ratio 0.15 0.25 0.32 0.06 0.16 0.16 0.07 0.37 0.37 0.19 0.48 0.48Clearance Time (s) 4.0 4.0 4.0 4.0 4.0 4.0 4.0 4.0 4.0 4.0 4.0 4.0Vehicle Extension (s) 3.0 3.0 3.0 3.0 3.0 3.0 3.0 3.0 3.0 3.0 3.0 3.0Lane Grp Cap (vph) 509 1270 567 197 572 256 249 1848 582 669 3103 1349v/s Ratio Prot c0.06 c0.15 0.01 0.03 c0.11 0.04 c0.28 c0.13 0.31v/s Ratio Perm 0.02 0.03 0.06 0.08v/c Ratio 0.37 0.61 0.09 0.51 0.68 0.16 0.60 0.76 0.18 0.70 0.63 0.16Uniform Delay, d1 46.1 39.6 28.1 54.9 47.4 43.3 54.0 33.3 25.7 45.5 23.1 17.3Progression Factor 1.00 1.00 1.00 1.00 1.00 1.00 1.00 1.00 1.00 0.80 0.32 0.05Incremental Delay, d2 0.5 2.2 0.1 2.1 3.3 0.3 4.1 3.0 0.7 2.9 0.9 0.2Delay (s) 46.5 41.7 28.2 57.0 50.7 43.6 58.0 36.2 26.3 39.1 8.2 1.1Level of Service D D C E D D E D C D A AApproach Delay (s) 41.8 49.1 36.9 12.4Approach LOS D D D B
Intersection SummaryHCM Average Control Delay 28.2 HCM Level of Service CHCM Volume to Capacity ratio 0.66Actuated Cycle Length (s) 120.0 Sum of lost time (s) 12.0Intersection Capacity Utilization 72.0% ICU Level of Service CAnalysis Period (min) 15c Critical Lane Group
C-4

Existing No Project203: McFadden & Beach AM Peak Hour
HCM Signalized Intersection Capacity Analysis Synchro 7 - ReportHuntington Beach, Center Ave Skate Park (503.008)
Movement EBL EBT EBR WBL WBT WBR NBL NBT NBR SBL SBT SBRLane ConfigurationsVolume (vph) 270 370 130 350 520 170 190 1910 120 200 2360 270Ideal Flow (vphpl) 1900 1900 1900 1900 1900 1900 1900 1900 1900 1900 1900 1900Total Lost time (s) 4.0 4.0 4.0 4.0 4.0 4.0 4.0 4.0Lane Util. Factor 0.97 0.95 0.97 0.95 0.97 0.86 0.97 0.86Frt 1.00 0.96 1.00 0.96 1.00 0.99 1.00 0.98Flt Protected 0.95 1.00 0.95 1.00 0.95 1.00 0.95 1.00Satd. Flow (prot) 3433 3401 3433 3408 3433 6351 3433 6309Flt Permitted 0.95 1.00 0.95 1.00 0.95 1.00 0.95 1.00Satd. Flow (perm) 3433 3401 3433 3408 3433 6351 3433 6309Peak-hour factor, PHF 1.00 1.00 1.00 1.00 1.00 1.00 1.00 1.00 1.00 1.00 1.00 1.00Adj. Flow (vph) 270 370 130 350 520 170 190 1910 120 200 2360 270RTOR Reduction (vph) 0 30 0 0 27 0 0 7 0 0 16 0Lane Group Flow (vph) 270 470 0 350 663 0 190 2023 0 200 2614 0Turn Type Prot Prot Prot ProtProtected Phases 7 4 3 8 5 2 1 6Permitted PhasesActuated Green, G (s) 11.0 21.2 15.9 26.1 7.7 57.1 9.8 59.2Effective Green, g (s) 11.0 21.2 15.9 26.1 7.7 57.1 9.8 59.2Actuated g/C Ratio 0.09 0.18 0.13 0.22 0.06 0.48 0.08 0.49Clearance Time (s) 4.0 4.0 4.0 4.0 4.0 4.0 4.0 4.0Vehicle Extension (s) 3.0 3.0 3.0 3.0 3.0 3.0 3.0 3.0Lane Grp Cap (vph) 315 601 455 741 220 3022 280 3112v/s Ratio Prot 0.08 0.14 c0.10 c0.19 c0.06 0.32 0.06 c0.41v/s Ratio Permv/c Ratio 0.86 0.78 0.77 0.90 0.86 0.67 0.71 0.84Uniform Delay, d1 53.7 47.2 50.3 45.6 55.6 24.2 53.7 26.3Progression Factor 1.00 1.00 1.00 1.00 1.33 0.39 1.00 1.00Incremental Delay, d2 19.9 6.6 7.7 13.3 26.5 1.1 8.4 2.9Delay (s) 73.6 53.8 57.9 59.0 100.7 10.6 62.1 29.2Level of Service E D E E F B E CApproach Delay (s) 60.7 58.6 18.3 31.5Approach LOS E E B C
Intersection SummaryHCM Average Control Delay 34.6 HCM Level of Service CHCM Volume to Capacity ratio 0.80Actuated Cycle Length (s) 120.0 Sum of lost time (s) 8.0Intersection Capacity Utilization 85.0% ICU Level of Service EAnalysis Period (min) 15c Critical Lane Group
C-5

Existing No Project18: Center & I-405 SB Ramps PM Peak Hour
HCM Signalized Intersection Capacity Analysis Synchro 7 - ReportHuntington Beach, Center Ave Skate Park (503.008)
Movement SEL SET NWT NWR SWL SWRLane ConfigurationsVolume (vph) 350 210 240 610 930 200Ideal Flow (vphpl) 1900 1900 1900 1900 1900 1900Total Lost time (s) 4.0 4.0 4.0 4.0 4.0 4.0Lane Util. Factor 1.00 0.95 0.95 1.00 0.97 1.00Frt 1.00 1.00 1.00 0.85 1.00 0.85Flt Protected 0.95 1.00 1.00 1.00 0.95 1.00Satd. Flow (prot) 1770 3539 3539 1583 3433 1583Flt Permitted 0.95 1.00 1.00 1.00 0.95 1.00Satd. Flow (perm) 1770 3539 3539 1583 3433 1583Peak-hour factor, PHF 1.00 1.00 1.00 1.00 1.00 1.00Adj. Flow (vph) 350 210 240 610 930 200RTOR Reduction (vph) 0 0 0 393 0 138Lane Group Flow (vph) 350 210 240 217 930 62Turn Type Prot Perm PermProtected Phases 1 6 2 8Permitted Phases 2 8Actuated Green, G (s) 27.9 74.6 42.7 42.7 37.4 37.4Effective Green, g (s) 27.9 74.6 42.7 42.7 37.4 37.4Actuated g/C Ratio 0.23 0.62 0.36 0.36 0.31 0.31Clearance Time (s) 4.0 4.0 4.0 4.0 4.0 4.0Vehicle Extension (s) 3.0 3.0 3.0 3.0 3.0 3.0Lane Grp Cap (vph) 412 2200 1259 563 1070 493v/s Ratio Prot c0.20 0.06 0.07 c0.27v/s Ratio Perm c0.14 0.04v/c Ratio 0.85 0.10 0.19 0.39 0.87 0.13Uniform Delay, d1 44.0 9.1 26.7 28.9 39.0 29.6Progression Factor 1.00 1.00 0.71 1.56 1.00 1.00Incremental Delay, d2 15.0 0.1 0.3 1.9 7.7 0.1Delay (s) 59.1 9.2 19.2 46.8 46.7 29.7Level of Service E A B D D CApproach Delay (s) 40.4 39.0 43.7Approach LOS D D D
Intersection SummaryHCM Average Control Delay 41.4 HCM Level of Service DHCM Volume to Capacity ratio 0.67Actuated Cycle Length (s) 120.0 Sum of lost time (s) 12.0Intersection Capacity Utilization 63.8% ICU Level of Service BAnalysis Period (min) 15c Critical Lane Group
C-6

Existing No Project19: Center & Beach PM Peak Hour
HCM Signalized Intersection Capacity Analysis Synchro 7 - ReportHuntington Beach, Center Ave Skate Park (503.008)
Movement EBL EBR NBL NBT SBT SBRLane ConfigurationsVolume (vph) 210 820 0 2450 2140 690Ideal Flow (vphpl) 1900 1900 1900 1900 1900 1900Total Lost time (s) 4.0 4.0 4.0 4.0 4.0Lane Util. Factor 0.97 0.88 0.86 0.86 1.00Frt 1.00 0.85 1.00 1.00 0.85Flt Protected 0.95 1.00 1.00 1.00 1.00Satd. Flow (prot) 3433 2787 6408 6408 1583Flt Permitted 0.95 1.00 1.00 1.00 1.00Satd. Flow (perm) 3433 2787 6408 6408 1583Peak-hour factor, PHF 1.00 1.00 1.00 1.00 1.00 1.00Adj. Flow (vph) 210 820 0 2450 2140 690RTOR Reduction (vph) 0 5 0 0 0 0Lane Group Flow (vph) 210 815 0 2450 2140 690Turn Type Perm FreeProtected Phases 4 2 6Permitted Phases 4 FreeActuated Green, G (s) 41.8 41.8 70.2 70.2 120.0Effective Green, g (s) 41.8 41.8 70.2 70.2 120.0Actuated g/C Ratio 0.35 0.35 0.59 0.59 1.00Clearance Time (s) 4.0 4.0 4.0 4.0Vehicle Extension (s) 3.0 3.0 3.0 3.0Lane Grp Cap (vph) 1196 971 3749 3749 1583v/s Ratio Prot 0.06 c0.38 0.33v/s Ratio Perm c0.29 0.44v/c Ratio 0.18 0.84 0.65 0.57 0.44Uniform Delay, d1 27.1 36.0 16.7 15.5 0.0Progression Factor 0.19 0.25 0.09 0.91 1.00Incremental Delay, d2 0.1 4.8 0.5 0.4 0.6Delay (s) 5.1 13.9 2.1 14.5 0.6Level of Service A B A B AApproach Delay (s) 12.1 2.1 11.1Approach LOS B A B
Intersection SummaryHCM Average Control Delay 7.8 HCM Level of Service AHCM Volume to Capacity ratio 0.72Actuated Cycle Length (s) 120.0 Sum of lost time (s) 8.0Intersection Capacity Utilization 66.4% ICU Level of Service CAnalysis Period (min) 15c Critical Lane Group
C-7

Existing No Project28: Edinger & Beach PM Peak Hour
HCM Signalized Intersection Capacity Analysis Synchro 7 - ReportHuntington Beach, Center Ave Skate Park (503.008)
Movement EBL EBT EBR WBL WBT WBR NBL NBT NBR SBL SBT SBRLane ConfigurationsVolume (vph) 310 790 270 120 430 190 310 2100 400 330 2180 540Ideal Flow (vphpl) 1900 1900 1900 1900 1900 1900 1900 1900 1900 1900 1900 1900Total Lost time (s) 4.0 4.0 4.0 4.0 4.0 4.0 4.0 4.0 4.0 4.0 4.0 4.0Lane Util. Factor 0.97 *0.90 1.00 0.97 0.95 1.00 0.97 *0.90 1.00 *1.00 0.86 0.88Frt 1.00 1.00 0.85 1.00 1.00 0.85 1.00 1.00 0.85 1.00 1.00 0.85Flt Protected 0.95 1.00 1.00 0.95 1.00 1.00 0.95 1.00 1.00 0.95 1.00 1.00Satd. Flow (prot) 3433 5029 1583 3433 3539 1583 3433 5029 1583 3539 6408 2787Flt Permitted 0.95 1.00 1.00 0.95 1.00 1.00 0.95 1.00 1.00 0.95 1.00 1.00Satd. Flow (perm) 3433 5029 1583 3433 3539 1583 3433 5029 1583 3539 6408 2787Peak-hour factor, PHF 1.00 1.00 1.00 1.00 1.00 1.00 1.00 1.00 1.00 1.00 1.00 1.00Adj. Flow (vph) 310 790 270 120 430 190 310 2100 400 330 2180 540RTOR Reduction (vph) 0 0 29 0 0 156 0 0 146 0 0 206Lane Group Flow (vph) 310 790 241 120 430 34 310 2100 254 330 2180 334Turn Type Prot pm+ov Prot Perm Prot Perm Prot PermProtected Phases 7 4 5 3 8 5 2 1 6Permitted Phases 4 8 2 6Actuated Green, G (s) 13.6 21.9 41.9 10.9 19.2 19.2 20.0 58.2 58.2 13.0 51.2 51.2Effective Green, g (s) 13.6 21.9 41.9 10.9 19.2 19.2 20.0 58.2 58.2 13.0 51.2 51.2Actuated g/C Ratio 0.11 0.18 0.35 0.09 0.16 0.16 0.17 0.49 0.49 0.11 0.43 0.43Clearance Time (s) 4.0 4.0 4.0 4.0 4.0 4.0 4.0 4.0 4.0 4.0 4.0 4.0Vehicle Extension (s) 3.0 3.0 3.0 3.0 3.0 3.0 3.0 3.0 3.0 3.0 3.0 3.0Lane Grp Cap (vph) 389 918 605 312 566 253 572 2439 768 383 2734 1189v/s Ratio Prot c0.09 c0.16 0.07 0.03 0.12 0.09 c0.42 c0.09 0.34v/s Ratio Perm 0.09 0.02 0.16 0.12v/c Ratio 0.80 0.86 0.40 0.38 0.76 0.13 0.54 0.86 0.33 0.86 0.80 0.28Uniform Delay, d1 51.9 47.6 29.5 51.4 48.2 43.3 45.8 27.3 19.0 52.6 29.9 22.4Progression Factor 1.00 1.00 1.00 1.00 1.00 1.00 1.00 1.00 1.00 0.97 0.54 0.28Incremental Delay, d2 10.8 10.4 0.4 0.8 5.8 0.2 1.1 4.3 1.2 14.8 2.0 0.5Delay (s) 62.7 58.0 29.9 52.2 54.0 43.5 46.9 31.6 20.1 65.6 18.1 6.7Level of Service E E C D D D D C C E B AApproach Delay (s) 53.5 51.0 31.6 21.2Approach LOS D D C C
Intersection SummaryHCM Average Control Delay 33.2 HCM Level of Service CHCM Volume to Capacity ratio 0.86Actuated Cycle Length (s) 120.0 Sum of lost time (s) 16.0Intersection Capacity Utilization 84.1% ICU Level of Service EAnalysis Period (min) 15c Critical Lane Group
C-8

Existing No Project203: McFadden & Beach PM Peak Hour
HCM Signalized Intersection Capacity Analysis Synchro 7 - ReportHuntington Beach, Center Ave Skate Park (503.008)
Movement EBL EBT EBR WBL WBT WBR NBL NBT NBR SBL SBT SBRLane ConfigurationsVolume (vph) 360 460 140 390 490 180 270 2330 270 240 2090 240Ideal Flow (vphpl) 1900 1900 1900 1900 1900 1900 1900 1900 1900 1900 1900 1900Total Lost time (s) 4.0 4.0 4.0 4.0 4.0 4.0 4.0 4.0Lane Util. Factor 0.97 0.95 0.97 0.95 0.97 0.86 0.97 0.86Frt 1.00 0.96 1.00 0.96 1.00 0.98 1.00 0.98Flt Protected 0.95 1.00 0.95 1.00 0.95 1.00 0.95 1.00Satd. Flow (prot) 3433 3415 3433 3397 3433 6308 3433 6309Flt Permitted 0.95 1.00 0.95 1.00 0.95 1.00 0.95 1.00Satd. Flow (perm) 3433 3415 3433 3397 3433 6308 3433 6309Peak-hour factor, PHF 1.00 1.00 1.00 1.00 1.00 1.00 1.00 1.00 1.00 1.00 1.00 1.00Adj. Flow (vph) 360 460 140 390 490 180 270 2330 270 240 2090 240RTOR Reduction (vph) 0 24 0 0 31 0 0 17 0 0 16 0Lane Group Flow (vph) 360 576 0 390 639 0 270 2583 0 240 2314 0Turn Type Prot Prot Prot ProtProtected Phases 7 4 3 8 5 2 1 6Permitted PhasesActuated Green, G (s) 12.0 21.5 17.0 26.5 10.5 56.0 9.5 55.0Effective Green, g (s) 12.0 21.5 17.0 26.5 10.5 56.0 9.5 55.0Actuated g/C Ratio 0.10 0.18 0.14 0.22 0.09 0.47 0.08 0.46Clearance Time (s) 4.0 4.0 4.0 4.0 4.0 4.0 4.0 4.0Vehicle Extension (s) 3.0 3.0 3.0 3.0 3.0 3.0 3.0 3.0Lane Grp Cap (vph) 343 612 486 750 300 2944 272 2892v/s Ratio Prot c0.10 0.17 c0.11 c0.19 c0.08 c0.41 0.07 0.37v/s Ratio Permv/c Ratio 1.05 0.94 0.80 0.85 0.90 0.88 0.88 0.80Uniform Delay, d1 54.0 48.6 49.9 44.9 54.2 28.9 54.7 27.8Progression Factor 1.00 1.00 1.00 1.00 1.30 0.43 1.00 1.00Incremental Delay, d2 62.2 22.9 9.3 9.2 24.4 3.4 26.7 2.4Delay (s) 116.2 71.5 59.1 54.1 94.8 15.9 81.4 30.2Level of Service F E E D F B F CApproach Delay (s) 88.3 55.9 23.4 35.0Approach LOS F E C C
Intersection SummaryHCM Average Control Delay 40.4 HCM Level of Service DHCM Volume to Capacity ratio 0.84Actuated Cycle Length (s) 120.0 Sum of lost time (s) 8.0Intersection Capacity Utilization 88.0% ICU Level of Service EAnalysis Period (min) 15c Critical Lane Group
C-9

Existing With Project18: Center & I-405 SB Ramps AM Peak Hour
HCM Signalized Intersection Capacity Analysis Synchro 7 - ReportHuntington Beach, Center Ave Skate Park (503.008)
Movement SEL SET NWT NWR SWL SWRLane ConfigurationsVolume (vph) 50 91 261 310 800 150Ideal Flow (vphpl) 1900 1900 1900 1900 1900 1900Total Lost time (s) 4.0 4.0 4.0 4.0 4.0 4.0Lane Util. Factor 1.00 0.95 0.95 1.00 0.97 1.00Frt 1.00 1.00 1.00 0.85 1.00 0.85Flt Protected 0.95 1.00 1.00 1.00 0.95 1.00Satd. Flow (prot) 1770 3539 3539 1583 3433 1583Flt Permitted 0.95 1.00 1.00 1.00 0.95 1.00Satd. Flow (perm) 1770 3539 3539 1583 3433 1583Peak-hour factor, PHF 1.00 1.00 1.00 1.00 1.00 1.00Adj. Flow (vph) 50 91 261 310 800 150RTOR Reduction (vph) 0 0 0 144 0 105Lane Group Flow (vph) 50 91 261 166 800 45Turn Type Prot Perm PermProtected Phases 1 6 2 8Permitted Phases 2 8Actuated Green, G (s) 7.7 75.9 64.2 64.2 36.1 36.1Effective Green, g (s) 7.7 75.9 64.2 64.2 36.1 36.1Actuated g/C Ratio 0.06 0.63 0.54 0.54 0.30 0.30Clearance Time (s) 4.0 4.0 4.0 4.0 4.0 4.0Vehicle Extension (s) 3.0 3.0 3.0 3.0 3.0 3.0Lane Grp Cap (vph) 114 2238 1893 847 1033 476v/s Ratio Prot c0.03 0.03 0.07 c0.23v/s Ratio Perm c0.10 0.03v/c Ratio 0.44 0.04 0.14 0.20 0.77 0.09Uniform Delay, d1 54.1 8.3 14.0 14.5 38.2 30.2Progression Factor 1.00 1.00 0.47 0.29 1.00 1.00Incremental Delay, d2 2.7 0.0 0.1 0.4 3.7 0.1Delay (s) 56.8 8.4 6.7 4.7 41.9 30.3Level of Service E A A A D CApproach Delay (s) 25.5 5.6 40.1Approach LOS C A D
Intersection SummaryHCM Average Control Delay 27.0 HCM Level of Service CHCM Volume to Capacity ratio 0.41Actuated Cycle Length (s) 120.0 Sum of lost time (s) 12.0Intersection Capacity Utilization 43.4% ICU Level of Service AAnalysis Period (min) 15c Critical Lane Group
C-10

Existing With Project19: Center & Beach AM Peak Hour
HCM Signalized Intersection Capacity Analysis Synchro 7 - ReportHuntington Beach, Center Ave Skate Park (503.008)
Movement EBL EBR NBL NBT SBT SBRLane ConfigurationsVolume (vph) 60 400 0 1980 2520 910Ideal Flow (vphpl) 1900 1900 1900 1900 1900 1900Total Lost time (s) 4.0 4.0 4.0 4.0 4.0Lane Util. Factor 0.97 0.88 0.86 0.86 1.00Frt 1.00 0.85 1.00 1.00 0.85Flt Protected 0.95 1.00 1.00 1.00 1.00Satd. Flow (prot) 3433 2787 6408 6408 1583Flt Permitted 0.95 1.00 1.00 1.00 1.00Satd. Flow (perm) 3433 2787 6408 6408 1583Peak-hour factor, PHF 1.00 1.00 1.00 1.00 1.00 1.00Adj. Flow (vph) 60 400 0 1980 2520 910RTOR Reduction (vph) 0 7 0 0 0 0Lane Group Flow (vph) 60 393 0 1980 2520 910Turn Type Perm FreeProtected Phases 4 2 6Permitted Phases 4 FreeActuated Green, G (s) 22.4 22.4 89.6 89.6 120.0Effective Green, g (s) 22.4 22.4 89.6 89.6 120.0Actuated g/C Ratio 0.19 0.19 0.75 0.75 1.00Clearance Time (s) 4.0 4.0 4.0 4.0Vehicle Extension (s) 3.0 3.0 3.0 3.0Lane Grp Cap (vph) 641 520 4785 4785 1583v/s Ratio Prot 0.02 0.31 0.39v/s Ratio Perm c0.14 c0.57v/c Ratio 0.09 0.76 0.41 0.53 0.57Uniform Delay, d1 40.4 46.2 5.6 6.3 0.0Progression Factor 0.30 0.37 0.29 2.14 1.00Incremental Delay, d2 0.1 5.5 0.2 0.3 1.1Delay (s) 12.3 22.4 1.8 13.9 1.1Level of Service B C A B AApproach Delay (s) 21.1 1.8 10.5Approach LOS C A B
Intersection SummaryHCM Average Control Delay 8.4 HCM Level of Service AHCM Volume to Capacity ratio 0.61Actuated Cycle Length (s) 120.0 Sum of lost time (s) 4.0Intersection Capacity Utilization 57.2% ICU Level of Service BAnalysis Period (min) 15c Critical Lane Group
C-11

Existing With Project28: Edinger & Beach AM Peak Hour
HCM Signalized Intersection Capacity Analysis Synchro 7 - ReportHuntington Beach, Center Ave Skate Park (503.008)
Movement EBL EBT EBR WBL WBT WBR NBL NBT NBR SBL SBT SBRLane ConfigurationsVolume (vph) 190 770 61 100 390 260 151 1400 210 470 1970 380Ideal Flow (vphpl) 1900 1900 1900 1900 1900 1900 1900 1900 1900 1900 1900 1900Total Lost time (s) 4.0 4.0 4.0 4.0 4.0 4.0 4.0 4.0 4.0 4.0 4.0 4.0Lane Util. Factor 0.97 *0.90 1.00 0.97 0.95 1.00 0.97 *0.90 1.00 *1.00 0.86 0.88Frt 1.00 1.00 0.85 1.00 1.00 0.85 1.00 1.00 0.85 1.00 1.00 0.85Flt Protected 0.95 1.00 1.00 0.95 1.00 1.00 0.95 1.00 1.00 0.95 1.00 1.00Satd. Flow (prot) 3433 5029 1583 3433 3539 1583 3433 5029 1583 3539 6408 2787Flt Permitted 0.95 1.00 1.00 0.95 1.00 1.00 0.95 1.00 1.00 0.95 1.00 1.00Satd. Flow (perm) 3433 5029 1583 3433 3539 1583 3433 5029 1583 3539 6408 2787Peak-hour factor, PHF 1.00 1.00 1.00 1.00 1.00 1.00 1.00 1.00 1.00 1.00 1.00 1.00Adj. Flow (vph) 190 770 61 100 390 260 151 1400 210 470 1970 380RTOR Reduction (vph) 0 0 11 0 0 218 0 0 108 0 0 163Lane Group Flow (vph) 190 770 50 100 390 42 151 1400 102 470 1970 217Turn Type Prot pm+ov Prot Perm Prot Perm Prot PermProtected Phases 7 4 5 3 8 5 2 1 6Permitted Phases 4 8 2 6Actuated Green, G (s) 17.8 30.3 39.0 6.9 19.4 19.4 8.7 44.1 44.1 22.7 58.1 58.1Effective Green, g (s) 17.8 30.3 39.0 6.9 19.4 19.4 8.7 44.1 44.1 22.7 58.1 58.1Actuated g/C Ratio 0.15 0.25 0.32 0.06 0.16 0.16 0.07 0.37 0.37 0.19 0.48 0.48Clearance Time (s) 4.0 4.0 4.0 4.0 4.0 4.0 4.0 4.0 4.0 4.0 4.0 4.0Vehicle Extension (s) 3.0 3.0 3.0 3.0 3.0 3.0 3.0 3.0 3.0 3.0 3.0 3.0Lane Grp Cap (vph) 509 1270 567 197 572 256 249 1848 582 669 3103 1349v/s Ratio Prot c0.06 c0.15 0.01 0.03 c0.11 0.04 c0.28 c0.13 0.31v/s Ratio Perm 0.03 0.03 0.06 0.08v/c Ratio 0.37 0.61 0.09 0.51 0.68 0.16 0.61 0.76 0.18 0.70 0.63 0.16Uniform Delay, d1 46.1 39.6 28.1 54.9 47.4 43.3 54.0 33.3 25.7 45.5 23.1 17.3Progression Factor 1.00 1.00 1.00 1.00 1.00 1.00 1.00 1.00 1.00 0.80 0.32 0.05Incremental Delay, d2 0.5 2.2 0.1 2.1 3.3 0.3 4.1 3.0 0.7 2.9 0.9 0.2Delay (s) 46.5 41.7 28.2 57.0 50.7 43.6 58.1 36.2 26.3 39.1 8.2 1.1Level of Service D D C E D D E D C D A AApproach Delay (s) 41.8 49.1 36.9 12.4Approach LOS D D D B
Intersection SummaryHCM Average Control Delay 28.3 HCM Level of Service CHCM Volume to Capacity ratio 0.66Actuated Cycle Length (s) 120.0 Sum of lost time (s) 12.0Intersection Capacity Utilization 72.0% ICU Level of Service CAnalysis Period (min) 15c Critical Lane Group
C-12

Existing With Project203: McFadden & Beach AM Peak Hour
HCM Signalized Intersection Capacity Analysis Synchro 7 - ReportHuntington Beach, Center Ave Skate Park (503.008)
Movement EBL EBT EBR WBL WBT WBR NBL NBT NBR SBL SBT SBRLane ConfigurationsVolume (vph) 270 370 130 350 520 170 190 1910 120 200 2360 270Ideal Flow (vphpl) 1900 1900 1900 1900 1900 1900 1900 1900 1900 1900 1900 1900Total Lost time (s) 4.0 4.0 4.0 4.0 4.0 4.0 4.0 4.0Lane Util. Factor 0.97 0.95 0.97 0.95 0.97 0.86 0.97 0.86Frt 1.00 0.96 1.00 0.96 1.00 0.99 1.00 0.98Flt Protected 0.95 1.00 0.95 1.00 0.95 1.00 0.95 1.00Satd. Flow (prot) 3433 3401 3433 3408 3433 6351 3433 6309Flt Permitted 0.95 1.00 0.95 1.00 0.95 1.00 0.95 1.00Satd. Flow (perm) 3433 3401 3433 3408 3433 6351 3433 6309Peak-hour factor, PHF 1.00 1.00 1.00 1.00 1.00 1.00 1.00 1.00 1.00 1.00 1.00 1.00Adj. Flow (vph) 270 370 130 350 520 170 190 1910 120 200 2360 270RTOR Reduction (vph) 0 30 0 0 27 0 0 7 0 0 16 0Lane Group Flow (vph) 270 470 0 350 663 0 190 2023 0 200 2614 0Turn Type Prot Prot Prot ProtProtected Phases 7 4 3 8 5 2 1 6Permitted PhasesActuated Green, G (s) 11.0 21.2 15.9 26.1 7.7 57.1 9.8 59.2Effective Green, g (s) 11.0 21.2 15.9 26.1 7.7 57.1 9.8 59.2Actuated g/C Ratio 0.09 0.18 0.13 0.22 0.06 0.48 0.08 0.49Clearance Time (s) 4.0 4.0 4.0 4.0 4.0 4.0 4.0 4.0Vehicle Extension (s) 3.0 3.0 3.0 3.0 3.0 3.0 3.0 3.0Lane Grp Cap (vph) 315 601 455 741 220 3022 280 3112v/s Ratio Prot 0.08 0.14 c0.10 c0.19 c0.06 0.32 0.06 c0.41v/s Ratio Permv/c Ratio 0.86 0.78 0.77 0.90 0.86 0.67 0.71 0.84Uniform Delay, d1 53.7 47.2 50.3 45.6 55.6 24.2 53.7 26.3Progression Factor 1.00 1.00 1.00 1.00 1.33 0.39 1.00 1.00Incremental Delay, d2 19.9 6.6 7.7 13.3 26.5 1.1 8.4 2.9Delay (s) 73.6 53.8 57.9 59.0 100.7 10.6 62.1 29.2Level of Service E D E E F B E CApproach Delay (s) 60.7 58.6 18.3 31.5Approach LOS E E B C
Intersection SummaryHCM Average Control Delay 34.6 HCM Level of Service CHCM Volume to Capacity ratio 0.80Actuated Cycle Length (s) 120.0 Sum of lost time (s) 8.0Intersection Capacity Utilization 85.0% ICU Level of Service EAnalysis Period (min) 15c Critical Lane Group
C-13

Existing With Project18: Center & I-405 SB Ramps PM Peak Hour
HCM Signalized Intersection Capacity Analysis Synchro 7 - ReportHuntington Beach, Center Ave Skate Park (503.008)
Movement SEL SET NWT NWR SWL SWRLane ConfigurationsVolume (vph) 350 210 240 610 930 200Ideal Flow (vphpl) 1900 1900 1900 1900 1900 1900Total Lost time (s) 4.0 4.0 4.0 4.0 4.0 4.0Lane Util. Factor 1.00 0.95 0.95 1.00 0.97 1.00Frt 1.00 1.00 1.00 0.85 1.00 0.85Flt Protected 0.95 1.00 1.00 1.00 0.95 1.00Satd. Flow (prot) 1770 3539 3539 1583 3433 1583Flt Permitted 0.95 1.00 1.00 1.00 0.95 1.00Satd. Flow (perm) 1770 3539 3539 1583 3433 1583Peak-hour factor, PHF 1.00 1.00 1.00 1.00 1.00 1.00Adj. Flow (vph) 350 210 240 610 930 200RTOR Reduction (vph) 0 0 0 393 0 138Lane Group Flow (vph) 350 210 240 217 930 62Turn Type Prot Perm PermProtected Phases 1 6 2 8Permitted Phases 2 8Actuated Green, G (s) 27.9 74.6 42.7 42.7 37.4 37.4Effective Green, g (s) 27.9 74.6 42.7 42.7 37.4 37.4Actuated g/C Ratio 0.23 0.62 0.36 0.36 0.31 0.31Clearance Time (s) 4.0 4.0 4.0 4.0 4.0 4.0Vehicle Extension (s) 3.0 3.0 3.0 3.0 3.0 3.0Lane Grp Cap (vph) 412 2200 1259 563 1070 493v/s Ratio Prot c0.20 0.06 0.07 c0.27v/s Ratio Perm c0.14 0.04v/c Ratio 0.85 0.10 0.19 0.39 0.87 0.13Uniform Delay, d1 44.0 9.1 26.7 28.9 39.0 29.6Progression Factor 1.00 1.00 0.70 1.55 1.00 1.00Incremental Delay, d2 15.0 0.1 0.3 1.9 7.7 0.1Delay (s) 59.1 9.2 19.1 46.7 46.7 29.7Level of Service E A B D D CApproach Delay (s) 40.4 38.9 43.7Approach LOS D D D
Intersection SummaryHCM Average Control Delay 41.4 HCM Level of Service DHCM Volume to Capacity ratio 0.67Actuated Cycle Length (s) 120.0 Sum of lost time (s) 12.0Intersection Capacity Utilization 63.8% ICU Level of Service BAnalysis Period (min) 15c Critical Lane Group
C-14

Existing With Project19: Center & Beach PM Peak Hour
HCM Signalized Intersection Capacity Analysis Synchro 7 - ReportHuntington Beach, Center Ave Skate Park (503.008)
Movement EBL EBR NBL NBT SBT SBRLane ConfigurationsVolume (vph) 212 822 0 2450 2140 691Ideal Flow (vphpl) 1900 1900 1900 1900 1900 1900Total Lost time (s) 4.0 4.0 4.0 4.0 4.0Lane Util. Factor 0.97 0.88 0.86 0.86 1.00Frt 1.00 0.85 1.00 1.00 0.85Flt Protected 0.95 1.00 1.00 1.00 1.00Satd. Flow (prot) 3433 2787 6408 6408 1583Flt Permitted 0.95 1.00 1.00 1.00 1.00Satd. Flow (perm) 3433 2787 6408 6408 1583Peak-hour factor, PHF 1.00 1.00 1.00 1.00 1.00 1.00Adj. Flow (vph) 212 822 0 2450 2140 691RTOR Reduction (vph) 0 5 0 0 0 0Lane Group Flow (vph) 212 817 0 2450 2140 691Turn Type Perm FreeProtected Phases 4 2 6Permitted Phases 4 FreeActuated Green, G (s) 41.9 41.9 70.1 70.1 120.0Effective Green, g (s) 41.9 41.9 70.1 70.1 120.0Actuated g/C Ratio 0.35 0.35 0.58 0.58 1.00Clearance Time (s) 4.0 4.0 4.0 4.0Vehicle Extension (s) 3.0 3.0 3.0 3.0Lane Grp Cap (vph) 1199 973 3743 3743 1583v/s Ratio Prot 0.06 c0.38 0.33v/s Ratio Perm c0.29 0.44v/c Ratio 0.18 0.84 0.65 0.57 0.44Uniform Delay, d1 27.1 36.0 16.8 15.6 0.0Progression Factor 0.18 0.25 0.09 0.91 1.00Incremental Delay, d2 0.1 4.9 0.5 0.4 0.6Delay (s) 5.0 14.0 2.1 14.6 0.6Level of Service A B A B AApproach Delay (s) 12.2 2.1 11.2Approach LOS B A B
Intersection SummaryHCM Average Control Delay 7.8 HCM Level of Service AHCM Volume to Capacity ratio 0.72Actuated Cycle Length (s) 120.0 Sum of lost time (s) 8.0Intersection Capacity Utilization 66.4% ICU Level of Service CAnalysis Period (min) 15c Critical Lane Group
C-15
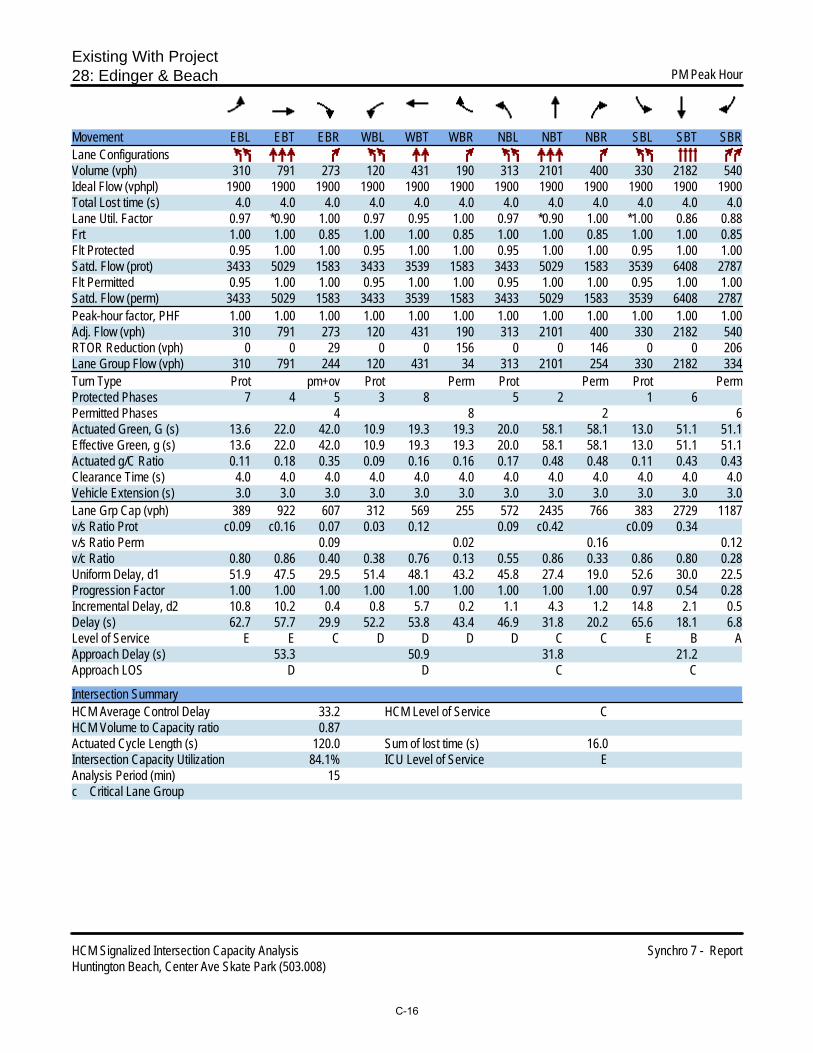
Existing With Project28: Edinger & Beach PM Peak Hour
HCM Signalized Intersection Capacity Analysis Synchro 7 - ReportHuntington Beach, Center Ave Skate Park (503.008)
Movement EBL EBT EBR WBL WBT WBR NBL NBT NBR SBL SBT SBRLane ConfigurationsVolume (vph) 310 791 273 120 431 190 313 2101 400 330 2182 540Ideal Flow (vphpl) 1900 1900 1900 1900 1900 1900 1900 1900 1900 1900 1900 1900Total Lost time (s) 4.0 4.0 4.0 4.0 4.0 4.0 4.0 4.0 4.0 4.0 4.0 4.0Lane Util. Factor 0.97 *0.90 1.00 0.97 0.95 1.00 0.97 *0.90 1.00 *1.00 0.86 0.88Frt 1.00 1.00 0.85 1.00 1.00 0.85 1.00 1.00 0.85 1.00 1.00 0.85Flt Protected 0.95 1.00 1.00 0.95 1.00 1.00 0.95 1.00 1.00 0.95 1.00 1.00Satd. Flow (prot) 3433 5029 1583 3433 3539 1583 3433 5029 1583 3539 6408 2787Flt Permitted 0.95 1.00 1.00 0.95 1.00 1.00 0.95 1.00 1.00 0.95 1.00 1.00Satd. Flow (perm) 3433 5029 1583 3433 3539 1583 3433 5029 1583 3539 6408 2787Peak-hour factor, PHF 1.00 1.00 1.00 1.00 1.00 1.00 1.00 1.00 1.00 1.00 1.00 1.00Adj. Flow (vph) 310 791 273 120 431 190 313 2101 400 330 2182 540RTOR Reduction (vph) 0 0 29 0 0 156 0 0 146 0 0 206Lane Group Flow (vph) 310 791 244 120 431 34 313 2101 254 330 2182 334Turn Type Prot pm+ov Prot Perm Prot Perm Prot PermProtected Phases 7 4 5 3 8 5 2 1 6Permitted Phases 4 8 2 6Actuated Green, G (s) 13.6 22.0 42.0 10.9 19.3 19.3 20.0 58.1 58.1 13.0 51.1 51.1Effective Green, g (s) 13.6 22.0 42.0 10.9 19.3 19.3 20.0 58.1 58.1 13.0 51.1 51.1Actuated g/C Ratio 0.11 0.18 0.35 0.09 0.16 0.16 0.17 0.48 0.48 0.11 0.43 0.43Clearance Time (s) 4.0 4.0 4.0 4.0 4.0 4.0 4.0 4.0 4.0 4.0 4.0 4.0Vehicle Extension (s) 3.0 3.0 3.0 3.0 3.0 3.0 3.0 3.0 3.0 3.0 3.0 3.0Lane Grp Cap (vph) 389 922 607 312 569 255 572 2435 766 383 2729 1187v/s Ratio Prot c0.09 c0.16 0.07 0.03 0.12 0.09 c0.42 c0.09 0.34v/s Ratio Perm 0.09 0.02 0.16 0.12v/c Ratio 0.80 0.86 0.40 0.38 0.76 0.13 0.55 0.86 0.33 0.86 0.80 0.28Uniform Delay, d1 51.9 47.5 29.5 51.4 48.1 43.2 45.8 27.4 19.0 52.6 30.0 22.5Progression Factor 1.00 1.00 1.00 1.00 1.00 1.00 1.00 1.00 1.00 0.97 0.54 0.28Incremental Delay, d2 10.8 10.2 0.4 0.8 5.7 0.2 1.1 4.3 1.2 14.8 2.1 0.5Delay (s) 62.7 57.7 29.9 52.2 53.8 43.4 46.9 31.8 20.2 65.6 18.1 6.8Level of Service E E C D D D D C C E B AApproach Delay (s) 53.3 50.9 31.8 21.2Approach LOS D D C C
Intersection SummaryHCM Average Control Delay 33.2 HCM Level of Service CHCM Volume to Capacity ratio 0.87Actuated Cycle Length (s) 120.0 Sum of lost time (s) 16.0Intersection Capacity Utilization 84.1% ICU Level of Service EAnalysis Period (min) 15c Critical Lane Group
C-16

Existing With Project203: McFadden & Beach PM Peak Hour
HCM Signalized Intersection Capacity Analysis Synchro 7 - ReportHuntington Beach, Center Ave Skate Park (503.008)
Movement EBL EBT EBR WBL WBT WBR NBL NBT NBR SBL SBT SBRLane ConfigurationsVolume (vph) 361 460 140 390 490 180 270 2332 270 240 2091 241Ideal Flow (vphpl) 1900 1900 1900 1900 1900 1900 1900 1900 1900 1900 1900 1900Total Lost time (s) 4.0 4.0 4.0 4.0 4.0 4.0 4.0 4.0Lane Util. Factor 0.97 0.95 0.97 0.95 0.97 0.86 0.97 0.86Frt 1.00 0.96 1.00 0.96 1.00 0.98 1.00 0.98Flt Protected 0.95 1.00 0.95 1.00 0.95 1.00 0.95 1.00Satd. Flow (prot) 3433 3415 3433 3397 3433 6308 3433 6309Flt Permitted 0.95 1.00 0.95 1.00 0.95 1.00 0.95 1.00Satd. Flow (perm) 3433 3415 3433 3397 3433 6308 3433 6309Peak-hour factor, PHF 1.00 1.00 1.00 1.00 1.00 1.00 1.00 1.00 1.00 1.00 1.00 1.00Adj. Flow (vph) 361 460 140 390 490 180 270 2332 270 240 2091 241RTOR Reduction (vph) 0 24 0 0 31 0 0 17 0 0 17 0Lane Group Flow (vph) 361 576 0 390 639 0 270 2585 0 240 2315 0Turn Type Prot Prot Prot ProtProtected Phases 7 4 3 8 5 2 1 6Permitted PhasesActuated Green, G (s) 12.0 21.5 17.0 26.5 10.5 56.0 9.5 55.0Effective Green, g (s) 12.0 21.5 17.0 26.5 10.5 56.0 9.5 55.0Actuated g/C Ratio 0.10 0.18 0.14 0.22 0.09 0.47 0.08 0.46Clearance Time (s) 4.0 4.0 4.0 4.0 4.0 4.0 4.0 4.0Vehicle Extension (s) 3.0 3.0 3.0 3.0 3.0 3.0 3.0 3.0Lane Grp Cap (vph) 343 612 486 750 300 2944 272 2892v/s Ratio Prot c0.11 0.17 c0.11 c0.19 c0.08 c0.41 0.07 0.37v/s Ratio Permv/c Ratio 1.05 0.94 0.80 0.85 0.90 0.88 0.88 0.80Uniform Delay, d1 54.0 48.6 49.9 44.9 54.2 28.9 54.7 27.8Progression Factor 1.00 1.00 1.00 1.00 1.30 0.43 1.00 1.00Incremental Delay, d2 63.0 22.9 9.3 9.2 24.4 3.4 26.7 2.4Delay (s) 117.0 71.5 59.1 54.1 94.7 16.0 81.4 30.2Level of Service F E E D F B F CApproach Delay (s) 88.6 55.9 23.4 35.0Approach LOS F E C D
Intersection SummaryHCM Average Control Delay 40.4 HCM Level of Service DHCM Volume to Capacity ratio 0.84Actuated Cycle Length (s) 120.0 Sum of lost time (s) 8.0Intersection Capacity Utilization 88.1% ICU Level of Service EAnalysis Period (min) 15c Critical Lane Group
C-17

2016 No Project18: Center & I-405 SB Ramps AM Peak Hour
HCM Signalized Intersection Capacity Analysis Synchro 7 - ReportHuntington Beach, Center Ave Skate Park (503.008)
Movement SEL SET NWT NWR SWL SWRLane ConfigurationsVolume (vph) 57 122 302 460 812 155Ideal Flow (vphpl) 1900 1900 1900 1900 1900 1900Total Lost time (s) 4.0 4.0 4.0 4.0 4.0 4.0Lane Util. Factor 1.00 0.95 0.95 1.00 0.97 1.00Frt 1.00 1.00 1.00 0.85 1.00 0.85Flt Protected 0.95 1.00 1.00 1.00 0.95 1.00Satd. Flow (prot) 1770 3539 3539 1583 3433 1583Flt Permitted 0.95 1.00 1.00 1.00 0.95 1.00Satd. Flow (perm) 1770 3539 3539 1583 3433 1583Peak-hour factor, PHF 1.00 1.00 1.00 1.00 1.00 1.00Adj. Flow (vph) 57 122 302 460 812 155RTOR Reduction (vph) 0 0 0 214 0 109Lane Group Flow (vph) 57 122 302 246 812 46Turn Type Prot Perm PermProtected Phases 1 6 2 8Permitted Phases 2 8Actuated Green, G (s) 8.1 76.2 64.1 64.1 35.8 35.8Effective Green, g (s) 8.1 76.2 64.1 64.1 35.8 35.8Actuated g/C Ratio 0.07 0.64 0.53 0.53 0.30 0.30Clearance Time (s) 4.0 4.0 4.0 4.0 4.0 4.0Vehicle Extension (s) 3.0 3.0 3.0 3.0 3.0 3.0Lane Grp Cap (vph) 119 2247 1890 846 1024 472v/s Ratio Prot c0.03 0.03 0.09 c0.24v/s Ratio Perm c0.16 0.03v/c Ratio 0.48 0.05 0.16 0.29 0.79 0.10Uniform Delay, d1 53.9 8.3 14.2 15.4 38.7 30.4Progression Factor 1.00 1.00 0.45 1.08 1.00 1.00Incremental Delay, d2 3.0 0.0 0.2 0.7 4.3 0.1Delay (s) 56.9 8.3 6.6 17.4 43.0 30.5Level of Service E A A B D CApproach Delay (s) 23.8 13.1 41.0Approach LOS C B D
Intersection SummaryHCM Average Control Delay 28.2 HCM Level of Service CHCM Volume to Capacity ratio 0.47Actuated Cycle Length (s) 120.0 Sum of lost time (s) 12.0Intersection Capacity Utilization 44.8% ICU Level of Service AAnalysis Period (min) 15c Critical Lane Group
C-18

2016 No Project19: Center & Beach AM Peak Hour
HCM Signalized Intersection Capacity Analysis Synchro 7 - ReportHuntington Beach, Center Ave Skate Park (503.008)
Movement EBL EBR NBL NBT SBT SBRLane ConfigurationsVolume (vph) 126 641 0 2556 2718 849Ideal Flow (vphpl) 1900 1900 1900 1900 1900 1900Total Lost time (s) 4.0 4.0 4.0 4.0 4.0Lane Util. Factor 0.97 0.88 0.86 0.86 1.00Frt 1.00 0.85 1.00 1.00 0.85Flt Protected 0.95 1.00 1.00 1.00 1.00Satd. Flow (prot) 3433 2787 6408 6408 1583Flt Permitted 0.95 1.00 1.00 1.00 1.00Satd. Flow (perm) 3433 2787 6408 6408 1583Peak-hour factor, PHF 1.00 1.00 1.00 1.00 1.00 1.00Adj. Flow (vph) 126 641 0 2556 2718 849RTOR Reduction (vph) 0 1 0 0 0 0Lane Group Flow (vph) 126 640 0 2556 2718 849Turn Type Perm FreeProtected Phases 4 2 6Permitted Phases 4 FreeActuated Green, G (s) 34.6 34.6 77.4 77.4 120.0Effective Green, g (s) 34.6 34.6 77.4 77.4 120.0Actuated g/C Ratio 0.29 0.29 0.64 0.64 1.00Clearance Time (s) 4.0 4.0 4.0 4.0Vehicle Extension (s) 3.0 3.0 3.0 3.0Lane Grp Cap (vph) 990 804 4133 4133 1583v/s Ratio Prot 0.04 0.40 c0.42v/s Ratio Perm c0.23 0.54v/c Ratio 0.13 0.80 0.62 0.66 0.54Uniform Delay, d1 31.5 39.4 12.6 13.1 0.0Progression Factor 0.38 0.32 0.12 1.05 1.00Incremental Delay, d2 0.0 4.7 0.5 0.5 0.8Delay (s) 11.9 17.2 2.0 14.3 0.8Level of Service B B A B AApproach Delay (s) 16.3 2.0 11.1Approach LOS B A B
Intersection SummaryHCM Average Control Delay 8.3 HCM Level of Service AHCM Volume to Capacity ratio 0.70Actuated Cycle Length (s) 120.0 Sum of lost time (s) 8.0Intersection Capacity Utilization 68.5% ICU Level of Service CAnalysis Period (min) 15c Critical Lane Group
C-19

2016 No Project28: Edinger & Beach AM Peak Hour
HCM Signalized Intersection Capacity Analysis Synchro 7 - ReportHuntington Beach, Center Ave Skate Park (503.008)
Movement EBL EBT EBR WBL WBT WBR NBL NBT NBR SBL SBT SBRLane ConfigurationsVolume (vph) 184 854 108 100 383 284 144 1928 342 569 2340 404Ideal Flow (vphpl) 1900 1900 1900 1900 1900 1900 1900 1900 1900 1900 1900 1900Total Lost time (s) 4.0 4.0 4.0 4.0 4.0 4.0 4.0 4.0 4.0 4.0 4.0 4.0Lane Util. Factor 0.97 *0.90 1.00 0.97 0.95 1.00 0.97 *0.90 1.00 *1.00 0.86 0.88Frt 1.00 1.00 0.85 1.00 1.00 0.85 1.00 1.00 0.85 1.00 1.00 0.85Flt Protected 0.95 1.00 1.00 0.95 1.00 1.00 0.95 1.00 1.00 0.95 1.00 1.00Satd. Flow (prot) 3433 5029 1583 3433 3539 1583 3433 5029 1583 3539 6408 2787Flt Permitted 0.95 1.00 1.00 0.95 1.00 1.00 0.95 1.00 1.00 0.95 1.00 1.00Satd. Flow (perm) 3433 5029 1583 3433 3539 1583 3433 5029 1583 3539 6408 2787Peak-hour factor, PHF 1.00 1.00 1.00 1.00 1.00 1.00 1.00 1.00 1.00 1.00 1.00 1.00Adj. Flow (vph) 184 854 108 100 383 284 144 1928 342 569 2340 404RTOR Reduction (vph) 0 0 3 0 0 221 0 0 62 0 0 141Lane Group Flow (vph) 184 854 105 100 383 63 144 1928 280 569 2340 263Turn Type Prot pm+ov Prot Perm Prot Perm Prot PermProtected Phases 7 4 5 3 8 5 2 1 6Permitted Phases 4 8 2 6Actuated Green, G (s) 9.6 23.3 32.0 4.0 17.7 17.7 8.7 55.0 55.0 21.7 68.0 68.0Effective Green, g (s) 9.6 23.3 32.0 4.0 17.7 17.7 8.7 55.0 55.0 21.7 68.0 68.0Actuated g/C Ratio 0.08 0.19 0.27 0.03 0.15 0.15 0.07 0.46 0.46 0.18 0.57 0.57Clearance Time (s) 4.0 4.0 4.0 4.0 4.0 4.0 4.0 4.0 4.0 4.0 4.0 4.0Vehicle Extension (s) 3.0 3.0 3.0 3.0 3.0 3.0 3.0 3.0 3.0 3.0 3.0 3.0Lane Grp Cap (vph) 275 976 475 114 522 233 249 2305 726 640 3631 1579v/s Ratio Prot c0.05 c0.17 0.02 0.03 0.11 0.04 c0.38 c0.16 0.37v/s Ratio Perm 0.05 0.04 0.18 0.09v/c Ratio 0.67 0.88 0.22 0.88 0.73 0.27 0.58 0.84 0.39 0.89 0.64 0.17Uniform Delay, d1 53.7 46.9 34.3 57.8 48.9 45.4 53.9 28.5 21.4 48.0 17.7 12.4Progression Factor 1.00 1.00 1.00 1.00 1.00 1.00 1.00 1.00 1.00 1.05 0.52 0.03Incremental Delay, d2 6.1 10.8 0.2 47.9 5.3 0.6 3.2 3.8 1.6 11.4 0.7 0.2Delay (s) 59.7 57.8 34.5 105.6 54.2 46.1 57.1 32.3 22.9 61.8 10.0 0.6Level of Service E E C F D D E C C E A AApproach Delay (s) 55.9 57.9 32.5 17.7Approach LOS E E C B
Intersection SummaryHCM Average Control Delay 32.1 HCM Level of Service CHCM Volume to Capacity ratio 0.83Actuated Cycle Length (s) 120.0 Sum of lost time (s) 12.0Intersection Capacity Utilization 86.7% ICU Level of Service EAnalysis Period (min) 15c Critical Lane Group
C-20

2016 No Project203: McFadden & Beach AM Peak Hour
HCM Signalized Intersection Capacity Analysis Synchro 7 - ReportHuntington Beach, Center Ave Skate Park (503.008)
Movement EBL EBT EBR WBL WBT WBR NBL NBT NBR SBL SBT SBRLane ConfigurationsVolume (vph) 261 428 136 416 495 176 184 2198 180 212 2546 279Ideal Flow (vphpl) 1900 1900 1900 1900 1900 1900 1900 1900 1900 1900 1900 1900Total Lost time (s) 4.0 4.0 4.0 4.0 4.0 4.0 4.0 4.0Lane Util. Factor 0.97 0.95 0.97 0.95 0.97 0.86 0.97 0.86Frt 1.00 0.96 1.00 0.96 1.00 0.99 1.00 0.99Flt Protected 0.95 1.00 0.95 1.00 0.95 1.00 0.95 1.00Satd. Flow (prot) 3433 3411 3433 3400 3433 6335 3433 6313Flt Permitted 0.95 1.00 0.95 1.00 0.95 1.00 0.95 1.00Satd. Flow (perm) 3433 3411 3433 3400 3433 6335 3433 6313Peak-hour factor, PHF 1.00 1.00 1.00 1.00 1.00 1.00 1.00 1.00 1.00 1.00 1.00 1.00Adj. Flow (vph) 261 428 136 416 495 176 184 2198 180 212 2546 279RTOR Reduction (vph) 0 26 0 0 30 0 0 11 0 0 15 0Lane Group Flow (vph) 261 538 0 416 641 0 184 2367 0 212 2810 0Turn Type Prot Prot Prot ProtProtected Phases 7 4 3 8 5 2 1 6Permitted PhasesActuated Green, G (s) 11.0 20.7 16.7 26.4 7.6 56.7 9.9 59.0Effective Green, g (s) 11.0 20.7 16.7 26.4 7.6 56.7 9.9 59.0Actuated g/C Ratio 0.09 0.17 0.14 0.22 0.06 0.47 0.08 0.49Clearance Time (s) 4.0 4.0 4.0 4.0 4.0 4.0 4.0 4.0Vehicle Extension (s) 3.0 3.0 3.0 3.0 3.0 3.0 3.0 3.0Lane Grp Cap (vph) 315 588 478 748 217 2993 283 3104v/s Ratio Prot 0.08 0.16 c0.12 c0.19 0.05 0.37 c0.06 c0.45v/s Ratio Permv/c Ratio 0.83 0.92 0.87 0.86 0.85 0.79 0.75 0.91Uniform Delay, d1 53.6 48.8 50.6 45.0 55.6 26.7 53.8 27.9Progression Factor 1.00 1.00 1.00 1.00 1.31 0.26 1.00 1.00Incremental Delay, d2 16.2 19.0 15.8 9.6 21.2 1.8 10.4 5.0Delay (s) 69.8 67.7 66.3 54.6 94.1 8.7 64.2 32.9Level of Service E E E D F A E CApproach Delay (s) 68.4 59.1 14.9 35.1Approach LOS E E B D
Intersection SummaryHCM Average Control Delay 35.3 HCM Level of Service DHCM Volume to Capacity ratio 0.85Actuated Cycle Length (s) 120.0 Sum of lost time (s) 8.0Intersection Capacity Utilization 88.2% ICU Level of Service EAnalysis Period (min) 15c Critical Lane Group
C-21

2016 No Project18: Center & I-405 SB Ramps PM Peak Hour
HCM Signalized Intersection Capacity Analysis Synchro 7 - ReportHuntington Beach, Center Ave Skate Park (503.008)
Movement SEL SET NWT NWR SWL SWRLane ConfigurationsVolume (vph) 393 209 267 664 978 220Ideal Flow (vphpl) 1900 1900 1900 1900 1900 1900Total Lost time (s) 4.0 4.0 4.0 4.0 4.0 4.0Lane Util. Factor 1.00 0.95 0.95 1.00 0.97 1.00Frt 1.00 1.00 1.00 0.85 1.00 0.85Flt Protected 0.95 1.00 1.00 1.00 0.95 1.00Satd. Flow (prot) 1770 3539 3539 1583 3433 1583Flt Permitted 0.95 1.00 1.00 1.00 0.95 1.00Satd. Flow (perm) 1770 3539 3539 1583 3433 1583Peak-hour factor, PHF 1.00 1.00 1.00 1.00 1.00 1.00Adj. Flow (vph) 393 209 267 664 978 220RTOR Reduction (vph) 0 0 0 449 0 147Lane Group Flow (vph) 393 209 267 215 978 73Turn Type Prot Perm PermProtected Phases 1 6 2 8Permitted Phases 2 8Actuated Green, G (s) 30.6 73.5 38.9 38.9 38.5 38.5Effective Green, g (s) 30.6 73.5 38.9 38.9 38.5 38.5Actuated g/C Ratio 0.26 0.61 0.32 0.32 0.32 0.32Clearance Time (s) 4.0 4.0 4.0 4.0 4.0 4.0Vehicle Extension (s) 3.0 3.0 3.0 3.0 3.0 3.0Lane Grp Cap (vph) 451 2168 1147 513 1101 508v/s Ratio Prot c0.22 0.06 0.08 c0.28v/s Ratio Perm c0.14 0.05v/c Ratio 0.87 0.10 0.23 0.42 0.89 0.14Uniform Delay, d1 42.8 9.6 29.6 31.7 38.7 29.0Progression Factor 1.00 1.00 0.66 1.97 1.00 1.00Incremental Delay, d2 16.6 0.1 0.4 2.2 8.9 0.1Delay (s) 59.5 9.7 19.8 64.6 47.6 29.2Level of Service E A B E D CApproach Delay (s) 42.2 51.8 44.2Approach LOS D D D
Intersection SummaryHCM Average Control Delay 46.3 HCM Level of Service DHCM Volume to Capacity ratio 0.71Actuated Cycle Length (s) 120.0 Sum of lost time (s) 12.0Intersection Capacity Utilization 69.6% ICU Level of Service CAnalysis Period (min) 15c Critical Lane Group
C-22

2016 No Project19: Center & Beach PM Peak Hour
HCM Signalized Intersection Capacity Analysis Synchro 7 - ReportHuntington Beach, Center Ave Skate Park (503.008)
Movement EBL EBR NBL NBT SBT SBRLane ConfigurationsVolume (vph) 180 915 0 2846 2428 855Ideal Flow (vphpl) 1900 1900 1900 1900 1900 1900Total Lost time (s) 4.0 4.0 4.0 4.0 4.0Lane Util. Factor 0.97 0.88 0.86 0.86 1.00Frt 1.00 0.85 1.00 1.00 0.85Flt Protected 0.95 1.00 1.00 1.00 1.00Satd. Flow (prot) 3433 2787 6408 6408 1583Flt Permitted 0.95 1.00 1.00 1.00 1.00Satd. Flow (perm) 3433 2787 6408 6408 1583Peak-hour factor, PHF 1.00 1.00 1.00 1.00 1.00 1.00Adj. Flow (vph) 180 915 0 2846 2428 855RTOR Reduction (vph) 0 2 0 0 0 0Lane Group Flow (vph) 180 913 0 2846 2428 855Turn Type Perm FreeProtected Phases 4 2 6Permitted Phases 4 FreeActuated Green, G (s) 44.5 44.5 67.5 67.5 120.0Effective Green, g (s) 44.5 44.5 67.5 67.5 120.0Actuated g/C Ratio 0.37 0.37 0.56 0.56 1.00Clearance Time (s) 4.0 4.0 4.0 4.0Vehicle Extension (s) 3.0 3.0 3.0 3.0Lane Grp Cap (vph) 1273 1034 3605 3605 1583v/s Ratio Prot 0.05 c0.44 0.38v/s Ratio Perm c0.33 0.54v/c Ratio 0.14 0.88 0.79 0.67 0.54Uniform Delay, d1 25.1 35.3 20.7 18.5 0.0Progression Factor 0.21 0.27 0.11 0.89 1.00Incremental Delay, d2 0.0 6.4 0.6 0.5 0.7Delay (s) 5.3 15.9 2.9 17.0 0.7Level of Service A B A B AApproach Delay (s) 14.2 2.9 12.8Approach LOS B A B
Intersection SummaryHCM Average Control Delay 9.1 HCM Level of Service AHCM Volume to Capacity ratio 0.83Actuated Cycle Length (s) 120.0 Sum of lost time (s) 8.0Intersection Capacity Utilization 73.9% ICU Level of Service DAnalysis Period (min) 15c Critical Lane Group
C-23

2016 No Project28: Edinger & Beach PM Peak Hour
HCM Signalized Intersection Capacity Analysis Synchro 7 - ReportHuntington Beach, Center Ave Skate Park (503.008)
Movement EBL EBT EBR WBL WBT WBR NBL NBT NBR SBL SBT SBRLane ConfigurationsVolume (vph) 346 778 299 216 566 250 465 2400 544 377 2450 762Ideal Flow (vphpl) 1900 1900 1900 1900 1900 1900 1900 1900 1900 1900 1900 1900Total Lost time (s) 4.0 4.0 4.0 4.0 4.0 4.0 4.0 4.0 4.0 4.0 4.0 4.0Lane Util. Factor 0.97 *0.90 1.00 0.97 0.95 1.00 0.97 *0.90 1.00 *1.00 0.86 0.88Frt 1.00 1.00 0.85 1.00 1.00 0.85 1.00 1.00 0.85 1.00 1.00 0.85Flt Protected 0.95 1.00 1.00 0.95 1.00 1.00 0.95 1.00 1.00 0.95 1.00 1.00Satd. Flow (prot) 3433 5029 1583 3433 3539 1583 3433 5029 1583 3539 6408 2787Flt Permitted 0.95 1.00 1.00 0.95 1.00 1.00 0.95 1.00 1.00 0.95 1.00 1.00Satd. Flow (perm) 3433 5029 1583 3433 3539 1583 3433 5029 1583 3539 6408 2787Peak-hour factor, PHF 1.00 1.00 1.00 1.00 1.00 1.00 1.00 1.00 1.00 1.00 1.00 1.00Adj. Flow (vph) 346 778 299 216 566 250 465 2400 544 377 2450 762RTOR Reduction (vph) 0 0 8 0 0 151 0 0 148 0 0 263Lane Group Flow (vph) 346 778 291 216 566 99 465 2400 396 377 2450 499Turn Type Prot pm+ov Prot Perm Prot Perm Prot PermProtected Phases 7 4 5 3 8 5 2 1 6Permitted Phases 4 8 2 6Actuated Green, G (s) 12.5 22.0 42.0 12.0 21.5 21.5 20.0 57.0 57.0 13.0 50.0 50.0Effective Green, g (s) 12.5 22.0 42.0 12.0 21.5 21.5 20.0 57.0 57.0 13.0 50.0 50.0Actuated g/C Ratio 0.10 0.18 0.35 0.10 0.18 0.18 0.17 0.48 0.48 0.11 0.42 0.42Clearance Time (s) 4.0 4.0 4.0 4.0 4.0 4.0 4.0 4.0 4.0 4.0 4.0 4.0Vehicle Extension (s) 3.0 3.0 3.0 3.0 3.0 3.0 3.0 3.0 3.0 3.0 3.0 3.0Lane Grp Cap (vph) 358 922 607 343 634 284 572 2389 752 383 2670 1161v/s Ratio Prot c0.10 0.15 0.08 0.06 c0.16 0.14 c0.48 c0.11 0.38v/s Ratio Perm 0.10 0.06 0.25 0.18v/c Ratio 0.97 0.84 0.48 0.63 0.89 0.35 0.81 1.00 0.53 0.98 0.92 0.43Uniform Delay, d1 53.5 47.3 30.5 51.9 48.1 43.1 48.2 31.5 22.1 53.4 33.1 24.9Progression Factor 1.00 1.00 1.00 1.00 1.00 1.00 1.00 1.00 1.00 0.91 0.63 0.43Incremental Delay, d2 38.3 9.3 0.6 3.6 14.9 0.7 8.6 19.5 2.6 35.3 4.9 0.9Delay (s) 91.9 56.7 31.1 55.5 63.0 43.9 56.8 51.0 24.7 83.9 25.7 11.5Level of Service F E C E E D E D C F C BApproach Delay (s) 59.8 56.8 47.6 28.8Approach LOS E E D C
Intersection SummaryHCM Average Control Delay 43.3 HCM Level of Service DHCM Volume to Capacity ratio 0.94Actuated Cycle Length (s) 120.0 Sum of lost time (s) 12.0Intersection Capacity Utilization 96.0% ICU Level of Service FAnalysis Period (min) 15c Critical Lane Group
C-24

2016 No Project203: McFadden & Beach PM Peak Hour
HCM Signalized Intersection Capacity Analysis Synchro 7 - ReportHuntington Beach, Center Ave Skate Park (503.008)
Movement EBL EBT EBR WBL WBT WBR NBL NBT NBR SBL SBT SBRLane ConfigurationsVolume (vph) 350 501 146 474 540 186 264 2540 276 240 2384 258Ideal Flow (vphpl) 1900 1900 1900 1900 1900 1900 1900 1900 1900 1900 1900 1900Total Lost time (s) 4.0 4.0 4.0 4.0 4.0 4.0 4.0 4.0Lane Util. Factor 0.97 0.95 0.97 0.95 0.97 0.86 0.97 0.86Frt 1.00 0.97 1.00 0.96 1.00 0.99 1.00 0.99Flt Protected 0.95 1.00 0.95 1.00 0.95 1.00 0.95 1.00Satd. Flow (prot) 3433 3419 3433 3403 3433 6314 3433 6314Flt Permitted 0.95 1.00 0.95 1.00 0.95 1.00 0.95 1.00Satd. Flow (perm) 3433 3419 3433 3403 3433 6314 3433 6314Peak-hour factor, PHF 1.00 1.00 1.00 1.00 1.00 1.00 1.00 1.00 1.00 1.00 1.00 1.00Adj. Flow (vph) 350 501 146 474 540 186 264 2540 276 240 2384 258RTOR Reduction (vph) 0 22 0 0 29 0 0 15 0 0 15 0Lane Group Flow (vph) 350 625 0 474 697 0 264 2801 0 240 2627 0Turn Type Prot Prot Prot ProtProtected Phases 7 4 3 8 5 2 1 6Permitted PhasesActuated Green, G (s) 12.0 21.0 18.0 27.0 10.0 56.0 9.0 55.0Effective Green, g (s) 12.0 21.0 18.0 27.0 10.0 56.0 9.0 55.0Actuated g/C Ratio 0.10 0.18 0.15 0.22 0.08 0.47 0.08 0.46Clearance Time (s) 4.0 4.0 4.0 4.0 4.0 4.0 4.0 4.0Vehicle Extension (s) 3.0 3.0 3.0 3.0 3.0 3.0 3.0 3.0Lane Grp Cap (vph) 343 598 515 766 286 2947 257 2894v/s Ratio Prot 0.10 c0.18 c0.14 0.20 c0.08 c0.44 0.07 0.42v/s Ratio Permv/c Ratio 1.02 1.04 0.92 0.91 0.92 0.95 0.93 0.91Uniform Delay, d1 54.0 49.5 50.3 45.3 54.6 30.7 55.2 30.1Progression Factor 1.00 1.00 1.00 1.00 1.34 0.30 1.00 1.00Incremental Delay, d2 53.9 49.0 21.9 14.9 25.1 6.0 38.4 5.4Delay (s) 107.9 98.5 72.2 60.2 98.5 15.4 93.6 35.6Level of Service F F E E F B F DApproach Delay (s) 101.8 64.9 22.5 40.4Approach LOS F E C D
Intersection SummaryHCM Average Control Delay 44.8 HCM Level of Service DHCM Volume to Capacity ratio 0.93Actuated Cycle Length (s) 120.0 Sum of lost time (s) 12.0Intersection Capacity Utilization 93.6% ICU Level of Service FAnalysis Period (min) 15c Critical Lane Group
C-25

2016 With Project18: Center & I-405 SB Ramps AM Peak Hour
HCM Signalized Intersection Capacity Analysis Synchro 7 - ReportHuntington Beach, Center Ave Skate Park (503.008)
Movement SEL SET NWT NWR SWL SWRLane ConfigurationsVolume (vph) 57 122 302 460 812 155Ideal Flow (vphpl) 1900 1900 1900 1900 1900 1900Total Lost time (s) 4.0 4.0 4.0 4.0 4.0 4.0Lane Util. Factor 1.00 0.95 0.95 1.00 0.97 1.00Frt 1.00 1.00 1.00 0.85 1.00 0.85Flt Protected 0.95 1.00 1.00 1.00 0.95 1.00Satd. Flow (prot) 1770 3539 3539 1583 3433 1583Flt Permitted 0.95 1.00 1.00 1.00 0.95 1.00Satd. Flow (perm) 1770 3539 3539 1583 3433 1583Peak-hour factor, PHF 1.00 1.00 1.00 1.00 1.00 1.00Adj. Flow (vph) 57 122 302 460 812 155RTOR Reduction (vph) 0 0 0 214 0 109Lane Group Flow (vph) 57 122 302 246 812 46Turn Type Prot Perm PermProtected Phases 1 6 2 8Permitted Phases 2 8Actuated Green, G (s) 8.1 76.2 64.1 64.1 35.8 35.8Effective Green, g (s) 8.1 76.2 64.1 64.1 35.8 35.8Actuated g/C Ratio 0.07 0.64 0.53 0.53 0.30 0.30Clearance Time (s) 4.0 4.0 4.0 4.0 4.0 4.0Vehicle Extension (s) 3.0 3.0 3.0 3.0 3.0 3.0Lane Grp Cap (vph) 119 2247 1890 846 1024 472v/s Ratio Prot c0.03 0.03 0.09 c0.24v/s Ratio Perm c0.16 0.03v/c Ratio 0.48 0.05 0.16 0.29 0.79 0.10Uniform Delay, d1 53.9 8.3 14.2 15.4 38.7 30.4Progression Factor 1.00 1.00 0.45 1.08 1.00 1.00Incremental Delay, d2 3.0 0.0 0.2 0.7 4.3 0.1Delay (s) 56.9 8.3 6.6 17.4 43.0 30.5Level of Service E A A B D CApproach Delay (s) 23.8 13.1 41.0Approach LOS C B D
Intersection SummaryHCM Average Control Delay 28.2 HCM Level of Service CHCM Volume to Capacity ratio 0.47Actuated Cycle Length (s) 120.0 Sum of lost time (s) 12.0Intersection Capacity Utilization 44.8% ICU Level of Service AAnalysis Period (min) 15c Critical Lane Group
C-26

2016 With Project19: Center & Beach AM Peak Hour
HCM Signalized Intersection Capacity Analysis Synchro 7 - ReportHuntington Beach, Center Ave Skate Park (503.008)
Movement EBL EBR NBL NBT SBT SBRLane ConfigurationsVolume (vph) 126 641 0 2556 2718 849Ideal Flow (vphpl) 1900 1900 1900 1900 1900 1900Total Lost time (s) 4.0 4.0 4.0 4.0 4.0Lane Util. Factor 0.97 0.88 0.86 0.86 1.00Frt 1.00 0.85 1.00 1.00 0.85Flt Protected 0.95 1.00 1.00 1.00 1.00Satd. Flow (prot) 3433 2787 6408 6408 1583Flt Permitted 0.95 1.00 1.00 1.00 1.00Satd. Flow (perm) 3433 2787 6408 6408 1583Peak-hour factor, PHF 1.00 1.00 1.00 1.00 1.00 1.00Adj. Flow (vph) 126 641 0 2556 2718 849RTOR Reduction (vph) 0 1 0 0 0 0Lane Group Flow (vph) 126 640 0 2556 2718 849Turn Type Perm FreeProtected Phases 4 2 6Permitted Phases 4 FreeActuated Green, G (s) 34.6 34.6 77.4 77.4 120.0Effective Green, g (s) 34.6 34.6 77.4 77.4 120.0Actuated g/C Ratio 0.29 0.29 0.64 0.64 1.00Clearance Time (s) 4.0 4.0 4.0 4.0Vehicle Extension (s) 3.0 3.0 3.0 3.0Lane Grp Cap (vph) 990 804 4133 4133 1583v/s Ratio Prot 0.04 0.40 c0.42v/s Ratio Perm c0.23 0.54v/c Ratio 0.13 0.80 0.62 0.66 0.54Uniform Delay, d1 31.5 39.4 12.6 13.1 0.0Progression Factor 0.38 0.32 0.12 1.05 1.00Incremental Delay, d2 0.0 4.7 0.5 0.5 0.8Delay (s) 12.0 17.2 2.0 14.3 0.8Level of Service B B A B AApproach Delay (s) 16.4 2.0 11.1Approach LOS B A B
Intersection SummaryHCM Average Control Delay 8.3 HCM Level of Service AHCM Volume to Capacity ratio 0.70Actuated Cycle Length (s) 120.0 Sum of lost time (s) 8.0Intersection Capacity Utilization 68.5% ICU Level of Service CAnalysis Period (min) 15c Critical Lane Group
C-27

2016 With Project28: Edinger & Beach AM Peak Hour
HCM Signalized Intersection Capacity Analysis Synchro 7 - ReportHuntington Beach, Center Ave Skate Park (503.008)
Movement EBL EBT EBR WBL WBT WBR NBL NBT NBR SBL SBT SBRLane ConfigurationsVolume (vph) 184 854 109 100 383 284 145 1928 342 569 2340 404Ideal Flow (vphpl) 1900 1900 1900 1900 1900 1900 1900 1900 1900 1900 1900 1900Total Lost time (s) 4.0 4.0 4.0 4.0 4.0 4.0 4.0 4.0 4.0 4.0 4.0 4.0Lane Util. Factor 0.97 *0.90 1.00 0.97 0.95 1.00 0.97 *0.90 1.00 *1.00 0.86 0.88Frt 1.00 1.00 0.85 1.00 1.00 0.85 1.00 1.00 0.85 1.00 1.00 0.85Flt Protected 0.95 1.00 1.00 0.95 1.00 1.00 0.95 1.00 1.00 0.95 1.00 1.00Satd. Flow (prot) 3433 5029 1583 3433 3539 1583 3433 5029 1583 3539 6408 2787Flt Permitted 0.95 1.00 1.00 0.95 1.00 1.00 0.95 1.00 1.00 0.95 1.00 1.00Satd. Flow (perm) 3433 5029 1583 3433 3539 1583 3433 5029 1583 3539 6408 2787Peak-hour factor, PHF 1.00 1.00 1.00 1.00 1.00 1.00 1.00 1.00 1.00 1.00 1.00 1.00Adj. Flow (vph) 184 854 109 100 383 284 145 1928 342 569 2340 404RTOR Reduction (vph) 0 0 3 0 0 221 0 0 62 0 0 141Lane Group Flow (vph) 184 854 106 100 383 63 145 1928 280 569 2340 263Turn Type Prot pm+ov Prot Perm Prot Perm Prot PermProtected Phases 7 4 5 3 8 5 2 1 6Permitted Phases 4 8 2 6Actuated Green, G (s) 9.6 23.3 32.0 4.0 17.7 17.7 8.7 55.0 55.0 21.7 68.0 68.0Effective Green, g (s) 9.6 23.3 32.0 4.0 17.7 17.7 8.7 55.0 55.0 21.7 68.0 68.0Actuated g/C Ratio 0.08 0.19 0.27 0.03 0.15 0.15 0.07 0.46 0.46 0.18 0.57 0.57Clearance Time (s) 4.0 4.0 4.0 4.0 4.0 4.0 4.0 4.0 4.0 4.0 4.0 4.0Vehicle Extension (s) 3.0 3.0 3.0 3.0 3.0 3.0 3.0 3.0 3.0 3.0 3.0 3.0Lane Grp Cap (vph) 275 976 475 114 522 233 249 2305 726 640 3631 1579v/s Ratio Prot c0.05 c0.17 0.02 0.03 0.11 0.04 c0.38 c0.16 0.37v/s Ratio Perm 0.05 0.04 0.18 0.09v/c Ratio 0.67 0.88 0.22 0.88 0.73 0.27 0.58 0.84 0.39 0.89 0.64 0.17Uniform Delay, d1 53.7 46.9 34.3 57.8 48.9 45.4 53.9 28.5 21.4 48.0 17.7 12.4Progression Factor 1.00 1.00 1.00 1.00 1.00 1.00 1.00 1.00 1.00 1.05 0.52 0.03Incremental Delay, d2 6.1 10.8 0.2 47.9 5.3 0.6 3.4 3.8 1.6 11.4 0.7 0.2Delay (s) 59.7 57.8 34.5 105.6 54.2 46.1 57.3 32.3 22.9 61.8 10.0 0.6Level of Service E E C F D D E C C E A AApproach Delay (s) 55.9 57.9 32.5 17.7Approach LOS E E C B
Intersection SummaryHCM Average Control Delay 32.2 HCM Level of Service CHCM Volume to Capacity ratio 0.83Actuated Cycle Length (s) 120.0 Sum of lost time (s) 12.0Intersection Capacity Utilization 86.7% ICU Level of Service EAnalysis Period (min) 15c Critical Lane Group
C-28

2016 With Project203: McFadden & Beach AM Peak Hour
HCM Signalized Intersection Capacity Analysis Synchro 7 - ReportHuntington Beach, Center Ave Skate Park (503.008)
Movement EBL EBT EBR WBL WBT WBR NBL NBT NBR SBL SBT SBRLane ConfigurationsVolume (vph) 261 428 136 416 495 176 184 2198 180 212 2546 279Ideal Flow (vphpl) 1900 1900 1900 1900 1900 1900 1900 1900 1900 1900 1900 1900Total Lost time (s) 4.0 4.0 4.0 4.0 4.0 4.0 4.0 4.0Lane Util. Factor 0.97 0.95 0.97 0.95 0.97 0.86 0.97 0.86Frt 1.00 0.96 1.00 0.96 1.00 0.99 1.00 0.99Flt Protected 0.95 1.00 0.95 1.00 0.95 1.00 0.95 1.00Satd. Flow (prot) 3433 3411 3433 3400 3433 6335 3433 6313Flt Permitted 0.95 1.00 0.95 1.00 0.95 1.00 0.95 1.00Satd. Flow (perm) 3433 3411 3433 3400 3433 6335 3433 6313Peak-hour factor, PHF 1.00 1.00 1.00 1.00 1.00 1.00 1.00 1.00 1.00 1.00 1.00 1.00Adj. Flow (vph) 261 428 136 416 495 176 184 2198 180 212 2546 279RTOR Reduction (vph) 0 26 0 0 30 0 0 11 0 0 15 0Lane Group Flow (vph) 261 538 0 416 641 0 184 2367 0 212 2810 0Turn Type Prot Prot Prot ProtProtected Phases 7 4 3 8 5 2 1 6Permitted PhasesActuated Green, G (s) 11.0 20.7 16.7 26.4 7.6 56.7 9.9 59.0Effective Green, g (s) 11.0 20.7 16.7 26.4 7.6 56.7 9.9 59.0Actuated g/C Ratio 0.09 0.17 0.14 0.22 0.06 0.47 0.08 0.49Clearance Time (s) 4.0 4.0 4.0 4.0 4.0 4.0 4.0 4.0Vehicle Extension (s) 3.0 3.0 3.0 3.0 3.0 3.0 3.0 3.0Lane Grp Cap (vph) 315 588 478 748 217 2993 283 3104v/s Ratio Prot 0.08 0.16 c0.12 c0.19 0.05 0.37 c0.06 c0.45v/s Ratio Permv/c Ratio 0.83 0.92 0.87 0.86 0.85 0.79 0.75 0.91Uniform Delay, d1 53.6 48.8 50.6 45.0 55.6 26.7 53.8 27.9Progression Factor 1.00 1.00 1.00 1.00 1.31 0.26 1.00 1.00Incremental Delay, d2 16.2 19.0 15.8 9.6 21.2 1.8 10.4 5.0Delay (s) 69.8 67.7 66.3 54.6 94.1 8.7 64.2 32.9Level of Service E E E D F A E CApproach Delay (s) 68.4 59.1 14.9 35.1Approach LOS E E B D
Intersection SummaryHCM Average Control Delay 35.3 HCM Level of Service DHCM Volume to Capacity ratio 0.85Actuated Cycle Length (s) 120.0 Sum of lost time (s) 8.0Intersection Capacity Utilization 88.2% ICU Level of Service EAnalysis Period (min) 15c Critical Lane Group
C-29

2016 With Project18: Center & I-405 SB Ramps PM Peak Hour
HCM Signalized Intersection Capacity Analysis Synchro 7 - ReportHuntington Beach, Center Ave Skate Park (503.008)
Movement SEL SET NWT NWR SWL SWRLane ConfigurationsVolume (vph) 395 212 270 664 978 222Ideal Flow (vphpl) 1900 1900 1900 1900 1900 1900Total Lost time (s) 4.0 4.0 4.0 4.0 4.0 4.0Lane Util. Factor 1.00 0.95 0.95 1.00 0.97 1.00Frt 1.00 1.00 1.00 0.85 1.00 0.85Flt Protected 0.95 1.00 1.00 1.00 0.95 1.00Satd. Flow (prot) 1770 3539 3539 1583 3433 1583Flt Permitted 0.95 1.00 1.00 1.00 0.95 1.00Satd. Flow (perm) 1770 3539 3539 1583 3433 1583Peak-hour factor, PHF 1.00 1.00 1.00 1.00 1.00 1.00Adj. Flow (vph) 395 212 270 664 978 222RTOR Reduction (vph) 0 0 0 449 0 148Lane Group Flow (vph) 395 212 270 215 978 74Turn Type Prot Perm PermProtected Phases 1 6 2 8Permitted Phases 2 8Actuated Green, G (s) 30.7 73.5 38.8 38.8 38.5 38.5Effective Green, g (s) 30.7 73.5 38.8 38.8 38.5 38.5Actuated g/C Ratio 0.26 0.61 0.32 0.32 0.32 0.32Clearance Time (s) 4.0 4.0 4.0 4.0 4.0 4.0Vehicle Extension (s) 3.0 3.0 3.0 3.0 3.0 3.0Lane Grp Cap (vph) 453 2168 1144 512 1101 508v/s Ratio Prot c0.22 0.06 0.08 c0.28v/s Ratio Perm c0.14 0.05v/c Ratio 0.87 0.10 0.24 0.42 0.89 0.15Uniform Delay, d1 42.8 9.6 29.7 31.8 38.7 29.0Progression Factor 1.00 1.00 0.66 1.96 1.00 1.00Incremental Delay, d2 16.6 0.1 0.4 2.2 8.9 0.1Delay (s) 59.4 9.7 20.0 64.6 47.6 29.2Level of Service E A B E D CApproach Delay (s) 42.0 51.7 44.2Approach LOS D D D
Intersection SummaryHCM Average Control Delay 46.3 HCM Level of Service DHCM Volume to Capacity ratio 0.72Actuated Cycle Length (s) 120.0 Sum of lost time (s) 12.0Intersection Capacity Utilization 69.7% ICU Level of Service CAnalysis Period (min) 15c Critical Lane Group
C-30
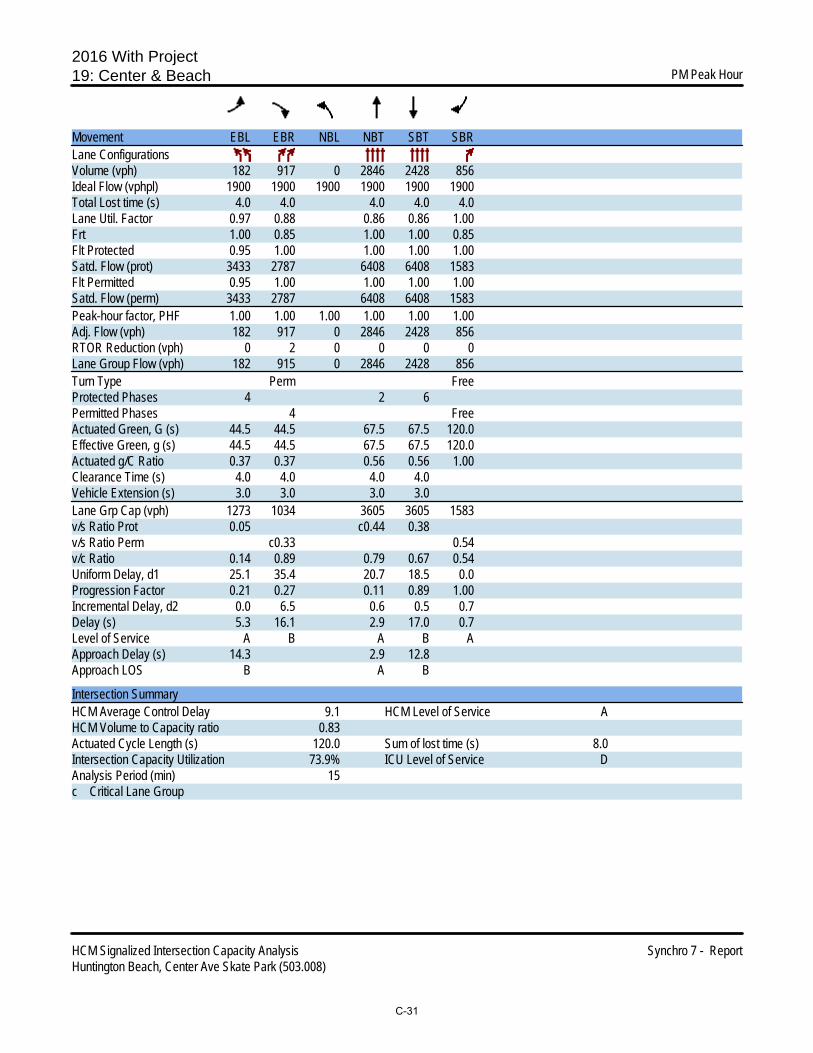
2016 With Project19: Center & Beach PM Peak Hour
HCM Signalized Intersection Capacity Analysis Synchro 7 - ReportHuntington Beach, Center Ave Skate Park (503.008)
Movement EBL EBR NBL NBT SBT SBRLane ConfigurationsVolume (vph) 182 917 0 2846 2428 856Ideal Flow (vphpl) 1900 1900 1900 1900 1900 1900Total Lost time (s) 4.0 4.0 4.0 4.0 4.0Lane Util. Factor 0.97 0.88 0.86 0.86 1.00Frt 1.00 0.85 1.00 1.00 0.85Flt Protected 0.95 1.00 1.00 1.00 1.00Satd. Flow (prot) 3433 2787 6408 6408 1583Flt Permitted 0.95 1.00 1.00 1.00 1.00Satd. Flow (perm) 3433 2787 6408 6408 1583Peak-hour factor, PHF 1.00 1.00 1.00 1.00 1.00 1.00Adj. Flow (vph) 182 917 0 2846 2428 856RTOR Reduction (vph) 0 2 0 0 0 0Lane Group Flow (vph) 182 915 0 2846 2428 856Turn Type Perm FreeProtected Phases 4 2 6Permitted Phases 4 FreeActuated Green, G (s) 44.5 44.5 67.5 67.5 120.0Effective Green, g (s) 44.5 44.5 67.5 67.5 120.0Actuated g/C Ratio 0.37 0.37 0.56 0.56 1.00Clearance Time (s) 4.0 4.0 4.0 4.0Vehicle Extension (s) 3.0 3.0 3.0 3.0Lane Grp Cap (vph) 1273 1034 3605 3605 1583v/s Ratio Prot 0.05 c0.44 0.38v/s Ratio Perm c0.33 0.54v/c Ratio 0.14 0.89 0.79 0.67 0.54Uniform Delay, d1 25.1 35.4 20.7 18.5 0.0Progression Factor 0.21 0.27 0.11 0.89 1.00Incremental Delay, d2 0.0 6.5 0.6 0.5 0.7Delay (s) 5.3 16.1 2.9 17.0 0.7Level of Service A B A B AApproach Delay (s) 14.3 2.9 12.8Approach LOS B A B
Intersection SummaryHCM Average Control Delay 9.1 HCM Level of Service AHCM Volume to Capacity ratio 0.83Actuated Cycle Length (s) 120.0 Sum of lost time (s) 8.0Intersection Capacity Utilization 73.9% ICU Level of Service DAnalysis Period (min) 15c Critical Lane Group
C-31

2016 With Project28: Edinger & Beach PM Peak Hour
HCM Signalized Intersection Capacity Analysis Synchro 7 - ReportHuntington Beach, Center Ave Skate Park (503.008)
Movement EBL EBT EBR WBL WBT WBR NBL NBT NBR SBL SBT SBRLane ConfigurationsVolume (vph) 346 779 302 216 567 250 468 2401 544 377 2452 762Ideal Flow (vphpl) 1900 1900 1900 1900 1900 1900 1900 1900 1900 1900 1900 1900Total Lost time (s) 4.0 4.0 4.0 4.0 4.0 4.0 4.0 4.0 4.0 4.0 4.0 4.0Lane Util. Factor 0.97 *0.90 1.00 0.97 0.95 1.00 0.97 *0.90 1.00 *1.00 0.86 0.88Frt 1.00 1.00 0.85 1.00 1.00 0.85 1.00 1.00 0.85 1.00 1.00 0.85Flt Protected 0.95 1.00 1.00 0.95 1.00 1.00 0.95 1.00 1.00 0.95 1.00 1.00Satd. Flow (prot) 3433 5029 1583 3433 3539 1583 3433 5029 1583 3539 6408 2787Flt Permitted 0.95 1.00 1.00 0.95 1.00 1.00 0.95 1.00 1.00 0.95 1.00 1.00Satd. Flow (perm) 3433 5029 1583 3433 3539 1583 3433 5029 1583 3539 6408 2787Peak-hour factor, PHF 1.00 1.00 1.00 1.00 1.00 1.00 1.00 1.00 1.00 1.00 1.00 1.00Adj. Flow (vph) 346 779 302 216 567 250 468 2401 544 377 2452 762RTOR Reduction (vph) 0 0 8 0 0 151 0 0 148 0 0 263Lane Group Flow (vph) 346 779 294 216 567 99 468 2401 396 377 2452 499Turn Type Prot pm+ov Prot Perm Prot Perm Prot PermProtected Phases 7 4 5 3 8 5 2 1 6Permitted Phases 4 8 2 6Actuated Green, G (s) 12.5 22.0 42.0 12.0 21.5 21.5 20.0 57.0 57.0 13.0 50.0 50.0Effective Green, g (s) 12.5 22.0 42.0 12.0 21.5 21.5 20.0 57.0 57.0 13.0 50.0 50.0Actuated g/C Ratio 0.10 0.18 0.35 0.10 0.18 0.18 0.17 0.48 0.48 0.11 0.42 0.42Clearance Time (s) 4.0 4.0 4.0 4.0 4.0 4.0 4.0 4.0 4.0 4.0 4.0 4.0Vehicle Extension (s) 3.0 3.0 3.0 3.0 3.0 3.0 3.0 3.0 3.0 3.0 3.0 3.0Lane Grp Cap (vph) 358 922 607 343 634 284 572 2389 752 383 2670 1161v/s Ratio Prot c0.10 0.15 0.08 0.06 c0.16 0.14 c0.48 c0.11 0.38v/s Ratio Perm 0.11 0.06 0.25 0.18v/c Ratio 0.97 0.84 0.48 0.63 0.89 0.35 0.82 1.01 0.53 0.98 0.92 0.43Uniform Delay, d1 53.5 47.4 30.5 51.9 48.1 43.1 48.2 31.5 22.1 53.4 33.1 24.9Progression Factor 1.00 1.00 1.00 1.00 1.00 1.00 1.00 1.00 1.00 0.91 0.63 0.43Incremental Delay, d2 38.3 9.4 0.6 3.6 15.0 0.7 8.9 19.6 2.6 35.2 4.9 0.9Delay (s) 91.9 56.7 31.1 55.5 63.2 43.9 57.1 51.1 24.7 83.8 25.7 11.5Level of Service F E C E E D E D C F C BApproach Delay (s) 59.8 56.9 47.7 28.8Approach LOS E E D C
Intersection SummaryHCM Average Control Delay 43.4 HCM Level of Service DHCM Volume to Capacity ratio 0.94Actuated Cycle Length (s) 120.0 Sum of lost time (s) 12.0Intersection Capacity Utilization 96.0% ICU Level of Service FAnalysis Period (min) 15c Critical Lane Group
C-32

2016 With Project203: McFadden & Beach PM Peak Hour
HCM Signalized Intersection Capacity Analysis Synchro 7 - ReportHuntington Beach, Center Ave Skate Park (503.008)
Movement EBL EBT EBR WBL WBT WBR NBL NBT NBR SBL SBT SBRLane ConfigurationsVolume (vph) 351 501 146 474 540 186 264 2542 276 240 2385 259Ideal Flow (vphpl) 1900 1900 1900 1900 1900 1900 1900 1900 1900 1900 1900 1900Total Lost time (s) 4.0 4.0 4.0 4.0 4.0 4.0 4.0 4.0Lane Util. Factor 0.97 0.95 0.97 0.95 0.97 0.86 0.97 0.86Frt 1.00 0.97 1.00 0.96 1.00 0.99 1.00 0.99Flt Protected 0.95 1.00 0.95 1.00 0.95 1.00 0.95 1.00Satd. Flow (prot) 3433 3419 3433 3403 3433 6314 3433 6314Flt Permitted 0.95 1.00 0.95 1.00 0.95 1.00 0.95 1.00Satd. Flow (perm) 3433 3419 3433 3403 3433 6314 3433 6314Peak-hour factor, PHF 1.00 1.00 1.00 1.00 1.00 1.00 1.00 1.00 1.00 1.00 1.00 1.00Adj. Flow (vph) 351 501 146 474 540 186 264 2542 276 240 2385 259RTOR Reduction (vph) 0 22 0 0 29 0 0 15 0 0 15 0Lane Group Flow (vph) 351 625 0 474 697 0 264 2803 0 240 2629 0Turn Type Prot Prot Prot ProtProtected Phases 7 4 3 8 5 2 1 6Permitted PhasesActuated Green, G (s) 12.0 21.0 18.0 27.0 10.0 56.0 9.0 55.0Effective Green, g (s) 12.0 21.0 18.0 27.0 10.0 56.0 9.0 55.0Actuated g/C Ratio 0.10 0.18 0.15 0.22 0.08 0.47 0.08 0.46Clearance Time (s) 4.0 4.0 4.0 4.0 4.0 4.0 4.0 4.0Vehicle Extension (s) 3.0 3.0 3.0 3.0 3.0 3.0 3.0 3.0Lane Grp Cap (vph) 343 598 515 766 286 2947 257 2894v/s Ratio Prot 0.10 c0.18 c0.14 0.20 c0.08 c0.44 0.07 0.42v/s Ratio Permv/c Ratio 1.02 1.04 0.92 0.91 0.92 0.95 0.93 0.91Uniform Delay, d1 54.0 49.5 50.3 45.3 54.6 30.7 55.2 30.2Progression Factor 1.00 1.00 1.00 1.00 1.34 0.31 1.00 1.00Incremental Delay, d2 54.7 49.0 21.9 14.9 25.1 6.1 38.4 5.4Delay (s) 108.7 98.5 72.2 60.2 98.4 15.5 93.6 35.6Level of Service F F E E F B F DApproach Delay (s) 102.1 64.9 22.6 40.4Approach LOS F E C D
Intersection SummaryHCM Average Control Delay 44.8 HCM Level of Service DHCM Volume to Capacity ratio 0.94Actuated Cycle Length (s) 120.0 Sum of lost time (s) 12.0Intersection Capacity Utilization 93.7% ICU Level of Service FAnalysis Period (min) 15c Critical Lane Group
C-33

2030 With Project18: Center & I-405 SB Ramps AM Peak Hour
HCM Signalized Intersection Capacity Analysis Synchro 7 - ReportHuntington Beach, Center Ave Skate Park (503.008)
Movement SEL SET NWT NWR SWL SWRLane ConfigurationsVolume (vph) 61 143 329 560 820 159Ideal Flow (vphpl) 1900 1900 1900 1900 1900 1900Total Lost time (s) 4.0 4.0 4.0 4.0 4.0 4.0Lane Util. Factor 1.00 0.95 0.95 1.00 0.97 1.00Frt 1.00 1.00 1.00 0.85 1.00 0.85Flt Protected 0.95 1.00 1.00 1.00 0.95 1.00Satd. Flow (prot) 1770 3539 3539 1583 3433 1583Flt Permitted 0.95 1.00 1.00 1.00 0.95 1.00Satd. Flow (perm) 1770 3539 3539 1583 3433 1583Peak-hour factor, PHF 1.00 1.00 1.00 1.00 1.00 1.00Adj. Flow (vph) 61 143 329 560 820 159RTOR Reduction (vph) 0 0 0 263 0 111Lane Group Flow (vph) 61 143 329 297 820 48Turn Type Prot Perm PermProtected Phases 1 6 2 8Permitted Phases 2 8Actuated Green, G (s) 8.3 75.9 63.6 63.6 36.1 36.1Effective Green, g (s) 8.3 75.9 63.6 63.6 36.1 36.1Actuated g/C Ratio 0.07 0.63 0.53 0.53 0.30 0.30Clearance Time (s) 4.0 4.0 4.0 4.0 4.0 4.0Vehicle Extension (s) 3.0 3.0 3.0 3.0 3.0 3.0Lane Grp Cap (vph) 122 2238 1876 839 1033 476v/s Ratio Prot c0.03 0.04 0.09 c0.24v/s Ratio Perm c0.19 0.03v/c Ratio 0.50 0.06 0.18 0.35 0.79 0.10Uniform Delay, d1 53.8 8.4 14.6 16.3 38.5 30.2Progression Factor 1.00 1.00 0.49 1.28 1.00 1.00Incremental Delay, d2 3.2 0.1 0.2 1.1 4.3 0.1Delay (s) 57.0 8.5 7.3 22.0 42.8 30.3Level of Service E A A C D CApproach Delay (s) 23.0 16.6 40.8Approach LOS C B D
Intersection SummaryHCM Average Control Delay 28.6 HCM Level of Service CHCM Volume to Capacity ratio 0.51Actuated Cycle Length (s) 120.0 Sum of lost time (s) 12.0Intersection Capacity Utilization 45.9% ICU Level of Service AAnalysis Period (min) 15c Critical Lane Group
C-34

2030 With Project19: Center & Beach AM Peak Hour
HCM Signalized Intersection Capacity Analysis Synchro 7 - ReportHuntington Beach, Center Ave Skate Park (503.008)
Movement EBL EBR NBL NBT SBT SBRLane ConfigurationsVolume (vph) 170 802 0 2940 2850 808Ideal Flow (vphpl) 1900 1900 1900 1900 1900 1900Total Lost time (s) 4.0 4.0 4.0 4.0 4.0Lane Util. Factor 0.97 0.88 0.86 0.86 1.00Frt 1.00 0.85 1.00 1.00 0.85Flt Protected 0.95 1.00 1.00 1.00 1.00Satd. Flow (prot) 3433 2787 6408 6408 1583Flt Permitted 0.95 1.00 1.00 1.00 1.00Satd. Flow (perm) 3433 2787 6408 6408 1583Peak-hour factor, PHF 1.00 1.00 1.00 1.00 1.00 1.00Adj. Flow (vph) 170 802 0 2940 2850 808RTOR Reduction (vph) 0 1 0 0 0 0Lane Group Flow (vph) 170 801 0 2940 2850 808Turn Type Perm FreeProtected Phases 4 2 6Permitted Phases 4 FreeActuated Green, G (s) 41.0 41.0 71.0 71.0 120.0Effective Green, g (s) 41.0 41.0 71.0 71.0 120.0Actuated g/C Ratio 0.34 0.34 0.59 0.59 1.00Clearance Time (s) 4.0 4.0 4.0 4.0Vehicle Extension (s) 3.0 3.0 3.0 3.0Lane Grp Cap (vph) 1173 952 3791 3791 1583v/s Ratio Prot 0.05 c0.46 0.44v/s Ratio Perm c0.29 0.51v/c Ratio 0.14 0.84 0.78 0.75 0.51Uniform Delay, d1 27.4 36.5 18.5 18.0 0.0Progression Factor 0.30 0.25 0.13 1.16 1.00Incremental Delay, d2 0.0 5.9 0.8 0.7 0.6Delay (s) 8.3 14.9 3.2 21.7 0.6Level of Service A B A C AApproach Delay (s) 13.7 3.2 17.0Approach LOS B A B
Intersection SummaryHCM Average Control Delay 11.2 HCM Level of Service BHCM Volume to Capacity ratio 0.80Actuated Cycle Length (s) 120.0 Sum of lost time (s) 8.0Intersection Capacity Utilization 76.0% ICU Level of Service DAnalysis Period (min) 15c Critical Lane Group
C-35

2030 With Project28: Edinger & Beach AM Peak Hour
HCM Signalized Intersection Capacity Analysis Synchro 7 - ReportHuntington Beach, Center Ave Skate Park (503.008)
Movement EBL EBT EBR WBL WBT WBR NBL NBT NBR SBL SBT SBRLane ConfigurationsVolume (vph) 180 910 141 100 379 300 141 2280 430 635 2587 420Ideal Flow (vphpl) 1900 1900 1900 1900 1900 1900 1900 1900 1900 1900 1900 1900Total Lost time (s) 4.0 4.0 4.0 4.0 4.0 4.0 4.0 4.0 4.0 4.0 4.0 4.0Lane Util. Factor 0.97 *0.90 1.00 0.97 0.95 1.00 0.97 *0.90 1.00 *1.00 0.86 0.88Frt 1.00 1.00 0.85 1.00 1.00 0.85 1.00 1.00 0.85 1.00 1.00 0.85Flt Protected 0.95 1.00 1.00 0.95 1.00 1.00 0.95 1.00 1.00 0.95 1.00 1.00Satd. Flow (prot) 3433 5029 1583 3433 3539 1583 3433 5029 1583 3539 6408 2787Flt Permitted 0.95 1.00 1.00 0.95 1.00 1.00 0.95 1.00 1.00 0.95 1.00 1.00Satd. Flow (perm) 3433 5029 1583 3433 3539 1583 3433 5029 1583 3539 6408 2787Peak-hour factor, PHF 1.00 1.00 1.00 1.00 1.00 1.00 1.00 1.00 1.00 1.00 1.00 1.00Adj. Flow (vph) 180 910 141 100 379 300 141 2280 430 635 2587 420RTOR Reduction (vph) 0 0 2 0 0 220 0 0 60 0 0 137Lane Group Flow (vph) 180 910 139 100 379 80 141 2280 370 635 2587 283Turn Type Prot pm+ov Prot Perm Prot Perm Prot PermProtected Phases 7 4 5 3 8 5 2 1 6Permitted Phases 4 8 2 6Actuated Green, G (s) 9.7 23.0 32.0 4.0 17.3 17.3 9.0 55.0 55.0 22.0 68.0 68.0Effective Green, g (s) 9.7 23.0 32.0 4.0 17.3 17.3 9.0 55.0 55.0 22.0 68.0 68.0Actuated g/C Ratio 0.08 0.19 0.27 0.03 0.14 0.14 0.08 0.46 0.46 0.18 0.57 0.57Clearance Time (s) 4.0 4.0 4.0 4.0 4.0 4.0 4.0 4.0 4.0 4.0 4.0 4.0Vehicle Extension (s) 3.0 3.0 3.0 3.0 3.0 3.0 3.0 3.0 3.0 3.0 3.0 3.0Lane Grp Cap (vph) 278 964 475 114 510 228 257 2305 726 649 3631 1579v/s Ratio Prot c0.05 c0.18 0.02 0.03 0.11 0.04 c0.45 c0.18 0.40v/s Ratio Perm 0.07 0.05 0.23 0.10v/c Ratio 0.65 0.94 0.29 0.88 0.74 0.35 0.55 0.99 0.51 0.98 0.71 0.18Uniform Delay, d1 53.5 47.9 35.0 57.8 49.2 46.3 53.5 32.2 23.0 48.8 18.9 12.5Progression Factor 1.00 1.00 1.00 1.00 1.00 1.00 1.00 1.00 1.00 0.95 0.44 0.08Incremental Delay, d2 5.1 18.3 0.3 47.9 5.8 0.9 2.4 16.4 2.5 22.9 0.8 0.2Delay (s) 58.6 66.1 35.3 105.6 55.0 47.2 55.9 48.6 25.5 69.5 9.2 1.2Level of Service E E D F E D E D C E A AApproach Delay (s) 61.5 58.5 45.5 18.8Approach LOS E E D B
Intersection SummaryHCM Average Control Delay 37.5 HCM Level of Service DHCM Volume to Capacity ratio 0.94Actuated Cycle Length (s) 120.0 Sum of lost time (s) 12.0Intersection Capacity Utilization 96.4% ICU Level of Service FAnalysis Period (min) 15c Critical Lane Group
C-36
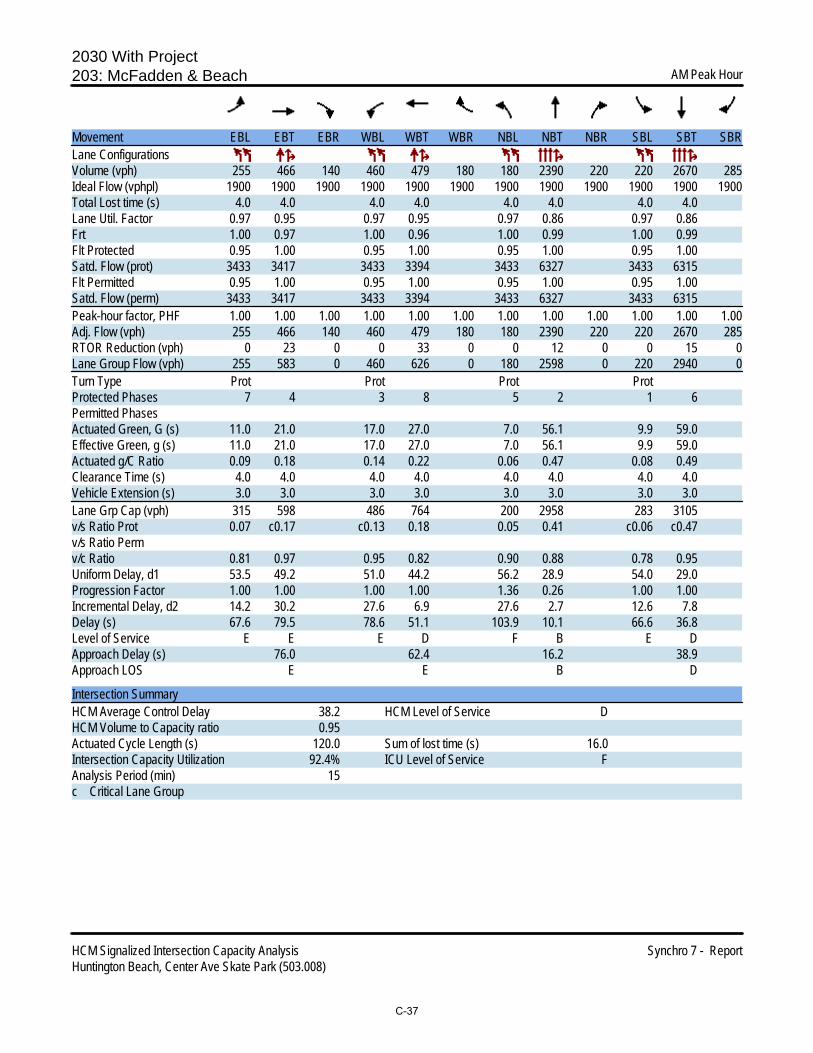
2030 With Project203: McFadden & Beach AM Peak Hour
HCM Signalized Intersection Capacity Analysis Synchro 7 - ReportHuntington Beach, Center Ave Skate Park (503.008)
Movement EBL EBT EBR WBL WBT WBR NBL NBT NBR SBL SBT SBRLane ConfigurationsVolume (vph) 255 466 140 460 479 180 180 2390 220 220 2670 285Ideal Flow (vphpl) 1900 1900 1900 1900 1900 1900 1900 1900 1900 1900 1900 1900Total Lost time (s) 4.0 4.0 4.0 4.0 4.0 4.0 4.0 4.0Lane Util. Factor 0.97 0.95 0.97 0.95 0.97 0.86 0.97 0.86Frt 1.00 0.97 1.00 0.96 1.00 0.99 1.00 0.99Flt Protected 0.95 1.00 0.95 1.00 0.95 1.00 0.95 1.00Satd. Flow (prot) 3433 3417 3433 3394 3433 6327 3433 6315Flt Permitted 0.95 1.00 0.95 1.00 0.95 1.00 0.95 1.00Satd. Flow (perm) 3433 3417 3433 3394 3433 6327 3433 6315Peak-hour factor, PHF 1.00 1.00 1.00 1.00 1.00 1.00 1.00 1.00 1.00 1.00 1.00 1.00Adj. Flow (vph) 255 466 140 460 479 180 180 2390 220 220 2670 285RTOR Reduction (vph) 0 23 0 0 33 0 0 12 0 0 15 0Lane Group Flow (vph) 255 583 0 460 626 0 180 2598 0 220 2940 0Turn Type Prot Prot Prot ProtProtected Phases 7 4 3 8 5 2 1 6Permitted PhasesActuated Green, G (s) 11.0 21.0 17.0 27.0 7.0 56.1 9.9 59.0Effective Green, g (s) 11.0 21.0 17.0 27.0 7.0 56.1 9.9 59.0Actuated g/C Ratio 0.09 0.18 0.14 0.22 0.06 0.47 0.08 0.49Clearance Time (s) 4.0 4.0 4.0 4.0 4.0 4.0 4.0 4.0Vehicle Extension (s) 3.0 3.0 3.0 3.0 3.0 3.0 3.0 3.0Lane Grp Cap (vph) 315 598 486 764 200 2958 283 3105v/s Ratio Prot 0.07 c0.17 c0.13 0.18 0.05 0.41 c0.06 c0.47v/s Ratio Permv/c Ratio 0.81 0.97 0.95 0.82 0.90 0.88 0.78 0.95Uniform Delay, d1 53.5 49.2 51.0 44.2 56.2 28.9 54.0 29.0Progression Factor 1.00 1.00 1.00 1.00 1.36 0.26 1.00 1.00Incremental Delay, d2 14.2 30.2 27.6 6.9 27.6 2.7 12.6 7.8Delay (s) 67.6 79.5 78.6 51.1 103.9 10.1 66.6 36.8Level of Service E E E D F B E DApproach Delay (s) 76.0 62.4 16.2 38.9Approach LOS E E B D
Intersection SummaryHCM Average Control Delay 38.2 HCM Level of Service DHCM Volume to Capacity ratio 0.95Actuated Cycle Length (s) 120.0 Sum of lost time (s) 16.0Intersection Capacity Utilization 92.4% ICU Level of Service FAnalysis Period (min) 15c Critical Lane Group
C-37

2030 With Project18: Center & I-405 SB Ramps PM Peak Hour
HCM Signalized Intersection Capacity Analysis Synchro 7 - ReportHuntington Beach, Center Ave Skate Park (503.008)
Movement SEL SET NWT NWR SWL SWRLane ConfigurationsVolume (vph) 423 212 288 700 1010 235Ideal Flow (vphpl) 1900 1900 1900 1900 1900 1900Total Lost time (s) 4.0 4.0 4.0 4.0 4.0 4.0Lane Util. Factor 1.00 0.95 0.95 1.00 0.97 1.00Frt 1.00 1.00 1.00 0.85 1.00 0.85Flt Protected 0.95 1.00 1.00 1.00 0.95 1.00Satd. Flow (prot) 1770 3539 3539 1583 3433 1583Flt Permitted 0.95 1.00 1.00 1.00 0.95 1.00Satd. Flow (perm) 1770 3539 3539 1583 3433 1583Peak-hour factor, PHF 1.00 1.00 1.00 1.00 1.00 1.00Adj. Flow (vph) 423 212 288 700 1010 235RTOR Reduction (vph) 0 0 0 446 0 150Lane Group Flow (vph) 423 212 288 254 1010 85Turn Type Prot Perm PermProtected Phases 1 6 2 8Permitted Phases 2 8Actuated Green, G (s) 31.6 73.7 38.1 38.1 38.3 38.3Effective Green, g (s) 31.6 73.7 38.1 38.1 38.3 38.3Actuated g/C Ratio 0.26 0.61 0.32 0.32 0.32 0.32Clearance Time (s) 4.0 4.0 4.0 4.0 4.0 4.0Vehicle Extension (s) 3.0 3.0 3.0 3.0 3.0 3.0Lane Grp Cap (vph) 466 2174 1124 503 1096 505v/s Ratio Prot c0.24 0.06 0.08 c0.29v/s Ratio Perm c0.16 0.05v/c Ratio 0.91 0.10 0.26 0.50 0.92 0.17Uniform Delay, d1 42.8 9.5 30.4 33.3 39.4 29.4Progression Factor 1.00 1.00 0.66 1.39 1.00 1.00Incremental Delay, d2 21.1 0.1 0.4 2.9 12.4 0.2Delay (s) 63.9 9.6 20.5 49.1 51.8 29.5Level of Service E A C D D CApproach Delay (s) 45.8 40.8 47.6Approach LOS D D D
Intersection SummaryHCM Average Control Delay 44.9 HCM Level of Service DHCM Volume to Capacity ratio 0.77Actuated Cycle Length (s) 120.0 Sum of lost time (s) 12.0Intersection Capacity Utilization 73.4% ICU Level of Service DAnalysis Period (min) 15c Critical Lane Group
C-38
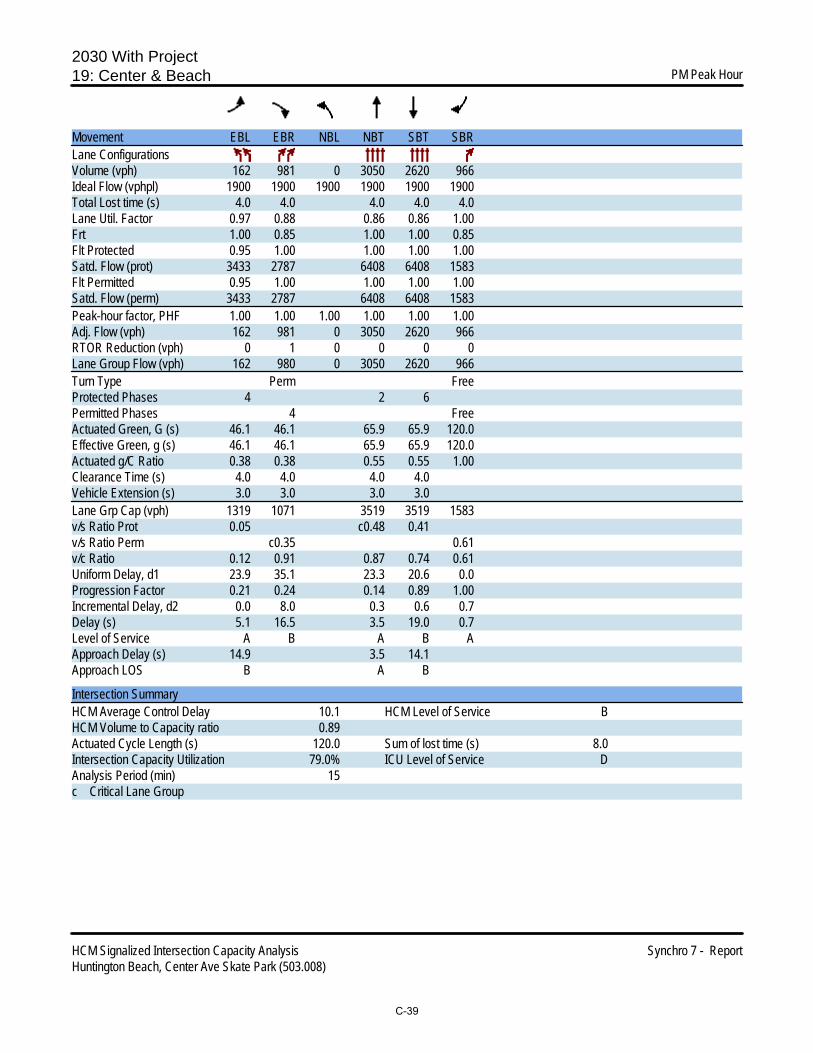
2030 With Project19: Center & Beach PM Peak Hour
HCM Signalized Intersection Capacity Analysis Synchro 7 - ReportHuntington Beach, Center Ave Skate Park (503.008)
Movement EBL EBR NBL NBT SBT SBRLane ConfigurationsVolume (vph) 162 981 0 3050 2620 966Ideal Flow (vphpl) 1900 1900 1900 1900 1900 1900Total Lost time (s) 4.0 4.0 4.0 4.0 4.0Lane Util. Factor 0.97 0.88 0.86 0.86 1.00Frt 1.00 0.85 1.00 1.00 0.85Flt Protected 0.95 1.00 1.00 1.00 1.00Satd. Flow (prot) 3433 2787 6408 6408 1583Flt Permitted 0.95 1.00 1.00 1.00 1.00Satd. Flow (perm) 3433 2787 6408 6408 1583Peak-hour factor, PHF 1.00 1.00 1.00 1.00 1.00 1.00Adj. Flow (vph) 162 981 0 3050 2620 966RTOR Reduction (vph) 0 1 0 0 0 0Lane Group Flow (vph) 162 980 0 3050 2620 966Turn Type Perm FreeProtected Phases 4 2 6Permitted Phases 4 FreeActuated Green, G (s) 46.1 46.1 65.9 65.9 120.0Effective Green, g (s) 46.1 46.1 65.9 65.9 120.0Actuated g/C Ratio 0.38 0.38 0.55 0.55 1.00Clearance Time (s) 4.0 4.0 4.0 4.0Vehicle Extension (s) 3.0 3.0 3.0 3.0Lane Grp Cap (vph) 1319 1071 3519 3519 1583v/s Ratio Prot 0.05 c0.48 0.41v/s Ratio Perm c0.35 0.61v/c Ratio 0.12 0.91 0.87 0.74 0.61Uniform Delay, d1 23.9 35.1 23.3 20.6 0.0Progression Factor 0.21 0.24 0.14 0.89 1.00Incremental Delay, d2 0.0 8.0 0.3 0.6 0.7Delay (s) 5.1 16.5 3.5 19.0 0.7Level of Service A B A B AApproach Delay (s) 14.9 3.5 14.1Approach LOS B A B
Intersection SummaryHCM Average Control Delay 10.1 HCM Level of Service BHCM Volume to Capacity ratio 0.89Actuated Cycle Length (s) 120.0 Sum of lost time (s) 8.0Intersection Capacity Utilization 79.0% ICU Level of Service DAnalysis Period (min) 15c Critical Lane Group
C-39

2030 With Project28: Edinger & Beach PM Peak Hour
HCM Signalized Intersection Capacity Analysis Synchro 7 - ReportHuntington Beach, Center Ave Skate Park (503.008)
Movement EBL EBT EBR WBL WBT WBR NBL NBT NBR SBL SBT SBRLane ConfigurationsVolume (vph) 370 771 321 280 657 290 571 2601 640 409 2632 910Ideal Flow (vphpl) 1900 1900 1900 1900 1900 1900 1900 1900 1900 1900 1900 1900Total Lost time (s) 4.0 4.0 4.0 4.0 4.0 4.0 4.0 4.0 4.0 4.0 4.0 4.0Lane Util. Factor 0.97 *0.90 1.00 0.97 0.95 1.00 0.97 *0.90 1.00 *1.00 0.86 0.88Frt 1.00 1.00 0.85 1.00 1.00 0.85 1.00 1.00 0.85 1.00 1.00 0.85Flt Protected 0.95 1.00 1.00 0.95 1.00 1.00 0.95 1.00 1.00 0.95 1.00 1.00Satd. Flow (prot) 3433 5029 1583 3433 3539 1583 3433 5029 1583 3539 6408 2787Flt Permitted 0.95 1.00 1.00 0.95 1.00 1.00 0.95 1.00 1.00 0.95 1.00 1.00Satd. Flow (perm) 3433 5029 1583 3433 3539 1583 3433 5029 1583 3539 6408 2787Peak-hour factor, PHF 1.00 1.00 1.00 1.00 1.00 1.00 1.00 1.00 1.00 1.00 1.00 1.00Adj. Flow (vph) 370 771 321 280 657 290 571 2601 640 409 2632 910RTOR Reduction (vph) 0 0 3 0 0 149 0 0 148 0 0 275Lane Group Flow (vph) 370 771 318 280 657 141 571 2601 492 409 2632 635Turn Type Prot pm+ov Prot Perm Prot Perm Prot PermProtected Phases 7 4 5 3 8 5 2 1 6Permitted Phases 4 8 2 6Actuated Green, G (s) 12.0 22.0 42.0 12.0 22.0 22.0 20.0 57.0 57.0 13.0 50.0 50.0Effective Green, g (s) 12.0 22.0 42.0 12.0 22.0 22.0 20.0 57.0 57.0 13.0 50.0 50.0Actuated g/C Ratio 0.10 0.18 0.35 0.10 0.18 0.18 0.17 0.48 0.48 0.11 0.42 0.42Clearance Time (s) 4.0 4.0 4.0 4.0 4.0 4.0 4.0 4.0 4.0 4.0 4.0 4.0Vehicle Extension (s) 3.0 3.0 3.0 3.0 3.0 3.0 3.0 3.0 3.0 3.0 3.0 3.0Lane Grp Cap (vph) 343 922 607 343 649 290 572 2389 752 383 2670 1161v/s Ratio Prot c0.11 0.15 0.09 0.08 c0.19 c0.17 c0.52 0.12 0.41v/s Ratio Perm 0.11 0.09 0.31 0.23v/c Ratio 1.08 0.84 0.52 0.82 1.01 0.48 1.00 1.09 0.65 1.07 0.99 0.55Uniform Delay, d1 54.0 47.3 31.0 52.9 49.0 43.9 50.0 31.5 24.0 53.5 34.6 26.4Progression Factor 1.00 1.00 1.00 1.00 1.00 1.00 1.00 1.00 1.00 0.87 0.69 0.56Incremental Delay, d2 71.2 8.9 0.8 13.9 38.4 1.3 36.9 47.7 4.4 57.5 11.5 1.3Delay (s) 125.2 56.2 31.9 66.8 87.4 45.2 86.9 79.2 28.4 104.3 35.6 16.1Level of Service F E C E F D F E C F D BApproach Delay (s) 68.3 72.7 71.8 38.2Approach LOS E E E D
Intersection SummaryHCM Average Control Delay 58.7 HCM Level of Service EHCM Volume to Capacity ratio 1.04Actuated Cycle Length (s) 120.0 Sum of lost time (s) 12.0Intersection Capacity Utilization 104.0% ICU Level of Service GAnalysis Period (min) 15c Critical Lane Group
C-40

2030 With Project203: McFadden & Beach PM Peak Hour
HCM Signalized Intersection Capacity Analysis Synchro 7 - ReportHuntington Beach, Center Ave Skate Park (503.008)
Movement EBL EBT EBR WBL WBT WBR NBL NBT NBR SBL SBT SBRLane ConfigurationsVolume (vph) 345 528 150 530 573 190 260 2682 280 240 2581 271Ideal Flow (vphpl) 1900 1900 1900 1900 1900 1900 1900 1900 1900 1900 1900 1900Total Lost time (s) 4.0 4.0 4.0 4.0 4.0 4.0 4.0 4.0Lane Util. Factor 0.97 0.95 0.97 0.95 0.97 0.86 0.97 0.86Frt 1.00 0.97 1.00 0.96 1.00 0.99 1.00 0.99Flt Protected 0.95 1.00 0.95 1.00 0.95 1.00 0.95 1.00Satd. Flow (prot) 3433 3422 3433 3407 3433 6317 3433 6317Flt Permitted 0.95 1.00 0.95 1.00 0.95 1.00 0.95 1.00Satd. Flow (perm) 3433 3422 3433 3407 3433 6317 3433 6317Peak-hour factor, PHF 1.00 1.00 1.00 1.00 1.00 1.00 1.00 1.00 1.00 1.00 1.00 1.00Adj. Flow (vph) 345 528 150 530 573 190 260 2682 280 240 2581 271RTOR Reduction (vph) 0 21 0 0 27 0 0 14 0 0 15 0Lane Group Flow (vph) 345 657 0 530 736 0 260 2948 0 240 2837 0Turn Type Prot Prot Prot ProtProtected Phases 7 4 3 8 5 2 1 6Permitted PhasesActuated Green, G (s) 12.0 21.0 18.0 27.0 10.0 56.0 9.0 55.0Effective Green, g (s) 12.0 21.0 18.0 27.0 10.0 56.0 9.0 55.0Actuated g/C Ratio 0.10 0.18 0.15 0.22 0.08 0.47 0.08 0.46Clearance Time (s) 4.0 4.0 4.0 4.0 4.0 4.0 4.0 4.0Vehicle Extension (s) 3.0 3.0 3.0 3.0 3.0 3.0 3.0 3.0Lane Grp Cap (vph) 343 599 515 767 286 2948 257 2895v/s Ratio Prot 0.10 c0.19 c0.15 0.22 c0.08 c0.47 0.07 0.45v/s Ratio Permv/c Ratio 1.01 1.10 1.03 0.96 0.91 1.00 0.93 0.98Uniform Delay, d1 54.0 49.5 51.0 46.0 54.5 32.0 55.2 32.0Progression Factor 1.00 1.00 1.00 1.00 1.37 0.26 1.00 1.00Incremental Delay, d2 50.1 65.8 47.3 22.7 19.2 12.1 38.4 12.7Delay (s) 104.1 115.3 98.3 68.7 93.9 20.3 93.6 44.6Level of Service F F F E F C F DApproach Delay (s) 111.5 80.8 26.2 48.4Approach LOS F F C D
Intersection SummaryHCM Average Control Delay 52.5 HCM Level of Service DHCM Volume to Capacity ratio 0.99Actuated Cycle Length (s) 120.0 Sum of lost time (s) 12.0Intersection Capacity Utilization 98.2% ICU Level of Service FAnalysis Period (min) 15c Critical Lane Group
C-41

Project Driveway - Year 20161: Center Ave & Project Driveway AM Peak Hour
HCM Unsignalized Intersection Capacity Analysis Synchro 7 - ReportHuntington Beach, Center Ave Skate Park (503.008)
Movement EBL EBT WBT WBR SBL SBRLane ConfigurationsVolume (veh/h) 6 230 240 1 1 5Sign Control Free Free StopGrade 0% 0% 0%Peak Hour Factor 1.00 1.00 1.00 1.00 1.00 1.00Hourly flow rate (vph) 6 230 240 1 1 5PedestriansLane Width (ft)Walking Speed (ft/s)Percent BlockageRight turn flare (veh)Median type TWLTL TWLTLMedian storage veh) 2 2Upstream signal (ft)pX, platoon unblockedvC, conflicting volume 241 368 120vC1, stage 1 conf vol 240vC2, stage 2 conf vol 127vCu, unblocked vol 241 368 120tC, single (s) 4.1 6.8 6.9tC, 2 stage (s) 5.8tF (s) 2.2 3.5 3.3p0 queue free % 100 100 99cM capacity (veh/h) 1323 725 908
Direction, Lane # EB 1 EB 2 EB 3 WB 1 WB 2 SB 1Volume Total 6 115 115 160 81 6Volume Left 6 0 0 0 0 1Volume Right 0 0 0 0 1 5cSH 1323 1700 1700 1700 1700 872Volume to Capacity 0.00 0.07 0.07 0.09 0.05 0.01Queue Length 95th (ft) 0 0 0 0 0 1Control Delay (s) 7.7 0.0 0.0 0.0 0.0 9.2Lane LOS A AApproach Delay (s) 0.2 0.0 9.2Approach LOS A
Intersection SummaryAverage Delay 0.2Intersection Capacity Utilization 16.7% ICU Level of Service AAnalysis Period (min) 15
C-42

Project Driveway - Year 20161: Center Ave & Project Driveway PM Peak Hour
HCM Unsignalized Intersection Capacity Analysis Synchro 7 - ReportHuntington Beach, Center Ave Skate Park (503.008)
Movement EBL EBT WBT WBR SBL SBRLane ConfigurationsVolume (veh/h) 24 290 335 5 6 27Sign Control Free Free StopGrade 0% 0% 0%Peak Hour Factor 1.00 1.00 1.00 1.00 1.00 1.00Hourly flow rate (vph) 24 290 335 5 6 27PedestriansLane Width (ft)Walking Speed (ft/s)Percent BlockageRight turn flare (veh)Median type TWLTL TWLTLMedian storage veh) 2 2Upstream signal (ft)pX, platoon unblockedvC, conflicting volume 340 530 170vC1, stage 1 conf vol 338vC2, stage 2 conf vol 193vCu, unblocked vol 340 530 170tC, single (s) 4.1 6.8 6.9tC, 2 stage (s) 5.8tF (s) 2.2 3.5 3.3p0 queue free % 98 99 97cM capacity (veh/h) 1216 631 844
Direction, Lane # EB 1 EB 2 EB 3 WB 1 WB 2 SB 1Volume Total 24 145 145 223 117 33Volume Left 24 0 0 0 0 6Volume Right 0 0 0 0 5 27cSH 1216 1700 1700 1700 1700 795Volume to Capacity 0.02 0.09 0.09 0.13 0.07 0.04Queue Length 95th (ft) 2 0 0 0 0 3Control Delay (s) 8.0 0.0 0.0 0.0 0.0 9.7Lane LOS A AApproach Delay (s) 0.6 0.0 9.7Approach LOS A
Intersection SummaryAverage Delay 0.7Intersection Capacity Utilization 26.1% ICU Level of Service AAnalysis Period (min) 15
C-43

Project Driveway - Year 20301: Center Ave & Project Driveway AM Peak Hour
HCM Unsignalized Intersection Capacity Analysis Synchro 7 - ReportHuntington Beach, Center Ave Skate Park (503.008)
Movement EBL EBT WBT WBR SBL SBRLane ConfigurationsVolume (veh/h) 6 270 290 1 1 5Sign Control Free Free StopGrade 0% 0% 0%Peak Hour Factor 1.00 1.00 1.00 1.00 1.00 1.00Hourly flow rate (vph) 6 270 290 1 1 5PedestriansLane Width (ft)Walking Speed (ft/s)Percent BlockageRight turn flare (veh)Median type TWLTL TWLTLMedian storage veh) 2 2Upstream signal (ft)pX, platoon unblockedvC, conflicting volume 291 438 146vC1, stage 1 conf vol 290vC2, stage 2 conf vol 147vCu, unblocked vol 291 438 146tC, single (s) 4.1 6.8 6.9tC, 2 stage (s) 5.8tF (s) 2.2 3.5 3.3p0 queue free % 100 100 99cM capacity (veh/h) 1268 682 875
Direction, Lane # EB 1 EB 2 EB 3 WB 1 WB 2 SB 1Volume Total 6 135 135 193 98 6Volume Left 6 0 0 0 0 1Volume Right 0 0 0 0 1 5cSH 1268 1700 1700 1700 1700 836Volume to Capacity 0.00 0.08 0.08 0.11 0.06 0.01Queue Length 95th (ft) 0 0 0 0 0 1Control Delay (s) 7.9 0.0 0.0 0.0 0.0 9.3Lane LOS A AApproach Delay (s) 0.2 0.0 9.3Approach LOS A
Intersection SummaryAverage Delay 0.2Intersection Capacity Utilization 18.0% ICU Level of Service AAnalysis Period (min) 15
C-44

Project Driveway - Year 20301: Center Ave & Project Driveway PM Peak Hour
HCM Unsignalized Intersection Capacity Analysis Synchro 7 - ReportHuntington Beach, Center Ave Skate Park (503.008)
Movement EBL EBT WBT WBR SBL SBRLane ConfigurationsVolume (veh/h) 24 350 360 5 6 27Sign Control Free Free StopGrade 0% 0% 0%Peak Hour Factor 1.00 1.00 1.00 1.00 1.00 1.00Hourly flow rate (vph) 24 350 360 5 6 27PedestriansLane Width (ft)Walking Speed (ft/s)Percent BlockageRight turn flare (veh)Median type TWLTL TWLTLMedian storage veh) 2 2Upstream signal (ft)pX, platoon unblockedvC, conflicting volume 365 586 182vC1, stage 1 conf vol 362vC2, stage 2 conf vol 223vCu, unblocked vol 365 586 182tC, single (s) 4.1 6.8 6.9tC, 2 stage (s) 5.8tF (s) 2.2 3.5 3.3p0 queue free % 98 99 97cM capacity (veh/h) 1190 605 829
Direction, Lane # EB 1 EB 2 EB 3 WB 1 WB 2 SB 1Volume Total 24 175 175 240 125 33Volume Left 24 0 0 0 0 6Volume Right 0 0 0 0 5 27cSH 1190 1700 1700 1700 1700 777Volume to Capacity 0.02 0.10 0.10 0.14 0.07 0.04Queue Length 95th (ft) 2 0 0 0 0 3Control Delay (s) 8.1 0.0 0.0 0.0 0.0 9.8Lane LOS A AApproach Delay (s) 0.5 0.0 9.8Approach LOS A
Intersection SummaryAverage Delay 0.7Intersection Capacity Utilization 26.8% ICU Level of Service AAnalysis Period (min) 15
C-45

City of Huntington Beach D-1 Austin-Foust Associates, Inc. Center Avenue Skate Park 503008rpt.doc
Appendix D DERIVATION OF TRIP RATES FOR
SKATE PARK
This section discusses the derivation of the trip generation rates for the Skate Park land use.
Traffic counts were performed for three local skate parks in Orange County: Etnies, Lake Forest;
Tewinkle, Costa Mesa; and Laguna Hill Skate Park, Laguna Hills. A review of the traffic data showed
that the Etnies skate park in Lake Forest would be consistent with the planned uses for the proposed
Center Avenue skate park and this data was then used to derive the trip rates. Table D-1 summarizes the
traffic data that was used to derive the trip rates, followed by the traffic count worksheets.

City of Huntington Beach D-2 Austin-Foust Associates, Inc. Center Avenue Skate Park 503008rpt.doc
Table D-1
DERIVATION OF TRIP RATES FOR SKATE PARK
Day of Count AM Peak Hour PM Peak Hour Week Date In Out TOTAL In Out Total ADT
WEEKDAY Monday 2/7/2011 7 6 13 27 30 57 402 Friday 2/4/2011 -- -- -- 28 34 62 --
WEEKDAY AVERAGE 7 28 32 60 402 Weekday Trip Rate
TSF 0.16 0.14 0.30 0.63 0.73 1.36 9.14
Weekend Saturday 2/5/2011 35 34 69 42 36 78 749 Sunday 2/6/2011 51 44 95 21 25 46 713
WEEKEND AVERAGE 43 39 82 32 31 62 731 Weekend Trip Rate
TSF 0.98 0.89 1.86 0.72 0.69 1.41 16.61
SUMMER WEEKDAY
Thursday 6/30/2011 1 4 5 12 13 25 -- Tuesday 7/5/2011 5 4 9 19 18 37 414 Wednesday 7/6/2011 8 13 21 8 9 17 536 Thursday 7/7/2011 2 10 12 14 25 39 601
SUMMER AVERAGE 4 8 12 13 16 30 517 Summer Trip Rate
TSF 0.09 0.18 0.27 0.30 0.37 0.67 11.75
Note: Site surveyed is Etnies Skate Park, Lake Forest (44,000 sq. ft. of skate park) AM Peak Hour of Adjacent Street Traffic = 7 – 9 AM PM Peak Hour of Adjacent Street Traffic = 4 – 6 PM Weekend counts show a mid-day peak hour, however peak hour of adjacent street traffic time frame was used in this analysis to maintain consistency.

Table D-2 Existing (2011) Weekday to Weekend Conversion Factors
North Leg East Leg South Leg West Leg Location SBL SBT SBR SB NB WBL WBT SBR WB EB NBL NBT NBR NB SB EBL EBT EBR EB WB AM Peak Hour 2010 Weekday Goldenwest St & Mcfadden
220 1490 70 1780 1300 180 550 140 870 810 100 1020 70 1190 1860 140 520 190 850 720
Gothard St & Center Ave
90 350 40 480 410 80 50 40 170 190 70 360 90 520 450 10 10 20 40 160
Goldenwest St Edinger Ave
190 1110 110 1410 1360 60 480 80 620 1290 130 1130 100 1360 1280 150 1000 110 1260 720
Gothard St & Edinger Ave
30 250 60 340 470 90 750 60 900 1070 110 340 100 550 490 70 940 150 1160 920
2010 Weekend Goldenwest St & Mcfadden 250 1320 80 1650 1770 170 310 220 700 880 90 1400 150 1640 1570 150 480 80 710 480 Gothard St & Center Ave 160 230 20 410 530 220 20 100 340 340 10 390 160 560 460 40 20 10 70 50 Goldenwest St Edinger Ave 370 1190 150 1710 1530 160 640 360 1160 1380 120 1010 170 1300 1450 160 840 100 1100 910 Gothard St & Edinger Ave 160 340 130 630 620 160 1070 160 1390 1560 120 360 250 730 640 100 1150 140 1390 1320 Increase Goldenwest St & Mcfadden
14% -11% 14% -7% 36% -6% -44% 57% -20% 9% -10% 37% 114% 38% -16% 7% -8% -58% -16% -33%
Gothard St & Center Ave
78% -34% -50% -15% 29% 175% -60% 150% 100% 79% -86% 8% 78% 8% 2% 300% 100% -50% 75% -69%
Goldenwest St Edinger Ave
95% 7% 36% 21% 13% 167% 33% 350% 87% 7% -8% -11% 70% -4% 13% 7% -16% -9% -13% 26%
Gothard St & Edinger Ave
433%
36% 117% 85% 32% 78% 43% 167% 124% 21% 9% 6% 150% 33% 31% 43% 22% -7% 10% 83%
PM Peak Hour 2010 Weekday Goldenwest St & Mcfadden
180 1480 70 1730 1740 220 470 290 980 860 100 1310 100 1510 1830 140 580 130 850 640
Gothard St & Center Ave
130 310 10 450 790 180 20 140 340 280 30 630 100 760 510 20 50 20 90 60
Goldenwest St Edinger Ave
210 1060 100 1370 1480 140 720 230 1090 960 160 1130 80 1370 1360 120 670 160 950 980
Gothard St & Edinger Ave
100 350 150 600 850 140 980 100 1220 1200 140 670 220 1030 630 80 880 140 1100 1270
2010 Weekend Goldenwest St & Mcfadden 250 1320 80 1650 1770 170 310 220 700 880 90 1400 150 1640 1570 150 480 80 710 480

Table D-2 Existing (2011) Weekday to Weekend Conversion Factors
North Leg East Leg South Leg West Leg Location SBL SBT SBR SB NB WBL WBT SBR WB EB NBL NBT NBR NB SB EBL EBT EBR EB WB Gothard St & Center Ave 160 230 20 410 530 220 20 100 340 340 10 390 160 560 460 40 20 10 70 50 Goldenwest St Edinger Ave 370 1190 150 1710 1530 160 640 360 1160 1380 120 1010 170 1300 1450 160 840 100 1100 910 Gothard St & Edinger Ave 160 340 130 630 620 160 1070 160 1390 1560 120 360 250 730 640 100 1150 140 1390 1320 Increase Goldenwest St & Mcfadden
39% -11% 14% -5% 2% -23% -34% -24% -29% 2% -10% 7% 50% 9% -14% 7% -17% -38% -16% -25%
Gothard St & Center Ave
23% -26% 100% -9% -33% 22% 0% -29% 0% 21% -67% -38% 60% -26% -10% 100% -60% -50% -22% -17%
Goldenwest St Edinger Ave
76% 12% 50% 25% 3% 14% -11% 57% 6% 44% -25% -11% 113% -5% 7% 33% 25% -38% 16% -7%
Gothard St & Edinger Ave
60% -3% -13% 5% -27% 14% 9% 60% 14% 30% -14% -46% 14% -29% 2% 25% 31% 0% 26% 4%

Table D-3 2035 WEEKDAY TO WEEKEND CONVERSION FACTORS
North Leg East Leg South Leg West Leg Location SBL SBT SBR SB NB WBL WBT SBR WB EB NBL NBT NBR NB SB EBL EBT EBR EB WB AM Peak Hour 2035 Weekday Goldenwest St & Mcfadden
230 1600 80 1910 1687 220 570 187 977 817 120 1340 80 1540 2020 160 507 200 867 770
Gothard St & Center Ave
140 473 130 743 533 80 96 110 286 250 170 383 100 653 573 40 10 20 70 396
Goldenwest St Edinger Ave
170 1330 120 1620 1610 79 757 120 956 1269 170 1320 150 1640 1519 170 949 110 1229 1047
Gothard St & Edinger Ave
90 388 245 723 753 100 1130 89 1319 1200 120 565 120 805 598 99 990 110 1199 1495
2035 Weekend Goldenwest St & Mcfadden
261 1417 91 1770 2305 208 321 294 823 901 108 1839 171 2119 1709 171 468 84 724 521
Gothard St & Center Ave
249 311 65 625 655 220 38 170 428 447 24 415 178 617 541 70 20 10 100 128
Goldenwest St Edinger Ave
331 1426 164 1921 1761 180 1009 400 1589 1383 157 1180 255 1592 1706 181 797 100 1078 1330
Gothard St & Edinger Ave
220 528 315 1063 929 178 1612 189 1979 1731 131 598 300 1029 808 141 1211 103 1455 2058
Increase Goldenwest St & Mcfadden
14% -11% 14% -7% 36% -6% -44% 57% -20% 9% -10% 37% 114% 38% -16% 7% -8% -58% -16% -33%
Gothard St & Center Ave
78% -34% -50% -15% 29% 175% -60% 150% 100% 79% -86% 8% 78% 8% 2% 300% 100% -50% 75% -69%
Goldenwest St Edinger Ave
95% 7% 36% 21% 13% 167% 33% 350% 87% 7% -8% -11% 70% -4% 13% 7% -16% -9% -13% 26%
Gothard St & Edinger Ave
433%
36% 117% 85% 32% 78% 43% 167% 124% 21% 9% 6% 150% 33% 31% 43% 22% -7% 10% 83%
PM Peak Hour 2035 Weekday Goldenwest St & Mcfadden
202 1730 70 2002 2039 230 456 269 955 959 110 1620 160 1890 2100 150 597 140 887 636
Gothard St & Center Ave
300 330 20 650 910 164 29 140 333 427 30 660 80 770 524 110 47 30 187 79
Goldenwest St Edinger Ave
200 1150 120 1470 1740 150 847 300 1297 1148 170 1190 99 1459 1460 250 849 160 1259 1137
Gothard St & Edinger Ave
57 471 147 675 780 150 1360 82 1592 1447 210 600 230 1040 771 98 1160 150 1408 1717
2035 Weekend Goldenwest St & Mcfadden
281 1543 80 1904 2096 178 301 204 683 1015 99 1731 240 2070 1807 161 494 86 741 480

Table D-3 2035 WEEKDAY TO WEEKEND CONVERSION FACTORS
North Leg East Leg South Leg West Leg Location SBL SBT SBR SB NB WBL WBT SBR WB EB NBL NBT NBR NB SB EBL EBT EBR EB WB Gothard St & Center Ave
369 245 40 654 729 200 29 100 329 516 10 409 128 547 460 220 19 15 254 79
Goldenwest St Edinger Ave
352 1291 180 1823 1867 171 753 470 1394 1627 128 1064 210 1402 1562 333 1064 100 1498 1060
Gothard St & Edinger Ave
91 458 127 676 576 171 1485 131 1788 1868 180 322 261 764 779 123 1516 150 1788 1792
Increase Goldenwest St & Mcfadden
39% -11% 14% -5% 2% -23% -34% -24% -29% 2% -10% 7% 50% 9% -14% 7% -17% -38% -16% -25%
Gothard St & Center Ave
23% -26% 100% -9% -33% 22% 0% -29% 0% 21% -67% -38% 60% -26% -10% 100% -60% -50% -22% -17%
Goldenwest St Edinger Ave
76% 12% 50% 25% 3% 14% -11% 57% 6% 44% -25% -11% 113% -5% 7% 33% 25% -38% 16% -7%
Gothard St & Edinger Ave
60% -3% -13% 5% -27% 14% 9% 60% 14% 30% -14% -46% 14% -29% 2% 25% 31% 0% 26% 4%

D-3

D-4

D-5

D-6

D-7
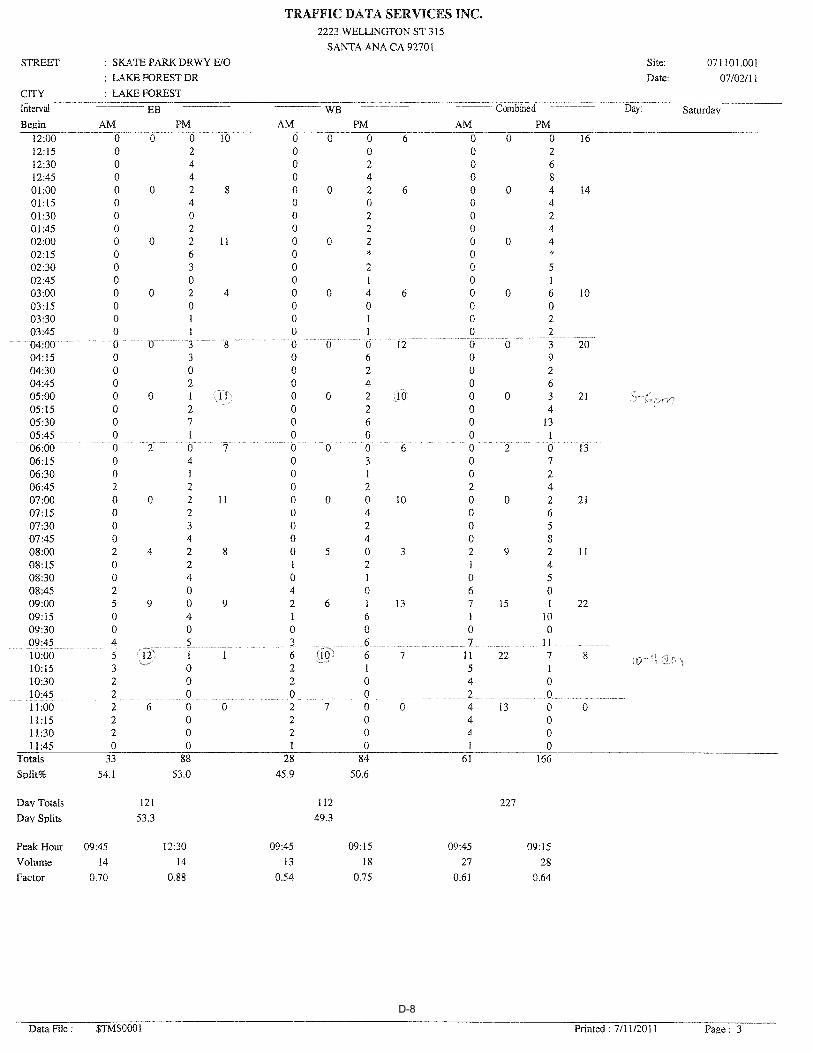
D-8
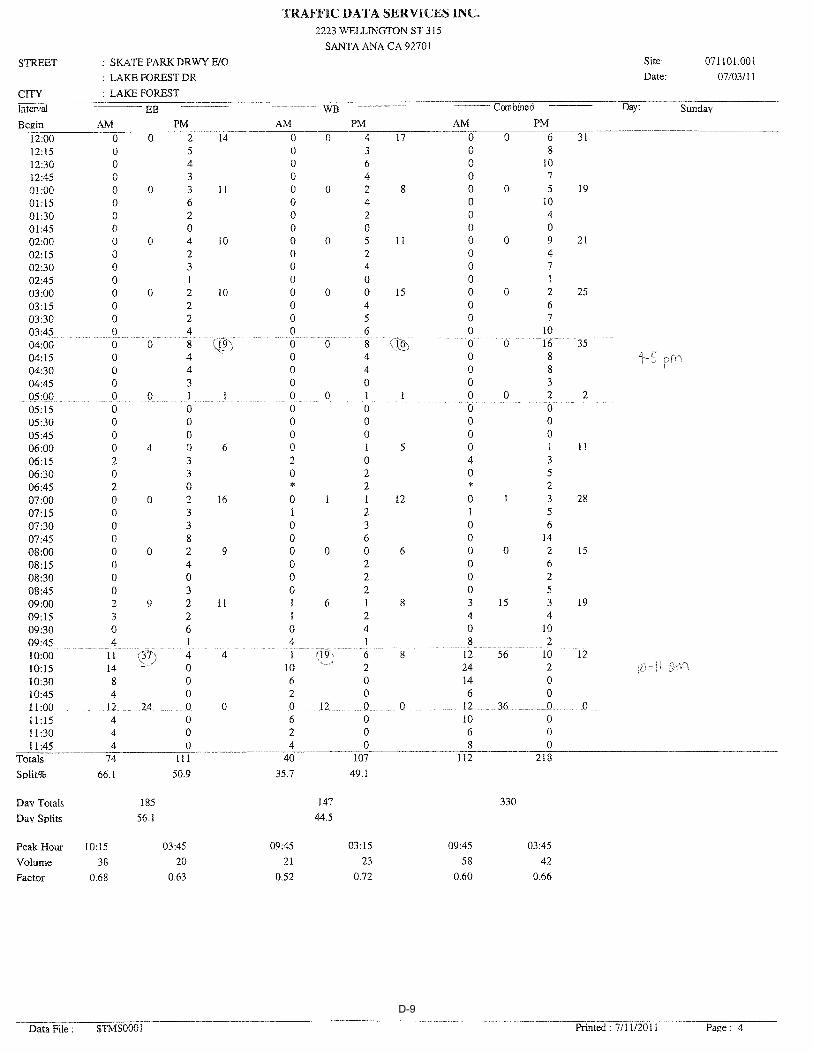
D-9

D-10
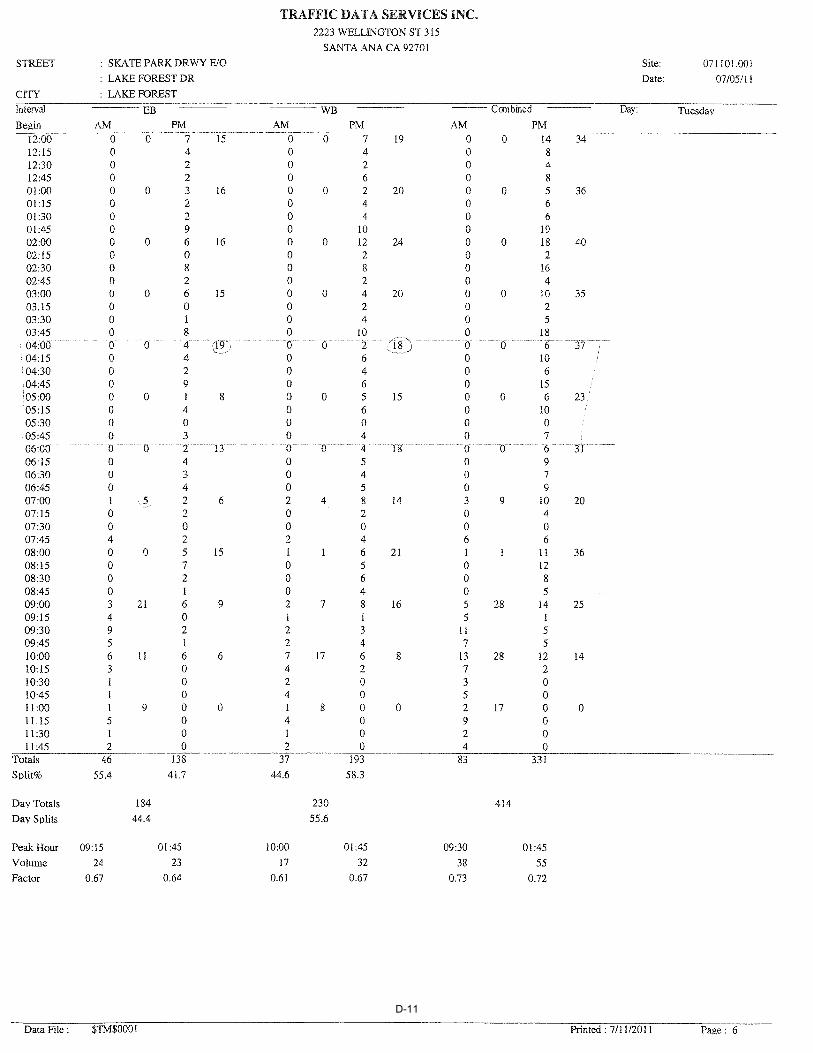
D-11

D-12

D-13

D-14

City of Huntington Beach E-1 Austin-Foust Associates, Inc. Center Avenue Skate Park 503008rpt.doc
Appendix E PROJECT SHARE CONTRIBUTION
WORKSHEETS

Table E-12016 INTERSECTION V/C EVALUATION(NO PROJECT VERSUS WITH PROJECT)
Jurisdiction Move Lanes Volume ICU Move Lanes Volume ICU
NBT 3 1 0.000
SBL 1 0 0.000
HuntingtonEBL 2 0 0.000
BeachWBT 2 0 0.000
WBR 1 0 0.000
Total 0.000
NBT 3 1 0.000
SBL 2 0 0.000
HuntingtonEBL 2 0 0.000
BeachWBT 2 1 0.000
Total 0.000
8 Goldenwest St & Bolsa Ave
28 Beach Blvd & Edinger Ave
AM PEAK HOUR PM PEAK HOURInt.# LOCATION
City of Huntington BeachCenter Ave Skate Park E-2
Austin-Foust Associates503008rpt AppendixE.xls(2016)
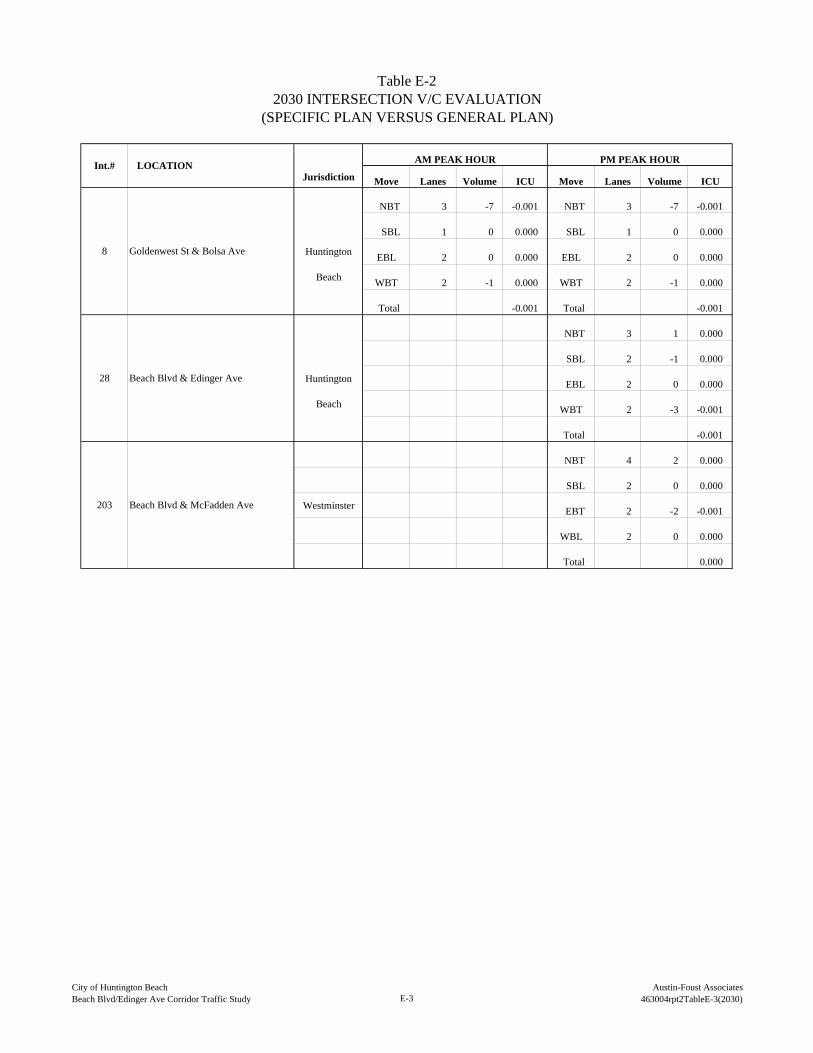
Table E-22030 INTERSECTION V/C EVALUATION
(SPECIFIC PLAN VERSUS GENERAL PLAN)
Jurisdiction Move Lanes Volume ICU Move Lanes Volume ICU
NBT 3 -7 -0.001 NBT 3 -7 -0.001
SBL 1 0 0.000 SBL 1 0 0.000
HuntingtonEBL 2 0 0.000 EBL 2 0 0.000
BeachWBT 2 -1 0.000 WBT 2 -1 0.000
Total -0.001 Total -0.001
NBT 3 1 0.000
SBL 2 -1 0.000
HuntingtonEBL 2 0 0.000
BeachWBT 2 -3 -0.001
Total -0.001
NBT 4 2 0.000
SBL 2 0 0.000
WestminsterEBT 2 -2 -0.001
WBL 2 0 0.000
Total 0.000
203 Beach Blvd & McFadden Ave
AM PEAK HOUR PM PEAK HOURInt.# LOCATION
8 Goldenwest St & Bolsa Ave
28 Beach Blvd & Edinger Ave
City of Huntington BeachBeach Blvd/Edinger Ave Corridor Traffic Study E-3
Austin-Foust Associates463004rpt2TableE-3(2030)

Table E-32030 INTERSECTION V/C EVALUATION FOR CUMULATIVE DEFICIENCIES
Jurisdiction Move Lanes Volume ICU Move Lanes Volume ICU
NBT 3 0 0.000 NBT 3 1 0.000
SBL 1 0 0.000 SBL 1 0 0.000
HuntingtonEBL 2 0 0.000 EBL 2 0 0.000
BeachWBT 3 0 0.000 WBT 3 0 0.000
Total 0.000 Total 0.000
NBT 3 1 0.000
SBL 2 0 0.000
Huntington EBL 2 0 0.000
Beach WBT 2 1 0.000
Total 0.000
NBT 4 2 0.000
SBL 1 0 0.000
Westminster EBL 1 1 0.001
WBT 2 0 0.000
Total 0.001
AM PEAK HOUR PM PEAK HOURInt.# LOCATION
203 Beach Blvd McFadden Ave
8 Goldenwest St & Bolsa Ave
28 Beach Blvd & Edinger Ave
City of Huntington BeachBeach Blvd/Edinger Ave Corridor Traffic Study E-4
Austin-Foust Associates463004rpt2TableE-3(2030 Cumulative)