Embed Size (px)
Citation preview

Ministry of Transport and Energy
Danish Road InstituteReport 1512007
Noise Control through Traffi c Flow Measures- Effects and Benefi ts

Reports published by the Danish Road Directorate
can be requested from the bookshop:
Telephone +45 4322 7300
Telefax +45 4363 1969
e-mail [email protected]
Road Directorate
Guldalderen 12
DK-2640 Hedehusene
Denmark
Telephone +45 7244 7000
Telefax +45 7244 7105
Roadinstitute.dk
Title Noise Control through Traffi c Flow Measures
- Effects and Benefi ts
Dated Marts 2007
Author Lars Ellebjerg Larsen
Published by Road Directorate, Danish Road Institute
Copyright Road Directorate, All rights reserved
Photo Lars Ellebjerg Larsen
Print Electronic
ISSN electronic 0909-1386
ISBN electronic 978-87-91177-99-6

Danish Road InstituteReport 1512007
Lars Ellebjerg
Noise Control through Traffi c Flow Measures
Ministry of Transport and Energy
- Effects and Benefi ts

xx

3
Contents
Preface .......................................................................................................................... 5Forord .......................................................................................................................... 6Summary ...................................................................................................................... 71. Introduction ........................................................................................................... 11
1.1 The report contents............................................................................................ 121.2 Noise metrics..................................................................................................... 12
2. Basic traffic – noise relations................................................................................ 142.1 Traffic volume................................................................................................... 142.2 Traffic composition ........................................................................................... 152.3 Speed and noise................................................................................................. 17
3. Traffic flow measures – effects on driving pattern, noise emission and annoyance................................................................................................................... 23
3.1 Traffic calming.................................................................................................. 233.2 Junctions............................................................................................................ 363.3 Dedicated lanes ................................................................................................. 413.4 Signs.................................................................................................................. 423.5 Automatic traffic control – ATC....................................................................... 453.6 Other measures.................................................................................................. 46
4. Catalogue of measures .......................................................................................... 485. Conclusions ............................................................................................................ 53
5.1 Traffic volume................................................................................................... 535.2 Traffic composition ........................................................................................... 535.3 Speed reductions ............................................................................................... 545.4 Driving pattern .................................................................................................. 545.5 Research needs .................................................................................................. 54
References .................................................................................................................. 56

4

5
Preface
This report was originally written as part of Work package H1: “Methods for Noise Control by Traffic Management” in the EU project SILENCE [Ellebjerg, 2007]. The aim of the work package is to produce a toolkit to advise city authorities on types and packages of traffic flow management and driver training measures which can be used to reduce noise from road traffic. The report presents the initial work on assessing the effect of individual traffic flow measures on traffic flow noise emissions.
The basis of the report is a thorough literature study of the effects of various traffic flow measures on traffic flow and noise.
The report was written by Lars Ellebjerg from the Danish Road Institute/Road Directorate (DRI). Hans Bendtsen from DRI has performed quality control of the report. The author wishes to thank the members of the SILENCE sub-project H, who have contributed to this publication with their knowledge and advice. Thank you to:
Michel Bérengier (LCPC). Truls Berge (SINTEF). Roberta Cafiero (UPPUMT). Emma Johansson (Volvo Technology). Steven Riley (BCC). Lluis Ros (DSD). Laurent Rosa (RATP). Rein Schandersson (VTI). Pierre Schmitz (AED-DTS). Heinz Steven (RWTUEV). Karen Vancluysen (POLIS).

6
Forord
Denne rapport er skrevet som en del af arbejdspakke H1: ”Methods for Noise Control by Traffic Management” i EU-projektet SILENCE. [Ellebjerg, 2007]. Målet med den-ne arbejdspakke er at udarbejde en værktøjskasse, der kan hjælpe myndigheder i byer med at reducere støj fra vejtrafik gennem forskellige typer og kombinationer af trafik-ledelsestiltag og uddannelse af chauffører. Denne rapport præsenterer det indledende arbejde med at vurdere effekten af individuelle trafikledelsestiltag på trafikkens støjemissioner.
Rapporten er skrevet af Lars Ellebjerg fra Vejdirektoratet – Vejteknisk Institut. Hans Bendtsen har kvalitetssikret rapporten. Forfatteren takker medlemmerne af SILENCE del-projekt H, som har bidraget til rapporten med deres viden og gode råd. Tak til:
Michel Bérengier (LCPC). Truls Berge (SINTEF). Roberta Cafiero (UPPUMT). Emma Johansson (Volvo Technology). Steven Riley (BCC). Lluis Ros (DSD). Laurent Rosa (RATP). Rein Schandersson (VTI). Pierre Schmitz (AED-DTS). Heinz Steven (RWTUEV). Karen Vancluysen (POLIS).

7
Summary
Traffic flow measures are usually implemented to improve traffic flow, traffic safety and/or to environmentally improve a neighborhood. The latter may include noise considerations, but it is seldom the main issue when establishing traffic calming, home zones and similar initiatives which may reduce the traffic volumes on streets and in areas with dwellings. In some cases the response of those living along the road may be that the noise situation has in fact deteriorated when various trafficflow measures are implemented.
In this report traffic flow measures are assessed not only with regards to their impact on noise levels, but also their effect on the annoyance experienced by those living along the road. Although noise regulation and abatement for practical reasons is based on noise levels, the overall aim must be to reduce the annoyance, sleep disturbance and adverse health effects that the noise may cause. These effects should therefore be considered in any scheme.
Measures aimed at reducing the traffic volume is one way of reducing noise. On minor roads this may be an effective measure if traffic can be moved through impeding through traffic. The road may be closed completely, or such traffic may be discouraged through the use of humps, chicanes or other traffic calming measures. Humps should preferably be round-top or in the form of narrow speed cushions.
On major roads reductions in traffic volumes are rarely feasible solutions to noise problems. In specific cases it may be possible through building a by-pass around a town or an area, or through parking information systems, if circulating vehicles looking for parking constitute a large percentage of the traffic. Congestion charging may reduce traffic volumes, but results indicate that there is little or no effect on noise levels.
Although heavy vehicles and motorcycles are noisier than cars, cars often dominate the LAeq levels. Even when this is the case, the noisier vehicles produce noise peaks which may cause annoyance, disturbance and/or awakening. Noise from heavy vehicles may be reduced through moving them to less vulnerable roads and areas, or through city logistics initiatives, which concentrate freight in a city on fewer vehicles. Nighttime bans or charging on heavy vehicles and perhaps motorcycles may reduce problems of sleep disturbance but are likely to move some of the traffic to the daytime and thus may worsen problems of disturbance and annoyance.

8
Speed reductions are a way of reducing traffic noise, providing that the necessary measures do not lead to an increase in accelerations and decelerations. For both light and heavy vehicles the largest reductions are achieved at low speeds. At speeds below 50 km/h, noise reductions of 2-3 dB LAeq are realistic as a result of 10 km/h reductions in actual speeds. A number of traffic claming measures may be used to reduce speeds on minor and in some cases also on major roads, but on many large urban roads, most traditional traffic calming measures are inapplicable. On such roads, speed limits enforced through automatic traffic control (ATC) or by police enforcement is the main measure available. Calming green waves may also be a possibility, but this needs to be confirmed.
Stop-and-go driving leads to higher noise emissions, because accelerating vehicles make more noise than vehicles driving at a steady pace. Several surveys have shown that roundabouts lead to less noise than intersections with or without signalization. This is to a large extent because more vehicles can pass without having to come to a complete stand-still. Coordinated signalization in the form of calming green waves may also be a measure to secure more even driving patterns. This needs further testing.
There is a need for further research in finding the optimal distance between various traffic flow measures in order for traffic to maintain a steady speed. For chicanes and road narrowing there is also a need for further knowledge about the noise and annoyance effects, especially when various forms of overrun areas are used in chicanes. The effects of various layouts of junctions on noise and annoyance also needs clarification. Calming green waves appear to be a promising measure for securing even driving patterns at low speed, and thus also for noise reduction.The initial results found in the literature merits further surveys to clarify the potential. ‘Rest on red’ and ‘rest on green’ signalizing schemes may have potential for noise reduction. This should be studied further.

9
Sammenfatning
Tiltag til at påvirke trafikafvikling har sædvanligvis til formål at øge vejes kapacitet eller at forbedre trafiksikkerheden og/eller nærmiljøet i et område. Det sidste formål kan omfatte trafikstøj, men støj er sjældent hovedformålet, når der trafiksaneres eller på anden måde gennemføres tiltag, som kan reducere trafikmængden på gader og i områder med boliger. I nogle tilfælde kan reaktionerne fra de personer, som bor langs vejene, være, at støjsituationen ligefrem er forværret i forbindelse med gennemførel-sen af forskellige former for trafikafviklingstiltag.
I denne rapport vurderes trafikafviklingstiltag ikke kun ud fra deres indflydelse på støjemissionerne fra trafikken, men også ud fra deres effekt på den oplevede støjgene hos de personer, som bor langs vejen. Selv om regulering og bekæmpelse af trafikstøj af praktiske grunde er baseret på støjniveauer, må det overordnede mål være at reduce-re støjgener, søvnforstyrrelser og negative helbredseffekter, som støjen forårsager. Disse effekter bør derfor overvejes i forbindelse med et hvert trafikafviklingstiltag.
Tiltag rettet mod reduktion af mængden af trafik er en måde at reducere støj. På min-dre veje kan dette være effektivt, hvis trafik kan flyttes ved at hindre gennemfartstra-fik. Vejen kan lukkes helt, eller den kan gøres mindre attraktiv som gennemfart ved hjælp af bump, chikaner eller andre former for trafiksanering. Bump bør være cirkel- eller sinusformede eller udformes som smalle pudebump.
På større veje er reduktioner i trafikmængden sjældent en farbar vej til løsning af støj-problemer. I enkelte tilfælde kan det være muligt at reducere trafikmængder ved at bygge en omfartsvej, eller det kan gøres med parkeringsinformationssystemer, hvis en stor del af trafikken udgøres af biler, der cirkulerer og leder efter parkering. Bompen-ge og road pricing kan føre til reducerede trafikmængder, men erfaringerne viser, at det har begrænset eller ingen effekt på støjniveauerne fra trafikken.
Tunge køretøjer og motorcykler støjer mere end personbiler, men alligevel er det nor-malt personbilerne der er afgørende for LAeq-niveauerne. Selvom dette er tilfældet, er de mere støjende tunge køretøjer og motorcykler årsag til maksimalniveauer som kan forårsage gene, forstyrrelse og/eller opvågnen. Støj fra tunge køretøjer kan reduceres ved at flytte trafikken til mindre følsomme veje og områder eller gennem citylogistik, som koncentrerer godsmængden i en by på færre køretøjer. Nat-forbud eller -afgifter for tunge køretøjer og eventuelt motorcykler kan reducere problemer med søvnforstyr-relser. Sådanne tiltag vil imidlertid formentlig flytte en del af trafikken til om dagen, hvilket kan forværre problemer med forstyrrelser og gene.

10
Hastighedsreduktioner kan reducere trafikstøj under forudsætning af, at de nødvendige tiltag ikke fører til stigninger i omfanget af accelerationer og opbremsninger. Både for lette og tunge køretøjer opnås de største støjreduktioner ved lave hastigheder. Ved ha-stigheder under 50 km/t er det realistisk at opnå støjreduktioner på 2-3 dB LAeq som resultat af en reduktion i den reelle hastighed på 10 km/t. En række trafiksaneringsvir-kemidler kan bruges til at reducere hastigheder på mindre – og i nogle tilfælde også større – veje, men på mange større veje i byer kan de fleste trafiksaneringsvirkemidler ikke bruges. På sådanne veje er hastighedsbegrænsninger, som håndhæves med auto-matisk trafikkontrol (ATC) eller af politiet, det primære virkemiddel, som er til rådig-hed. Hastighedsdæmpende grønne bølger kan også være en mulighed, men dette bør undersøges nærmere.
Kørsel med ujævn hastighed fører til højere støjemissioner, fordi accelererende køre-tøjer støjer mere end køretøjer, der kører med jævn fart. Flere undersøgelser har vist, at rundkørsler giver mindre støj end kryds med eller uden lysregulering. Dette skyldes i høj grad, at flere køretøjer kan passere uden at skulle stoppe helt op. Koordinerede signaler i form af hastighedsdæmpende grønne bølger kan også være et middel til at sikre jævnere køremønstre. Dette bør undersøges nærmere.
Der er behov for yderligere undersøgelser for at finde den optimale afstand mellem forskellige former for trafiksaneringsvirkemidler for at sikre en trafikafvikling med jævn hastighed. For chikaner og vejindsnævringer er der også behov for mere viden om effekten på støj og støjgene, ikke mindst når forskellige former for overkørselsare-aler benyttes i chikaner. Effekten af forskellige former for krydsudformning på støj og gene bør også undersøges yderligere. Hastighedsdæmpende grønne bølger fremtræder umiddelbart som et lovende middel til at sikre jævne kørselsmønstre ved lave hastig-heder, og dermed som et middel til at reducere trafikstøj. De resultater, som er fundet i litteraturen, lægger op til yderligere undersøgelser for at vise potentialet. ’Rød hvile’1
og ’præference’2 ved signalanlæg kan have potentialer for støjreduktion. Det bør un-dersøges nærmere.
1 Signalanlægget viser rødt i alle retninger, indtil en retning bliver aktiveret. 2 Signalet viser grønt for hovedfærdselsretningen, indtil den sekundære retning bliver aktiveret.

11
1. Introduction
According to the European Commission Green Paper on noise “around 20 percent of the Union’s population or close to 80 million people suffer from noise levels that scientists and health experts consider to be unacceptable, where most people become annoyed, where sleep is disturbed and where adverse health effects are to be feared. An additional 170 million citizens are living in so-called ‘gray areas’ where the noise levels are such to cause serious annoyance during the daytime” [EC, 1996, p. 2]. The majority of these people are subjected to noise from road traffic.
The noise emission limits for new vehicles have been tightened over the years without this resulting in lower noise levels along the roads. The need for means to reduce road traffic noise is therefore great. The choice of pavements is one aspect in controlling the noise emissions from road traffic, and the choice of tire is an important factor for the emission from individual vehicles. Both of these aspects are included in the SILENCE project in sub-projects C and F.
Traffic flow is also a factor – in addition to vehicle, tire and road design – in deciding traffic noise emission levels. A steady traffic flow without accelerations and decelera-tions help reduce noise, as does speed reductions, reductions in the percentage heavy vehicles and reductions in overall traffic levels. None of these approaches providesolutions to noise problems when used individually, as the effect of each of them is usually limited to a few dB, but by combining various traffic flow measures with measures aimed at roads, vehicles and tires, it should be possible to achieve substan-tial noise reductions.
The use of traffic flow measures to reduce noise from road traffic is the subject of SILENCE Sub-project H. Work package H1, of which this report is a part, focuseson methods for noise control by traffic management. Together with WP H2 (roadside and in-service noise test methods) and WP H3 (driver assistance systems for quiet vehicle operation), this work package will produce a toolkit which can be used by authorities to reduce noise from road traffic through initiatives aimed at the traffic flow. This report, which is based on a thorough literature study, assesses the effective-ness and benefits of various traffic flow measures on noise control.
Traffic flow measures are usually implemented to improve traffic flow, traffic safety and/or to environmentally improve a neighborhood. The latter may include noise considerations, but it is seldom the main issue when establishing traffic calming, home zones and similar initiatives which may reduce the traffic volumes on streets and in areas with dwellings. In some cases the response of those living along the road may be that the noise situation has in fact deteriorated when various trafficflow measures are implemented.

12
In this report traffic flow measures are assessed not only with regards to their impact on noise levels, but also their effect on the annoyance experienced by those living along the road. Although noise regulation and abatement for practical reasons is based on noise levels, the overall aim must be to reduce the annoyance, sleep disturbance and adverse health effects that the noise may cause. These effects should therefore be considered in any scheme.
1.1 The report contents In Chapter 2 basic traffic noise relations are presented. These relations regarding traffic volume, speed, acceleration and composition are necessary to evaluate the effect on noise levels of various traffic flow measures.
Chapter 3 reviews surveys on the effect of various measures on traffic flow, noise levels and annoyance. For some measures, few results of such surveys have been reported, and the conclusions to be drawn are therefore sparse for these measures. For other measures the effects are highly dependent on local conditions as to the road network layout, traffic composition and other physical and traffic related parameters. The effects of such measures can only be described in general terms based on the relations presented in Chapter 2. The specific noise and annoyance effect will have to be assessed from case to case based on the effects on traffic. This could be measures such as parking control systems or nighttime bans on trucks.
A catalogue of the various measures and their effects is presented in Chapter 4 and Chapter 5 draws up some general conclusions on the findings in the report.
1.2 Noise metrics The literature studied in preparation of this report uses a variety of noise metrics. These are:
LAeq,T or just LAeq, which is the energy equivalent A-weighted sound pressure level during the period T. This is the constant sound level which during the period T produces the same sound energy as the varying sound levels from the traffic. LDEN
which is used for noise mapping according to the European Noise Directive (2002/49/EC) is based on LAeq.LAE or SEL (Sound Exposure Level), which is the total sound energy over a period (for example the duration of a single noise event) normalized to a duration of 1 second. LAeq,T = LAE – 10 log T, where T is given in seconds. LAmax or LAFmax, which is the maximum sound level produced by a single event (in this case the passing of a vehicle) with time weighting “F”, corresponding to an av-eraging time of 0.25 seconds. L10, which is the sound pressure level exceeded 10 percent of the time.

13
It is not possible to directly compare these different metrics. LAeq and LAE for the same event will differ in level, but a change of 1 dB in LAeq will also be a change of 1 dB in LAE. Changes in sound pressure levels will usually correlate for all four metrics, but changes in LAmax and L10 will in general not be of the same magnitude as changes in LAeq and LAE, and there may be situations where a short impulsive noise event changes LAmax without significantly influencing the other metrics.
All sound pressure levels are referred to the reference sound pressure 20 Pa.
14
2. Basic traffic – noise relations
When evaluating the noise effect of various traffic management measures, there are four common parameters to take into account: traffic volume and composition, speed and driving pattern. The traffic volume may change on a road because traffic is moved from one road to another, or it may change because the implemented measures dis-courage or encourage people from driving altogether. Trips may not be taken at all, or there may be a change in modal split because private cars become more or less attractive compared with public transportation, bicycles or walking.
Reducing speed and thereby improving traffic safety is often a major reason for the implementation of a number of the traffic flow measures, which are included in this report. Even in cases where this is not the aim, changes in driving speed are likely to occur as an effect of changes to traffic volume, composition and road layout. These factors and various measures in themselves are also likely to affect the driving pattern, causing an increase or decrease in the accelerations, stop-and-go driving, etc.
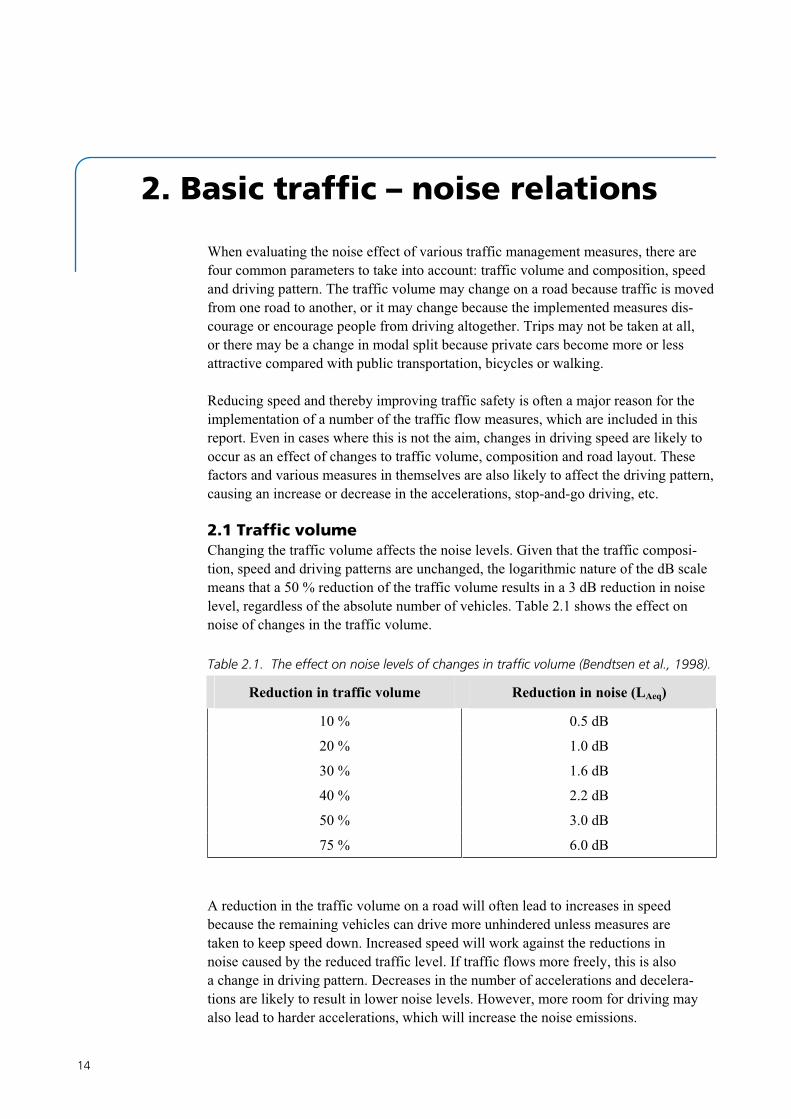
2.1 Traffic volume Changing the traffic volume affects the noise levels. Given that the traffic composi-tion, speed and driving patterns are unchanged, the logarithmic nature of the dB scale means that a 50 % reduction of the traffic volume results in a 3 dB reduction in noise level, regardless of the absolute number of vehicles. Table 2.1 shows the effect on noise of changes in the traffic volume.
Table 2.1. The effect on noise levels of changes in traffic volume (Bendtsen et al., 1998).
Reduction in traffic volume Reduction in noise (LAeq)
10 % 0.5 dB
20 % 1.0 dB
30 % 1.6 dB
40 % 2.2 dB
50 % 3.0 dB
75 % 6.0 dB
A reduction in the traffic volume on a road will often lead to increases in speed because the remaining vehicles can drive more unhindered unless measures are taken to keep speed down. Increased speed will work against the reductions in noise caused by the reduced traffic level. If traffic flows more freely, this is also a change in driving pattern. Decreases in the number of accelerations and decelera-tions are likely to result in lower noise levels. However, more room for driving may also lead to harder accelerations, which will increase the noise emissions.
15
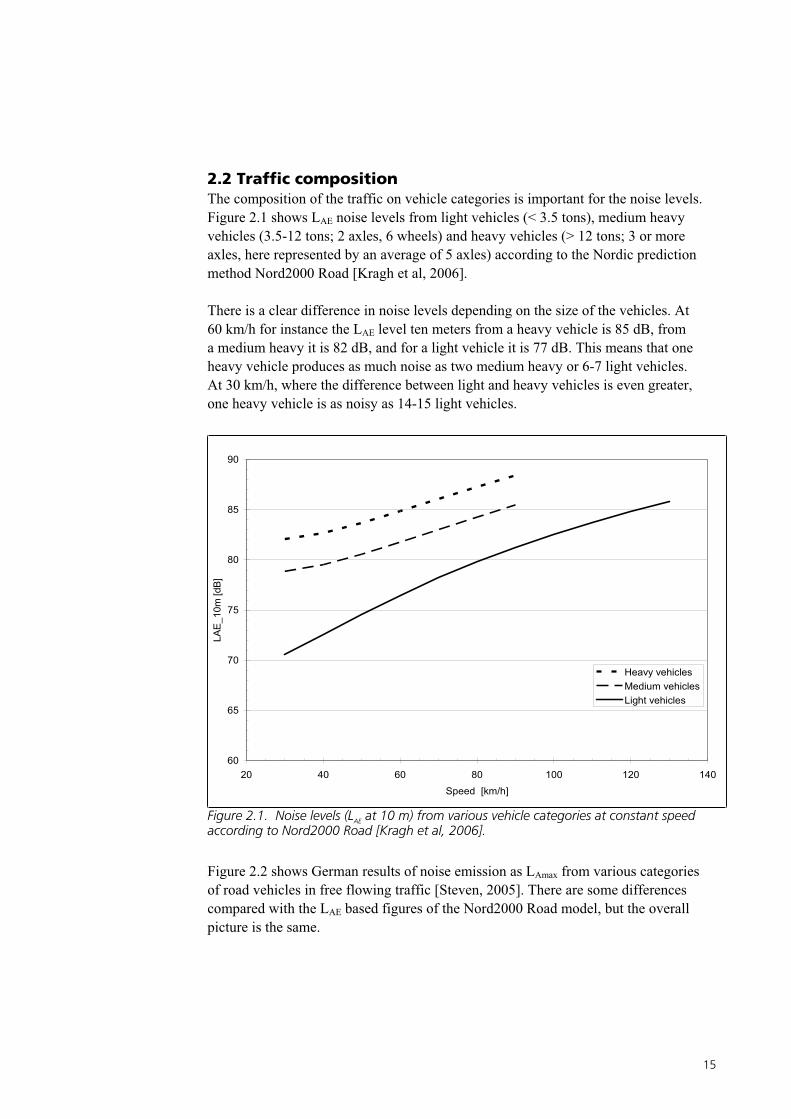
2.2 Traffic composition The composition of the traffic on vehicle categories is important for the noise levels. Figure 2.1 shows LAE noise levels from light vehicles (< 3.5 tons), medium heavy vehicles (3.5-12 tons; 2 axles, 6 wheels) and heavy vehicles (> 12 tons; 3 or more axles, here represented by an average of 5 axles) according to the Nordic prediction method Nord2000 Road [Kragh et al, 2006].
There is a clear difference in noise levels depending on the size of the vehicles. At 60 km/h for instance the LAE level ten meters from a heavy vehicle is 85 dB, from a medium heavy it is 82 dB, and for a light vehicle it is 77 dB. This means that one heavy vehicle produces as much noise as two medium heavy or 6-7 light vehicles. At 30 km/h, where the difference between light and heavy vehicles is even greater, one heavy vehicle is as noisy as 14-15 light vehicles.
60
65
70
75
80
85
90
20 40 60 80 100 120 140
Speed [km/h]
LAE
_10m
[dB
]
Heavy vehiclesMedium vehiclesLight vehicles
Figure 2.1. Noise levels (LAE at 10 m) from various vehicle categories at constant speed according to Nord2000 Road [Kragh et al, 2006].
Figure 2.2 shows German results of noise emission as LAmax from various categories of road vehicles in free flowing traffic [Steven, 2005]. There are some differences compared with the LAE based figures of the Nord2000 Road model, but the overall picture is the same.

16
In reality the effect of the heavy vehicles is usually not as important as these figures suggest. On most urban roads, the heavy vehicles only account for a small percentage of the total traffic. In combination with the usually higher speed of the light vehicles, the effect is that the light vehicles usually dominate the noise emissions. On most high speed roads – especially on motorways – the speed of the light vehicles is considerably higher, and these therefore also dominate the noise emission in these situations even though the percentages heavy vehicles often are fairly high. Only in cases with very high percentages heavy vehicles and/or small or no difference in the speed of light and heavy vehicles will the heavy vehicles dominate the LAeq levels from a road.
Although the heavy vehicles usually do not dominate the noise emissions given as LAeq, they represent peaks in the emitted noise which may annoy and disturb those living, working, walking or leisuring along the road. At night the peak levels caused by the heavy vehicles represent noise events which may wake up people living along the road. According to Griefahn (1985, 1992) the awakening frequency increases with increasing number of noise events exceeding a certain LAmax level up events per night (Figure 2.3).
60
65
70
75
80
85
90
95
0 20 40 60 80 100 120 140 160 180 200
vehicle speed in km/h
aver
age
Lmax
in d
B(A)
carsLDVHDV up to 3 axlesHDV more than 3 axlespublic transport busesmotorcyclesmopedsHDV, Pn < 75 kWHDV, 75 kW <= Pn < 150 kWHDV, 150 kW <= Pn < 250 kWHDV, Pn >= 250 kW
Figure 2.2. Average LAmax values for different vehicle categories and freeflowing traffic [Steven, 2005]. LDV is light goods vehicle (a van), HDV is heavy goods vehicle (a truck).

17
Figure 2.3. Number of awakenings as a function of the number of noise events per night [Griefahn, 1985; Griefahn, 1992].
2.3 Speed and noise Figure 2.1 and Figure 2.2 show the relations between speed and noise levels for various vehicle categories under conditions of free flowing traffic. Figure 2.4 shows the emissions of a single vehicle – a compact car – during acceleration. The propul-sion noise (Lprop) increases with increasing engine revolutions. That is, it increases with increasing speed within the same gear, but drops when the driver shifts to a higher gear. There is, however, also an overall tendency towards increasing noise levels at higher gears, and thereby at higher speed.
In the source model of the road traffic noise model, which was developed in the EU project HARMONOISE, default propulsion noise is given by the equation [Jonasson et al, 2004]:
ref
refPPWR v
vvfbfafL ,
where aP(f) and bP(f) are specific coefficients for each -octave band.

18
Thus, in the HARMONOISE model there is also a clear engine noise dependency on the driving speed. The equation is valid for free flowing traffic at constant speed. Cal-culations are done in octave bands. The model does not include engine speed, as this would not be practical in a noise model of this sort. This information usually is not available when modeling overall noise levels from the traffic flow on a road.
50
55
60
65
70
75
80
85
0 5 10 15 20 25 30
time in s
Lmax
in d
B(A
)
0
20
40
60
80
100
120
140
160
180
200
vehi
cle
spee
d in
km
/h
LrollLpropLprop_wotLtot, aveLtot_wot, avev, ave
constant speed
full load
compact car, 81 kW, average driving behaviour
Figure 2.4. Contribution of vehicle noise sources during acceleration, exemplified by a compact car. The dotted lines are the noise from the accelerating car. The fully drawn lines show the noise level as it would be at the given speed without acceleration. The line labeled ‘v, ave’ shows the vehicle speed. [Steven, 2006].
The tire/road noise – the rolling noise (Lroll) – increases with increasing speed. The noise level depends on the tires and the type and aggregate size of the road surface. An example of the dependency on pavement type from Nord2000 Road is given in. Figure 2.5 In the HARMONOISE model, default tire/road noise based on an average of DAC0/11 and SMA0/113 pavements at 20°C is given by the equation [Jonasson et al, 2004]:
refRRWR v
vfbfafL lg ,
where aR(f) and bR(f) are specific coefficients for each -octave band.
As for the propulsion noise, the noise levels are calculated separately for each octave band. A simpler way in this context to present the effect of changes in speedis therefore to use the results derived by Andersen (2003) from measurements of more than 4000 vehicles carried out in 1999 and 2000. The effect of speed changes (driving with constant speed) is given in 10 km/h intervals in Table 2.2.
3 Dense Asphalt Concrete and Stone Mastic Asphalt with 0-11 mm aggregate.

19
The speed reductions in the table are actual reductions, not changes in speed limits. The overall effect will depend on the share of light and heavy vehicles in the total traffic.
-2
-1
0
1
2
8 9 10 11 12 13 14 15 16
SMADAC
Correction [dB]
Max. aggregate [mm]
Figure 2.5. Correction Lsurface for maximum aggregate size for SMA and DAC pavements according to Nord2000 Road [Kragh et al, 2006].
Table 2.2. The effect of speed reductions on noise [Andersen, 2003. p. 15 and p. 21].
Reduction in speed Noise reduction (LAE, dB) from light vehicles
Noise reduction (LAE, dB) from heavy vehicles
From 130 to 120 km/h 1.0 - From 120 to 110 km/h 1.1 - From 110 to 100 km/h 1.2 - From 100 to 90 km/h 1.3 1.0 From 90 to 80 km/h 1.5 1.1 From 80 to 70 km/h 1.7 1.2 From 70 to 60 km/h 1.9 1.4 From 60 to 50 km/h 2.3 1.7 From 50 to 40 km/h 2.8 2.1 From 40 to 30 km/h 3.6 2.7

20
2.4 Uneven driving and noise The effect of the driving pattern on noise is important to take into account when evaluating the noise effect of various traffic management measures. Installing road humps, changing the layout of road sections and intersections, setting up signs of speed reduction, etc. are all initiatives which are likely to change the way people drive. This may cause an increase or decrease in the number and intensity of accelera-tions and decelerations. As can be seen in Figure 2.6 there is a correlation between acceleration and noise for passenger cars. For low speeds around 30 km/h the average noise increase due to ac-celeration is 2 dB. For normal urban speeds around 50 to 60 km/h the increase due to acceleration is 1 to 1.5 dB. At high speeds the increase is marginal. In each individual case the noise increase depends on the level of acceleration.
y = 13.257Ln(x) + 20.624R2 = 0.908
y = 12.161Ln(x) + 26.308R2 = 0.7082
55
60
65
70
75
80
85
90
95
0 20 40 60 80 100 120 140 160 180 200
vehicle speed in km/h
Lmax
in d
B(A
)
cars, free flowing traffic
cars, accelerating vehicles
Logarithmisch (cars, free flowing traffic)
Logarithmisch (cars, accelerating vehicles)
Figure 2.6. Lmax values versus vehicle speed for cars in free flowing traffic and during acceleration. The measurements have been done on actual traffic [Steven, 2005].
Similar relations are drawn by Steven (2005) for light goods vehicles (LGV), heavy goods vehicles (HGV) with power ratings below 75 kW, between 75 and 150 kW, be-tween 150 and 250 kW and higher than 250 kW. The same tendency to an increase in noise during acceleration is seen for all these vehicle categories. The differences at 30 and 50 km/h can be seen in Table 2.3. This is also seen when comparing figure 2.7 with Figure 2.2.

21
Table 2.3. Differences in noise emissions between accelerating vehicles and vehicles driving at steady speed at 30 and 50 km/h [Steven, 2005].
Vehicle category At 30 km/h At 50 km/h
Car 2.0 1.4 LGV 3.5 2.3 HGV, Pn < 75 kW 4.4 3.5 HGV, 75 kW Pn < 150 kW 4.4 3.6 HGV, 150 kW Pn < 250 kW 3.5 3.0 HGV, Pn 250 kW 3.5 2.7
60
65
70
75
80
85
90
95
0 10 20 30 40 50 60 70 80 90 100vehicle speed in km/h
aver
age
Lmax
in d
B(A
)
cars LDVHDV up to 3 axles HDV more than 3 axlespublic transport buses HDV, Pn < 75 kWHDV, 75 kW <= Pn < 150 kW HDV, 150 kW <= Pn < 250 kWHDV, Pn >= 250 kW
Figure 2.7. Average Lmax values for different vehicle categories and accelerating vehicles. Measurements have been done on actual traffic, so accelerations are at levels which are realistic on roads [Steven, 2005].

22
The increased propulsion noise levels due to accelerations are calculated from the fol-lowing equation in the HARMONOISE model [Jonasson et al., 2004]:
aCLacc for -2 m/s2 < a < 2 m/s2
where:
a is the acceleration/deceleration in m/s2
C is 4.4 for light vehicles and 5.6 for heavy vehicles.
Thus, the HARMONOISE model does not only give an increase in noise for accelerat-ing vehicles but also a decrease for decelerating vehicles. The exemption from this is for HGVs with 3 or more axles, where the numeric value of a should be used when the vehicle is using the engine to brake, for example on downhill gradients. Table 2.4 shows examples of the effect of accelerations and decelerations on propulsion noise at 50 km/h according to the HARMONOISE model. At speeds higher than 50 km/h the effects of changes in driving style will decrease due to the increasing contribution of tire/road noise.
The effect of traffic management measures on noise levels is often small, and the main effect is usually due to changes in speed. However, even when noise is reduced due to reduced speed, annoyance to those living along the road may increase because the measures also result in uneven driving patterns with accelerations and decelerations. These do not necessarily change the overall noise level very much, but where the noise without the measures may have been a steady sound, the accelerations and de-celerations cause the “sound picture” to shift, thus making it more noticeable. This is important to consider when installing traffic management measures, and it will be treated further in the following chapter.
Table 2.4. Noise effect (dB) of accelerations and decelerations in the HARMONOISE model in relation to a reference case of constant speed 50 km/h [Bendtsen et al., 2004].
Acceleration/deceleration Vehicle type Noise influence Note
1 m/s2 Light + 1.7 dB Moderate acceleration 2 m/s2 Light + 4.5 dB High acceleration
0.5 m/s2 Heavy + 2.1 dB Moderate acceleration 1 m/s2 Heavy + 4.5 dB High acceleration
-1 m/s2 Light - 0.8 dB Slow deceleration -2 m/s2 Light - 1.2 dB High deceleration
-1.5 m/s2 Heavy, 2 axles - 4.5 dB Moderate deceleration -1.5 m/s2 Heavy, 3 axles + 4.5 dB Moderate deceleration

23
3. Traffic flow measures – effects on driving pattern, noise emission and annoyance
Based on a literature study, this chapter presents the effects of various traffic flow measures on noise and annoyance. As several of the studied measures have not been subject to surveys of noise and noise annoyance, the effect on driving patterns isincluded whenever available as this may give some indication of the effect on noise and annoyance.
In Section 3.1 the basic elements of many traffic calming schemes – humps, chicanes, cycle lanes, gateways and rumble devices – are examined. Mini-roundabouts, which also are common in traffic calming, are treated in Section 3.2 along with other meas-ures related to junctions. Section 3.3 covers dedicated lanes, primarily bus lanes, which are likely to influence traffic speed and flow through the allocation of carriage-way space and possibly through a separation of different vehicle types. In Section 3.4 speed signs and other signs aimed at influencing traffic flow are examined, and Sec-tion 3.5 covers the effects of using automatic traffic control (ATC) to keep driving speed below the limits. Section 3.6 with the title “Other measures” briefly discusses the effects of congestion charging, parking information systems and nighttime bans on traffic.
Many measures – taxes, park-and-ride schemes, by-passes and many others – have effects on traffic volumes but no other specific effects on traffic flow. Using various noise prediction methods – for example NORD2000 or Harmonoise – the effect of such measures on noise levels may easily be calculated based on the changes in the traffic volumes. Such changes are likely to differ from city to city and even from road to road. Planners will have to model the local noise effects in each case based on the changes in traffic volumes.
The cases with congestion charging in London and Stockholm, which are discussed in Section 3.6, show that noise levels do not necessarily change even if traffic volumes are reduced. This may be due to higher speeds or changes in driving pattern made possible by the reduced congestion. Such effects should be taken into account when modeling effects of this type of more general measures.
3.1 Traffic calming Traffic calming schemes are usually implemented with the main objective to reduce speeds, and on residential roads often also to reduce traffic volumes by discouraging drivers without a local errand from using these for through traffic.

24
The overall effect on noise of a traffic calming scheme is highly dependent on the design of the scheme. The design determines the effect the scheme has on speed and driving patterns. A poorly designed scheme may only result in small speed reductions, or even worse – in a noise context – in drivers braking and accelerating at the individual measures in the scheme, so that the noise reductions are negligible and annoyance and perhaps also the noise levels even increase.
On the other hand, properly designed schemes may result in even driving patterns at reduced speed, whereby the noise levels may be reduced as much as 3-4 dB for LAeq and up to 7 dB for LAmax [Hedström, 1999; Döldissen, 1988; Bendtsen, 1987]. The highest noise reductions may be achieved on roads with no or very few heavy vehicles. This is in accordance with the findings above that noise emissions of heavy vehicles are less speed dependent than emissions from light vehicles, especially at low speeds.
The Danish guidelines for distance between speed reducing measures are shown Table 3.1. These guidelines are set so that speed reducing measures aimed at reducing the speed to 5 km/h bellow the desired speed should result in an average speed between the measures which is approximately 5 km/h higher than the desired speed.
Table 3.1. Danish guidelines for distances between speed reducing measures [DRD, 2000, Authors translation].
Desired speed Advised distance between measures
Maximum distance between measures
50 km/h 150 m 250 m 40 km/h 100 m 150 m 30 km/h 75 m 75 m
10-20 km/h 20 m 50 m
The Danish guideline for 30 km/h matches the advice given by the UK Department for Transport. Based on results from 250 20-mph ( 30 km/h) speed limit zones in the UK DfT advises that physical traffic calming measures should be spaced 60-70 m apart [DfT, 1999]. The results indicate average speed reductions of 9 mph (14.5 km/h) at locations where various traffic calming measures have been implemented. According to Table 2.2 this should result in noise reductions of 3-5 dB depending on the percent-age heavy vehicles. At locations without traffic calming measures, where only signs were used, average speed reductions of 1 mph (1.6 km/h) were found.
Smaller noise reductions were found by Webster et al. (2006) in a study of home zone schemes in the UK. At a raised shared surface noise levels (LA10, 18h) werereduced by 1 dB at a speed reduction of 4.1 mph (6.6 km/h). This is a slightly smaller reduction than would be expected according to Table 2.2. On average for seven schemes speed reductions of 4.7 mph (7.6 km/h) were recorded.

25
In Austria before-and-after measurements of noise effects of implementing 30 km/h zones as opposed to previously 50 km/h showed noise levels (Leq) to decrease by 1-2 dB. The actual effect on speeds is unknown to the authors.
In a study from the Danish Road Directorate [Rosbach et al, 1996], the effect of 21 environmentally adapted through roads was assessed. Traffic calming of the 21 roads resulted in speed reductions of on average 10 km/h. The focus of the study is on traffic safety, so noise and driving patterns have not been studied, but at the relevant speeds close to 50 km/h the effect on the LAeq levels should be about 2 dB, provided that the driving patterns are even. A repeated study ten years later [Wellis et al, 2004] showed that the speed reductions registered during the first study were still valid. Thus, there were no signs that driver customization to the schemes had led to increases in speed. This is also the finding of Wheeler and Taylor (1999) in a study of traffic calming of major roads in villages in the UK. They found mean speed reduction of 2-12 mph (3-19 km/h) and a general pattern of noise reductions (A- and C-weighted and number of maximum events) corresponding to the change in speed.
These results on traffic calming in general indicate that it is possible to achieve noise reductions (LAeq) of up to 4 dB if the schemes are properly designed. This implies a proper spacing between the various measures.
Vertical deflections Vertical deflections are humps, speed cushions and raised junctions. This type of measure seems to be the most thoroughly assessed traffic flow measure when it comes to noise. Especially TRL in England has been very active in studying the noise and annoyance effects.
Abbott et al. (1995a) concludes based on a survey of hump sites in the UK that maxi-mum noise levels from light vehicles traveling over and between cushions were not significantly different from each other when normalized for speed. Noise levels were lower at the cushions than between cushions, because the speed was lower. Noise levels at a reference speed of 25 km/h varied between different cushion sites. It is hy-pothesized that this may be due to differences in construction – asphalt/block paving or steepness of the on/off gradient – but the data set is too small for definite conclu-sions. For buses, the noise levels at the cushions were more than 2.5 dB higher than the levels between cushions after normalizing for speed differences.
Generally it was concluded that increased distance between the humps led to increased speed, and thereby to increased noise levels. At one location with a distance of 50 meters between cushions, speeds about 30 km/h were registered both at and between cushions. The difference in noise levels at and between cushions was 0.5 dB. At another site, also with 50 m between cushions, speeds of 22.4 and 21.4 km/h were registered at a single and a double pair of cushions respectively, and 27.0 km/h was registered between the cushions. Differences in noise levels of 2.2 and 0.7 dB were recorded. At a site where the distance between humps was 80 m, the speed was 23.5 and 22.1 at the cushions and 33.5 km/h between the cushions. Differences in noise levels were 3.9 and 5.6 dB.

26
Picture 3.1. Speed cushions on Sportsvej in Glostrup, Denmark, where the advised speed is 40 km/h. Heavy vehicles can straddle the cushions whereas cars have to drive with at least one wheel pair on the cushion (Photo: L. Ellebjerg, DRI).
Abbott et al. (1997) reports that although noise levels are reduced also at sectionswith long distances between the humps, there are complaints about noise from the residents. This is not the case along sections with short distances, where the driving patterns are more even.
Abbott et al. (1995b) reports on the results of controlled pass-by measurements of noise from light vehicles, buses and trucks on a test track with level road and various designs of speed control cushions (3 narrow – width less than 1700 mm – and 4 wide) and road humps (1 flat-top and 1 round-top). For light vehicles the change in noise levels with speed was independent of the road profile over the speed range 15-40 km/h. For all hump profiles, the noise level and speed functions derived from a passenger car and normalized to 25 km/h were similar to those obtained for a level road with similar surface characteristics. Also for buses the average noise level nor-malized to a speed of 25 km/h were similar for all road profiles, including level road.
For trucks the average noise levels for the narrow cushions were similar to those for level road when normalized to 25 km/h. The other profiles resulted in significantly higher noise levels, on average 10 dB for the wide cushions and 8 dB for the humps. Noise levels for the flat-top hump were on average 8 dB higher than for the round- top hump. Maximum noise levels from the trucks increased by 2.0 dB at the narrow cushions, 8.0 dB at the wide cushions and 2.0 dB at the humps (round-top: -2.0 dB, flat-top: 6.0 dB). The trucks were selected to be worst-case in the sense that they were prone to the generation of body noise. Therefore a more representative sample may lead to lower noise levels.

27
Harris et al. (1999) tests the noise (average and maximum levels) and vibration effects of sinusoidal, round-top and flat-top humps. For light vehicles no differences are found between the various hump designs. The noise levels at the humps were lower than those measured next to a control surface, and vibration levels were only marginally higher than the background levels. For the bus the sinusoidal hump resulted in distinctly lower noise levels than the other hump designs. The highest noise levels were found alongside a flat-top hump with straight ramps. This hump also gave the highest vibration levels. The round-top hump gave lower vibration levels than the sinusoidal hump. For the trucks the flat-top humps also resulted in the highest noise levels. The sinusoidal humps resulted in slightly lower maximum noise levels than the other humps, whereas the average levels were similar to those found at the other humps. The flat-top humps also resulted in significantly higher vibration levels than the other hump designs. For both buses and trucks it is stated that the pattern in noise levels is the same for both A- and C-weighted levels, which indicates that the changes are not limited to the low frequencies, where engine noise dominates.
In a report on environmental assessment of a traffic calming scheme in Havant, UK, it is concluded that “at sites positioned alongside and between cushions, light vehicle noise was reduced by about 6 and 5 dB(A) respectively...due to changes in vehicle speeds...and not influenced by any other changes in the style of driving” Cloke et al. (1999, p. 48). The cushions were spaced 30 – 70 meters apart. Speeds of 30-40 km/h were registered at and between the cushions.
At another scheme in Gloucester, UK, Abbott et al. (2003) registered mean speed reductions of 7 – 13 mph (11 – 21 km/h) on road sections with cushions, humps and raised junctions. Maximum vehicle noise levels from light vehicles are reduced by 5.2-5.3 dB alongside cushions and humps. 4.7 and 6.5 dB were expected based onthe change in vehicle speed. 6.6 dB (expected: 7.4) was registered at a raised junction, and 2.7 dB (expected: 4.5) was registered on a section between cushions. The lower-than-expected noise reductions at humps, the raised junctions and between humps may be due to accelerating vehicles. The higher-than-expected noise reductions at the cushions are less easily explained. However, measurement uncertainty also plays a roll in explaining these small variations.
For heavy vehicles a slight and statistically not significant increase in noise was registered at the hump, the raised junction and between the cushions, and a slight,statistically not significant decrease at the cushions. There were occurrences of body rattle from heavy vehicles. In some cases it “...did not substantially affect the maxi-mum A-weighted pass-by noise level, but the impulsive, and in some cases, tonal na-ture of the noise would be expected to make the pass-by noise noticeable and therefore potentially disturbing to nearby residents.” (Abbott et al., 2003, p. 61) For some heavy vehicles the maximum pass-by levels increased substantially as a result of body noise. For one vehicle a maximum level over 11 dB greater than at the level section of road was measured. Still, the number of occurrences of levels exceeding 80 dB for 1 second or more was reduced.

28
When changes in traffic flow and composition was taken into account, reductions in noise exposure were estimated to be 4.0 dB at the cushions, 3.1 dB between the cushions, 6.0 and 3.3 dB at two raised junctions, and 2.4 dB at the hump. There were no changes in the daytime C-weighted noise levels. This indicates that the low frequency noise levels were unchanged.
In spite of the measured decreases in noise levels, annoyance from traffic noise increased significantly, and many respondents to the questionnaire survey perceived increases in traffic noise when indoors at home. Nuisance from noise and vibrations indoors was correlated to the distance from the dwelling to the nearest traffic calming measure.
French experiences show increases of 1-5 dB due to tire impact on the edge of the hump and due to braking and accelerating. Therefore, road humps have been replaced by other less noisy means such as carriageway narrowing (Bérengier, 2005). It is not stated which types of humps are included in the survey.
In a Danish study of noise effects of road humps with design speeds of 30, 40, 50 and 60 km/h, Bendtsen et al. (2001) registered noise reductions (LAE) of up to 3.5 dB, highest at the humps, and down to less than 1 dB between the humps. The 30-km/h hump is a so called “H” hump according to terminology used by the UK Department for Transport [DfT, 1998], the others are round top or modified round-top humps designed for the given speed4.
Low frequency noise levels increased by up to 4 dB (at 63 Hz) for passenger cars, LGVs and small trucks, and by up to 3 dB for trucks with more than two axles at the humps as compared to between humps. At 250 Hz and higher frequencies the noise spectra at and between humps do not differ. The increase in low frequency noise indi-cates an increase in propulsion noise due to accelerations. No peaks in noise levels from trucks due to body rattle or loose cargo was registered at any of the humps. Apart from the 30-km/h section, the sections in the study comply fairly well with the Danish guidelines for distance between speed reducing measures which are presented in Table 3.1. A questionnaire survey showed that people living near the humps tend to be more annoyed by traffic noise than those living between the humps.
4 According to Danish guidelines, road humps should be designed so as to subject the driver of vehicles with an acceleration of 0.7 G when driving across the hump at the design speed in the case of light vehicles and at a speed 15 km/h below the design speed in the case of heavy vehicles.

29
Picture 3.2. A round-top hump on Vældegårdsvej in Gentofte, Denmark, where the ad-vised speed is 40 km/h (Photo: H. Bendtsen, DRI).
Based on Abbott et al. (1995a and b) and a TRL study of round-top humps in Slough Berkshire, Traffic Advisory Leaflet 6/96 (DfT, 1996) advises on traffic and vehicle noise in connection with traffic calming. A distance between cushions of 50 meters is advised5. No clear advice is given for the distance between humps, but it is noted that experience suggests that distances in excess of 100 meters encourage drivers to accelerate between humps. In residential areas round-top humps are seen as the best technique for keeping noise levels down, provided that the flow of HGVs is confined to the normal working day. Speed cushions are stated to be less effective at reducing speed, but where round-top humps are unacceptable, the use of narrow cushions (up to 1600 mm wide) is advised. To limit noise nuisance from speed cushions, the on/off ramps should be no steeper than 1:8.
Flat-top humps and wide cushions should not be used in residential areas where HGVs require access late at night or early in the morning. Round-top humps may also pose a problem under these conditions because vehicles generally are driven faster at night, when there are no other vehicles present. At speeds exceeding 20 km/h at round-top humps, vehicle noise levels from HGVs will increase significantly (See Figure 3.1).
5 It is not stated at which speed this distance is advised.

30
Figure 3.1. Comparing average noise levels for HGVs alongside various road profiles. The humps are 75 mm high. The flat-top with on/off ramp gradients of 1:12 and a 6 m plateau length. The round-top with an overall length of 3.7 meters. The cushions were 60-80 mm high and 1500-1900 mm wide with on/off ramp gradients of 1:8 and side ramp gradients of 1:4. Trench and Ramp are profiles included to imitate old, worn and poorly maintained pavements. [DfT, 1996; Abbott et al., 1995b].
The conclusion from these studies is that when properly spaced, so that accelerations and decelerations are avoided, there is little difference between the noise effect of various hump designs when it comes to light vehicles. For heavy vehicles, on the other hand, round-top humps and narrow cushion (up to 1700 mm wide) are to be preferred. If round-top humps are selected, it should be ensured that heavy vehicles do not pass the humps at speeds exceeding 25 km/h, even when there is no other traffic to keep speeds down. It may therefore be necessary to supplement the humps with other measures. Flat-top humps and wide cushions should be avoided on residential roads with heavy vehicles.
At a desired speed level of 30 km/h a distance between cushions of 50 m is to be preferred. 30 km/h corresponds to a driving time between humps of 6 seconds. Assuming that it is the driving time between humps, which determines the incentive for drivers to accelerate, the preferable distances between cushions at speeds of 40 and 50 km/h are likely to be 67 and 83 meters respectively. This, however, needs to be verified. Similar distances seem appropriate for humps, in order to keep driving patterns even. This also needs verification.

31
Dummy humps Only one study (Abbott et al., 2003) has been found of the effect of dummy humps. Dummy humps are painted images on the road surface, which to the driver appears to be humps, but where there is no actual vertical deflection. In the study from Gloucester, UK, reductions in mean speed from 30 to 25 mph (48 to 40 km/h) were recorded. According to Table 2.2 such a speed reduction should lead to a reduction in average noise levels of approximately 2.5 dB, depending on the percentage heavy vehicles and providing that there are no accelerations and decelerations. It seems likely that drivers will habituate to the dummy humps, which will reduce the speed effect and the noise reduction. This hypothesis of habituation should be verified or rejected through further studies.
Horizontal deflections and road narrowing Horizontal deflections in the form of chicanes are commonly used to reduce speed. This is often done in combination with road narrowing so that vehicles only can pass the chicane in one direction at a time. Therefore chicanes and road narrowing are treated together in this section.
Picture 3.3. Chicanes in Saint-Sulpice, France (Photo: E. Rousseau, LRPC Blois).
TRL in the UK has carried out test track and on-road studies of the effect of chicanes on vehicle speeds [Sayer and Parry, 1994; Webster, 1995; Sayer et al., 1998; DfT, 1994; DfT, 1997]. The parameters which are relevant to describe a chicane and assess its effect are shown in Figure 3.2 These parameters are the free view width (a), the lane width (b=(b1+b2)/2) and the stagger length (l).

32
Increasing the stagger length increases the mean speeds, whereas there is little effect on speeds of varying the width of the approach lane. Changing the free view width from +1 m to -1 m reduces mean speed by about 10 mph (16 km/h). Double chicanes6
result in 5 mph (8 km/h) lower speeds than those found through single chicanes, and obscuring the forward visibility across buildouts reduces speeds by 2-4 mph (3-6 km/h). Chicanes which reduce the speed of cars to about 20 mph (30 km/h) reduces the speed of buses to about 10 mph (15 km/h), but they are too tight for articulated trucks to pass. [Sayer and Parry, 1994; DfT, 1994].
Sayer et al. (1998) compare 33 single lane and 16 two-way working chicane schemes and find mean speed reductions of 12 and 11 mph (19 and 18 km/h) at chicanes and 7-8 mph (11-13 km/h) between chicanes. The speed reductions between chicanes were higher for single lane (12 mph (19 km/h)) than two-way working chicanes (6 mph (10 km/h)). One explanation for this difference may be that vehicles have to wait for oncoming vehicles at the single lane working chicanes. However, the distances between the chicanes are not known, so this may also be a reason for this difference. Both the mean speed and the 85th percentile speed through the chicanes are related to the path angle calculated as:
labTananglePath 1_ .
Path angles of 15° should reduce the mean speed to less than 20 mph (30 km/h), and angles of 10° generally result in mean speeds of 25 mph (40 km/h) or more. In order to allow heavy vehicles to pass some chicanes were designed with overrun zareas, for example in the form of slightly raised stone paving. At these chicanes on average half of the cars ran over the overrun areas, and all observed trucks used at least one area when passing a chicane. Vehicles driving over overrun areas are likely to cause increased noise levels and shifts in the noise pattern which may cause annoy-ance to people living near the chicanes.
6 Chicanes which first displace the lane to the left and then to the right, or vice versa.

33
Figure 3.2. Parameters considered in TRL tests of chicanes as a means of traffic calming [Sayer et al., 1998, p. 4].
Marek and Walgren report on the effects of chicanes on traffic volume and speed in Seattle, USA. The speeds on the roads can be seen in Table 3.2. It appears that 90 m or less is a suitable distance between chicanes in order to achieve even driving patterns at a speed of about 20 km/h.
Table 3.2. Speeds on roads with chicanes in Seattle, USA [Marek and Walgren].
Location Speed inside chicane (km/h)
Speed between chicanes (km/h)
Difference (km/h) Distancebetween
chicanes (m) Northeast 70th Street 18 27 9 128*
Northwest 55th Street 20 23 3 90*
Northwest 56th Street 23 26 3 90*
Northeast 98th Street 26 33 7 137*
* There is only one chicane. The stated distance is between the chicane and a ‘traffic circle’, a small roundabout.

34
Greibe and Nilsson (1999) states that narrowing the road through traffic islands, pinch points, cycle tracks/lanes or parking lanes is slightly speed reducing. At one scheme a “substantial reduction” was achieved by reduction of the number of vehicle lanes and establishment of cycle track or parking lane. Narrowing a road to one lane is also seen to be slightly speed reducing. It only works when there is oncoming traffic, and for capacity reasons only at low traffic volumes. Chicanes (staggerings) are reported to be less speed reducing than road humps.
Only one source [Bérengier, 2005], from France, has been found which reports on noise effects of chicane schemes. Bérengier reports that 1-4 dB noise reductions have been obtained in the center of locations with zigzag obstacles, but 1-5 dB increases at the entrances and exits from the locations due to braking and accelerating.
Generally single lane working chicanes can be expected to cause braking and acceler-ating because vehicles have to wait for oncoming traffic to pass. The more traffic there is on a road with such chicanes, the more often vehicles will have to decelerate and accelerate. This may increase noise levels and will certainly cause shifts in the sound pattern which are likely to make the noise more noticeable and annoying to the neighbors. Both single lane and two-way working chicanes have greater speed reduc-ing effect for heavy vehicles than for cars. It is therefore likely that chicanes which cause cars to drive evenly at a desirable speed will cause large vehicles to brake and accelerate, which may cause annoyance to the neighbors. To the largest trucks such chicanes are even likely to be impassable so that overrun areas are necessary. These, however, are also likely to cause unwanted shifts in noise levels and/or patterns so that annoyance to the road neighbors is increased. Further surveys are necessary to gather knowledge on the noise and annoyance effects of chicane and road narrowing schemes. Thus, from a noise perspective these measures should be used with some caution, especially on roads carrying many heavy vehicles.
Cycle lanes According to Abbott et al. (2003), the building of cycle lanes do not have significant influence on vehicle speed. Greibe and Nilsson (1999) reports that road narrowing through cycle lanes has a slight speed reducing effect. This is supported by Elliott et al. (2003), who based on a literature review reports that cycle lanes have an effect on speed of 1 mph (1.5 km/h), and a further 4 mph (6 km/h) when there is a cyclist on the lane. Whether there is an actual speed reducing effect or not, as long as the effect is only slight, the noise reductions will be negligible unless the changes alsosignificantly influence the driving pattern, which seems unlikely.

35
Gateways Gateways are often used to mark entrances to areas or road sections with low speed and often also traffic calming. As such they are aimed at raising the awareness of the driver towards the change in conditions rather than being a separate speed reduction measure. However, the gateways are often combined with traffic calming measures such as chicanes or humps to secure speed reductions at the gateway.
Wheeler and Taylor (1999) report that various designs of gateways – often combined with other measures – at different schemes led to speed reductions at the gateways ranging from 3 to 13 mph (5-21 km/h) from before to after the implementation of the schemes. The highest speed reductions are registered at gateways combined with speed cushions, advance signing/countdown signs and/or road narrowing. Contrary to these findings Kennedy et al (2005) report that gateways and colored patches of pavement only show slight speed reducing effects. However, DfT (2004) also state that gateways “...can act as a speed reducing measure if properly designed”. All in all, evidence as to the effect of gateways alone is sparse, especially considering the great variety in the gateways which have been implemented in different areas, towns and countries. If gateways are used together with other speed reducing devices they may support the speed reducing effect of these measures.
Rumble devices Rumble devices may be in the form of short sections with paving stones, thermoplastic strips across the road, milled grooves in the pavement or other measures which cause vibrations and noise inside the vehicle.
Rumble devices are not intended as speed reducing as such but rather used to raise the awareness of the driver. This could for instance be before entering a zone with traffic calming, at pedestrian crossings or at some hazardous road layout. Although rumble devices are not in themselves speed reducing, they are included here because they are commonly used and usually result in increased noise levels also outside the vehicles.

36
Bendtsen and Høj (1990) have carried out LAeq noise measurements at five different rumble devices and at corresponding reference points. The results are presented inTable 3.3. Increases in noise levels along the road of 1.6 to 3.7 dB are measured. In addition to these increases in levels it should be considered that the noise from the rumble devices tend to pulsate. Impulse noise tends to be more annoying than continuous noise, so the increase in annoyance is likely to be higher than the increase in noise level s would indicate.
Table 3.3 Noise increases measured at different types of rumble areas [Bendtsen and Høj, 1990].
Type of rumble device Dimension of rumble device Reference speed km/h
Noise increase LAeq dB
Paving stones 7 m long section 60 1.6
Paving stones 15 m long section 50 2.1
Narrow thermoplastic strips 10 cm wide, 0.8 cm high 50 2.1
Wide thermoplastic strips 100 cm wide, 0.5 cm high 50 2.7
Milled groves in the pavement 15 cm wide, 1 cm deep 80 3.7
TRL have done trials of various designs of rumble surfaces aimed at producing noise and vibrations inside vehicles without increasing noise emitted to the surroundings [Watts et al., 2002]. The result is a sinusoidal surface ‘Rippleprint’ with a peak-to-trough amplitude of 6-7 mm and 0.35 m wavelength, which produces large increases in interior noise and vibrations inside vehicles but little increase in exterior noise levels and only a slight increase in annoyance rating compared with flat road when rated by a listening panel.
3.2 Junctions Junctions lead to some degree of breaking and accelerating of the traffic, depending on the amount of traffic and the type and layout of the junction. The types could be roundabouts, mini-roundabouts, signalized crossings, crossings with stop signs (2- or 4-way) or right-of-way, and crossings with priority to the right/left7. The l ayout of the junction depends on the surroundings and on a number of other factors, allowing for a great variety, which cannot be covered in this context. In the case of signalized intersections there are possibilities of affecting the traffic flow through rest-on-red, rest-on-green and coordination of signalization (green waves).
The literature which has been found in this study is mainly concerned with the effect of converting various types of crossings into roundabouts or with installing mini-roundabouts in intersections. Little has been found on the effect of various signalization schemes.
7 Depends on whether traffic is right- or left-hand.

37
Roundabouts Bérengier (2002) reports on noise measurements carried out in connection with the rebuilding of junctions with or without signalization into roundabouts. LAeq levels are reduced due to the reduction in the number of accelerations and decelerations. The reduction depends on the roundabout radius and the number of entry and exit roads. Resulting reductions of 1 to 4 dB are found for the day period and 1 to 3 dB for the night period mainly depending on how the traffic flow is modified.
According to Plüss et al. (2003) rebuilding a signalized crossing into a roundabout resulted in daytime noise reductions (LAeq, 6-22) of 1.7 dB and nighttime reductions (LAeq, 22-6) of 2.9 dB. The daytime reduction was lower than originally modeled (3.2 dB), whereas the nighttime reduction was higher (1.7 dB). No explanation is given for this difference.
In a Norwegian study (Storeheier and Skaalvik, 1987) traffic noise measurements (LAeq and LA1) were carried out before and after rebuilding a junction from a right-of-way crossing to a roundabout. The speed limit on the roads was 50 km/h both before and after rebuilding. Noise was measured at several points close to three of the four approaching roads at distances up to 100 m from the junction, and at three points further away from the roads. The amount of traffic and the percentage heavy vehicles are unchanged from the before to the after situation.
At the measuring points close to the road which had right of way before the rebuild-ing, no significant changes were found in the noise levels except at the point closest to the roundabout, where a decrease of approx. 2 dB was found in LAeq and 3 dB in LA1. Along the road which had to give way decreases of 2-3 dB was found for both LAeq and LA1. At two of the three measuring points further away from the roads de-creases of approx. 2 dB were found in LAeq. At the third point no significant changes were found. This may be due to changes in the conditions for noise propagation be-tween the before and the after situation. The reductions in noise levels may be ex-plained by the changes in vehicle speed. Merétei et al. (2000) reports on the results of a study including traffic flow counts, driving pattern measurements, noise measurements (LAeq) and noise calculations (LAeq)at two junctions before and after conversion from priority respectively signalized crossings to roundabouts (four arms, one lane). At the priority crossing the traffic was unchanged, at the signalized it increased after the conversion. Slight decreases in the noise levels (1 dB) were found through both measurements and calculations at both junctions.
Bredenfeldt and Nilsson (2004) measured noise along access/exit roads at roundabouts and signalized crossings. The results were compared with calculations done with the road traffic noise prediction model Nord2000. The speed limit of 50 km/h was used for all calculations. Results were based on cars, as there were very few heavy vehicles on the roads in the survey. Results show that measured noise levels at both crossings and roundabouts were lower than the calculated levels, which may be ascribed to the actual speed being lower than the speed limit of 50 km/h. Measured noise levels at the roundabouts tended to be lower than those at the crossings.

38
According to Austroads (2005, p. 43) “roundabouts generally provide the greatest benefit in noise reduction. Noise from roundabouts appears to create less community annoyance than other traffic calming devices.”
Roundabouts with small diameters are often built with overrun areas with paving stones at the center in order to allow large trucks to pass the roundabout. If cars use these areas to drive through the roundabouts at high speed, this may generate high impulse like noise levels which may increase the annoyance experienced by those living next to the roundabout. Similar overrun areas are sometimes seen at the entrances to and exits from the roundabouts in an attempt to keep the speed of cars down while still allowing heavy vehicles to pass. These may have the same effect as the center areas.
Picture 3.4. Roundabout with central overrun area (Photo: H. Bendtsen, DRI).
The results above indicate that roundabouts without overrun areas may reduce noise levels (LAeq) by 1-4 dB compared with ordinary intersections, signalized or non-signalized, depending on the traffic and the layout of both the intersection and the roundabout. How these parameters influence the noise generated is unclear.There is a need for further studies to clarify this before roundabouts can be fully utilized as a measure to reduce road traffic noise.

39
Mini-roundaboutsMini-roundabouts – also called traffic circles – are small paved or painted circles in the center of intersections which function as roundabouts for cars whereas heavy vehicles can drive across. These roundabouts are used as traffic calming measures to reduce speed.
In a traffic calming scheme in Växjö, Sweden 21 mini-roundabouts were constructed [Hydén et al., 1995]. Average speeds were reduced by 11-18 km/h. Speeds were also reduced on road sections between the roundabouts if the distance between these did not exceed 300 m. Noise reductions of 1.6, 3.9 and 4.2 dB were recorded at three locations where measurements were done, indicating that besides reduced speed, driving patterns are smoother after the introduction of the roundabouts.
In the Leigh Park Area in Havant, UK mini-roundabouts with 1.6 m wide cushions at exits and entrances lead to reductions of noise (LAmax) from light vehicles of 1 to 3 dB, where 3 to 7 dB would have been expected based on the before noise/speed relation. Noise from heavy vehicles increased by 5 to 6 dB despite an expected reduc-tion of 2 to 4 dB [Cloke et al., 1999]. These results do not agree with the above results from Sweden, nor with the previously presented results on the noise effect of narrow cushions. Whether it is the combination of the roundabout with the cushions or other circumstances specific to this scheme which cause the not-so-good noise results is not known.
In Seattle, USA installation of traffic circles (mini-roundabouts) have resulted in mid-block speed reductions of 3.4 mph (5.5 km/h). There has been little change in traffic volumes. With unchanged driving patterns this should – according to Table 2.2 – result in noise reductions of 1 to 1.5 dB depending on the traffic composition. The scheme is supported by 85 percent of the residents. This may indicate that noise conditions at least have not become worse.
The little evidence found on the noise effects of mini-roundabouts indicate that these, when properly designed, may lead to noise reductions due to reductions in speed as well as to more even driving patterns. Based on the above results the potential seems to be noise reductions (LAeq) of up to 4 dB. UK experiences indicate that especially the effect on noise from heavy vehicles should be studied further, but there is also a need for studies of the influence of the roundabout design.
Calming green waves Ellenberg and Bedeaux (1999) present the concept of calming green waves, where consecutive traffic signals on a road are coordinated to promote desirable driving patterns rather than maximum capacity. Through implementing calming green waves optimized for speeds of 40-45 km/h on roads with speed limits of 50 km/h, the average speed of groups of vehicles were reduced by 15 km/h, for the 15 percent fastest drivers the speed was reduced by 22 km/h, and a greater coherence in drivers’ behavior was observed.

40
Figure 3.3 shows speeds before and after implementing a calming green wave. In the before situation, where the signal coordination is aimed at a speed of 45 km/h, there are two peaks on the speed distribution, one at around 40 km/h, and one around 70 km/h. In the after situation, where the coordination is based on a speed of 41 km/h, there is only one peak around 40 km/h. The desired speed has only been reduced slightly, but the green time and cycle time of the signals have been reduced so thatthe signal coordination no longer makes it attractive to speed.
Figure 3.3. Vehicle speeds before (dotted line) and after (fully-drawn line) the implementation of a calming green wave [Ellenberg and Bedeaux, 1999].
Ellenberg and Bedeaux claim that calming green waves reduce noise emissions from the traffic. From the observed changes in driving patterns this seems likely, but the literature search has not come up with results on the matter. Figure 3.3 indicates a reduction in average speeds of 10 to 15 km/h, which according to Table 2.2 wouldresult in a noise reduction of 2.5 to 3 dB depending on the traffic composition if driving patterns are unchanged. It is likely that driving patterns become more even with the implementation of calming green waves. This may result in further noise reductions, but further verification is needed to draw conclusions.
‘Rest on red’ and ‘rest on green’ In addition to calming green waves individual traffic signals can be used for calming traffic through the use of strategies implementing ‘rest on red’, where the signals re-main red in all directions until triggered by an approaching vehicle, or ‘rest on green’, where the signals in a certain direction remain green unless some triggering factor causes them to shift. No literature has been found on the effect of such schemes on noise, speed or driving patterns, so there is a need for studies of these effects. The fol-lowing section contains some ideas of the author.

41
‘Rest on red’ may be implemented in a manner so that the signal changes to green if an approaching vehicle observes the speed limit. If the speed limit is exceeded, the signal remains on red until the vehicle is at a standstill at the stop line. This may be combined with a warning to the driver that the speed limit is exceeded. Such a system has been implemented in Celle in Germany [Bendtsen and Larsen, 2000]. On roads where the majority of the traffic is constituted of drivers who drive on the road regularly, and who therefore are likely to get to know this functionality, such a system may lead to even driving patterns at appropriate speeds. If, on the other hand, a large percentage of the drivers are unfamiliar with the system, there may be a risk that the system will lead to traffic braking and accelerating, and thereby increasing the noise levels and the annoyance. This signalization strategy needs to be tested before it can be proposed as a means of traffic noise abatement.
‘Rest on green’ may be implemented in a way so that the lights rest on green in the direction of the most heavily trafficked road unless drivers exceed speed limits. If the strategy works it may reduce speeds as well as braking and accelerations. However, the presence of a green light ahead may encourage unfamiliar drivers to increase speeds in order to make it across ‘before the light changes’, thus causing the light to shift to red and making traffic brake and thereafter accelerate. Thus, ‘rest on green’ also needs to be tested before being used as a means of noise abatement.
3.3 Dedicated lanes No literature has been found on the noise effect of implementing dedicated lanes for specific types of traffic, e.g. buses. The effects on traffic will depend on the specific implementation of such lanes. In a literature review Elliott et al. (2003) find in one study that a bus lane has no effect on the speed of cars in itself but a speed reducing effect of 4 mph (6.4 km/h) when a bus is present. Another study showed a reduction in mean speed of between 1 and 2 mph (1.6 – 3.2 km/h) on roads with a bus lane.
The implementation of bus lanes may also lead to a shift in modal split as the im-proved level of service for buses attracts more passengers to this transport mode, thereby reducing the number of cars. This may reduce noise levels, but such a result is not unambiguous. The improved level of service of the remaining cars may lead to higher speeds, which again causes more noise. Also, it may be necessary to operate more buses. Thereby the noise effect depends on the number of cars removed and the number of buses added. Watts et al. (2005) have used the Harmonoise model to estimate the number of cars which in regards to noise is equivalent to a bus. The results can be seen in Figure 3.5.
Even if the LAeq levels decrease as a result of moving traffic from cars to buses, this will not necessarily result in less annoyance. The individual buses produce higher maximum noise levels than the cars. This makes them more noticeable and therefore maybe more annoying. Further knowledge on the noise and annoyance effects of bus lanes is needed to draw any conclusions.

42
Figure 3.5. Estimates of the number of passenger cars which in regards to noise is equivalent to a bus on hot rolled asphalt (HRA) and stone mastic asphalt (SMA) [Watts et al., 2005, p. 43].
3.4 Signs Signs showing the speed limit and signs warning or informing drivers of some matter may be static or dynamic. In the following static and dynamic signs will be treated separately as there are differences in their noticeability and applicability. The section on static signs only covers speed signs, whereas dynamic signs also involve informa-tive signs regarding speed.
Static signs According to Greibe and Nilsson (1999) the approximate percentage of speeders on urban roads is 62 % in Denmark, 72 % in the UK and up to 80 % in the Netherlands8.These high percentages indicate that there is little respect for urban speed limits in European countries. Greibe and Nilsson conclude that posted speed limits have little or no effect and that only massive law enforcement and/or changes in road layout will reduce urban speed levels.
This is supported by results from studies of traffic calming in the UK. In zones where various traffic calming measures have been implemented, average speed reductions of 9 mph (14 km/h) were achieved. In zones where only signs were used, average reduc-tions of 1 mph were found [DfT, 1999].
8 More recent figures are slightly lower [OECD/ECMT, 2006].

43
Slightly more positive effects – mean reductions of 2.2 mph (3.5 km/h) are found by Mackie (1998). Based on data from a number of countries a statistical model has been developed which suggests that the mean speed reduction due to changing a speed limit and using signs would be one quarter of the difference between the speed limits.
The results presented by Mackie include speed effects of introducing a 30 km/h speed limit on all but the main roads in Graz, Austria. The speed limit before was 50 km/h. The implementation was accompanied by an intensive public awareness campaign and speed limit enforcement by the police. The effect four months after the implementa-tion was a reduction in mean speed from 37.6 km/h to 34.8 km/h. Nine months after the implementation the mean speed was 37.1 km/h.
Far more positive are the results of the Norwegian Public Roads Administration (2005). In winter 2004-05 a speed reduction from 80 km/h to 60 km/h was introduced on a section of the National Highway route 4 through Oslo in order to reduce the suspended dust concentrations along the road. The only speed reducing measure was signs stating the lower speed limit. The average speed reduction was 10 km/h, noise was reduced by 2 dB(A). It is unclear whether the speed reduction was backed by automatic speed control (ATC), which is commonly used in Norway.
On the ring road in Nantes, France speed has been reduced from 110 to 90 km/h. The effect on noise was approximately 1 dB as opposed to an expected effect of 2-3 dB. This was mainly due to a “non-respect of the regulations by a large part of the drivers. After installation of ATC the respect of the speed limit is better [Bérengier, 2005].
Trials of speed limits with a sign of “Lärmschutz” (noise protection) as a means of noise abatement on German motorways showed nighttime noise reductions of 1 to 3.5 dB(A) given as LAeq, 22-6. The speed limits were between 80/60 (cars/HGVs) and 120 km/h as opposed to the free speed, which is common in Germany. The trials showed that drastic speed reductions require presence of police for enforcement. At many locations the noise reductions were barely perceptible because of high percentages HGVs, even when these were subject to a limit of 60 km/h. Up to 52 % HGVs was recorded for the period 22 to 6 [Krux and Kathmann, 1998; Kathmann and Cannon, 1999].
The results of the above surveys indicate that the use of lower speed limits for noise reduction is only effective if combined with physical measures, ATC or massive enforcement by police. In those cases realistic speed reductions may result in noise reductions (LAeq) of 1-3 dB.

44
Interactive signs Webster (1995) tests two types of vehicle activated speed signs, ‘secret’ (blank when not activated) and ‘enhanced’ (ordinary sign with additional ‘eye-catchers’). The ef-fect of such signs is on average 2 mph (3.2 km/h) at the signs. Some of this reduction is maintained downstream. There are few data regarding the effect on the speed of HGVs, but apparently the signs have little effect on the speed of this vehicle category. Mackie (1998) reports that a variety of ‘flashing’ signs (often vehicle activated) re-duced speeds by on average 4 mph (6.4 km/h). The results vary according to location, speed limit, and sign trigger threshold. The best results have been obtained where the speed limit has simultaneously been reduced.”
Winnett and Wheeler (2002) have tested the effect of vehicle activated speed signs. At speed limits of 30 mph (48 km/h) and a sign trigger speed of 35 mph (56 km/h) reductions in mean speed were between 2.6 and 7.1 mph (4.2-11.4 km/h), highest at sites with high speeds before the installation of the signs. At a speed limit of 40 mph (64 km/h) and a trigger speed of 45 mph (72 km/h) reductions in mean speeds were between 1.2 and 4.4 mph (1.9-7.1 km/h), again highest when before speeds were high. At one location with dual carriageway, a speed limit of 50 mph (80 km/h) and a trig-ger speed of 55 mph (89 km/h) reductions of 3.6 and 4.6 mph (5.8-7.4 km/h) in the mean speed were achieved.
Vehicle activated signs were also tested at locations with changes in speed limit. At locations with changes from 30 to 20 mph (48 to 32 km/h) reductions in mean speed between 4.4 and 7.5 mph (7.1 and 12.1 km/h) were achieved. At speed limit changes from 40 to 30 mph (64 to 48 km/h) the reductions were between 6.5 and 13.8 mph (10.5-22.2 km/h). Also at these locations the greatest speed reductions were achieved at the locations with the highest speeds before the installation of the signs.
Larsen (2003) tests two different interactive signs on non-urban roads with 80 km/h speed limits. One sign displays the message: “XX% observed the speed limit in the past hour”. The sign is only active if the percentage is higher than 50. The other displays the message: “Your speed is XX km/h”. Both signs have significant effects on the driving speed. One conclusion is that the speed selected by drivers depends on how fast they perceive that others drive.
In Gleisdorf, Austria interactive speed limit signs are linked to noise measuring equipment, which – depending on the noise levels at dwellings along the road – increases or reduces the speed limit [Bendtsen et al., 2004; Aigner, ????]. The speed signs are supplemented by signs showing noise to be the reason for the reduced speed. The usual speed limit on Austrian motorways and also in Gleisdorf is 130 for cars and 100 for heavy vehicles. A limit of 130/80 km/h for cars and heavy vehicles respectively is respected by 90 percent of drivers. A limit of 100 km/h for cars is respected by more than half of the drivers, whereas a limit of 80 km/h for cars is respected by less than 10 percent. A limit of 60 km/h for heavy vehicles is disrespected by 80 percent although there is a general ban on trucks at night when the overall traffic level is light.

45
Figure 3.4. Interactive speed limit system from Gleisdorf, Austria. (1) Immission noise measurement. (2) Emission noise measurement. (3) Noise reducing pavement. (4) Central noise barrier. (5) Noise barrier with photovoltaic cells. The sign reads: “I want to sleep. Quiet please!” [Bendtsen et al., 2004].
The above results indicate that interactive speed signs may be useful in reducing vehi-cle speeds. The effect seems to be to raise driver awareness of the current or changed speed limit, thus causing more drivers to observe the limit. The above results are all based on the use of interactive signs at a few specific locations. It seems realistic that widespread use of this measure will reduce the effect. The results from Gleisdorf indi-cate that reducing speed on a motorway through signs is only effective to a certain de-gree, but that speed limits which are considered too low are disrespected.
3.5 Automatic traffic control – ATC ATC is a system which combines speed measurement equipment with a camera so that speeding vehicles are photographed and a picture sent to the owner along with a fine. In section 3.4.1 it was reported that installation of ATC had improved drivers’ respect of reduced speed limits on the Nantes ring road based solely on static signs [Bérengier, 2006]. It is not clear whether the increased respect of the speed limits led to the expected noise reductions of 2-3 dB compared with the situation before t he speed reduction.
Krohn (1996) reports of average speed reductions of 5 km/h on road sections with ATC. The average is based on road sections with reductions ranging from 0 to 20 km/h. Mackie (1998) reports of average reductions around 5 mph (8 km/h) based on surveys in a number of countries. The reductions are similar whether cameras are in place or just camera housings. No reductions are obtained with camera warning signs only.
According to Tveit (2005), ATC results in lower speed, but it may also lead to uneven driving patterns, where drivers decelerate at the camera boxes and accelerate between them. Therefore there are now considerations in Norway regarding section based ATC, where control is not only based on individual cameras but also on the total travel speed between cameras on a road section.

46
According to the above results, speed reductions due to ATC are highly dependent on the section on which the ATC is implemented. The noise effect of the reductions also depends on the speed on the road, whether it is a motorway or an urban road. This is not clear in the above figures. A further factor influencing the noise is whether or not there is a change in driving pattern. If the result is as suggested by Tveit (2005), the noise may increase although speed decreases, or the shifts in the sound picture may lead to increased annoyance even though the noise decreases.
3.6 Other measures A number of measures may influence the overall traffic levels in a city. Two examples of such measures are congestion charging and parking information systems, which are treated below. Other measures change the traffic composition and to some extent the traffic levels on specific roads or in certain areas. This may for instance be city logistics or nighttime bans on truck traffic.
Congestion charging has been implemented in London, and in 2006 it has been tested in Stockholm. In London the measuring program does not allow for statistically-robust conclusions, but the results for the four years with congestion charging suggests that this has no detectable impact on noise levels (TfL, 2006). In Stockholm noise levels have been modeled at 152 locations [City of Stockholm, 2006]. The results show that at 18 locations noise levels have decreased by 1-4 dB and at 6 they have increased by 1-4 dB. At the remaining 128 locations changes in noise levels have been less than 1 dB. All in all there is no indication that congestion charging is useful as a tool to reduce road traffic noise.
Parking information systems may reduce the amount of traffic through reducing the extent of driving while seeking for a parking space. An effective parking guidance system may also result in increased traffic to the city, or it may transfer car travel to more sustainable modes, thus reducing traffic [Danish Road Safety and Transport Agency, 2001; DfT, 2003]. Whatever the outcome of such schemes, the effect on noise is likely to be limited, as it generally takes very large changes in the traffic flow to significantly increase or reduce noise levels.
Generally measures which influence the amounts of traffic are unlikely to significantly influence the noise levels on an overall area level unless these measures lead to dra-matic changes. Thus, such measures are not generally applicable as means of noise abatement, but they may have an effect on selected roads.
City logistics have been implemented in a number of cities, but no results have been found considering the effect on noise levels and noise annoyance. In Linköping, Swe-den city logistics lead to reductions in the number of heavy vehicles entering the inner city as well as 14 percent reduction in deliverance time, 26 percent reduction in travel time and 31 percent reduction in stops. All together this indicates a reduction in the heavy vehicle traffic in the city. This reduction is unlikely to influence the LAeq noise levels significantly, but the number of noise events/peaks is reduced. Depending on the time of day of the reduction this may lead to reductions in annoyance and/or sleep disturbance.

47
Nighttime bans on trucks and perhaps motorcycles on a specific road or in an area will reduce the overall nighttime noise levels, depending on the percentage of these vehicles in the overall traffic flow. Just as important may be that such a ban will reduce the number of very high noise peaks, thus reducing the sleep disturbance experienced by those living along the roads. Depending on the type of road and area, some part of the truck traffic, which before a ban drove at night, is likely to drive during daytime instead. This would be the case for traffic with an errand in the area, whereas through traffic is likely to find other routes instead. Thus, such a night ban is likely to increase daytime noise levels and the number of disturbing peaks along the road and also increase nighttime noise levels and peaks along alternative routes. The effect of such a ban depends on the traffic composition at the specific locality.

48
4. Catalogue of measures
This catalogue of measures is a table presenting the main conclusions and comments for each traffic flow measure, as they are given above. The presented potential noise reductions are based on the effects reported in the literature. The effect of a measure in a specific case will depend on the local conditions as to road layout, traffic compo-sition and speed before and after the measure is implemented.
In several cases the effect of a measure on noise is given simply as “determined by speed reduction”. In these cases the noise reduction is a direct effect of reduced speed without influence from changes in driving pattern or noise effects directly linked to the traffic flow measure. In these cases the noise effect may be decided based on the relations presented in Chapter 2, for instance from Table 2.2.

49
Traffic flow measure Effect on noise Comments
Traffic calming Up to 4 dB LAeq reduction. Up to 7 dB LAmax reduction.
- highly dependent on the traf-fic composition and speed, the road layout and the use of the measures below.
Vertical deflections - highly dependent on the traf-fic composition. - depends on the design of the humps. - proper distance between humps/cushions is important.
round-top humps Light vehicles: determined by speed reduction.*
Heavy vehicles: 0 dB LAeq at speeds up to 25 km/h. Higher speeds result in increasing noise. Up to 8 dB LAeqincrease.
flat-top humps Light vehicles: determined by speed reduction.*
Heavy vehicles: Up to 8 dB LAeq in-crease.
wide speed cushions (>1700 mm)
Light vehicles: determined by speed reduction.*
Heavy vehicles: up to 10 dB LAeqand 8 dB LAmax increase.
narrow speed cushions (< 1700 mm)
Light vehicles: determined by speed reduction.*
Heavy vehicles: determined by speed reduction.* Up to 2 dB LAmaxincrease.
Dummy humps Determined by speed reduction.* - initial speed reducing effect may diminish due to driver habituation.

50
Traffic flow measure Effect on noise Comments
Chicanes and road narrowing Determined by speed reduction.*
Braking and accelerating may in-crease noise levels at entrances to and exits from road sections with chicanes and at road narrowing and single lane working chicanes.
- proper distance between chicanes is important. - measures which allow large trucks to pass may not be effective at reducing the speed of cars. - overrun areas allowing trucks to pass narrow chicanes may – if made with paving stones – cause increased noise levels and/or noise pulses whichincrease annoyance. - further studies of noise and annoyance effects are necessary.
Cycle lanes Slight speed reducing effect (?). Noise effects will be negligible.
Gateways Depends on speed reduction.* - gateways are unlikely to have an effect by themselves but may support the effect of other measures.
Rumble devices
traditional devices (paving stones, thermoplastic strips, milled groves)
2-4 dB LAeq increase. - the shift in sound pattern and often pulse like nature of noise from such devices increase the annoyance more than the increase in noise levels would indicate.
‘Rippleprint’ 0 dB - listening panel testing indicates slightly increased annoyance, but this effect may not extend to distances large enough to reach peoples homes.

51
Traffic flow measure Effect on noise Comments
Junctions
roundabouts 1-4 dB LAeq reduction compared with intersections.
- depends on the traffic composition and the layout of the roundabout and the intersection.- further studies are needed to clarify how these factors influence the noise.
mini-roundabouts Up to 4 dB LAeq reduction. - noise reduction due to reduced speed and to changes in driving patterns. - further studies are needed to clarify the influence of the roundabout design and the effect on noise from heavy vehicles.
calming green waves Depends on speed reduction.* - there may be a further effect from changes in driving patterns. - further studies of the effecton both speed, driving pattern and noise are needed.
Speed signs
static signs 0 dB. 1-3 dB reduction – depending on speed reduction* – if speed limits are combined with physical measures, ATC or massive enforcement by police.
interactive signs Up to 3 dB reduction depending on speed reduction.*
- results indicate that speed reductions up to 15-20 km/h may be achieved at locations where speeds are already rela-tively high compared with the speed limits. - whether the effect will be preserved if the measure is used commonly is unknown.
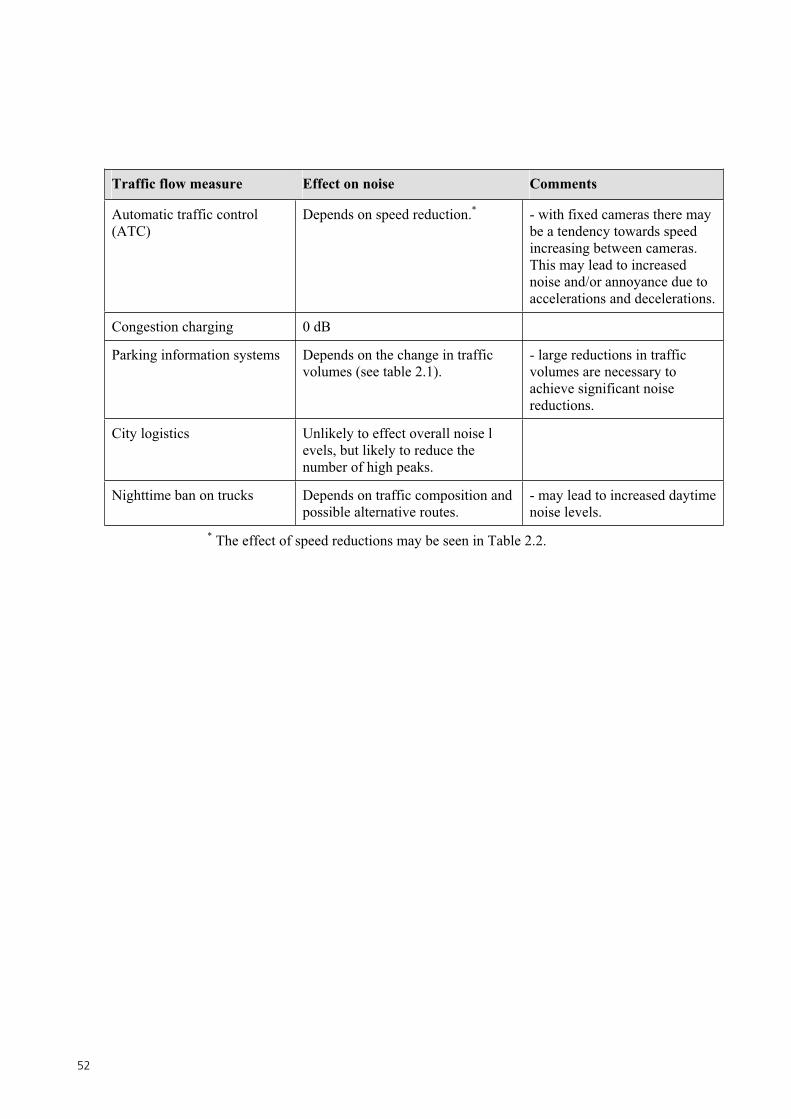
52
Traffic flow measure Effect on noise Comments
Automatic traffic control (ATC)
Depends on speed reduction.* - with fixed cameras there may be a tendency towards speed increasing between cameras. This may lead to increased noise and/or annoyance due to accelerations and decelerations.
Congestion charging 0 dB
Parking information systems Depends on the change in traffic volumes (see table 2.1).
- large reductions in trafficvolumes are necessary to achieve significant noisereductions.
City logistics Unlikely to effect overall noise l evels, but likely to reduce the number of high peaks.
Nighttime ban on trucks Depends on traffic composition and possible alternative routes.
- may lead to increased daytime noise levels.
* The effect of speed reductions may be seen in Table 2.2.

53
5. Conclusions
5.1 Traffic volume One way of reducing road traffic noise is to reduce traffic volumes. On minor roads with small traffic volumes, for example in dwelling areas, this may be an effective measure if large percentages of traffic can be moved to major roads, where traffic volumes are already high. This could for example be achieved by impeding through traffic. This may be done by completely closing roads to through traffic through physical measures or bans, or it could be discouraged by the use of road humps, chicanes or other measures. Narrow cushions and round-top humps are preferable from a noise perspective. Correct distancing between such measures is important to avoid accelerations and decelerations
On major roads, however, reductions in traffic volumes are rarely feasible solutions to noise problems. Due to the logarithmic nature of the dB scale, large numbers of vehicles would have to be removed in order to result in any significant level of noise reduction. A twenty percent reduction in traffic results in a 1 dB noise reduction, providing that speed, traffic composition and driving pattern is unchanged. This may be possible in specific cases, for instance through building a by-pass, which may lead large amounts of traffic – and often most of the heavy traffic – around an urban area instead of through it. It could also be by implementing parking information systems, if circulating vehicles looking for parking makes up a large percentage of the overall traffic in an area. It may also be possible through long term initiatives in physical planning and traffic planning, if significant amounts of traffic can be transferred to other modes of transport. Results from London and Stockholm indicate that a general initiative such as congestion charging, even if it does limit traffic volumes somewhat, has little or no effect on noise levels.
5.2 Traffic composition The traffic composition is also a factor in determining noise levels. Heavy vehicles and motorcycles are noisier than cars. Often cars still dominate the LAeq levels, but even when this is the case, the noisier vehicles produce noise peaks, which may cause annoyance, disturbance and/or awakening. It may be possible to reduce the number of heavy vehicles on a road or in an area through planning initiatives, which move this traffic to less vulnerable roads and areas, or through city logistics initiatives, which concentrate freight in a city on fewer vehicles. Problems of sleep disturbance may be reduced through nighttime bans or charging on trucks and perhaps also motorcycles. Bans are likely to move some of the traffic to the daytime and thus may worsen day-time noise levels and problems of disturbance and annoyance.

54
5.3 Speed reductions Speed reductions are a way of reducing traffic noise, providing that the necessary measures do not lead to an increase in accelerations and decelerations. The effect depends on the traffic composition, but for both light and heavy vehicles the largest reductions are achieved at low speeds. At speeds below 50 km/h, noise reductions of 2-3 dB LAeq are realistic as a result of 10 km/h reductions in actual speeds. A number of traffic claming measures may be used to reduce speeds on minor and in some cases also on major roads, but on many large urban roads, most traditional traffic calming measures are inapplicable. On such roads, speed limits enforced through automatic traffic control (ATC) or by police enforcement is the main measure available. Calming green waves may also be a possibility, but this needs to be confirmed.
5.4 Driving pattern The driving pattern of traffic on a road influences noise levels. Stop-and-go driving leads to higher noise emissions, because accelerating vehicles make more noise than vehicles driving at a steady pace. Several surveys have shown that roundabouts lead to less noise than intersections with or without signalization. This is to a large extent because more vehicles can pass without having to come to a complete stand-still. Coordinated signalization in the form of calming green waves may also be a measure to secure more even driving patterns. This needs further testing.
5.5 Research needs Speed humps and cushions are by far the measures which have been subject to most studies. The main research need for these measures is to determine the optimal distance between the measures in order to maintain an even driving pattern without large differences in speeds at and between the measures. Such optimal distances may be general for speed reducing measures, also including chicanes and mini-roundabouts, or they may be specific for the various types and layouts of measures. This needs to be clarified.
If dummy humps are to be used, it should be clarified whether their effect on speed is permanent or there is a driver habituation. Chicanes and road narrowing should be studied further to gather knowledge on the noise and annoyance effects of such measures. Especially the use of various forms of overrun areas in chicanes needs to be studied.
There is a great need for clarifying the noise and annoyance effect of various layouts of junctions, both signalized and non-signalized intersections and roundabouts. Also mini-roundabouts should be studied further in relation to the effect on noise and an-noyance. It should also be clarified whether there is a difference in the effect on speed, noise and annoyance depending on the construction of mini-roundabouts, whether painted, constructed with various paving stones, or otherwise constructed.

55
Calming green waves appear to be a promising measure for securing even driving patterns at low speed, and thus also for noise reduction. The initial results found in the literature merits further surveys to clarify the potential. ‘Rest on red’ and ‘rest on green’ signalizing schemes may have potential for noise reduction. This should be studied further.

56
References
Abbott, P. G., Phillips, S. M. and Layfield, R. E., 1995a. Vehicle and traffic noise surveys alongside speed control cushions in York. Wokingham: Transport Research Laboratory. Project Report 103. Abbott, P., Tyler, J. and Layfield, R., 1995b. Traffic calming: vehicle noise emis-sions alongside speed control cushions and road humps. Wokingham: Transport Research Laboratory. TRL Report 180. Abbott, P., Taylor, M. and Layfield, R., 1997. The effects of traffic calming meas-ures on vehicle and traffic noise. Traffic Engineering + Control, 38 (9), 447-453. Abbott, P., Chinn, L., Nelson, P. and Watts, G., 2003. Traffic calming in Longlevens, Gloucester – Noise, vibration and public attitudes. Wokingham: TRL Limited. Project Report PR/SE/816/03. Aigner, G., ????. Alternativen im modernen Lärmschutz - Was kann die neue MLA wirklich, Vienna: ASFINAG. Available from http://www.asfinag.at/docs/gernot_aigner.pdf [Accessed 4 August 2006]. Andersen, B., 2003. Støjudsendelse fra biler på vejnettet. Kgs. Lyngby: Danish Transport Research Institute. Report 2. In Danish with English summary. Available from http://www.trm.dk/graphics/Synkron-Library/DTF/PDF/Rapporter/rap0203.pdf[Accessed 5 July 2006]. Austroads, 2005. Modelling, Measuring and Mitigating Road Traffic Noise. Syd-ney: Austroads Incorporated. Austroads Research Report AP-R277/05. Bredenfeldt, H. and Nilsson, A., 2004. Traffic Noise in Crossings and Roundabouts, Gothenburg: Chalmers University of Technology, Department of Applied Acoustics. Report E04-12. Bendtsen, H., 1987. Effekt af miljøprioriteret gennemfart. Forurenings-effekterne. Støj, luftforurening, vibrationer og energiforbrug, Vinderup. Copenhagen: Danish Road Directorate. Report 52. In Danish with English summary. Bendtsen, H. and Høj, J., 1990. Rumlefelter of støj. Copenhagen: Danish Road Directorate, Road Data Laboratory. Note no. 4. In Danish with English summary. Bendtsen, H., Michelsen, L., Reif, K. and Reiff, L., 1998. Vejtrafik og støj – en grundbog. Copenhagen: Danish Road Directorate. Report 146. In Danish. Available from http://www.vejdirektoratet.dk/dokument.asp?page=document&objno=69898 [Ac-cessed 30 June 2006]. Bendtsen, H. and Larsen, L.E., 2000. Støjbekæmpelse i Tyskland og Schweiz. Co-penhagen: Danish Road Directorate. Note 73. In Danish. Available from http://www.vejdirektoratet.dk/publikationer.asp?page=document&objno=84634[Accessed 7 July 2006].
Bendtsen, H. and Larsen, L.E., 2001. Støj ved bump på veje. Kgs. Lyngby: Danish Transport Research Institute. Report 2. In Danish with English

57
summary. Available from http://www.trm.dk/graphics/Synkron-Library/DTF/PDF/Rapporter/rap0201.PDF [Accessed 7 July 2006]. Bendtsen, H., Haberl, J., Litzka, J., Pucher, E., Sandberg, U. and Watts, G., 2004. Traffic management and noise reducing pavements – Recommendations on addi-tional noise reducing measures. Copenhagen: Danish Road Directorate. Report 137. Available from http://www.vejdirektoratet.dk/publikationer/VIrap137/index.htm[Accessed 3 July 2006]. Bérengier, M., 2002. “Acoustical impact of traffic flowing equipments in urban ar-eas”. In: Proceedings of Forum Acusticum, September 2002 Sevilla. European Acoustical Association. Bérengier, M., 2005. Urban Traffic Noise Management – French Experiments.Nantes: LCPC. Silence Report No. H.R1. Unpublished. City of Stockholm, 2006. Utvärdering av Stockholmsförsöket – buller.Stockholm: Environmental Administration. Available from http://www.stockholmsforsoket.se/upload/Rapporter/Miljö-stadsliv/Under/Buller_slutrapport.pdf [Accessed 22 September 2006]. Cloke, J., Webster, D., Boulter, P., Harris, G., Stait, R., Abbott, P. and Chinn, L., 1999. Traffic calming: Environmental assessment of the Leigh Park Area Safety Scheme in Havant. Wokingham: TRL. TRL Report 397. Danish Road Safety and Transport Agency, 2001. IT i biler. Copenhagen. DfT, 1993. Gateways. London: Department for Transport. Traffic Advisory Leaflet 13/93. Available from http://www.dft.gov.uk/stellent/groups/dft_controldocuments/contentservertemplate/dft_index.hcst?n=9300&l=3[Accessed 12 July 2006]. DfT, 1994. Horizontal deflections. London: Department for Transport. Traffic Ad-visory Leaflet 9/94. Available from http://www.dft.gov.uk/stellent/groups/dft_controldocuments/contentservertemplate/dft_index.hcst?n=9300&l=3[Accessed 12 July 2006]. DfT, 1996. Traffic calming – traffic and vehicle noise. London: Department for Transport. Traffic Advisory Leaflet 6/96. Available from http://www.dft.gov.ukstellent/groups/dft_control/documents/contentservertemplate/dft_index.hcst?n=9300&l=3 [Accessed 12 July 2006]. DfT, 1997. Chicane schemes. London: Department for Transport. Traffic Advisory Leaflet 12/97. Available from http://www.dft.gov.uk/stellent/groups/dft_control/documents/contentservertemplate/dft_index.hcst?n=9300&l=3 [Ac-cessed 12 July 2006]. DfT, 1998. Sinusoidal, “H” & “S” road humps. London: Department for Trans-port. Traffic Advisory Leaflet 9/98. Available from http://www.dft.gov.uk/stellent/groups/dft_control/documents/contentservertemplate/dft_index.hcst?n=9300&l=3 [Accessed 12 July 2006]. DfT, 1999. 20 mph speed limits and zones. London: Department for Transport. Traffic Advisory Leaflet 9/99. Available from http://www.dft.gov.uk/stellent/groups/dft_control/documents/contentservertemplate/dft_index.hcst?n=9300&l=3 [Accessed 12 July 2006].

58
DfT, 2003. Parking Guidance and Information. London: Department for Transport. Traffic Advisory Leaflet ITS 4/03. Available from http://www.dft.gov.uk/stellent/groups/dft_roads/documents/page/dft_roads_508242.pdf[Accessed 12 July 2006]. DfT, 2003. Access control. London: Department for Transport. Traffic Advisory Leaflet ITS 6/03. Available from http://www.dft.gov.uk/stellent/groups/dft_roads/documents/page/dft_roads_508244.pdf [Accessed 12 July 2006]. Döldissen, A., 1988. Environmental Traffic Management – German Interministerial Research Programme. In: Proceedings of Seminar M, Environmental Issues at Transport & Planning, 16th Summer Annual Meeting, September 1988. London: PTRC Educational and Research Services Ltd, 71-85. DRD, 2000. Geometrisk udformning af veje og stier i byområder – Fartdæmpere. Copenhagen: Danish Road Directorate. Vejregler. Available from http://www.vejregler.dk/pls/vrdad/vr_layout.vis?p_gren_id=3451[Accessed 15 November 2006]. EC, 1996. FUTURE NOISE POLICY. Brussels: European Commission. Green Pa-per.Ellebjerg, L. 2007. Effectiveness and Benefits of Traffic Flow Measures on Noise Control. SILENCE project. Deliverable no. H.D1. Available from http://www.silence-ip.org/site/fileadmin/SP_H/SILENCE_H.DI_20070105_DRI_Final.pdf [Accessed 27 July 2007]. Ellenberg, M. and Bedeaux, J.-F., 1999. “Calming waves for safety. A time to rethink green waves?” Traffic Technology International, April/May 1999, 55-58.Elliott, M. A., McColl, V. A. and Kennedy, J. V., 2003. Road design measures to reduce drivers’ speed via ‘psychological’ processes: A literature review. Woking-ham: TRL Limited. TRL Report TRL564. Greibe, P. and Nilsson, P. K., 1999. Speed Management. National practice and experiences in Denmark, the Netherlands and in the United Kingdom. Copenhagen: Danish Road Directorate. Report no. 167. Griefahn B, 1985: Schlafverhalten und Geräusche. Feld- und Laboruntersuchungen über Straßenverkehr, EEG-Analyse, Literaturauswertung. Stuttgart: Ferdinand Enke.Griefahn B, 1992: “Noise control during the night”. Acoust Austral 20:43-47. Harris, G. J., Stait, R. E., Abbott, P. G. and Watts, G. R., 1999. Traffic calming: Vehicle generated noise and ground-borne vibration alongside sinusoidal, round-top and flat-top road humps. Wokingham: Transport Research Laboratory. TRL Report 416. Hedström, R., 1999. Miljøeffekter av 30 km/t i tätort – med avseende på avgasutsläpp och buller. Linköping: Swedish National Road and Transport Insti-tute. VTI M869. In Swedish with English summary. Available from http://www.vti.se/templates/Report____2796.aspx?reportid=4303[Accessed 12 July 2006]. Hydén, C., Odelid, K. and Várhelyi, A., 1995. Effekten av generell hastighets-dämpning i tätort, Lund: University of Lund, Department of Traffic Planning and Engineering. Bulletin 131. Jonasson, H., Sandberg, U., van Blokland, G., Ejsmont, J., Watts, G. and Luminari, M., 2004. Source modelling of road vehicles. Borås: SP.

59
Technical Report, HAR11TR-040210-SP10. (Deliverable 9 of the EU project HARMONOISE). Available from http://www.imagine-project.org /bestanden/D07_WP1.1_HAR11TR-020614-SP05.pdf [Accessed 14 July 2006]. Kathmann, T. and Cannon, R. 1999. “Speed limits as a noise reducing measure in Germany”, Highways & Transportation, 46, Sept. 1999, 8-11. Kragh, J., Jonasson, H., Plovsing, B., Sarinen, A., Storeheier, S. Å. and Taraldsen, G., 2006. User’s Guide Nord2000 Road. Hørsholm: DELTA. AV 1171/06. Krohn, F., 1996. Automatisk trafikkontrol, opsummering av effekter(in Norwegian). Oslo: Norwegian Public Roads Administration – Directorate of Public Roads. Report no. TTS 7/1996. Krux, W. and Kathmann, T.1998. “Lärmreduzierung durch Geschwindigkeits-beschränkungen” (in German), Strassenverkehrstechnik, no. 1, 1998, 28-32. Larsen, L., 2003. “Effekt af variable tavler på landeveje – kollektiv og individuel feedback” (in Danish). In: H. Lahrmann and J. Nielsen, ed. Konferencerapport, Trafikdage på Aalborg Universitet, 26-27 August 2003 Aal-borg. Aalborg: Aalborg University, Department of Development and Planning.Mackie, A., 1998. Urban speed management methods. Wokingham: Transport Re-search Laboratory. TRL Report 363. Marek, J. C. and Walgren, S, ????. Mid-Block Speed Control: Chicanes and Speed Humps, Seattle: Seattle Department of Transportation. ITE-Report. Available from http://www.seattle.gov/transportation/docs/ITErevfin.pdf[Accessed 12 July 2006]. Merétei, T., Simonyi, Á. and Hajdú, S. 2000. “Effect of conversion of crossroads to roundabouts on air pollution in urban and rural areas”, Proceedings of the 9th Inter-national Symposium “Transport and Air Pollution”. Arcueil: Inrets. 559-566. Norwegian Public Roads Administration, 2005. Environmental Speed Limit – Na-tional 4 Trondheimsveien. Oslo. OECD/ECMT, 2006. Country Reports on Road Safety Performance. Available from http://www.cemt.org/JTRC/WorkingGroups/RoadSafety/Performance/TS3-report.pdf [Accessed 20 December 2006]. Plüss, P., Meury, F. and Mohler, P., 2003. “Verringerung der Lärmbelastung durch die Umgestaltung einer ampelgeregelten Kreuzung in einer Kreisel”, Strasse und Verkehr, 89 (10), 25-27. Rosbach, O., Wellis, W., Jørgensen, L. and Mertner, J., 1996. Miljøprioriteredegennemfarter. Effekter i 21 byer. Copenhagen: Danish Road Directorate. Report no. 70. Sayer, I. A. and Parry, D. I., 1994. Speed control using chicanes – A trial at TRL.Wokingham: Transport Research Laboratory. Project Report 102. Sayer, I. A., Parry, D. I. and Barker, J. K., 1998. Traffic calming – an assessment of selected on-road chicane schemes. Wokingham: Transport Research Laboratory. TRL Report 313. Schoneman, N. F., ????. Low Cost vs. High Cost Traffic Calming Devices in Seat-tle, Seattle: Seattle Department of Transportation. Available from http://www.seattle.gov/transportation/docs/TorontoNoel1.pdf[Accessed 12 July 2006]

60
Steven, H., 2005. Investigations on Noise Emission of Motor Vehicles in Road Traffic. Research Project 200 54 135, Final Report. Wuerselen: RWTUEV Fahr-zeug GmbH. Steven, H., 2006. Figures prepared by Heinz Steven, RWTUEV Fahrzeug GmbH, Wuerselen, Germany. Storeheier, S. Å. and Skaalvik, K., 1987. Trafikkstøy fra rundkjøring(Traffic noise from a roundabout), Trondheim: ELAB – SINTEF. Report STF44 A87149. TfL, 2006. Central London Congestion charging. Impact monitoring – Fourth An-nual Report, June 2006. London: Transport for London. Available from http://www.tfl.gov.uk/tfl/cclondon/pdfs/FourthAnnualReportFinal.pdf[Accessed 12 July 2006]. Tveit, Ø., 2005. “Intensivert bruk av fotobokser kan svekke trafikksikkerhetseffekten” (in Norwegian). Samferdsel, No. 4 2005. Watts, G. R., Stait, R. E., Godfrey, N. S., Chinn, L. and Layfield, R., 2002. Development of a novel traffic calming surface ‘Rippleprint’. Wokingham: TRL Limited. TRL Report TRL545. Watts, G. R., Abbott, P. G. and Nelson, P. M., 2005. Traffic noise reduction toolkit.Wokingham: TRL Limited. Published Project Report PPR 047. Webster, D. C., 1995. Traffic calming – Vehicle activated speed limit reminder signs, Wokingham: Transport Research Laboratory. TRL Report 177. Webster, D., Tilly, A., Wheeler, A., Nicholls, D. and Buttress, S., 2006. Pilot home zone schemes: summary of the schemes. Wokingham: TRL Limited. TRL Report TRL654.Wellis, W., Greibe, P., Andersson, P. K., Lund, B. C., Ágústsson, L. and Pedersen, B.W., 2004. 21 miljøprioriterede bygennemfarter. Den trafiksikkerheds-mæssige effekt. Copenhagen: Danish Road Directorate. Report no. 281. In Danish with English summary. Available from http://www.vejdirektoratet.dk/publikationer/VDrap281/index.htm[Accessed 7 July 2006]. Wernsperger, F. and Sammer, G., 1995. Results of the scientific investigation ac-companying the pilot trial of 30 kph limit in side streets and 50 kph limit in priority streets. In: Traffic Management and Road Safety. Proceedings of Semi-nar G held at the 23rd PTRC European Transport Forum, University of Warwick, September 11-15 1995. London: PTRC Education and Research Services Ltd. Vol. P394, 1995, pp. 27-38 Wheeler, A. H. and Taylor, M. C., 1999. Traffic calming in villages on major roads: Final report. Wokingham: Transport Research Laboratory. TRL Report 385. Winnett, M. A. and Wheeler, A. H., 2002. Vehicle-activated signs – a large scale evaluation. Wokingham: TRL Limited. TRL Report 548.

Rapport / Report
Nr. No.
Titel/Title/Shortcut Forfatter/Author
136 European co-operation in COST 347 - Bringing ALT activities closer together
Gregers Hildebrand Michael E. Nunn
137 Traffic management and noise reducing pavements - Recommendations on additional noise reducing measures
Hans BendtsenJürgen Haberl, Johan Litzka
Ernst PucherUlf Sandberg
Greg Watts
138 Mechanistic Design of Semi-Rigid Pavements - An Incremental Approach
Finn ThøgersenChrist ian Busch
Anders Henrichsen
139 Holdbarhed af Drænasfalt Carsten Bredahl NielsenJørn Raaberg
Erik Nielsen
140 Indbygning af skrivekridt - Et fuldskalaforsøg
Sten ThorsenPoul PanduroKnud A. Pihl
141 Noise reducing pavements - State of the art in Denmark
Hans BendtsenBent Andersen
142 Economic assessment of traffic noise in planning – Danish experiences
Lars El lebjergHans Bendtsen
143 Organising urban noise abatement - New ideas
Hans Bendtsen Lene Nøhr Michelsen
Brian Kristensen
144 Two-layer porous asphalt- for urban roads
Hans BendtsenBent Andersen
Jørn RåbergLars El lebjergJørgen Kragh
145 Thin noise reducing pavements - Experiences
Hans BendtsenBent Andersen
146 Cost-benefit analysis on noise-reducing pavements Lars El lebjerg
147 Traffic management and noise - INTER-NOISE 2006 Hans BendtsenLars El lebjerg
148 Noise reducing thin layers for highways - INTER-NOISE 2006
Hans BendtsenSigurd N. Thomsen
149 Noise reducing thin pavements – urban roads Sigurd N. ThomsenHans BendtsenBent Andersen
150 Integration of noise in PM Systems - Pavement Management and noise
Hans BendtsenBjarne Shmidt
151 Noise Control through Traffic Flow Measures - Effects and Benefits
Lars El lebjerg

Road DirectorateNiels Juels Gade 13P.O. Box 9018DK-1022 Copenhagen KDenmarkTelephone +45 7244 3333Telefax +45 3315 6335
Road DirectorateGuldalderen 12DK-2640 HedehuseneDenmarkTelephone +45 7244 7000Telefax +45 7244 7105
Road DirectorateThomas Helsteds Vej 11P.O. Box 529DK-8660 SkanderborgDenmarkTelephone +45 7244 2200Telefax +45 8652 2013