Embed Size (px)
Citation preview

This paper presents preliminary findings and is being distributed to economists
and other interested readers solely to stimulate discussion and elicit comments.
The views expressed in this paper are those of the authors and do not necessarily
reflect the position of the Federal Reserve Bank of New York or the Federal
Reserve System. Any errors or omissions are the responsibility of the authors.
Federal Reserve Bank of New York
Staff Reports
Trading Activity in the Indian Government
Bond Market
Michael Fleming
Seema Saggar
Samita Sareen
Staff Report No. 785
August 2016
Revised August 2016

Trading Activity in the Indian Government Bond Market
Michael Fleming, Seema Saggar, and Samita Sareen
Federal Reserve Bank of New York Staff Reports, no. 785
August 2016; revised August 2016JEL classification: G12, G15, H63
Abstract
We study how the Indian government bond market functions, how it has changed over time, and
what factors help explain some of its features. Looking at the primary market, we describe how
underwriting obligations are allocated to primary dealers via auction and identify several
significant determinants of the underwriting commission cutoff rate, including the launch of the
Negotiated Dealing System-Order Matching System (NDS-OM) electronic trading platform.
Turning to the secondary market, we explore the importance of benchmark bonds, the launch of
NDS-OM, the growth in trading activity, and the migration of activity from the over-the-counter
(OTC) market to NDS-OM. We find that benchmark bonds, larger issues, and recently issued
bonds tend to trade more actively, but that the launch of NDS-OM is associated with a reduced
likelihood of a bond trading but greater trading volume conditional on trading. Benchmark bonds,
larger issues, and recently issued bonds are associated with a greater share of NDS-OM trading
volume (as opposed to OTC trading volume), suggesting that the NDS-OM platform is especially
attractive for trading bonds with benchmark attributes.
Key words: India, government bonds, trading activity
_________________
Fleming: Federal Reserve Bank of New York (e-mail: [email protected]). Saggar:
Reserve Bank of India (e-mail: [email protected]). Sareen: New York University (e-mail:
[email protected]). This work was completed while Samita Sareen was at the Centre for
Advanced Financial Research and Learning (CAFRAL). The authors are grateful for the excellent
research assistance of Vinod Dharmarajan, Weiling Liu, Madhusudan Adki, Maruti Nandan
Srivastava, and Zachary Wojtowicz. The authors also acknowledge helpful comments from
Karnath Balan Biju, Golaka C. Nath, Ravi Rajan, and seminar participants at the Ninth Annual
CAFRAL-BIS Workshop of the Asian Research Network and the workshop organized by
CAFRAL and the Internal Debt Management Department of the Reserve Bank of India. The
views expressed in this paper are those of the authors and do not necessarily reflect the position
of CAFRAL, the Federal Reserve Bank of New York, the Federal Reserve System, or the Reserve
Bank of India.

1
I. Introduction
An efficient and well-functioning government securities market is central to the smooth functioning of financial markets more generally. It enables the use of the market for pricing and hedging positions in other fixed income securities, facilitating issuance and secondary market trading in such securities. Government securities' creditworthiness and liquidity can also make them benchmarks for risk-free rates and an important store of value, especially during times of market turmoil. A well-functioning market also facilitates the low-cost financing of government expenditures and the implementation of monetary policy, which is often carried out through the market.
The Indian government bond market is particularly worthy of study. For one, there is its large and growing size and high liquidity. Within Asia, India has the fourth largest government bond market after Japan, China, and South Korea with 569 billion USD of outstanding government bonds as of March 2014 (Asian Development Bank, 2014). The annual turnover of the secondary market for government of India bonds – over four times the debt outstanding – is comparable to that of Japan and South Korea, and much higher than that of China. Numerous studies describe this important market, including Mohanty (2002), Reddy (2002), Mohan and Ray (2009), Nath, Rajaram and Ghose (2009), and Gandhi (2012).
Until as late as the 1990s, Indian government debt issuance was dominated by fiscal considerations, with automatic monetization of fiscal deficits, and interest rates that were administered to contain borrowing costs. Consequently, there was little scope for the development of a government securities market. That changed with the Fiscal Responsibility and Budget Management Act of 2003, which aimed to bring the government’s revenue deficit to zero and fiscal deficit to 3% of gross domestic product over time, while at the same time eliminating the direct participation of the Reserve Bank of India (the central bank) in the issuance of government securities. The act in turn unleashed changes in market infrastructure, making the Indian government securities market a virtual laboratory for analyzing the effects of market structure changes on issuance costs, liquidity, and informational efficiency.
One such change was the launch in August 2005 of the anonymous electronic order matching trading system, Negotiated Dealing System-Order Matching System (NDS-OM). It fundamentally transformed the trading and reporting protocols in the secondary market for government bonds in at least two ways. First, it provided an alternative marketplace for government bonds that involved lower search costs for trade execution relative to over-the-counter (OTC) trading, the primary mode of price discovery and trading prior to NDS-OM. Second, since trade book and order-book information could be reported in real time with NDS-OM, it could be publically disseminated in real time as well, in contrast to the OTC market where trade data is published with a 15-minute lag.
This paper studies the Indian government bond market with a view to better understanding how it functions, how it has changed over time, and what factors help explain some of its features. In particular, we describe the primary market, including the novel manner in which underwriting obligations are allocated to primary dealers via auction, and the secondary market, including the introduction of NDS-OM and the importance of benchmark securities. We present various

2
models to better understand the determinants of underwriting commissions, trading activity, and trading venue. Some studies have examined how the changes ushered in by the 2003 Act influenced the Indian government securities market. Shankar and Bose (2008) examine the variables that affect demand and bid dispersion in primary market auctions. Nath (2007) shows that the secondary market price of a security that is yet-to-be-auctioned declines between the auction announcement date and the actual date of the auction, and that this effect is statistically less pronounced after the introduction of NDS-OM. Nath (2013) examines the 2003 Act’s effect on liquidity and market volatility, and Nath (2006) compares the liquidity premium of bonds trading on and off NDS-OM. In the primary market, we identify several important features, including the two-stage auction mechanism, the preponderance of auctions of existing as opposed to new securities, and the use of both uniform and discriminatory auctions. Focusing on the first stage of the auction process, we find several significant determinants of the auction-determined underwriting commission cutoff rate. In particular, the rate is lower after the introduction of NDS-OM, perhaps because the platform increased the liquidity of newly auctioned securities, thereby lowering the risk of underwriting them. In the secondary market, we identify important features including designated benchmark bonds, the launch of NDS-OM, the growth in trading activity, and the migration of activity from the OTC market to NDS-OM. Focusing on the determinants of activity we find that variables one might expect to be associated with liquidity, such as benchmark status, issue size, and time since issuance are correlated with activity in the expected way. Interestingly, we find that the launch of NDS-OM is associated with a reduced likelihood of a bond trading, but greater trading volume conditional on trading. Analysis of trading venue shows that benchmark bonds, larger issues, and recently issued bonds are associated with a greater share of NDS-OM trading volume (as opposed to OTC trading volume), suggesting that the NDS-OM platform is especially attractive for trading bonds with benchmark attributes. The paper proceeds as follows. In the next section, we provide details on the issuance process in the primary market and trading in the secondary market. Section III describes the data we have assembled from several public sources, including auction-level data for the primary market and daily secondary market data for each bond outstanding during our sample period, and presents some descriptive results. Section IV presents the results of our empirical analysis. Finally, we conclude in Section V. II. Description of the Market for Government of India Bonds A wide variety of government securities are issued by the Reserve Bank of India (RBI) in its role as the government’s fiscal agent. This includes treasury bills with maturities of less than one

3
year and government bonds with longer maturities, referred to as dated securities.1 There are several variations in the dated securities: fixed and floating rate coupons, put/call options, nominal and inflation indexed, and special bonds (such as oil bonds). The focus of this paper is on dated securities with fixed coupons issued by the central government. Figure 1 shows that government debt outstanding increased from 11.9 trillion INR in April 2005 to 51.1 trillion INR in March 2014 and that dated government securities with fixed coupons account for about 70% of the outstanding debt through this period.2 A. Primary Market3
Government of India securities are issued in the primary market through two rounds of auctions: an underwriting auction and a main auction in which securities are sold. Announcement of the auctions are made via a press release on the RBI website, typically on a Monday for an underwriting auction on the Thursday of the same week and the second-round auction on Friday. Both auctions take place on an electronic platform. The underwriting auction is a unique aspect of Indian government bond issuance as compared to other countries. The RBI relies exclusively on primary dealers to underwrite issuance through a two-part mandatory underwriting commitment (MUC). The MUC obligates dealers to underwrite 50% of an issue amount split equally among them. The commission paid on the MUC is determined in a multiple price auction for the remaining 50%. Dealers submit sealed bids to the RBI between 10:30 a.m. and 12:00 noon on the day of the underwriting auction. A bid comprises a price-quantity schedule where the price is the underwriting fee (per INR 100), and quantity is the amount the dealer is willing to underwrite. The second part of the MUC, referred to as additional competitive underwriting (ACU), relates to this auction: at the least primary dealers are obligated to bid their MUC amounts. The cut-off price is the commission at which the ACU demand equals 50% of the issue amount. Bids with commissions below the cut-off price are accepted and the rest are rejected. As in any multiple price auction, successful bidders are compensated for their successful bids as per the commissions they have tendered. As mentioned, the auction also determines the commission paid on the MUC amount. The RBI awards dealers who bid aggressively in the auction. For dealers who are successful in winning at least 4% of the issue amount, the commission is the weighted average of all the accepted bids. Other primary dealers are paid a lower commission: the weighted average of the lowest three bids. Similar to the underwriting auction, the second-round main auction is a multi-unit sealed-bid auction. RBI has the discretion to use the discriminatory or uniform price format, and this is made public in the issuance notification. Entities that hold a current account and a securities account (referred to as a Subsidiary General Ledger (SGL) account) with the RBI can bid
1 Details on the variety of bonds issued by the Government of India can be found in “Government Securities Market in India - A Primer”, Section 1.6, http://www.rbi.org.in/scripts/FAQView.aspx?Id=79#1. 2 Exchange rate as of March 31, 2014, from Foreign Exchange Dealers Association of India. 3 This section is based on the “Government Securities Market in India - A Primer”, which is available here: http://www.rbi.org.in/scripts/FAQView.aspx?Id=79#1.

4
directly in the auctions. This includes primary dealers, banks other than primary dealers, and institutional investors such as insurance companies, large pension funds, and mutual funds. Other potential bidders (for example, corporations, smaller pension funds, non-bank finance companies, and foreign institutional investors) can bid indirectly via primary dealers and other banks.4 Bids are submitted between 10:30 a.m. and 12:00 noon on the auction day. The auction process allows for both competitive and noncompetitive bids. A competitive bid comprises a price-quantity schedule in which the price is quoted per INR 100 face value in case of a reopened bond and in yield terms for a newly issued bond. Noncompetitive bids specify only a bid amount, and up to 5% of the issue amount is reserved for these bids. Successful competitive bids are allotted at the cut-off price in a uniform price auction and at the quoted price in a multiple price auction. Noncompetitive bids are allotted at the weighted average price/yield. The underwriting and second-round auctions are linked in that primary dealers are obligated to bid in the second round at least the amount they have committed to underwrite, including both the ACU and MUC amounts. However, their underwriting commissions are not tied to their success in the second auction. In the event that the bid amount at the cut-off price is less than the issue amount in the second-round auction, primary dealers are obligated to purchase the balance in proportion to their underwriting commitment at the cut-off price. This is referred to as a devolvement. B. Secondary Market Secondary market trading in Government of India bonds takes place on three sub-markets: the Negotiated Dealing System-Order Matching System (NDS-OM), the OTC direct or non-brokered market, and the OTC brokered market. NDS-OM is an electronic, screen based, anonymous, order driven trading system for dealing in Government of India securities, and is owned by the Reserve Bank of India (RBI).5 Participants place bids and offers directly on the NDS-OM screen and can observe bids/offers and trades in real-time. Being order driven, the system matches all bids and offers on price/time priority, that is, for orders of the same price, it matches the oldest order first. Trades happen in multiples of 50 million INR.6 Figure 2, Panel A provides a snapshot of the NDS-OM screen as observed by platform participants.
4 For this, indirect bidders need to open a securities account called a gilt account with a direct bidder, which is eligible to open a Constituents’ Subsidiary General Ledger Account (CSGL) account with the RBI. In this instance, the direct bidder is also the custodian of the indirect bidder’s government securities holdings. Essentially, the CSGL account is a pooled custodial account maintained by a direct bidder for the government securities holdings of entities that maintain a gilt account with it. 5 A detailed description of NDS-OM is available here: http://rbidocs.rbi.org.in/rdocs/Publications/PDFs/NDSOM290410.pdf. 6 To facilitate trading in smaller lot sizes there is a separate ‘odd lot’ segment in which the minimum size is only INR 10,000.

5
In contrast, OTC trades are negotiated over the telephone and the participants are not anonymous. When a deal is struck it is recorded on a deal slip, a specimen of which is shown in Figure 2, Panel B. Participants can deal directly with one another, which we refer to as the OTC direct or non-brokered market. Alternatively, there is the OTC brokered market where negotiations are through a broker registered with the securities regulator, the Securities and Exchange Board of India, and a commission is paid to the broker on trade consummation.7 Most brokered OTC trades are done through member-brokers of the two major stock exchanges, the National Stock Exchange (NSE) and the Bombay Stock Exchange (BSE). NSE and BSE also have an NDS-OM-like screen-based, order driven automated and anonymous trading platform for the wholesale segment of the government debt market.8 Moreover, the stock exchanges have developed screen-based access to the government debt market for retail investors.9 Nonetheless, it is our understanding that trading on these segments continues to be insignificant, and that the exchanges’ debt platforms have ended up as reporting platforms for deals brokered OTC by member-brokers of the exchange.10 Similar to the participants in the second-round auctions, entities with a current account and SGL account with the RBI (that is, direct bidders in the primary market) can trade directly on the NDS-OM and OTC sub-markets. Other players have indirect market access in that they can trade on NDS-OM or OTC only through a subset of the SGL account holders, the primary dealers and other banks. These are the indirect bidders in the second-round auctions. Clearing and settlement of government securities is the exclusive responsibility of the Clearing Corporation of India Limited (CCIL).11 Setup in April 2001, CCIL is a joint stock company with share capital contribution by major banks and financial institutions. CCIL has also developed and maintains for the RBI several dealing and reporting electronic platforms called the National Dealing System (NDS). This includes NDS-OM, a platform for treasury auctions (NDS-Auction),12 reporting of secondary trades, and an interface to the Securities Settlement System of the Public Debt Office at the RBI.13 All trades, irrespective of the market in which they take place, must be reported to the CCIL’s NDS reporting platform. OTC transactions must be reported within 15 minutes of trade
7 Brokers also pay a commission to the NSE. For trade sizes exceeding 100 million INR the commission is currently 0.05 per 100 INR. 8 The first such platform came in June 1994 when the NSE introduced a transparent, fully automated screen-based trading system known as National Exchange for Automated Trading (NEAT) in the wholesale debt market segment. 9 Since January 16, 2003, retail investors have been able to buy and sell government securities from different locations in the country through exchange registered brokers in the same manner as they buy and sell equities. 10 See Nath, Rajaram and Ghose (2009). They suggest that these platforms did not promote liquidity of government securities. 11 CCIL acts as a central counterparty for all transactions in government securities by interposing itself between counterparties. It also guarantees settlement of all trades in government securities so that if any participant fails to provide funds/securities during the settlement process, it makes the same available from its own means. For this purpose it collects margin from all participants and maintains a “Settlement Guarantee Fund”. 12 Since October 2012, these primary market auctions have been conducted on RBI’s e-Kuber electronic platform. 13 The interface facilitates settlement of transactions in government securities (both outright and repos) conducted in the secondary market.

6
confirmation, following which the data automatically flows to the CCIL for clearing and settlement. For NDS-OM, once an order is matched, the deal ticket gets generated automatically and the trade details flow to the CCIL’s reporting platform in real time. Furthermore, once a trade is concluded on NDS-OM it is treated as confirmed for settlement. Trades are settled on a T+1 basis on NDS-OM. Settlement on OTC is also T+1 (and has been since May 24, 2005).14 For orders matched on NDS-OM, information on trades and quotes is disseminated publicly on a close to real-time basis.15 There are three levels at which real-time activity on NDS-OM is published, Quote Watch, Trade Watch, and Market Watch, and a snapshot of each segment is provided in Figure 2, Panels C-E.16 For each security, Quote Watch displays the five best bid and offer prices and quantities available at those prices, along with the total number of bids/offers and quantities available and a daily summary of that day’s activity. Trade Watch displays the trade price, quantity, and timestamp for all trades executed that day for each security. Market Watch displays summary information for that day’s trading activity across all securities. For the OTC sub-market, only trade information is published and there is up to a 15-minute lag from trade execution.17 Figure 2, Panels F-G present OTC Market Watch and Trade Watch snapshots. III. Data Discussion and Descriptive Analysis A. Primary Market Our primary market data set is collected from the press releases of auction announcements and results for both underwriting and second-round auctions.18 We have primary market auction-level data for 72 dated securities with fixed coupon rates issued via 862 auctions between
14 Settlement could be either T+0 or T+1 prior to this date. Each order had a unique settlement date specified upfront at the time of order entry and used as a matching parameter for trade execution. It is mandatory for trades to be settled on the predefined settlement date. Further since October 8, 2005 there are no outright transactions in government securities on Saturdays. Government securities traded on Fridays on a T+1 basis are settled on Mondays or the next business day if Monday is a holiday. See https://www.rbi.org.in/scripts/BS_PressReleaseDisplay.aspx?prid=13658 and http://www.nseindia.com/content/circulars/wdtr6313.htm. 15 There is a short delay reflecting the time it takes to post the information on the internet (https://www.ccilindia.com/OMHome.aspx). Also see http://economictimes.indiatimes.com/markets/stocks/policy/nse-taps-rbi-for-live-gilt-quotes-to-transform-interest-rate-futures-market/articleshow/47507377.cms. 16 During the hours when NDS-OM sub-market is open, real-time Market Watch can be accessed here https://www.ccilindia.com/OMHome.aspx, and real-time Trade Watch can be accessed here https://www.ccilindia.com/OMIT.aspx. 17 Prior to April 22, 2013, real-time OTC deals were published on PDO-NDS (http://www.rbi.org.in/Scripts/NdsUserXsl. aspx), and since then, on NDS-RD (reported deals) (https://www.ccilindia.com/OMRPTDeals.aspx). 18 http://www.rbi.org.in/scripts/BS_PressReleaseDisplay.aspx.

7
January 1, 2003 and June 12, 2014.19 The dataset variables include the dates of the underwriting and second-round auctions, a description of the auctioned security, the issue amount, whether the auction is yield or price-based and uniform or discriminatory, underwritten amount, and the ACU auction cutoff underwriting commission in paise for every 100 INR underwritten.20 Table 1 summarizes significant characteristics of the auctions in our data set. As shown in Panel A, the average coupon rate for all auctions is just under 8% and the average tenor at issuance is just over 17 years. The average auction size is about 40 billion INR, and the average underwriting commission is just under 5 paise per 100 INR, implying that underwriting commissions for the typical auction are roughly 20 million INR. The second-round auctions receive an average of 163 bids and have an average bid-to-cover ratio (bid received amount to issue amount) of roughly 2.4. Of the 862 auctions, only 42 auctions (less than 5%) were for new bonds, with previously issued bonds accounting for the remaining 820 auctions. As shown in Table 1, Panel B, the average number of bids received and bid-to-cover ratio in the second-round auction are significantly higher for newly issued bonds than for reissued bonds. One might have expected higher underwriting commissions for newly issued bonds to compensate primary dealers for the potentially higher uncertainty about the market clearing price (because such bonds would not have the same trading history as reissued bonds), but we find that the average underwriting commission for reissued bonds (5.07) is nearly 2.5 times that of newly issued bonds (2.08). Reissued bonds have an average tenor at issuance of just over 17 years, versus just under 15 years for new issues, indicating that older bonds are more likely to be reissued. The average issuance size of newly issued bonds is larger than reissued bonds by about 7 billion INR (47 billion vs. 40 billion). Irrespective of whether it is a new issue or a reissue, close to 75% of the second-round auctions during our sample period are uniform price, and 25% are single price.21 We find that the average number of bids received and bid-to-cover ratio are significantly lower for uniform than discriminatory price auctions.22 Issuance sizes are also significantly smaller. Underwriting commission rates are also somewhat smaller for uniform auctions (although the difference is statistically insignificant) and the variance of the underwriting commissions is somewhat higher.23 19 During our sample period, there were 37 special bonds issued, which are distinct from dated government securities in that they are not sold via auction. There were also 42 auctions under the Market Stabilization Scheme; these auctions do not have an underwriting round. In addition, one inflation-indexed bond and eight floating rate bonds were issued via 7 and 12 auctions, respectively. Lastly, 14 auctions were cancelled during the sample period, 3 before the underwriting auction and 11 after the underwriting auction. We exclude all these auctions and bonds from our sample. 20 100 paise = 1 INR. 21 For newly issued bonds, 31 of 42 auctions are uniform price and for reissued bonds 615 of 820 bonds are uniform price. 22 It is our understanding that uniform price auctions are typically held during periods of market uncertainty. This finding is thus similar to the finding of Nyborg, Rydqvist and Sundaresan (2002) for Sweden that quantity demand per bidder relative to the issue amount and consequently the bid-to-cover ratio decline significantly with uncertainty. 23 The difference in standard deviations between the two auction formats is significant at the 1% level.

8
The distributions of underwriting commission rates by year are plotted in Figure 3 using Tukey’s boxplots (McGill, Tukey and Larsen, 1978). The figure shows that the average underwriting commission cutoff rate exhibits a declining trend over our sample period, falling from a high of 11.4 paise per 100 INR in 2004 to a low of 1.2 paise in 2012.24 The years 2009 and 2013 are exceptions to the trend with average underwriting commissions of 7 and 13 paise per 100 INR respectively. Moreover, the spreads of the distributions of underwriting commissions for these two years are particularly wide, with standard deviations of commission rates in 2009 (2013) twice (four times) that of auctions in the sample excluding 2009 and 2013. The global financial crisis was in full swing in 2009, and 2013 saw considerable uncertainty surrounding the timing and extent of quantitative easing tapering by the U.S. Federal Reserve. Another interesting aspect of the primary market is that issuance occurs across the curve in a wide range of securities. Table 2 reports the number of auctions of new and reissued securities by years to maturity (rounded to the nearest year) as of the issuance/reissuance date. New securities were issued at 20 maturity points ranging from 5 to 30 years, and reissuance occurred at all 29 maturity points between 2 and 30 years. B. Secondary Market Our secondary market data consists of daily security-specific data for the three sub-markets described in Section II.B: NDS-OM, OTC non-brokered (or direct) and OTC brokered. For each security we have the ISIN, security description, coupon, maturity date, issue date, trade date, high and low prices, last price, and daily volume traded. Our OTC data is from RBI and runs from January 1, 2003 to April 22, 2013. The NDS-OM data is from Bloomberg and CCIL and runs from August 1, 2005 (the first day of trading on NDS-OM) to June 12, 2014.25
Characteristics of the 162 bonds traded at any time during our sample period, are reported in Table 3, Panel A. The average coupon rate is 9.38% and the average tenor at issuance is just over 15 years. Average daily traded volume of 2.8 billion INR is about 1.2% of the average issuance size of 224 billion INR. The bonds traded on 32% of the days they were outstanding during our sample period, on average. Six bonds, excluded from the table, did not trade on any days during the sample period. Over our sample period, trading volume across all sub markets increased markedly, as shown in Figure 4, and at a higher rate than that of debt outstanding (shown in Figure 1).26 Interestingly,
24 This is tantamount to 5 billion INR of reduced commission payments to the dealers for the 6260 billion INR underwritten in 2012 versus being compensated at the 2004 rates. 25 CCIL data was made available to us from May 21, 2007 to April 17, 2014. We relied on data from Bloomberg to fill in the gaps. 26 Comparison by financial year (ending March 31) shows that the annual growth rate of trading volume was significantly higher than that of outstanding government debt other than in 2010. While the average annual growth rate of outstanding debt was relatively constant at around 18% since 2006 (whether or not government bonds other than fixed-rated dated Government of India bonds are included), that of secondary market trading volume was more than double at 40%. Data for the comparison is compiled from Figure 1 and the Handbook of Statistics, Ministry of Finance, Table 1A Column 2 (for outstanding debt) and Table 11 Column 2 (for trading volume) which can be accessed here: http://www.finmin.nic.in/the_ministry/dept_eco_affairs/middle_office/handbook_stat_Debt.pdf.

9
the number of bonds both trading and outstanding on a given day trended down over our sample period, as shown in Figure 4, implying an even sharper increase in trading volume per security over time. Trading prevalence – the number of bonds trading on a given day divided by the number of bonds outstanding – shows no long-term trend over our sample. Next we confine ourselves to the period after the introduction of NDS-OM, and in Table 3, Panel B compare characteristics of bonds trading on different sub-markets. Average daily trading volume of a bond traded on NDS-OM is over six times that of a bond traded OTC. Differences in coupon rate, issuance size, tenor at issuance, and fraction of days traded are not statistically significant. Consistent with the high level of trading volume of bonds trading on NDS-OM, Figure 5 shows that the increase in trading volume over time can be attributed to activity occurring on NDS-OM, with OTC activity showing little long-term trend. Given the divergent patterns of trading volume (Figure 5), it is no surprise to see that the share of trading volume accounted for by NDS-OM has increased over time, as shown in Figure 6. From a share averaging 50% in 2006, NDS-OM share trended upwards to above 70% in 2007-2009, and then above 80% after 2010. The decomposition of daily OTC trading volume suggests that NDS-OM gained market share at the expense of the OTC brokered sub-market relative to the OTC direct sub-market. Before NDS-OM, OTC brokered market accounted for over 80% of the daily trading volume, but the OTC brokered and OTC direct shares quickly converged to similar levels after the introduction of NDS-OM. C. Benchmark Bonds An additional aspect of bonds that we observe is whether or not they are benchmarks. The Fixed Income Money Market and Derivatives Association of India (FIMMDA) releases a list of bonds it deems to be benchmarks as of the end of each trading day.27 Broadly, for each maturity year, FIMMDA selects the most liquid bond in terms of volume traded and number of trades subject to minimum activity thresholds.28 Table 4 reports summary statistics for the benchmark bonds. It is similar to Table 3 except that it only reports statistics for bonds deemed a benchmark by FIMMDA and only over trade days a bond is a benchmark. A comparison of Table 4 with 3 suggests that benchmark bonds are more liquid. Issuance sizes are about 100 billion INR larger (334 billion versus 224 billion), daily
27 The daily benchmark releases are accessible from FIMMDA website, http://www.fimmda.org/, with a subscription. Since March 2013, FIMMDA refers to benchmark bonds as “Nodal Points”. 28 Bonds are declared to be benchmarks on a retrospective monthly basis by FIMMDA. There is a benchmark bond corresponding to each maturity year of the stock of outstanding bonds. The general principle is that a bond can be deemed a benchmark if the monthly volume traded and number of trades exceed a threshold of INR 10 billion and 100 trades respectively in the preceding month. In the instance when, the daily volume traded and number of trades of a non-benchmark bond exceeds the threshold on a specific trading day, then this bond displaces the benchmark for the corresponding maturity year. For example, one such instance was when a new bond 8.83 GS 2023 was issued in the middle of the month on November 22, 2013. The volume traded was over INR 78 billion on November 25, 2013, the first day it began trading. This bond was declared to be a benchmark bond for the maturity year 2023 displacing the bond 7.16 GS 2023, the existing benchmark.

10
traded volume is nearly three times as large (7.8 billion vs. 2.8 billion), and fraction of days traded is higher (46% vs. 32%). A limitation of FIMMDA benchmark identification is that it does not report the tenor in which the bond is a benchmark. Bloomberg, in contrast, publishes a daily listing of benchmark bonds by tenor for 2-10, 15 and 30 years, applying a proprietary methodology on the FIMMDA data. We combine the tenor-specific daily identity of the benchmark bond with the daily NDS-OM and OTC trade data to construct daily volume traded and last price data series for the benchmark bonds. Table 5, Panel A shows that Bloomberg identifies the benchmark bond of a given tenor for 77% of the 2646 trading days in our sample, on average, but that there is considerable variation across tenors. The 10-year benchmark is identified for 94% of the trade days, followed by the 5-year benchmark at 91%, with the 15-year bond lowest at only 57%. Panel A also shows that the 10-year trades on 91% of the days there is a benchmark in that tenor, again followed by the 5-year note at 88%, with the 3-year bond lowest at 58%. Panel B shows that for days there is trading activity, the average volume traded of the 10-year benchmark (28 billion INR) is 4-21 times larger than that for any other benchmark tenor. Figure 7 plots the daily price (per 100 INR face value) and equivalent yield for the 10-year benchmark bond. There are noticeable spikes in the price on the date that Bloomberg switches to a new bond (ISIN) underlying the benchmark. In several instances there are steep coupon rate changes between the underlying benchmark bonds. Consequently, we plot the price equivalent yield and note the same pattern in daily 10-year benchmark yields. The difference in magnitude between the average absolute daily yield changes on ISIN switch dates versus dates with no switch is over 20 basis points. Figure 7 also identifies whether there was an auction within the 20 trade days prior to the switch date for the bond that became the new benchmark, and whether this auction is for a newly issued bond or a reissued bond. It is interesting to observe that auction dates typically coincide with switch dates or precede them by a few days. Moreover, we can see that this phenomenon is limited to the period since NDS-OM’s launch, and that there is no apparent relationship between auctions and switch dates in the pre-NDS-OM period. Distinct from these one-off price spikes, there are relatively prolonged periods of stress during 2003, 2008-2009, and 2013. This is evident from Figure 8, which plots daily volatility of the 10-year benchmark bond, measured by the standard deviation of daily returns over a 10-day moving window. Returns are obtained from the daily secondary market price series constructed by combining the OTC and NDS-OM 10-year benchmark bond daily price series. It is the NDS-OM price on days trading occurs on NDS-OM, and the OTC price on days trading occurs only OTC. Care is taken to ensure that returns are only calculated for a given bond, so as to avoid artificial spikes in volatility when the benchmark bond changes.29
29 Specifically, the return is set to be missing when the bond changes. Because of the high number of days with no trade prices for the benchmark bond, we fill in missing observations with the last valid price for a given benchmark bond (assuming that benchmark bond also trades after the missing observation period). Volatility itself is deemed to

11
IV. Empirical Results The preceding discussion and descriptive analysis identify numerous interesting features about the market for Government of India debt. In the primary market, this includes the underwriting commission rate and the possible effects of auction type, whether the auctioned bond is a reopening, auction year, and other factors. In the secondary market it includes the effects of NDS-OM, benchmark status, and other factors. In this section, we present results of several additional analyses to better understand the drivers of auction cutoff rates and trading activity. A. Underwriting Commissions We showed earlier that underwriting commission rates are (significantly) lower for newly issued bonds, (insignificantly) lower for bonds sold in uniform price auctions, and that they vary significantly over time. Moreover, as shown in Figure 9, which plots underwriting commission rates over time along with volatility, much of the time series variation seems to be correlated with market volatility. In addition, we documented interesting changes in the secondary market over time, such as the sharp increase in trading volume and the migration of trading to the NDS-OM platform. We proceed to test more formally how underwriting commissions are affected by various factors in an effort to better understand the determinants of debt issuance costs. In particular, we regress the underwriting commission cutoff rate in each ACU auction on an indicator variable that takes the value one if the underwriting auction is held post NDS-OM and zero otherwise, on market volatility the preceding trading day (as defined earlier and presented in Figure 8), and on several other variables:
∗ ∗ ∗ 1 In equation (1), t indexes the date on which the ACU auction is held. Typically, multiple bonds of varying tenors are underwritten on a day (and at the same time), so m is an index for the bond being underwritten. , the commission cutoff rate in auction m on date t, is expressed in natural logarithms. Other variables in the model are represented by the vector . They include the coupon rate of the auctioned bond, its residual maturity on the underwriting auction date, the natural log of the issuance size, and indicator variables for whether the auctioned bond is a reissue, whether the second-round auction is a uniform price auction, and whether the bond was on the list of FIMMDA-deemed benchmarks on the day preceding the underwriting auction date. Liquidity adjustment facility is a variable equal to the net liquidity injections by the RBI on the day
be missing if there are fewer than five days with non-missing prices for the ten-day moving window over which it is computed. This accounts for the gaps observed in the volatility series in Figure 8. Note that the standard deviation of daily returns was also computed over a 20-day moving window with at least 10 days of non-missing prices. Moreover, both the 10-day and 20-day moving window measures were also computed without replacing missing daily prices. The four series are highly correlated with correlation coefficients in the range of 0.90-0.97. The plotted series has the largest number of daily observations at 2758.

12
preceding the underwriting auction. These are part of the daily liquidity mismatch operations conducted by the RBI in the form of repos/reverse repos and may ease financing constraints faced by dealers in committing to underwrite an auction. The bid-to-cover ratio in the second-round auction is used as a proxy for auction demand.30 The least squares regressions results are reported in Table 6 and broadly support the idea that underwriting commissions decrease with the expected liquidity of the bond to be auctioned and increase with expected volatility. Starting with the univariate results in columns (1) – (10), we find that underwriting commissions are significantly lower after the introduction of NDS-OM, which we showed earlier is associated with increased trading activity. Commissions are also significantly lower for benchmark bonds and for larger issues, which are likely expected to be more liquid as expected liquidity increases. Moreover, commissions are negatively and significantly correlated with net liquidity injections, suggesting that the injections ease dealers’ financing constraints. In contrast, volatility is significantly and positively correlated with underwriting commissions, accounting for 37% of the variation in underwriting commissions (more than any other variable). Residual maturity is also positively and significantly correlated with commissions, consistent with the idea that longer duration bonds are expected to be more volatile in price terms. Other significant coefficients are the bid-to-cover ratio, reissue indicator variable, and coupon rate. The negative bid-to-cover ratio coefficient means that underwriting commissions are lower when demand is higher, which seems intuitive. The positive coefficient for reissue indicator and negative coefficient for coupon rate are harder to interpret. The uniform price auction indicator variable is the only variable not significant in the univariate regressions, suggesting that the type of auction used in the second stage does not affect underwriting commissions. The results of the multivariate regression model displayed in Column (10) of Table 6 are in line with the findings in the univariate models. The most notable differences are that issuance size is insignificant in the multivariate model and the sign on the coupon rate coefficient flips. Every other coefficient significant in the univariate regressions is significant in the multivariate and of the same sign. The adjusted R2 of the multivariate model is over 51%, showing that over half the variation in underwriting commissions is explained by our model. Qualitatively similar results are obtained when the multivariate regression is run using only the period 2003-2007 as a robustness check excluding the global financial crisis and its aftermath. B. Models of Trading Activity We showed earlier that trading activity varies significantly across bonds, that it tends to be higher for benchmark bonds, and that it has increased significantly over time. We proceed to test more formally how trading activity is affected by various factors in an effort to better understand its determinants. In particular, we regress trading activity on many of the same variables as in the underwriting commission regression, although we omit variables pertaining to the primary
30 Data on all bids received in the underwriting auction were not available on the RBI press releases website – the source of primary auction data.

13
auction, which seem less pertinent to explaining secondary market activity. Moreover, since we have a panel data set, we look not only at tenor at issuance, but also at time since issuance. We employ three different definitions of trading activity and tailor our regression models accordingly. We model (unconditional) trading volume, which is left-censored at zero for many security-days, and hence employ a Tobit model left-censored at zero. We also model whether a security trades on a given day or not, a binary variable, and hence a logit model in that case. Lastly, we model trading volume conditional on trading occurring, which avoids the censoring issue, and use least squares for that. In all cases, we calculate robust standard errors. Estimates from the censored Tobit (unconditional) trading volume model are reported in Table 7. Starting with those coefficients statistically significant in both univariate and multivariate models, we find trading volume is higher if a bond is a FIMMDA benchmark, increases with issue amount outstanding, and decreases with time since issuance, as would be expected. Perhaps surprisingly, the NDS-OM coefficient is negative and statistically significant in the multivariate model, albeit insignificant in the univariate model. Interestingly, the NDS-OM coefficient is instead positive and significant if we instead run a least squares model, suggesting the importance of the censoring model. Indeed, as we show in subsequent models, the NDS-OM variable is negatively related to the probability of a security trading, but positively related to trading volume conditional on a bond trading. Coupon rate and tenor at original issuance are negatively and significantly related to trading volume in the univariate models, but insignificant in the multivariate models. Volatility is insignificant in both univariate and multivariate models. Estimates from the logit model on which bonds trade on a given day are reported in Table 8 and are broadly consistent with those reported in Table 7. In particular, the frequency of trading is significantly and positively related with whether a bond is a benchmark and with issue amount outstanding, and negatively related with time since issuance and whether NDS-OM has been introduced (in both the univariate and multivariate models in the latter case in this instance). With the logit model, the tenor coefficient is marginally significant in the multivariate model, albeit positive, in contrast to the univariate model. Volatility is positive and marginally significant in the multivariate model. Results from the least squares regression models of trading volume conditional on trading are reported in Table 9 and are broadly consistent with the results reported in Tables 7 and 8. FIMMDA benchmark status and amount outstanding are again positively and statistically related to trading volume and time since issuance is negative and significantly related, and tenor at issuance is negatively and significantly related to volume in both the univariate and multivariate models The greatest difference in the conditional volume results from the unconditional volume and trading frequency results is that the NDS-OM coefficient is here positive and significant. That is, the frequency of a bond trading has declined since the introduction of NDS-OM, as shown in Table 8, but trading volume conditional on trading has increased. This finding is consistent with the story emerging from Figures 4 and 5 showing a massive increase in trading activity over time even as the frequency with which a given bond trades has not increased. One hypothesis is that
14
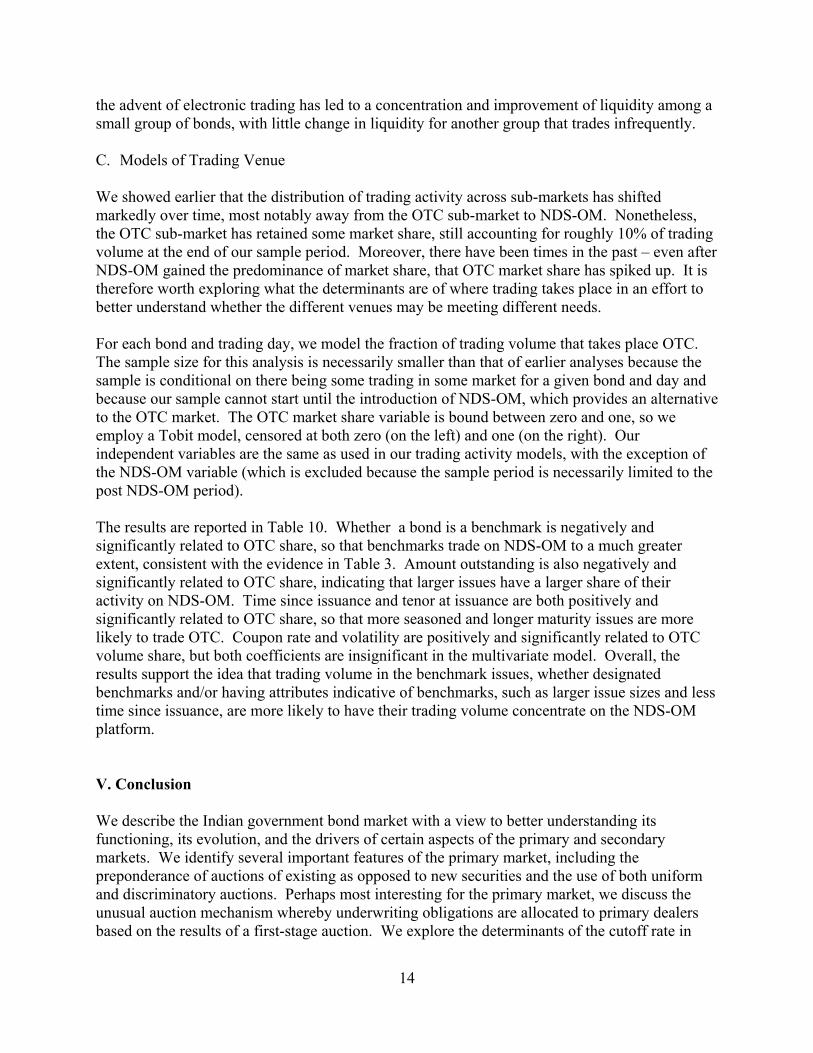
the advent of electronic trading has led to a concentration and improvement of liquidity among a small group of bonds, with little change in liquidity for another group that trades infrequently. C. Models of Trading Venue We showed earlier that the distribution of trading activity across sub-markets has shifted markedly over time, most notably away from the OTC sub-market to NDS-OM. Nonetheless, the OTC sub-market has retained some market share, still accounting for roughly 10% of trading volume at the end of our sample period. Moreover, there have been times in the past – even after NDS-OM gained the predominance of market share, that OTC market share has spiked up. It is therefore worth exploring what the determinants are of where trading takes place in an effort to better understand whether the different venues may be meeting different needs. For each bond and trading day, we model the fraction of trading volume that takes place OTC. The sample size for this analysis is necessarily smaller than that of earlier analyses because the sample is conditional on there being some trading in some market for a given bond and day and because our sample cannot start until the introduction of NDS-OM, which provides an alternative to the OTC market. The OTC market share variable is bound between zero and one, so we employ a Tobit model, censored at both zero (on the left) and one (on the right). Our independent variables are the same as used in our trading activity models, with the exception of the NDS-OM variable (which is excluded because the sample period is necessarily limited to the post NDS-OM period). The results are reported in Table 10. Whether a bond is a benchmark is negatively and significantly related to OTC share, so that benchmarks trade on NDS-OM to a much greater extent, consistent with the evidence in Table 3. Amount outstanding is also negatively and significantly related to OTC share, indicating that larger issues have a larger share of their activity on NDS-OM. Time since issuance and tenor at issuance are both positively and significantly related to OTC share, so that more seasoned and longer maturity issues are more likely to trade OTC. Coupon rate and volatility are positively and significantly related to OTC volume share, but both coefficients are insignificant in the multivariate model. Overall, the results support the idea that trading volume in the benchmark issues, whether designated benchmarks and/or having attributes indicative of benchmarks, such as larger issue sizes and less time since issuance, are more likely to have their trading volume concentrate on the NDS-OM platform. V. Conclusion We describe the Indian government bond market with a view to better understanding its functioning, its evolution, and the drivers of certain aspects of the primary and secondary markets. We identify several important features of the primary market, including the preponderance of auctions of existing as opposed to new securities and the use of both uniform and discriminatory auctions. Perhaps most interesting for the primary market, we discuss the unusual auction mechanism whereby underwriting obligations are allocated to primary dealers based on the results of a first-stage auction. We explore the determinants of the cutoff rate in

15
these underwriting auctions and identify several variables with a significant influence. Of note, the introduction of NDS-OM seems to have led to lower cutoff rates, perhaps because the platform improves liquidity and hence lowers underwriting risk. We also discuss important features of the secondary market, including the introduction of the electronic NDS-OM trading platform, the role of benchmark securities, and changing patterns of trading activity. Daily trading volume in particular has increase sharply in recent years, Moreover, an increasing share of the increasing daily trading volume has migrated to the NDS-OM sub-market at the expense of the OTC brokered sub-market. From an equal share of 50% in 2006, NDS-OM share trended upwards to over 80% after 2010. We explore the derminants of trading activity and find that variables one might expect to be associated with liquidity, such as benchmark status, issue size, and time since issuance are correlated with activity in the expected way. Moreover, we find that the launch of NDS-OM is associated with a reduced likelihood of a bond trading, but greater trading volume conditional on it trading. Analysis of trading venue shows that benchmark bonds, larger issues, and recently issued bonds are associated with a greater share of NDS-OM trading volume (as opposed to OTC trading volume), suggesting that the NDS-OM platform is especially attractive for trading bonds with benchmark attributes.

16
References Asian Development Bank, 2014, Emerging East Asian Local Currency Bond Markets: A Regional Update, Asia Bond Monitor, March.
Gandhi, R. 2012. “Report of the Working Group on Enhancing Liquidity in the Government Securities and Interest Rate Derivatives Market.” Reserve Bank of India REPORTS, August.
McGill, Robert, Tukey, John W., Larsen, Wayne A. 1978. “Variations of Box Plots.” THE AMERICAN STATISTICIAN 32 no. 1: 12-16.
Ministry of Finance, Government of India. 2015. “Handbook of Statistics on Central Government Debt.” November.
Mohan, Rakesh and Partha Ray. 2009. “Development of the Indian Debt Market.” The Stanford Center for International Development Working Paper 410, December.
Mohanty, M.S. 2002. “Improving Liquidity in Government Bond Markets: What Can Be Done?” In THE DEVELOPMENT OF BOND MARKETS IN EMERGING ECONOMIES, BIS PAPERS NO 11, June: 49-80.
Nath, Golaka C. 2006. “Liquidity Cost in Indian Government Securities Market.” Unpublished paper, The Clearing Corporation of India Ltd, January.
Nath, Golaka C. 2007. “An Empirical Study of the Indian Treasury Securities Primary Auctions.” Unpublished paper, The Clearing Corporation of India Ltd, February.
Nath, Golaka C. 2013. “Liquidity Issues in Indian Sovereign Bond Market.” Unpublished paper, The Clearing Corporation of India Ltd, May.
Nath, Golaka C., Sahana Rajaram and Payal Ghose. 2009. “The Changing Dynamics of the Indian Government Bond Market.” Unpublished paper, The Clearing Corporation of India Ltd, October.
Nyborg, Kjell G., Kristian Rydqvist and Suresh M. Sundaresan. 2002. “Bidder Behavior in Multiunit Auctions: Evidence from Swedish Treasury Auctions.” JOURNAL OF POLITICAL ECONOMY 110 no. 2: 393-424.
Reddy, Y.V. 2002. “Issues and Challenges in the Development of the Debt Market in India.” In THE DEVELOPMENT OF BOND MARKETS IN EMERGING ECONOMIES, BIS PAPERS NO 11, June: 117-126.
Reserve Bank of India. 2005. “Effective October 8, Outright Trading in Government Securities to be Discontinued on Saturdays.” September 23.
-------. 2010. “Transactions in G-Secs Market through NDS and NDS-OM.” April 29.
-------. 2014. “Government Securities Market in India-A Primer.” October 17.

17
Shankar, Ravi and Sanjoy Bose. 2008. “Auctions of Government Securities in India-An Analysis.” Reserve Bank of India OCCASIONAL PAPERS 29, no. 3, August: 23-68.
The Economic Times. 2015. “NSE Taps RBI for Live Gilt Quotes to Transform Interest Rate Futures Market.” June 2.

Variable Name Mean
Standard
Deviation
Coupon rate (%) 7.98 0.71
Issuance size (INR billion) 40.22 15.46
Tenor at issuance (years) 17.19 8.48
Competitive bids received (#) 162.63 69.33
Bid‐to‐cover ratio 2.43 0.65
Underwriting commission cutoff
rate (paise per 100 INR)4.93 10.95
Variable Name Difference
Mean
Standard
Deviation Mean
Standard
Deviation Mean
Coupon rate (%) 7.69 0.96 8.00 0.69 ‐0.31***
Issuance size (INR billion) 46.67 17.20 39.89 15.30 6.78***
Tenor at issuance (years) 14.81 8.93 17.31 8.44 ‐2.50*
Competitive bids received (#) 212.36 83.48 160.09 67.61 52.27***
Bid‐to‐cover ratio 2.86 0.77 2.41 0.64 0.45***
Underwriting commission cutoff
rate (paise per 100 INR)2.08 2.53 5.07 11.20 ‐2.99***
Variable Name Difference
Mean
Standard
Deviation Mean
Standard
Deviation Mean
Coupon rate (%) 8.05 0.67 7.77 0.78 0.28***
Issuance size (INR billion) 39.24 15.80 43.15 14.02 ‐3.91***
Tenor at issuance (years) 16.74 8.38 18.54 8.66 ‐1.81***
Competitive bids received (#) 141.86 49.71 224.76 81.63 ‐82.90***
Bid‐to‐cover ratio 2.34 0.54 2.71 0.85 ‐0.37***
Underwriting commission cutoff
rate (paise per 100 INR)4.83 11.40 5.23 9.52 ‐0.41
Notes: The table reports summary statistics for fixed‐rate dated Government of India securities auctions held
between January 1, 2003 and June 12, 2014. Panel A reports statistics for all auctions, Panel B reports statistics
separately for auctions of newly issued and reissued bonds and Panel C reports statistics separately for
uniform and discriminatory price auctions. One‐, two‐, and three‐ asterisks indicate differences statistical
significant at the 10 percent, 5 percent, and 1 percent levels, respectively.
Panel A: All Auctions (n = 862)
Reissued (n = 820)Newly Issued (n = 42)
Table 1: Auction Summary Statistics
Source: Authors' calculations, based on data from "Press Releases" section of the Reserve Bank of India
website, http://www.rbi.org.in/scripts/BS_PressReleaseDisplay.aspx.
Panel B: Reissued Bond Auctions vs. Newly Issued Bond Auctions
Panel C: Uniform Price Auctions vs. Discriminatory Price Auctions
Uniform (n = 646) Discriminatory (n = 216)

Year 1 2 3 4 5 6 7 8 9 10 11 12 13 14 15 16 17 18 19 20 21 22 23 24 25 26 27 28 29 302003 1+ 1+ 2+ 1+ 2++ 2++ 3++ 3++ 2+2004 1+ 1+ 2 2+ 1+ 2 1 1+2005 1 1+ 1 1 2 3 3++ 1 3+ 1+ 1 4 5+2006 1 3 2+ 1 1 8+ 1+ 2+ 1 5 6+2007 3 1 2 12+ 4+ 2+ 3 102008 1 3+ 1 1 2 7+ 2 1 1 1+ 2 9+ 1 32009 1 1 11+++ 11+ 10+ 4 24++ 2 7 3 2 4+ 5 8 7 9 5 1 5+2010 2 1 17+ 5 12 1 15+ 18++ 18+ 11+ 10+2011 2 10 13 10+ 2 15++ 13 3 4+ 17+ 2 2+ 3 15 2+2012 12+ 10 9 13++ 2 17+ 2 15+ 8+ 5 12 11 6 12 12 10+2013 1 2 6 12+ 12 7 3 16++ 5 9 6 8+ 7 21 4 7 13 11+2014 2 5+ 2 5 1 6 6 1+ 4 3 6 1 7 6
New Issues 0 0 0 0 6 7 2 2 1 12 1 6 3 3 6 4 3 0 2 2 0 1 0 1 2 0 0 0 1 8Reopenings 0 3 1 7 58 59 57 28 17 109 21 35 38 19 10 22 34 34 34 7 3 21 2 22 13 7 2 16 62 48Total Issues 0 3 1 7 64 66 59 30 18 121 22 41 41 22 16 26 37 34 36 9 3 22 2 23 15 7 2 16 63 56
Source: Authors' calculations, based on data from "Press Releases" section of the Reserve Bank of India website, http://www.rbi.org.in/scripts/BS_PressReleaseDisplay.aspx.
Maturity (Years)
Notes: The table reports the number of fixed coupon government bond issues by calendar year and years to maturity between January 1, 2003 and June 14, 2014. Years to maturity is measured as of the time of issuance/reissuance and rounded to the closest year. Plus (+) symbols indicate the number of new issues within a cell (so 11+++ in 2009 for 5 years to maturity means that there were 11 auctions of issues with 4.5‐5.5 years to maturity in 2009, three of which were newly issued securities and 8 of which were reopenings of previously issued securities).
Table 2: Number of Auctions by Year and Maturity

Variable Name Mean
Standard
Deviation
Coupon rate (%) 9.38 2.36
Issuance size (INR billion) 224.44 248.15
Tenor at issuance (years) 15.31 7.82
Daily traded volume (INR billion) 2.77 10.38
Fraction of days traded 0.32 0.28
Variable Name Difference
Mean
Standard
Deviation Mean
Standard
Deviation Mean
Coupon rate (%) 8.73 2.13 9.06 2.27 ‐0.33
Issuance size (INR billion) 261.85 253.79 248.82 250.44 13.03
Tenor at issuance (years) 16.56 7.64 16.05 7.59 0.52
Daily traded volume (INR billion) 3.13 10.42 0.48 1.40 2.65***
Fraction of days traded 0.24 0.30 0.27 0.26 ‐0.03
Notes: Panel A reports summary statistics for the 162 bonds that traded between January 1, 2003 and April 22,
2013 irrespective of the submarket. Panel B reports summary statistics for the bonds that traded on NDS‐OM
(n=114) and on OTC sub‐markets (n=131), including both direct trades and those brokered through NSE/BSE
member‐brokers, between February 24, 2006 and April 22, 2013 (while NDS‐OM went live on August 1, 2005,
February 24, 2006 is the first date for which NDS‐OM volume data is available). Daily traded volume statistics are
calculated across all days within the sample period that a bond is outstanding, and are calculated across all
markets (Panel A) or the noted sub‐markets (Panel B). Fraction of days traded is the ratio of number of days a
bond/ISIN traded in the sample to the total number of days the bond/ISIN was outstanding in the sample period
and are calculated across all markets (Panel A) or the noted sub‐markets (Panel B). One‐, two‐, and three‐
asterisks indicate statistical significance at the 10 percent, 5 percent, and 1 percent levels, respectively.
Source: Authors' calculations, based on data from Bloomberg, Clearing Corporation of India Ltd., Internal Debt
Management Department of Reserve Bank of India, and "Press Releases" section of the Reserve Bank of India
website, http://www.rbi.org.in/scripts/BS_PressReleaseDisplay.aspx.
Table 3: Secondary Market Summary Statistics
Panel A: All Sub‐Markets (n = 162)
NDS‐OM (n = 114) OTC (n = 131)
Panel B: NDS‐OM vs OTC

Variable Name Mean
Standard
Deviation
Coupon rate (%) 8.32 1.89
Issuance size (INR billion) 334.48 268.07
Tenor at issuance (years) 14.45 7.53
Daily traded volume (INR billion) 7.84 13.27
Fraction of days traded 0.46 0.27
Notes: The table reports summary statistics for all 89 bonds deemed a benchmark between January 1, 2003 and
April 22, 2013. Daily traded volume statistics are calculated across all days within the sample period that a bond is
deemed a benchmark and are calculated across all markets. Fraction of days traded is the ratio of number of days
a benchmark bond/ISIN traded in the sample to the total number of days the bond/ISIN was a benchmark in the
sample period and are calculated across all markets. One‐, two‐, and three‐ asterisks indicate statistical
significance at the 10 percent, 5 percent, and 1 percent levels, respectively.
Table 4: Benchmark Bond Summary Statistics
Source: Authors' calculations, based on data from Bloomberg, Clearing Corporation of India Ltd., Fixed Income
Money Market and Derivatives Association of India, Internal Debt Management Department of Reserve Bank of
India, and "Press Releases" section of the Reserve Bank of India website,
http://www.rbi.org.in/scripts/BS_PressReleaseDisplay.aspx.

All NDS‐OM OTC Sub‐Markets
2 2280 1414 765 814
3 2236 1295 682 723
4 1992 1323 783 723
5 2420 2125 1147 1118
6 2131 1737 805 944
7 2158 1833 921 1070
8 1876 1587 748 817
9 1730 1350 596 627
10 2492 2278 1576 1606
15 1496 1283 583 512
30 1696 1379 769 653
Tenor All NDS‐OM OTC Sub‐Markets
2 1.93 1.75 1.46
3 1.34 1.23 1.00
4 2.80 3.83 1.05
5 3.82 4.82 1.22
6 3.36 4.30 1.00
7 4.15 5.49 1.11
8 3.75 5.31 0.83
9 7.33 11.66 1.70
10 28.33 34.72 4.38
15 1.96 1.43 0.42
30 1.39 1.78 0.64
Source: Authors' calculations, based on data from Bloomberg.
Notes: Panel A reports the number of days for which Bloomberg identifies benchmark bonds by tenor and
the number of days these bonds traded across the 2646 trade days between January 1, 2003 and April 22,
2013. "All" refers to NDS‐OM and OTC sub‐markets. Panel B reports the average daily traded volume from
January 1, 2003 to April 22, 2014 for Bloomberg benchmark bonds by tenor, conditional on trading in either
of the sub‐markets (column "All") or the respective sub‐markets.
Table 5: Benchmark Bond Trading Statistics by Tenor
Panel B: Daily Traded Volume (INR Billion)
Number of Days
Benchmark ISIN
IdentifiedTenor
Number of Trade Days
Panel A: Identified vs Traded Benchmark Bonds

Variable Name (1) (2) (3) (4) (5) (6) (7) (8) (9) (10) (11)
NDS‐OM ‐0.94*** ‐1.24***
(0.208) (0.200)
Volatility 1.30*** 1.24***
(0.061) (0.060)
Liquidity adjustment facility ‐0.47*** ‐0.27***
(0.053) (0.055)
Uniform price auction ‐0.13 ‐0.03
(0.111) (0.102)
Reissued bond 0.47** 0.52***
(0.195) (0.179)
Bid‐to‐cover ‐0.50*** ‐0.31***
(0.071) (0.063)
ln(IssuanceSize) ‐0.34*** ‐0.14
(0.125) (0.113)
Residual maturity 0.04*** 0.03***
(0.006) (0.006)
FIMMDA benchmark ‐0.38*** ‐0.27***
(0.103) (0.085)
Coupon rate ‐0.19*** 0.15**
(0.062) (0.069)
Constant 1.37*** 2.02*** 0.57*** 0.57*** 0.03 1.70*** 1.69*** ‐0.07 0.74*** 1.98*** 2.50***
(0.202) (0.086) (0.046) (0.098) (0.189) (0.183) (0.458) (0.092) (0.087) (0.494) (0.702)
Observations 861 797 861 861 861 861 861 861 861 861 797
Adjusted R‐Squared 0.021 0.372 0.060 0.001 0.004 0.056 0.008 0.047 0.016 0.008 0.514
Table 6: Determinants of Underwriting Commission
Source : Authors' calculations, based on data from Bloomberg, Clearing Corporation of India Ltd., Internal Debt Management Department of Reserve Bank of India, "Press
Releases" section of the Reserve Bank of India website, http://www.rbi.org.in/scripts/BS_PressReleaseDisplay.aspx, and the website of Fixed Income Money Market and
Derivatives Association of India.
Notes: The table reports least squares regression results in which the dependent variable is the log cutoff rate (paise per 100 INR) in the auction for Additional Competitive
Underwriting. The sample period runs from January 1, 2003 to June 12, 2014. NDS‐OM is an indicator variable equal to 1 if the underwriting auction date is on or after August
1, 2005; Volatility is the standard deviation of the daily secondary market return for the 10‐year benchmark bond over the 10‐day window ending the day preceding the
underwriting auction date; Liquidity adjustment facility equals the net liquidity injections on the day preceding the underwriting auction in INR trillions; uniform price auction is
an indicator variable equal to 1 if the second‐round auction is a uniform price auction; reissued bond is an indicator variable equal to 1 if the auctioned bond is a reissue; bid‐to‐
cover is the ratio of the bid amount to the issue amount in the second‐round auction; ln(issuance size) is the natural log of the underwriting auction issuance size in tens of
millions of INR, residual maturity is the time to maturity from underwriting auction day in years; FIMMDA benchmark is an indicator variable equal to 1 if the auctioned bond is
on the list of benchmark bonds released by FIMMDA on the day preceding the underwriting auction date. Heteroskedasticity consistent standard errors are reported in the
parentheses. One‐, two‐, and three‐ asterisks indicate statistical significance at the 10 percent, 5 percent, and 1 percent levels, respectively.

Variable Name (1) (2) (3) (4) (5) (6) (7) (8)
FIMMDA benchmark 15.630*** 12.062***
(2.648) (2.084)
NDS‐OM ‐0.629 ‐3.678***
(0.740) (0.691)
Coupon rate ‐1.116*** ‐0.122
(0.256) (0.147)
Amount outstanding 26.367*** 18.351***
(4.870) (3.636)
Time since original issuance ‐0.878*** ‐0.389***
(0.172) (0.100)
Tenor at original issuance ‐0.265*** ‐0.009
(0.086) (0.054)
Volatility ‐0.783 0.144
(0.972) (0.692)
Constant ‐12.016*** ‐9.262*** 0.405 ‐13.847*** ‐3.344*** ‐5.328*** ‐9.654*** ‐8.636***
(1.912) (1.767) (2.063) (2.272) (0.921) (1.471) (1.561) (2.631)
Observations 246,213 246,213 246,213 246,213 246,213 246,213 221,232 221,232
Table 7: Determinants of Trading Volume
Notes: The table reports regression results of a Tobit model left‐censored at zero in which the dependent variable is daily trading volume (in
INR millions). The sample period runs from January 1, 2003 to April 22, 2013. FIMMDA benchmark is an indicator variable equal to 1 if the
bond is on the list of benchmark bonds released daily by FIMMDA at the close of trading; NDS‐OM is an indicator variable equal to 1 from
August 1, 2005; Volatility is the standard deviation of the daily secondary market return for the 10‐year benchmark bond over the 10‐day
window ending the preceding day; amount outstanding is in INR millions; time since original issuance and tenor at original issuance are in
years. Robust standard errors are reported in the parentheses. One‐, two‐, and three‐ asterisks indicate statistical significance at the 10
percent, 5 percent, and 1 percent levels, respectively.
Source: Authors' calculations, based on data from Bloomberg, Clearing Corporation of India Ltd., Internal Debt Management Department of
Reserve Bank of India, and the Fixed Income Money Market and Derivatives Association of India.

Variable Name (1) (2) (3) (4) (5) (6) (7) (8)
FIMMDA benchmark 2.764*** 2.241***
(0.122) (0.116)
NDS‐OM ‐0.397*** ‐1.147***
(0.123) (0.097)
Coupon rate ‐0.153*** ‐0.042
(0.033) (0.030)
Amount outstanding 3.717*** 3.310***
(0.347) (0.360)
Time since original issuance ‐0.138*** ‐0.071***
(0.017) (0.012)
Tenor at original issuance ‐0.030** 0.019*
(0.012) (0.010)
Volatility ‐0.026 0.141*
(0.095) (0.082)
Constant ‐1.379*** ‐0.655*** 0.466 ‐1.535*** 0.024 ‐0.427** ‐0.890*** ‐0.619
(0.076) (0.118) (0.332) (0.098) (0.136) (0.206) (0.093) (0.384)
Observations 246,213 246,213 246,213 246,213 246,213 246,213 221,232 221,232
Table 8: Determinants of What Trades
Notes: The table reports regression results of a logit model in which the dependent variable equals one if a given bond traded on a given day
and equals zero otherwise. The sample period runs from January 1, 2003 to April 22, 2013. FIMMDA benchmark is an indicator variable equal
to 1 if the bond is on the list of benchmark bonds released daily by FIMMDA at the close of trading; NDS‐OM is an indicator variable equal to 1
from August 1, 2005; Volatility is the standard deviation of the daily secondary market return for the 10‐year benchmark bond over the 10‐
day window ending the preceding day; amount outstanding is in INR millions; time since original issuance and tenor at original issuance are in
years. Robust standard errors are reported in the parentheses. One‐, two‐, and three‐ asterisks indicate statistical significance at the 10
percent, 5 percent, and 1 percent levels, respectively.
Source: Authors' calculations, based on data from Bloomberg, Clearing Corporation of India Ltd., Internal Debt Management Department of
Reserve Bank of India, and the Fixed Income Money Market and Derivatives Association of India.

Variable Name (1) (2) (3) (4) (5) (6) (7) (8)
FIMMDA benchmark 5.720*** 4.486***
(1.203) (0.995)
NDS‐OM 3.553*** 2.917***
(0.811) (0.740)
Coupon rate ‐0.395*** 0.249
(0.122) (0.179)
Amount outstanding 12.097*** 5.046**
(3.106) (2.468)
Time since original issuance ‐0.391*** ‐0.233**
(0.092) (0.099)
Tenor at original issuance ‐0.184*** ‐0.119**
(0.046) (0.055)
Volatility ‐1.183 ‐1.374
(1.153) (0.996)
Constant 0.830*** 0.974*** 6.499*** 0.286 5.068*** 5.925*** 3.599*** ‐0.172
(0.119) (0.139) (1.336) (0.414) (0.891) (1.130) (0.776) (1.846)
Observations 70,575 70,575 70,575 70,575 70,575 70,575 64,007 64,007
Adjusted R‐squared 0.060 0.023 0.005 0.043 0.029 0.013 0.001 0.106
Table 9: Determinants of Trading Volume Conditional on Trading
Notes: The table reports results of a least squares regression model in which the dependent variable is daily trading volume (in INR millions),
conditional on trading occurring. The sample period runs from January 1, 2003 to April 22, 2013. FIMMDA benchmark is an indicator variable
equal to 1 if the bond is on the list of benchmark bonds released daily by FIMMDA at the close of trading; NDS‐OM is an indicator variable
equal to 1 from August 1, 2005; Volatility is the standard deviation of the daily secondary market return for the 10‐year benchmark bond over
the 10‐day window ending the preceding day; amount outstanding is in INR millions; time since original issuance and tenor at original
issuance are in years. Robust standard errors are reported in the parentheses. One‐, two‐, and three‐ asterisks indicate statistical significance
at the 10 percent, 5 percent, and 1 percent levels, respectively.
Source: Authors' calculations, based on data from Bloomberg, Clearing Corporation of India Ltd., Internal Debt Management Department of
Reserve Bank of India, and the Fixed Income Money Market and Derivatives Association of India.

Variable Name (1) (3) (4) (5) (6) (7) (8)
FIMMDA benchmark ‐0.619*** ‐0.410***
(0.072) (0.059)
Coupon rate 0.089*** 0.025
(0.032) (0.020)
Amount outstanding ‐1.238*** ‐0.751***
(0.194) (0.130)
Time since original issuance 0.065*** 0.024***
(0.006) (0.006)
Tenor at original issuance 0.028*** 0.021***
(0.007) (0.003)
Volatility 0.153** 0.002
(0.077) (0.059)
Constant 0.937*** ‐0.064 1.052*** 0.320*** 0.218** 0.573*** 0.421**
(0.074) (0.287) (0.097) (0.053) (0.096) (0.060) (0.199)
Observations 42,415 42,415 42,415 42,415 42,415 36,940 36,940
Table 10: Determinants of Share Traded OTC
Notes: The table reports regression results of a Tobit model left‐censored at zero and right‐censored at one in which the dependent
variable is the share of the OTC market in daily trading volume. The sample period runs from Feburary 24, 2006 to April 22, 2013.
FIMMDA benchmark is an indicator variable equal to 1 if the bond is on the list of benchmark bonds released daily by FIMMDA at the
close of trading; Volatility is the standard deviation of the daily secondary market return for the 10‐year benchmark bond over the 10‐
day window ending the preceding day; amount outstanding is in INR millions; time since original issuance and tenor at original
issuance are in years. Robust standard errors are reported in the parentheses. One‐, two‐, and three‐ asterisks indicate statistical
significance at the 10 percent, 5 percent, and 1 percent levels, respectively.
Source: Authors' calculations, based on data from Bloomberg, Clearing Corporation of India Ltd., Internal Debt Management
Department of Reserve Bank of India, and the Fixed Income Money Market and Derivatives Association of India.

28
Figure 1
Source: Rakshitra, Clearing Corporation of India Ltd's Monthly Newsletter on Money, G‐Sec and Government Markets, volumes from May 2005 to March 2015 (https://www.ccilindia.com/Research/CCILPublications/Pages/RakshitraArchive.aspx). Note: The figure plots the composition of outstanding government debt (central and state) from April 2005 to February 2015, comprised of fixed coupon government securities, state development loans, and other (floating rate bonds, special bonds, and treasury bills).

29
Figure 2
Panel A: NDS‐OM Screen as Observed by Participants

30
Panel B: Specimen Deal Slip for Recording OTC Trades

31
Panel C: NDS‐OM Quote Watch Snapshot
Panel D: NDS‐OM Trade Watch Snapshot

32
Panel E: NDS‐OM Market Watch Snapshot
Panel F: OTC Trade Watch Snapshot

33
Panel G: OTC Market Watch Snapshot
Source: http://rbidocs.rbi.org.in/rdocs/Publications/PDFs/NDSOM290410.pdf, pp. 5‐6. Notes: Panel A shows the NDS‐OM screen as observed by participants. Panel B is a specimen deal slip for recording trades on OTC. Panels C‐E are snapshots of the NDS‐OM Quote Watch, Trade Watch, and Market Watch screens respectively. Panels F and G are snapshots of the OTC Trade Watch and Market Watch screens respectively.

34
Figure 3
Source: Authors' calculations based on data from "Press Releases" section of the Reserve Bank of India website, http://www.rbi.org.in/scripts/BS_PressReleaseDisplay.aspx. Notes: The figure shows box plots of underwriting commission cutoff rates by year. The upper and lower ends of each box represent the third (Q3) and first (Q1) quartiles respectively. The black line (red dot) inside each box represents the median (mean). The upper horizontal bar represents Q3+(1.5*interquartile range) or the largest value in the distribution, whichever is smaller. The lower horizontal bar represents Q1‐(1.5*interquartile range) or the lowest value of the distribution, whichever is larger, and appears on the graph only if it is statistically distinguishable from Q1.
Figure 4
Source: Authors' calculations based on data from Clearing Corporation of India Ltd. and the Internal Debt Management Department of Reserve Bank of India. Note: The chart plots average daily trading volume (INR billion), and daily number of bonds traded and outstanding by month across all secondary sub‐markets for the period January 2003 to April 2013.

35
Figure 5
Source: Authors' calculations based on data from Clearing Corporation of India Ltd. and Internal Debt Management Department of Reserve Bank of India. Note: The chart plots daily trading volume by month for the NDS‐OM and OTC sub‐markets for the period January 2003 to April 2013.
Figure 6
Source: Authors' calculations based on data from Clearing Corporation of India Ltd. and Internal Debt Management Department of Reserve Bank of India. Note: The chart plots the trading volume shares of the NDS‐OM, OTC direct and OTC brokered sub‐markets by month for the period January 2003 to April 2013.

36
Figure 7
Sources: Bloomberg and Clearing Corporation of India Ltd. Notes: The figure plots the last price and equivalent yield of the 10‐year benchmark bond on the OTC sub‐market from January 1, 2003 to June 12, 2014 along with the dates on which the benchmark ISIN changed. Dates in red are switch dates, dates in blue are reissue auction dates and dates in black are new issue auction dates.
Figure 8
Source: Authors' calculations, based on data from Bloomberg and the Internal Debt Management Division of RBI. Notes: The figure plots the daily volatility of the 10‐year benchmark bond between January 11, 2003 and April 17, 2014. Volatility is measured by the standard deviation of daily returns over a 10‐day moving window, and is set to missing if there are fewer than five days with non‐missing daily returns. Returns are based on the daily secondary market price series which is the NDS‐OM last price on days the 10‐year benchmark bond trades on NDS‐OM and the OTC last price on days the bond only trades OTC. Daily returns are calculated over the secondary market daily price series with returns set to missing on the date the benchmark bond changes.

37
Figure 9
Source: Authors' calculations, based on data from Bloomberg, Internal Debt Management Division of RBI, and "Press Releases" section of the Reserve Bank of India website, http://www.rbi.org.in/scripts/BS_PressReleaseDisplay.aspx. Notes: The figure plots the daily volatility of the 10‐year benchmark bond (blue line) and the mean commission cutoff rate (orange dots) by underwriting auction date from January 1, 2003 to June 12, 2014. Volatility is measured by the standard deviation of daily returns over a 10‐day moving window from the current date, and is set to missing if there are fewer than five days with non‐missing daily returns. Returns are obtained from the daily secondary market price series which is the NDS‐OM last price on days the 10‐year benchmark bond trades on NDS‐OM and the OTC last price on days the bond only trades OTC. Daily returns are calculated over the secondary market daily price series with returns set to missing on the date the benchmark bond changes.