Embed Size (px)
Citation preview

TRACTEBEL ENGINEERING S.A. Avenue Ariane, 7 – 1200 Brussels - BELGIUM tel. +32 2 773 99 11 - fax +32 2 773 99 00 [email protected] tractebel-engie.com TECHNICAL NOTE
Our ref.: EASTNSI/4NT/0512397/000/02
TS:Imputation: P.008903/0004
Client:
Project:
02 2017 02 16 FIN *P. Henneaux *M. Bons
*L. Charlier *E. Haesen
*S. Ouziaux *J. Dubois
01 2016 12 09 FIN *P. Henneaux *L. Charlier *S. Ouziaux *J. Dubois
00 2016 11 18 FIN *P. Henneaux *L. Charlier *J. Dubois
REV. YY/MM/DD STAT. WRITTEN VERIFIED APPROVED VALIDATED
* This document is fully electronically signed on 2017 02 24.TRACTEBEL ENGINEERING S.A. – registered office: Avenue Ariane 7 – 1200 Brussels - BELGIUM VAT:BE 0412 639 681 – RMP/RPR Brussels: 0412 639 681 – Bank account - IBAN: BE74375100843707 – BIC/SWIFT: BBRUBEBB
European Commission
Study on electricity infrastructure developments in Central and South EasternEurope
FINAL REPORTSubject:
Comments:More information on the European Union is available on the Internet (http://www.europa.eu).
Luxembourg: Publications Office of the European Union, 2016
ISBN: 978-92-79-63919-7
Catalogue number: MJ0716069ENN doi: 10.2833/706948
© European Union, 2016
Reproduction is authorised provided the source is acknowledged.
The study has been carried out for the European Commission and expresses the opinion of the organisation having undertaken them. To this end, it does not reflect the views of the European Commission, TSOs, project promoters and other stakeholders involved. The European Commission does not guarantee the accuracy of the information given in the study, nor does it accept responsibility for any use made thereof


EASTNSI/4NT/0512397/000/02 2017 02 16 3/74
This
doc
umen
t is
the
prop
erty
of T
ract
ebel
Eng
inee
ring
S.A
. Any
dup
licat
ion
or tr
ansm
issi
on to
third
par
ties
is fo
rbid
den
with
out p
rior w
ritte
n ap
prov
al
EUROPEAN COMMISSION – DIRECTORATE-GENERAL FOR ENERGY ENERGY/B1/2015-572 – STUDY ON ELECTRICITY INFRASTRUCTURE DEVELOPMENTS IN CENTRAL AND SOUTH EASTERN EUROPE FINAL REPORT
TABLE OF CONTENTS
1. INTRODUCTION ................................................................................................................... 5
2. ANALYSIS OF EXISTING PCIS ............................................................................................ 8
2.1. List of interconnection projects and groups ......................................................... 8
2.2. Detailed groups and internal reinforcements ...................................................... 10
2.2.1. Group I (AT/DE) ........................................................................................... 10 2.2.2. Group II (AT/IT) ........................................................................................... 11 2.2.3. Group III (AT/IT) .......................................................................................... 12 2.2.4. Group IV (BG/EL) ........................................................................................ 12 2.2.5. Group V (BG/RO) ........................................................................................ 13 2.2.6. Group VI (SI/HU/HR) ................................................................................... 15 2.2.7. Group VII (IL/CY/EL) ................................................................................... 16 2.2.8. Group VIII (CZ/DE) ...................................................................................... 17 2.2.9. Group IX (DE/PL) ........................................................................................ 18 2.2.10. Group X (DE/PL) ......................................................................................... 19 2.2.11. Group XI (SK/HU) ........................................................................................ 20 2.2.12. Group XII (SK/HU) ....................................................................................... 21 2.2.13. Group XIII (IT/ME) ....................................................................................... 22 2.2.14. Group XIV (IT/SI) ......................................................................................... 22 2.2.15. Group XV (RO/RS) ...................................................................................... 23
2.3. CBA of interconnection projects .......................................................................... 24
2.3.1. Short-term groups ........................................................................................ 25 2.3.2. Mid-term groups .......................................................................................... 25 2.3.3. Long-term groups ........................................................................................ 26
2.4. Analysis of interconnection levels ....................................................................... 27
2.5. Ranking of groups ................................................................................................. 28
2.5.1. Short-term groups ........................................................................................ 29

EASTNSI/4NT/0512397/000/02 2017 02 16 4/74
This
doc
umen
t is
the
prop
erty
of T
ract
ebel
Eng
inee
ring
S.A
. Any
dup
licat
ion
or tr
ansm
issi
on to
third
par
ties
is fo
rbid
den
with
out p
rior w
ritte
n ap
prov
al
2.5.2. Mid-term groups .......................................................................................... 29
2.6. Conclusions ........................................................................................................... 30
3. ANALYSIS OF BARRIERS AND CORRESPONDING RECOMMENDATIONS ................... 32
3.1. Overview of delayed PCIs ...................................................................................... 33
3.2. Longlist of barriers ................................................................................................ 36
3.3. Experiences of project promoters ........................................................................ 37
3.4. Major barriers ......................................................................................................... 42
3.4.1. Organisational issues at the permitting authority ......................................... 42 3.4.2. Difficulties related to the EIA ........................................................................ 44 3.4.3. Public consultation and opposition ............................................................... 45 3.4.4. Financing ..................................................................................................... 45
3.5. Need for actions ..................................................................................................... 47
3.5.1. Existing measures ....................................................................................... 47 3.5.2. New measures and recommendations ........................................................ 52
4. ASSESSMENT OF FURTHER INTEGRATION ................................................................... 55
4.1. Methodology ........................................................................................................... 55
4.2. Results of the market simulation .......................................................................... 57
4.2.1. Energy mix .................................................................................................. 57 4.2.2. Zonal marginal electricity prices and major bottlenecks ............................... 59
4.3. Sensitivity analyses ............................................................................................... 62
4.3.1. Impact of internal constraints in Germany and Italy ..................................... 62 4.3.2. Impact of load-generation vision .................................................................. 63 4.3.3. Impact of generation assumptions ............................................................... 64 4.3.4. Summary of the main congested interconnections ...................................... 65
4.4. Need of further integration in the region .............................................................. 66
5. CONCLUSIONS .................................................................................................................. 67
ANNEX A: LITERATURE ........................................................................................................... 69
ANNEX B: CASE STUDIES ....................................................................................................... 70 PCI cluster 3.4.......................................................................................................... 70 PCI cluster 3.8.......................................................................................................... 71 PCI cluster 3.15 ........................................................................................................ 73

EASTNSI/4NT/0512397/000/02 2017 02 16 5/74
This
doc
umen
t is
the
prop
erty
of T
ract
ebel
Eng
inee
ring
S.A
. Any
dup
licat
ion
or tr
ansm
issi
on to
third
par
ties
is fo
rbid
den
with
out p
rior w
ritte
n ap
prov
al
1. INTRODUCTION
In 2002, the European Council in Barcelona agreed on "the target for Member States of a level of electricity interconnections equivalent to at least 10% of their installed production capacity by 2005”. This target, expressed in terms of Net Transfer Capacity (NTC), was reiterated by the European Council in May 2013. In May 2014, the Commission proposed to extend the current 10% electricity interconnection target to 15% by 2030 while taking into account the cost aspects and the potential of commercial exchanges in the relevant regions. The European Council Conclusions requested that the EC, supported by the Member States, takes measures in order to ensure the achievement of a minimum target of 10% of existing electricity interconnections, as a matter of urgency, and no later than 2020 at least for Member States which have not yet attained a minimum level of integration in the internal energy market.
Despite the original target date of 2005, as indicated in Table 1, twelve Member States had still not met the 10% target as of 2014, including three of the five largest power systems in Europe.
The TEN-E Regulation1 identifies 4 priority electricity corridors (in its Annex I) which aim to identify Projects of Common Interest that support the achievement of internal market, sustainability and security of supply. In particular, the TEN-E Regulation identifies the NSI East Electricity priority corridor comprising Member States from Central Eastern and South Eastern Europe. For this purpose, in the second PCI list (Regulation (EU) 2016/89), 42 (out of 108) PCIs in the electricity sector belong to the NSI East Electricity corridor. However, this corridor shows a high degree of delay of PCI implementation, especially for financing and permitting issues.
Member States below 10% interconnection level
IE 9%
IT 7%
RO 7%
PT 7%
EE 4%
LT 4%
LV 4%
UK 6%
ES 3%
PL 2%
CY 0%
MT 0%
Table 1: Interconnection levels for electricity in 2014 for Member States below the 10% level
Source: ENTSO-E, Scenario Outlook and Adequacy Forecast 2014, as reported in COM(2015)82 final
1 Regulation (EU) 347/2013

EASTNSI/4NT/0512397/000/02 2017 02 16 6/74
This
doc
umen
t is
the
prop
erty
of T
ract
ebel
Eng
inee
ring
S.A
. Any
dup
licat
ion
or tr
ansm
issi
on to
third
par
ties
is fo
rbid
den
with
out p
rior w
ritte
n ap
prov
al
The objective of this study is thus to provide an in-depth analysis of the electricity infrastructure developments in that region (especially the need of new interconnections), to understand the barriers (administrative, permitting, regulatory and financing aspects) towards the deployment of these projects, and to provide recommendations to progress on PCIs deployment in this region.
As shown in Figure 1, the NSI East region gathers 13 countries that are analysed in details in the frame of this study: Italy, Hungary, Romania, Germany, Slovenia, Bulgaria, Poland, Croatia, Cyprus, Slovakia, Greece, Czech Republic and Austria. In addition, the cross-borders with Energy Community contracting parties2 (Serbia, Bosnia and Herzegovina, Montenegro, FYR of Macedonia, and Albania) are also considered.
Figure 1: Geographical Scope of the study
The first step of the study is the assessment of existing Projects of Common Interest in the region and the way they address the specific bottlenecks in the electricity networks of the region. A key element of the study is the detailed analysis of the impact of each PCI on EU energy policies such as RES integration and Internal Energy Market completion. For this purpose, Chapter 2 reviews existing Cost Benefit Analysis (CBA) of PCIs in the region and drafts a prioritised project list to guarantee that a further integration in the region brings substantial socioeconomic benefits. This list focuses on short-term and mid-term
2 At the exception of Kosovo and Moldova.

EASTNSI/4NT/0512397/000/02 2017 02 16 7/74
This
doc
umen
t is
the
prop
erty
of T
ract
ebel
Eng
inee
ring
S.A
. Any
dup
licat
ion
or tr
ansm
issi
on to
third
par
ties
is fo
rbid
den
with
out p
rior w
ritte
n ap
prov
al
interconnection projects, i.e. projects that are expected to be fully commissioned by 2025.
On the basis of this draft prioritised list, Chapter 3 investigates the delays and the barriers relevant for the deployment of the most important electricity infrastructure projects in Central and South Eastern Europe. This analysis of the barriers forms the basis of a proposal for a set of actions to overcome the obstacles identified.
The last step of the study is the assessment of the need for further integration in the region after the implementation of projects included in the prioritised list. Chapter 4 thus studies the expected remaining bottlenecks at the horizon 2030.

EASTNSI/4NT/0512397/000/02 2017 02 16 8/74
This
doc
umen
t is
the
prop
erty
of T
ract
ebel
Eng
inee
ring
S.A
. Any
dup
licat
ion
or tr
ansm
issi
on to
third
par
ties
is fo
rbid
den
with
out p
rior w
ritte
n ap
prov
al
2. ANALYSIS OF EXISTING PCIS
2.1. List of interconnection projects and groups
The first part of the study is the identification and the analysis of main electricity interconnection projects in the region. The considered list of interconnection projects is based on the list of PCIs, but is limited to projects increasing the transfer capacities between different countries. Therefore, this list of interconnection projects includes cross-border projects and internal reinforcements that increase transfer capacities between different countries, but does not include internal reinforcements that increase transfer capacities inside a specific country.
Figure 2: Map of groups of interdependent interconnection projects that will be analysed
In South-East and Central-East regions, for the 13 countries studied in this project, the analysis of Commission Delegated Regulation (EU) 2016/89 shows that 38 PCIs lead to an increase of cross-border transfer capacities3. These projects can be grouped in 15 groups of interdependent projects. Note that one of these groups gathers two co-dependent PCIs (3.16.1 and 3.17). Table 2 and Figure 2 show these groups. The ones indicated in red are the short-term groups (commissioning expected before 2020) while the one in orange and green are mid-term (commissioning expected between 2020 and 2025) and long-term (commissioning expected between 2025 and 2030) groups. The commissioning dates considered for this classification are the commissioning dates of the latest PCI of each group, as estimated by the PCI fiches of October
3 Internal projects without impact on cross-border transfer capacities such as the ones related to some of the internal German lines as well as storage projects are out of the scope of this study.

EASTNSI/4NT/0512397/000/02 2017 02 16 9/74
This
doc
umen
t is
the
prop
erty
of T
ract
ebel
Eng
inee
ring
S.A
. Any
dup
licat
ion
or tr
ansm
issi
on to
third
par
ties
is fo
rbid
den
with
out p
rior w
ritte
n ap
prov
al
2015 (latest version of the PCI fiches at the beginning of this study)4. Indeed, the expected increase of the interconnection capacity as estimated by ENTSO-E will be reached only when all projects of the group will be commissioned.
Group ID
Group Name Corresponding PCIs
Cross-border PCIs
I Interconnection Austria – Germany, between St. Peter (AT) and Isar (DE) 3.1.1, 3.1.2 3.1.1
II Interconnection Austria – Italy, between Lienz (AT) and Veneto region (IT) 3.2.1, 3.2.2 3.2.1
III Interconnection Austria – Italy, between Wurmlach (AT) and Somplago (IT) 3.4 3.4
IV Interconnection Bulgaria – Greece, between Maritsa East 1 (BG) and N. Santa (EL)
3.7.1, 3.7.2, 3.7.3, 3.7.4 3.7.1
V Capacity increase between Bulgaria and Romania (Black Sea Corridor)
3.8.1, 3.8.4, 3.8.5 -
VI Interconnection Croatia – Hungary – Slovenia, between Zerjavenec (HR) / Heviz (HU) and Cirkovce (SI)
3.9.1, 3.9.2, 3.9.3, 3.9.4 3.9.1
VII Interconnection Israel – Cyprus – Greece (Euroasia
Interconnector) between Hadera (IL), Kofinou (CY) and Korakia (EL)
3.10.1, 3.10.2, 3.10.3 3.10.1, 3.10.2
VIII Capacity increase between Czech Republic and Germany (Czech North South Corridor)
3.11.1, 3.11.2, 3.11.3, 3.11.4,
3.11.5 -
IX Interconnection Germany – Poland (GerPol Power Bridge), between Eisenhuttenstadt (DE) and Plewiska (PL)
3.14.1, 3.14.2, 3.14.3 3.14.1
X Interconnection Germany – Poland (GerPol Improvements), between Vierraden (DE) and Krajnik (PL) 3.15.1, 3.15.2 3.15.1
XI Double interconnection Hungary – Slovakia, between
Gabcikovo (SK) and Gonyu (HU) and between Sajovanka (HU) and Rimavska Sobota (SK)
3.16.1, 3.17 3.16.1, 3.17
XII Interconnection Hungary – Slovakia, between Kisvarda area (HU) and Velké Kapusany (SK) 3.18.1 3.18.1
XIII Interconnection Italy – Montenegro, between Villanova (IT) and Lastva (ME) 3.19.1 3.19.1
XIV Interconnection Italy – Slovenia, between Salgareda (IT) and Divaca-Bericevo region (SI) 3.21 3.21
XV Interconnection Romania – Serbia (Mid Continental East Corridor), between Resita (RO) and Pancevo (RS)
3.22.1, 3.22.2, 3.22.3, 3.22.4 3.22.1
Table 2 : List of groups of interconnection projects that will be analysed
4 Note that the PCI fiches were updated during this study (June 2016). This classification remains valid when
considering that update, except for Group XII: it is rescheduled for 2029 while it was initially planned for 2021. Moreover, expected commissioning dates given by ENTSO-E (in the TYNDP) and by ACER (in the annual report on PCI progress) might slightly differ. That will be discussed in the next chapters.

EASTNSI/4NT/0512397/000/02 2017 02 16 10/74
This
doc
umen
t is
the
prop
erty
of T
ract
ebel
Eng
inee
ring
S.A
. Any
dup
licat
ion
or tr
ansm
issi
on to
third
par
ties
is fo
rbid
den
with
out p
rior w
ritte
n ap
prov
al
2.2. Detailed groups and internal reinforcements
Because several fundamental characteristics of groups (e.g. their costs and their contribution to the NTC increase between two countries and so the benefits they bring to the system), rely on internal reinforcements, the identification of these internal reinforcements is required. Some internal reinforcements are already identified in the PCI list for PCIs forming part of a cluster. Other internal reinforcements are identified in the TYNDP: a project in the draft TYNDP 2016 package can gather several investment items that have to be realised in total to achieve a desired effect. A group linked to a particular PCI can thus gather projects beyond the ones that are part of the relevant cluster of interdependent PCIs in the second PCI list (Commission Delegated Regulation (EU) 2016/89). This section analyses thus internal reinforcements needed in order to take advantage of the full potential of PCIs.
2.2.1. Group I (AT/DE) Group I is an interconnection Austria – Germany. It consists mainly in a new 380 kV double circuit OHL between St. Peter (AT) and Isar (DE), including 110 km of new line in Germany5, 61 km of new circuit on an existing line, new 380 kV switchgears (in Altheim, Simbach, Pirach and St. Peter), new 380/220 kV transformers (substations Altheim and St. Peter) and a fourth circuit on the line between Isar and Ottenhofen. This project corresponds to the PCI 3.1.1 and the investment item 47.212 in the draft TYNDP2016. According to the draft TYNDP2016, the NTC increase between Austria and Germany will be 2900 MW (in both directions), if the following internal reinforcements are performed as well:
Upgrade of existing line St. Peter – Salzburg from 220 kV to 380 kV and new double circuit 380 kV line (replacement of the existing 220 kV lines on an optimized route) between Salzburg and Tauern (PCI 3.1.2 & draft TYNDP2016 investment item 47.216)6,
Upgrade of existing 220 kV line Westtirol – Zell-Ziller (105 km) and erection of an additional 220/380 kV transformer (PCI 2.1 & draft TYNDP2016 investment item 47.219),
Upgrade of the existing overhead line between Vöhringen (DE) and Westtirol (AT) to 380 kV (draft TYNDP2016 investment item 47.689).
This group is considered to be a “Mid-term group”, because the forecasted commissioning date of the latest PCI, PCI 3.1.2, is 2023. Figure 3 shows the electrical grid in the region of Group I. The cluster 3.1 contained initially PCI 3.1.3, the upgrade of the 220 kV line between St. Peter and Ernsthofen to 380 kV, but this line is now commissioned.
5 This is an AC line, so it is not directly affected by the recent German legislation giving priority of underground
cabling for new HVDC projects. 6 These internal lines are both necessary to be commissioned to get full advantage of the increase of the
interconnection capacity provided by the cross-border and to establish the 380-kV-Ring in Austria.

EASTNSI/4NT/0512397/000/02 2017 02 16 11/74
This
doc
umen
t is
the
prop
erty
of T
ract
ebel
Eng
inee
ring
S.A
. Any
dup
licat
ion
or tr
ansm
issi
on to
third
par
ties
is fo
rbid
den
with
out p
rior w
ritte
n ap
prov
al
Figure 3: Regional grid map of Group I (AT-DE), from ENTSO-E Transmission System Map.
2.2.2. Group II (AT/IT) Group II is an interconnection Austria – Italy. It consists mainly in the reconstruction of the existing 220-kV interconnection line as 380-kV line, between Lienz (AT) and the Veneto region (IT), of about 100-150 km (approximately 35 km in Austria, and the rest in Italy), along an optimized route, which minimizes the environmental impact. This project corresponds to the PCI 3.2.1 and the investment item 26.63 in the draft TYNDP2016.
According to the TYNDP2016, the NTC increase will be 1000 MW in the direction Italy → Austria and 1100 MW in the direction Austria → Italy, if the following internal reinforcements are performed as well:
New 380 kV OHL between Lienz and Obersielach (PCI 3.2.2 & draft TYNDP2016 investment item 26.218) with a length of approximately 190 km7,
New 380/220/132 substation at Volpago (draft TYNDP2016 investment item 26.1039).
This group is considered to be a “Mid-term group”, because the forecasted commissioning date of the latest project, PCI 3.2.2, is 2025. Figure 4 shows the electrical grid in the region of Group II.
7 This project is also the last part of the planned 380-kV-Ring, which is the backbone of Austrian electricity supply.

EASTNSI/4NT/0512397/000/02 2017 02 16 12/74
This
doc
umen
t is
the
prop
erty
of T
ract
ebel
Eng
inee
ring
S.A
. Any
dup
licat
ion
or tr
ansm
issi
on to
third
par
ties
is fo
rbid
den
with
out p
rior w
ritte
n ap
prov
al
Figure 4: Regional grid map of Group II & Group III (AT-IT) , from ENTSO-E Transmission System Map.
2.2.3. Group III (AT/IT) Group III is an interconnection Austria – Italy. It consists mainly in the construction of a new 220 kV AC OHL (merchant line) of 40 km, between Wurmlach/Greuth (AT) and Somplago (IT). It is a third party project (i.e. not promoted by the TSOs) promoted by Alpe Adria Energia SpA. This project corresponds to the PCI 3.4 and the investment item 210.1380 in the draft TYNDP2016. The draft TYNDP2016 indicates additionally that the project includes a 300 MW PST, located in Austria.
According to the draft TYNDP2016, the NTC increase between Austria and Italy will be 150 MW (in both directions) and no internal reinforcement is needed. This group is considered to be a “Short-term group”, because the forecasted commissioning date of PCI 3.4 is 2019. Figure 4 here above shows the electrical grid in the region of Group III.
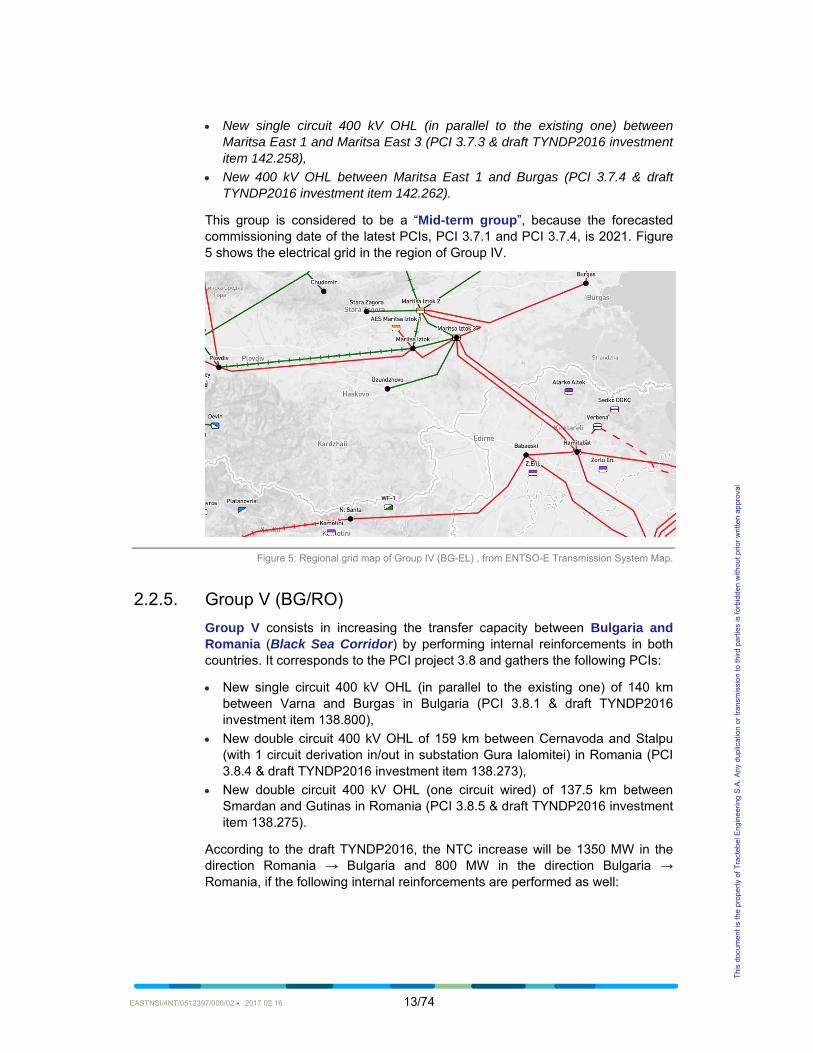
2.2.4. Group IV (BG/EL) Group IV is an interconnection Bulgaria – Greece. It consists mainly in the construction of a new 400 kV AC OHL (single circuit), between Maritsa East 1 (BG) and N. Santa (EL), with a length of approximately 151 km (29 km in Greece and 122 km in Bulgaria). This project corresponds to the PCI 3.7.1 and the investment item 142.256 in the draft TYNDP2016.
According to the draft TYNDP2016, the NTC increase will be 850 MW in the direction Bulgaria → Greece and 400 MW in the direction Greece → Bulgaria, if the following internal reinforcements are performed as well:
New single circuit 400 kV OHL (in parallel to the existing one) between Maritsa East 1 and Plovdiv (PCI 3.7.2 & draft TYNDP2016 investment item 142.257),
EASTNSI/4NT/0512397/000/02 2017 02 16 13/74
This
doc
umen
t is
the
prop
erty
of T
ract
ebel
Eng
inee
ring
S.A
. Any
dup
licat
ion
or tr
ansm
issi
on to
third
par
ties
is fo
rbid
den
with
out p
rior w
ritte
n ap
prov
al
New single circuit 400 kV OHL (in parallel to the existing one) between Maritsa East 1 and Maritsa East 3 (PCI 3.7.3 & draft TYNDP2016 investment item 142.258),
New 400 kV OHL between Maritsa East 1 and Burgas (PCI 3.7.4 & draft TYNDP2016 investment item 142.262).
This group is considered to be a “Mid-term group”, because the forecasted commissioning date of the latest PCIs, PCI 3.7.1 and PCI 3.7.4, is 2021. Figure 5 shows the electrical grid in the region of Group IV.
Figure 5: Regional grid map of Group IV (BG-EL) , from ENTSO-E Transmission System Map.
2.2.5. Group V (BG/RO) Group V consists in increasing the transfer capacity between Bulgaria and Romania (Black Sea Corridor) by performing internal reinforcements in both countries. It corresponds to the PCI project 3.8 and gathers the following PCIs:
New single circuit 400 kV OHL (in parallel to the existing one) of 140 km between Varna and Burgas in Bulgaria (PCI 3.8.1 & draft TYNDP2016 investment item 138.800),
New double circuit 400 kV OHL of 159 km between Cernavoda and Stalpu (with 1 circuit derivation in/out in substation Gura Ialomitei) in Romania (PCI 3.8.4 & draft TYNDP2016 investment item 138.273),
New double circuit 400 kV OHL (one circuit wired) of 137.5 km between Smardan and Gutinas in Romania (PCI 3.8.5 & draft TYNDP2016 investment item 138.275).
According to the draft TYNDP2016, the NTC increase will be 1350 MW in the direction Romania → Bulgaria and 800 MW in the direction Bulgaria → Romania, if the following internal reinforcements are performed as well:

EASTNSI/4NT/0512397/000/02 2017 02 16 14/74
This
doc
umen
t is
the
prop
erty
of T
ract
ebel
Eng
inee
ring
S.A
. Any
dup
licat
ion
or tr
ansm
issi
on to
third
par
ties
is fo
rbid
den
with
out p
rior w
ritte
n ap
prov
al
New single circuit 400 kV OHL (139 km) between Suceava and Gadalin in Romania (draft TYNDP2016 investment item 138.276) 8,
Upgrade of the existing 220 kV OHL Stalpu – Teleajen – Brazi to 400 kV (continuation of the line between Cernavoda and Stalpu), and corresponding upgrade of the Stalpu substation (draft TYNDP2016 investment item 138.715).
This group is considered to be a “Mid-term group”, because the forecasted commissioning date of the latest PCI, PCI 3.8.1, is 2022. Figure 6 shows the electrical grid in the region of Group V.
Figure 6: Regional grid map of Group V (BG-RO) , from ENTSO-E Transmission System Map.
8 It corresponded previously to the PCI 3.8.6, but is no longer considered as PCI because the contribution to the NTC
contribution was not enough.

EASTNSI/4NT/0512397/000/02 2017 02 16 15/74
This
doc
umen
t is
the
prop
erty
of T
ract
ebel
Eng
inee
ring
S.A
. Any
dup
licat
ion
or tr
ansm
issi
on to
third
par
ties
is fo
rbid
den
with
out p
rior w
ritte
n ap
prov
al
2.2.6. Group VI (SI/HU/HR) Group VI is an interconnection Croatia – Hungary – Slovenia. It consists mainly in the connection of the existing substation of Cirkovce (SI) to one circuit of the existing Heviz (HU) – Zerjavinec (HR) double circuit 400 kV OHL by erecting a new 80 km double circuit 400 kV OHL in Slovenia. It will result in two new cross-border circuits: Heviz (HU) – Cirkvoce (SI) and Cirkvoce (SI) – Zerjavenec (HR). This project corresponds to the PCI 3.9.1 and the investment item 141.223 in the draft TYNDP2016.
According to the draft TYNDP2016, the NTC increase will be 1350 MW in the direction Romania → Bulgaria and 800 MW in the direction Bulgaria → Romania., if the existing 220 kV lines of the corridor Divaca-Bericevo-Podlog-Cirkovce in Slovenia are upgraded to 400 kV (PCIs 3.9.2, 3.9.3, 3.9.4 & draft TYNDP2016 investment item 141.225).
This group is considered to be a “Long-term group”, because the forecasted commissioning date of the latest PCIs, PCI 3.9.3 and PCI 3.9.4, is 20269. Note that the commissioning date of PCI 3.9.1 is already 2019, which means that the internal reinforcements needed to reach the expected increase of interconnection capacity is foreseen be commissioned 7 years after the interconnection itself. Figure 7 shows the electrical grid in the region of Group VI.
Figure 7: Regional grid map of Group VI (SI-HU-HR) , from ENTSO-E Transmission System Map.
9 It must be noted that the draft TYNDP2016 considers that the expected commissioning year of that project is 2021
(“on time”), which is contradictory with the PCI implementation fiche.

EASTNSI/4NT/0512397/000/02 2017 02 16 16/74
This
doc
umen
t is
the
prop
erty
of T
ract
ebel
Eng
inee
ring
S.A
. Any
dup
licat
ion
or tr
ansm
issi
on to
third
par
ties
is fo
rbid
den
with
out p
rior w
ritte
n ap
prov
al
2.2.7. Group VII (IL/CY/EL) Group VII is an interconnection Israel – Cyprus – Greece (Creta and mainland). It is called the “EuroAsia Interconnector”. It consists in two international HVDC interconnections and one national HVDC interconnection:
A new HVDC interconnection (final capacity: 2000 MW) of 330 km between Hadera (Israel) and Vasilikos (Cyprus), corresponding to the PCI 3.10.1 and the draft TYNDP2016 investment item 219.1407,
A new HVDC interconnection (final capacity: 2000 MW) of 880 km between Vasilikos (or Kofiniou) (Cyprus) and Korakia (Creta – Greece), corresponding to the PCI 3.10.2 and the draft TYNDP2016 investment item 219.1409,
A new HVDC interconnection (final capacity: 2000 MW) of 310 km between Korakia (Creta) and Athens in Greece, corresponding to the PCI 3.10.3 and the draft TYNDP2016 investment item 219.1410.
According to the draft TYNDP2016, the NTC increase will be 2000 MW (in both directions). However, the anticipated deployment of the complete HVDC system is divided of two stages: the first stage aims at having a capacity of 1000 MW on the axis Israel – Cyprus – Greece (Creta and mainland), while the second stage will allow to reach a capacity of 2000 MW. The first stage is anticipated to be completed in four steps:
Step 1: interconnection of Israel and Cyprus by an HVDC power transmission system of 500 MW (converter stations of 500 MW, but a pair of cables for a capacity up to 1000 MW),
Step 2 : interconnection of Attica and Crete by an HVDC power transmission of 1000 MW,
Step 3: upgrade of the HVDC power transmission system between Israel and Cyprus to 1000 MW (upgrade of converter stations),
Step 4: interconnection of Crete and Cyprus by an HVDC power transmission of 1000 MW.
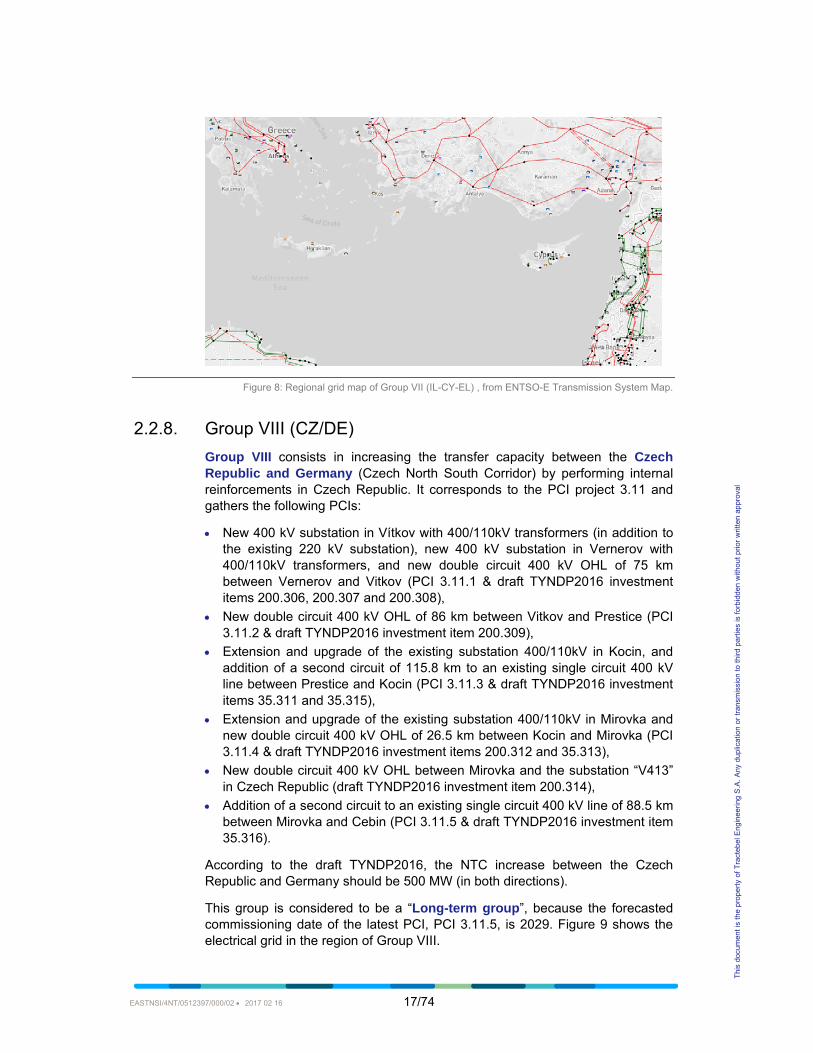
This group is considered to be a “Mid-term group”, because the forecasted commissioning date of the second stage of the latest PCI, PCI 3.10.2, is 2022. Figure 8 shows the electrical grid in the region of Group VII.
EASTNSI/4NT/0512397/000/02 2017 02 16 17/74
This
doc
umen
t is
the
prop
erty
of T
ract
ebel
Eng
inee
ring
S.A
. Any
dup
licat
ion
or tr
ansm
issi
on to
third
par
ties
is fo
rbid
den
with
out p
rior w
ritte
n ap
prov
al
Figure 8: Regional grid map of Group VII (IL-CY-EL) , from ENTSO-E Transmission System Map.
2.2.8. Group VIII (CZ/DE) Group VIII consists in increasing the transfer capacity between the Czech Republic and Germany (Czech North South Corridor) by performing internal reinforcements in Czech Republic. It corresponds to the PCI project 3.11 and gathers the following PCIs:
New 400 kV substation in Vítkov with 400/110kV transformers (in addition to the existing 220 kV substation), new 400 kV substation in Vernerov with 400/110kV transformers, and new double circuit 400 kV OHL of 75 km between Vernerov and Vitkov (PCI 3.11.1 & draft TYNDP2016 investment items 200.306, 200.307 and 200.308),
New double circuit 400 kV OHL of 86 km between Vitkov and Prestice (PCI 3.11.2 & draft TYNDP2016 investment item 200.309),
Extension and upgrade of the existing substation 400/110kV in Kocin, and addition of a second circuit of 115.8 km to an existing single circuit 400 kV line between Prestice and Kocin (PCI 3.11.3 & draft TYNDP2016 investment items 35.311 and 35.315),
Extension and upgrade of the existing substation 400/110kV in Mirovka and new double circuit 400 kV OHL of 26.5 km between Kocin and Mirovka (PCI 3.11.4 & draft TYNDP2016 investment items 200.312 and 35.313),
New double circuit 400 kV OHL between Mirovka and the substation “V413” in Czech Republic (draft TYNDP2016 investment item 200.314),
Addition of a second circuit to an existing single circuit 400 kV line of 88.5 km between Mirovka and Cebin (PCI 3.11.5 & draft TYNDP2016 investment item 35.316).
According to the draft TYNDP2016, the NTC increase between the Czech Republic and Germany should be 500 MW (in both directions).
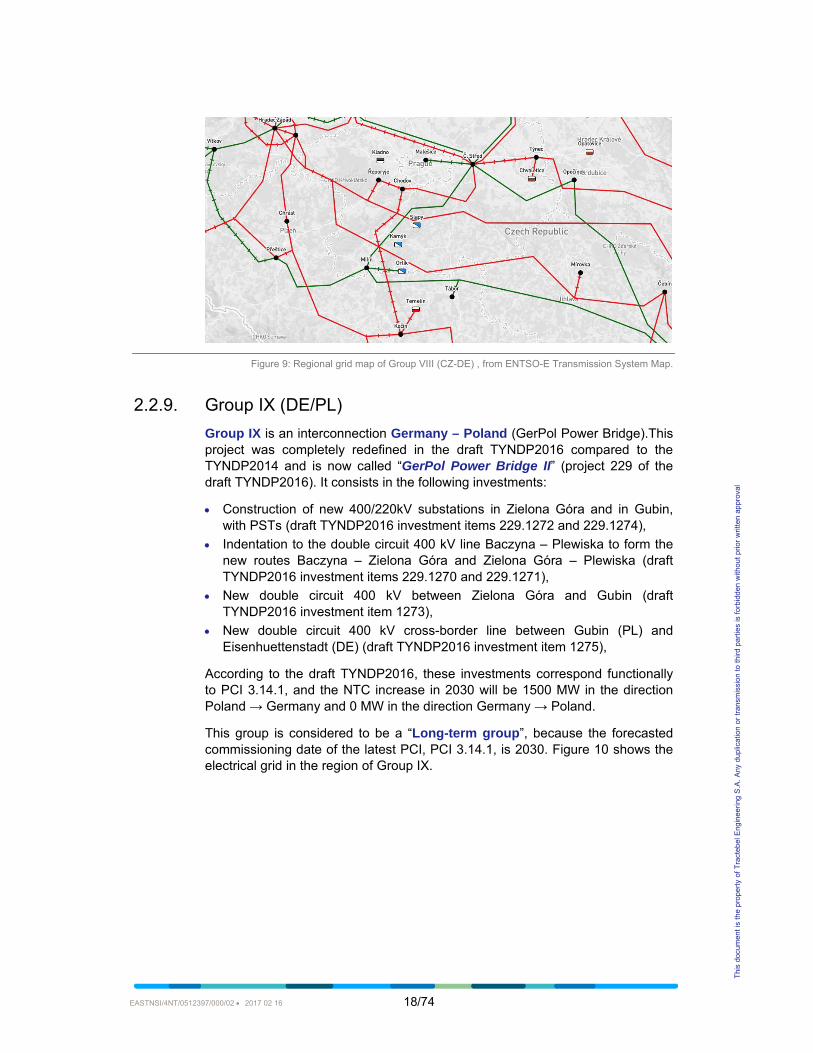
This group is considered to be a “Long-term group”, because the forecasted commissioning date of the latest PCI, PCI 3.11.5, is 2029. Figure 9 shows the electrical grid in the region of Group VIII.
EASTNSI/4NT/0512397/000/02 2017 02 16 18/74
This
doc
umen
t is
the
prop
erty
of T
ract
ebel
Eng
inee
ring
S.A
. Any
dup
licat
ion
or tr
ansm
issi
on to
third
par
ties
is fo
rbid
den
with
out p
rior w
ritte
n ap
prov
al
Figure 9: Regional grid map of Group VIII (CZ-DE) , from ENTSO-E Transmission System Map.
2.2.9. Group IX (DE/PL) Group IX is an interconnection Germany – Poland (GerPol Power Bridge).This project was completely redefined in the draft TYNDP2016 compared to the TYNDP2014 and is now called “GerPol Power Bridge II” (project 229 of the draft TYNDP2016). It consists in the following investments:
Construction of new 400/220kV substations in Zielona Góra and in Gubin, with PSTs (draft TYNDP2016 investment items 229.1272 and 229.1274),
Indentation to the double circuit 400 kV line Baczyna – Plewiska to form the new routes Baczyna – Zielona Góra and Zielona Góra – Plewiska (draft TYNDP2016 investment items 229.1270 and 229.1271),
New double circuit 400 kV between Zielona Góra and Gubin (draft TYNDP2016 investment item 1273),
New double circuit 400 kV cross-border line between Gubin (PL) and Eisenhuettenstadt (DE) (draft TYNDP2016 investment item 1275),
According to the draft TYNDP2016, these investments correspond functionally to PCI 3.14.1, and the NTC increase in 2030 will be 1500 MW in the direction Poland → Germany and 0 MW in the direction Germany → Poland.
This group is considered to be a “Long-term group”, because the forecasted commissioning date of the latest PCI, PCI 3.14.1, is 2030. Figure 10 shows the electrical grid in the region of Group IX.

EASTNSI/4NT/0512397/000/02 2017 02 16 19/74
This
doc
umen
t is
the
prop
erty
of T
ract
ebel
Eng
inee
ring
S.A
. Any
dup
licat
ion
or tr
ansm
issi
on to
third
par
ties
is fo
rbid
den
with
out p
rior w
ritte
n ap
prov
al
Figure 10: Regional grid map of Group IX (DE-PL) , from ENTSO-E Transmission System Map.
2.2.10. Group X (DE/PL) Group X is an interconnection Germany – Poland (GerPol Improvements). It consists mainly in the upgrade of the existing 220 kV line of 26 km between Vierraden and Krajnik to a double circuit 380 kV OHL10. In addition, the Krajnik substation must be upgraded. This project corresponds to the PCI 3.15.1 and the draft TYNDP2016 investment items 94.139 and 94.796.
According to the draft TYNDP2016, the NTC increase between Germany and Poland will be 1500 MW in the direction Poland → Germany and 500 MW in the direction Germany → Poland, if Phase Shifter Transformers (PSTs) are installed in Vierraden and in Mikulowa (PCI 3.15.2 & draft TYNDP2016 investment items 94.992 and 94.799). Indeed, the existing 220 kV line between Vierraden and Krajnik could be switched to 400 kV only after the PSTs have been installed on both existing interconnectors.
10 This is an AC line, so it is not directly affected by the recent German legislation giving priority of underground
cabling for new HVDC projects.

EASTNSI/4NT/0512397/000/02 2017 02 16 20/74
This
doc
umen
t is
the
prop
erty
of T
ract
ebel
Eng
inee
ring
S.A
. Any
dup
licat
ion
or tr
ansm
issi
on to
third
par
ties
is fo
rbid
den
with
out p
rior w
ritte
n ap
prov
al
This group is considered to be a “Short-term group”, because the forecasted commissioning date of the latest PCIs, PCI 3.15.1 and PCI 3.15.2, is 2017, according to the latest PCI fiches (June 2016). However, the draft TYNDP2016 indicates that delays are expected on several investment items. If the PSTs are already installed in Mikulowa (June 2016), the upgrade of the line between Vierraden and Krajnik and the commissioning of PSTs in Vierraden is postponed to 2018, due to permit granting reasons on 50Hertz side. Moreover, the upgrade of the Krajnik substation is rescheduled to 2020. The overall project is thus planned to operate in final shape by 2020. Figure 11 shows the electrical grid in the region of Group X.
Figure 11: Regional grid map of Group X (DE-PL) , from ENTSO-E Transmission System Map.
2.2.11. Group XI (SK/HU) Group XI is a double interconnection Hungary – Slovakia (New SK-HU interconnection – phase 1). It consists mainly in a new double circuit 400 kV line of between Gabcikovo (SK) and Gonyu (HU) and a new double circuit 400 kV line between Rimavska Sobota (SK) and Sajoivanka. This double project corresponds to PCIs 3.16 and 3.17 and to the draft TYNDP2016 investment items 48.214 and 48.695. They are grouped together because they are co-dependent. PCI 3.16 includes also the erection of a new switching station Gabcikovo next to the existing one.
According to the draft TYNDP2016, the NTC increase will be 2400 MW in the direction Slovakia → Hungary and 950 MW in the direction Hungary → Slovakia, if the following internal reinforcement is performed as well:
Installation of a second 400/120 kV transformer and 2×70 MVAr shunt reactors in station Sajoivanka (draft TYNDP2016 investment items 48.696 and 48.697).

EASTNSI/4NT/0512397/000/02 2017 02 16 21/74
This
doc
umen
t is
the
prop
erty
of T
ract
ebel
Eng
inee
ring
S.A
. Any
dup
licat
ion
or tr
ansm
issi
on to
third
par
ties
is fo
rbid
den
with
out p
rior w
ritte
n ap
prov
al
This group is considered to be a “Short-term group”, because the forecasted commissioning date of the latest PCIs, PCI 3.16.1, PCI 3.16.3 and PCI 3.17, is 2018. However, according to the draft TYNDP2016, the expected commissioning date is now 2019. Figure 12 shows the electrical grid in the region of Group XI.
Figure 12: Regional grid map of Group XI (SK-HU) , from ENTSO-E Transmission System Map.
2.2.12. Group XII (SK/HU) Group XII is an interconnection Hungary – Slovakia (New SK-HU interconnection – phase 2). It consists in a new double circuit 400 kV line between Kisvarda area (HU) and Velké Kapusany (SK). This project corresponds to the PCI 3.18.1 and to the draft TYNDP2016 investment item 54.720.
According to the draft TYNDP2016, the NTC increase will be 300 MW in the direction Hungary → Slovakia and 250 MW in the direction Slovakia → Hungary.
This group is considered to be a “Mid-term group”, because the initial forecasted commissioning date of PCI 3.18.1 was 2021, according to the PCI fiche of October 2015. However, the draft TYNDP2016 and the latest PCI fiche (June 2016) indicate that this project is rescheduled to 2029. Figure 13 shows the electrical grid in the region of Group XII.
Figure 13: Regional grid map of Group XII (HU-SK) , from ENTSO-E Transmission System Map.

EASTNSI/4NT/0512397/000/02 2017 02 16 22/74
This
doc
umen
t is
the
prop
erty
of T
ract
ebel
Eng
inee
ring
S.A
. Any
dup
licat
ion
or tr
ansm
issi
on to
third
par
ties
is fo
rbid
den
with
out p
rior w
ritte
n ap
prov
al
2.2.13. Group XIII (IT/ME) Group XIII is an interconnection Italy – Montenegro. It consists mainly in a new 1200MW 500kV HVDC subsea interconnection cable of 375 km between Villanova (IT) and Lastva (ME) and corresponding converter stations. This project corresponds to the PCI 3.19.1 and draft TYNDP2016 investment item 28.70.
According to the draft TYNDP2016, the NTC increase between Italy and Montenegro will be 1200 MW (in both directions), if a new 400 kV substation in Lastva is constructed and connected to the existing 400 kV line between Podgorica 2 (ME) and Trebinje (BA) (draft TYNDP2016 investment item 28.624).
This group is considered to be a “Short-term group”, because the forecasted commissioning date of PCI 3.19.1 is 2018. Figure 14 shows the electrical grid in the region of Group XIII.
Figure 14: Regional grid map of Group XIII (IT-ME) , from ENTSO-E Transmission System Map.
2.2.14. Group XIV (IT/SI) Group XIV is an interconnection Italy – Slovenia. It consists in a new HVDC underground cable with a length of about 150-200 km between Salgareda (IT) and Divaca-Bericevo region (SI) with a capacity of 1000 MW. This project corresponds to the PCI 3.21 and the draft TYNDP2016 investment item 150.616.
According to the draft TYNDP2016, the NTC increase between Italy and Slovenia will be 950 MW in both directions Additionally, PCI 3.21 is highly dependent on the realization of Cluster 3.9 (part of Group VI): PCIs 3.9.1 and 3.9.2 will be necessary to get full advantage of the increase of the interconnection capacity provided by the cross-border line11.
This group is considered to be a “Mid-term group”, because the forecasted commissioning date of PCI 3.21 is 2022. Figure 15 shows the electrical grid in the region of Group XIV.
11 Note that PCIs 3.9.1 and 3.9.2 should be commissioned in 2019 and 2021, respectively, so before PCI 3.21.

EASTNSI/4NT/0512397/000/02 2017 02 16 23/74
This
doc
umen
t is
the
prop
erty
of T
ract
ebel
Eng
inee
ring
S.A
. Any
dup
licat
ion
or tr
ansm
issi
on to
third
par
ties
is fo
rbid
den
with
out p
rior w
ritte
n ap
prov
al
Figure 15: Regional grid map of Group XIV (IT-SL) , from ENTSO-E Transmission System Map.
2.2.15. Group XV (RO/RS) Group XV is an interconnection Romania – Serbia (Mid-Continental East corridor). It consists mainly in a new double circuit 400 kV OHL of 131 km (63 km on Romanian side and 68 km on Serbian side) between Resita (RO) and Pancevo (RS). This project corresponds to the PCI 3.22.1 and the draft TYNDP2016 investment item 144.238.
According to the draft TYNDP2016, the NTC increase between Romania and Serbia will be will be 950 MW in the direction Romania → Serbia and 750 MW in the direction Serbia → Romania:
New 400 kV substation at Resita and new 400 kV OHL of 116 km between Portile de Fer and Resita in Romania (PCI 3.22.2 & draft TYNDP2016 investment items 144.701 and 144.269),
Upgrade of existing double circuit 220 kV lines Resita-Timisoara-Sacalaz-Arad to double circuit 400 kV lines and replacement of the 220 kV Timisoara substation with 400 kV substation in Romania (PCIs 3.22.3 and 3.22.4 & draft TYNDP2016 investment items 144.270 and 144.705).
This group is considered to be a “Mid-term group”, because the forecasted commissioning date of the latest PCIs, PCI 3.22.3 and PCI 3.22.4, is 2022. Figure 16 shows the electrical grid in the region of Group XV.

EASTNSI/4NT/0512397/000/02 2017 02 16 24/74
This
doc
umen
t is
the
prop
erty
of T
ract
ebel
Eng
inee
ring
S.A
. Any
dup
licat
ion
or tr
ansm
issi
on to
third
par
ties
is fo
rbid
den
with
out p
rior w
ritte
n ap
prov
al
Figure 16: Regional grid map of Group XV, from ENTSO-E Transmission System Map.
2.3. CBA of interconnection projects
This section provides a synthesis of costs and benefits of groups of interconnection projects listed in the previous section estimated by the draft TYNDP2016. For this analysis, Vision 3 is chosen as a reference, but main results are also given for the others visions. In the TYNDP 2016, the Net Present Value (NPV) is estimated from the cost and the yearly benefit of each project. In accordance with “ENTSO-E Guidelines for Cost Benefit Analysis of Grid Development Projects”, a real discount rate of 4% for 25-year lifetime and a residual value equal to zero were used.
Note that the CBA is performed on each group defined in the previous section, in its entirety (including internal reinforcements), and not on individual PCIs12. Indeed, a PCI alone cannot be used to its full potential without the adequate internal reinforcements that are included in its group. For the sake of clarity, interconnection groups are divided in the three temporal categories according to their implementation schedule, using as a reference the commissioning dates of the PCI fiches (in line with the methodology reported in the previous section): short-term, mid-term and long-term groups.
12 Note that, in order to become a PCI, a project must contribute also significantly to sustainability and security of
supply, according to the TEN-E Regulation, Art. 4.2. These benefits are not entirely captured by the SEW indicator used in the ENTSO- E methodology and they need a separate evaluation.

EASTNSI/4NT/0512397/000/02 2017 02 16 25/74
This
doc
umen
t is
the
prop
erty
of T
ract
ebel
Eng
inee
ring
S.A
. Any
dup
licat
ion
or tr
ansm
issi
on to
third
par
ties
is fo
rbid
den
with
out p
rior w
ritte
n ap
prov
al
2.3.1. Short-term groups Table 3 shows the CBA of short-term groups according to the draft TYNDP2016, using Vision 3 for the annual benefits, the NPV and the IRR.
The impact on the Socio-Economic Welfare (SEW) of Group III and of Group XI is negligible, but their costs are low. Therefore, their NPVs are around zero. On the contrary, Group X and Group XI increase significantly the SEW and display globally high NPVs and IRRs. Their NPVs are in a similar range. However, Group X has a low cost (85 M€) and annual benefits are only slightly lower than this cost. Therefore, the IRR is huge (more than 70%). On the contrary, Group XIII has a high cost (more than €1 billion) and annual benefits much smaller than this cost (between 100 M€ and 200 M€). It entails an IRR much lower, between 5% and 15%.
Group ID Cost (M€) Annual benefits (M€/year)
NPV (M€) IRR (%)
III (AT/IT) 60 [0,10] [-60,96] ]-∞,16.3]
X (DE/PL) 85 [60,80] [852,1165] [70.6,94.1]
XI (SK/HU) [74,90] [0,10] [-90,82] ]-∞,12.9]
XIII (IT/ME) [1181,1311] [100,181] [251,1631] [5.7,14.8]
Table 3: Economic Analysis of Short-Term Interconnection Groups, draft TYNDP2016 Vision 3
Table 4 shows the annual benefits and the NPVs for Vision 1, Vision 2 and Vision 4. Groups III and XI are not really sensitive to the load/generation vision: theirs NPVs stay close to 0 in each case. Group X displays a higher sensitivity, but the NPV stays very much positive for each vision. Group XIII is very sensitive: if the NPV is between €251 million and €1.9 billion for Vision 2, it is between €-1 billion and €381 million for Vision 4.
Group ID Annual benefits – V1
(M€/year)
NPV – V1 (M€)
Annual benefits – V2
(M€/year)
NPV – V2 (M€)
Annual benefits – V4
(M€/year)
NPV – V4 (M€)
III (AT/IT) [0,10] [-60,96] [0,20] [-60,252] [0,10] [-60,96]
X (DE/PL) [180,200] [2727,3039] [120,160] [1790,2415] [60,80] [852,1165]
XI (SK/HU) [0,10] [-90,82] [0,10] [-90,82] [0,10] [-90,82] XIII (IT/ME) [90,190] [95,1787] [100,200] [251,1943] [20,100] [-999,381]
Table 4: Economic Analysis of Short-Term Interconnection Groups, draft TYNDP2016 Visions 1, 2 & 4
2.3.2. Mid-term groups Table 5 shows the CBA of mid-term groups according to the draft TYNDP2016, using Vision 3 for the annual benefits, NPV and IRR.

EASTNSI/4NT/0512397/000/02 2017 02 16 26/74
This
doc
umen
t is
the
prop
erty
of T
ract
ebel
Eng
inee
ring
S.A
. Any
dup
licat
ion
or tr
ansm
issi
on to
third
par
ties
is fo
rbid
den
with
out p
rior w
ritte
n ap
prov
al
Groups II, IV, XIV and XV display negative NPV: the annual benefits they bring are low compared to their cost. The annual benefits of Group V are moderate, which leads to a low but positive NPV. Group I displays NPV of several billions of Euros, but there is an important relative uncertainty on annual benefits. Finally, Group VII leads to a huge NPV, between €9 billion and €14 billion. Nevertheless, it must be noted that no details about the origin of the high benefits computed by ENTSO-E is given in the TYNDP.
Group ID Cost (M€) Annual benefits (M€/year)
NPV (M€) IRR (%)
I (AT/DE) [1000,1500] [150,270] [843,3218] [8.8,26.9]
II (AT/IT) [615,815] [0,40] [-815,10] ]-∞,4.2]
IV (BG/EL) [178,198] [0,10] [-198,-22] ]-∞,2.8]
V (BG/RO) [258,338] [30,50] [131,523] [7.4,19.1]
VII (IL/CY/EL) 4247 [860,1160] [9188,13875] [20.0,27.2]
XIV (IT/SI) 870 [10,30] [-714,-401] [-7.9,-1.1]
XV (RO/RS) [151,201] [0,10] [-201,5] ]-∞,4.3]
Table 5: Economic Analysis of Mid-Term Interconnection Groups, draft TYNDP2016 Vision 3
Table 6 shows the annual benefits and the NPVs for Vision 1, Vision 2 and Vision 4. The sensitivity to the load/generation vision is low for Group II and Group VII. Group I displays NPVs around 0 but with a large variance for Vision 1 and Vision 2, but high NPVs for Vision 3 and Vision 4. Group IV displays NPVs around 0 for Vision 1 and Vision 3, but a NPV of several hundreds of M€ for Vision 2 and around €1 billion for Vision 4. Group V displays NPV constantly positive, but ranging from €131 million to around €4.6 billion. Group XIV has positive NPVs for Vision 1 and Vision 2, but negative NPVs for Vision 3 and Vision 4. Finally, Group XV displays positive NPVs, except for Vision 3, where the NPV is around 0.
Group ID Annual benefits – V1
(M€/year)
NPV – V1 (M€)
Annual benefits – V2
(M€/year)
NPV – V2 (M€)
Annual benefits – V4
(M€/year)
NPV – V4 (M€)
I (AT/DE) [60,100] [-563,562] [20,160] [-1188,1500] [110,250] [218,2906]
II (AT/IT) [20,40] [-503,10] [10,50] [-659,166] [0,20] [-815,-303] IV (BG/EL) [10,20] [-42,134] [20,40] [114,447] [60,100] [739,1384] V (BG/RO) [70,90] [756,1148] [40,60] [287,679] [230,310] [3255,4585]
VII (IL/CY/EL) [560,760] [4501,7626] [490,670] [3408,6220] [1050,1290] [12156,15905] XIV (IT/SI) [60,120] [67,1005] [80,140] [380,1317] [10,30] [-714,-401] XV (RO/RS) [80,100] [1049,1411] [50,70] [580,943] [50,70] [580,943]
Table 6: Economic Analysis of Mid-Term Interconnection Groups, draft TYNDP2016 Visions 1, 2 & 4
2.3.3. Long-term groups Table 7 shows the CBA of long-term groups according to the draft TYNDP2016, using Vision 3 for the annual benefits, the NPV and the IRR. Economic benefits brought by Group VI are low compared to its cost and its NPV is negative. Benefits brought by Group XII are also small, but given its low cost, it leads to a NPV around 0. The annual benefits brought by Group VIII are also much lower, but it leads nevertheless to a NPV of several hundreds of M€. Finally, Group IX has a moderate cost and brings important annual benefits compared to that cost (approximately the half). Consequently, its NPV is around €1 billion and the IRR is of several tens of percent.

EASTNSI/4NT/0512397/000/02 2017 02 16 27/74
This
doc
umen
t is
the
prop
erty
of T
ract
ebel
Eng
inee
ring
S.A
. Any
dup
licat
ion
or tr
ansm
issi
on to
third
par
ties
is fo
rbid
den
with
out p
rior w
ritte
n ap
prov
al
Group ID Cost (M€) Annual benefits (M€/year)
NPV (M€) IRR (%)
VI (SI/HU/HR) 345 [0,20] [-345,-33] ]-∞,3.1]
VIII (CZ/DE) [231,347] 40 [278,394] [10.6,17.0]
IX (DE/PL) [150,250] [70,90] [844,1256] [27.9,60.0]
XII (SK/HU) [57,69] [0,10] [-69,99] ]-∞,17.2]
Table 7: Economic Analysis of Long-Term Interconnection Groups, draft TYNDP2016 Vision 3
Table 8 shows the annual benefits and the NPV for Vision 1, Vision 2 and Vision 4. Group VI is quite sensitive on the Vision: benefits are much higher for Vision 1 and Vision 2 than for Vision 3 and Vision 4. It is the opposite for Group VIII and Group IX: benefits are lower in Vision 1 and in Vision 2. Finally, Group XII is insensitive to the load/generation vision.
Group ID Annual benefits – V1
(M€/year)
NPV – V1 (M€)
Annual benefits – V2
(M€/year)
NPV – V2 (M€)
Annual benefits – V4
(M€/year)
NPV – V4 (M€)
VI (SI/HU/HR) [70,90] [749,1061] [70,90] [749,1061] [20,40] [-33,280]
VIII (CZ/DE) [10,30] [-191,238] 20 [-35,81] [40,60] [278,706] IX (DE/PL) [0,10] [-250,6] [0,10] [-250,6] [90,130] [1156,1881] XII (SK/HU) [0,10] [-69,99] [0,10] [-69,99] [0,10] [-69,99]
Table 8: Economic Analysis of Long-Term Interconnection Groups, draft TYNDP2016 Visions 1, 2 & 4
2.4. Analysis of interconnection levels
Table 9 shows the current interconnection levels (2016) of the 13 countries of the NSI East electricity corridor the interconnection levels that they will have in 2020 if no additional interconnection is developed and the additional export capacity needed to reach the 10% target in 2020. Numbers are taken from the 2015 ENTSO-E “Scenario Outlook & Adequacy Forecast”. Five countries/regions are expected to be below this target in 2020 with their current export capacity: Cyprus, Germany, Italy, Poland and Romania. If small increases of export capacity (less than 1 GW) are sufficient for Cyprus and Romania to reach the target, large increases are needed for Poland, Germany and Italy (approximately 2.7 GW, 5 GW and 7 GW).

EASTNSI/4NT/0512397/000/02 2017 02 16 28/74
This
doc
umen
t is
the
prop
erty
of T
ract
ebel
Eng
inee
ring
S.A
. Any
dup
licat
ion
or tr
ansm
issi
on to
third
par
ties
is fo
rbid
den
with
out p
rior w
ritte
n ap
prov
al
Country
Current export
capacity (GW)
Current generating
capacity (GW)
Current interconnection
level (%)
2020 generating
capacity (GW)
2020 interconnection
level if no change (%)
Additional export capacity needed to reach 10% in
2020 (GW) AT 7 25 28.0 28 25.0 0
BG 1.6 13.7 11.7 12.9 12.4 0 CY 0 1.7 0.0 1.9 0.0 0.2 CZ 5.5 21.5 25.6 20.2 27.2 0 DE 15.6 195.5 8.0 215.1 7.3 5.9 EL 1.9 17.8 10.7 18.9 10.1 0 HR 2.6 4.7 55.3 5.8 44.8 0 HU 2.5 8 31.3 9.4 26.6 0 IT 4.5 122.1 3.7 122.9 3.7 7.8 PL 1.6 37.9 4.2 42.9 3.7 2.7 RO 2.5 21.1 11.8 25.3 9.9 0.1 SI 3.2 3.6 88.9 4.1 78.0 0 SK 2.7 7.6 35.5 8.6 31.4 0
Table 9: Analysis of interconnection levels in 2016 and in 202013
2.5. Ranking of groups
The ranking of groups focuses on short-term and mid-term projects and is based on the following criteria:
The CBA of each group, as presented in the previous section (average value and range of the NPV),
The role of the projects in achieving the EC 10% target of interconnection for each country,
The investment costs (expensive projects are less likely to be developed in priority),
The risks in terms of environment or public acceptance, due to the main characteristics of the project: overhead line or underground cable (the specific impact of the project on the environment is not studied).
13 Note that, for some countries, the expected generating capacity in 2020 is less than the 2016 value (e.g. BG, CZ),
or only slightly higher (e.g. IT). It is due to a decommissioned capacity larger than the expected new capacity.

EASTNSI/4NT/0512397/000/02 2017 02 16 29/74
This
doc
umen
t is
the
prop
erty
of T
ract
ebel
Eng
inee
ring
S.A
. Any
dup
licat
ion
or tr
ansm
issi
on to
third
par
ties
is fo
rbid
den
with
out p
rior w
ritte
n ap
prov
al
2.5.1. Short-term groups Among short-term groups, Group X (IT/ME) and Group XIII (IT/ME) have quasi-constantly positive economic indicators. An exception occurs for Group XIII in draft TYNDP2016 Vision 4. Group X will increase by 1.5 GW the interconnection level of Poland and by 0.5 GW the interconnection level of Germany which are foreseen to be below the 10% target at 2020 horizon. The investment cost is moderate (around €150 million), which implies that the financial risk is small, and the environmental impact is small (upgrade of an existing line and addition of PSTs in existing substations). Even if its investment cost is much higher than other projects (around €1 billion), Group XIII will increase significantly the interconnection level of Italy (by 1-1.2 GW) which is well below the 10% target, and, because it consists mainly in an undersea HVDC cable, no major public opposition is expected. Therefore, because economic indicators are systematically positive for Group X and these groups are equivalent on others aspects, Group X is ranked number 1 and Group XIII is ranked number 2.
The two remaining groups, Group III (AT/IT) and Group XI (SK/HU) bring small annual benefits, which leads to unclear economic indicators: in some cases, theirs NPVs are positive, but, in others cases, they are negative. Group III does not bring a positive NPV, its cost is low and it helps to increase the interconnection level of Italy. Group XI (SK/HU) has a moderate investment cost (around €100 million) and does not increase the interconnection level of countries below the 10% target. Moreover, it will have a non-negligible environmental impact (new overhead line) and it could suffer from public opposition. Therefore, Group III is ranked number 3 and Group XI is ranked number 4.
Rank Group ID
1 X (DE/PL)
2 XIII (IT/ME) 3 III (AT/IT) 4 XI (SK/HU)
Table 10: Ranking of Short-Term Interconnection Groups
2.5.2. Mid-term groups Among mid-term groups, Group IV (BG/EL) and Group V (BG/RO) have usually high NPVs and moderate investment costs. Group V has a systematically positive NPV (which is not the case for Group V) and has a positive impact on the interconnection level of Romania, expected to be slightly below the 10% in 2020 without any new interconnection. These two groups are however expected to have significant environmental impacts: new OHL are built on several hundreds of kilometres. Therefore, despite an investment cost slightly higher for Group V, the latter is ranked number 5 and Group IV is ranked number 6.
Among remaining groups, Group I (AT/DE) increases significantly (by 2.3 GW) the interconnection level of Germany, which is foreseen to be below the 10% target at 2020 horizon. Moreover, it is the only one to have both good economic indicators and a significant contribution on the export capacity of a country needing a large increase of its interconnection level. Despite a significant investment cost (around €1 billion) and non-negligible environmental impact

EASTNSI/4NT/0512397/000/02 2017 02 16 30/74
This
doc
umen
t is
the
prop
erty
of T
ract
ebel
Eng
inee
ring
S.A
. Any
dup
licat
ion
or tr
ansm
issi
on to
third
par
ties
is fo
rbid
den
with
out p
rior w
ritte
n ap
prov
al
(new overhead lines), this group is thus ranked number 7. Note that Germany is part of three others priority electricity corridors, the “Northern Seas Offshore Grid” and the “North-South Electricity Interconnections in Western Europe”, and the “BEMIP” electricity corridors: others PCIs not analysed in this report can help to increase the interconnection level of Germany.
Two groups with quasi-consistently positive NPVs remain: Group VII (IL/CY/EL) and Group XV (RO/RS). Group XV has a moderate investment cost (between €130-220 million), a non-negligible environmental impact (new overhead lines) and is ranked number 8. Group VII should have a positive NPV but could display a negative NPV under some circumstances and its investment cost is important. Moreover, the benefits will strongly rely on the exchanges with a third-party country, Israel, and thus on its energy mix evolution, which is quite uncertain from a European point of view. Therefore, it is ranked number 9. Note that the CBA was performed for the 2000 MW version, after completion of stage 2 of this EuroAsia interconnector. The CBA of stage 1 only could be better, because the benefits of an increase of the interconnection capacity between different regions are usually higher when the existing interconnection capacity is low. The two remaining groups, Group II (AT/IT) and Group XIV (IT/SI), display negative NPV in Vision 3 and are thus not ranked. Note that Group II has an average NPV negative in all Visions, while Group XIV brings significant economic benefits (and thus a positive NPV) in Vision 1 and in Vision 2.
Rank Group ID
5 V (BG/RO)
6 IV (BG/EL) 7 I (AT/DE) 8 XV (RO/RS) 9 VII (IL/CY/EL)
Not ranked II (AT/IT), XIV (IT/SI)
Table 11: Ranking of Mid-Term Interconnection Groups
2.6. Conclusions
This section aimed at synthetizing the CBA analyses proposed by ENTSO-E in the draft TYNDP2016 for all PCI projects allowing for increasing transfer capacities between the countries (i.e. while excluding projects with a purely national scope -e.g. internal grid reinforcements in Germany, despite having a significant cross border benefit, or storage projects) in South-East and Central-East regions. For the 13 Member States studied in this project, 38 PCIs leading to an increase of cross-border transfer capacities were considered, while being grouped into 15 groups of interdependent projects

EASTNSI/4NT/0512397/000/02 2017 02 16 31/74
This
doc
umen
t is
the
prop
erty
of T
ract
ebel
Eng
inee
ring
S.A
. Any
dup
licat
ion
or tr
ansm
issi
on to
third
par
ties
is fo
rbid
den
with
out p
rior w
ritte
n ap
prov
al
The draft TYNDP 2016 showed that most of the projects foreseen at short-term and mid-term time horizons have a positive Net Present Value (under the assumption of considering a real discount rate of 4% for 25-year lifetime and a residual value equal to zero). Such a positive NPV is moreover quite robust to the load-generation visions considered. This means that these projects will lead to an increase of social welfare in the South East and Central-East Regions. This increase of Social Welfare can be explained by a better use of Renewable Energy Sources (reduction of curtailment)14 within the countries and by an optimized economic dispatch resulting from the increase of transfer capacities.
Moreover, a lot of these projects allow for increasing the level of electricity interconnections of countries which do not currently meet the objective of least 10% of their installed production capacity. This is especially the case of projects
at Polish borders (Germany-Poland: Groups IX and X) at Romanian borders (Bulgaria Romania: Group V) at Italian borders (Austria-Italy: Groups II and III but also Italy-Slovenia:
Group XIV and Italy-Montenegro: Group XIII) at Cyprus borders (Greece-Cyprus-Israel: Group VII) Regarding the long-term projects, the ranges of expected NPVs for these projects are quite large. Because they evolve in an uncertain environment (i.e. the evolution of the load and the generation mix during the decade 2020-2030 is highly uncertain), it is difficult to assess their exact role in the future European system. These projects are discussed in section 4 dedicated to the assessment of further integration. The question of internal constraints in Germany and in Italy is also discussed in this fourth section. But before assessing the options for further integration of South East and Central-East Regions, the next section aims at analysing the barriers for implementation of short-term and long-term PCI projects and at proposing recommendations for mitigating these barriers.
14 Note that the reduction of RES curtailment is not directly included as such in the SEW, but it avoids the use of
more expensive generation (i.e. RES have a quasi-null marginal cost while classical units have a non-negligible marginal cost) and, thus, leads to a lower generation cost.
EASTNSI/4NT/0512397/000/02 2017 02 16 32/74
This
doc
umen
t is
the
prop
erty
of T
ract
ebel
Eng
inee
ring
S.A
. Any
dup
licat
ion
or tr
ansm
issi
on to
third
par
ties
is fo
rbid
den
with
out p
rior w
ritte
n ap
prov
al
3. ANALYSIS OF BARRIERS AND CORRESPONDING RECOMMENDATIONS
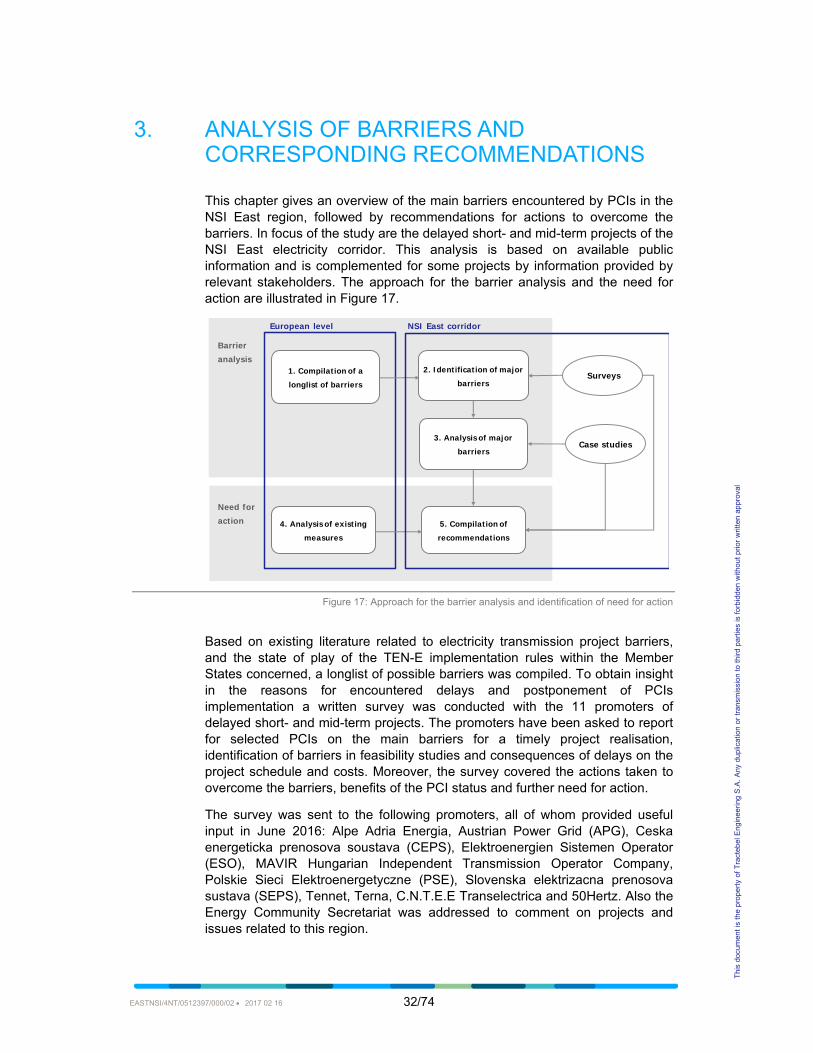
This chapter gives an overview of the main barriers encountered by PCIs in the NSI East region, followed by recommendations for actions to overcome the barriers. In focus of the study are the delayed short- and mid-term projects of the NSI East electricity corridor. This analysis is based on available public information and is complemented for some projects by information provided by relevant stakeholders. The approach for the barrier analysis and the need for action are illustrated in Figure 17.
Figure 17: Approach for the barrier analysis and identification of need for action
Based on existing literature related to electricity transmission project barriers, and the state of play of the TEN-E implementation rules within the Member States concerned, a longlist of possible barriers was compiled. To obtain insight in the reasons for encountered delays and postponement of PCIs implementation a written survey was conducted with the 11 promoters of delayed short- and mid-term projects. The promoters have been asked to report for selected PCIs on the main barriers for a timely project realisation, identification of barriers in feasibility studies and consequences of delays on the project schedule and costs. Moreover, the survey covered the actions taken to overcome the barriers, benefits of the PCI status and further need for action.
The survey was sent to the following promoters, all of whom provided useful input in June 2016: Alpe Adria Energia, Austrian Power Grid (APG), Ceska energeticka prenosova soustava (CEPS), Elektroenergien Sistemen Operator (ESO), MAVIR Hungarian Independent Transmission Operator Company, Polskie Sieci Elektroenergetyczne (PSE), Slovenska elektrizacna prenosova sustava (SEPS), Tennet, Terna, C.N.T.E.E Transelectrica and 50Hertz. Also the Energy Community Secretariat was addressed to comment on projects and issues related to this region.
1. Compilation of a
longlist of barriers
European level NSI East corridor
2. Identification of major
barriers
3. Analysis of major
barriers
5. Compilation of
recommendations
4. Analysis of existing
measures
Barrier
analysis
Need for
action
Surveys
Case studies

EASTNSI/4NT/0512397/000/02 2017 02 16 33/74
This
doc
umen
t is
the
prop
erty
of T
ract
ebel
Eng
inee
ring
S.A
. Any
dup
licat
ion
or tr
ansm
issi
on to
third
par
ties
is fo
rbid
den
with
out p
rior w
ritte
n ap
prov
al
As an outcome of the survey evaluation, major barriers in the NSI East region were identified. To gain further insight into those barriers three projects were selected for further review in the form of case studies. For the review of these case studies a number of relevant parties were contacted via in-depth telephone interviews. These interviews covered topics, related to a specific PCI as well as to PCI implementation experiences in general. The interviews covered the status and recent progress of the PCIs, detailed information on the projects specific barriers as well as barriers related to the PCI implementation and further need for action.
The interviews were conducted with representatives of the following organisations during August/September 2016: Alpe Adria Energia, Autorita Energia, Bundesnetzagentur, E-Control, ESO, Nature And Biodiversity Conservation Union (NABU), Transelectrica and 50Hertz.
The feedback of the survey, the interviews and own analysis of existing measures to overcome the barriers resulted in a proposal for actions to further facilitate PCI implementation in the NSI East region. These recommendations are given in Chapter 3.5.
A first outcome of the barrier analysis and survey feedback was presented to the NSI East Regional Group in October 2016, with the opportunity for all members to provide additional views in writing.
While the longlist of barriers and the existing measures are regarded on a European level, the analysis of barriers and the respective recommendations refer in particular to the NSI East region.
3.1. Overview of delayed PCIs
A first overview focuses on all PCIs analysed in Chapter 2. The current project status (under consideration, planned but not yet in permitting, permitting, under construction) as well as the current progress (on time, rescheduled, delayed) were identified for those 38 projects on the list as seen in Table 12. The ACER 2015 PCI implementation monitoring report is taken as reference as it makes a comparison with 2012 which represents the development since the entry into force of Regulation (EU) 347/2013.
Current status Progress over the past years
Total
On time Rescheduled Delayed
Under consideration 1 2 - 3
Planned, but not yet in permitting
11 2 1 14
Permitting 6 4 9 19
Under construction - 1 1 2
Total 18 9 11 38
Table 12: Comparison of status (2015) and progress (2012 to 2015) for PCIs in the region (based on ACER 2015)

EASTNSI/4NT/0512397/000/02 2017 02 16 34/74
This
doc
umen
t is
the
prop
erty
of T
ract
ebel
Eng
inee
ring
S.A
. Any
dup
licat
ion
or tr
ansm
issi
on to
third
par
ties
is fo
rbid
den
with
out p
rior w
ritte
n ap
prov
al
Out of the 38 PCIs in focus, 18 projects were on time, 9 had been rescheduled and 11 were delayed. Looking at the current progress, one can distinguish between the projects in planning phase (under consideration, planned but not yet in permitting) and execution phase (permitting, under construction). 17 out of the 38 PCIs are still in planning. 21 are already in execution. Of these 21 projects in execution, only six are on time. Ten projects are delayed and five were rescheduled.
The ACER 2016 PCI implementation monitoring report focuses on progress since 2015. Compared to the 2015 report, five of the delayed projects and four of the rescheduled projects experienced a new delay in 2015. Also two other projects that were on time faced delays in this year as well.
Two reasons for rescheduling a project need to be differentiated. Firstly, projects can be rescheduled in the planning phase due to changes in the overall planning assumptions (generation connection, demand, market conditions etc.) or effects of other planned projects. This kind of rescheduling is thus based on decisions taken by the promoter. Secondly, some reported rescheduling can take place during the construction phase, though it would be clearer to label these as delayed rather than rescheduled.
15 out of these 38 PCIs are cross-border PCIs (i.e. with multiple hosting countries). Only 6 out of the 15 cross-border projects are on time. Five projects are rescheduled and four are delayed. Nine projects were in the planning phase and six in execution phase. Out of the six projects in execution five are either delayed or indicated as being rescheduled. Those numbers show that for cross-border PCIs the share of projects with delay/rescheduling is even slightly higher as compared to the full portfolio in the region.
Out of the 38 projects that have an effect on cross-border capacities, 25 belong to short- and mid-term groups as defined in section 2.1.
Table 13 shows the current project status and the progress for the period 2012 to 2015 for these projects.
Current status Progress over the past years
Total On time Rescheduled Delayed
Under consideration 1 - - 1
Planned, but not yet in permitting
7 2 1 10
Permitting 4 1 7 12
Under construction - 1 1 2
Total 12 4 9 25
Table 13: Comparison of status (2015) and progress (2012 to 2015) for the 25 PCIs of short- and mid-term groups (based on ACER 2015)
The study focuses on the 10 projects of the short- and mid-term groups that are either delayed, or rescheduled while under construction, and on two additional

EASTNSI/4NT/0512397/000/02 2017 02 16 35/74
This
doc
umen
t is
the
prop
erty
of T
ract
ebel
Eng
inee
ring
S.A
. Any
dup
licat
ion
or tr
ansm
issi
on to
third
par
ties
is fo
rbid
den
with
out p
rior w
ritte
n ap
prov
al
projects that were considered delayed instead of rescheduled in 2015 according to the ACER 2016 PCI implementation monitoring report15. Table 14 lists current project status, progress over the past years, expected year of commissioning and the delay since 2012 for these projects. To calculate the delay since 2012, the current expected year of commissioning from the ACER 2016 PCI implementation monitoring report has been compared to planning data from ENTSO-E’s Ten Year Network Development Plan 2012. It therefore represents the development since the last report prior to the implementation of the TEN-E regulation. In some cases the data was updated with information from stakeholder interviews.
No. Name Current status
Progress over past years
16
Expected year of commissioning
Delay since 2012 [years]
3.1.1 St. Peter (AT) – Isar/Ottenhofen (DE)
Permitting Delayed 2020 3
3.1.2 Internal line between St. Peter and Tauern (AT)
Permitting Delayed 2023 4
3.4 PCI Austria – Italy interconnection between Wurmlach (AT) and Somplago (IT)
Permitting Delayed 2019 N/A17
3.7.2 Internal line between Maritsa East and Plovdiv (BG)
Permitting Delayed 2019 5
3.7.4 Internal line between Maritsa East and Burgas (BG)
Permitting Delayed 2021 7
3.8.1 Internal line between Dobrudja and Burgas (BG)
Permitting Delayed 2021 5
3.8.4 Internal line between Cernavoda and Stalpu (RO)
Permitting Delayed 2020 3
3.15.1 Interconnection between Vierraden (DE) and Krajnik (PL)
Under construction
Rescheduled
2018 2
3.16.1 Interconnection between Gabcikovo (SK) — Gonyu (HU) and Velky Ďur (SK)
Planned, but not yet in permitting
Rescheduled
2019 3
3.17 Interconnection between Sajovanka (HU) and Rimavska Sobota (SK)
Planned, but not yet in permitting
Rescheduled
2020 4
3.19.1 Interconnection between Villanova (IT) and Lastva (ME)
Under construction
Delayed 2019 4
15 PCI 3.15.2 (installation of phase shifting transformers) was considered delayed according to ACER 2016 but not
added to the projects in focus as this PCI depends on the investment 3.15.1 and is thus in this analysis considered as rescheduled.
16 Based on ACER 2015
17 No information available from ENTSO-E 2012, 2013 and interviews.

EASTNSI/4NT/0512397/000/02 2017 02 16 36/74
This
doc
umen
t is
the
prop
erty
of T
ract
ebel
Eng
inee
ring
S.A
. Any
dup
licat
ion
or tr
ansm
issi
on to
third
par
ties
is fo
rbid
den
with
out p
rior w
ritte
n ap
prov
al
No. Name Current status
Progress over past years
16
Expected year of commissioning
Delay since 2012 [years]
3.22.2 Internal line between Portile de Fier and Resita (RO)
Permitting Delayed 2018 2
Table 14: List of 12 short- and mid-term PCIs in focus (based on ACER 2015, 2016, interviews and ENTSO-E 2012 and 2013)
3.2. Longlist of barriers
Based on several studies and positions related to transmission project barriers and TEN-E implementation (ENTSO-E 2012, 2014a, 2016, ACER 2015, 2016, Bearing Point and MicroEconomix 2015, Roland Berger 2011, CPI 2012, European Commission 2011, own analysis) a longlist of possible barriers was set. After analysing the actual PCI related information from all European projects (ACER reports, non-public implementation fiches from 2014, and competent authority reports to the regional groups 2015 in line with Article 5(6) of the TEN-E regulation) the 12 most relevant barriers were selected and then grouped into five categories as shown in Table 5. This served as the basis for further analysis and stakeholder interviews, to detect which barriers have actually hampered the timely realisation of PCIs in the NSI East region.
Category Barrier
I Project planning
Changes in planning data input (initiated by project promoter)
Dependence on realisation of related investment
II Permitting
Preparation of application files
Organisational issues at the permitting authority
Difficulties related to the EIA
Law and policy changes affecting permitting
Public consultation and opposition
III Spatial issues
Acquisition of and access to land
Conflicting interests regarding spatial plans
IV Financing
Financial difficulties
Cross-border allocation of costs and benefits
V Construction Technical difficulties
Table 15: List of barriers
EASTNSI/4NT/0512397/000/02 2017 02 16 37/74
This
doc
umen
t is
the
prop
erty
of T
ract
ebel
Eng
inee
ring
S.A
. Any
dup
licat
ion
or tr
ansm
issi
on to
third
par
ties
is fo
rbid
den
with
out p
rior w
ritte
n ap
prov
al
Barriers that could occur related to project planning are changes in the planning data input, e.g. concerning generation, demand or transmission. A common barrier is the dependence on the realisation of a related investment. When PCIs have other projects as a technical prerequisite or when they are part of a larger project cluster, their commissioning is directly affected by delays of those related investments.
A significant category covers barriers related to permitting. The barriers may already appear before submission of application files due to the complexity of required documents and the need for adaption of the national process to the TEN-E requirements. The environmental documentation and its scope and level of detail can be a major difficulty for project promoters. In addition, they may lack guidelines on how application documents should be structured, what scope and level of detail is required and what target groups the documents need to be aimed at. Therefore, in some cases the documentation has to be supplemented or revised. Environmental impact, e.g. the crossing of a protected area can cause public opposition. If complaints cannot be solved through consultation and negotiations they might result in lawsuits, which cause a further delay.
Spatial issues cover difficulties regarding the acquisition of land or conflicting interests regarding spatial plans. In cases where negotiations with landowners do not succeed, expropriation procedures may have to be initiated. In other cases local authorities might request a change of the route for environmental compensation. Both situations cause a delay of the original plan.
In the category of financing, difficulties may occur for the promoter to gather sufficient capital. Also the cross-border allocation of costs and benefits may result in disagreements on assumptions and impact, and thus delays.
A last category describes barriers emerging in the construction phase. Those involve any technical difficulties that might occur and could not be foreseen.
3.3. Experiences of project promoters
The promoters of projects listed in Table 14 were contacted via a survey to give more views on the encountered barriers in the NSI East electricity corridor. PCIs from the long-term group VIII (PCI Cluster 3.11) were also included since several related projects have an expected commissioning date around 2020, and as several investments already faced delays in past years.
A multiple choice questionnaire was used with focus on the barriers, delays and (with respect to chapter 3.5) possible actions for overcoming those barriers. The most relevant information is illustrated in the following figures.

EASTNSI/4NT/0512397/000/02 2017 02 16 38/74
This
doc
umen
t is
the
prop
erty
of T
ract
ebel
Eng
inee
ring
S.A
. Any
dup
licat
ion
or tr
ansm
issi
on to
third
par
ties
is fo
rbid
den
with
out p
rior w
ritte
n ap
prov
al
Figure 18: Major barriers of the PCIs in focus
Figure 18 depicts the list of barriers listed in Section 3.3 and how often they were faced in the project implementation. To give the project promoters the opportunity to give input on further barriers not on the list, the category “Other” had been added to the list which also covers delays due to national processes not directly related to the grid planning itself. In the survey the barriers were ranked by their relevance. This is illustrated by the different colours.
The most common barrier, selected six times, related to environmental impact assessment difficulties. This barrier is often strongly connected to public consultation and opposition, which has been selected five times. Public opposition can lead to requirements for supplementary EIA documents or even lawsuits which prolong the process. Changes in planning data input have been selected five times and the dependence of a related investment four times. Three project promoters stated organisational issues at the permitting authority as a barrier. A barrier that was named as a major barrier twice is the acquisition of and access to land. Each selected twice as either second or third barrier are law and policy changes affecting permitting, conflicting interests regarding spatial plans and financial difficulties. It deserves attention that 16 out of 40 reported barriers belong to the category permitting.
Nine project promoters reported other barriers, including unbundling issues, problems with the legal agreement on the contract for construction with the co-promoter of the PCI and interference in the construction phase. Except for the latter, all barriers were encountered in either the planning or the permitting phase.
0 2 4 6 8 10
Changes in planning data input (initiated by project…
Dependence on realisation of related investment
Preparation of application files
Organisational issues at the permitting authority
Difficulties related to the environmental impact assessment
Law and policy changes affecting permitting
Public consultation and opposition
Acquisition of and access to land
Conflicting interests regarding spatial plans
Financial difficulties
Cross-border allocation of costs and benefits
Technical difficulties
Other
1st barrier 2nd barrier 3rd barrier

EASTNSI/4NT/0512397/000/02 2017 02 16 39/74
This
doc
umen
t is
the
prop
erty
of T
ract
ebel
Eng
inee
ring
S.A
. Any
dup
licat
ion
or tr
ansm
issi
on to
third
par
ties
is fo
rbid
den
with
out p
rior w
ritte
n ap
prov
al
The collected experience of these projects also shows that no one reported that he experienced barriers when preparing the application files for permit granting, issues regarding cross-border cost allocation or technical difficulties. A perception is sometimes expressed that the scope and level of detail in environmental documentation grows and becomes cumbersome, but no issues were reported. Also cross border cost allocations (CBCAs) are often referred to in literature as potential cause for conflict due to asymmetric benefits and externalities, geographic scope, scenario assumptions, and uncertain future corrections; still for the PCIs analysed none of these were mentioned as a barrier18.
These findings are broadly in line with the ACER PCI implementation monitoring report 2016 conclusions and complement them. The report stated among others that permitting was the most frequent reason for delay in each PCI corridor. Environmental permitting in particular was the most frequent cause in the NSI-East region. Across the four PCI corridors there was no prevailing pattern of region-specific permitting issues. The ACER report also noted twice a delay related to finalising agreements and coordination across borders in the NSI-East region. The report did not mention financial reasons for delay in the region for the period 2015-2016. However, following the 2015 ACER PCI implementation monitoring report financial issues had been the most frequent reason for delays in the NSI East electricity corridor for the period 2012-2015, although only reported by one project promoter for multiple projects.
The stakeholder interaction within this study revealed moreover that delays can lead to further delays in a project. This is particularly crucial in the permitting phase, since single permits can expire and application processes have to be started again.
In addition to the effect on the project duration, also a possible increase in cost was analysed. For three projects the increase in cost was estimated up to 10% compared to the initial estimation. A complete reworking of a technical solution due to ongoing public opposition and lawsuits led to a significant increase of cost for a project. Also the longer a project is in delay, the more it becomes susceptible to changes in planning due to variations of external factors.
The survey probed promoters for the benefits of the PCI status. The TEN-E regulation aims at limiting the duration of the permitting procedures to 3.5 years. This shall be facilitated by single national authorities responsible for streamlining the permitting process. Furthermore, the PCI status can provide for direct financial support for feasibility studies and/or works, as well as increased national support (e.g. national funding, public communication) or indirect financial support (e.g. based on political support). Figure 19 summarizes the perceived effect of the PCI status on these objectives.
1818 There is no public list of all CBCA applications. Only the eventual INEA grants are published. For this PCI region
until now only PCI 3.8.1 and 3.7.4 received a grant for work for which a CBCA is a precondition. ACER’s PCI monitoring report 2016 states that in total up to 2015 only 5 electricity PCIs filed an investment request including CBCA. For 2016 only 6 were considering doing this.

EASTNSI/4NT/0512397/000/02 2017 02 16 40/74
This
doc
umen
t is
the
prop
erty
of T
ract
ebel
Eng
inee
ring
S.A
. Any
dup
licat
ion
or tr
ansm
issi
on to
third
par
ties
is fo
rbid
den
with
out p
rior w
ritte
n ap
prov
al
Figure 19: Perceived impact of the PCI status on potential benefits
While most barriers experienced are connected to the permitting procedure, no project promoter perceived the PCI status as having significant positive effect on its facilitation. This can partly be explained with the fact that five out of the 12 projects follow the transitory arrangements of Article 19 TEN-E regulation because they submitted their application files before the 16th of November 2013. Hence permit granting and public participation provisions do not apply for those projects. Out of the five potential benefits discussed here, only financial support is not affected by the transitory arrangements of the TEN-E Regulation. The survey did not look into the reasoning for the rating of the perceived impacts, i.e. whether the low rating is due to TEN-E regulation, the national implementation of the TEN E Regulation, or due to more time needed for the regulation to have a significant effect in national implementation.
The overall picture shows that the PCI status is presently still perceived as having rather low or neutral impact on all the given aspects. Regarding a faster and easier permitting procedure, it had only low or neutral impact according to all contacted project promoters. Two respondents acknowledged a high and one respondent a relatively high impact of the PCI status on the financial support for feasibility studies. The impact on financial support for project realisation was rated as relatively high or high by two promoters. The effect on national support was rated as relatively high by two of the project promoters. In-depth interviews with a number of stakeholders showed that financial support is however seen as a main benefit in more cases than appears from the survey. The PCI status can also be a signal for possible investors, as it conveys European importance and support. Overall across all benefit objectives the majority of contacted parties does not acknowledge a substantial impact yet.
A challenge of the implementation of PCIs is a good cooperation between project promoters. In the survey, project promoters have been asked to rate the cooperation with other project promoters. The evaluation summarised in Figure 20 shows that over 70% of the project promoters rated the cooperation as being good or relatively good. Only two project promoters are not satisfied with the cooperation.
0% 10% 20% 30% 40% 50% 60% 70% 80% 90% 100%
Fast permitting procedure
Easier permitting procedure
Financial support for feasibility studies
Financial support for project realisation
Increased national support (e.g. national funding, public communication)
low relatively low neutral relatively high high

EASTNSI/4NT/0512397/000/02 2017 02 16 41/74
This
doc
umen
t is
the
prop
erty
of T
ract
ebel
Eng
inee
ring
S.A
. Any
dup
licat
ion
or tr
ansm
issi
on to
third
par
ties
is fo
rbid
den
with
out p
rior w
ritte
n ap
prov
al
Figure 20: Rating of cross-border cooperation of project promoters
Project promoters and the competent authorities participate regularly in regional group meetings guiding the PCI selection process. The regional group meetings are also used for project implementation updates and for further developing the PCI selection methodology.
Figure 21 illustrates the relevance of the regional group meetings for the timely realisation of PCIs as perceived by the contacted promoters.
Figure 21: Relevance of the regional group for the timely realisation of PCIs
Only two out of 11 project promoters attributed the regional group meetings a relatively high relevance. Two rated the relevance as low and one as relatively low. More than half of the project promoters selected the option neutral.
The results of the survey have been confirmed in the in-depth interviews. These highlighted that the communication between stakeholders and the exchange of best-practices or barriers regarding implementation are not sufficiently in focus of these meetings yet. Most also stated that the regional group meetings do not increase the cooperation between project promoters, regulators or competent authorities.
2
1
2
6
bad
relatively bad
neutral
relatively good
good
2
1
6
2
0
1 low
2 relatively low
3 neutral
4 relatively high
5 high

EASTNSI/4NT/0512397/000/02 2017 02 16 42/74
This
doc
umen
t is
the
prop
erty
of T
ract
ebel
Eng
inee
ring
S.A
. Any
dup
licat
ion
or tr
ansm
issi
on to
third
par
ties
is fo
rbid
den
with
out p
rior w
ritte
n ap
prov
al
3.4. Major barriers
Earlier studies and the findings of this study show that the following four barriers are the most pressing issues in the NSI East electricity corridor with a high impact on project delays:
1) Organisational issues at the permitting authority, 2) Difficulties related to the EIA, 3) Public consultation and opposition and 4) Financial difficulties.
These barriers are analysed in more detail in this section.
The remaining barriers that have been identified in section 3.2 as being of relevance for the timely implementation of PCIs are not in focus for different reasons. Barriers related to planning are not regarded in detail, because they cover changes of planning data or dependencies on other investments, whereas this study primarily aims to examine barriers in the execution phase of projects. Moreover, when the related project is not in the same PCI cluster, but external, there is particularly little room for action via TEN-E specific measures. Three out of the 12 barriers were not indicated as a major barrier by promoters in the survey. Furthermore three barriers only hampered the progress for two project promoters each and are therefore of minor relevance. Although financing barriers have only been selected twice in the survey, they are discussed in detail as the projects affected by financial difficulties belong to the projects with the highest delays in the region compared to 2012.
3.4.1. Organisational issues at the permitting authority The experiences of PCI projects in the region show that permitting issues remain the main reason for project delays. At the same time (possibly in view of the short time of implementation of the TEN-E Regulation) also still little to no benefits are acknowledged yet on facilitating permitting projects with a PCI label.
Stakeholder interviews confirmed that the permit granting processes show differences between countries, sometimes resulting in different speed of progress. To avoid such inefficiencies in the process and to set up a transparent process on a national level, stakeholders demanded an alignment of permitting procedures for different countries, which is very important for interconnectors. One explanation for the non-conformity between countries is that some procedural aspects as set in the TEN-E regulation, the EC guidance and their implementation are closer to past national practices in some countries as compared to others. This gives a different learning curve for some.
Such alignment is not always seen as realistic, as permitting responsibilities and procedures are national, regional or very local competencies at national level, and can differ depending on the type of permit. As such different schemes still exist with different speeds of processes as a result (see case 3.4). EU law cannot override this but it obliges Member States to appoint a single coordinator (competent authority), thus it does aim to create a bridge between national authorities by requiring all possible steps are taken for effective and efficient coordination and cooperation (Article 8.5).

EASTNSI/4NT/0512397/000/02 2017 02 16 43/74
This
doc
umen
t is
the
prop
erty
of T
ract
ebel
Eng
inee
ring
S.A
. Any
dup
licat
ion
or tr
ansm
issi
on to
third
par
ties
is fo
rbid
den
with
out p
rior w
ritte
n ap
prov
al
Several parties claim that while good steps are taken in national procedures and responsibilities, more experience needs to be gained. In particular, a clear process seems missing of how pan-European agreements on investment needs and local assessments of impact fit in one process. The identification of investment needs on a European level has not so far involved extensive analysis of local (environmental) impacts. The TEN-E regulation aims to give PCIs a higher priority status as compared to other national or regional infrastructure projects. This higher priority can be used to facilitate access to capital or prioritize resources in permitting procedures. However, this cannot be translated in an impact analysis, and in some cases the higher priority status at European level is a difficult argument to use in local consultations (see case 3.4 and 3.15).
Another issue was the complexity of the permit granting process. In some cases promoters deemed the permitting procedure to be too strict. This meant that in case of changes in the project details, the procedure had to be restarted. Others had to cope with the dependency between sequential permits, where a delay of one resulted in a delay of another at a later stage. Furthermore, in some cases permits expired as the project was on hold due to other delayed decisions from the ministry.
The number of delays as depicted in section 3.2.1 lead to the question of adherence to time limits. Many project promoters had issues following the workflow requirements of Article 10 because it was not clear which specific steps of permitting fall under the pre-application procedure or the statutory phase. Also, in some cases, there was no formal notification to the one-stop-shop for the initiation of the pre-application procedure and therefore no official start of the 3.5 year permitting time.
The problem of long idle times due to pending decisions was stated by various project promoters (see for example case studies 3.4 and 3.8 in Annex B: Case studies). In those cases the competent authority seems to have limited power to enforce time limits as set out in Article 10 of the regulation.
The TEN-E regulation requirement of establishing one-stop-shops is evidently a main element to reach the objectives of the PCI status. Such authority is installed in all Member States, but with different applications, e.g. in level of detail of provided manuals as well as the overall process due to other national provisions (Milieu, 2016). In most countries this authority competence is with a national ministry. This study does not give a statement on whether this is right or wrong, but the findings seem to show that a possible disconnect exists between the parties assessing the investment needs, CBAs and possible CBCAs (NRAs) and the one coordinating the permitting and ultimately judging the balance of societal and environmental impact (the one-stop-shop). These findings should be further studied in the context of other regional corridors.

EASTNSI/4NT/0512397/000/02 2017 02 16 44/74
This
doc
umen
t is
the
prop
erty
of T
ract
ebel
Eng
inee
ring
S.A
. Any
dup
licat
ion
or tr
ansm
issi
on to
third
par
ties
is fo
rbid
den
with
out p
rior w
ritte
n ap
prov
al
Following Regulation (EU) 347/2013 Article 8.3, the one-stop-shop can be set up via one of three alternatives, differing in coordination ‘power’ (integrated, coordinated, or collaborative). While it may seem evident that from the perspective of streamlining the process a stronger coordination power is preferred, the case studies did not signal a choice for either system to be a critical cause for encountered delays. ACER’s 2016 PCI implementation monitoring report did conclude (looking at all PCI corridors) that countries with a coordinated system had substantially shorter expected permitting times than ones with a collaborative system (2.8 compared to 3.6 years).
Out of the 13 Member States in the NSI East electricity corridor, seven decided for the collaborative system and four for the coordinated system. Romania decided for the integrated system and Greece for a combination of the collaborative and coordinated system. In contrast to the findings of ACER (2016), our analysis of the 12 focus projects of the NSI East region shows that projects of countries with a coordinated system have slightly longer expected permitting times than projects of countries with a collaborative system (3.5 compared to 3.3 years)19, which does not allow to make a causal relation between the scheme and permitting duration.
It remains doubtful whether newer projects with a permit application filed after November 2013 would not suffer from these same barriers. ACER’s 2016 monitoring report concluded that across all PCI regions and looking at both electricity and storage, the average expected duration of permitting is 3.5 years, with a higher expected average duration for “pre-2013 PCIs” (5.5 years) than for “post-2013 PCIs” (2.3 years). It was not analysed in detail, nor commented on by the interviewed stakeholders, whether or not any of the EC guidance recommendations or TEN-E provisions itself could still be applied on voluntary basis for the older PCI projects.
3.4.2. Difficulties related to the EIA A large part of project promoters was facing issues regarding the environmental impact assessment. Especially incidents like the crossing of protected areas arouse the concern of other stakeholders like environmental groups and hampered the procedure.
The documentation of the EIA is not predominantly an issue for project promoters, as only one criticised the lack of clarity on the scope and level of detail. It is rather an issue for other stakeholders, who have the perception that the environmental impact is not assessed completely and lacks in-depth knowledge. This shows that the EIA is strongly connected to the issue of public opposition.
As a reaction to the experience of project promoters, the EC published a guidance document to support national and regional actions in “Streamlining environmental assessment procedures for energy infrastructure Projects of Common Interest (PCIs)”.
19 Expected permitting times based on PCI implementation plans, available from
http://ec.europa.eu/energy/infrastructure/transparency_platform/map-viewer/

EASTNSI/4NT/0512397/000/02 2017 02 16 45/74
This
doc
umen
t is
the
prop
erty
of T
ract
ebel
Eng
inee
ring
S.A
. Any
dup
licat
ion
or tr
ansm
issi
on to
third
par
ties
is fo
rbid
den
with
out p
rior w
ritte
n ap
prov
al
3.4.3. Public consultation and opposition The TEN-E regulation gives high priority to a high level of transparency and participation of the public and claims the need for additional measures for PCI projects that exceed the established standards.
Our analysis shows, that public opposition constitutes a major barrier in the NSI East region (selected as a barrier 5 times) and can result in high delays. Public opposition is often related to environmental concerns and a high environmental impact of projects (see case study 3.4/ 3.15). However, various factors can lead to no public buy-in and a high level of public opposition.
European regulation aims to bridge pan-European common understanding with national views via the tools of PCIs, TYNDP and NDPs, which does not create buy-in from local population when local impact is a key concern. In the stakeholder interviews the concern has been raised that the environmental impact cannot be estimated on a European level without an in-depth local assessment. This is reinforced since at national level also public participation in the investment discussion can differ between PCIs and non-PCIs (e.g. in Germany). There is a risk that this increases the perception that for PCIs the higher socio-economic benefit can allow for higher environmental costs.
The case study on PCI 3.15.1 has shown that a strong public opposition at a late stage of the permitting procedure can lead to high delays of the project. Especially when the EIA does not cover the concerns of the public a lawsuit against the EIA decision can result in long court procedures of unpredictable duration.
Local stakeholders raise objection at a late stage in the process because either they had no opportunity to voice an opinion earlier, or because in their view strategic planning considerations (PCI, NDP, SEA) failed to demonstrate all relevant alternatives were considered. Missing alternative routes and technological options (e.g. underground cables instead of overhead lines) have been highlighted by stakeholders as relevant points for the public to intervene (see case study 3.4).
This study does not intend to make a case whether or not public participation was effective or not. Not surprisingly opinions differ between parties. What is important to note is that while stakeholders argue for earlier and enforced involvement in the process, other parties identify the risk that additional opportunities could only increase the likelihood of delays.
3.4.4. Financing Financing issues were flagged as the key reason for delay for a limited number of the projects in focus only. However, projects suffering financing issues show substantial delays and financing issues have been identified as being of high significance in the NSI East electricity corridor in the period 2012-2015 according to ACER’s 2015 PCI monitoring report. At the same time the survey results showed that financial support (direct or indirect) is perceived by project promoters as being one of the main benefits of the PCI label. Also for the cases where financing issues impacted project progress, the PCI label was considered an advantage to overcome these issues.

EASTNSI/4NT/0512397/000/02 2017 02 16 46/74
This
doc
umen
t is
the
prop
erty
of T
ract
ebel
Eng
inee
ring
S.A
. Any
dup
licat
ion
or tr
ansm
issi
on to
third
par
ties
is fo
rbid
den
with
out p
rior w
ritte
n ap
prov
al
The investment challenges of electricity infrastructure projects have been analysed recently in various reports. ENTSO-E (2014b) raised awareness for the unprecedented investment wave of the coming decade, and the need for effective regulatory conditions.
An EC study (Bearing Point and Microeconomix, 2015) reviewed a large number of TSO and Member State situations. A particular finding for Eastern European countries was that the lack of data and that financial management expertise and innovation was seen less of a priority for TSOs. Also cross-border project financing was deemed more complex in the NSI East region as security of supply was considered a larger driver for projects in this region which is less easy to put in CBA terms and translate to individual country benefits. The analysis carried out in this study did not identify this complexity as a barrier for PCI implementation though.
The ACER 2016 PCI implementation monitoring report revealed that across all electricity PCI corridors one third of the project promoters applied for CEF funding in the past, and most have expressed no position on whether they plan to apply for it in 2016/2017. Also 75% indicated they did not receive any public funding for their PCIs be it at European or national level.
A full overview of the INEA grants to PCIs in the NSI East electricity corridor is publically available20. In the first three calls during the period 2014 to first half of 2016 in total 26 Grant Agreements were signed with INEA on electricity PCIs, of which 22 for studies and four for works. One of the grants for works was in the NSI East electricity corridor and is described in more detail in case study 3.8.1. The CEF regulation allows for a co-funding rate up to 50% (and in exceptional cases under specific criteria up to 75%). The award criteria for grants for works and studies under CEF are covered in the TEN-E regulation, and complemented with guidance provided by the Commission in the CEF call for proposals.
The surveys and interviews did not reveal a substantial barrier in accessing CEF funds for particular projects. Nevertheless, several parties believe too many promoters grasp the opportunity for CEF funding, knowing very well the chance of meeting the criteria are very low. This is seen as a time and resource burden for promoters and regulators. An example is that a cross-border cost allocations agreements (among TSOs and NRAs) or decisions (by ACER) in line with provisions of the TEN-E regulation and ACER guidance are a necessary pre-condition to prepare a CEF grant application for works. Also INEA has expressed that promoters cannot assume by default a CEF co-financing rate, (because the co-financing rate is estimated on a case by case basis depending on the financing gap presented by the project application) and need to have a fall-back plan in case a grant is not given (at the co-financing rate requested by the promoter) 21.
20 https://ec.europa.eu/inea/en/connecting-europe-facility/cef-energy/projects-by-common-interest/energy-priority-
corridor-3
21 http://www.acer.europa.eu/Events/Workshop-on-2nd-ACER-CBCA-Recommendation/Documents/4.OKG-CBCA-CEF.pdf

EASTNSI/4NT/0512397/000/02 2017 02 16 47/74
This
doc
umen
t is
the
prop
erty
of T
ract
ebel
Eng
inee
ring
S.A
. Any
dup
licat
ion
or tr
ansm
issi
on to
third
par
ties
is fo
rbid
den
with
out p
rior w
ritte
n ap
prov
al
3.5. Need for actions
The recommendations in this chapter are related to the four major barriers discussed in section 3.4: organisational issues at the permitting authority, difficulties related to the EIA, public consultation and opposition and financial difficulties.
In the first part of this chapter, existing measures that tackle the major barriers are outlined and evaluated regarding their effectiveness and implementation issues. In the second part, the need for further improvement of the existing measures as well as new measures and recommendations are presented.
3.5.1. Existing measures The TEN-E regulation is the main instrument that provides various tools to support PCI implementation on a European level. Table 16 gives an overview of the major barriers of the NSI East electricity corridor and the existing legislation dealing with those issues. Additionally it shows, whether or not implementation issues have hampered the effectiveness of the measure indicating whether a revision or enforcement of the measure is useful. This overview does not present an exhaustive evaluation of the TEN-E regulation as such, but is based on already available studies with elements of relevance of this region as well as the main issues found in the projects and case studies of this report.
For completeness it must be added that out of the 12 projects in focus five have a pre-PCI history and are following the transitory arrangements set in Regulation (EU) 347/2013 Article 19 by which the permit granting and public participation provisions do not apply to them. Six submitted their application for permit after November 2013, and one partly before and after this date.
Barrier Existing measure Evaluation Implementation issues
Organisational issues at the permitting authority
Art. 9.1
Manual of procedures
No manual fully compliant with requirements
Manual sets a general framework and does not cover specificities of each PCI
Yes
Art. 10.1-10.2
Permit granting process consisting of a two-step procedure shall not exceed 3.5 years
Non-compliance with workflow requirements
Exceedance of time limits
Yes
Art. 7.2
Priority status shall ensure fast permitting
Limited proven effectiveness Requires further analysis
Art. 7.3
Highest national significance regarding permit granting and spatial planning
Criteria and benefits differ from country to country
Higher significance cannot always overrule permitting objection
Yes
Difficulties related to the EIA
Art 7.4-7.7
Commission shall issue nonbinding guidance to support Member States streamlining the
Available
Lessons learned not yet captured in regional setting
Requires further analysis

EASTNSI/4NT/0512397/000/02 2017 02 16 48/74
This
doc
umen
t is
the
prop
erty
of T
ract
ebel
Eng
inee
ring
S.A
. Any
dup
licat
ion
or tr
ansm
issi
on to
third
par
ties
is fo
rbid
den
with
out p
rior w
ritte
n ap
prov
al
Barrier Existing measure Evaluation Implementation issues
environmental assessment; Member States shall assess and take legislative and non-legislative measures
Public consultation and opposition
Annex VI (3) (b)
Extensive information and consultation at an early stage supported by competent authority
Early consultation in some cases may cause more opposition, in others may facilitate buy
Requires further analysis
Annex VI (3) (b)
Public consultation per subject matter limited to one consultation however one public consultation may take place in more than one geographical location
Essential to allow local actors to participate in the process; needs further analysis on effectiveness of applied consultation processes
Requires further analysis
Annex VI (3) (c)
Comments and objections shall be admissible until the expiry of the deadline only
Procedure needs to be clear, late comments can delay the process
No22
Art. 9.3
Project promoter shall draw up concept for public participation for approval of one-stop-shop
Only few projects with public participation concept in practice
Yes
Art.9.4
At least one public consultation before submission of the application file
Different opinions on number of consultations required
No
Financial difficulties
Art. 14.1-14.2
Union financial assistance: grants for studies and for works under specific criteria
Perceived as main benefit; confirmed by affected promoters in the region to have addressed the barrier
No (not applicable)
Art. 6.1 c
Guidance on the financing of the project by European coordinator
European coordinator has main role in the identification of PCIs, less in their implementation where bilateral/trilateral discussions seems more appropriate. No experience however yet on the use of this concept
No (not applicable)
Table 16: Overview on existing measures as set out in TEN-E regulation (Source: Milieu 2016, own analysis)
22 The surveys and interviews did not reveal that the time allowed to provide comments was an issue if the process
was clear and open.

EASTNSI/4NT/0512397/000/02 2017 02 16 49/74
This
doc
umen
t is
the
prop
erty
of T
ract
ebel
Eng
inee
ring
S.A
. Any
dup
licat
ion
or tr
ansm
issi
on to
third
par
ties
is fo
rbid
den
with
out p
rior w
ritte
n ap
prov
al
Organisational issues at the permitting authority:
TEN-E regulation Art 9.1 deals with the publication of a manual of procedures by each Member State or competent authority, which outlines the specific permitting steps and their timeframe.
According to a study of Milieu (2016) the article has not been fully implemented yet by Member States. At the time when the report was published, no manual was found to be fully compliant with the requirements. It is particularly difficult to consolidate different project specificities in one single manual and still keep it simple enough for application. Some competent authorities prepared the manual with the consultation of other authorities or the support of a working group, to adjust the different procedures.
Art. 10.1 and 10.2 of the TEN-E regulation set out the two phases of the permit granting process. The pre-application procedure covers the period between the start of the permit granting process and the acceptance of the submitted application file by the competent authority. It is followed by the statutory permit granting procedure which is the timeframe between acceptance of the application file and comprehensive decision. Those two phases combined shall not exceed a total duration of 3.5 years.
The project promoters stated that there was uncertainty if the acceptance of the submitted application file, which defines the end of stage one and the beginning of stage two, is related to the very first or last file in the permitting process. Thus, it is clearly problematic to determine the actual status of implementation of projects. The number of delayed projects in Table 13 underlines the issue of keeping up with the planned workflow. Some stakeholders noted that a general time limit is not convenient for projects of different scope. It does take into account the complexity of the project and the times needed for a single permit throughout the procedure.
According to Milieu (2016), besides Art. 9.1, there have also been cases of non-compliance with the workflow requirements of Art. 10.1. To resolve compliance problems, the EC has launched in 2016 “EU pilot” cases and intensified the dialogue with the competent authorities.
To make a significant assessment on the effectiveness of the compliance with time limits, more experience needs to be gained with the application of the TEN-E regulation provisions on permit granting. The articles do not apply to projects under the scope of Art. 19 “transitional provision” of the TEN-E regulation.
Art. 7.2 and 7.3 aim to facilitate the permit granting process for PCIs. The priority status shall ensure the most rapid treatment legally possible by project promoters and all authorities concerned to the application files of PCIs. Where such status exists in national law, PCIs shall be allocated the status of the highest national significance possible and be treated as such in permit granting processes and spatial planning, if national law so provides.
The benefits coming with this status and the criteria to obtain it differ from country to country. The status of the highest national significance possible can automatically be recognised along with the PCI label or has to be authorised based on other national criteria; it can also be refused. In two Member States (Cyprus and Czech Republic) the status does not exist in all parts of the country (Milieu, 2016).

EASTNSI/4NT/0512397/000/02 2017 02 16 50/74
This
doc
umen
t is
the
prop
erty
of T
ract
ebel
Eng
inee
ring
S.A
. Any
dup
licat
ion
or tr
ansm
issi
on to
third
par
ties
is fo
rbid
den
with
out p
rior w
ritte
n ap
prov
al
Difficulties related to the EIA:
According to Art. 7.4 of TEN-E the EC issued a guidance document in 2013 to support national and regional actions in “Streamlining environmental assessment procedures for energy infrastructure Projects of Common Interest (PCIs)”. This document gives the following suggestions, in terms of both legislative and non-legislative measures to enable a 3.5 year maximum permit process:²°BN
Early planning, "roadmapping" and scoping of assessments: This means creating a clear overview of the assessments to be done, the data to be collected for these, and reviewing existing potential/constraint maps that already exist. Apart from avoiding repetition or delay in various assessments, it incentivises the promoter to think about alternatives, sensitivities and the preferred option with various environmental plans in mind.
Early and effective integration of environmental assessments and of other environmental requirements: This can mean for example making Strategic Environmental Assessments (SEA) more complete, to prepare grounds for project-specific EIAs. These should not lock in solutions for future projects but be a proper base for all impact assessments and alternative considerations, by an appropriate “tiering” approach.
Procedural co-ordination and time limits: This means the national competent authority designated by the TEN-E regulation is truly empowered. Also time limits of individual process steps need to be clear, including the consequence of failure to meet these.
Data collection, data sharing and quality control: This means relevant data for planning and environmental impact assessment should be available, up to date, both to promoters as well as neighbouring member states. Ex post monitoring is crucial to foster data quality and assessment methodologies for future PCIs.
Cross-border co-operation: Evidently collaboration is key for transboundary projects. Such coordination in process and data requirements can be set up via multilateral agreement, either formalised or with informal voluntary contacts. The TEN-E regulation also provides for a European coordinator to assist in this. The EC also provided guidance explicitly for EIAs for transboundary projects.
Early and effective public participation: In the earlier mentioned points of early roadmapping, complete SEAs, data sharing, and cross-border cooperation, an effective public participation needs to be offered.
According to Art. 7.5-7.7, after the issue of the guidance document by the EC, Member States had nine months (until April 2014) to implement appropriate non-legislative measures, and 24 months (until August 2015) to implement legislative measures to meet the TEN-E regulation objectives taking into account the guidance. This study did not cover an overall analysis of all relevant measures and gaps, but focused on the issues raised by stakeholders in the case studies. In particular cases 3.4 and 3.15 highlighted issues where either the EIA methodology or the public participation process was questioned.

EASTNSI/4NT/0512397/000/02 2017 02 16 51/74
This
doc
umen
t is
the
prop
erty
of T
ract
ebel
Eng
inee
ring
S.A
. Any
dup
licat
ion
or tr
ansm
issi
on to
third
par
ties
is fo
rbid
den
with
out p
rior w
ritte
n ap
prov
al
Public consultation and opposition:
Article 9 complemented by a guideline in Annex VI.3 builds the framework for public participation.
Main aspects are information and consultation at an early stage, the drawing up of a concept for public participation by the project promoter, at least one public consultation before submission of the application file and an updated website with relevant information.
While extensive information and early consultation are seen as a promoter for public buy-in, some project promoters argued that it may cause even more opposition or draw the attention of a large number of opponents. One stakeholder criticised the inaccessibility of consultations on a local level. Following Milieu (2016) report on the manuals of procedures for the permit granting process, article 9.4 was interpreted in different ways regarding the number of consultations to be held. Project promoters were uncertain whether one public consultation in the pre-application was sufficient or if that consultation should be in addition to the ones in the framework of the EIA.
To keep consultation practices efficient, the regulation prescribes that only one public consultation per subject matter shall take place and comments and objections shall only be admissible until the expiry of a deadline.
Financial difficulties:
Art. 14.1 and 14.2 set the requirements for PCIs to become eligible for Union financial assistance in the form of grants for studies and financial instruments and grants for works under the Connecting Europe Facility Programme (CEF). The survey results and interviews have shown that the financial support of the CEF is perceived as a benefit by most project promoters and can be crucial for the timely realisation of projects facing financial difficulties.
Art. 6 covers the role of European coordinators. Following Art. 6.1c, the European Commission may designate for PCIs that encounter significant implementation difficulties a European coordinator who shall, if appropriate, advise project promoters on the financing of the project.
One project promoter raised the issue that the present procedures to select projects and allocate financial resources are long and complicated. A more effective procedure was expected.

EASTNSI/4NT/0512397/000/02 2017 02 16 52/74
This
doc
umen
t is
the
prop
erty
of T
ract
ebel
Eng
inee
ring
S.A
. Any
dup
licat
ion
or tr
ansm
issi
on to
third
par
ties
is fo
rbid
den
with
out p
rior w
ritte
n ap
prov
al
3.5.2. New measures and recommendations The following table lists new measures which can be explored further either in a review and revision process of the TEN-E regulation, in the collaborations at regional (e.g. NSI East Electricity regional group) or bilateral level, and in national processes. These measures were identified by involved actors in the surveys and case studies mentioned earlier. They are explored further, made more generic, and also compared to approaches applied in other European regions. For each possible measure a risk assessment is given.
Barrier New measure Level Risks
Organisational issues at the permitting authority
Alignment of national procedures by exchange of best practices, both by national authorities as well as by promoters
Regional and bilateral
- Light approach
- Conflict with particular national/local competences for which competent authority designated by the TEN-E regulation has no mandate
Regular update of manual of procedures
national - Increased ambiguity for ongoing projects
Involvement/ consultation of stakeholders in preparation of manual
national - Ambiguity in role of each consultation step (PCI identification, NDP, EIA, national guidance document)
Create a central single database with all implementation monitoring information, covering the various reporting tasks either mandated by the TEN-E regulation, or voluntarily done (in RGs or via ENTSO-E). This overview facilitates the possibility for the RGs and EC to understand and intervene where needed.
EU/region - Only process coordination risk
- Still a possible conflict with national reporting obligations
Difficulties related to the EIA
Guidance document for EIA methodologies to be established based on sound consultation
EU/region - Possibly little added value compared to existing best practices and guidance documents
- Conflict with detailed national provisions for EIA on other domains
Exchange of best practices, possibly with a central database of issues and solutions
EU/region - Difficult to make it relevant for others actors due to case-specific conditions; could end up being a very long case study archive
Public consultation and opposition
Early engagement with all local stakeholders, aiming to make sure that all options were checked and why the preferred one was selected.
national - If no transparent plan, the risk that discussions do not end or get blocked. Essentially the usual fear that more consultation leads to more resistance
- Can result in scrutiny over PCI identification
Early communication with all stakeholders, and create buy-in via "co-decision". E.g. putting the question to a public panel or local community representatives on which action to take within budget constraints, environmental constraints, and system needs (example: RTE/Elia Life23 + project where green corridors are created
national - May be challenging to implement, and not in line with national responsibilities
23 The RTE/Elia Life project website is http://www.life-elia.eu/en/.

EASTNSI/4NT/0512397/000/02 2017 02 16 53/74
This
doc
umen
t is
the
prop
erty
of T
ract
ebel
Eng
inee
ring
S.A
. Any
dup
licat
ion
or tr
ansm
issi
on to
third
par
ties
is fo
rbid
den
with
out p
rior w
ritte
n ap
prov
al
Barrier New measure Level Risks
under overhead lines with local stakeholder input)
Establish a public (compensation) fund which can be used to offset negative infrastructure impact (example: Luxemburg). Decision on fund application could be by the government, or again be a co-decision process with local actors.
national - Still overall seen as higher societal cost
- Misuse of funding, needs checks and balance mechanism
Simplify formal procedures by enshrining in EU or national law that a particular asset technology or a project with perceived little environmental impact is exempted from parts of the permitting and/or consultation obligations (e.g. replacement works of existing lines)24
EU/national - Can send wrong signal to the public, as being bypassed without consultation or rigorous approval process
- Can send wrong incentives to planners and financers to prefer sub-optimal but more easy to implement projects. Can thus set bias in PCI identification.
- Can lock in existing routes which already have substantial impact
Create public buy-in via political support, e.g. the need for a NDP parliamentary approval
national - Difficult to keep full process within prescribed time limits
- Impacts TYNDP roles as foreseen in EU legislation
Financial difficulties
Establish a pre-qualification for financial support. This can be combined in the PCI process by a separate labelling or by defining a new PCI category in the TEN-regulation. This could give stronger focus in the identification to cases with finance issues.
EU/regions - Still a risk that most projects ask for pre-qualification
- Risk of discrimination in the PCI selection process with one class being more scrutinized (the one aiming for financial support), while all can benefit from a priority status in national permitting.
- Request for pre-qualification in the PCI process may undermine regional support for such label based on questioned profitability. At present the societal benefit discussion is in the PCI process, not the financeability discussion.
Table 17: New measures
24 Note that it does not refer to the PCI status as such, but it is an option (sometimes expressed by promoters) to
exempt ‘simple’ projects from consultation and PCIs.

EASTNSI/4NT/0512397/000/02 2017 02 16 54/74
This
doc
umen
t is
the
prop
erty
of T
ract
ebel
Eng
inee
ring
S.A
. Any
dup
licat
ion
or tr
ansm
issi
on to
third
par
ties
is fo
rbid
den
with
out p
rior w
ritte
n ap
prov
al
Overall these recommendations mostly point in the following direction:
A more open stakeholder process, looking at all phases of the planning process and clarifying needs and alternatives.
Intensified sharing of best practices at regional level (Regional Groups or subgroups) regarding permit coordination, stakeholder engagement, and persisting implementation issues.
Clearer central data repositories of progress and issues. Both previous points should allow for a more focused escalation process at
RG or EU level, or for allowing the EU to take mediator actions in bilateral high-level discussions.
DISCLAIMER: more evidence needed on the permit granting process; results should be compared with the other regions of the TEN E Regulation

EASTNSI/4NT/0512397/000/02 2017 02 16 55/74
This
doc
umen
t is
the
prop
erty
of T
ract
ebel
Eng
inee
ring
S.A
. Any
dup
licat
ion
or tr
ansm
issi
on to
third
par
ties
is fo
rbid
den
with
out p
rior w
ritte
n ap
prov
al
4. ASSESSMENT OF FURTHER INTEGRATION
Chapter 2 showed that short-term projects (i.e. commissioning expected before 2020) and mid-term projects (i.e. commissioning expected between 2020 and 2025) are justified, and Chapter 3 analysed barriers preventing their implementation and proposed adequate solutions. The purpose of this Chapter is to analyse the situation of the electricity infrastructure in Central and South Eastern Europe after the implementation of short-term and mid-term projects through a market simulation, in order to assess the need of further integration by 2030. This Chapter assesses also the relevance of long-term project in relation to the identified remaining needs. Consequently, Section 4.1 describes the methodology used, Section 4.2 presents the results of the market simulation, Section 4.3 presents a qualitative sensitivity analysis and Section 4.4 analyses the need of further integration.
4.1. Methodology
The market simulation that is performed to assess the need of further integration in the region is based on a non-sequential Monte Carlo simulation of the generation-transmission power system thanks to the SCANNER software tool developed by Tractebel. Monte Carlo simulation is used to consider random forced outages of generating units and transmission elements and the stochastic behaviour of RES. For each sampled state, operating costs are optimized under operating constraints (e.g. transfer capacities between areas, maximum outputs of generators). Note that dynamic constraints on generators (ramping rates, minimum up/down times, minimum stable power) are not considered for the results presented in this report. Annual operating costs can then be estimated by averaging the results on all sampled states. Moreover, the need for additional interconnection projects can be estimated by computing average price spreads between countries and the marginal costs associated to transmission constraints between countries.
In terms of transmission scenario, the analysis is based on a Market Approach. This means that each country is modelled by a single node and power exchanges between countries are limited by the corresponding Net Transfer Capacities (NTCs). It corresponds to the approach used for the market analysis in the TYNDP, at the exception that Italy is modelled by a single node in this study and by several nodes (typically two nodes, Northern Italy and Southern Italy) in the TYNDP2016. The internal congestions due to the limitations of internal networks are not analysed in the frame of this study. The reference network corresponds to the expected state after the commissioning of short-term and mid-term projects defined in Chapter 2. Corresponding NTCs between countries are estimated from values given in the TYNDP 2016.
The installed generating capacity and the load profiles in the different countries are taken from the Vision 2 of the TYNDP 2016. This vision assumes a strong European framework but a lack of financial strength. This creates a cost cutting and energy savings so that the demand is quite low. The deployment of RES is made in a more efficient way due to EU framework. Some development of Heating Power, Electrical Vehicles and Demand Response are included in this
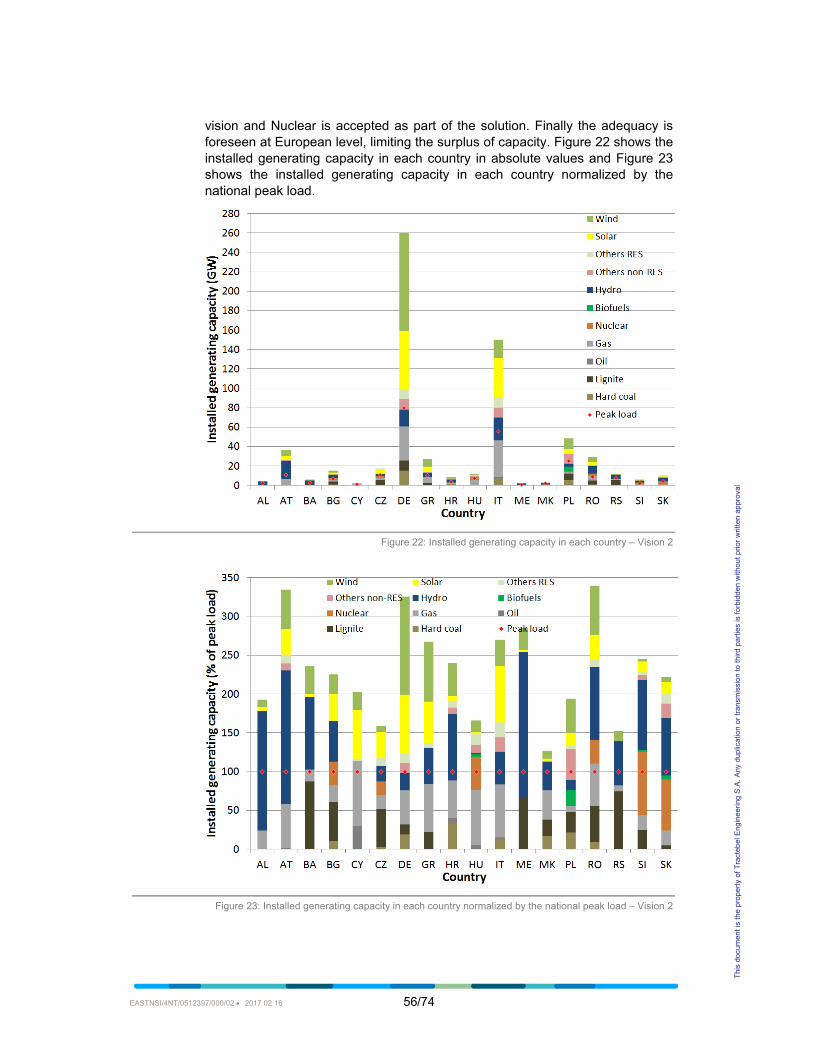
EASTNSI/4NT/0512397/000/02 2017 02 16 56/74
This
doc
umen
t is
the
prop
erty
of T
ract
ebel
Eng
inee
ring
S.A
. Any
dup
licat
ion
or tr
ansm
issi
on to
third
par
ties
is fo
rbid
den
with
out p
rior w
ritte
n ap
prov
al
vision and Nuclear is accepted as part of the solution. Finally the adequacy is foreseen at European level, limiting the surplus of capacity. Figure 22 shows the installed generating capacity in each country in absolute values and Figure 23 shows the installed generating capacity in each country normalized by the national peak load.
Figure 22: Installed generating capacity in each country – Vision 2
Figure 23: Installed generating capacity in each country normalized by the national peak load – Vision 2
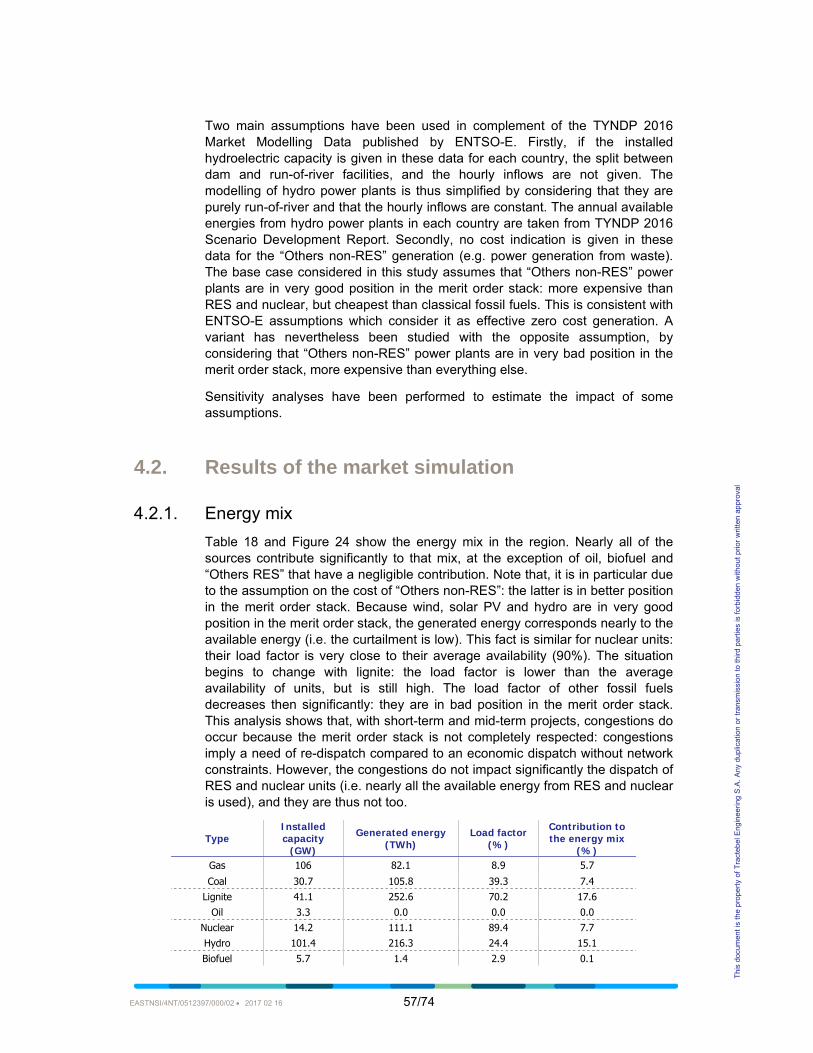
EASTNSI/4NT/0512397/000/02 2017 02 16 57/74
This
doc
umen
t is
the
prop
erty
of T
ract
ebel
Eng
inee
ring
S.A
. Any
dup
licat
ion
or tr
ansm
issi
on to
third
par
ties
is fo
rbid
den
with
out p
rior w
ritte
n ap
prov
al
Two main assumptions have been used in complement of the TYNDP 2016 Market Modelling Data published by ENTSO-E. Firstly, if the installed hydroelectric capacity is given in these data for each country, the split between dam and run-of-river facilities, and the hourly inflows are not given. The modelling of hydro power plants is thus simplified by considering that they are purely run-of-river and that the hourly inflows are constant. The annual available energies from hydro power plants in each country are taken from TYNDP 2016 Scenario Development Report. Secondly, no cost indication is given in these data for the “Others non-RES” generation (e.g. power generation from waste). The base case considered in this study assumes that “Others non-RES” power plants are in very good position in the merit order stack: more expensive than RES and nuclear, but cheapest than classical fossil fuels. This is consistent with ENTSO-E assumptions which consider it as effective zero cost generation. A variant has nevertheless been studied with the opposite assumption, by considering that “Others non-RES” power plants are in very bad position in the merit order stack, more expensive than everything else.
Sensitivity analyses have been performed to estimate the impact of some assumptions.
4.2. Results of the market simulation
4.2.1. Energy mix Table 18 and Figure 24 show the energy mix in the region. Nearly all of the sources contribute significantly to that mix, at the exception of oil, biofuel and “Others RES” that have a negligible contribution. Note that, it is in particular due to the assumption on the cost of “Others non-RES”: the latter is in better position in the merit order stack. Because wind, solar PV and hydro are in very good position in the merit order stack, the generated energy corresponds nearly to the available energy (i.e. the curtailment is low). This fact is similar for nuclear units: their load factor is very close to their average availability (90%). The situation begins to change with lignite: the load factor is lower than the average availability of units, but is still high. The load factor of other fossil fuels decreases then significantly: they are in bad position in the merit order stack. This analysis shows that, with short-term and mid-term projects, congestions do occur because the merit order stack is not completely respected: congestions imply a need of re-dispatch compared to an economic dispatch without network constraints. However, the congestions do not impact significantly the dispatch of RES and nuclear units (i.e. nearly all the available energy from RES and nuclear is used), and they are thus not too.
Type Installed capacity
(GW)
Generated energy (TWh)
Load factor (%)
Contribution to the energy mix
(%) Gas 106 82.1 8.9 5.7
Coal 30.7 105.8 39.3 7.4 Lignite 41.1 252.6 70.2 17.6
Oil 3.3 0.0 0.0 0.0 Nuclear 14.2 111.1 89.4 7.7 Hydro 101.4 216.3 24.4 15.1 Biofuel 5.7 1.4 2.9 0.1

EASTNSI/4NT/0512397/000/02 2017 02 16 58/74
This
doc
umen
t is
the
prop
erty
of T
ract
ebel
Eng
inee
ring
S.A
. Any
dup
licat
ion
or tr
ansm
issi
on to
third
par
ties
is fo
rbid
den
with
out p
rior w
ritte
n ap
prov
al
Wind 157.9 301.6 21.8 21.0 Solar PV 125.1 155.7 14.2 10.8 Others 60.7 209.2 39.4 14.6
Table 18: Energy mix in the region
Figure 24: Energy mix in the region
Figure 25 shows the energy mix in each country. The generated energy is normalized by the national annual load. Some countries are strongly exporting (more than 20% of their load): Slovenia, Montenegro, Romania, Serbia and Slovakia. Others are strongly importing (more than 20% of their load): Cyprus, Macedonia, Hungary and Croatia.
Figure 25: Generated energy in each country normalized by the national annual load

EASTNSI/4NT/0512397/000/02 2017 02 16 59/74
This
doc
umen
t is
the
prop
erty
of T
ract
ebel
Eng
inee
ring
S.A
. Any
dup
licat
ion
or tr
ansm
issi
on to
third
par
ties
is fo
rbid
den
with
out p
rior w
ritte
n ap
prov
al
4.2.2. Zonal marginal electricity prices and major bottlenecks Table 19 and Figure 26 show the average electricity price for the various countries in the region. Moreover, Figure 26 shows also the remaining bottlenecks. From the analysis of major bottlenecks, the countries can be gathered in six different sets such that there is no major bottleneck within each set of countries, but major bottlenecks appear between two different sets:
First set of countries: only Poland. That country has an energy mix relying strongly on fossil fuels and others non-RES and has an import/export balance quasi equal to zero (import of 1 TWh, less than 1% of the annual load). The price of electricity is around the middle of the range of the region.
Second set of countries: Germany, Czech Republic and Austria. They are together a small net importer (12 TWh, approximately 2% of their annual load), although Austria is a small net exporter and Germany and Czech Republic are small net importers. The generation mix in Austria is mainly based on hydro, but also a little on other RES (wind, PV), while the generation in Germany is strongly based on wind, PV and fossil fuels and the generation in Czech Republic is strongly based on fossil fuels and nuclear energy. The energy mix is thus very different from one country to another and there are important power exchanges from one country to another, but no major congestion is expected after the commissioning of short-term and mid-term projects: it will act nearly as one market area. However, this implies that a global excess of RES compared to the load is very rare and that thermal units are nearly always necessary to supply the load. Because the price of electricity at a given moment is the cost of the most expensive (marginal) unit running, it means that the price of electricity is nearly always ruled by thermal units. Consequently, the average price of electricity in these three countries is the highest in the region (with Italy that has a similar price).
Third set of countries: only Italy. It is a small net importer (7 TWh, approximately 3% of its annual load) and it has a large share of RES (hydro, wind, PV) in its energy mix. Although the average annual price of electricity is nearly the same in Italy and in Austria, there is a bottleneck between the two countries because the RES in the south of Europe and in the north of Europe are poorly correlated: an excess of RES in the North combined with a lack of RES in the South will induce a congestion in the direction Austria → Italy, while an excess of RES in the South combined with a lack of RES in the North will induce a congestion in the direction Italy → Austria.
Fourth set of countries: Slovakia, Hungary, Slovenia and Croatia. They are together a small net importer (2 TWh, approximately 2% of their annual load), but Slovakia and Slovenia are two major net exporters (18 TWh) while Hungary and Croatia are two major net importers (20 TWh). The price of electricity in these four countries is in the lowest half of the range of the region.

EASTNSI/4NT/0512397/000/02 2017 02 16 60/74
This
doc
umen
t is
the
prop
erty
of T
ract
ebel
Eng
inee
ring
S.A
. Any
dup
licat
ion
or tr
ansm
issi
on to
third
par
ties
is fo
rbid
den
with
out p
rior w
ritte
n ap
prov
al
Fifth set of countries: Romania, Bulgaria, Bosnia-Herzegovina, Montenegro, Macedonia, Albania and Serbia. They are together a major net exporters of electricity (35 TWh, 20% of their annual load), although Macedonia is a major net importer (6.5 TWh, 61% of its annual load). The price of electricity in these seven countries is the lowest of the region. Indeed, the installed capacity is dominated by RES, mainly hydro, and by lignite power plants that are in very good position in the merit order stack (less expensive than any other fossil fuel): on 61 GW of installed generating capacity in these countries, there are 32 GW from RES (among which 22 GW from hydro) and 16 GW of lignite. The price of electricity is thus often fixed either by the marginal cost of RES (close to 0) or by the marginal cost of lignite.
Sixth set of countries: Greece and Cyprus. They are major net importers of electricity (12 TWh, nearly 20% of their annual load). The price of electricity is among the highest of the region (below the price in Italy, Austria, Germany and Czech Republic). Although an important RES generating capacity is installed in these countries, it is not sufficient to supply the load at all moments. Lignite power plants in Greece contributes significantly to the load supply (20%), but imports from neighbouring countries are also needed, before resorting to expensive gas generation.
The major bottlenecks are located between these six clusters of countries.
Country Average marginal cost of electricity (€/MWh)
Albania (AL) 24.6
Austria (AT) 36.3 Bosnia-Herzegovina (BA) 24.4
Bulgaria (BG) 23.2 Cyprus (CY) 35.1
Czech Republic (CZ) 37.3 Germany (DE) 36.7 Greece (GR) 35.1 Croatia (HR) 27.8
Hungary (HU) 27.8 Italy (IT) 35.6
Montenegro (ME) 24.3 Macedonia (MK) 24.6
Poland (PL) 30.5 Romania (RO) 21.2 Serbia (RS) 24.3
Slovenia (SI) 27.8 Slovakia (SK) 27.7
Table 19: Average electricity price (average marginal cost) in the region

EASTNSI/4NT/0512397/000/02 2017 02 16 61/74
This
doc
umen
t is
the
prop
erty
of T
ract
ebel
Eng
inee
ring
S.A
. Any
dup
licat
ion
or tr
ansm
issi
on to
third
par
ties
is fo
rbid
den
with
out p
rior w
ritte
n ap
prov
al
Figure 26: Zonal prices (in €/MWh) in each country and major remaining bottlenecks
Table 20 shows the annual number of hours with congestion on the main congested interconnectors, and also the average price spread between the two interconnected countries. In this context, the price spread is defined as the average absolute value of the price difference between the two countries. When the price is systematically higher in one country, the price spread is equal to the difference between the average electricity prices. It is for example approximately the case for the interconnection between Greece and Macedonia. However, when the hourly electricity price is, from times to times, lower on one side, and from times to times, lower on the other side of the interconnection, the price spread can be very different from the difference between the average marginal prices. It is in particular the case for the interconnection between Italy and Austria: although average prices are almost the same, the price spread between these two countries is among the biggest in the region. Table 20 confirms in particular the fact that the interconnections between the six identified clusters of countries are the major remaining bottlenecks in the region.
Interconnection Annual number of hours with a forward congestion
Annual number of hours with a backward congestion
Price spread (€/MWh)
AT-IT 1999 2975 17.0
AT-HU 1987 4160 14.3
AT-SI 1735 3945 14.3
IT-ME 1166 4348 13.9
DE-PL 2053 3172 13.0
GR-MK 1324 5082 12.8
AL-GR 4452 1329 12.8
BG-GR 4375 279 12.4
IT-SI 1210 3400 11.0
CZ-SK 800 4003 10.2
CZ-PL 2167 2979 9.0

EASTNSI/4NT/0512397/000/02 2017 02 16 62/74
This
doc
umen
t is
the
prop
erty
of T
ract
ebel
Eng
inee
ring
S.A
. Any
dup
licat
ion
or tr
ansm
issi
on to
third
par
ties
is fo
rbid
den
with
out p
rior w
ritte
n ap
prov
al
Interconnection Annual number of hours with a forward congestion
Annual number of hours with a backward congestion
Price spread (€/MWh)
HU-RO 111 4917 6.6
SK-PL 3518 785 5.4
Table 20: Main congested interconnections
4.3. Sensitivity analyses
This section aims at assessing, qualitatively the impact of main parameters that could impact the flows on the interconnection and the needs for further regional integration. It aims at analysing the limits/assumptions of the model built to anticipate how the results would be sensitive to these limits/assumptions. Three items are especially discussed:
The impact of internal constraints that are not taken into account in the model. However systems of Germany and Italy face strong North-South transmission bottlenecks. Their role on international flows will be assessed qualitatively in this section
The model is based on Vision 2 of ENTSO-E. This Vision assumes a strong European framework but a lack of financial strength. The impact of using another load-generation visions will also be discussed in this section
Finally, results presented previously are based on two fundamental assumptions that have been made due to the lack of public information from ENTSO-E: one related to the cost of “Others non-RES” generation, and the other on hydraulicity. This section also studies the sensitivity of the results to those two assumptions.
4.3.1. Impact of internal constraints in Germany and Italy Germany
Currently no internal constraint is considered in the model. Implicitly, it is therefore considered that necessary reinforcement likes the ones proposed in PCI 3.12 (2 GW HVDC connection from North-East Germany to the South of Bavaria) and 3.13 (South-East Interconnector) are online. When looking further inside German system, it can be noticed that strong internal constraints prevent currently from a harmonized marginal price. Indeed, the average yearly marginal cost in the North of the country is much lower than the South thanks to the high share of wind farm in the energy mix in this part of the country (in particular offshore wind energy in the North Sea and in the Baltic Sea). These internal constraints currently lead to a substantial internal re-dispatch within Germany. Additionally, high power flows from northern Germany to southern Germany lead to loop flows through Poland, on one side, and through the Netherlands, Belgium and France, on the other side. Phase shifter transformers are installed on various borders to keep the north-south power flows in Germany. Consequently, the development of internal reinforcements in Germany to alleviate internal constraints is of the paramount importance. Several projects are expected, in particular several HVDC transmission links. However, the recent change in the German legislation imposing an underground preference
EASTNSI/4NT/0512397/000/02 2017 02 16 63/74
This
doc
umen
t is
the
prop
erty
of T
ract
ebel
Eng
inee
ring
S.A
. Any
dup
licat
ion
or tr
ansm
issi
on to
third
par
ties
is fo
rbid
den
with
out p
rior w
ritte
n ap
prov
al
for new HVDC links could lead to a strong delay in the completion of these internal projects.
As an additional consequence of the different marginal costs between northern Germany and southern Germany, the difference of marginal cost between the North of Germany and Poland is lower than presented in Figure 26. However, as the energy mix is very different in both countries (essentially wind in Germany and non RES fuel in Poland), important flows are foreseen between the two countries (in both directions in function of energy available on both sides of the interconnections at a given moment). Therefore, reinforcing the interconnection between these two countries remains a priority.
Italy
In Italy, the majority of hydro plants are located in the North, so relatively correlated with hydro generation in Austria. The load is much higher in the North than in the South. Currently, there are internal constraints between North and South of Italy, creating a gap in the marginal costs of electricity between the six different market areas25.
The internal constraints in Italy represent the first barrier for further integration between Italy and the rest of Europe but once these internal constraints will be solved, it will become required to reinforce interconnections between Italy and Austria. On the other side, the interconnection between Italy and Montenegro remains a priority and can help at mitigating internal constraints in Italy, offering a new way for Central Italy to import (or export) renewable energy.
4.3.2. Impact of load-generation vision The poor economic context considered in Vision 2 of ENTSO-E leads to a limited development of RES. However, this vision considers also a strong European framework that leads to an optimization of the development of RES at the regional level: each type of RES is developed mainly in the areas that are the most efficient.
In Vision 3, the strong development of RES in each country independently of regional integration could lead to stronger needs for interconnections because of an over-investment in RES in some countries, consecutive of favourable national policies. It could in particular impact the northern area of the NSI East priority corridor (DE, PL, CZ, SK) because the development of RES in Germany is much more important in Vision 3 than in Vision 2 (+13.9 GW of solar and +39.6 GW of wind), and there is a significant shift in Poland from thermal units (-4.5 GW) to RES (+8.1 GW). The share of RES changes also drastically in Italy from Vision 2 to Vision 3 (+18.9 GW).
25 Note that the need of having a day-ahead energy market split in six different bidding areas is motivated by the
internal congestions.

EASTNSI/4NT/0512397/000/02 2017 02 16 64/74
This
doc
umen
t is
the
prop
erty
of T
ract
ebel
Eng
inee
ring
S.A
. Any
dup
licat
ion
or tr
ansm
issi
on to
third
par
ties
is fo
rbid
den
with
out p
rior w
ritte
n ap
prov
al
On the other side, the Vision 2 of ENTSO-E presents the lowest load demand forecast (decrease in 2030 compared to 2020) while other scenarios consider a stagnation or increase of load demand. Increasing the load demand will lead to an increase of thermal generation and potentially an increase of marginal prices in several countries of the region. The impact is quite uncertain, creating, on one side, needs of local generation, and on other side, possibilities for higher exchanges between the countries.
4.3.3. Impact of generation assumptions Cost of “Others non-RES”
As explained in section 4.1 and according to the assumptions of ENTSO-E, the “Others non-RES” power plants are considered in very good position in the merit order stack.
When the “Others non-RES” generation is assumed to be more expensive than the fossil fuels (i.e. in bad position in the merit order stack), the average price of electricity increases in the region and the major remaining bottlenecks remain the same. However, the price of electricity in Poland increases much more than the price of electricity in neighbouring countries (approximately +40€/MWh, compared to +15-20€/MWh). The congestion between Poland and the neighbouring countries is then in that case quasi-unidirectional: Poland tends to rely strongly on imports from other countries. The price of electricity in Italy increases also much more than in its neighbouring countries, increasing the importance of congestions between Italy and Austria, and between Italy and the Balkans. It is however the opposite for Greece: that country does not rely on “Others non-RES” generation and the increase of the price of electricity in that country is negligible, leading to a slight decrease of the congestions between Greece and northern countries.
Annual hydraulicity
In the base case, the annual available energies from hydro power plants in each country are taken from TYNDP 2016 Scenario Development Report. When the annual available energy from hydro power plants is assumed to be higher than the average generation given in TYNDP 2016 Scenario Development Report (e.g. in wet years), the price of electricity decreases in the region, but much more in countries with a large share of hydro, at the exception of Austria. The major bottlenecks in that case are between Czech Republic/Austria and Slovakia/Hungary/Croatia, and between Greece and northern countries.

EASTNSI/4NT/0512397/000/02 2017 02 16 65/74
This
doc
umen
t is
the
prop
erty
of T
ract
ebel
Eng
inee
ring
S.A
. Any
dup
licat
ion
or tr
ansm
issi
on to
third
par
ties
is fo
rbid
den
with
out p
rior w
ritte
n ap
prov
al
4.3.4. Summary of the main congested interconnections The previous analyses can be summarized as follows. After the implementation of short-term and mid-term groups, in 2030, the electricity infrastructure in Central and South Eastern Europe will probably suffer from the following bottlenecks:
Between Italy and Austria. Although the average price of electricity on both sides is similar, the interconnection between Italy and Austria will often be congested, because RES in Italy and in Northern Europe are complementary and non-correlated (mainly PV in Italy, and important wind and hydro generating capacity in Northern Europe).
Between Austria on one side, and Slovenia/Hungary on the other side. The high share of nuclear energy (and hydro energy) in the Slovenian energy mix will induce exports towards Czech Republic and Germany through Austria when the generation of RES is low in Germany. Note that Austria has a huge hydra capacity and consequently does not need itself import from Slovenia and that the transfer capacity between Austria and Germany will be much higher than the transfer capacity between Austria and Slovenia/Hungary (7.5 GW compared to 2 GW).
Between Italy and the Balkans. Hydroelectricity is an important renewable resource in the Balkans. The planned interconnection between Italy and Montenegro will to be insufficient to share that resource with Italy and will be strongly congested in the direction Montenegro → Italy. It will also be slightly congested in the other direction, when Italy has an excess of RES.
Between Greece and its northern neighbours. Even if Greece will have important RES capacities (hydro, PV, wind), it will still need imports and fossil generation to supply the load when there is a lack of RES. The interconnections with its northern neighbours will thus tend to be highly congested in the direction north → south in that case and slightly in the opposite direction, when there is an excess of RES in Greece.
Between Poland on one side, and its neighbouring countries (Germany Czech Republic, Slovakia), on the other side. Indeed, the generating capacity of Poland will be strongly based on fossil fuels, while the generating capacity of Germany will be strongly based on RES (wind, PV), and the generating capacity of Slovakia will be strongly based on nuclear energy (and hydro). However, because RES are intermittent, the magnitude and the direction of the congestion will depend on the actual generation cost of “Others non-RES” generation in Poland. If “Others non-RES” generation is in better position in the merit order stack than fossil fuels, Poland will tend to export when there is a lack of RES in neighbouring countries and the congestions will be balanced on both directions. On the contrary, if fossil fuels are in better position in the merit order stack than “Others non-RES”, Poland will always tend to import and the congestion will occur quasi-only in that direction.

EASTNSI/4NT/0512397/000/02 2017 02 16 66/74
This
doc
umen
t is
the
prop
erty
of T
ract
ebel
Eng
inee
ring
S.A
. Any
dup
licat
ion
or tr
ansm
issi
on to
third
par
ties
is fo
rbid
den
with
out p
rior w
ritte
n ap
prov
al
Between Czech Republic and Slovakia. Slovakia will have an energy mix mainly based on nuclear and hydro. Although Czech Republic will have some nuclear generating capacity, the marginal units will often be based on fossil fuels. Therefore, Slovakia will tend to export towards Czech Republic. However, due to a part of “Others non-RES” generation in the energy mix of Slovakia, and due to the influence of the neighbouring Poland, the importance of these exports and the magnitude of the congestion will depend on the actual marginal cost of “Others non-RES”: a low cost tends to increase the exports from Slovakia to Czech Republic.
Between Croatia/Hungary on one side, and the other Balkan countries (including Romania) on the other side. Although Hungary will have an important nuclear generating capacity and Croatia an important renewable generating capacity (mainly hydro), they will be net importers: their national fossil units are too expensive compared to neighbouring resources. They will import in particular hydroelectricity from the other Balkan countries. The magnitude of the congestion depends strongly on the actual cost of “Others non-RES” generation: if that cost is low the congestion is very moderate.
4.4. Need of further integration in the region
The long-term groups, not included in the base case studied in previous section, are the following:
Group VI, interconnection SI/HU/HR, Group VIII, interconnection CZ/DE (Czech North South Corridor), Group IX, interconnection DE/PL (GerPol Power Bridge), Group XII, interconnection SK/HU.
Among these four long-term groups, only the Group IX addresses a major bottleneck, between Germany and Poland. It should increase the NTC between the two countries by 500 MW in the direction Poland → Germany, and by 1500 MW in the direction Germany → Poland. Group VI increases the NTC between Hungary and Slovenia, but no major bottleneck is detected on that border. The situation is the same for Group VIII which increases the NTC between the Czech Republic and Germany, and for Group XII that increases the NTC between Slovakia and Hungary.
While only one long-term existing project addresses a major bottleneck, five major bottlenecks (over six) are not addressed at all: between Czech Republic and Slovakia, between Austria and Slovenia/Hungary, between Italy and Austria, between Italy and the Balkans, between Croatia/Hungary and the Balkans/Romania and between Greece and its northern neighbours. New projects should be proposed in order to overcome these bottlenecks.

EASTNSI/4NT/0512397/000/02 2017 02 16 67/74
This
doc
umen
t is
the
prop
erty
of T
ract
ebel
Eng
inee
ring
S.A
. Any
dup
licat
ion
or tr
ansm
issi
on to
third
par
ties
is fo
rbid
den
with
out p
rior w
ritte
n ap
prov
al
5. CONCLUSIONS
In Central and South Eastern Europe, there is a major need to reinforce and develop the electricity grid, in order to integrate renewable energy sources, to guarantee the security of supply, and to alleviate bottlenecks in the internal electricity market. Within the regional priority corridor of North-South electricity interconnections in Central Eastern and South Eastern Europe (NSI East Electricity corridor), the second PCI list (Regulation (EU) 2016/89) established 42 PCIs (out of 108 in the electricity sector). Among them, 38 PCIs lead to an increase of cross-border transfer capacities, which can be grouped in 15 groups of interdependent projects. This study classified these groups according to the time horizon of their implementation: short-term groups are expected to be fully commissioned by 2020, mid-term groups are expected to be fully commissioned between 2020 and 2025, and long-term groups are expected to be fully commissioned between 2025 and 2030. This study shows that short-term and mid-term PCI projects are required to address interconnection issues in the NSI East Electricity corridor, in particular to reduce the cross-border bottlenecks within that region that could lead to RES curtailment, to harmonize electricity price and to boost the interconnection level of several countries that are below the European target of 10% (Italy, Romania, Poland, and Cyprus).
However the implementation of these PCI faces barriers and delays. The study analysed them in details for the PCIs in the region where the delays where identified in official reporting. For those PCIs where the new permit granting provisions of the TEN-E Regulation was of application, the difficulties found were related in particular to organisational issues at the permitting authority, difficulties related to the environmental impact assessment in the context of the overall permitting process, and public opposition. Financial difficulties were an issue in some cases, though the PCI process already provided support to advance these projects.
It is therefore essential to take further action to overcome these barriers, and ensure a smooth implementation of these projects which are essential for the regional electricity market. Actions can be taken either at national level, at the level of implementation of the NSI East Electricity regional corridor (via the monitoring activities taking place in the corresponding TEN-E regional groups (or subgroups), or via future TEN-E regulation evaluation. The TEN-E regulation already sets appropriate obligations and empowerments of national bodies and regional groups. Experiences gained in past years should stimulate more sharing of best practices:
A more open stakeholder process, looking at all phases of the planning process and clarifying needs and alternatives,
Intensified sharing of best practices at regional level (Regional Groups or subgroups) regarding permit coordination, stakeholder engagement, and persisting implementation issues,
Clearer central data repositories of progress and issues.
These points should allow for a more focused escalation process both at regional group level or EU level, or for allowing the EU to take mediator actions in bilateral high-level discussions.

EASTNSI/4NT/0512397/000/02 2017 02 16 68/74
This
doc
umen
t is
the
prop
erty
of T
ract
ebel
Eng
inee
ring
S.A
. Any
dup
licat
ion
or tr
ansm
issi
on to
third
par
ties
is fo
rbid
den
with
out p
rior w
ritte
n ap
prov
al
Once these short-term and mid-term projects will have been implemented, the reinforcement of cross-border electricity infrastructure between several countries will remain required to ensure efficient trading within NSI-East electricity system. Through market simulations, this study shows that the following major bottlenecks should be especially addressed by 2030:
Between Poland and its neighbouring countries (Germany Czech Republic, Slovakia),
Between Czech Republic and Slovakia, Between Austria and Slovenia/Hungary, Between Italy and Austria, Between Italy and the Balkans, Between Croatia/Hungary on one side, and the Balkans/Romania on the
other side, Between Greece and its northern neighbours.

EASTNSI/4NT/0512397/000/02 2017 02 16 69/74
This
doc
umen
t is
the
prop
erty
of T
ract
ebel
Eng
inee
ring
S.A
. Any
dup
licat
ion
or tr
ansm
issi
on to
third
par
ties
is fo
rbid
den
with
out p
rior w
ritte
n ap
prov
al
ANNEX A: LITERATURE
ACER (2015). “Consolidated report on the progress of electricity and gas projects of common interest”.
ACER (2016) “Consolidated report on the progress of electricity and gas projects of common interest for the year 2015”.
Bearing Point, Microeconomix (2015). “Study on comparative review of investment conditions for electricity and gas Transmission System Operators (TSOs) in the EU”.
CPI (2012). “European Electricity Infrastructure: Planning, Regulation, and Financing”, CPI Workshop Report.
ENTSO-E (2012) TYNDP 2012
ENTSO-E (2013). Monitoring update TYNDP 2012
ENTSO-E (2014a). TYNDP 2014
ENTSO-E (2014b). “Fostering Electricity transmission investments to achieve Europe´s energy goals: Towards a future-looking regulation”.
ENTSO-E (2016). TYNDP 2016
European Commission (2011). Commission staff working paper, “Impact assessment”, Accompanying the document “Proposal for a Regulation of the Europen Parliament and of the Council on guidelines for trans-European energy infrastructure and repealing Decision No 1364/2006/EC”.
Milieu (2016). “Analysis of the manuals of procedures for the permit granting process applicable to projects of common interest prepared under Art.9 Regulation No 347/2013”
Roland Berger (2011). “Permitting procedures for energy infrastructure projects in the EU: evaluation and legal recommendations”.

EASTNSI/4NT/0512397/000/02 2017 02 16 70/74
This
doc
umen
t is
the
prop
erty
of T
ract
ebel
Eng
inee
ring
S.A
. Any
dup
licat
ion
or tr
ansm
issi
on to
third
par
ties
is fo
rbid
den
with
out p
rior w
ritte
n ap
prov
al
ANNEX B: CASE STUDIES
PCI cluster 3.4 PCI cluster 3.4 consists of one single project, an interconnection between Austria and Italy. The project has started the permitting procedure in 2004. The commissioning is expected for 2019.
3.4 Austria – Italy interconnection between Wurmlach (AT) and Somplago (IT)
Project promoters Alpe Adria Energie S.p.A.
Technical information A new 220 kV AC OHL of 40 km and with a capacity of 300 MVA from Somplago substation to Wurmlach substation
Current status Permitting
Current progress Delayed
Expected year of commissioning
2019
Delay since 2012 N/A
Information on progress In 2010 the application file for the Austrian section of this PCI (7 km) was submitted to the competent provincial government for the EIA, in reaction to a Court decision that stated that an EIA is necessary, even if the line does not exceed the limit of 15 km.
In August 2014 the EIA application was rejected by the Federal Administrative Court.
The appeal of Alpe Adria Energia S.p.A. against that decision was rejected in 2015.
The procedure was accompanied by public opposition from numerous Italian and Austrian initiatives that demanded an underground line.
That possible alternative is currently in technical planning and the EIA will be submitted approximately within 2016.
Table 21: PCI 3.4 (based on ACER 2016, decision W104 2000178-1/63E of the Bundesverwaltungsgericht, interviews)
The main barrier of the project is public opposition against the proposed option. Numerous local initiatives, environmental groups and experts from local governments were against the construction of the overhead line and stated first complaints in 2010. Reasons for opposition were ecological and geological aspects and the region’s role as a touristic area. Especially the Austrian part of the line (7 km) was subject of judicial negotiations. The application for the EIA for this section was rejected and an appeal to the Federal Court was refused as well. As reflected in the interviews, in Austria the EIA procedure is deemed to be very strict, as the whole application has to be restarted when single changes are necessary. Although on the Italian side the permitting was completed, the public demanded an underground line as an alternative solution. This alternative is in the process of technical planning and its EIA will be submitted within 2016. As the project is dependent on another internal Italian project of Terna, it might experience further delays.
The fact that PCI 3.4 is promoted by a private investor does not have an impact on the progress, following the interviewees. The project is neither included in the Austrian nor the Italian NDP, although there is a national interest in the project, considering the increase of transfer capacity.

EASTNSI/4NT/0512397/000/02 2017 02 16 71/74
This
doc
umen
t is
the
prop
erty
of T
ract
ebel
Eng
inee
ring
S.A
. Any
dup
licat
ion
or tr
ansm
issi
on to
third
par
ties
is fo
rbid
den
with
out p
rior w
ritte
n ap
prov
al
This was also flagged by ACER. The interviewed stakeholders reported that it is common practice that projects of private investors are not included in NDPs. Also, an inclusion of PCI 3.4 in the NDP would not necessarily have helped overcoming the barriers, since the opposition was a local problem.
A lack of communication between all stakeholders was stated as another reason for delay. A European coordinator to promote dialogue between stakeholder as described in Art. 6 of the TEN-E regulation has not been designated so far.
The interviewed stakeholders see a need for alignment of the permit granting procedures of the EU Member States.
To improve the communication between project promoters, NRAs and competent authorities, the interviewees see a meeting of all relevant stakeholders as helpful to identify and solve constraints. However, they see no need for an explicit regulation to set the terms for such meetings.
The project falls under the scope of Art. 19 “transitional provision” of the TEN-E regulation and therefore Article 7 to 10, covering the organisation, duration and implementation of the permit granting process and transparency and public participation, do not apply for this project.
PCI cluster 3.8 Cluster 3.8 describes the interconnection between Bulgaria and Romania and consists of three projects. The 2nd Union list includes PCIs 3.8.1, 3.8.4 and 3.8.5, which are all internal lines. The case study focuses on the delayed projects, which are 3.8.1 an internal line in Bulgaria and 3.8.4 an internal line in Romania.
PCI 3.8.1
3.8.1 Internal line between Dobrudja and Burgas (BG) Project promoters Elektroenergien sistemen operator (ESO) EAD
Technical information Construction of a new 400kV AC single-circuit line (OHL) of 140 km and with a capacity of 1700 MVA connecting Varna and Burgas.
Current status Permitting
Current progress Delayed
Expected year of commissioning
2021
Delay since 2012 5 years
Information on progress In 2014 ESO was unbundled from the National Electricity Company (NEK).
The preliminary detailed design has been finalised and is currently coordinated with the relevant institutions. The field surveys for the EIA on the project have been implemented. The Terms of Reference for the Scope and Content of the EIA are prepared and submitted for approval to the Ministry of Environment and Waters, Bulgaria.
A draft amendment to the Bulgarian Energy Act, regarding the land acquisition has been submitted to the Ministry of Energy.
CEF funding has been granted in July 2016.
Table 22: PCI 3.8.1 (based on ACER 2016 PCI implementation monitoring report, personal interviews)

EASTNSI/4NT/0512397/000/02 2017 02 16 72/74
This
doc
umen
t is
the
prop
erty
of T
ract
ebel
Eng
inee
ring
S.A
. Any
dup
licat
ion
or tr
ansm
issi
on to
third
par
ties
is fo
rbid
den
with
out p
rior w
ritte
n ap
prov
al
In 2014 ESO EAD became the owner of the Bulgarian transmission grid as it was unbundled from the National Electricity Company. The unbundling process and financial difficulties have been reported as the major barriers which led to a delay of five years. During the unbundling process the project was put on hold because of organisational changes.
Several factors caused the financial issues of the project. Firstly, the high cost of construction led to a low rate of return. Secondly, in Bulgaria, half of the electricity market prices are still regulated and an increase of infrastructure investment costs can not completely be forwarded to society. Moreover the delay increased the costs and the financial gap. However, the financial barrier could be solved with the granting of CEF funding in July 2016. As an effect, the expected year of commissioning has been rescheduled from 2022 to 2021.
Other barriers have been the changes in planning data (location of the substation changed from Dobrudja to Varna) and the complexity of land acquisition and permitting procedures. Since the TEN-E regulation does not provide specific measures regarding the land expropriation, ESO submitted a draft amendment regarding the acceleration of procedures for the acquisition of property rights to the Ministry of Energy in Bulgaria. Procedures for land acquisition prior to the receiving of construction permission is generally complex and time consuming.
Communication between the national ministry and the EC could help speeding up the procedure, since the progress of the project is only dependent on the decision on the draft amendment.
5.1.1.1. PCI 3.8.4
3.8.4 – Internal line between Cernavoda and Stalpu (RO) Project promoters CNTEE TRANSELECTRICA SA
Technical information A new 400 kV AC OHL double circuit of 159 km and with a capacity of 2x1380 MVA shall be built between the 400 kV substation Cernavoda and the existing 220/110 kV Stalpu substation.
The Stalpu substation shall be upgraded to 400/110 kV. One of the two circuits shall be connected in-out to the 400 kV substation Gura Ialomitei, situated in the vicinity of the new line.
Current status Permitting
Current progress Delayed
Expected year of commissioning
2020
Delay since 2012 3 years
Information on progress There is an ongoing permitting procedure for the acquisition of land. The required files regarding land expropriation were submitted to the Ministry of Economy.
Table 23: PCI 3.8.4 (based on ACER 2016, personal interviews)
PCI 3.8.4 is currently in the permitting phase and experiencing delays caused by an ongoing permitting procedure for the acquisition of land and difficulties related to the EIA.
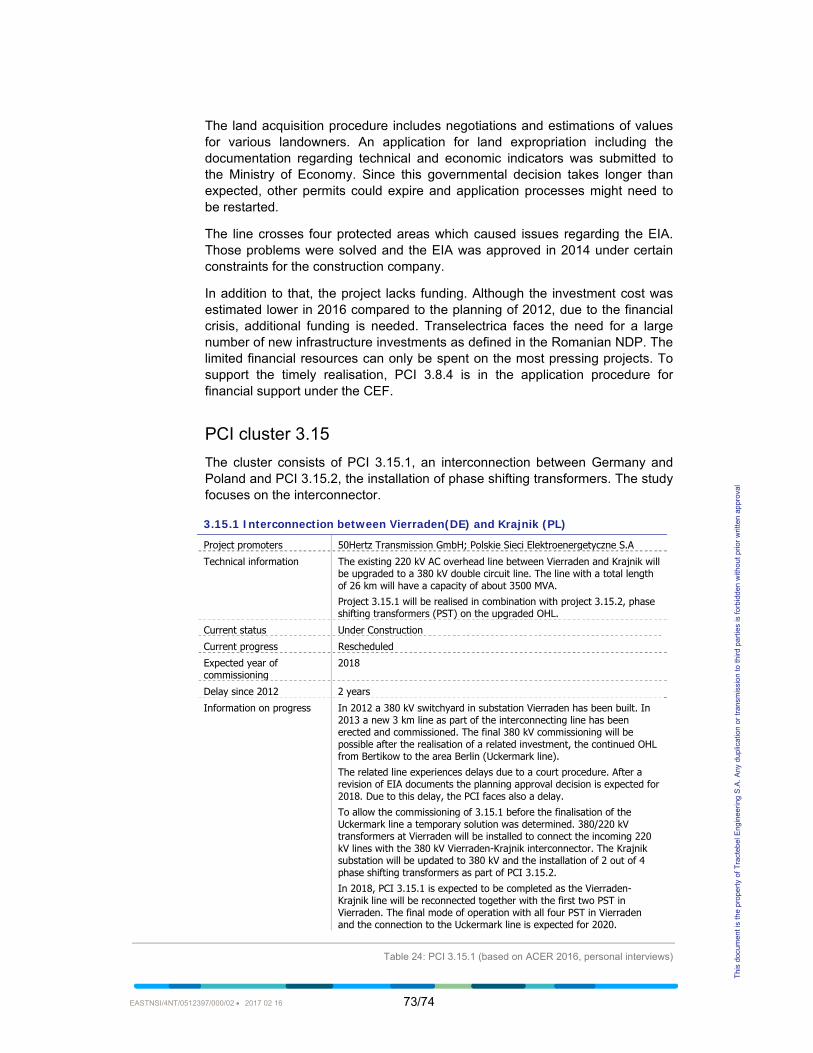
EASTNSI/4NT/0512397/000/02 2017 02 16 73/74
This
doc
umen
t is
the
prop
erty
of T
ract
ebel
Eng
inee
ring
S.A
. Any
dup
licat
ion
or tr
ansm
issi
on to
third
par
ties
is fo
rbid
den
with
out p
rior w
ritte
n ap
prov
al
The land acquisition procedure includes negotiations and estimations of values for various landowners. An application for land expropriation including the documentation regarding technical and economic indicators was submitted to the Ministry of Economy. Since this governmental decision takes longer than expected, other permits could expire and application processes might need to be restarted.
The line crosses four protected areas which caused issues regarding the EIA. Those problems were solved and the EIA was approved in 2014 under certain constraints for the construction company.
In addition to that, the project lacks funding. Although the investment cost was estimated lower in 2016 compared to the planning of 2012, due to the financial crisis, additional funding is needed. Transelectrica faces the need for a large number of new infrastructure investments as defined in the Romanian NDP. The limited financial resources can only be spent on the most pressing projects. To support the timely realisation, PCI 3.8.4 is in the application procedure for financial support under the CEF.
PCI cluster 3.15 The cluster consists of PCI 3.15.1, an interconnection between Germany and Poland and PCI 3.15.2, the installation of phase shifting transformers. The study focuses on the interconnector.
3.15.1 Interconnection between Vierraden(DE) and Krajnik (PL) Project promoters 50Hertz Transmission GmbH; Polskie Sieci Elektroenergetyczne S.A
Technical information The existing 220 kV AC overhead line between Vierraden and Krajnik will be upgraded to a 380 kV double circuit line. The line with a total length of 26 km will have a capacity of about 3500 MVA.
Project 3.15.1 will be realised in combination with project 3.15.2, phase shifting transformers (PST) on the upgraded OHL.
Current status Under Construction
Current progress Rescheduled
Expected year of commissioning
2018
Delay since 2012 2 years
Information on progress In 2012 a 380 kV switchyard in substation Vierraden has been built. In 2013 a new 3 km line as part of the interconnecting line has been erected and commissioned. The final 380 kV commissioning will be possible after the realisation of a related investment, the continued OHL from Bertikow to the area Berlin (Uckermark line).
The related line experiences delays due to a court procedure. After a revision of EIA documents the planning approval decision is expected for 2018. Due to this delay, the PCI faces also a delay.
To allow the commissioning of 3.15.1 before the finalisation of the Uckermark line a temporary solution was determined. 380/220 kV transformers at Vierraden will be installed to connect the incoming 220 kV lines with the 380 kV Vierraden-Krajnik interconnector. The Krajnik substation will be updated to 380 kV and the installation of 2 out of 4 phase shifting transformers as part of PCI 3.15.2.
In 2018, PCI 3.15.1 is expected to be completed as the Vierraden-Krajnik line will be reconnected together with the first two PST in Vierraden. The final mode of operation with all four PST in Vierraden and the connection to the Uckermark line is expected for 2020.
Table 24: PCI 3.15.1 (based on ACER 2016, personal interviews)

EASTNSI/4NT/0512397/000/02 2017 02 16 74/74
This
doc
umen
t is
the
prop
erty
of T
ract
ebel
Eng
inee
ring
S.A
. Any
dup
licat
ion
or tr
ansm
issi
on to
third
par
ties
is fo
rbid
den
with
out p
rior w
ritte
n ap
prov
al
The central reason for the delay of the project is the dependence on the realisation of a related investment. The interconnecting line cannot operate with 380 kV as long as the construction of the 380 kV so called “Uckermark line” from Bertikow via Vierraden to Neuenhagen has not been completed. All barriers discussed occurred on this related line but are directly affecting the progress of the PCI.
An appeal against the planning approval decision of the Uckermark line was lodged in 2014 followed by a judgment in January 2016, implicating the rejection of the planning approval decision. The Nature and Biodiversity Conservation Union (NABU) was the main plaintiff in a group action against the granted permit. The project was criticised for the neglect of bird protection and for not considering alternative routes for the line. Since the Uckermark line is an upgrade of an already existing line, the complaints were not expected by the project promoter. While the route of the line has been approved by the court, a revision of the EIA regarding bird protection is necessary. The decision for the updated EIA is expected for the third quarter of 2017.
Stakeholders criticised in the interviews that environmental documentation often lacks in-depth knowledge, because projects of national interest are expected to be proceeded quickly. Moreover, it has been criticised that on EU level indicators to evaluate environmental impact of multiple projects are not always suitable, e.g. environmental impact should not be measured by the length of the area that is crossed, because such an indicator does not regard the specific properties of the areas. Alternative technical solutions should not be dismissed preliminary but discussed for every project individually.
As the barriers do not appear in the PCI itself, possible actions based on the TEN-E regulation are limited. Furthermore the project falls under the scope of Art. 19 “transitional provision” of the TEN-E regulation.
The experiences of the stakeholders of this project show that a clear process for the involvement of the public in the planning is essential to avoid delays at a late stage of the permitting phase. Early involvement of stakeholders as part of a project implementation plan also gives more security from the promoter’s perspective.