Embed Size (px)
Citation preview
Details
Lesson Antarctic About 1 period Download, Share, and Remix Middle School and Up
NASA SOHO (https://soho.nascom.nasa.gov/classroom/for_students.html)
Materials
Sunspot Images
Standards
b. Position and motion of objectsc. Light, heat, electricity, and magnetismb. Objects in the skyc. Changes in earth and skyb. Understandings about science andtechnology
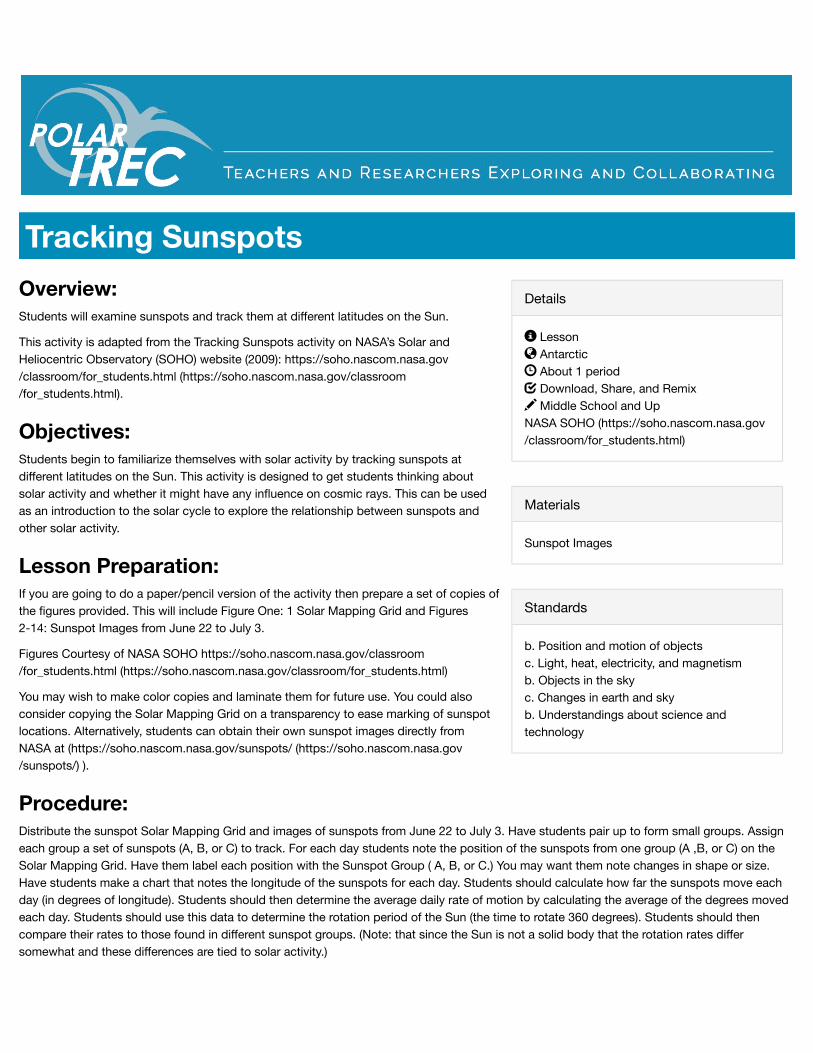
Tracking SunspotsOverview:Students will examine sunspots and track them at different latitudes on the Sun.
This activity is adapted from the Tracking Sunspots activity on NASA’s Solar andHeliocentric Observatory (SOHO) website (2009): https://soho.nascom.nasa.gov/classroom/for_students.html (https://soho.nascom.nasa.gov/classroom/for_students.html).
Objectives:Students begin to familiarize themselves with solar activity by tracking sunspots atdifferent latitudes on the Sun. This activity is designed to get students thinking aboutsolar activity and whether it might have any influence on cosmic rays. This can be usedas an introduction to the solar cycle to explore the relationship between sunspots andother solar activity.
Lesson Preparation:If you are going to do a paper/pencil version of the activity then prepare a set of copies ofthe figures provided. This will include Figure One: 1 Solar Mapping Grid and Figures2-14: Sunspot Images from June 22 to July 3.
Figures Courtesy of NASA SOHO https://soho.nascom.nasa.gov/classroom/for_students.html (https://soho.nascom.nasa.gov/classroom/for_students.html)
You may wish to make color copies and laminate them for future use. You could alsoconsider copying the Solar Mapping Grid on a transparency to ease marking of sunspotlocations. Alternatively, students can obtain their own sunspot images directly fromNASA at (https://soho.nascom.nasa.gov/sunspots/ (https://soho.nascom.nasa.gov/sunspots/) ).
Procedure:Distribute the sunspot Solar Mapping Grid and images of sunspots from June 22 to July 3. Have students pair up to form small groups. Assigneach group a set of sunspots (A, B, or C) to track. For each day students note the position of the sunspots from one group (A ,B, or C) on theSolar Mapping Grid. Have them label each position with the Sunspot Group ( A, B, or C.) You may want them note changes in shape or size.Have students make a chart that notes the longitude of the sunspots for each day. Students should calculate how far the sunspots move eachday (in degrees of longitude). Students should then determine the average daily rate of motion by calculating the average of the degrees movedeach day. Students should use this data to determine the rotation period of the Sun (the time to rotate 360 degrees). Students should thencompare their rates to those found in different sunspot groups. (Note: that since the Sun is not a solid body that the rotation rates differsomewhat and these differences are tied to solar activity.)
✏
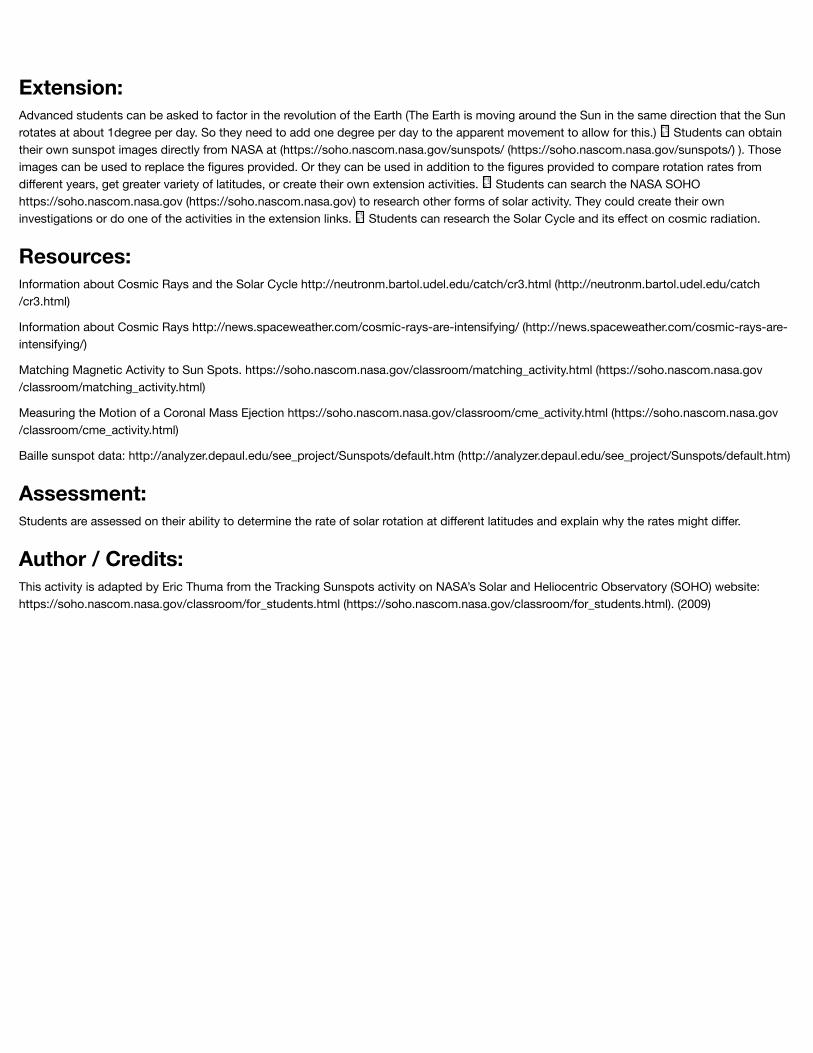
Extension:Advanced students can be asked to factor in the revolution of the Earth (The Earth is moving around the Sun in the same direction that the Sunrotates at about 1degree per day. So they need to add one degree per day to the apparent movement to allow for this.) Students can obtaintheir own sunspot images directly from NASA at (https://soho.nascom.nasa.gov/sunspots/ (https://soho.nascom.nasa.gov/sunspots/) ). Thoseimages can be used to replace the figures provided. Or they can be used in addition to the figures provided to compare rotation rates fromdifferent years, get greater variety of latitudes, or create their own extension activities. Students can search the NASA SOHOhttps://soho.nascom.nasa.gov (https://soho.nascom.nasa.gov) to research other forms of solar activity. They could create their owninvestigations or do one of the activities in the extension links. Students can research the Solar Cycle and its effect on cosmic radiation.
Resources:Information about Cosmic Rays and the Solar Cycle http://neutronm.bartol.udel.edu/catch/cr3.html (http://neutronm.bartol.udel.edu/catch/cr3.html)
Information about Cosmic Rays http://news.spaceweather.com/cosmic-rays-are-intensifying/ (http://news.spaceweather.com/cosmic-rays-are-intensifying/)
Matching Magnetic Activity to Sun Spots. https://soho.nascom.nasa.gov/classroom/matching_activity.html (https://soho.nascom.nasa.gov/classroom/matching_activity.html)
Measuring the Motion of a Coronal Mass Ejection https://soho.nascom.nasa.gov/classroom/cme_activity.html (https://soho.nascom.nasa.gov/classroom/cme_activity.html)
Baille sunspot data: http://analyzer.depaul.edu/see_project/Sunspots/default.htm (http://analyzer.depaul.edu/see_project/Sunspots/default.htm)
Assessment:Students are assessed on their ability to determine the rate of solar rotation at different latitudes and explain why the rates might differ.
Author / Credits:This activity is adapted by Eric Thuma from the Tracking Sunspots activity on NASA’s Solar and Heliocentric Observatory (SOHO) website:https://soho.nascom.nasa.gov/classroom/for_students.html (https://soho.nascom.nasa.gov/classroom/for_students.html). (2009)
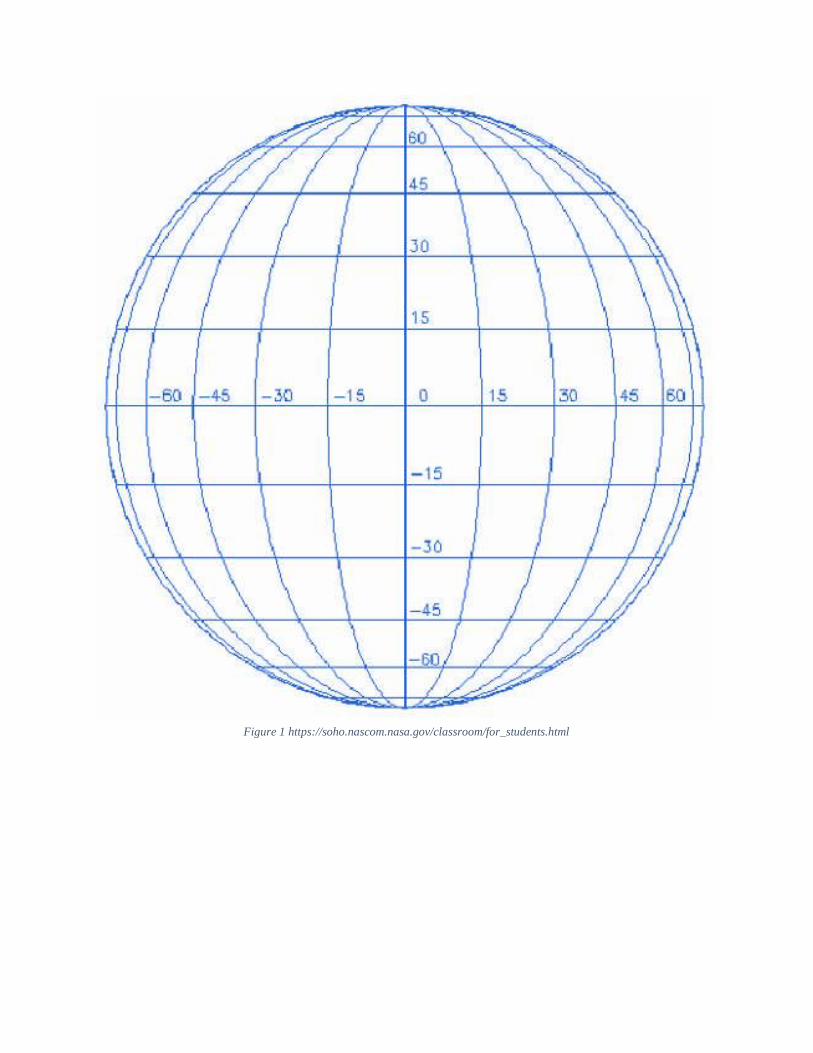
Figure 1 https://soho.nascom.nasa.gov/classroom/for_students.html

Figure 2 https://soho.nascom.nasa.gov/classroom/for_students.html

Figure 3 https://soho.nascom.nasa.gov/classroom/for_students.html

Figure 4 https://soho.nascom.nasa.gov/classroom/for_students.html
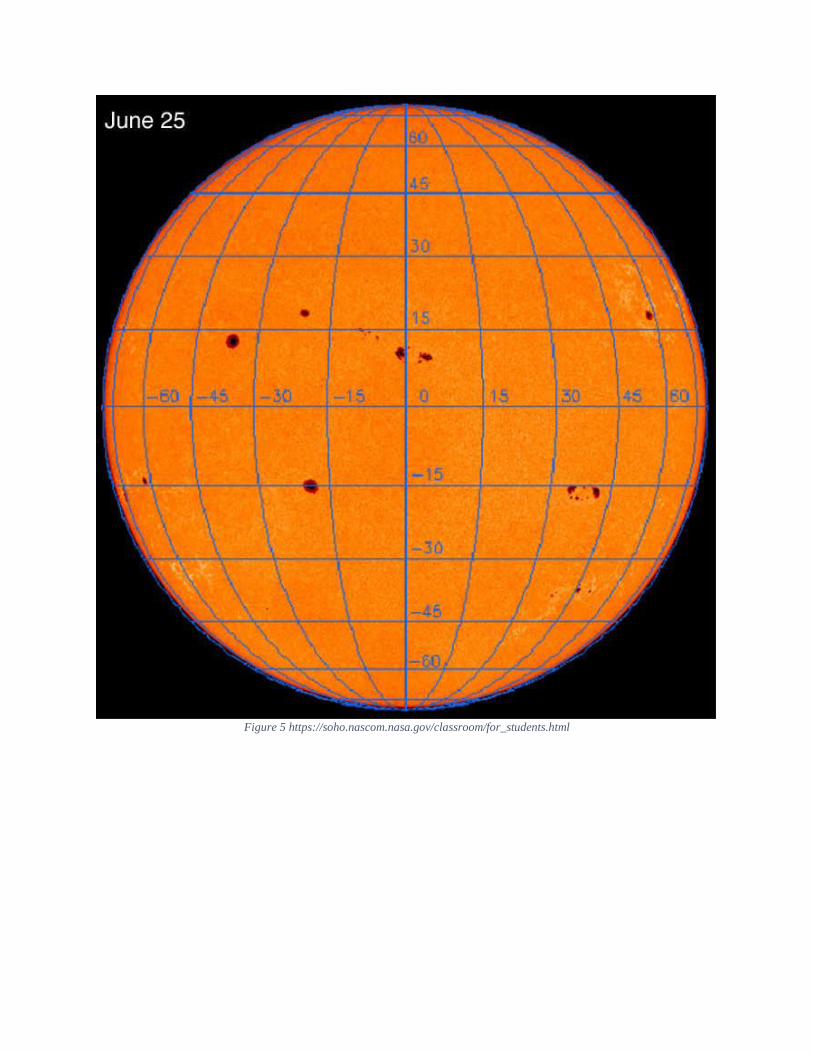
Figure 5 https://soho.nascom.nasa.gov/classroom/for_students.html
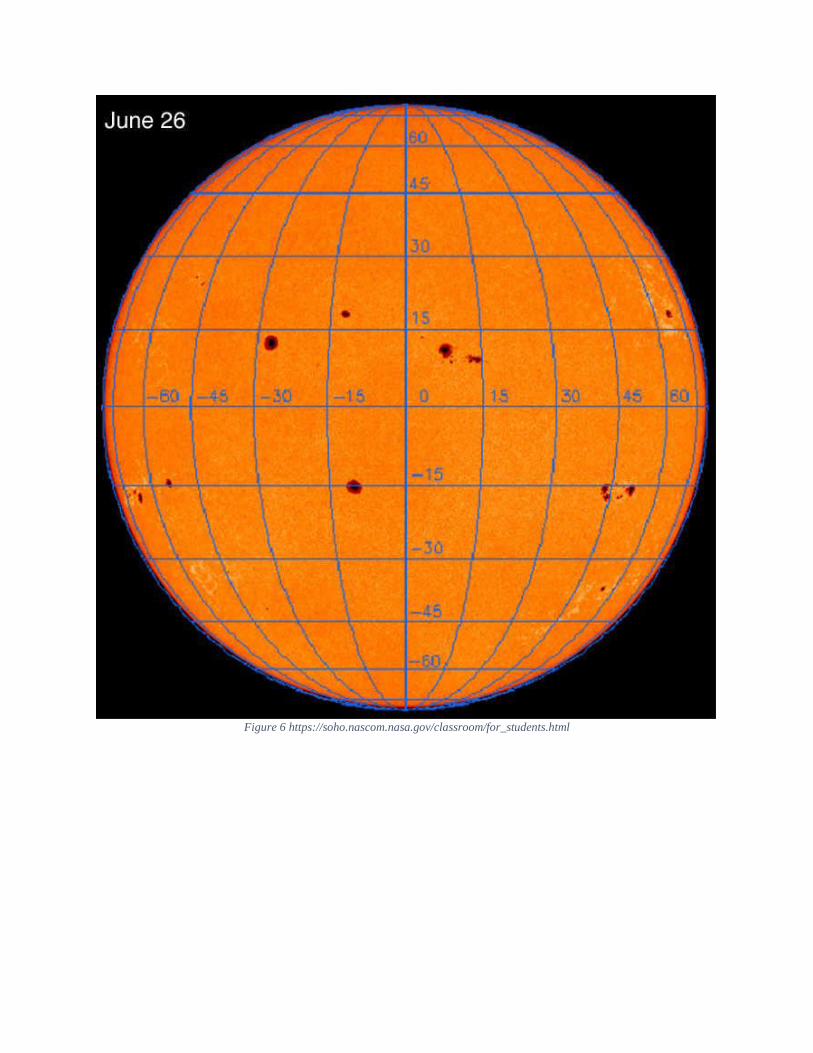
Figure 6 https://soho.nascom.nasa.gov/classroom/for_students.html
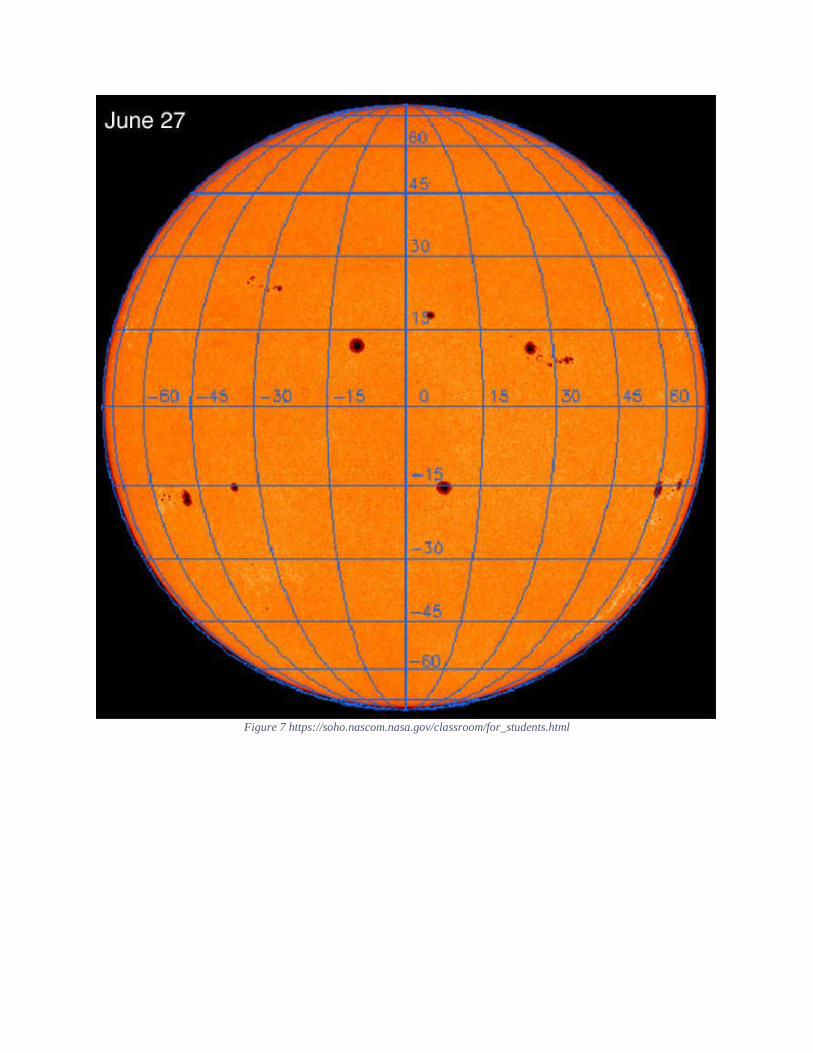
Figure 7 https://soho.nascom.nasa.gov/classroom/for_students.html
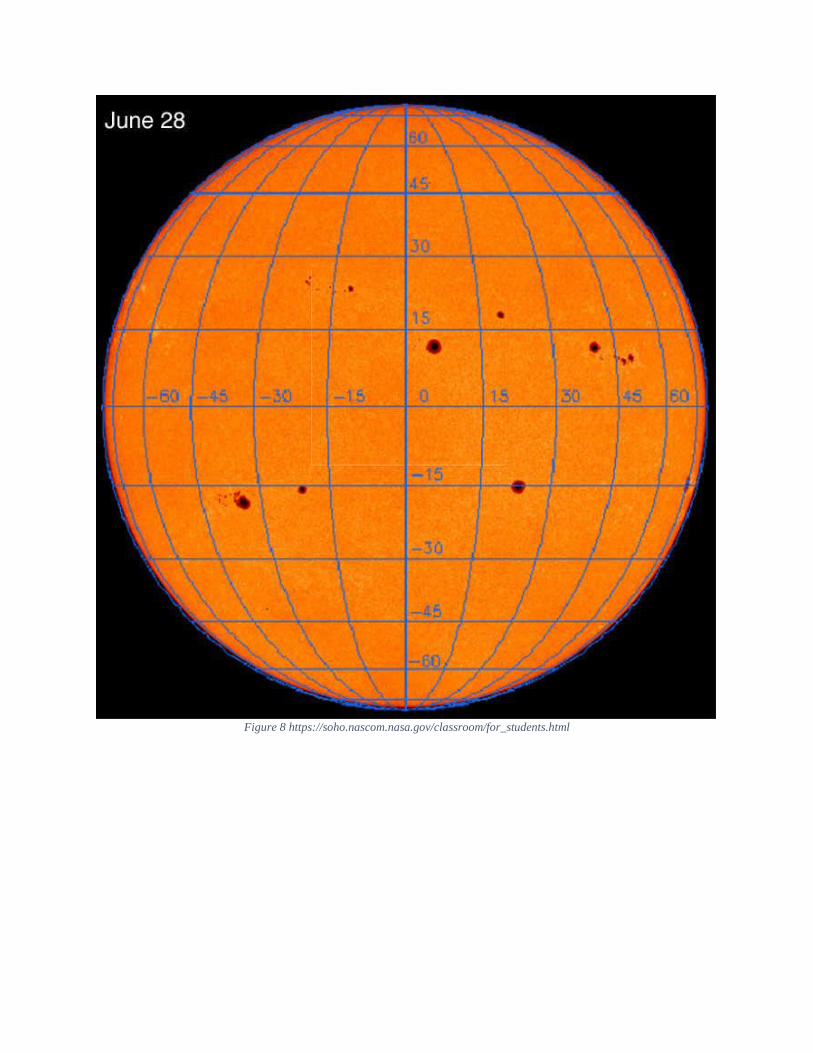
Figure 8 https://soho.nascom.nasa.gov/classroom/for_students.html
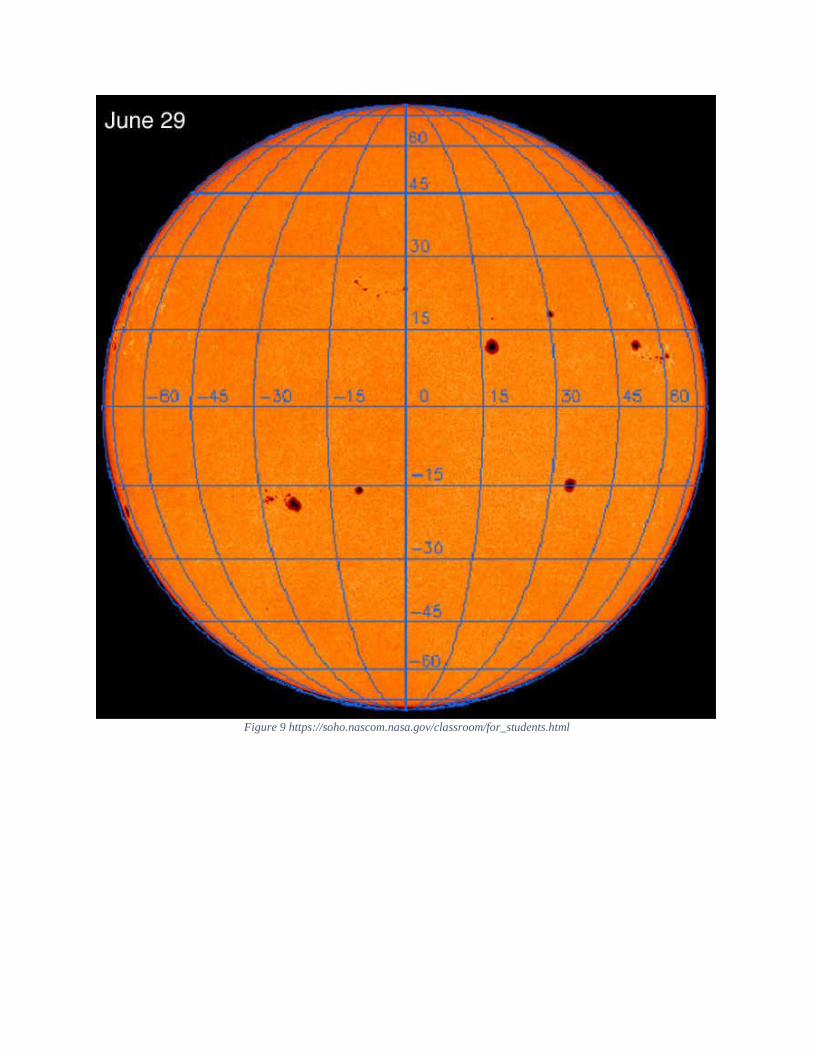
Figure 9 https://soho.nascom.nasa.gov/classroom/for_students.html

Figure 10 https://soho.nascom.nasa.gov/classroom/for_students.html
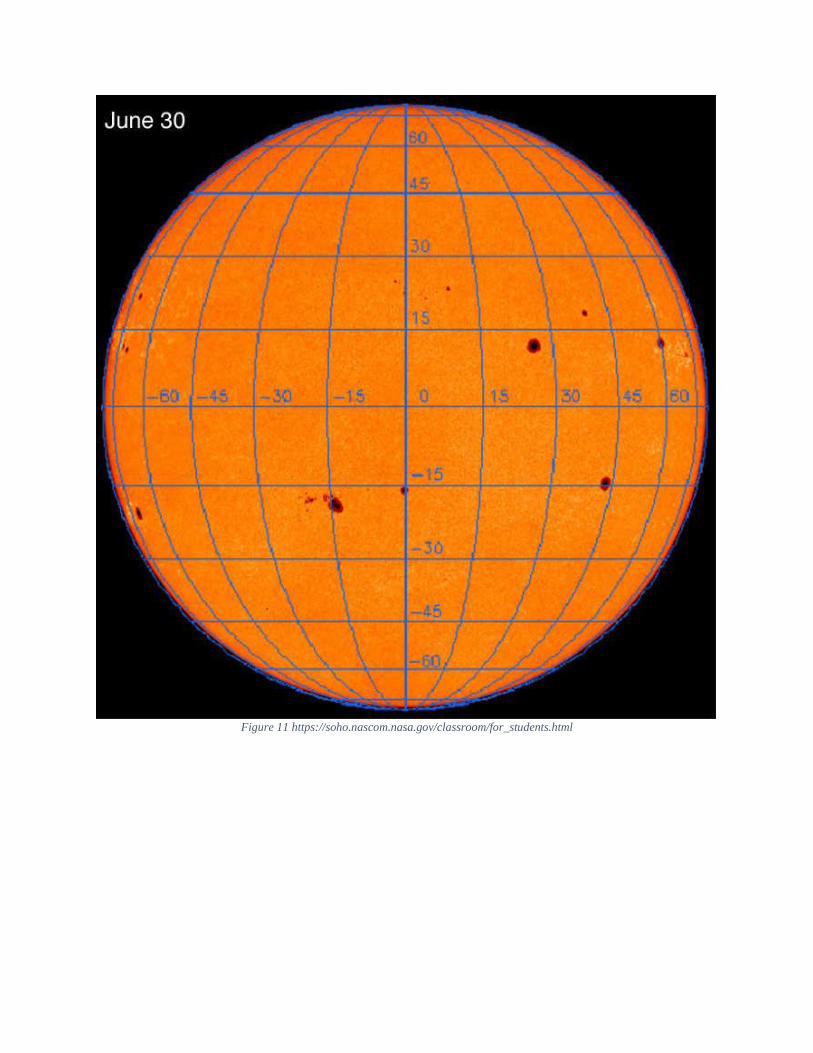
Figure 11 https://soho.nascom.nasa.gov/classroom/for_students.html
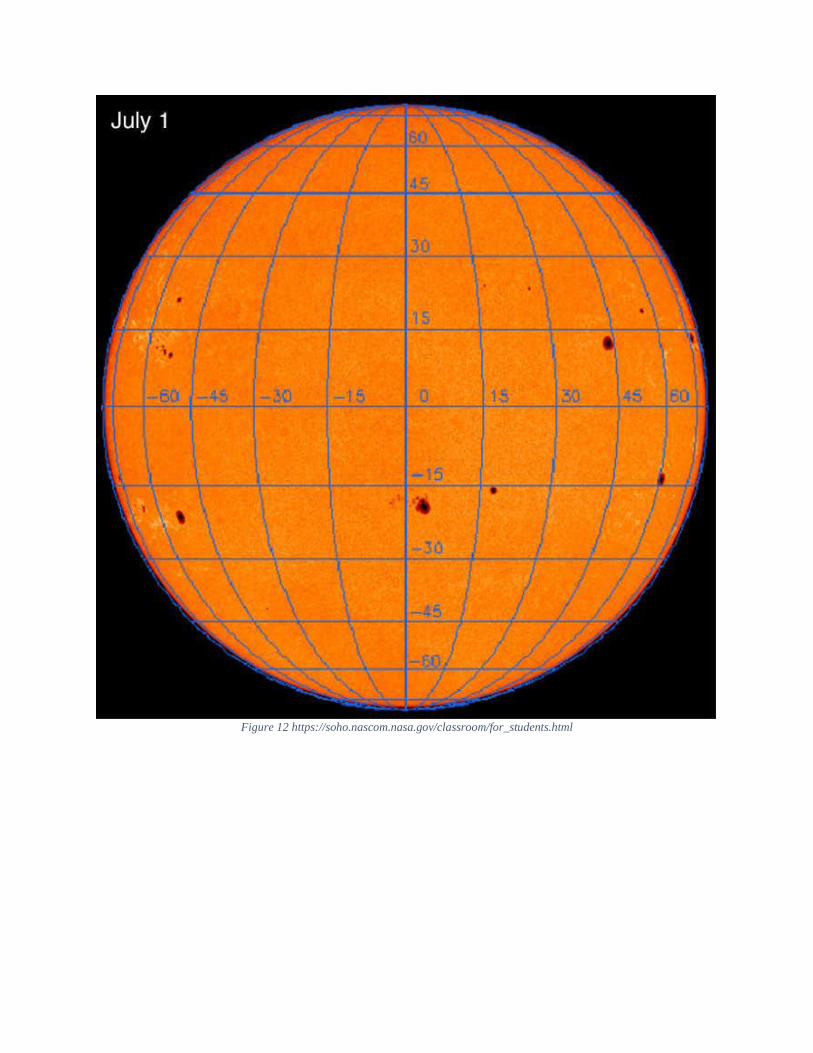
Figure 12 https://soho.nascom.nasa.gov/classroom/for_students.html
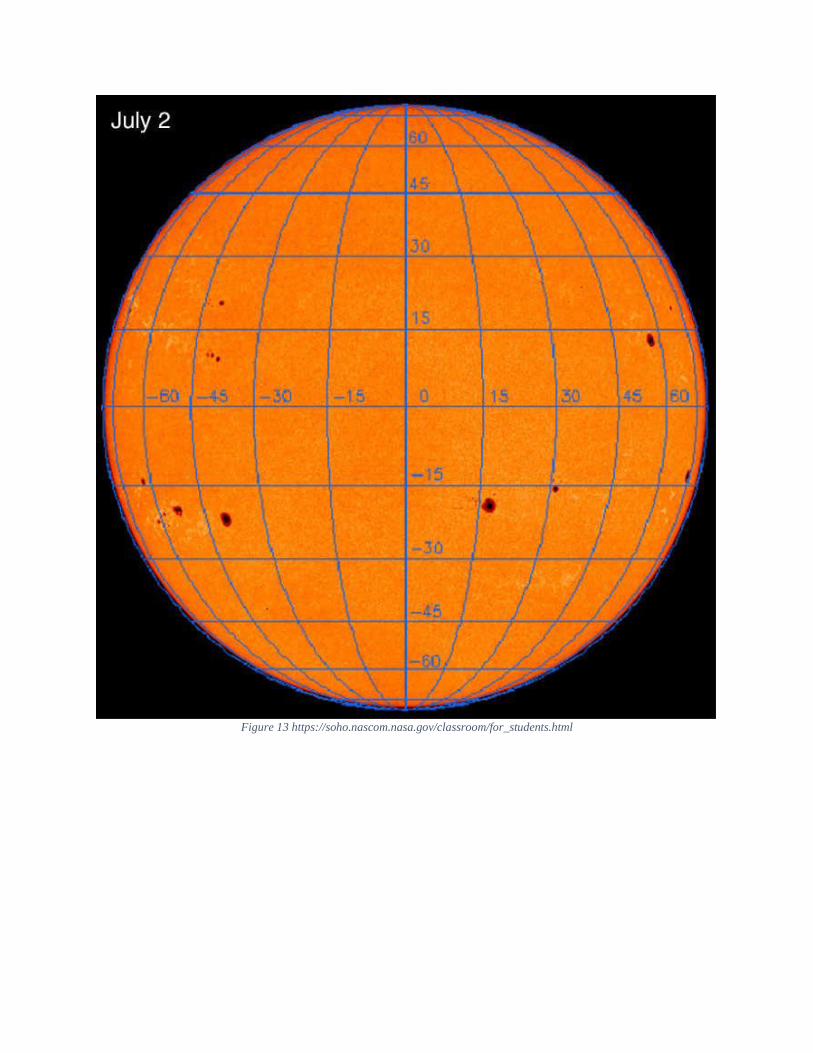
Figure 13 https://soho.nascom.nasa.gov/classroom/for_students.html
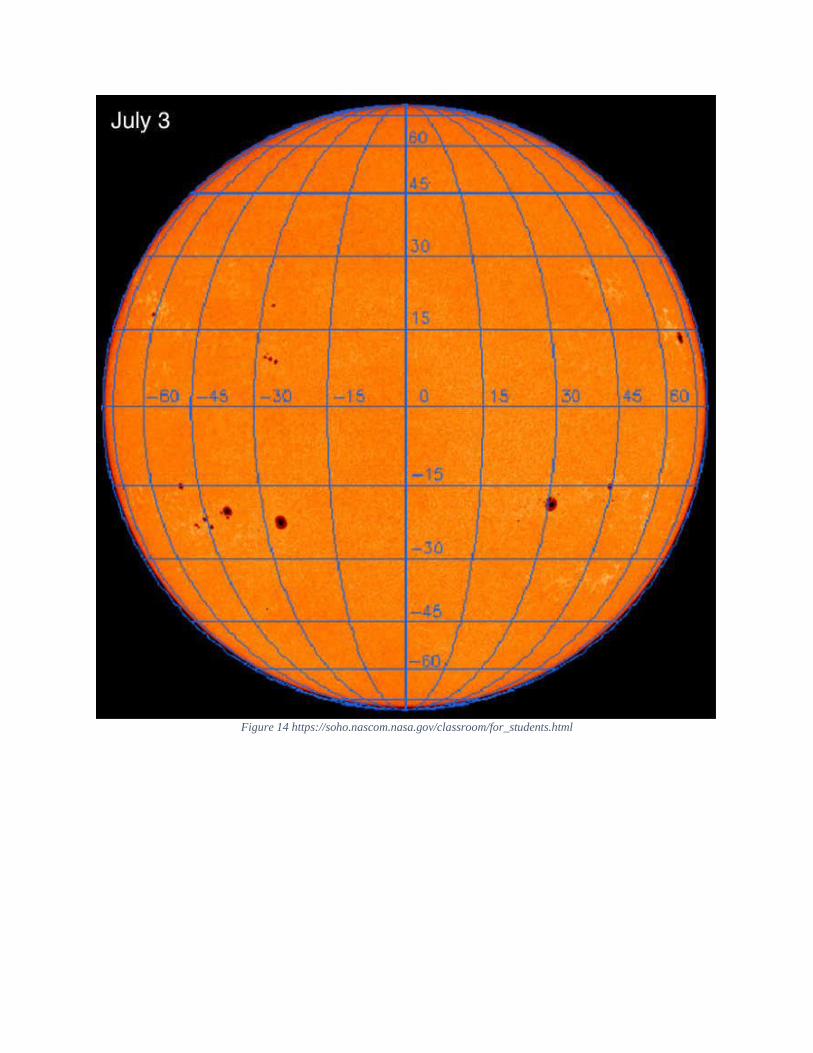
Figure 14 https://soho.nascom.nasa.gov/classroom/for_students.html