Embed Size (px)
Citation preview
TRACEABILITY TO FARM & FACTORY,
COUNTRY OF MANUFACTURING,
AND APPAREL PURCHASE SCENARIO
A Thesis Submitted to
Faculty of the Graduate School at the
University of Missouri in
Partial Fulfillment of the Requirements for the
Degree of Master of Science
by
Saheli Goswami
Dr. Pamela S. Norum, Thesis Supervisor
July 2014
APPROVAL PAGE
The undersigned, appointed by the dean of the Graduate School, have examined the
Thesis entitled:
TRACEABILITY TO FARM & FACTORY, COUNTRY OF MANUFACTURING,
AND APPAREL PURCHASE INTENTION
Presented by
Saheli Goswami
A candidate for the degree of
Masters of Science
And hereby certify that, in their opinion, it is worthy of acceptance.
________________________________________________________
Dr. Pamela S. Norum
_________________________________________________________
Dr. Jung E. Ha- Brookshire
_________________________________________________________
Dr. Glenn Leshner

To my parents:
thank you for believing in me.

ii
ACKNOWLEDGEMENTS
I thank the Almighty God for the wisdom, perseverance, and strength during this
thesis research, and indeed throughout my life. I praise Him for giving me a free-
spirit, and encouraging me to live by my own conventions, but respecting others’
wishes and beliefs.
My cordial thanks to Dr. Pamela Norum, for your thoughtful guidance, valuable
advice, and critical comments during the whole period of study. Indeed, without her
patience, I would not be able to put the topic together.
I will like to thank Dr. Jung Ha-Brookshire and Dr. Glenn Leshner for taking time off
their busy schedule to be on my thesis committee and for the insightful discussions.
I also want to thank my parents for their encouragement, inspiration, and
unconditional support throughout my life. And finally I am deeply thankful to Gargi
Bhaduri for being a great friend, and even a better guide.

iii
TABLE OF CONTENTS
ACKNOWLEDGEMENTS ii
LIST OF TABLES iv
LIST OF FIGURES vi
LIST OF APPENDICES vii
CHAPTER I: INTRODUCTION Background 1
Purpose of the Study 4
Significance of the Study 4
CHAPTER II: LITERATURE REVIEW
Traceability 6
Fiber-Origin 10
Factory-Origin 12
Country of Manufacturing 14
Ad Credibility 16
Attitude towards Advertisement (Webpage) 16
Attitude towards Product 18
Purchase Intention 19
Research Gap, Research Hypothesis, and Conceptual
Model 20
CHAPTER III: RESEARCH METHODOLOGY
Research Design 27 Stimulus Materials 28
Dependent Variables 31 Manipulation Check 32 Data Collection 33 Data Analysis 35
CHAPTER IV: RESULTS
Sample description 36 Scale Reliability 37 ANOVA results 37 Additional Analysis for Gender 47
CHAPTER V: CONCLUSION Summary of the Study 71 Discussion of the Major Findings 73 Contributions and Implications 77 Limitations and Scope of Future Research 81
REFERENCES 83
iv
LIST OF TABLES
Table 2.1. Summary of the Hypotheses 24
Table 3.1. Manipulation Sets for USA 27
Table 3.2. Manipulation Sets for China 28
Table 3.3. Summary of the t-test analysis for manipulation check 33
Table 4.1. Survey Respondents’ Demographic characteristics 38
Table 4.2. Reliability of scales 39
Table 4.3.1. ANOVA for Mean Difference in Ad Credibility 41
Table 4.3.2. Mean and Standard Error of Ad Credibility 41
Table 4.3.3. Mean and Standard Deviation of Ad Credibility based on
Interaction 42
Table 4.3.4 ANOVA for Mean Difference in Attitude towards
Advertisement 42
Table 4.3.5. Mean and Standard Error of Attitude towards
Advertisement 43
Table 4.3.6 Mean and Standard Deviation of Attitude towards Ad due
to interaction 43
Table 4.3.7 ANOVA for Mean Difference in Attitude towards Product 44
Table 4.3.8. Mean and Standard Error of Attitude towards Product 44
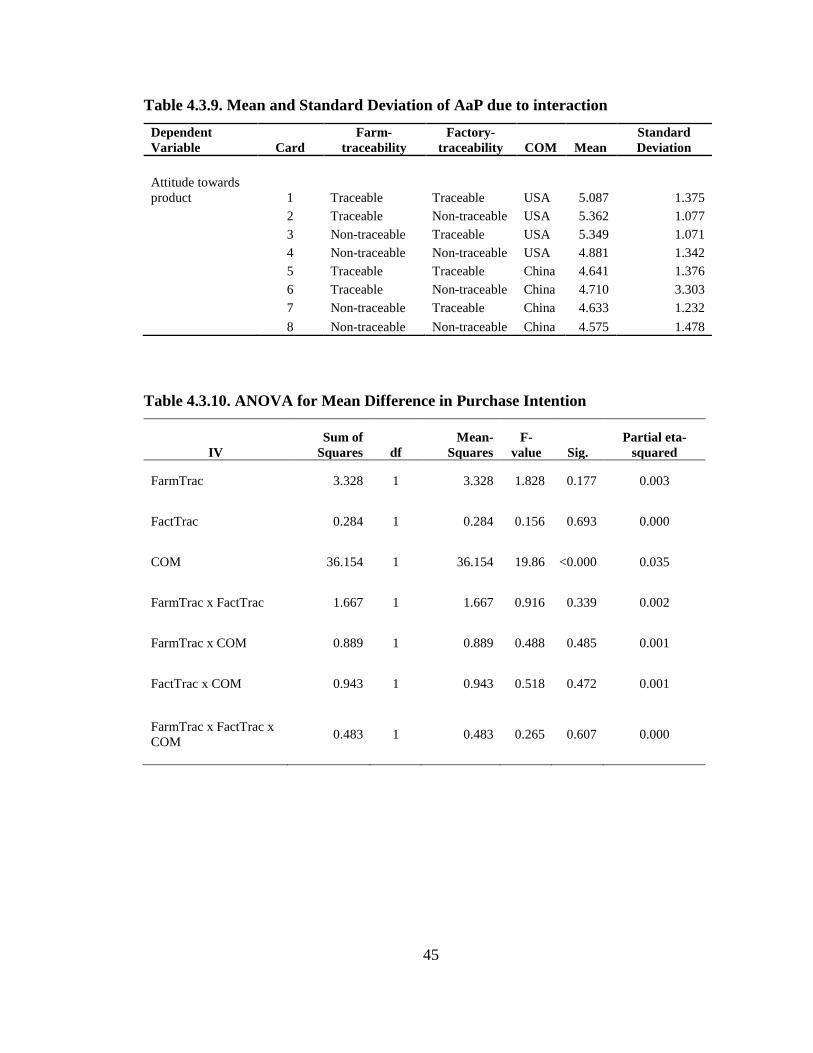
Table 4.3.9. Mean and Standard Deviation of AaP due to interaction 45
Table 4.3.10. ANOVA for Mean Difference in Purchase Intention 45
Table 4.3.11. Mean and Standard Error of Purchase Intention 46
Table 4.3.12. Mean and Standard Deviation of Purchase Intention due
to interaction 46
Table 4.5.1. Independent Sample T-test for male and female
participants 48
Table 4.5.2. ANOVA for Mean Difference in Ad Credibility Due to
Gender 50
Table 4.5.3. Mean and Standard Error of Ad Credibility due to Gender 51
Table 4.5.4. Mean and Standard Error of Ad Credibility due to Gender
interaction 51

v
Table 4.5.5. ANOVA for Mean Difference in AaD Due to Gender 54
Table 4.5.6. Mean and Standard Error of AaD due to Gender 55
Table 4.5.7. Mean and Standard Error of AaD due to Gender
interaction 55
Table 4.5.8. ANOVA for Mean Difference in AaP Due to Gender 59
Table 4.5.9. Mean and Standard Error of AaP due to Gender 59
Table 4.5.10. Mean and Standard Error of AaP due to Gender
interaction (2-way) 60
Table 4.5.11. Mean and Standard Error of AaP due to Gender
interaction (3-way) 60
Table 4.5.12. ANOVA for Mean Difference in PI Due to Gender 64
Table 4.5.13. Mean and Standard Error of PI due to Gender 65
Table 4.5.14. Mean and Standard Error of PI due to Gender interaction
(2-way) 65
Table 4.5.15. Mean and Standard Error of PI due to Gender interaction
(3-way) 66
Table 4.6. Summary of Results 70

vi
LIST OF FIGURES
Figure 2.1. Conceptual Model for Traceability affecting Attitude
towards Advertisement 24
Figure 2.2. Conceptual Model for Traceability affecting Ad
Credibility 25
Figure 2.3. Conceptual Model for Traceability affecting Attitude
towards Product 25
Figure 2.4. Conceptual Model for Traceability affecting Purchase
Intention 26
Figure 4.1. Plot Diagram for Gender Interacting with Factory
Traceability affecting Ad Credibility 52
Figure 4.2. Plot Diagram for Gender Interacting with COM
affecting Ad Credibility 52
Figure 4.3. Plot Diagram for Gender Interacting with Farm
Traceability and Factory Traceability affecting Attitude towards
Webpages 56
Figure 4.4. Plot Diagram for Gender Interacting with Factory
Traceability affecting Attitude towards Product 60
Figure 4.5. Plot Diagram for Gender Interacting with Factory
Traceability and COM affecting Attitude towards Product 61
Figure 4.6. Plot Diagram for Gender Interacting with Factory
Traceability affecting Purchase Intention 67
Figure 4.7. Plot Diagram for Gender Interacting with Farm
Traceability and Factory Traceability affecting Purchase Intention 68
Figure 4.8. Plot Diagram for Gender Interacting with Farm
Traceability and COM affecting Purchase Intention 69

vii
LIST OF APPENDICES
APPENDIX A: SURVEY INSTRUMENTS
Recruitment Script 94
Consent Form 95
Survey 96
Stimuli 101
APPENDIX B: INSTITUTIONAL REVIEW BOARD
DOCUMENTS
IRB Approval 106

viii

1
CHAPTER I: INTRODUCTION
Chapter I contains the following sections (a) background of the study, (b) purpose
of the study, and (c) significance of the study.
Background of the Study
In recent years, traceability, transparency, sustainability and certification have
been emerging issues in the textile and apparel industry. Studies show that consumers are
concerned about their environment and society, and have an increasing demand for
straightforward, transparent products (Bhaduri & Ha-Brookshire, 2011, Flatters &
Willmott, 2009). The popularity and demand for such transparent products are expected
to increase by almost 19% by 2014 (Slavin, 2009). In today’s competitive, turbulent and
highly fragmented business environment (Dickerson 1999, Dyer & Ha-Brookshire,
2008), firms need to consider opportunities for tailoring their products to reach specific
consumers. Traceability provides one such opportunity. Traceability is defined as: “the
ability to trace the history, application or location of that which is under consideration”
(ISO, 2005). Traceable products provide additional assurances that help to build
consumer trust and confidence (Clemens, 2003). Trust, in turns, affects consumers’
purchase intentions (Bhaduri, 2011). With traceable information, consumers feel assured
about the origin, source, and procedures under which a product was produced (Lusk et
al., 2006; van Amstel et al., 2008). This assurance has a strong effect on their purchase
decisions (de Jonge et al., 2008). What started as a movement in the food industry
(Soron, 2009), with consumers’ increasing queries about where their food came from,
who produced it, and what chemicals were sprayed on it, traceability or ‘identity

2
preservation” (Liddell and Bailey, 2001) became a buzzword that is now reaching other
industries.
With respect to other industries, efforts to increase consumer trust through
transparency have begun to emerge in the apparel industry. All American Clothing Co.,
for example provides consumers with a specific “traceability number” to retrieve
information about the US farm where the fibers in its products are sourced from (All
American Clothing Co., 2013) while Levi Corporation informs its customers about the
company’s impact and involvement in environmental initiatives (Clothing traceability,
2013). These recent developments suggest potential benefits to businesses by enhancing
consumer confidence. In an e-commerce environment, a company’s website acts as one
major promotional vehicle contributing to successful business transactions. Thus, in
webpages, businesses might be able to assure their genuineness by providing traceable
information. With details about the fiber origin, and/or where those products have been
manufactured, companies might be expected to be less deceptive in their claims, and be
more cautious about their qualifying claims for textile products. Cotton is particularly
relevant to this discussion regarding both the environment and traceability since it is the
most widely consumed fiber world-wide, and is clearly a popular fiber among consumers
(Cotton Incorporated, 2011). As one of the leading cotton producers in the world, (Cotton
Incorporated, 2010b), the United States is believed to produce cotton that is better in
quality than its competitors, particularly with respect to fiber length (Kadolph, 2007).
Thus, its popularity all over the world has provided U.S. cotton growers with an
economic advantage. The purchase of US cotton is viewed by some US consumers as
saving domestic employment, acting patriotic by buying local, and being socially
3
responsible (Ha-Brookshire & Norum, 2011). Regarding the environmental impact of
cotton in the U.S., farmers and producers are working on reducing the criticized negative
impact of the farming processes, including excessive water consumption and the use of
pesticides (USDA, 2010) making it more sustainable and profitable (Cotton Incorporated,
2010d). With all of these sustainable developments, the involved farmers, and other
stakeholders, might be interested about how consumers perceive their efforts towards
sustainability and how such efforts can be effectively communicated with consumers.
(Norum & Ha-Brookshire, 2011).
Compared to the food industry where locally grown products are quite popular,
fiber producers in the United States face challenges in terms of gaining popularity among
local consumers in USA (Hustvedt & Bernard, 2008). Locally grown commodity fibers
are usually distributed overseas for processing into textiles and apparel, which are then
sold as apparel products produced in a foreign country. U.S. laws require labelling of the
Country of Manufacturing (COM), but doesn’t require labelling of the fiber source in the
product. Thus, there is no incentive or signal provided to consumers regarding the fiber
origin. Very few studies have considered the consumers’ perspective with regard to the
effect of traceability on demand. Given that increased traceability could benefit both
cotton growers and apparel manufacturers, this study will explore traceability regarding
fiber and factory origin, and their effect on consumers’ perceived ad credibility, attitudes
and purchase intention.

4
Purpose of the Study
In clothing and textile industry, previous research has focused on transparency
and its effect on consumers’ attitudes, willingness to pay and purchase intentions. Though
these studies provide a strong theoretical background about consumers’ growing interest
in fiber-origin, farming methods, and country of manufacturing, there is a gap in the
research about how businesses can effectively communicate transparency-related
information to consumers. The purpose of this study is to gain a better understanding of
whether including traceable information about a product can influence consumers during
an apparel purchase scenario. Specifically, this study will examine the effect of
traceability regarding fiber origin, factory origin, and the country of manufacture, on
consumers’ attitude towards apparel advertising, ad credibility, attitude towards product,
and purchase intentions for apparel.
Significance of the Study
The literature review suggests that the completeness of a product’s information is
directly and positively related to consumers’ product and brand preferences (Hiscox and
Smyth, 2007; Hustvedt & Bernard, 2008; Hustvedt & Bernard, 2010). Consumers have
shown a preference for having access to product and company information at the point of
purchasing an apparel product (Bhaduri et al, 2011). Thus, the availability of traceable
information increases assurance about safety and quality, thereby, building consumer
trust and confidence (Clemens, 2003). However, only a few companies have reacted to
the situation. To date, little information is available regarding traceability and apparel
products throughout the supply chain. Consumers still have no means to access and trace
where from the fibers originate, where the apparel is made, and by which firm.
5
Considering the increasing power of traceability, it is important to investigate the effect
of such traceable information on consumers’ attitudes and purchase intentions.
This study is expected to add to the literature on traceability, and COM,
specifically related to apparel acquisition in three ways. First, this study is expected to
contribute to the growing body of traceability literature, applied to the textile and apparel
(T&A) industry. Second, this research will examine importance of traceability about
multiple stages of the supply chain on consumers’ attitudes, perceived credibility and
purchase intentions. It will shed light on whether availability of information about the
supply chain influences consumers’ attitude towards their advertisements, and also the
products. Thus, businesses willing to advertise traceable information may better
understand the importance of such information in business transactions. It will help
businesses gain insight regarding consumer expectations, and thereby, react to them to
create a competitive niche. Third, such information will be particularly relevant to
companies using US cotton and who are also seeking to be more transparent. This will be
helpful to support US cotton farmers as well. Information about their cotton and farms
will better reach consumers through traceability, thus gaining more appreciation and
increased business. Finally, this study caters to consumers’ growing needs about apparel
products. Their various queries about apparel, their source and various processes, as
addressed by businesses through traceability will help to better meet their needs and
demands. Thus this study will help consumers to be well informed with explicit traceable
information about their apparel products.
6
CHAPTER II: LITERATURE REVIEW
The literature review section includes the following: (a) traceability, (b) fiber-
origin/farm traceability, (c) factory-origin/factory traceability, (d) country of
manufacturing (COM), (e) ad credibility, attitude towards the advertisement, attitude
towards the product, purchase intention and (f) research gaps, hypothesis development,
and conceptual model.
Traceability
The importance of traceability in the food supply chain has intensified over time
and has received strict scrutiny. In past decades, events like the mad cow disease crisis,
dioxin in chicken feed, and issues resulting from genetically modified crops, have raised
questions about the importance of traceability in food manufacturing. (Hobbs,
1996; Loader and Hobbs, 1996; Paarlberg, 2002; Palmer, 1996). In the United States,
health concerns like salmonella and E. coli, the desire to protect exports, and qualms
regarding biosecurity vulnerability contributed to the need for traceability (Hoffmann &
Taylor, 2005). Given these factors, consumers became increasingly concerned about food
safety, animal welfare, and the environmental impact of food production methods and
agro-processing (Opera & Mazaud, 2001). These growing concerns among consumers as
well as other stakeholders have led them to demand transparency about food from farm to
plate, leading to the establishment of traceability as an important policy concern in food
quality and safety. It is now considered a requisite in the food industry, with several
nations and companies necessitating it as a compulsory condition for business. The
European Union mandated traceability in January 2005, for all food firms for their
products in different stages of production (Alfaro & Rábade, 2009). In 2003, Wal-mart

7
served notice to its top meat suppliers expecting to receive goods from them supporting
traceability using new technologies (Smith, Tatum, Belk, Scanga, Grandin & Sofos,
2005).
Implementing traceability empowers firms to reinforce consumers’ confidence in
the strength and integrity of their products, their brand value, and to meet global
standards (Smith, Tatum, Belk, Scanga, Grandin & Sofos, 2005). Lee, Han, Nayga, and
Lim (2011), reported that consumers prefer to pay a premium price as high as 39% for
traceable food products over non-traceable ones. Some similar results have been reported
by Dickinson and Bailey (2002), who found that some consumers are willing to pay a
further premium price for traceable products when presented with other valuable
attributes like transparency, reliable information and assurance. By being able to provide
consumers with more information about the origins, production processes and the
ingredients used (Lusk et al., 2006; van Amstel et al., 2008), businesses try to strengthen
consumer confidence. Developing consumer confidence, in turn, plays an important role
in food-related decision making. (Jonge et al., 2008a,b). Ubilava and Foster (2009), found
that some consumers consider traceability equivalent to quality certification. While yet
another study by Loureiro and Umberger (2007), found American consumers regard the
United States Department of Agriculture (USDA) certification with more significance
than traceable information or country of origin information in food and agriculture.
Similar studies related to the clothing and textile industry by Hustvedt and Bernard
(2008), and Hustvedt, Peterson & Chen (2008) have shown that including information
about fiber attributes helps consumers to better identify with products, thereby, creating a
more favorable attitude.
8
Traceability acts as a tool of containment and protection for developing and less
bric countries, as they face increased scrutiny compared to developed nations (Popper,
2007). In situations where it is difficult for consumers to judge the value and safety of a
product through its appearance alone, traceability guides them through the ‘credence
factors’ which consumers cannot otherwise experience at the point of sale, thereby,
increasing their confidence (Hobbs et al., 2005; Golan et al., 2002; Moe, 1998; Resende-
Filho & Buhr, 2007). Since the supply chain of global products includes numerous small
processes at widely separated places, there is hidden geography in the production process
(Popper, 2007). The knowledge of processes, and their impact on the environment,
assures consumers about aspects that might otherwise not be revealed. Hence, the ability
to offer a traceable record can bring customers a few steps closer to being confident in
product choices. Olsen and Borit (2013), have suggested that a potential benefit of
traceable products is an increased competitive advantage, beyond the standard desired
intrinsic product attributes like price, quality, convenience, and brand name, traceability
also relates to sustainability, ethics and low environmental impact. (Olsen & Borit, 2013).
Considering the literature from the food industry, it can be expected that using traceable
information as a signal for the fiber origin assures consumers about the genuineness of
fiber quality or authenticity. Golan et al. (2004) showed how US food firms, by
implementing traceability, created a better managed system, ensured quality over
competitors, and guaranteed greater safety to consumers. Becker (2000) and Wall (1994)
also reported that traceability was a quality signal in the food industry. Due to the
asymmetric information shared between producers and consumers (Akerlof, 1970),
initiatives are taken by manufacturers seeking to signal (Spence, 1973) its assimilation of

9
the quality and safety features into a product. Thus, to identify and trace information flow
in a convenient manner, signaling mechanisms such as labels and certifications are used
(Talamini, & Malafaia, 2006).
In an e-commerce environment, information shared via various promotional
vehicles, such as webpages and advertisements, act as similar signaling mechanism.
Since lack of trustworthiness has been noted as an issue in e-commerce transactions,
researchers have highlighted the importance of providing transparent cues to enhance
stakeholders’ confidence (Riegelsberger, Sasse, and McCarthy, 2003). Information
available on company’s webpages can provide such cues while helping in consumers’
search for information. Thus, in webpages, businesses might be able to assure their
genuineness with traceable information. Including traceable information might also be
helpful for reducing the growing cases of deceptions. Recent incidents of deceptive
advertisements by Macy’s Inc. and Amazon about contradictory fiber claims, or claims
without qualifications, are specific examples to refer. In the food industry, the EU
government failed to provide detailed information about food and their processing during
the outbreak of bovine spongiform encephalopathy (BSE)2, which increased doubts about
food transparency and traceability (Baines and Davis, 1998). This resulted in urgent
development of the traceable system which is now being extensively used to present a
vivid record of all stages of a product from farm to development. This also helped to easy
track products and their supply chain during product recalls (Dickinson & Bailey, 2002).
Including traceable information may help companies to provide more qualifying details
to track a product, which otherwise is difficult. Thus this can be expected to reduce the
10
deceptive claims, alerting businesses to be more cautious about their claims for textile
products.
Like the food literature, recent research in textile and apparel (T&A) literature,
suggests consumers are concerned about how and where apparel products are made, and
want easily comprehensible transparent information (Bhaduri & Ha-Brookshire, 2011;
Norum & Ha-Brookshire, 2011). As studied by Slavin (2009), the market of consumers
seeking transparent information is expected to increase by almost 19% by 2014. Hustvedt
and Dickson (2009) studied consumers’ preferences regarding fiber content, and how
such knowledge affects their purchase decisions. Hustvedt and Bernard (2008) reported
of consumer preferences varying with products’ fiber content and production methods.
Almost 30% of one US sample was identified as showing their preference for US cotton
that was transparently grown (Ha-Brookshire & Norum, 2011). Previous research found
price to be an overriding attribute for any consumer when making a purchase decision
(Ha-Brookshire & Norum, 2011). Hustvedt and Bernard (2008, 2010) reported
consumers’ preference and willingness to pay for products when available with detailed
product information. Bhaduri and Ha-Brookshire (2011) showed consumers’ interest for,
not only transparent information, but also for accessible and reliable attributes of such
information. Thus, the prior research has shown a consumer desire for traceable
information that may affect their purchase behavior.
Fiber Origin/Farm traceability
Some consumers may be enthusiastic to obtain products specifically made by
domestic firms, using locally grown fibers, and local manufacturing skills to help support
domestic societies and the national economy (Ha-Brookshire, 2012). Prior research by

11
Nagashlma (1970), and Lillis and Narayana (1974) have shown that people are more
inclined to buy products from their own country. Their study on US and Japanese
consumers confirmed that consumers from both places had biased preferences for
domestically produced goods. Similar findings have been reported by Bannister and
Saunders (1978) about English consumers. Though, over time, most products have
shifted to be multi-national in origin, researchers have still reported similar biases in
today’s globalization age (Ha-Brookshire & Norum, 2011). Fueled by environmental
concerns (Kingsolver, 2007), after the 2009 economic downturn, indicated that the
“local” movement gained strength by stressing the power of supporting local enterprises.
(Norum & Ha-Brookshire, 2011). Bruwer and Johnson (2010) reported how people are
eager to know about where products come from, and are willing to support local farm
grown products. This trend is especially strong in the food industry where wineries and
other business use local regions to enhance more brand popularity (Norum & Ha-
Brookshire, 2011). Many U.S. consumers, seeking to help the domestic economy,
perceive their preference for the local movement as exhibiting their social responsibility
(Ha-Brookshire & Norum, 2011). Interestingly, previous research shows that consumers
also perceive local or domestic products as having better quality and offering the least
risk (Hooley et al., 1988). This may extend to apparel products made of US cotton (Ha-
Brookshire & Norum, 2011). Thus the knowledge of fiber-origin may influence
consumers’ purchase preference.
Fiber farm in USA.
The U.S. is one of the largest cotton producing nations (Cotton Incorporated,
2010b) and its production capability is still growing, with an increase of 15% in cotton

12
production in 2010 over the previous year (Norum & Ha-Brookshire, 2011). Consumers
perceive US cotton as symbol of quality (Ha-Brookshire & Norum, 2011) over other
competing nations. Comparing to the popularity of locally grown food products, US
cotton farmers also want their consumers to know more about the fiber they are wearing,
to be aware of the fiber-origin, and how the fiber has been produced (Norum & Ha-
Brookshire, 2011). Dickson (2001) found 16% of US consumers were interested in
learning about labor and production practices in the apparel industry by using the
labelling information to confirm their purchase decisions (Hustvedt & Bernard, 2008). In
addition, a few studies have found value based labelling to be strongly effective in
marketing of agricultural-based products. However, labelling for fiber origin in apparel is
a more difficult a proposition (Hustvedt & Bernard, 2008). While the labelling
requirement of specifying the manufacturing location on labels is mandatory by the U.S.
government, there is generally no such stringent requirement of tracking the fiber origin.
In fact, for manufacturers, it is challenging to ascertain the origin of the fiber in their
products (Bilkey & Nes, 1982). With the trend toward tracing agricultural products to
their farm of origin, and the importance of U.S. grown cotton to both producers and
consumers, the traceability of U.S. cotton in apparel products is a topic ripe for
exploration, and is one variable to be investigated in this study.
Factory Origin/Factory traceability
Several researchers have studied labor conditions, corporate labor standards, and
fair labor demand in the apparel industry (Claxton & Ritchie, 1979; Emmelhainz &
Adams, 1999). Studies have shown that consumers are concerned about sweatshop and
labor conditions in the apparel manufacturing process (Harris, 1999). The National
13
Consumers League (1999) reported about 77% participants of their study, were interested
in ensuring fair labor involvement in their apparel purchase, and about 55% of the
participants were further ready to pay premium prices for clothes produced with fair labor
conditions. Availability of such information empowers consumers to be assured about
ethical labor conditions (Dickson, 2001), and impacts their attitudes and beliefs regarding
clothing consumption (Shaw & Shiu, 2000). Studies by Hyllegard, Yan, Ogle, and Lee,
(2012) and others have shown how consumers perceive hangtags and labels as effective
signaling tool. Hyllegard et al. (2012) reported such behavior in 60% of study
participants. Furthermore, consumers are willing to pay premium prices for apparel
products based on availability of information about social and ethical labor involvement
in making those products (Hustvedt and Bernard, 2008). However, it is difficult for both
buyers and consumers to learn about the intermediate manufacturing conditions. By the
U.S. law, all apparel products sold in the United States need to have a registered
identification number (RN) which act as identifiers of the manufacturers, importers,
distributers, or sellers of those products. But such information can’t always be easily
interpreted by consumers. While purchasing an apparel product, consumers have
difficulties to access and interpret information about the factories involved, their labor
conditions, sweatshop-free behaviors, their concern for labor’s health hazards, employee
satisfaction, or their infra-structure (Dickson, 2000; Tomolillo & Shaw, 2004). Thus,
offering traceable information about the factory-origin of apparel products might impact
consumers’ purchase intentions, and will be examined in this study.

14
Country of Manufacturing
Country of manufacturing (origin) labels are a requirement for any apparel
product sold to consumers in the United States. According to the Textile Fiber Products
Identification Act, identifying the country of manufacturing for apparel goods is required
by law (U.S. Federal Trade Commission, 2009). By this act, all textile and apparel
products must specify the percentage of the generic fiber composition, the name or
registered number of the manufacturing company, and the name of the country of
manufacturing (U.S. Federal Trade Commission, 2009) It is a mandatory government
policy to be followed by all manufacturing firms, but contains much more legal
sophistication than being a mere mention of just the manufacturing country. It acts as
perceived measure to signal different product qualities, based on the manufacturing
country’s development status (Bilkey & Nes, 1982).
Along with products’ intrinsic features, consumers are also interested in products’
extrinsic cues such as information about their manufacturing, design processes or various
stages in the journey of products across the supply chain network (Singh et al, 2008).
With their increased social and environmental awareness, and modern communication,
consumers are interested in greater visibility and accessibility regarding these cues while
purchasing apparel products (Bhaduri & Ha-Brookshire, 2011). The literature shows that
consumers use information about country of origin to estimate benefits from products,
and to evaluate their qualities and confirm their purchase behavior (Samiee, 1994). There
is a tendency for consumers to evaluate their own country’s products relatively more
favorably than do foreigners (Bilkey & Nes, 1982). In fact, consumers’ reliance upon
their knowledge and preference of countries to develop their perceptions of product

15
quality has been summarized through the term ‘‘COO effect’’ (Han & Terpstra, 1988).
However, it’s important to note that the current COO label rules refer to the nation only
where the final product is manufactured, without giving information about the origin of
fibers, or any intermediate processing (Samiee, 1994). Since most of the products in this
globalized industry are hybrid or multinational in nature, inclusion of information on the
source of fiber, design, assembly, part and manufacture as new levels of COO is expected
to support the multi-national identity (Ha-Brookshire, 2012). Country of Manufacture
refers to the country where materials are transformed into the final products (Essoussi &
Mernuka, 2007; Insch & McBride, 1998). Thus, COM is the country used in apparel
product labelling practices (Samiee, 1994).
Previous studies have shown that COM is frequently associated with patriotism,
nationalism, ethnocentrism and preference of domestic goods over imported products
(Bannister & Saunders, 1978; Drozdenko & Jensen, 2005). In some research, these terms
have been linked to consumers’ anti-globalization involvement. In the US, mainly after
September 11, consumers execute and show patriotism in much stronger ways (Lee et all,
2003), and the “local” movement has been viewed as an approach to save local jobs and
local economics. The U.S. government is actively involved in getting manufacturing back
to the U.S., and this movement has been coined as ‘reshoring’. Buying textile products
made in America is perceived as socially responsible behavior (Ha-Brookshire & Norum,
2011). US consumers also use the country of manufacturing information to determine
apparel quality, associating it with the economy of a country. Consumers prefer apparel
made in developed countries relative to less developed countries (Dickerson 1982). For
fashion products, requiring low technology skill, the study by Iyer and Kalita (1997)
16
confirmed that consumers’ perceived value for products were significantly varied
between developed and developing countries (Zhang, 2012). Given the COM is legally
required on apparel products, and its use by consumers in purchase decisions, COM will
be included as a variable in this study, along with the fiber-origin and factory-origin.
Ad Credibility
Credibility is described as the extent to which consumers consider a product as
believable and trustworthy (MacKenzie and Lutz, 1989). Considering that traceability is
comparable to identity preservation, generates trust and instills confidence among
consumers, traceable information can be considered as important cues of credibility.
They help to reaffirm valuable product attributes with details about various stages of the
product supply chain. By providing such information, firms try to strengthen
transparency, reliability, and assurance. The presence of such information may contribute
to ad credibility and assure genuineness. Thus, traceable information availability is
expected to act as persuasive force to increase ad credibility, which in turn acts as an
important antecedent to develop a positive attitude towards the advertisement
(MacKenzie and Lutz, 1989).
Attitude towards Advertisement (Webpages)
In the marketing literature, attitude towards an object is an important construct,
and is described as individual’s perceived understanding of the object. It is used to
evaluate the object’s benefits, and determine its effective usage. Hoyer and MacInnis
(1997) explained attitude to be an overall assessment of any product, person, or issue,
which sustains for a long period of time. Fishbein and Ajzen (1975) also defined attitude
17
as an ‘enduring predisposition’ considered by consumers to evaluate an object, and
results in particular behaviors. Thus, attitude is a predictor for measuring and
understanding consumers’ behavior towards an object or service or similar (Oskamp,
1999).
E-commerce has been a growing popular application of Internet and world-wide-
web, and acts as an additional selling platform for textile and apparel industry. In an e-
commerce environment, a company’s webpages act as one major advertisement tool
contributing to successful business transactions. It acts as the promotional vehicle to
convey information (Wang, Zhang, Choi, & D’Eredita, 2002), and develop a positive
attitude towards advertisements among their consumers. Thus in this study,
advertisements will be represented with webpages. Mackenzie, Lutz and Belch (1986)
describes attitude towards advertisement (AaD) as “a predisposition to respond in a
favorable or unfavorable manner to a particular advertising stimulus during a particular
exposure situation” (Sallam & Wahid, 2012). Thus AaD refers to consumers’ general
overall likings and reactions towards the ad, including aspects such as good/bad and
pleasant/ unpleasant, and similar. But companies’ webpages are competing to gain their
consumers’ focus and to intensify their attention by various means. Due to the growing
number of online ads, businesses are struggling to gain consumers’ attention (Bogart,
1985). Similarly, lack of a face-to-face interaction is another concern in e-commerce
transactions through their website, thus generating untrustworthiness. Considering these
concerns, researchers have highlighted the importance of providing transparent cues to
enhance consumers’ confidence (Riegelsberger, Sasse, and McCarthy, 2003), which can
be used to generate positive attitudes. From consumers’ perspective, an ad needs to have

18
information relevant to their wants and requirements, so as to motivate them for further
actions, generating a positive attitude. Information available on company’s webpages can
provide such cues while helping in consumers’ search for information. Lavidge and
Steiner (1961), described the effectiveness of an ad through its three functions. While the
first function of an ad relates to shared knowledge and awareness through information,
the next function indicates its impact on consumers’ product attitudes, leading to its final
function of a purchase transaction. Thus, in webpages, businesses might be able to assure
their genuineness with traceable information, thereby, enhancing consumers’ attitude
towards their webpages impacting product attitude and/or their purchase intention (Wang,
Zhang, Choi, and Eredita, 2002).
Attitude towards Product
An attitude towards product (AaP) can be described as an individual’s
predisposed idea about the product, its utility and benefits, his positive or negative
evaluation in relation to acquiring and using the product (Chen, 2007). Smith, Tatum,
Belk, Scanga, Grandin and Sofos (2005) indicated the impact of traceable information in
reinforcing positive consumer confidence in products’ and brands’ strength and integrity.
Informational cues about products’ origin, compositional content, and their production
procedures, contributes to reaffirm consumers’ confidence, which in turn, strengthens
their decision making abilities (de Jonge et al., 2008). Drawing from the food industry,
and the textile and apparel (T&A) literature, traceability can be compared to quality
certification, and an attribute that generates a more favorable product attitude (Ubilava &
Foster, 2009; Hustvedt & Bernard, 2008; and Hustvedt, Peterson & Chen, 2008). Attitude
towards a product is affiliated with the views of personal desirability towards purchasing
19
the product. Products with traceable information are perceived to generate more
confidence in consumers about the source, quality and impact of a product purchase.
Thus, consumers’ attitude towards purchasing traceable apparel products is expected to
be positively related to their attitude towards purchasing products with traceable
information. Attitude is personal and subjective in nature. Previous researchers, including
Hyllegard et al (2012), Koklic (2011), and Hartmann and Apaolaza-Ibáñez (2012) have
found evidence that attitude relates to purchase intentions.
Purchase Intention for traceable products
Consumers’ purchase intention can be defined as “the consumer’s self-instruction
to purchase the brand (or take another relevant purchase related action)” (Rossiter &
Percy 1998, p 126). Purchase intention is considered as an immediate predecessor of
purchase behavior and considered to be an indication of people’s readiness to execute the
behavior. As all behaviors cannot necessarily be voluntarily controlled, the construct of
purchase intention is expected to predict attitude towards the actual purchase behavior
(Bredahl, 2001). In keeping with Ajzen (1991), consumers’ purchase intention for buying
an apparel product is influenced by their overall attitude towards such apparel products
available, and can be extended to products with traceable information. The expectation of
outcomes resulting from buying traceable products are an important antecedent to
purchase intention and thus the actual behavior. Thus, three sources of traceable
information: farm, factory, and the COM, are expected to strongly impact consumers’
purchase intentions for products marketed with traceable information (Bredahl, 2001).
20
Research gap, research hypotheses and conceptual model
As can be seen from the literature review, there has been prior research on how
consumers’ knowledge of country of origin, and fiber production methods, relate to
consumers’ purchase intentions. For the country of origin, it has been shown to influence
the quality perceptions of a product (Bilkey & Nes, 1982). Previous researchers have
studied country of origin relative to patriotism, and domestic good preferences, and have
identified how knowledge of the country affects their purchase intentions and product
attitudes. A few studies focused on sweatshop participation and social responsibilities of
specific factories. However, since consumers’ purchase intention are partially dependent
on their subjective attitudes, different consumers vary with the amount of information
they seek. Consumers have also been found to desire information on fiber-origin
(Bhaduri, 2011). A few apparel companies like Levis Strauss & Co., and All American
Clothing Co. are publishing such information to allow their customers to trace the
products or their processes. However, the impact of traceable information in terms of
generating positive consumers’ attitude, affecting their perceived credibility, and
persuading their intentions to purchase such textile and apparel (T&A) products, has not
been explored. This study intends to gain a better understanding of whether traceable
information affects various aspects of consumer behavior during an apparel purchase
scenario. Specifically, this study is designed to examine the impact of the traceability of
fiber-origin, factory-origin, and COM, on consumers’ perceived ad credibility, attitudes
towards apparel advertising, attitude towards the product, and purchase intentions.
21
From the above discussions, the following hypotheses are developed:
Hypotheses
H1: Products with farm-traceability compared to products with no farm-
traceability, will be more positively related to:
a) Perceived ad credibility
b) Attitude towards advertisement (website)
c) Attitude towards product
d) Purchase intention
H2: Products with factory-traceability compared to products with no factory-
traceability, will be more positively related to:
a) Perceived ad credibility
b) Attitude towards advertisement (website)
c) Attitude towards product
d) Purchase intention
H3: Products with the USA as their COM compared to products with China as
their COM will be more positively related to:
a) Perceived ad credibility
b) Attitude towards advertisement (website)
c) Attitude towards product
d) Purchase intention
Traceability can have various levels of information, such as about farm-origin of
fibers, the factory involved in production, country of manufacturing, country of design,
22
country of parts, and the country where the product is finally sold. This study focuses on
the farm traceability, factory traceability, and country of manufacturing.
In addition to the direct effect of the independent variables on each dependent
variable, interaction effects will also be tested. Considering people support for locally
grown and locally manufactured products, it will be interesting to see how presence of
both farm traceability and factory traceability information might increase consumers’
perceived credibility, attitude, and preference for such products.
H4: Products with farm-traceability and factory-traceability compared to products
with no farm, factory traceability will be more positively related to:
a) Perceived ad credibility
b) Attitude towards advertisement (website)
c) Attitude towards product
d) Purchase intention
Similarly when products are produced from locally grown fibers, and
manufactured in a highly developed country, it is expected that the conjunctive presence
of both such information will influence consumers to develop strong credibility, attitude,
and hence, preference for such products.
H5: Products with farm-traceability and USA as COM compared to Chinese
products with no farm traceability will be more positively related to:
a) Perceived ad credibility
b) Attitude towards advertisement (website)
c) Attitude towards product
d) Purchase intention

23
People support locally manufactured products due to perceived genuineness and
pride in supporting local community and national economy. Hence, when factory-
traceable information is present with a highly-developed manufacturing country, their
conjunctive effect is expected to increase credibility, attitude, and hence, preference for
such products.
H6: Products with factory-traceability and USA as COM compared to Chinese
products with no factory traceability will be more positively related to:
a) Perceived ad credibility
b) Attitude towards advertisement (website)
c) Attitude towards product
d) Purchase intention
Similarly, all the three traceable information are also expected to interact with
each other to have an overall increased positive effect on consumers. Thus, the following
specific hypotheses were developed.
H7: Products with farm-traceability, factory-traceability, and USA as COM
compared to Chinese products with no farm and factory traceability, will be more
positively related to:
a) Perceived ad credibility
b) Attitude towards advertisement (website)
c) Attitude towards product
d) Purchase intention
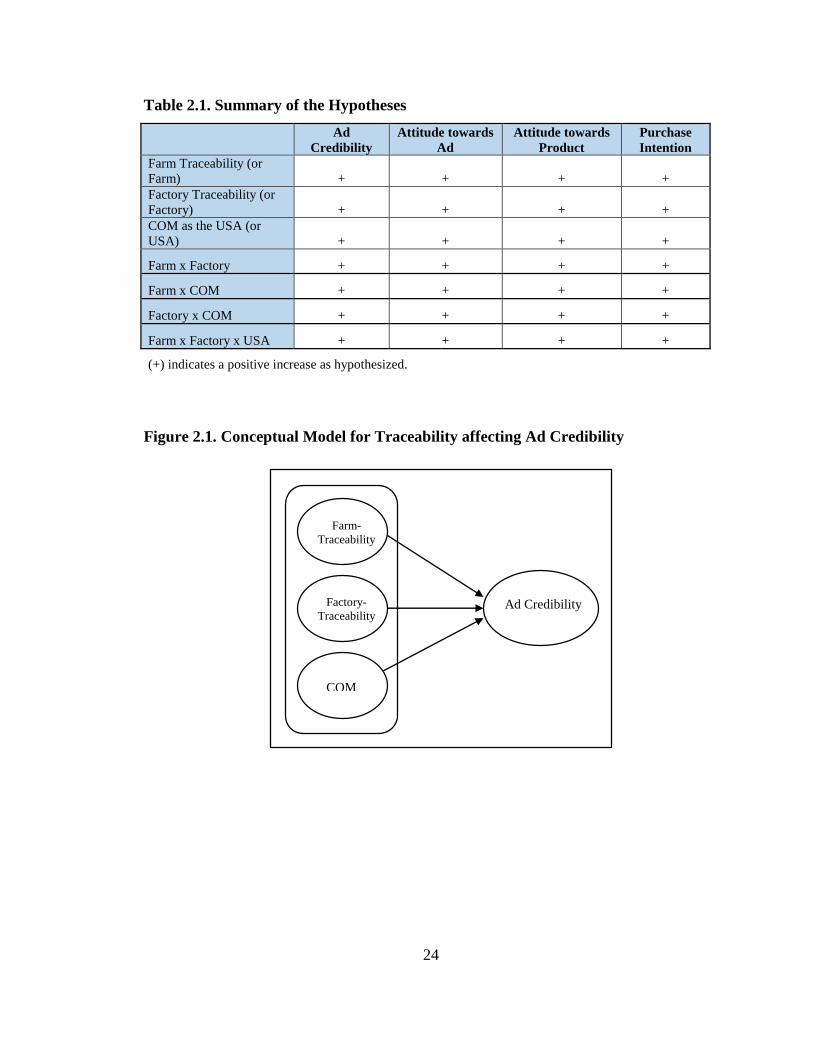
Table 2.1 summarizes the hypotheses and Figures 2.1-2.4 illustrate the conceptual models
developed based on the review of literature.
24
Table 2.1. Summary of the Hypotheses
Ad
Credibility
Attitude towards
Ad
Attitude towards
Product
Purchase
Intention
Farm Traceability (or
Farm) + + + +
Factory Traceability (or
Factory) + + + +
COM as the USA (or
USA) + + + +
Farm x Factory + + + +
Farm x COM + + + +
Factory x COM + + + +
Farm x Factory x USA + + + +
(+) indicates a positive increase as hypothesized.
Figure 2.1. Conceptual Model for Traceability affecting Ad Credibility
Farm-
Traceability
Factory-
Traceability
COM
Ad Credibility

25
Figure 2.2. Conceptual Model for Traceability affecting Attitude towards
Advertisement
Figure 2.3. Conceptual Model for Traceability affecting Attitude towards Product
Farm-
Traceability
Factory-
Traceability
COM
Attitude towards
Advertisement
Farm-
Traceability
Factory-
Traceability
COM
Attitude towards
Product
26
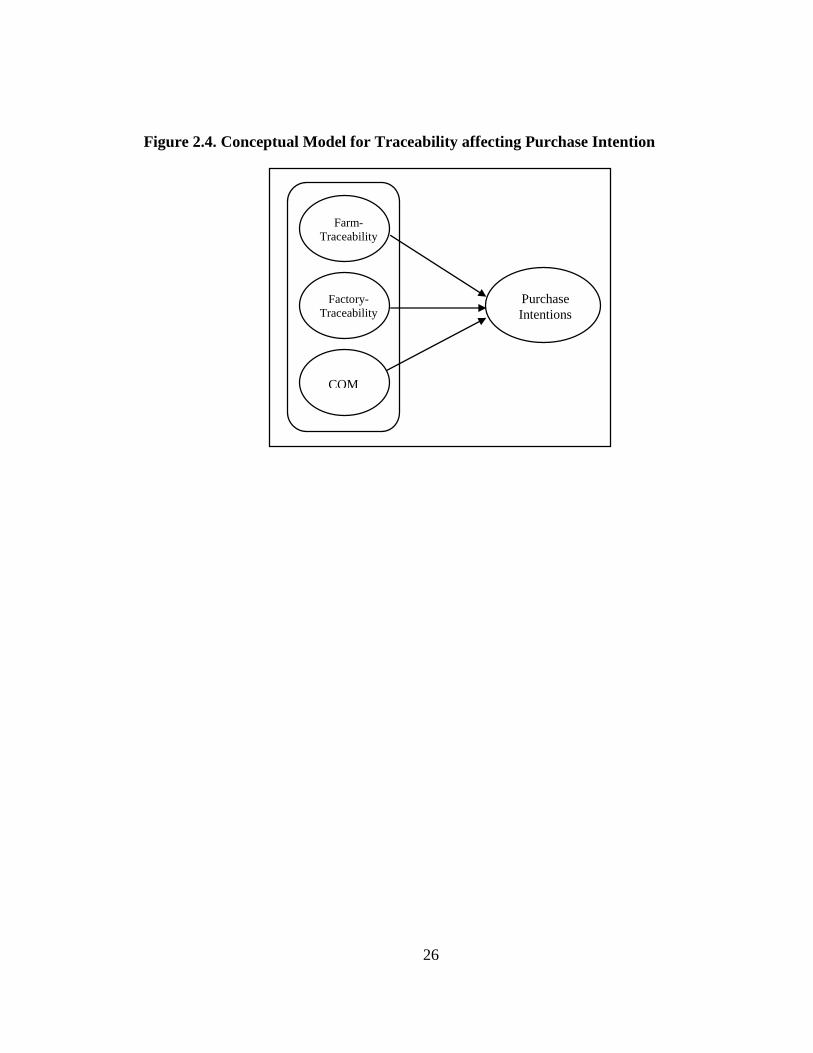
Figure 2.4. Conceptual Model for Traceability affecting Purchase Intention
Farm-
Traceability
Factory-
Traceability
COM
Purchase
Intentions
27
CHAPTER III: RESEARCH METHODOLOGY
Chapter III provides the following sections: (a) research design; (b) stimulus
materials; (c) variables; (d) manipulation check, (e) data collection; and (g) data analysis
techniques.
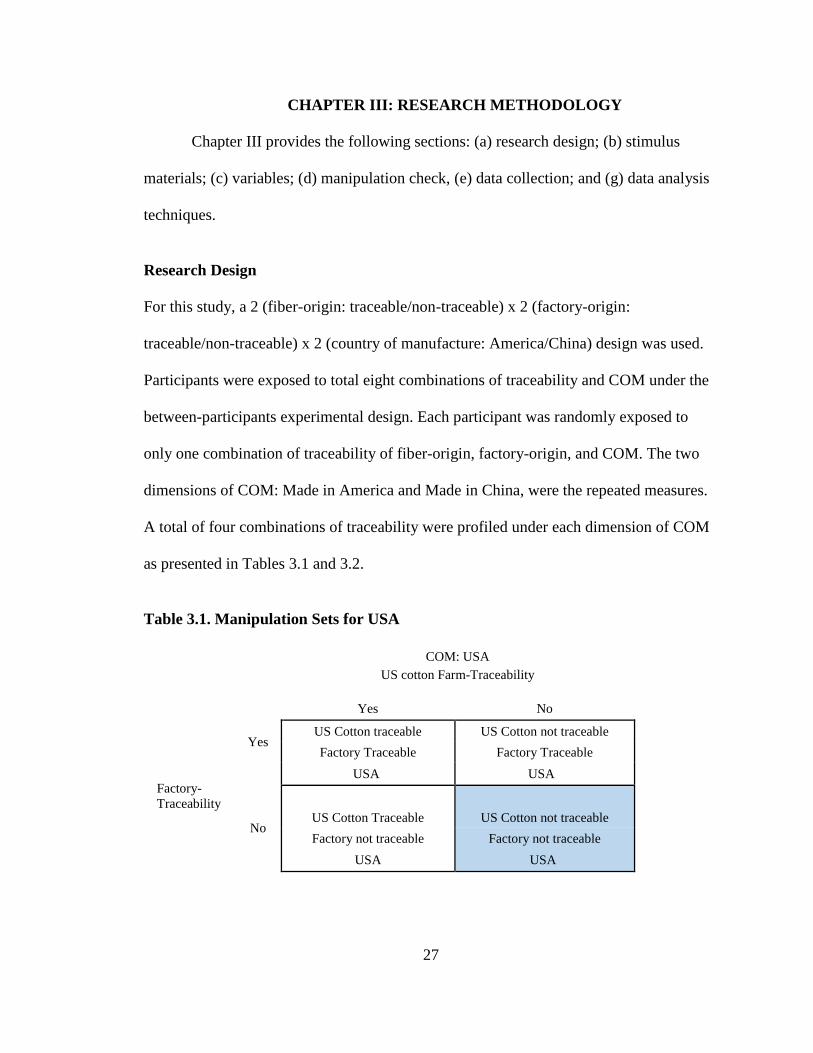
Research Design
For this study, a 2 (fiber-origin: traceable/non-traceable) x 2 (factory-origin:
traceable/non-traceable) x 2 (country of manufacture: America/China) design was used.
Participants were exposed to total eight combinations of traceability and COM under the
between-participants experimental design. Each participant was randomly exposed to
only one combination of traceability of fiber-origin, factory-origin, and COM. The two
dimensions of COM: Made in America and Made in China, were the repeated measures.
A total of four combinations of traceability were profiled under each dimension of COM
as presented in Tables 3.1 and 3.2.
Table 3.1. Manipulation Sets for USA
COM: USA
US cotton Farm-Traceability
Yes No
Factory-
Traceability
Yes US Cotton traceable US Cotton not traceable
Factory Traceable Factory Traceable
USA USA
No US Cotton Traceable US Cotton not traceable
Factory not traceable Factory not traceable
USA USA
28
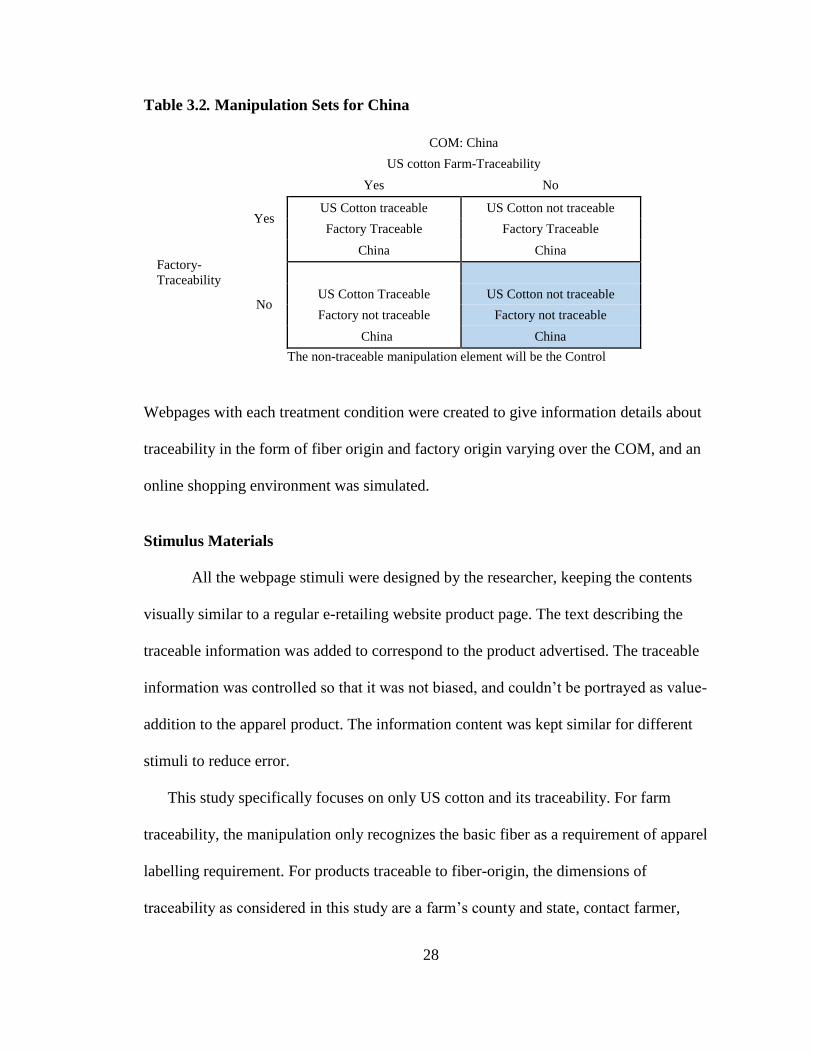
Table 3.2. Manipulation Sets for China
COM: China
US cotton Farm-Traceability
Yes No
Factory-
Traceability
Yes US Cotton traceable US Cotton not traceable
Factory Traceable Factory Traceable
China China
No US Cotton Traceable US Cotton not traceable
Factory not traceable Factory not traceable
China China
The non-traceable manipulation element will be the Control
Webpages with each treatment condition were created to give information details about
traceability in the form of fiber origin and factory origin varying over the COM, and an
online shopping environment was simulated.
Stimulus Materials
All the webpage stimuli were designed by the researcher, keeping the contents
visually similar to a regular e-retailing website product page. The text describing the
traceable information was added to correspond to the product advertised. The traceable
information was controlled so that it was not biased, and couldn’t be portrayed as value-
addition to the apparel product. The information content was kept similar for different
stimuli to reduce error.
This study specifically focuses on only US cotton and its traceability. For farm
traceability, the manipulation only recognizes the basic fiber as a requirement of apparel
labelling requirement. For products traceable to fiber-origin, the dimensions of
traceability as considered in this study are a farm’s county and state, contact farmer,
29
number of years in farming, and acres of farm land. The county and state would help
consumers to specifically narrow down and identify the farm. Similarly, identifying
farmers with specific details like contact information, farming experience over the years,
and acres of land, would help consumers to relate the information with genuineness.
For traceability to factory-origin, factory was identified by its unique
identification name, contact details, address, and years in business. The name and contact
details will reinforce the validity and accessibility of the factory involved in
manufacturing the product.
The country of manufacture for the apparel product was shown as the United
States or China. For the foreign country, China was selected for several reasons. China is
the leading importer of US cotton, importing over half of US produced cotton (United
States Department of Agriculture, 2011). It is also the leading cotton apparel exporter to
the United States, with the US importing more than 27% of its cotton apparel from China
in 2008. (Cotton Incorporated, 2009). Thus, as an important competitor and business
partner to US in cotton, and as a lesser developed country, China had been considered an
appropriate foreign country to use in this study.
Eight webpages representing four combinations of traceability for each COM
were created, and the four combinations were categorized as:
- Farm traceable/Factory traceable: maximum traceability is reflected through
identifying the farms’ county and state where the cotton fiber was grown, farmers’
name, contact details along with factories’ name, contact details, address, and
manufacturers’ years in business for producing apparel products..

30
- Farm not traceable/ factory traceable: partial traceability where the company fails to
identify and offer information about the fiber origin, but does identify the factory by
its unique name and other details.
- Farm traceable/ factory not traceable: partially traceable where the company
identifies the fiber origin, with their county and state, the contact farmer and other
details, but does not identify information about the factory. The manipulation shows
no information about the factory involved for manufacturing the apparel.
- Farm not traceable/ factory not traceable: no traceability offered, where the
manipulation doesn’t identify the fiber or factory origin. This is the control factor,
and represents the current labelling rules as per Textile Fiber Products Identification
Act, by identifying only the country of manufacturing.
E-retailing is generally criticized as a platform of intangible products (Bikra,
2008) affecting consumers’ confidence regarding product quality and assurance (Azam,
2012). Thus, availability of traceable information provides informative cues regarding
apparel products, and is expected to affect participants’ purchase intentions. The webpage
stimuli developed for this study are shown in Appendix A.
Previous research shows that significant intrinsic product values, like style, color,
and product features along with other extrinsic factors like brand name, product
guarantee are more important factors relative to traceability of information and COM
(Dickson & Littrell, 1996, Kim et al., 1999). Hence, such values will be held constant by
using one specific apparel product: a pair of denim jeans.

31
Dependent Variables
There are four dependent variables to be measured in this study, ad credibility,
attitude towards website (advertisement), attitude towards products, and purchase
intention.
Ad credibility.
In this study, ad credibility referred to consumers’ belief or perceived trust in
presence of traceable information on webpages. This reflected consumers’ perceived
credibility as believable, truthful, and realistic. These measurement items are adapted
from Cotte, Coulter, and Moore, (2005). They are measured on a 7-point Likert scale
with anchors of 1 as strongly disagree and 7 as strongly agree. The reliability of these
scales ranged from 0.84 to 0.87 (Cotte, Coulter, & Moore, 2005).
Attitude towards website.
For this study, website is considered equivalent to a promotional vehicle or an
advertisement. This reflected consumers’ evaluation of advertisements as being
good/bad, favorable/unfavorable, pleasant/unpleasant, and likeable/unlikeable, 4-items
often used for attitudinal studies. These measurement items are adapted from MacKenzie
and Lutz, (1989). The original scale was designed for measuring attitude towards
advertisements. The word ‘advertisement’ was replaced with ‘website’ to cater to the
study. These items are measured on a 7-point Likert scale with anchors of 1 as strongly
disagree and 7 as strongly agree. The reliability of these scales ranged from 0.89 to 0.94
(MacKenzie & Lutz, 1989).

32
Attitude towards product.
This reflected consumers’ evaluation as good/bad, favorable/unfavorable,
pleasant/unpleasant, and likeable/unlikeable for products with traceable information.
These 4-items are also adapted from the same scale of attitude towards ad by MacKenzie
and Lutz, (1989), by replacing ‘advertisement’ with the product, ‘jeans’. These items are
measured on a 7-point Likert scale with anchors of 1 as strongly disagree and 7 as
strongly agree. The reliability of these scales ranged from 0.89 to 0.96 (MacKenzie &
Lutz, 1989).
Purchase Intention.
To measure purchase intention, the consumers were asked to indicate their
likeliness to purchase clothes with traceable information, if priced favorably and if
available, and to refer it to a friend, in the future. It was measured using 3-items scale
adapted from Hyllegar, Yan, Ogle, and Lee (1999) and Chen (2007), on a 7-point scale
from 1 anchored as definitely not to 7 anchored as definitely. The original scales were
adapted to include affordable price and availability, to match the purpose of the study.
The reliability of scales ranged from 0.83 to 0.96.
Manipulation check (Mean Difference between Stimuli)
To determine the effectiveness of the developed stimuli, a manipulation check
was conducted with 38 participants. Their feedback was analyzed and some adjustments
were made to the wordings of stimuli accordingly. Participants were randomly exposed to
stimuli cases, with each participant being exposed to only one case. The total number of
respondents were equally distributed among the eight cases. Cases were recoded based on
33
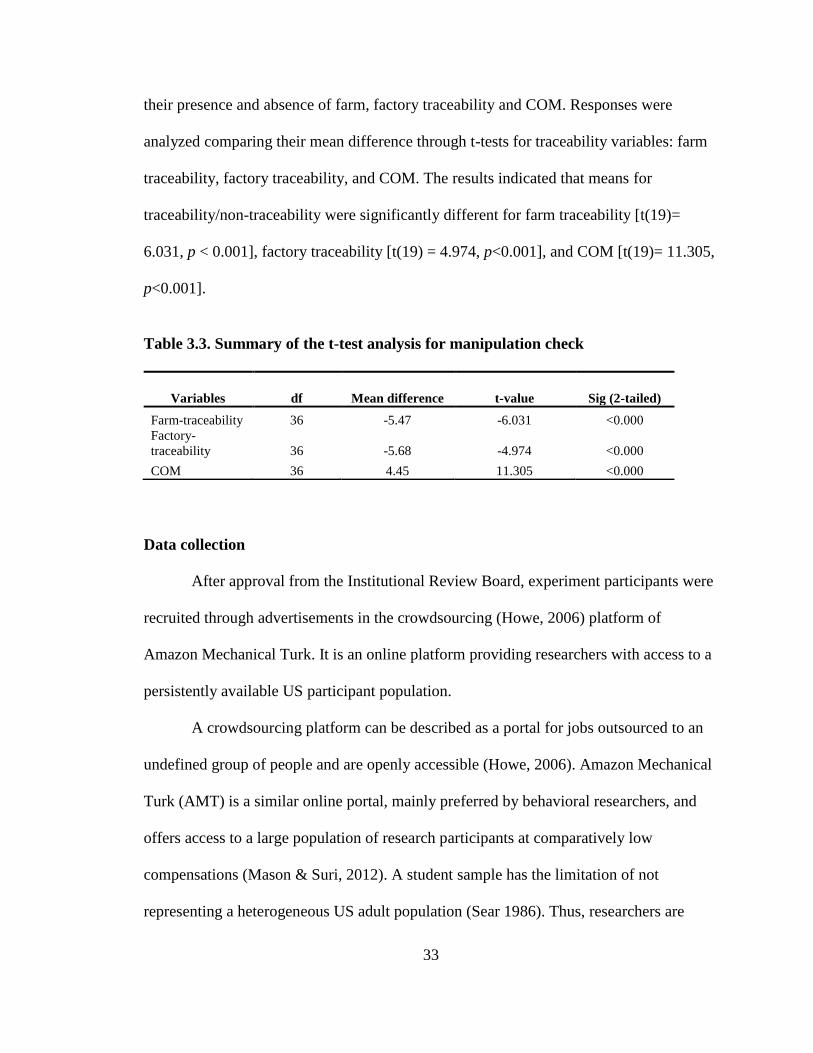
their presence and absence of farm, factory traceability and COM. Responses were
analyzed comparing their mean difference through t-tests for traceability variables: farm
traceability, factory traceability, and COM. The results indicated that means for
traceability/non-traceability were significantly different for farm traceability [t(19)=
6.031, p < 0.001], factory traceability [t(19) = 4.974, p<0.001], and COM [t(19)= 11.305,
p<0.001].
Table 3.3. Summary of the t-test analysis for manipulation check
Variables df Mean difference t-value Sig (2-tailed)
Farm-traceability 36 -5.47 -6.031 <0.000
Factory-
traceability 36 -5.68 -4.974 <0.000
COM 36 4.45 11.305 <0.000
Data collection
After approval from the Institutional Review Board, experiment participants were
recruited through advertisements in the crowdsourcing (Howe, 2006) platform of
Amazon Mechanical Turk. It is an online platform providing researchers with access to a
persistently available US participant population.
A crowdsourcing platform can be described as a portal for jobs outsourced to an
undefined group of people and are openly accessible (Howe, 2006). Amazon Mechanical
Turk (AMT) is a similar online portal, mainly preferred by behavioral researchers, and
offers access to a large population of research participants at comparatively low
compensations (Mason & Suri, 2012). A student sample has the limitation of not
representing a heterogeneous US adult population (Sear 1986). Thus, researchers are
34
restoring to inexpensive, and easily accessible non-probability samples but that are not
limited to students. Researchers have used AMT in previous studies. Erikson and
Simpson (2010) studied gender, and the culture for risk preferences. Suri and Watts
(2011) used it to study the relationships between social dilemmas and networks (Mason
& Suri, 2012). Berinsky and colleagues (2012) have supported participants’ viability
recruited from AMT (Cassese, Huddy, Hartman, Mason & Weber, 2013). Thus, a
literature review shows the validity of AMT and its accepted use in an experimental
research environment. Participants from this online portal offer an access to diverse
population, and their response to experimental stimuli exposure have been found to be
consistent in prior studies (Cassese et al., 2013).
A total of 640 participants volunteered for this study, a between-participant
experiment design, in which they were exposed to treatments arranged as 2x2x2 factorial.
Equal number of participants were recruited and exposed randomly to each of the eight
stimuli conditions. For the study, participants were compensated with $0.50, on
successful completion of the entire survey. Before beginning the main online study, the
respondents were given a brief description about the purpose of the study. Voluntary
participation and participatory compensation were highlighted. Information about
participants’ withdrawal for unwillingness to reply, anonymous participation,
confidentiality of the data, and no associated risks were assured. The consent form had
the above information explicitly listed in it, and participants willing to volunteer for the
study, were thus required to read and confirm their approval of it. For the purpose of the
study, participants were recruited based on their denim purchase behavior in the past one
year or an expected behavior in the recent future. Participants were exposed randomly to
35
one of the eight designed stimuli of an apparel company’s website. Based on the
exposure, participants had to answer the survey questions. A total of 552 responses were
finally shortlisted as usable data. A validity check question was also introduced in
between the survey, to check and control the chances of participants’ random responses.
The demographic questions were included at the end of survey.
Data Analysis
The process of successful data collection was followed by data analysis using the
Statistical Package for the Social Sciences (SPSS) software. Participants’ demographics
were analyzed with descriptive statistics to obtain a characteristics profile of the
respondents. Participants’ age, gender, employment, and other demographic
characteristics were analyzed using frequencies and percentages. The effect, if any, of
traceable information and COM on consumers’ perceived ad credibility, attitude towards
webpages, attitude towards product and purchase intentions were analyzed through
analysis of variance (ANOVA).

36
CHAPTER IV: RESULTS
Chapter IV includes (a) description of the sample including demographic
characteristics; (b) scale reliability; (c) ANOVA results; (d) additional analysis for
gender, and (e) summary of results.
Description of the Sample
For the experiment, a total of 640 participants were recruited through the AMT
platform. Out of 640 respondents, 88 respondents were excluded due to missing or bad
data. Bad data referred to respondents, who either indicated through a screening question
that they had not purchased denim in the past one year, nor plans of purchase in recent
the future, or who did not answer all questions. This resulted in a total of 552 usable
survey responses. Table 4.1 presents the demographic characteristics of the sample.
Respondents consisted of 199 (36.1%) females and 350 (63.4%) males. Participants’ age
range was widely distributed from 18 to above 65. Sixteen (2.9%) participants were of
ages 18 and 21, 369 (66.8%) participants were of ages 22 and 34, 94 (17%) participants
were of ages 35 and 44, 49 (8.9%) participants were of ages 45 and 54, 17 (3.1%)
participants were of ages 55 and 64, and 7 (1.3%) participants were of ages 65 and above.
Out of 552, 80 (14.5%) participants were students, 91 (16.5%) participants were part-time
employed, 295 (53.4%) were full-time employed, 9 (1.6%) were retired, and 77 (13.9%)
participants were not employed. The study participants represented 413 (74.8%)
Caucasians, 34 (6.2%) African Americans, 31 (5.6%) Hispanic, 66 (12%) Asians, 8
(1.4%) of other ethnic origins. Over three hundred (334 or 60.5%) participants had
college as their highest educational level, 3 (0.5%) had less than a high school education,

37
158 (28.6%) were high school graduates, 57 (10.3%) were college graduates. Of the 552
participants, 371 (67.2%) were unmarried and 181 (32.8%) were married.
Scale Reliability
The reliability of the 3-item ad credibility scale was 0.883 (Cronbach’s α), and the
reliability of the 4-item attitude towards advertisement scale was 0.940 (Cronbach’s α).
The reliability of the 3-item attitude towards product scale was 0.956 (Cronbach’s α), and
for purchase intention, the reliability of the 3-item scale was 0.827 (Cronbach’s α). Table
4.2 contains the reliability measures for the dependent variables used in the study.
Analysis of Variance (ANOVA) Results
The results from the analysis of variance are presented in Tables 4.3.1 – 4.3.12.
The results are discussed in light of the earlier stated hypotheses.
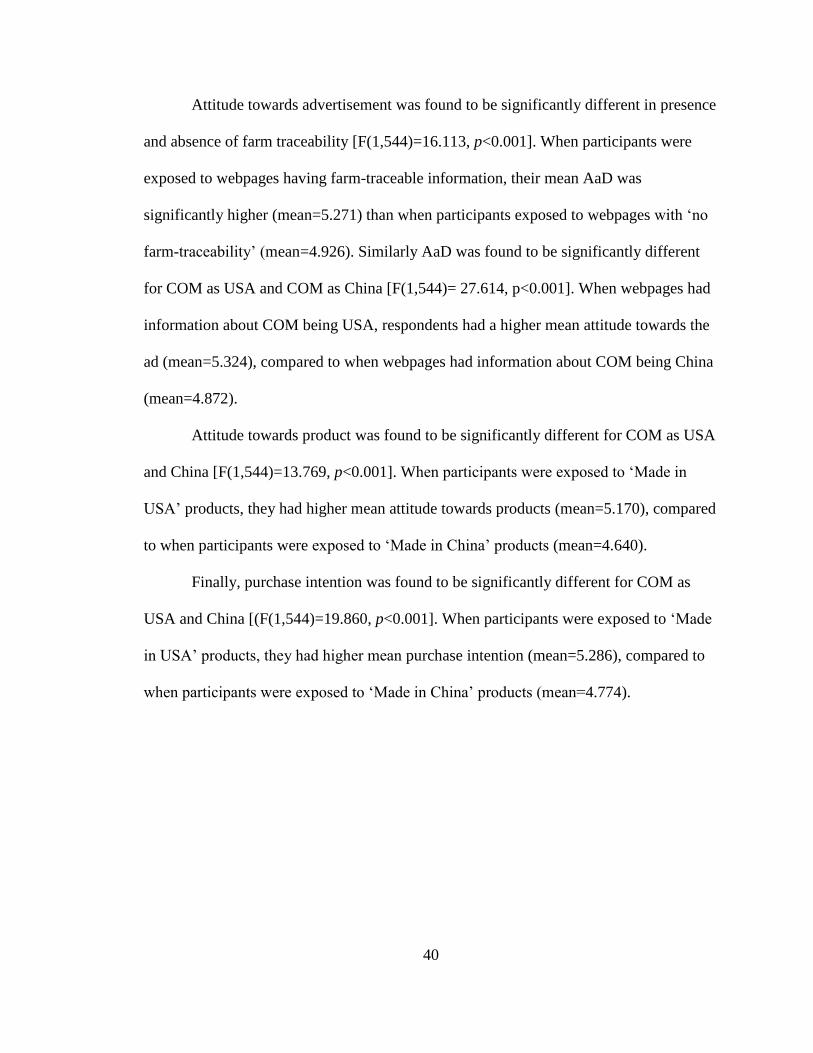
For ad credibility, COM was the only variable to have statistically significant
mean difference [F(1,544)=13.275, p<0.001]. Participants who were exposed to
webpages with COM as the USA had a higher mean (5.635) ad credibility than
participants when exposed to webpages with COM as China (mean=5.322). Other
traceability factors of farm and factory did not generate any significant mean difference
in perceived ad credibility.

38
Table 4.1. Survey respondents’ Demographic characteristics
Variable Frequency Percentage
Gender
Male 350 63.40
Female 199 36.10
Ethnicity
Caucasian 413 74.80
African American 34 6.20
Hispanic 31 5.60
Asian 66 12.00
Others 8 1.40
Age
21 and Under 16 2.90
22 to 34 369 66.80
35 to 44 94 17.00
45 to 54 49 8.90
55 to 64 17 3.10
65 and Over 7 1.30
Marital Status
Unmarried 371 67.20
Married 181 32.80
Education Level
Less than high school 3 0.50
High School 158 28.60
College 334 60.50
Graduate School 57 10.30
Occupation
Student 80 14.50
Part-time employed 91 16.50
Full-time employed 295 53.40
Retired 9 1.60
Not Employed 77 13.90
Annual Household Income
Less than $10, 000 45 8.15
$10,000 - $29,999 308 55.79
$30,000 - $49,999 89 16.12
$50,000 - $69,999 66 11.95
$70,000 - $89,999 24 4.34
$90,000 - $149,999 18 3.26
$150,000 or above 2 0.36
Note. Total number of participants = 552

39
Table 4.2. Reliability of scales
Scale Number of items Reliability (Cronbach's α)
Ad Credibility 3 0.883
I consider the above website to be believable
I consider the above website to be truthful
I consider the above website to be realistic
Attitude towards advertisement 4 0.940
I consider the above website to be :
Bad/good
Unfavorable/favorable
Unpleasant/pleasant
Unlikeable/likeable
Attitude towards the product 3 0.956
I consider the above jeans to be :
Bad/good
Unfavorable/favorable
Unpleasant/pleasant
Purchase Intention 3 0.827
If the jeans were priced at a price you were
willing to pay, will you purchase clothing from
The Denim Company?
If the jeans were priced at a price you were
willing to pay, will you tell a friend about The
Denim Company?
If products with farm and factory information are
available in the shops, I would intend to buy it.
40
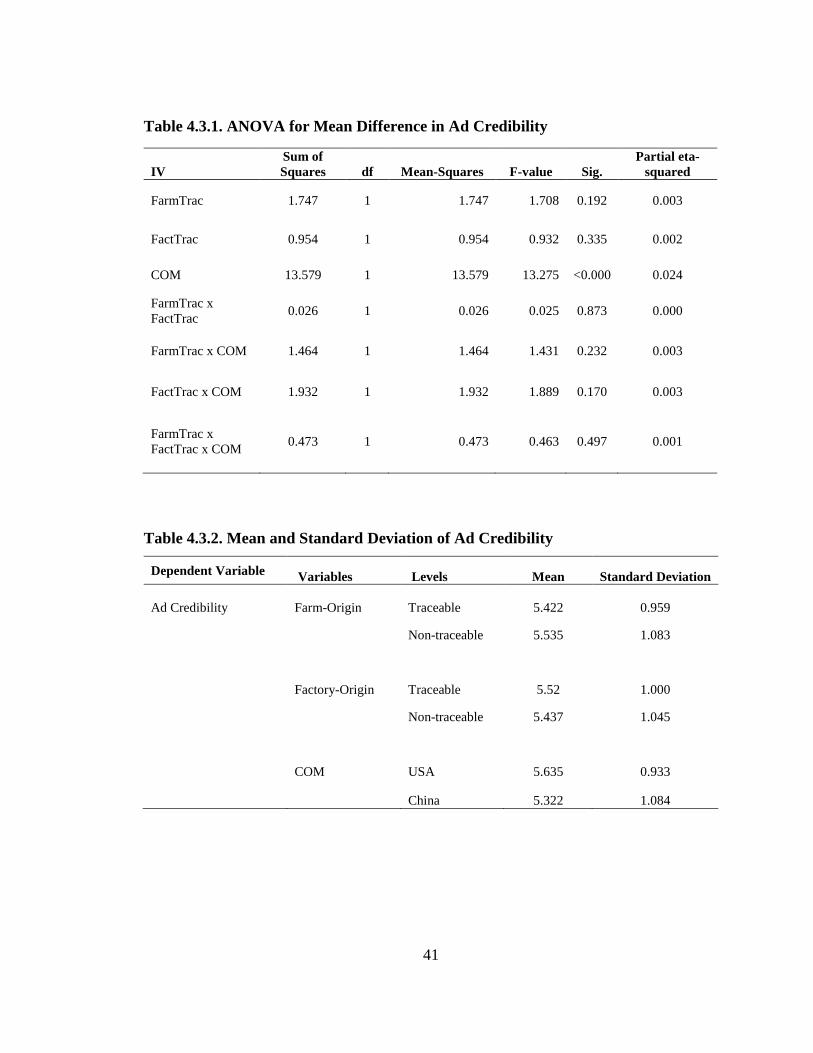
Attitude towards advertisement was found to be significantly different in presence
and absence of farm traceability [F(1,544)=16.113, p<0.001]. When participants were
exposed to webpages having farm-traceable information, their mean AaD was
significantly higher (mean=5.271) than when participants exposed to webpages with ‘no
farm-traceability’ (mean=4.926). Similarly AaD was found to be significantly different
for COM as USA and COM as China [F(1,544)= 27.614, p<0.001]. When webpages had
information about COM being USA, respondents had a higher mean attitude towards the
ad (mean=5.324), compared to when webpages had information about COM being China
(mean=4.872).
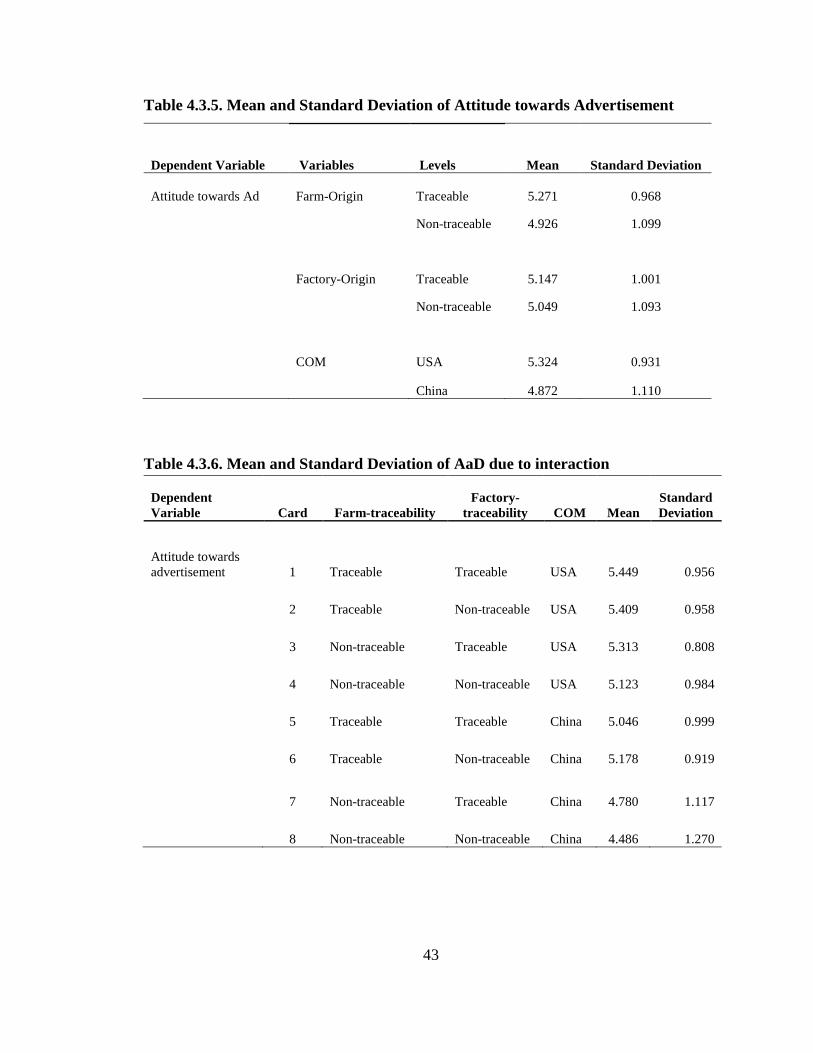
Attitude towards product was found to be significantly different for COM as USA
and China [F(1,544)=13.769, p<0.001]. When participants were exposed to ‘Made in
USA’ products, they had higher mean attitude towards products (mean=5.170), compared
to when participants were exposed to ‘Made in China’ products (mean=4.640).
Finally, purchase intention was found to be significantly different for COM as
USA and China [(F(1,544)=19.860, p<0.001]. When participants were exposed to ‘Made
in USA’ products, they had higher mean purchase intention (mean=5.286), compared to
when participants were exposed to ‘Made in China’ products (mean=4.774).
41
Table 4.3.1. ANOVA for Mean Difference in Ad Credibility
Table 4.3.2. Mean and Standard Deviation of Ad Credibility
Dependent Variable Variables Levels Mean Standard Deviation
Ad Credibility Farm-Origin Traceable 5.422 0.959
Non-traceable 5.535 1.083
Factory-Origin Traceable 5.52 1.000
Non-traceable 5.437 1.045
COM USA 5.635 0.933
China 5.322 1.084
IV
Sum of
Squares df Mean-Squares F-value Sig.
Partial eta-
squared
FarmTrac 1.747 1 1.747 1.708 0.192 0.003
FactTrac 0.954 1 0.954 0.932 0.335 0.002
COM 13.579 1 13.579 13.275 <0.000 0.024
FarmTrac x
FactTrac 0.026 1 0.026 0.025 0.873 0.000
FarmTrac x COM 1.464 1 1.464 1.431 0.232 0.003
FactTrac x COM 1.932 1 1.932 1.889 0.170 0.003
FarmTrac x
FactTrac x COM 0.473 1 0.473 0.463 0.497 0.001

42
Table 4.3.3. Mean and Standard Deviation of Ad Credibility based on Interaction
Dependent
Variable Card Farm-traceability Factory-traceability COM Mean
Standard
Deviation
Ad Credibility 1 Traceable Traceable USA 5.763 0.875
2 Traceable Non-traceable USA 5.514 0.930
3 Non-traceable Traceable USA 5.709 0.981
4 Non-traceable Non-traceable USA 5.552 0.942
5 Traceable Traceable China 5.376 0.938
6 Traceable Non-traceable China 5.484 1.061
7 Non-traceable Traceable China 5.232 1.122
8 Non-traceable Non-traceable China 5.195 1.203
Table 4.3.4. ANOVA for Mean Difference in Attitude towards Advertisement
IV
Sum of
Squares df
Mean-
Squares
F-
value Sig.
Partial eta-
squared
FarmTrac 16.403 1 16.403 16.113 <0.000 0.029
FactTrac 1.331 1 1.331 1.307 0.253 0.002
COM 28.111 1 28.111 27.614 <0.000 0.048
FarmTrac x FactTrac 2.867 1 2.867 2.816 0.094 0.005
FarmTrac x COM 2.468 1 2.468 2.425 0.12 0.004
FactTrac x COM 0.039 1 0.039 0.038 0.845 0.000
FarmTrac x FactTrac x
COM 0.656 1 0.656 0.645 0.422 0.001
43
Table 4.3.5. Mean and Standard Deviation of Attitude towards Advertisement
Dependent Variable Variables Levels Mean Standard Deviation
Attitude towards Ad Farm-Origin Traceable 5.271 0.968
Non-traceable 4.926 1.099
Factory-Origin Traceable 5.147 1.001
Non-traceable 5.049 1.093
COM USA 5.324 0.931
China 4.872 1.110
Table 4.3.6. Mean and Standard Deviation of AaD due to interaction
Dependent
Variable Card Farm-traceability
Factory-
traceability COM Mean
Standard
Deviation
Attitude towards
advertisement 1 Traceable Traceable USA 5.449 0.956
2 Traceable Non-traceable USA 5.409 0.958
3 Non-traceable Traceable USA 5.313 0.808
4 Non-traceable Non-traceable USA 5.123 0.984
5 Traceable Traceable China 5.046 0.999
6 Traceable Non-traceable China 5.178 0.919
7 Non-traceable Traceable China 4.780 1.117
8 Non-traceable Non-traceable China 4.486 1.270
44
Table 4.3.7. ANOVA for Mean Difference in Attitude towards Product
IV
Sum of
Squares df
Mean-
Squares
F-
value Sig.
Partial eta-
squared
FarmTrac 1.139 1 1.139 0.405 0.525 0.001
FactTrac 0.282 1 0.282 0.100 0.752 0.000
COM 38.738 1 38.738 13.769 <0.000 0.025
FarmTrac x FactTrac 6.528 1 6.528 2.320 0.128 0.004
FarmTrac x COM 0.051 1 0.051 0.018 0.893 0.000
FactTrac x COM 0.36 1 0.360 0.128 0.721 0.000
FarmTrac x FactTrac x
COM 3.276 1 3.276 1.164 0.281 0.002
Table 4.3.8. Mean and Standard Deviation of Attitude towards Product
Dependent Variable Variables Levels Mean Standard Deviation
Attitude towards
product Farm-Origin Traceable 4.950 1.997
Non-traceable 4.859 1.318
Factory-Origin Traceable 4.927 1.299
Non-traceable 4.882 2.017
COM USA 5.170 1.232
China 4.640 2.022
45
Table 4.3.9. Mean and Standard Deviation of AaP due to interaction
Dependent
Variable Card
Farm-
traceability
Factory-
traceability COM Mean
Standard
Deviation
1 Traceable Traceable USA 5.087 1.375
Attitude towards
product
2 Traceable Non-traceable USA 5.362 1.077
3 Non-traceable Traceable USA 5.349 1.071
4 Non-traceable Non-traceable USA 4.881 1.342
5 Traceable Traceable China 4.641 1.376
6 Traceable Non-traceable China 4.710 3.303
7 Non-traceable Traceable China 4.633 1.232
8 Non-traceable Non-traceable China 4.575 1.478
Table 4.3.10. ANOVA for Mean Difference in Purchase Intention
IV
Sum of
Squares df
Mean-
Squares
F-
value Sig.
Partial eta-
squared
FarmTrac 3.328 1 3.328 1.828 0.177 0.003
FactTrac 0.284 1 0.284 0.156 0.693 0.000
COM 36.154 1 36.154 19.86 <0.000 0.035
FarmTrac x FactTrac 1.667 1 1.667 0.916 0.339 0.002
FarmTrac x COM 0.889 1 0.889 0.488 0.485 0.001
FactTrac x COM 0.943 1 0.943 0.518 0.472 0.001
FarmTrac x FactTrac x
COM 0.483 1 0.483 0.265 0.607 0.000

46
Table 4.3.11. Mean and Standard Deviation of Purchase Intention
Dependent Variable
Independent
Variable Levels Mean Standard Deviation
Purchase Intention Farm-Origin Traceable 5.108 1.403
Non-traceable 4.952 1.333
Factory-Origin Traceable 5.053 1.414
Non-traceable 5.007 1.325
COM USA 5.286 1.239
China 4.774 1.446
Table 4.3.12. Mean and Standard Deviation of Purchase Intention due to interaction
Dependent
Variable Card Farm-traceability
Factory-
traceability COM Mean
Standard
Deviation
Purchase Intention 1 Traceable Traceable USA 5.362 1.436
2 Traceable Non-traceable USA 5.285 1.172
3 Non-traceable Traceable USA 5.338 1.151
4 Non-traceable Non-traceable USA 5.159 1.198
5 Traceable Traceable China 4.789 1.593
6 Traceable Non-traceable China 4.995 1.328
7 Non-traceable Traceable China 4.722 1.343
8 Non-traceable Non-traceable China 4.591 1.496

47
Thus, these results show that presence of farm traceability compared to products
with no farm traceability, was more positively related to attitude towards ad, supporting
hypothesis H1a. Similarly, products with the USA as their COM compared to products
with China as their COM was more positively related to respondents’ purchase intention.
Thus the results supported hypotheses H3 (a-d). However no statistical significant mean
differences were observed for other proposed hypotheses, and were thus not supported.
Also as hypothesized, farm-traceability, factory-traceability, and COM did not interact
with each other for all four dependent variables. Therefore, hypotheses 4 (a-d), 5 (a-d), 6
(a-d), and 7 (a-d) were also not supported.
Additional Analyses for Gender
In textile and apparel research literature, females have generally comprised a
larger proportion of the sample used by researchers. However, in this study the
distribution of gender among participants was different, with approximately 64% males,
and 36% females. Although the literature has not documented gender differences
regarding the effects of traceability on attitudes, a gender interaction was further
examined given the nature of the sample. Hence the effects of gender, if any, on the
dependent variables was analyzed, by comparing the mean difference of males and
females on both main effects and the interaction effects.
Mean Difference between Male and Female
Independent sample t-tests were conducted to test for mean differences in
responses between male and female participants on the dependent variables. Results

48
indicated there were no significant differences (main effects) based on participants’
gender for any of the dependent variables.
Table 4.5.1. Independent Sample t-test for male and female participants
However, gender did interact with the independent variables of traceability (farm-
traceability, factory traceability, and COM) to generate varied significant effects on the
dependent variables.
For the ad credibility, gender significantly interacted with factory-traceability
[F(1,533)=8.616, p=0.003]. When webpages were factory traceable, female participants
had a higher mean ad-credibility (mean=5.708) than male participants (mean=5.438).
When webpages were not factory traceable, interestingly male participants reported of
higher ad credibility (mean=5.539) than female participants (mean= 5.283). Females’
mean ad credibility when exposed to factory-traceable webpages was higher
(mean=5.708) than when exposed to non-factory-traceable webpages (mean=5.283). For
males, mean ad credibility did not differ much with presence (mean=5.438) or absence
(mean=5.539) of factory-traceable information.
t-test for Equality of
Means
Dependent Variable Gender Mean t Sig.
Ad Credibility Male 5.4857 0.142 0.887
Female 5.4724
Attitude towards Ad Male 5.0843
-0.451 0.652
Female 5.1269
Attitude towards Product Male 4.915
0.154 0.878
Female 4.8882
Purchase intention Male 4.961
-1.492 0.136
Female 5.1491
49
Similarly, gender interacted with COM to create a significant mean difference in
ad credibility [F(1,533)=3.557, p=0.06]. When webpages had information about COM
being USA, female participants had a higher ad-credibility (mean=5.768) than male
participants (mean=5.592). When webpages had COM as China, interestingly male
participants reported of higher ad credibility (mean=5.385) than female participants
(mean= 5.223). Females’ mean ad credibility for webpages with COM being USA was
higher (mean=5.768) than for webpages with COM being China (mean=5.223). Males’
mean ad credibility for webpages with COM being USA was higher (mean=5.592) than
for webpages with COM being China (mean=5.385).
The two-way interaction of gender with farm traceability did not have statistically
significant differences on ad credibility. The three-way interaction of gender with farm
and factory traceability, farm traceability and COM, factory traceability and COM did not
generate statistically significant differences on ad credibility. The four-way interaction of
gender with farm traceability, factory traceability and COM, did not generate statistically
significant differences on ad credibility. Table 4.5.2 presents the ANOVA results for
mean difference in ad credibility due to gender. Table 4.5.3 and 4.5.4 present descriptive
statistics (mean and standard deviation) of ad credibility due to gender’s main effect and
its interaction.

50
Table 4.5.2. ANOVA for mean difference in Ad Credibility Due to Gender
Independent Variable
Sum of
Squares df
Mean-
Squares
F-
value Sig.
Partial eta-
squared
FarmTrac 0.680 1 0.68 0.676 0.412 0.001
FactTrac 3.297 1 3.297 3.276 0.071 0.006
COM 17.663 1 17.663 17.551 <0.000 0.032
Gender 0.006 1 0.006 0.006 0.940 0.000
FarmTrac x FactTrac 0.003 1 0.003 0.003 0.956 0.000
FarmTrac x COM 1.414 1 1.414 1.405 0.236 0.003
FarmTrac x Gender 2.461 1 2.461 2.445 0.118 0.005
FactTrac x COM 1.872 1 1.872 1.86 0.173 0.003
FactTrac x Gender 8.671 1 8.671 8.616 0.003 0.016
COM x Gender 3.580 1 3.58 3.557 0.060 0.007
FarmTrac x FactTrac x
COM 0.358 1 0.358 0.355 0.551 0.001
FarmTrac x FactTrac x
Gender 1.878 1 1.878 1.866 0.173 0.003
FarmTrac x COM x
Gender 0.019 1 0.019 0.018 0.892 0.000
FactTrac x COM x
Gender 0.169 1 0.169 0.168 0.682 0.000
FarmTrac x FactTrac x
COM x Gender 0.002 1 0.002 0.002 0.964 0.000

51
Table 4.5.3. Mean and Standard Error of Ad Credibility due to Gender
Table 4.5.4. Mean and Standard Error of Ad Credibility due to Gender interaction
Independent Variable Levels Gender Mean
Standard.
Error
Factory Traceability Non-traceable Female 5.283 0.098
Male 5.539 0.077
Traceable Female 5.708 0.105
Male 5.438 0.075
COM China Female 5.223 0.101
Male 5.385 0.076
USA Female 5.768 0.102
Male 5.592 0.076
Dependent Variable Independent Variable Levels Mean
Standard
Error
Ad Credibility Farm-Traceability Traceable 5.455 0.065
Non-traceable 5.529 0.062
Factory-Traceability Traceable 5.573 0.064
Non-traceable 5.411 0.062
COM USA 5.68 0.064
China 5.304 0.063
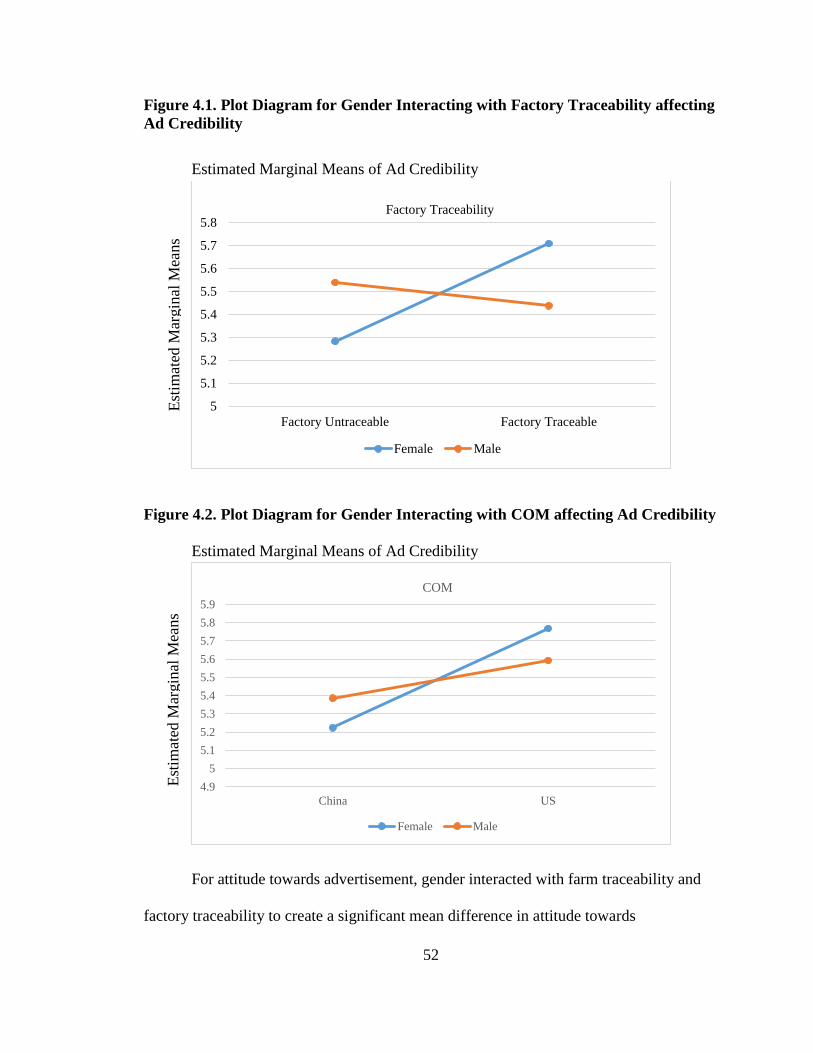
52
Figure 4.1. Plot Diagram for Gender Interacting with Factory Traceability affecting
Ad Credibility
Estimated Marginal Means of Ad Credibility
Figure 4.2. Plot Diagram for Gender Interacting with COM affecting Ad Credibility
Estimated Marginal Means of Ad Credibility
For attitude towards advertisement, gender interacted with farm traceability and
factory traceability to create a significant mean difference in attitude towards
5
5.1
5.2
5.3
5.4
5.5
5.6
5.7
5.8
Factory Untraceable Factory Traceable
Factory Traceability
Female Male
4.9
5
5.1
5.2
5.3
5.4
5.5
5.6
5.7
5.8
5.9
China US
COM
Female Male
Est
imat
ed M
argin
al M
eans
Est
imat
ed M
argin
al M
eans
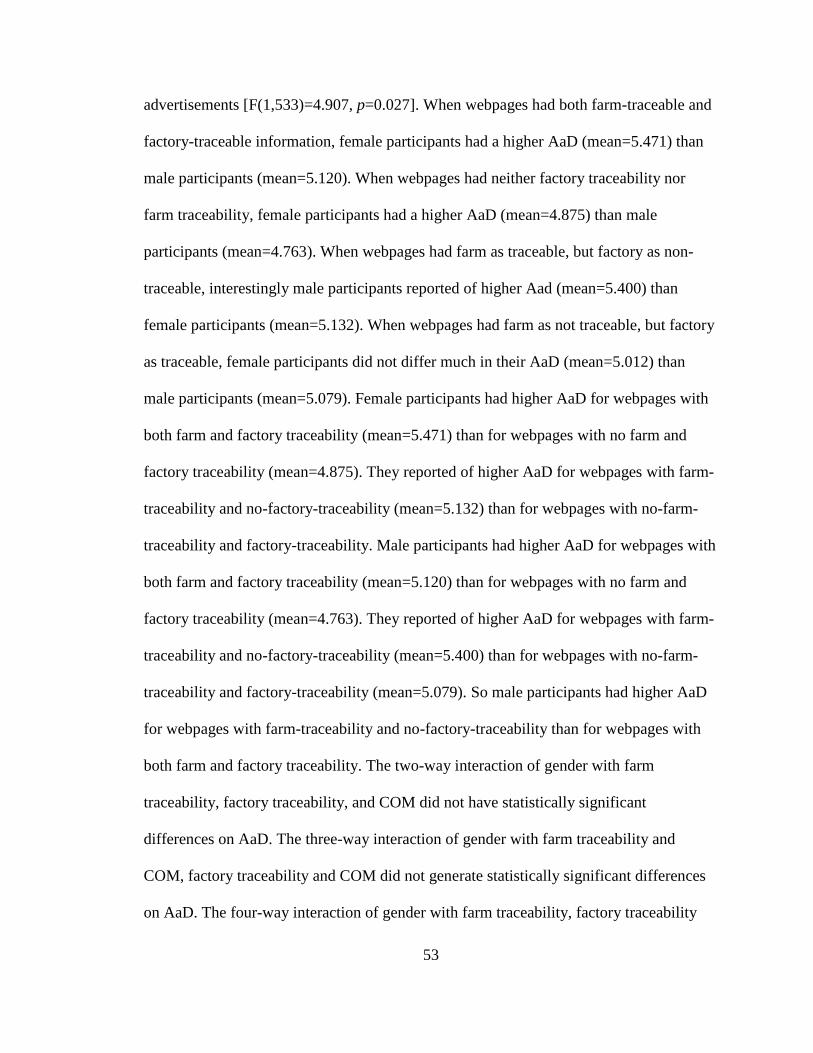
53
advertisements [F(1,533)=4.907, p=0.027]. When webpages had both farm-traceable and
factory-traceable information, female participants had a higher AaD (mean=5.471) than
male participants (mean=5.120). When webpages had neither factory traceability nor
farm traceability, female participants had a higher AaD (mean=4.875) than male
participants (mean=4.763). When webpages had farm as traceable, but factory as non-
traceable, interestingly male participants reported of higher Aad (mean=5.400) than
female participants (mean=5.132). When webpages had farm as not traceable, but factory
as traceable, female participants did not differ much in their AaD (mean=5.012) than
male participants (mean=5.079). Female participants had higher AaD for webpages with
both farm and factory traceability (mean=5.471) than for webpages with no farm and
factory traceability (mean=4.875). They reported of higher AaD for webpages with farm-
traceability and no-factory-traceability (mean=5.132) than for webpages with no-farm-
traceability and factory-traceability. Male participants had higher AaD for webpages with
both farm and factory traceability (mean=5.120) than for webpages with no farm and
factory traceability (mean=4.763). They reported of higher AaD for webpages with farm-
traceability and no-factory-traceability (mean=5.400) than for webpages with no-farm-
traceability and factory-traceability (mean=5.079). So male participants had higher AaD
for webpages with farm-traceability and no-factory-traceability than for webpages with
both farm and factory traceability. The two-way interaction of gender with farm
traceability, factory traceability, and COM did not have statistically significant
differences on AaD. The three-way interaction of gender with farm traceability and
COM, factory traceability and COM did not generate statistically significant differences
on AaD. The four-way interaction of gender with farm traceability, factory traceability

54
and COM, did not generate statistically significant differences on AaD. Table 4.5.5
presents ANOVA results for mean difference in attitude towards ad due to gender. Table
4.5.6 and 4.5.7 present descriptive statistics (mean and standard deviation) of attitude
towards ad due to gender’s main effect and its interaction.
Table 4.5.5. ANOVA for mean difference in AaD Due to Gender
IV
Sum of
Squares df
Mean-
Squares F-value Sig.
Partial
eta-
squared
FarmTrac 15.202 1 15.202 14.956 <0.000 0.027
FactTrac 2.047 1 2.047 2.014 0.156 0.004
COM 31.839 1 31.839 31.325 <0.000 0.056
Gender 0.130 1 0.130 0.128 0.721 0.000
FarmTrac x FactTrac 1.210 1 1.210 1.191 0.276 0.002
FarmTrac x COM 2.531 1 2.531 2.490 0.115 0.005
FarmTrac x Gender 0.012 1 0.012 0.012 0.913 0.000
FactTrac x COM 0.204 1 0.204 0.201 0.654 0.000
FactTrac x Gender 1.513 1 1.513 1.489 0.223 0.003
COM x Gender 2.402 1 2.402 2.363 0.125 0.004
FarmTrac x FactTrac x
COM 0.251 1 0.251 0.247 0.619 0.000
FarmTrac x FactTrac x
Gender 4.988 1 4.988 4.907 0.027 0.009
FarmTrac x COM x
Gender 0.013 1 0.013 0.013 0.909 0.000
FactTrac x COM x
Gender 0.022 1 0.022 0.022 0.882 0.000
FarmTrac x FactTrac x
COM x Gender 0.741 1 0.741 0.729 0.394 0.001
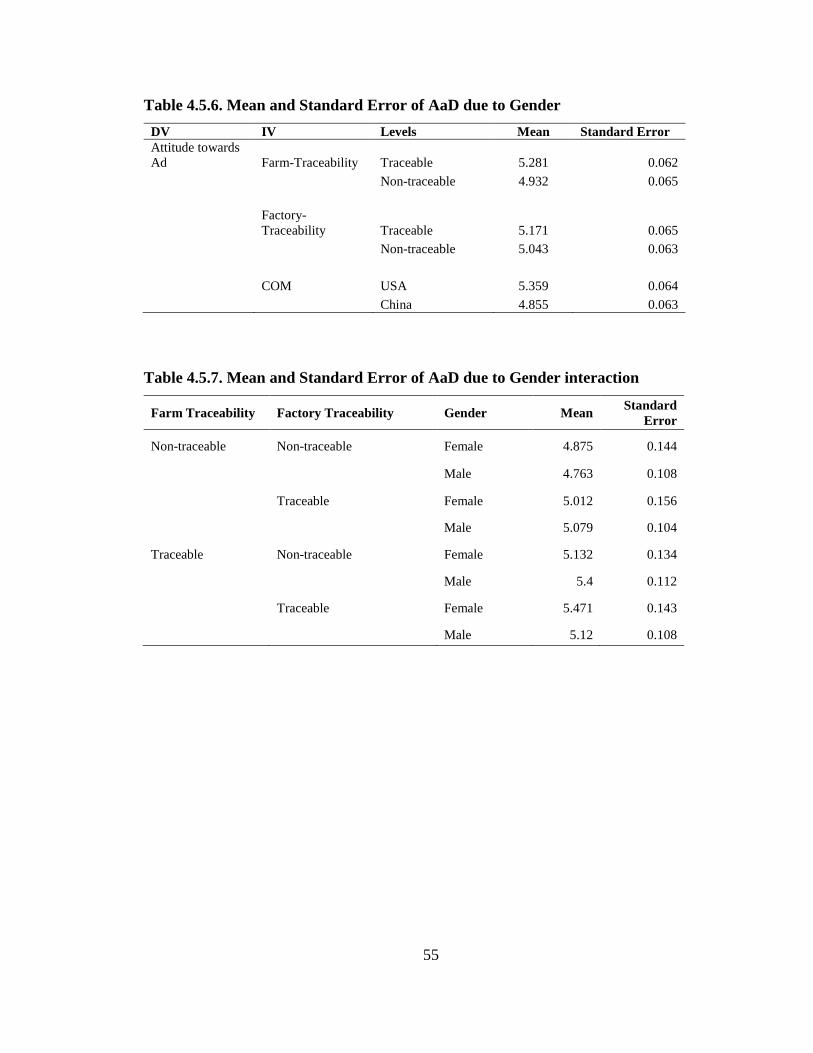
55
Table 4.5.6. Mean and Standard Error of AaD due to Gender
DV IV Levels Mean Standard Error
Attitude towards
Ad Farm-Traceability Traceable 5.281 0.062
Non-traceable 4.932 0.065
Factory-
Traceability Traceable 5.171 0.065
Non-traceable 5.043 0.063
COM USA 5.359 0.064
China 4.855 0.063
Table 4.5.7. Mean and Standard Error of AaD due to Gender interaction
Farm Traceability Factory Traceability Gender Mean Standard
Error
Non-traceable Non-traceable Female 4.875 0.144
Male 4.763 0.108
Traceable Female 5.012 0.156
Male 5.079 0.104
Traceable Non-traceable Female 5.132 0.134
Male 5.4 0.112
Traceable Female 5.471 0.143
Male 5.12 0.108
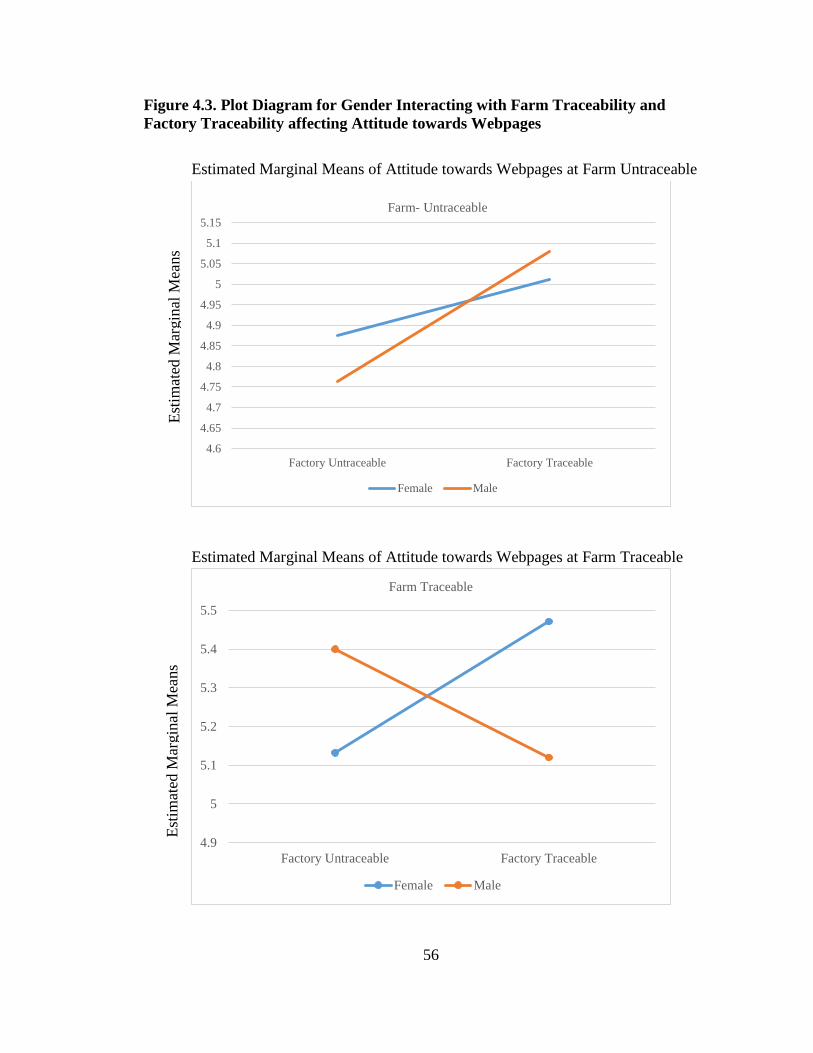
56
Figure 4.3. Plot Diagram for Gender Interacting with Farm Traceability and
Factory Traceability affecting Attitude towards Webpages
Estimated Marginal Means of Attitude towards Webpages at Farm Untraceable
Estimated Marginal Means of Attitude towards Webpages at Farm Traceable
4.6
4.65
4.7
4.75
4.8
4.85
4.9
4.95
5
5.05
5.1
5.15
Factory Untraceable Factory Traceable
Farm- Untraceable
Female Male
4.9
5
5.1
5.2
5.3
5.4
5.5
Factory Untraceable Factory Traceable
Farm Traceable
Female Male
Est
imat
ed M
argin
al M
eans
Est
imat
ed M
argin
al M
eans

57
Gender interacted with factory-traceability to create a significant mean difference
in attitude towards product [F(1,533)=4.442, p=0.036]. When webpages had information
about factory-traceability, female participants had higher AaP (mean=5.108) than male
participants (mean=4.818). When webpages had no information about factory
traceability, interestingly, male participants had higher AaP (mean=5.013) than female
participants (mean=4.673). Females’ mean AaP when exposed to factory traceable
webpages was higher (mean=5.108) than when exposed to non-factory-traceable
webpages (mean=4.673). Males’ mean AaP when exposed to factory traceable webpages
was lower (mean=4.818) than when exposed to non-factory-traceable webpages
(mean=5.013).
Similarly, gender interacted with factory traceability and COM as USA, to create
a significant mean difference in attitude towards products [F(1,533)=3.508, p=0.062].
When webpages had both factory-traceable information and COM as USA, female
participants had a higher AaP (mean=5.271) than male participants (mean=5.198). When
webpages had no factory traceability and COM as China, female participants had lower
AaP (mean=4.217) than male participants (mean=4.901). When webpages had factory as
traceable, but COM as China, female participants reported of higher AaP 9mean=4.944)
than male participants (mean=4.438). When webpages had factory as non-traceable and
COM as USA, female participants did not differ much in their AaP (5.129) than male
participants (mean=5.126). Female participants had higher AaP for webpages with
factory traceable information and COM as USA (mean=5.271) than for webpages with no
factory-traceability and COM as China (mean=4.217). They reported of higher AaP
(mean=5.129) for webpages with no-farm-traceability and COM as USA, than for

58
webpages with farm traceability and COM as China (mean=4.944). Male participants had
higher AaP for webpages with factory traceability and COM as USA (mean=5.198) than
for webpages with no factory traceability and COM as China (mean=4.217). When
webpages had COM as China, male participants’ AaP went down (mean=4.438) in
presence of factory-traceability, compared to webpages with no-factory-traceability
(mean=4.901). The two-way interaction of gender with farm traceability and COM did
not have statistically significant differences on AaP. The three-way interaction of gender
with farm and factory traceability, farm traceability and COM did not generate
statistically significant differences on AaP. The four-way interaction of gender with farm
traceability, factory traceability and COM, did not generate statistically significant
differences on AaP. Table 4.5.8 presents ANOVA results for mean difference in attitude
towards product due to gender. Table 4.5.9, 4.5.10 and 4.5.11 present descriptive
statistics (mean and standard deviation) of attitude towards product due to gender’s main
effect and its interaction.

59
Table 4.5.8. ANOVA for mean difference in AaP Due to Gender
IV
Sum of
Squares df
Mean-
Squares
F-
value Sig.
Partial eta-
squared
FarmTrac 0.838 1 0.838 0.299 0.585 0.001
FactTrac 1.785 1 1.785 0.638 0.425 0.001
COM 38.740 1 38.740 13.837 <0.000 0.025
Gender 0.080 1 0.080 0.029 0.866 0.000
FarmTrac x FactTrac 4.298 1 4.298 1.535 0.216 0.003
FarmTrac x COM 0.014 1 0.014 0.005 0.943 0.000
FarmTrac x Gender 0.338 1 0.338 0.121 0.729 0.000
FactTrac x COM 0.020 1 0.020 0.007 0.933 0.000
FactTrac x Gender 12.435 1 12.435 4.442 0.036 0.008
COM x Gender 0.506 1 0.506 0.181 0.671 0.000
FarmTrac x FactTrac
x COM 3.533 1 3.533 1.262 0.262 0.002
FarmTrac x FactTrac
x Gender 4.610 1 4.610 1.647 0.200 0.003
FarmTrac x COM x
Gender 0.593 1 0.593 0.212 0.646 0.000
FactTrac x COM x
Gender 9.822 1 9.822 3.508 0.062 0.007
FarmTrac x FactTrac
x COM x Gender 1.967 1 1.967 0.703 0.402 0.001
Table 4.5.9. Mean and Standard Error of AaP due to Gender
DV IV Levels Mean Standard Error
Attittude towards
Product Farm- Traceability Traceable 4.944 0.104
Non-traceable 4.862 0.108
Factory-
Traceability Traceable 4.963 0.107
Non-traceable 4.843 0.104
COM USA 5.181 0.106
China 4.625 0.105

60
Table 4.5.10. Mean and Standard Error of AaP due to Gender interaction (2-way)
Factory Traceability Gender Mean Standard. Error
Non-traceable Female 4.673 0.163
Male 5.013 0.129
Traceable Female 5.108 0.175
Male 4.818 0.125
Table 4.5.11. Mean and Standard Error of AaP due to Gender interaction (3-way)
Factory Traceability COM Gender Mean Standard. Error
Factory Untraceable
China
Female 4.217 0.235
Male 4.901 0.179
US
Female 5.129 0.227
Male 5.126 0.186
Factory Traceable
China
Female 4.944 0.240
Male 4.438 0.179
US
Female 5.271 0.255
Male 5.198 0.173
Figure 4.4. Plot Diagram for Gender Interacting with Factory Traceability affecting
Attitude towards Product
Estimated Marginal Means of Attitude towards Product
4.4
4.5
4.6
4.7
4.8
4.9
5
5.1
5.2
Factory Untraceable Factory Traceable
Factory Traceability
Female Male
Est
imat
ed M
argin
al M
eans
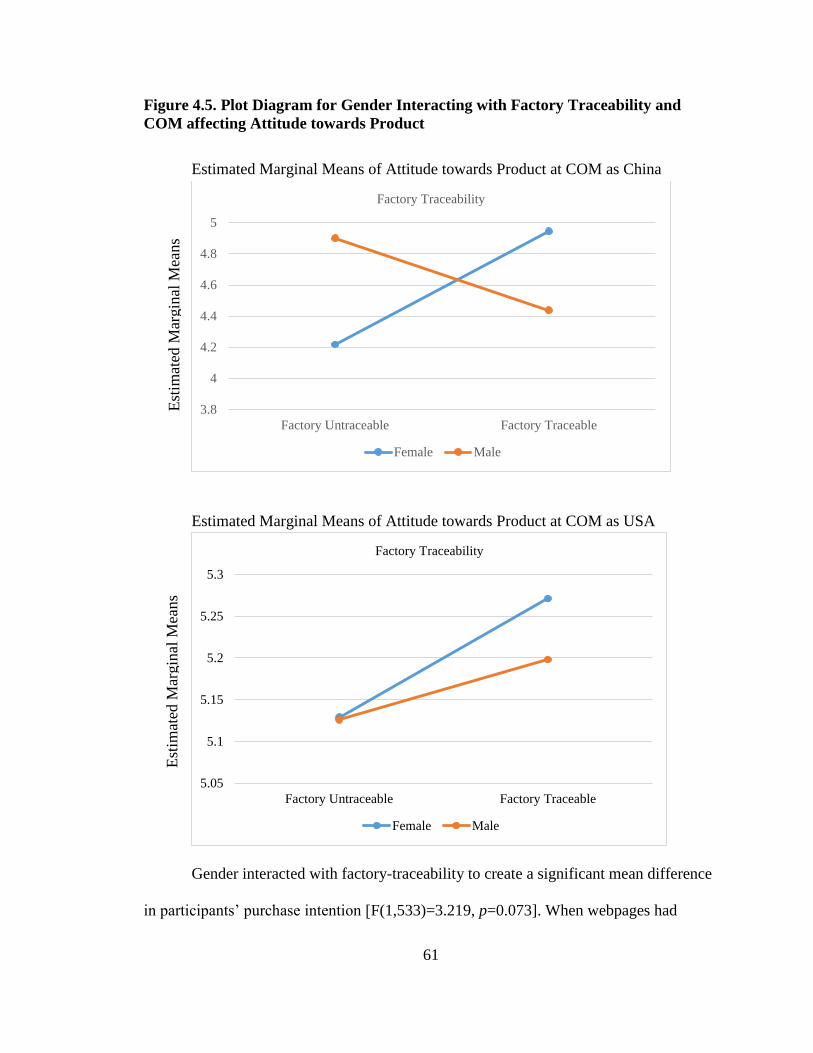
61
Figure 4.5. Plot Diagram for Gender Interacting with Factory Traceability and
COM affecting Attitude towards Product
Estimated Marginal Means of Attitude towards Product at COM as China
Estimated Marginal Means of Attitude towards Product at COM as USA
Gender interacted with factory-traceability to create a significant mean difference
in participants’ purchase intention [F(1,533)=3.219, p=0.073]. When webpages had
3.8
4
4.2
4.4
4.6
4.8
5
Factory Untraceable Factory Traceable
Factory Traceability
Female Male
5.05
5.1
5.15
5.2
5.25
5.3
Factory Untraceable Factory Traceable
Factory Traceability
Female Male
Est
imat
ed M
argin
al M
eans
Est
imat
ed M
argin
al M
eans

62
information about factory-traceability, female participants had a higher PI (mean= 5.305)
than male participants (mean=4.903). When webpages had no information about factory
traceability, interestingly, male participants had higher PI (mean=5.023) than female
participants (mean=4.995). Females’ mean PI when exposed to factory traceable
webpages was higher (mean=5.305) than when exposed to non-factory-traceable
webpages (mean=4.995). Males’ mean PI when exposed to factory traceable webpages
was lower (mean=4.903) than when exposed to non-factory-traceable webpages
(mean=5.023).
Similarly, gender interacted with both farm and factory traceability to create a
significant mean difference in PI [F(1,533)=4.501, p=0.034]. When webpages had both
farm-traceable and factory-traceable information, female participants had a higher PI
(mean=5.555) than that of male participants (mean=4.783). When webpages had neither
farm-traceability nor factory-traceability, female participants did not have much different
PI (mean=4.944) than male participants (mean=4.832). When webpages had farm as
traceable, but factory as non-traceable, female participants had lower PI (mean=5.046)
than male participants (mean=5.215). When webpages had farm as non-traceable but
factory as traceable, female participants did not report much different PI (mean=5.056)
than male participants (mean=5.022). Female participants had higher PI for webpages
with both farm and factory traceability (mean=5.555) than for webpages with neither
farm nor factory traceability (mean=4.944). There was not much difference in their PI for
webpages with farm-traceability but no factory traceability (mean=5.046), than for
webpages with no farm-traceability but factory-traceability (mean=5.056). Male
participants had slightly lower PI for webpages with both farm and factory traceability

63
(mean=4.783), than for webpages with neither farm nor factory traceability
(mean=4.832). They had higher PI (mean=5.215) for webpages with farm-traceability but
no factory traceability, than for webpages with no farm-traceability but factory-
traceability (mean=5.022).
Gender also interacted with farm traceability and COM as USA to create a
significant mean difference in PI [F(1,533)=3.077, p=0.080]. When webpages had both
farm-traceable information and COM as USA, female participants had a higher PI
(mean=5.405) than male participants (mean=5.315). When webpages had no farm-
traceable information and COM as China, female participants had a lower PI
(mean=4.564) than male participants (mean=4.701). When webpages had farm as
traceable and COM as China, female participants had higher PI (mean=5.196) than male
participants (mean=4.683). When webpages had farm as non-traceable and COM as
USA, female participants had higher PI (mean=5.435) than male participants
(mean=5.153). Female participants had higher PI for webpages with farm traceability and
COM as USA (mean=5.405) than for webpages with no farm traceability and COM as
China (mean=4.564). They had lower PI (mean=5.196) for webpages with farm-
traceability and COM as China, than for webpages with no farm-traceability and COM as
USA (mean=5.435). Male participants had higher PI for webpages with farm traceability
and COM as USA (mean=5.315), than for webpages with no farm traceability and COM
as China (mean=4.701). They had lower PI (mean=4.683) for webpages with farm-
traceability and COM as China, than for webpages with no farm-traceability and COM as
USA (mean=5.153). The two-way interaction of gender with farm traceability, and COM
did not have statistically significant differences on PI. The three-way interaction of

64
gender with factory traceability and COM did not generate statistically significant
differences on PI. The four-way interaction of gender with farm traceability, factory
traceability and COM, did not generate statistically significant differences on PI. Table
4.5.12 presents ANOVA results for mean difference in purchase intention due to gender.
Table 4.5.13, 4.5.14 and 4.5.15 present descriptive statistics (mean and standard
deviation) of purchase intention due to gender’s main effect and its interaction.
Table 4.5.12. ANOVA for mean difference in PI Due to Gender
IV
Sum of
Squares df
Mean-
Squares F-value Sig.
Partial eta-
squared
FarmTrac 4.350 1 4.350 2.406 0.121 0.004
FactTrac 1.128 1 1.128 0.624 0.430 0.001
COM 36.679 1 36.679 20.291 <0.000 0.037
Gender 4.392 1 4.392 2.430 0.120 0.005
FarmTrac x FactTrac 0.390 1 0.390 0.216 0.642 0.000
FarmTrac x COM 1.820 1 1.820 1.007 0.316 0.002
FarmTrac x Gender 1.634 1 1.634 0.904 0.342 0.002
FactTrac x COM 1.309 1 1.309 0.724 0.395 0.001
FactTrac x Gender 5.818 1 5.818 3.219 0.073 0.006
COM x Gender 0.000 1 0.000 0.000 0.990 0.000
FarmTrac x FactTrac x
COM 0.435 1 0.435 0.241 0.624 0.000
FarmTrac x FactTrac x
Gender 8.136 1 8.136 4.501 0.034 0.008
FarmTrac x COM x
Gender 5.562 1 5.562 3.077 0.080 0.006
FactTrac x COM x Gender 0.024 1 0.024 0.013 0.909 0.000
FarmTrac x FactTrac x
COM x Gender 0.009 1 0.009 0.005 0.943 0.000

65
Table 4.5.13. Mean and Standard Error of PI due to Gender
DV IV Levels Mean Standard Error
Purchase
Intention Farm-Traceable Traceable 5.15 0.083
Non-traceable 4.963 0.087
Factory-Traceable Traceable 5.104 0.086
Non-traceable 5.009 0.084
COM USA 5.327 0.085
China 4.786 0.084
Table 4.5.14: Mean and Standard Error of PI due to Gender interaction (2-way)
Factory Traceability Gender Mean Standard Error
Non-traceable Female 4.995 0.131
Male 5.023 0.104
Traceable Female 5.305 0.141
Male 4.903 0.100

66
Table 4.5.15: Mean and Standard Error of PI due to Gender interaction (3-way)
Farm Traceability Factory Traceability Gender Mean
Standard.
Error
Non-traceable Non-traceable Female 4.944 0.192
Male 4.832 0.143
Traceable Female 5.056 0.207
Male 5.022 0.139
Traceable Non-traceable Female 5.046 0.178
Male 5.215 0.149
Traceable Female 5.555 0.19
Male 4.783 0.144
Non-traceable China Female 4.564 0.201
Male 4.701 0.141
USA Female 5.435 0.199
Male 5.153 0.141
Traceable China Female 5.196 0.18
Male 4.683 0.147
USA Female 5.405 0.189
Male 5.315 0.147
Thus, we see that male participants reported to have lower means when exposed
to webpages with farm-traceability and/or factory-traceability information compared to
webpages with no farm and/or factory traceability. Though the mean differences for
presence and absence of these information are low, it is interesting to notice that traceable
information reduces their ad credibility, AaD, AaP, and PI. However, when gender
interacted with COM, males reported higher means when exposed to products with Made
in USA information than products with Made in China information.

67
Summary of Results
Table 4.6 provides a summary of the results. Farm-traceability had a statistically
significant effect on attitude towards advertisement, thereby supporting hypothesis 1.b. It
did not have significant effect on other dependent variables, thereby rejecting hypotheses
H1.a, H1.c, and H1.d. Factory traceability did not have any significant effect on any of
the four dependent variables, thereby, rejecting hypothesis H2 (a-d). COM was found to
have statistically significant effect on ad credibility, AaD, AaP, and PI, thereby
supporting hypothesis 3 (a-d). The interaction of the traceability variables and COM had
no statistically significant effect, thereby rejecting H4 (a-d), H5 (a-d), H6 (a-d) and H7
(a-d). However, further investigation revealed the interaction effect of gender moderating
with farm traceability, factory traceability, and COM (as USA) on ad credibility, Aad,
AaP, and PI.
Figure 4.6. Plot Diagram for Gender Interacting with Factory Traceability affecting
Purchase Intention
Estimated Marginal Means of Purchase Intention
4.4
4.5
4.6
4.7
4.8
4.9
5
5.1
5.2
Factory Untraceable Factory Traceable
Factory traceability
Female Male
Est
imat
ed M
argin
al M
eans

68
Figure 4.7. Plot Diagram for Gender Interacting with Farm Traceability and
Factory Traceability affecting Purchase Intention
Estimated Marginal Means of Purchase Intention at Farm Untraceable
Estimated Marginal Means of Purchase Intention at Farm Untraceable
4.7
4.75
4.8
4.85
4.9
4.95
5
5.05
5.1
Factory Untraceable Factory Traceable
Factory Traceability
Female Male
4.2
4.4
4.6
4.8
5
5.2
5.4
5.6
5.8
Factory Untraceable Factory Traceable
Factory Traceability
Female Male
Est
imat
ed M
argin
al M
eans
Est
imat
ed M
argin
al M
eans

69
Figure 4.8. Plot Diagram for Gender Interacting with Farm Traceability and COM
affecting Purchase Intention
Estimated Marginal Means of Purchase Intention at Farm Untraceable
Estimated Marginal Means of Purchase Intention at Farm Untraceable
4
4.2
4.4
4.6
4.8
5
5.2
5.4
5.6
China USA
Farm Traceability
Female Male
4.2
4.4
4.6
4.8
5
5.2
5.4
5.6
China USA
Farm Traceability
Female Male
Est
imat
ed M
argin
al M
eans
Est
imat
ed M
argin
al M
eans

70
Table 4.6. Summary of Results
Hypothesis Result
H1: Products with farm-traceability will be more positively related to:
a) Perceived Ad Not-supported
b) Attitude towards Ad Supported
c) Attitude towards Product Not-supported
d) Purchase Intention Not-supported
H2: Products with factory-traceability will be more positively related to:
a) Perceived Ad Not-supported
b) Attitude towards Ad Not-supported
c) Attitude towards Product Not-supported
d) Purchase Intention Not-supported
H3: Products with USA as their COM will be more positively related to:
a) Perceived Ad Supported
b) Attitude towards Ad Supported
c) Attitude towards Product Supported
d) Purchase Intention Supported
H4: Products with farm-traceability and factory-traceability will be more positively
related to :
a) Perceived Ad Not-supported
b) Attitude towards Ad Not-supported
c) Attitude towards Product Not-supported
d) Purchase Intention Not-supported
H5: Products with farm-traceability and USA as COM will be more positively related
to :
a) Perceived Ad Not-supported
b) Attitude towards Ad Not-supported
c) Attitude towards Product Not-supported
d) Purchase Intention Not-supported
H6: Products with factory-traceability and USA as COM will be more positively
related to :
a) Perceived Ad Not-supported
b) Attitude towards Ad Not-supported
c) Attitude towards Product Not-supported
d) Purchase Intention Not-supported
H7: Products with farm-traceability, factory-traceability, and USA as COM
will be more positively related to :
a) Perceived Ad Not-supported
b) Attitude towards Ad Not-supported
c) Attitude towards Product Not-supported
d) Purchase Intention Not-supported

71
CHAPTER V: CONCLUSIONS
This chapter includes (a) summary of the study, (b) discussion of the major
findings, (c) implications and contributions of findings, and (d) study limitations and
future research suggestions.
Summary of the Study
Consumers have shown a preference for having access to product and company
information at the point of purchase of an apparel product (Bhaduri et al, 2011). The
completeness of a product’s information is directly and positively related to consumers’
product and brand preferences (Hiscox and Smyth, 2007; Hustvedt & Bernard, 2008;
Hustvedt & Bernard, 2010). Thus the availability of traceable information increases
assurance about product safety and quality, thereby, building consumer trust and
confidence (Clemens, 2003). The literature review suggests that in situations where it’s
difficult for consumers to judge the value and safety of a product through its appearance
alone, traceability guides them through the ‘credence factors’ which consumers can’t
experience at the point of sale, thereby, increasing their confidence (Hobbs et al., 2005;
Golan et al., 2002; Moe, 1998; Resende-Filho & Buhr, 2007). The knowledge of
manufacturing processes, and their impact on the environment assures consumers about
product aspects that might otherwise not be revealed. This study sought to investigate the
effect of traceability regarding fiber origin, factory origin, and the country of
manufacture, on consumers’ attitude towards apparel advertising, ad credibility, attitude
towards product, and purchase intentions for apparel.

72
The study hypothesized the following:
H1: Products with farm-traceability will have higher perceived ad credibility,
attitude towards advertisement, attitude towards products, and purchase intention
than products with no farm-traceability.
H2: Products with factory-traceability will have higher perceived ad credibility,
attitude towards advertisement, attitude towards products, and purchase intention
than products with no farm-traceability.
H3: Products with the USA as their COM will have higher perceived ad
credibility, attitude towards advertisement, attitude towards products, and
purchase intention than products with no farm-traceability.
H4: When products have farm-traceability and factory-traceability, consumers
will have higher perceived ad credibility, than when such information is absent.
H5: When products have farm-traceability and USA as COM, consumers will
have higher perceived ad credibility, than when such information is absent.
H6: When products have factory-traceability and USA as COM, consumers will
have higher perceived ad credibility, than when such information is absent.
H7: When products have farm-traceability, factory-traceability, and USA as
COM, consumers will have higher perceived ad credibility, than when such
information is absent.
For this study, a 2 (fiber-origin: traceable/non-traceable) x 2 (factory-origin:
traceable/non-traceable) x 2 (country of manufacture: USA/China) between subject
experimental design was used. Participants were exposed to total of eight combinations
of traceability and COM under the between-participants experimental design. Six
73
hundred and forty participants were recruited for the study through the AMT platform.
Eighty-eight responses out of 640 participants were excluded due to missing or bad data.
Participants’ age range was broadly distributed from 18 or above with the upper limit as
65 and above. Respondents consisted of 199 (36.1%) females and 350 (63.4%) males.
Participants consisted of both students and non-students and represented a wide range of
ethnic origins.
Discussion of Major Findings
Analysis of variance indicated that female participants experienced a higher
attitude towards webpages when exposed to products with farm-traceable information
than products with no such information. This result suggests that female participants
assessed and evaluated webpages to be positive, helpful, and beneficial when extra details
about the cotton farm were provided. As discussed in the literature review, consumers
have reported a growing interest in product origin. Thus, this finding supports existing
research, where presence of farm details like, farms’ locations, their contact farmers, and
their experience, made female participants experience a positive increase in their attitude
towards webpages. According to hypotheses 1 (a-d), when apparel products have extra
details about fiber origin, consumer are expected to have a more positive attitude towards
the product, the webpages showing such products, and a higher purchase intention. The
study results thus reported of statistically significant effect of farm traceability on attitude
towards webpages, thus supporting hypothesis H1 (b). However, the study results did not
find any statistically significant effect of farm traceability on ad credibility, attitude
towards products or purchase intention to support hypotheses H1 (a, c, and d). This
means that when participants were exposed to information about the cotton farm, in the

74
jean webpage, their attitude towards the jean and/or purchase intention were not
significantly higher than when they were exposed to webpages with no cotton farm
information. According to the definitions of attitude as used in this study, a higher rating
on attitude refers to participants’ better perception of the product in regards to any
expected benefits. Thus, as the study results reported, participants did not find farm-
traceability to be important enough to enhance then attitude towards the product
presented with farm information. Participants also did not have any increased intention to
buy products in the presence of such information.
Contrary to the hypotheses, factory traceability did not have any significant effect
on ad credibility, attitude towards, ad, attitude towards product, or purchase intention.
Thus, the presence of extra details about the factory involved in manufacturing the
product had no effect on participants with respect to increased expectations, benefits or
trust. As seen in the food literature, presence of traceable information about the food
supply chain positively impacted consumers’ confidence and purchase intention.
However, no such increase or difference in their intention was observed in this study
when participants were exposed to webpages with extra factory information.
Analysis of variance within this study indicated that country of manufacturing
(COM) has a statistically significant effect on ad credibility, attitude, and purchase
intention. When female participants saw products as Made in USA, their perceived ad
credibility was higher compared to Made in China products. COM may have acted as a
signal to female participants that enhanced their trust or otherwise supported their beliefs.
As the literature review suggested, respondents might have used this information about
COM to estimate their expected benefits from products, to evaluate their qualities and
75
confirm their purchase intentions. When webpages had USA as the manufacturing
country, female participants developed a better attitude towards the website than
compared to China as the manufacturing country. It is possible that they could trust the
website more, expect greater benefits, and react in more favorable ways. Similarly, they
also rated their attitude towards the product to be higher when it was made in USA, as
compare to products manufactured in China, indicating that products with USA as their
COM were perceived to generate more confidence in participants about the source,
quality and impact of a product purchase. Finally the results also reported that female
participants had higher intentions of purchasing apparel products if manufactured in the
US, as compared to those manufactured in China. These findings support the literature
that consumers’ purchase intentions for buying apparel products is expected to be
influenced by their overall attitude towards such apparel products available with traceable
information.
Though hypothesized, the interaction of farm-traceability, factory-traceability,
and COM did not create any significant effect on any of the four dependent variables.
While participants reported some differences in their attitude, perceived ad credibility,
and purchase intention were influenced by farm traceability, factory traceability and
COM individually, their responses reported no significant effect due to an interaction
between these factors. Presence of farm and factory traceability were expected to present
in-depth details about the products’ supply chain. Details about the farm origin of the
cotton fiber as used in the product, along with the manufacturing factory was expected to
shed light on two of the frequently requested pieces of information by some consumers.
Presence of farm-traceability along with COM was hypothesized to create a positive

76
impact due to inclusion of both farm identifiers and the COM. While farm traceability
would support farmers, products with the USA as the COM would address peoples’
perceptions about better quality and benefits from USA products. However, this
hypothesis was not supported. Similarly, the hypothesis about factory-traceability and
COM was not supported. The factory information along with country of manufacturing
did not generate any difference in participants’ opinions. Their attitude, perceived ad
credibility, and purchase intention were same for webpages with factory-traceable USA
manufactured products, and non-factory-traceable China made products. Finally, ad
credibility, attitude towards ad, attitude towards product, and purchase intention were not
statistically different in presence of farm-traceability, factory-traceability, and USA as
COM, when compared to non-traceable China manufactured apparel products.
The study did not hypothesize any effect for gender with respect to an impact on
consumers’ behaviors in an apparel purchase scenario. However, on further analysis,
gender had a statistically significant effect on the dependent variables while interacting
with farm traceability, factory traceability, and country of manufacturing. Female
participants reported a higher perceived ad credibility than male participants when they
were exposed to factory traceable webpages or USA manufactured products.
Furthermore, male participants did not find factory traceable webpages or USA made
products important enough, as their perceived ad credibility was reduced in the presence
of such information. Similarly, female participants rated the webpages more positive than
male participants when the webpages contained information about both farm and factory
traceability. Male participants had a more negative attitude towards webpages when they
saw traceable information about both farm and factory. That is, they reported negative

77
attitudes when they saw both farm and factory traceable than when only farm traceable
information was present. For attitude towards product, female participants reported a
more positive attitude towards the product than male participants when they saw factory
traceable webpages and/or USA manufactured products. When females saw the product
to also have factory as traceable, they evaluated the product to be better than non-
traceable products. For purchase intention, the female participants reported a higher
purchase intention than male participants when they saw webpages with factory
information. Even when the webpages had both farm and factory traceable, or the farm as
traceable and products manufactured in USA, female participants had a higher purchase
intention than males. In all the significant interactions, male participants always reported
a lower ad credibility, negative attitudes and lower purchase intentions when they saw
factory traceable information or saw all types of traceable information present altogether.
These gender differences may be due to differences in how males and females process
cues or use them as heuristics.
Contributions and Implications
The study findings have several important implications. First, the study explored
the concept of traceability applied to the textile and apparel industry, thus filling a gap in
literature. Traceability had been found to reinforce consumers’ trust and confidence for
products, brands, and webpages, in the food industry. When information about where the
raw-materials came from, where the product had been manufactured, and who had been
involved with the product were present, consumers’ confidence about products’
genuineness was increased. Though clothing consumption can be similar to food
consumption as a basic human need, clothing consumption differs from food in the sense
78
that it does not get exhausted with a single use, can be stored, and can be consumed again
and again. It is different in that it is not ingested when consumed. Traceability has been
widely used in food industry, but is a fairly innovative concept applied in the textile and
apparel industry. Only a few companies are taking the initiative to offer product
information beyond legal mandates. In the global dynamic business environment, where
most of the products are hybrid in nature, inclusion of such information might be an
option for apparel firms to better advertise their products. This might help firms to
specially cater to consumers with preferences for products of specific origin, specific
manufacturing country, or further details.
Second, the study findings strongly supported the previous literature of the
importance of COM for textile and apparel consumers. People perceive US manufactured
apparel products as a signal of high product qualities. The literature showed that
consumers use information about the manufacturing country to estimate benefits from
products, and to evaluate their qualities and confirm their purchase behavior. The
findings indicated similar results where female consumers had higher perceived ad
credibility, higher scores on attitude towards ad and product, and a higher purchase
intention rating for USA manufactured products than Chinese products. Thus businesses
manufacturing their apparel products in the U.S. can advertise this information not just as
a legal requirement, but as a value-addition claim. It also supports the potential of the
‘reshoring’ movement by the U.S. government in bringing manufacturing back to the
U.S. Also, businesses considering reshoring back to the US might tap into a potential
market.

79
Third, the findings of the study suggest that farm traceability positively affects
female consumers’ attitude towards advertisement. Based on the results of this study,
when female consumers have some evidence about where the fiber or raw-material of the
apparel product is sourced from, they estimate such products to be better compared to
products with no farm information. Considering that the presence of farm information
positively affects female consumers’ predisposition about webpages showing such
products and based on this study, apparel companies might use such information in their
product advertisements to enhance female consumer attitudes. Businesses willing to
advertise traceable information might consider including the origin of cotton fibers to
increase their sales and to come across as genuine. This will be helpful to support US
cotton farmers as well. Hence advertising farm-traceable information might be helpful for
both female consumers and US cotton farmers.
Though hypothesized, factory traceability did not generate any difference in
consumers’ perceived ad credibility, attitude towards advertisement, attitude towards
products, or their purchase intention. However certain times, presence of factory
information significantly lowered male participants’ behaviors when compared to their
behavior in absence of such information. Considering that factory-traceable information
also presented the manufacturing country, people might have ignored other unique
details, and did not find them effective. Thus this non-significant finding suggests that
apparel firms might not benefit from presenting factory related details on their webpages.
They might not invest their resources to include information such as presence of factory
address, the contact person, or similar details.
80
Fourth, consumers’ perceived importance of farm traceability and COM (USA) in
this study might imply the potential business value of such information. This study
revealed consumers’ preference for farm traceability over no information, preference for
USA manufactured products over Chinese products. Learning consumers’ specific
expectations, and adding such information to company webpages might be helpful for
businesses to create a niche in the competitive apparel industry. In the era of mass
production, where individual products are all similar and have minimal product
differentiation, including such information about products on webpages, might help firms
develop an extra edge and serve their customers better. Also, firms which are currently
specializing in products made from US cotton, and seeking to be transparent, might want
to include such information to tap into a potential market.
Fifth, the study also revealed some interesting findings about how gender played a
moderating role on the relation between traceable information, to generate a difference in
advertisement and product attitude, perceived ad credibility, and higher purchase
intention. When exposed to apparel webpages having information about cotton farm and
the manufacturing factory, female consumers reported to have increased ad credibility,
higher attitudes towards advertisements, and increased purchase intention than males,
than webpages with no farm and factory information. This suggests female consumers
consider webpages with such information to be more believable, expect them to have
more benefits, to be more meaningful, and hence, increased purchase intentions. Apparel
firms specializing in products for female consumers might want to include farm and
factory information in their webpages, to tap such potential clientele. Results of this study
also showed that females, when exposed to presence of factory traceable signals, had
81
increased purchase intentions than males further indicating that firms specializing in
female apparel products might consider publishing factory traceability on their webpages.
Though female consumers had higher purchase intention for products having both farm
and factory traceability than just factory traceability, it might not be always possible for
businesses to invest all their resources to be traceable in both ways. Thus, to find a
balanced choice in between economic profitability and being traceable, firms need to
identify consumer preferences on types of traceability.
Limitations and Scope of Future Research
While the study has significant contributions, it has certain limitations as well.
First, the study was conducted as a controlled experimental design. Many important
intrinsic and extrinsic variables like price, style, and quality have been found to be major
factors considered by consumers while making a product purchase. Thus, the effect of all
such variables had to be controlled by keeping them constant. However, in actual apparel
purchase scenarios, such variables cannot be controlled and always have vital roles in
consumers’ choices. Since including all such variables was beyond the scope of this
study, further research considering these variables along with traceability might be
helpful to better replicate real apparel purchase scenarios.
Second, the study only focused on e-commerce and online company webpages.
Future study about the presence of similar traceable information in packaging and
labelling of actual apparel products might be interesting to investigate.
Third, males in this study reported reduced ad credibility, attitude towards ad,
attitude towards products, and purchase intentions than females, when exposed to factory
traceable webpages. Therefore, further study could be conducted to specifically examine

82
the effect of factory traceability, and the depth and level of traceability in building overall
confidence and trust in males for apparel products. Also further research in depth about
the positive impact of traceability in female consumers can also be helpful in terms about
the type of products, and their preference of different types of traceability.
Fourth, the study was based on a specific apparel product, a pair of jeans, and
considered USA and China as countries of manufacturing. Future study involving other
apparel products, and other manufacturing countries might be interesting to check for the
impact of traceability and COM on consumers.
Fifth, the study includes basic information about farm traceability through farm’s
county and state, contact details of the farmer, and number of years in farming, and acres
of farming land. For traceability to factory-origin, the dimensions included were the
manufacturing factory’s unique identification name, contact details, address, and years in
business. However, future research about the depth and width of traceability, in terms of
what extent and which type of traceable information have a greater impact on consumers
might be interesting to study.
Finally, the study focused on purchase intention and could not study the actual
purchase behavior. Since it was beyond the scope of this research to explore the relation
between traceability and purchase behavior, a future study might be helpful to reassure
the relationship between traceability, and attitude, purchase intention and purchase
behavior.
83
REFERENCES:
Ajzen, I. (1988). Attitudes, personality, and behavior. Chicago: Dorsey Press.
Ajzen, I. (1991). The theory of planned behavior. Organizational Behavior and Human
Decision Processes, 50, 179–211.
Ajzen, I. (2002). Constructing a Theory of Planned Behavior Questionnaire. Retrieved
from http://people.umass.edu/aizen/pdf/tpb.measurement.pdf
Ajzen, I., & Fishbein, M. (1980). Understanding attitudes and predicting social
behaviour. Englewood Hills: Prentice-Hall.
Akerlof, G. A. (1970). The market for" lemons": Quality uncertainty and the market
mechanism. The quarterly journal of economics, 488-500.
Alfaro, J. A., & Rábade, L. A. (2009). Traceability as a strategic tool to improve
inventory management: a case study in the food industry. International Journal of
Production Economics, 118(1), 104-110.
All American Clothing Co: Traceability: Every Jean Has A Story. (n.d.). All American
Clothing Co. Retrieved November 12, 2013, from
http://www.allamericanclothing.com/traceability.html
Azam, A. (2012). An economic model of the consumers’ online shopping utility and
factors affecting on online shopping. International Journal of Computer
Applications, 52(1), 24-31.
Baines, R. N., & Davies, W. P. (1998, May). Quality assurance in international food
supply. In International Conference On Chain Management In Agribusiness And
The Food Industry (Vol. 3, pp. 213-223).
Bannister, J. P., & Saunders, J. A. (1978). UK consumers’ attitudes towards imports: the
measurement of national stereotype image. European Journal of Marketing, 12(8),
562-570.
Becker, T. (2000). Consumer perception of fresh meat quality: a framework for analysis.
British Food Journal, 102(3), 158–176.
Berinsky, A. J., Gregory A. H., and Gabriel S. L. (2012). Using Mechanical Turk as a
Subject Recruitment Tool for Experimental Research. Political Analysis, 20(3),
351–68.
Bhaduri, G. (2011). Trust/distrust, perceived quality, perceived price, and apparel
purchase intention (Doctoral dissertation, University of Missouri).

84
Bhaduri, G., & Ha-Brookshire, J. (2011). Do transparent business practices pay?
Exploration of transparency and consumer purchase intention. Clothing and
Textiles Research Journal, 29, 135-149.
Bikra J (2008). An empirical study of online shopping behavior: A factor analysis
approach. Journal of Marketing & Communication, 3(3).
Bilkey, W. J., & Nes, E. (1982). Country-of-origin effects on product evaluations. Journal
of international business studies, 89-99.
Bogart, L. (1985). War of the Words: Advertising in the Year 2010.“. Across the
Board, 1.
Bredahl, L. (2001). Determinants of consumer attitudes and purchase intentions with
regard to genetically modified food–results of a cross-national survey.Journal of
consumer policy, 24(1), 23-61.
Bruwer, J., & Johnson, R. (2010). Place-based marketing and regional branding strategy
perspectives in the California wine industry. Journal of Consumer Marketing, 27,
5-16.
Cassese, E. C., Huddy, L., Hartman, T. K., Mason, L., & Weber, C. R. (2013). Socially
Mediated Internet Surveys: Recruiting Participants for Online Experiments. PS:
Political Science & Politics, 46(04), 775-784.
Chen, M. F. (2007). Consumer attitudes and purchase intentions in relation to organic
foods in Taiwan: Moderating effects of food-related personality traits. Food
Quality and Preference, 18(7), 1008-1021.
Claxton, J.D., and Ritchie, J.R.B. (1979). Consumer prepurchase shopping problems: a
focus on the retailing component. Journal of Retailing, 55, 24-43.
Clemens, R. L. (2003). Meat traceability and consumer assurance in Japan. Midwest
Agribusiness Trade Research and Information Center, Iowa State University.
Clothing Traceability » Levis on Denim & Sustainability. (n.d.). Clothing Traceability
RSS. Retrieved November 12, 2013, from
http://www.clothingtraceability.com/noteworthy/levis-on-denim-sustainability/
Cotton Incorporated (2009), “Supply chain insights: the economy and apparel sourcing
trends”, available at: http://lifestylemonitor.cottoninc.com/Supply-Chain-
Insights/Economy-and-Apparel-Sourcing-Trends-02-09/ (accessed 28 June 2011).
Cotton Incorporated. (2010a). Making the eco-movement matter. Retrieved June 11, 2010
from http://www.cottoninc.com/lsmarticles/ ?articleID=532& pub=Hoke.
85
Cotton Incorporated. (2010b). U.S. cotton market monthly economic letter July 12, 2010.
Retrieved August 2, 2010 from
http://www.cottoninc.com/MarketInformation/MonthlyEconomicLetter/#3.
Cotton Incorporated. (2010d). Responsible economic development. Retrieved August 2,
2010 from http://cottontoday.cottoninc.com/sustainability-about/responsible-
economic development.
Cotton Incorporated. (2011). Responsible economic development. Retrieved June 14,
2011, from http://lifestylemonitor.cottoninc.com/LSM-Fast-Facts/016-
Consumers-Favorite Fiber/?category=fiber&sort=view
all&mainSection=fastFacts¤tRow=1
De Jonge, J., Van Trijp, H., Goddard, E., & Frewer, L. (2006). The reciprocal
relationship between public policy making and consumer confidence in food
safety: A cross-national perspective. Wageningen University, The Netherlands,
Marketing and Consumer Behaviour Group.
De Jonge, J., Van Trijp, J. C. M., Van der Lans, I. A., Renes, R. J., & Frewer, L. J.
(2008). How trust in institutions and organizations builds general consumer
confidence in the safety of food: A decomposition of effects. Appetite, 51(2),
311-317.
Dickerson, K. G. (1999). Textiles and apparel in the global economy (3rd ed.). Upper
Saddle River, NJ: Prentice-Hall.
Dickerson, K.C.(1982) Imported versus U.S. produced apparel: Consumer views and
buying patterns. Home Economics Research Journal, 10,241-252.
Dickinson, D. L., & Bailey, D. (2002). Meat traceability: Are US consumers willing to
pay for it?. Journal of Agricultural and Resource Economics, 348-364.
Dickson, M. A. (2000). Personal values, beliefs, knowledge, and attitudes relating to
intentions to purchase apparel from socially responsible businesses. Clothing and
Textile Research Journal, 18-19.
Dickson, M.A. (2001). Utility of no-sweat labels for apparel consumers: profiling label
users and predicting their purchases. The journal of Consumer Affairs, 35, 96-
119.
Dickson, M.A. and Littrell, M. (1996). Socially responsible behavior; values and attitudes
of the alternative trading organization consumer. Journal of Fashion Marketing
and Management, 1(1), 50-69.
Drozdenko, R., & Jensen, M. (2005). Risk and maximum acceptable discount
levels. Journal of Product & Brand Management, 14(4), 264-270.

86
Dyer, B., & Ha-Brookshire, J. (2008). Apparel import intermediaries’ secrets to success:
Redefining success in a hyper-dynamic environment. Journal of Fashion
Marketing and Management, 12, 51-67.
Eagly, A. H., & Chaiken, S. (1993). The psychology of attitudes. Fort Worth, TX:
Harcourt Brace Jovanovich College Publishers.
Emmelhainz, M.a., & Adams. R. J. (1992). The apparel industry response to “ sweat
shop” concerns: A review and analysis of codes of conduct. Journal of Supply
Chain Management. 35(3), 51-57.
Eriksson, K., & Simpson, B. (2010). Emotional reactions to losing explain gender
differences in entering a risky lottery. Judgment and Decision Making, 5, 159–
163.
Essoussi, L. H., & Merunka, D. (2007). Consumers' product evaluations in emerging
markets: does country of design, country of manufacture, or brand image matter?.
International Marketing Review, 24(4), 409-426.
Federal Trade Commission (2009). The Textile Products Identification Act. Retrieved
from http://www.ftc.gov/os/statutes/textile/textlact.shtm#70
Flatters, P., & Willmott, M. (2009). Understanding the postrecession consumer. Harvard
Business Review, Retrieved June 16, 2010, from
http://hbr.org/2009/07/understanding-the-postrecession-consumer/ar/pr
Gadenne, D., Sharma, B., Kerr, D., & Smith, T. (2011). The influence of consumers'
environmental beliefs and attitudes on energy saving behaviours. Energy
Policy, 39(12), 7684-7694.
Golan, E., Krissoff, B., & Kuchler, F. (2002). Food & Marketing-Traceability for Food
Marketing & Food Safety: What's the Next Step?. Agricultural Outlook, (288),
21-25.
Golan, E., Krissoff, B., Kuchler, F., Calvin, L., Nelson, K., & Price, G. (2004).
Traceability in the US food supply: economic theory and industry studies. US
Department of Agriculture, Economic Research Service.
Ha-Brookshire, J. E. (2012). Country of Parts, Country of Manufacturing, and Country of
Origin Consumer Purchase Preferences and the Impact of Perceived Prices.
Clothing and Textiles Research Journal, 30(1), 19-34.
Ha-Brookshire, J. E. (2012). Country of Parts, Country of Manufacturing, and Country of
Origin Consumer Purchase Preferences and the Impact of Perceived Prices.
Clothing and Textiles Research Journal, 30(1), 19-34.
Ha-Brookshire, J. E., & Norum, P. S. (2011). Willingness to pay for socially responsible
products: case of cotton apparel. Journal of Consumer Marketing, 28(5), 344-353.
87
Halepete, J., Littrell, M. & Park, J. (2009) Personalization of fair trade apparel: consumer
attitudes and intentions. Clothing and Textiles
Han, C. M., & Terpstra, V. (1988). Country-of-origin effects for uni-national and bi-
national products. Journal of International Business Studies, 235-255.
Harris, Louis, & Associates, Inc. (1999). Consumers and the 21st century. Retrieved
September 5, 1999, from http:// www.nclnet.org/FNLSUM1.PDF
Hartmann, P., & Apaolaza-Ibáñez, V. (2012). Consumer attitude and purchase intention
toward green energy brands: The roles of psychological benefits and
environmental concern. Journal of Business Research, 65(9), 1254-1263.
Hiscox, M. J., & Smyth, N. (2007). Is there consumer demand for improved labor
standards? Evidence from field experiments in social labeling. Harvard
University. Retrieved from
http://www.people.fas.harvard.edu/*hiscox/SocialLabeling.pdf
Hobbs, J. E. (1996). A transaction cost analysis of quality, traceability and animal welfare
issues in UK beef retailing. British Food Journal, 98(6), 16–26.
Hobbs, J. E., Bailey, D., Dickinson, D. L., & Haghiri, M. (2005). Traceability in the
Canadian red meat sector: do consumers care?. Canadian Journal of Agricultural
Economics/Revue canadienne d'agroeconomie, 53(1), 47-65.
Hoffmann, S. A., & Taylor, M. R. (Eds.). (2005). Toward safer food: Perspectives on risk
and priority setting. RFF Press.
Hooley, G., Shipley, D. and Krieger, N. (1988), “A method for modelling consumer
perceptions of country of origin”, International Marketing Review, Vol. 5 No. 3,
pp. 67-76.
Houston, M. J., Terry L. C., and Susan E. H. (1987). Picture-Word Consistency and the
Elaborative Pro-cessing of Advertisements. Journal of Marketing Re-search, 24
(November), 359-69.
Howe, J. (2006). The rise of crowdsourcing. Wired Magazine, 14, 1–4.
Hoyer, W. C., & MacInnis, D. J. (1997). Consumer behavior: Boston, MA: Houghton
MiMin.
Hustvedt, G., & Bernard, J. C. (2008). Consumer willingness to pay for sustainable
apparel: The influence of labelling for fibre origin and production methods.
International Journal of Consumer Studies, 32(5), 491-498.
Hustvedt, G., & Bernard, J. C. (2010). Effects of social responsibility labeling and brand
on willingness to pay for apparel. International Journal of Consumer Studies, 34,
619-626.

88
Hustvedt, G., & Dickson, M. A. (2009). Consumer likelihood of purchasing organic
cotton apparel: influence of attitudes and self-identity. Journal of Fashion
Marketing and Management, 13(1), 49-65.
Hustvedt, G., Peterson, H. H., & Chen, Y. J. (2008). Labelling wool products for animal
welfare and environmental impact. International Journal of Consumer Studies,
32(5), 427-437.
Hyllegard, K. H., Yan, R. N., Ogle, J. P., & Lee, K. H. (2012). Socially Responsible
Labeling The Impact of Hang Tags on Consumers' Attitudes and Patronage
Intentions Toward an Apparel Brand. Clothing and Textiles Research Journal,
30(1), 51-66.
Icek Ajzen (2006). TPB diagram. Retrieved from
http://people.umass.edu/aizen/tpb.diag.html#null-link
Insch, G. S., & McBride, J. B. (1999). Decomposing the Country-of-Origin Construct:
An Empirical Test of Country of Parts and Country of Assembly. Journal of
International Consumer Marketing, 10(4), 69-91.
International Labor Organization (2013). A global industry facing new challenges.
Retrieved March 10, 2014 from http://www.ilo.org/global/industries-and-
sectors/textiles-clothing-leather-footwear/lang--en/index.htm
ISO. (2005). ISO/TC 176/SC 1 22005:2005, Traceability in the feed and food chaine
General principles and basic requirements for system design and implementation.
Iyer, G. R. and Kalita, J. K. (1997). The impact of country of origin and country of
manufacture cues on consumer perceptions of quality and value, Journal of
Global Marketing, 11(1), 7-28.
Kadolph, S. (2007). Textiles (10th ed.). Upper Saddle, NJ: Prentice Hall.
Kang, J., Liu, C., & Kim, S. H. (2013). Environmentally sustainable textile and apparel
consumption: the role of consumer knowledge, perceived consumer effectiveness
and perceived personal relevance. International Journal of Consumer Studies.
Kim, S., Littrell, M. A., & Ogle, J. L. P. (1999). Academic Papers: The relative
importance of social responsibility as a predictor of purchase intentions for
clothing. Journal of Fashion Marketing and Management, 3(3), 207-218.
Kingsolver, B. (2007). Animal, vegetable, miracle. New York, NY: HarperCollins.
Koklic, M. K. (2011). Non-deceptive counterfeiting purchase behavior: Antecedents of
attitudes and purchase intentions. Journal of Applied Business Research
(JABR), 27(2).

89
Lavidge, R. J., & Steiner, G. A. (1961). A model for predictive measurements of
advertising effectiveness. Journal of marketing, 25(6).
Lee, J. Y., Han, D. B., Nayga, R. M., & Lim, S. S. (2011). Valuing traceability of
imported beef in Korea: an experimental auction approach*. Australian Journal of
Agricultural and Resource Economics, 55(3), 360-373.
Lee, W. N., Hong, J. Y., & Lee, S. J. (2003). Communicating with American consumers
in the post 9/11 climate: An empirical investigation of consumer ethnocentrism in
the United States. International Journal of Advertising, 22(4), 487-510.
Liddell, S., & Bailey, D. (2001). Market opportunities and threats to the US pork industry
posed by traceability systems. The International Food and Agribusiness
Management Review, 4(3), 287-302.
Lillis, C. M., & Narayana, C. L. (1974). Analysis of" made in" product images-An
exploratory study. Journal of International Business Studies, 119-127.
Loader, R., & Hobbs, J. E. (1996). The hidden costs and benefits of BSE. British Food
Journal, 98(11), 26–35.
Loureiro, M. L., & Umberger, W. J. (2007). A choice experiment model for beef: What
US consumer responses tell us about relative preferences for food safety, country-
of-origin labeling and traceability. Food Policy, 32(4), 496-514.
Lusk, J. L., Brown, J., Mark, T., Proseku, I., Thompson, R., & Welsh, J. (2006).
Consumer behavior, public policy, and country-of-origin labeling. Applied
Economic Perspectives and Policy, 28(2), 284-292.
MacKenzie, S. B., & Lutz, R. J. (1989). An empirical examination of the structural
antecedents of attitude toward the ad in an advertising pretesting context. The
Journal of Marketing, 48-65.
Mason, W., & Suri, S. (2012). Conducting behavioral research on Amazon’s Mechanical
Turk. Behavior research methods, 44(1), 1-23.
Moe, T. (1998). Perspectives on traceability in food manufacture. Trends in Food Science
& Technology, 9(5), 211-214.
Mowen, J. (1993). Consumer behaviour. New York: Macmillan Publishing.
Nagashima, A. (1970). A comparison of Japanese and US attitudes toward foreign
products. The Journal of Marketing, 68-74.
Norum, P. S., & Ha-Brookshire, J. E. (2011). Consumer Trade-Off Analysis and Market
Share Estimation for Selected Socially Responsible Product Attributes for Cotton
Apparel. Clothing and Textiles Research Journal, 29(4), 348-362.
90
Olsen, P., & Borit, M. (2012). How to define traceability. Trends in Food Science &
Technology.
Opara, L. U., & Mazaud, F. (2001). Food traceability from field to plate. Outlook on
agriculture, 30(4), 239-247.
Paarlberg, R. L. (2002). The real threat to GM crops in poor countries: consumer and
policy resistance to GM foods in rich countries. Food Policy, 27, 247–250.
Popper, D. E. (2007). TRACEABILITY: TRACKING AND PRIVACY IN THE FOOD
SYSTEM. Geographical review, 97(3), 365-388.
Resende-Filho, M.A. & Buhr, B.L. (2007) Economics of traceability for mitigation of
food recall costs. Retrieved from. http://ssrn.com/abstract=995335 (accessed on 9
May 2011).
Rossiter, J.L., & Percy, L. (1998). Advertising communications and promotion
management (2nd ed.). NY: McGraw Hill.
Sallam, M. A. A., & Wahid, N. A. (2012). Endorser Credibility Effects on Yemeni Male
Consumer's Attitudes towards Advertising, Brand Attitude and Purchase
Intention: The Mediating Role of Attitude toward Brand. International Business
Research, 5(4).
Samiee, S. (1994). Customer evaluation of products in a global market. Journal of
International Business Studies, 579-604.
Sears, D. O. (1986). College Sophomores in the Laboratory: Influences of a Narrow Data
Base on Social Psychology’s View of Human Nature. Journal of Personality and
Social Psychology, 51(3), 515–30.
Shaw, D. and E. Shiu: 2002, _The Role of Ethical Obligation and Self-Identity in Ethical
Consumer Choice_, International Journal of Consumer Studies, 26(2), 109–116.
Shaw, D., Shiu, E. and Clarke, I. (2000), “The contribution of ethical obligation and self-
identity to the theory of planned behavior: an exploration of ethical consumers”,
Journal of Marketing Management, 16 (8), 79-94.
Sheppard, B. H., Hartwick, J., & Warshaw, P. R. (1988). The theory of reasoned action:
A meta-analysis of past research with recommendations for modifications and
future research. Journal of consumer Research, 325-343.
Singh, J., de los Salmones Sanchez, M. M. G., & DEL Bosque, I. R. (2008).
Understanding corporate social responsibility and product perceptions in
consumer markets: A cross-cultural evaluation. Journal of Business Ethics, 80,
597-611.
91
Slavin, M. (2009). Commentary: Transparency increases firms’ credibility. Daily Journal
of Commerce, p 5.
Smith, G. C., Tatum, J. D., Belk, K. E., Scanga, J. A., Grandin, T., & Sofos, J. N. (2005).
Traceability from a US perspective. Meat Science, 71(1), 174-193.
Soron, D. (2009). Meat Consumption and Food Traceability. The Minnesota review,
2010(73-74), 243-253.
Spence, M. (1973). Job market signaling. The quarterly journal of Economics, 87(3),
355-374.
Suri, S., & Watts, D. J. (2011). Cooperation and contagion in Web-based, networked
public goods experiments. PLoS One, 6(3), e16836.
Talamini, E., & Malafaia, G. C. (2006). Traceability, transparency and assurance (TTA)
systems implementation for the brazilian exporter pork meat chain. In World
Food & Agribusiness Symposium (Vol. 16).
Tomolillo, D.A.C. and Shaw, D. (2004). Undressing the ethical issues in fashion: a
consumer perspective. International Retail Marketing, 141-152
Ubilava, D., & Foster, K. (2009). Quality certification vs. product traceability: Consumer
preferences for informational attributes of pork in Georgia. Food Policy, 34(3),
305-310.
United States Department of Agriculture. (2011, June 16). US export sales for weakening
6/16/2011. Retrieved June 30, 2011, from http://www.fas.usda.gov/export-
sales/cottfax.htm
United States of Department of Agriculture. (2010). Adoption of genetically engineered
crops in the United States: Upland cotton varieties. Retrieved August 2 2010,
from http://ers.usda.gov/Data/BiotechCrops/ExtentofAdoptionTable2.htm
Van Amstel, M., Driessen, P., & Glasbergen, P. (2008). Eco-labeling and information
asymmetry: a comparison of five eco-labels in the Netherlands. Journal of
Cleaner Production, 16(3), 263-276.
Vermeir, I., & Verbeke, W. (2008). Sustainable food consumption among young adults in
Belgium: Theory of planned behaviour and the role of confidence and
values. Ecological Economics, 64(3), 542-553.
Vishwanath, T., & Kaufmann, D. (2001). Toward transparency: new approaches and their
application to financial markets. The World Bank Research Observer. 16(1), 41-
57.
Wall, B. (1994). Quality management at Golden Wonder. Industrial Management and
Data Systems, 94(7), 24–28.
92
Wang, C., Zhang, P., Choi, R., & Eredita, M. D. (2002, August). Understanding
consumers’ attitude toward advertising. In Eighth Americas conference on
information systems (pp. 1143-1148).
Zhang, L. (2012). How country of manufacturing and sweatshop free information affects
online -apparel consumers’ perceived quality, value and purchase intention.
Unpublished raw data.
93
APPENDIX A
SURVEY INSTRUMENTS

94
RECRUITMENT SCRIPT
The primary goal of this research is to investigate your attitude towards clothing
and apparel purchase. A screenshot of an apparel website will be shown to you. Your
participation will help today’s apparel brands with better understanding of consumer
expectations. Participation in this study is totally voluntary. You need to be 18 years of
age or above, and will be compensated at $1.00 for completing the entire survey.

95
TRACEABILITY TO FARM & FACTORY, COUNTRY OF MANUFACTURING,
AND
APPAREL PURCHASE INTENTION
Primary-Investigator: Saheli Goswami
CONSENT FORM
Description and Explanation of Procedures:
The primary goal of this research is to investigate your attitude towards clothing
purchases. A screenshot of an apparel webpage will be shown to you, and you will be
asked for feedback. Your participation will help today’s apparel brands to develop a
better understanding of consumer expectations.
Participation in this study is totally voluntary.
Confidentiality:
Data for the survey will be saved anonymously and kept strictly confidential. Electronic
files will be saved with numeric codes with no personal identifiers. Throughout the
survey, if you feel uncomfortable with any question, you may stop participation any time.
Risks and Benefits:
There are no physical or psychological risks in participating in this study. The study
results will benefit society as we will have a better understanding of consumers’ attitudes
and expectations about apparel brands.
Compensation:
On completion on the entire study, your contact information will be eligible for winning
one of two $20 Target gift cards.
Consent:
By checking this box, you confirm your age as 18 years or above, and
your consent to participate in this study.

96
Have you purchased a pair of denim jeans in past year or do you intend to purchase a pair
in the near future? Yes (1)
No (2)
In this study you will see an image of a webpage for denim jeans and you will be asked to
answer a few questions about the webpage. Please read the page carefully before
answering the questions.
SURVEY
Card 1: Made In USA (Traceable to farm, traceable to factory)
This image was managed to control the time a participant spends on this page.
[There were a total of 8 stimuli. Participants were exposed to only one stimuli in random
order]

97
Based on what you just read about the denim jeans, please answer the following
questions.
I consider the WEBPAGE to be :
1 (1) 2 (2) 3 (3) 4 (4) 5 (5) 6 (6) 7 (7)
Very Bad:Very Good (1)
Unfavorable:Favorable
(2)
Unpleasant:Pleasant (3)
Unlikeable:Likeable (4)
Unbelievable:Believable
(5)
Untruthful:Truthful (6)
Unrealistic:Realistic (7)
Q3.4 I consider the JEANS to be :
1 (1) 2 (2) 3 (3) 4 (4) 5 (5) 6 (6) 7 (7)
Very Bad:Very Good
(1)
Unfavorable:Favorable
(2)
Unpleasant:Pleasant (3)
Unlikeable:Likeable (4)
For this study, we want to make sure our respondents are paying attention as they answer
our questions. Please type or paste the word 'survey' in the text box below.
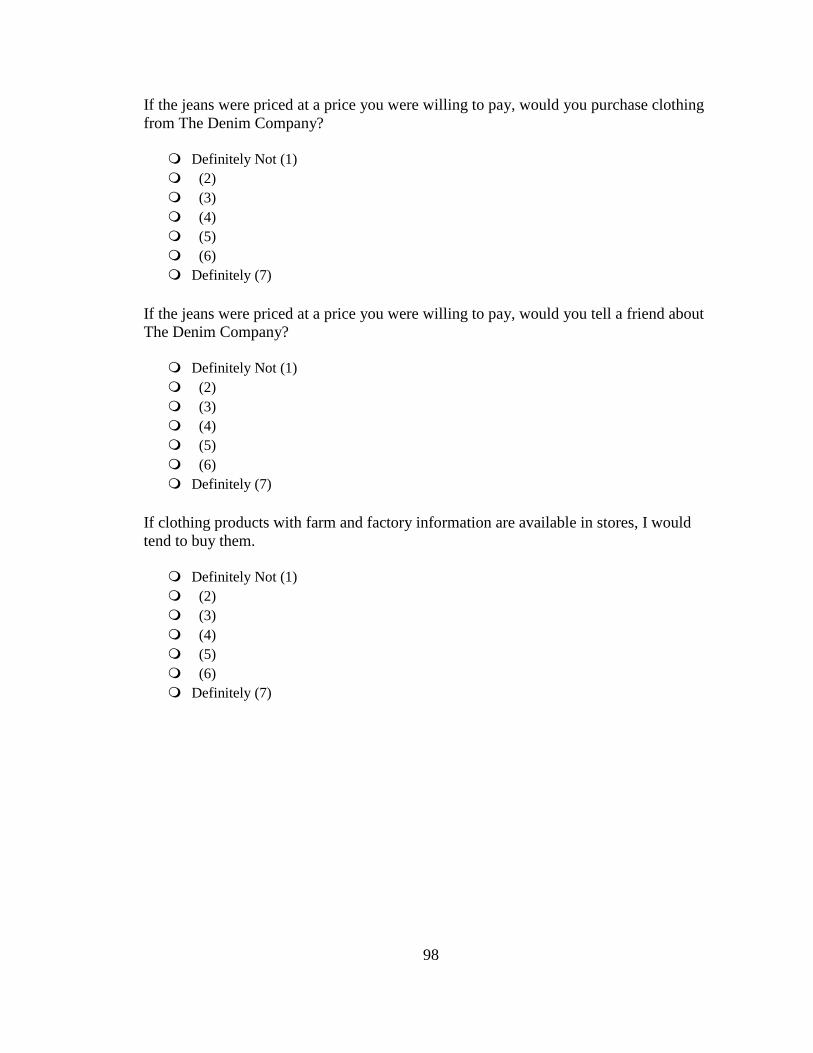
98
If the jeans were priced at a price you were willing to pay, would you purchase clothing
from The Denim Company?
Definitely Not (1)
(2)
(3)
(4)
(5)
(6)
Definitely (7)
If the jeans were priced at a price you were willing to pay, would you tell a friend about
The Denim Company?
Definitely Not (1)
(2)
(3)
(4)
(5)
(6)
Definitely (7)
If clothing products with farm and factory information are available in stores, I would
tend to buy them.
Definitely Not (1)
(2)
(3)
(4)
(5)
(6)
Definitely (7)

99
We would like you to answer the following demographic questions. These will help us to
understand your answers better.
What is your age in years?
18-20 (1)
22-34 (2)
35-44 (3)
45-54 (4)
55-64 (5)
65 and Over (6)
What is your gender?
Male (1)
Female (2)
Prefer not to disclose (3)
What is your race/ethnicity?
Caucasian, non-Hispanic (1)
African-American (2)
Hispanic (3)
Asian (4)
Other (5)
What is your marital status?
Currently Married (1)
Currently Unmarried (2)
What is the highest level of education you have completed?
Less than high-school (1)
High-school (2)
College (3)
Graduate school (4)

100
Occupation
Student (1)
Part-time employed (2)
Full-time employed (3)
Retired (4)
Not employed (5)
Annual household income:
Less than $ 10,000 (1)
$10,000 - $29,999 (2)
$30,000 - $49,999 (3)
$50,000 - $69,999 (4)
$70,000 - $89,999 (5)
$90,000 - $149,999 (6)
$150,000 or above (7)
Thank you for taking part in this study. Your validation code for mTurk is
${e://Field/mTurkCode} PLEASE PRESS ON THE CONTINUE BUTTON ONE
MORE TIME TO RECORD RESPONSES.
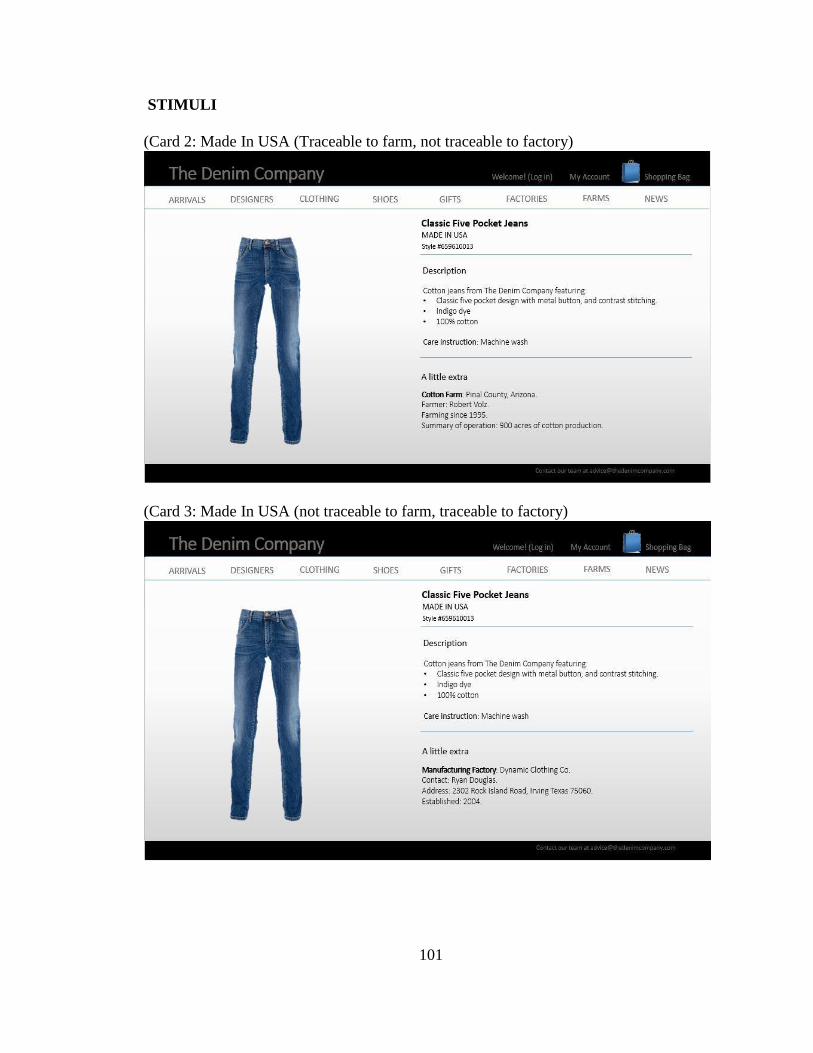
101
STIMULI
(Card 2: Made In USA (Traceable to farm, not traceable to factory)
(Card 3: Made In USA (not traceable to farm, traceable to factory)
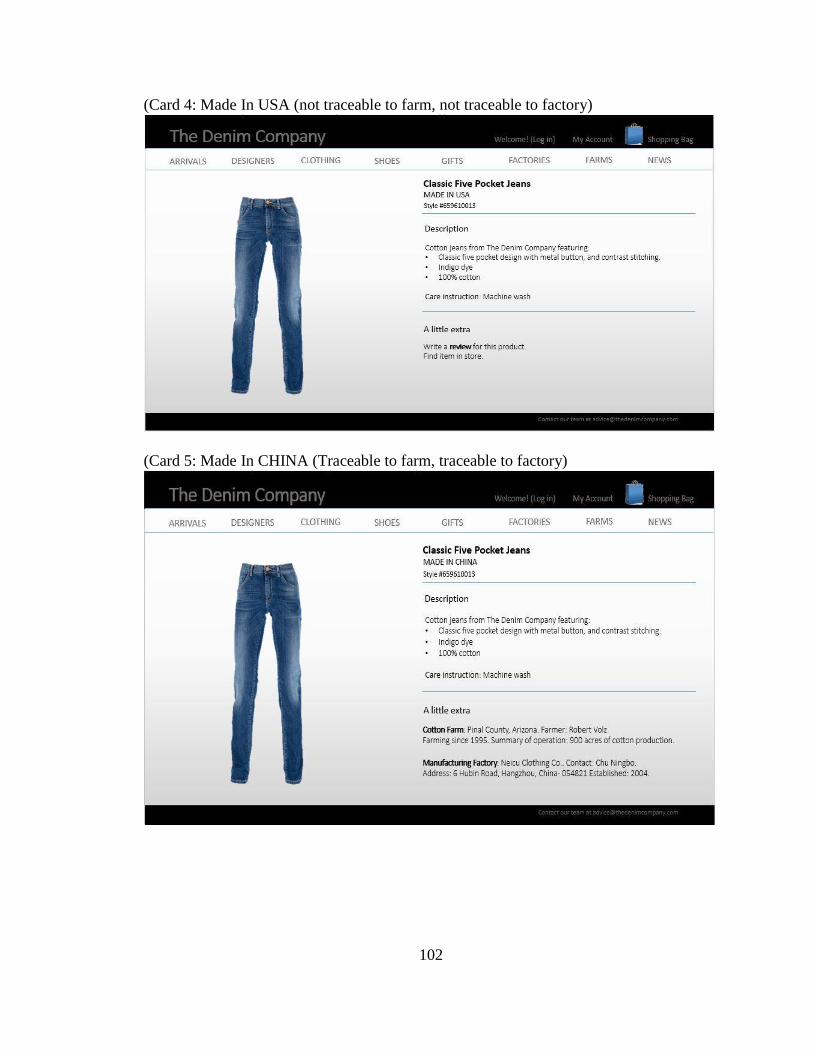
102
(Card 4: Made In USA (not traceable to farm, not traceable to factory)
(Card 5: Made In CHINA (Traceable to farm, traceable to factory)
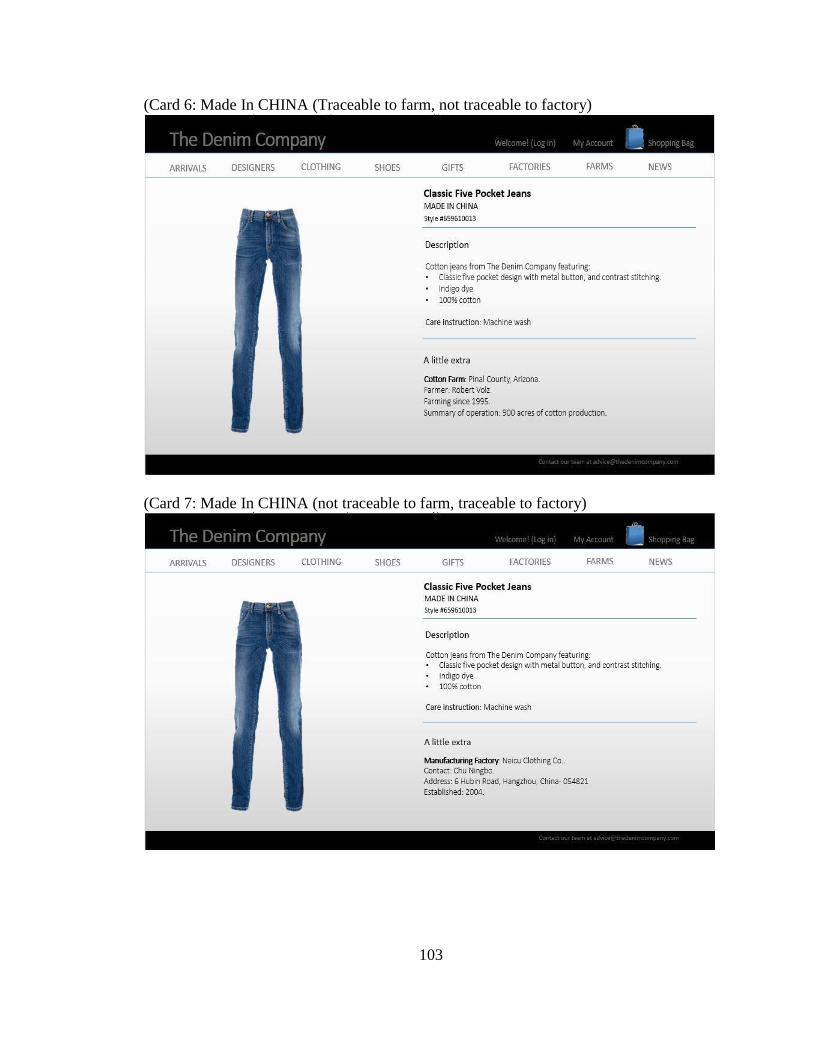
103
(Card 6: Made In CHINA (Traceable to farm, not traceable to factory)
(Card 7: Made In CHINA (not traceable to farm, traceable to factory)
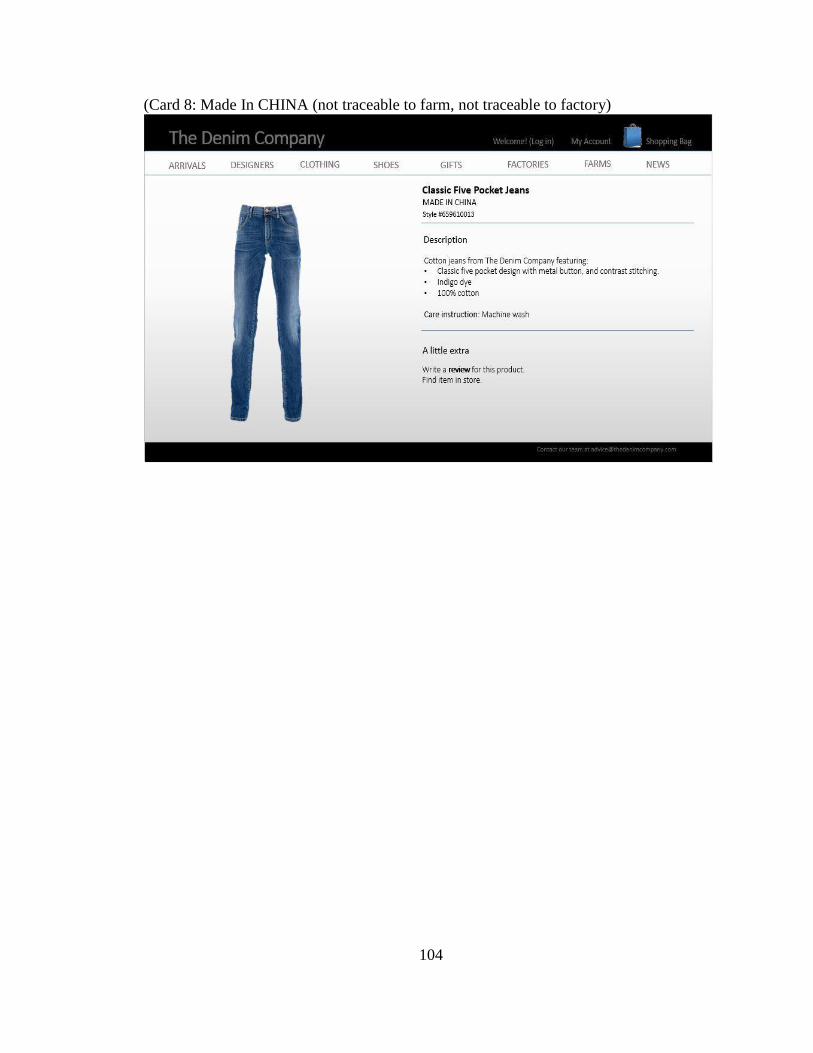
104
(Card 8: Made In CHINA (not traceable to farm, not traceable to factory)

105
APPENDIX B
INSTITUTIONAL REVIEW BOARD DOCUMENTS
106