Embed Size (px)
Citation preview

Imagine the result
Homestake Mining Company of California
TPP Alluvial Pilot Testing Work Plan
Grants Reclamation Project
Grants, New Mexico
December 3, 2012

TPP Alluvial Pilot Testing Work Plan Grants Reclamation Project Grants, New Mexico
Adam Griffin Project Engineer
Jeff Gillow, PhD Technical Expert
Phil DeDycker Principal in Charge / Project Manager
Prepared for:
Homestake Mining Company of California
Prepared by:
ARCADIS U.S., Inc.
630 Plaza Drive
Suite 100
Highlands Ranch
Colorado 80129
Tel 720 344 3500
Fax 720 344 3535
Our Ref.:
AO000120
Date:
December 3, 2012
This document is intended only for the use
of the individual or entity for which it was
prepared and may contain information that
is privileged, confidential and exempt from
disclosure under applicable law. Any
dissemination, distribution or copying of
this document is strictly prohibited.
i
Table of Contents
1. Introduction 1
2. Site History and Background 1
2.1 Site Description and History 2
2.2 Site Conceptual Model 3
2.3 Existing Site Restoration Strategy 5
2.4 Alternative Technologies Feasibility Analysis 5
3. In Situ Phosphate Treatment 5
3.1 Summary of Previous Evaluations 7
3.1.1 Phase 1 – Bench Testing 7
3.1.2 Phase 2 – LTP Tracer Testing 8
3.1.3 Phase 3 – LTP Pilot Testing 8
3.1.4 Results 9
3.2 Conceptual Approach 10
3.3 Pilot Test Locations 11
4. Alluvial Pilot Testing 13
4.1 Phase 1 – Hydraulic Evaluation 14
4.1.1 Well Installation 14
4.1.2 Baseline Monitoring 14
4.1.3 Tracer Testing 14
4.2 Phase 2 – Alluvial Pilot Test 16
4.2.1 Injection Approach 16
4.2.2 Amendment Injection 16
4.2.3 Monitoring 17
4.2.4 Contingency Planning 17
5. Data Evaluation and Reporting 18
6. Schedule 19
7. References 20

ii
Table of Contents
8. Tables 22
9. Figures 30
Tables
Table 1 Hydraulic Properties of the Alluvial Aquifer 22
Table 2 Summary of Previous Testing 23
Table 3 Summary of Alluvial Pilot Testing Phases 24
Table 4 Well Network and Construction for Pilot Test S 25
Table 5 Well Network and Construction for Pilot Test X 26
Table 6 Alluvial Pilot Test Analyte Lists 27
Table 7 Design Parameters for Alluvial Pilot Test S 28
Table 8 Design Parameters for Alluvial Pilot Test X 28
Table 9 Alluvial Pilot Test Monitoring Program 29
Figures
Figure 1 Pilot Test S Location
Figure 2 Pilot Test X Location
Figure 3 Base of Alluvium
Figure 4 Saturated Extent of Alluvial Aquifer
Figure 5 Hydraulic Conductivity of Alluvial Aquifer
Figure 6 Transmissivity of Alluvial Aquifer
Figure 7 Groundwater Flow in Alluvial Aquifer
Figure 8 Subcrops of Chinle Formation Aquifers
Figure 9 Uranium in Alluvial Aquifer (2010)
Figure 10 Conceptual Approach of Treatment
Figure 11 Proposed Well Locations for Pilot Test S
Figure 12 Proposed Well Locations for Pilot Test X

iii
Table of Contents
Appendices
A Bench Testing Procedures and Results
B LTP Pilot Test Procedures and Results
C Material Safety Data Sheets

iv
Table of Contents
Acronyms and Abbreviations
CAP Corrective Action Program
COC constituent of concern
DOE U.S. Department of Energy
EPA U.S. Environmental Protection Agency
ft bgs feet below ground surface
ft/day feet per day
gpd/ft gallons per day per foot
gpm gallons per minute
GWPS groundwater protection standard
HMC Homestake Mining Company of California
LTP Large Tailings Pile
NMED New Mexico Environment Department
NMOSE New Mexico Office of State Engineer
NRC U.S. Nuclear Regulatory Commission
OUL Ozark Underground Laboratories
POC point of compliance
RO reverse osmosis
ROI radius of influence
STP Small Tailings Pile

v
Table of Contents
STPP sodium tripolyphosphate
TDS total dissolved solids
TPP tripolyphosphate

1
TPP Alluvial Pilot Testing Work Plan
Grants Reclamation Project Grants, New Mexico
1. Introduction
On behalf of Homestake Mining Company of California (HMC), ARCADIS has
prepared this Work Plan for the proposed tripolyphosphate (TPP) Alluvial Pilot Testing
for the Grants Reclamation Project (site).
Currently, the Corrective Action Program (CAP) for the site comprises source control
and ex situ water treatment and management systems. Pending continued testing, the
full-scale implementation of an in situ technology would strategically augment the CAP
and would reduce the reliance on the current ex situ treatment and management
systems to achieve the accepted site standards.
HMC is currently evaluating the in situ immobilization and treatment of uranium using a
TPP amendment to supplement the CAP. The New Mexico Environment Department
(NMED) approved the initial evaluation of the TPP treatment technology, a pilot test in
the Large Tailings Pile (LTP), in 2010 (NMED 2010). Based on the results of the LTP
pilot test and supporting laboratory testing, HMC proposes the continued evaluation of
TPP for uranium immobilization through pilot testing in the alluvial aquifer. Pilot testing
will be performed at two unique locations at the site to evaluate the efficacy of the
technology in different hydrogeologic and geochemical conditions.
The primary objective of this Work Plan is to describe the proposed alluvial pilot testing
and to attain regulatory approval to proceed with testing. To this end, relevant site
history and background is discussed in Section 2, the TPP treatment technology is
discussed in Section 3, and the proposed pilot testing is described in Section 4. Also
described in this Work Plan are the associated data evaluation and reporting (Section
5) and the proposed schedule (Section 6).
2. Site History and Background
HMC owns and operates the site, which is a former uranium mill located in Cibola
County, New Mexico. Currently, the primary activity at the site is the containment and
treatment of contaminated groundwater through a groundwater restoration program.
The objective of this program is to restore concentrations of the constituents of concern
(COCs) to levels that meet site standards established for each of the affected aquifers
present at the site.

2
TPP Alluvial Pilot Testing Work Plan
Grants Reclamation Project Grants, New Mexico
Regulatory responsibilities for the site are currently shared by the NMED, the U.S.
Nuclear Regulatory Commission (NRC), the U.S. Environmental Protection Agency
(EPA), and the New Mexico Office of State Engineer (NMOSE).
An updated CAP describing the current site restoration program was submitted to the
regulatory agencies and to stakeholders in March 2012 (HMC 2012). This updated
CAP includes detailed information about current site conditions, recent modifications to
the groundwater restoration program, and key aspects of the proposed future
components of the CAP, including the evaluation of alternative groundwater treatment
technologies.
2.1 Site Description and History
The site occupies approximately 1,085 acres and is located 5.5 miles north of Milan,
New Mexico. Uranium milling operations occurred at the site from 1958 to 1990,
processing ore from several mines. During the operation of the mill, tailings were
deposited in two onsite tailings piles: the Small Tailings Pile (STP) and the LTP. At the
time of placement, concentrations of constituents that naturally occurred in the uranium
ore were elevated in the tailings pore water. These constituents have become the
COCs at the site and include uranium, selenium, molybdenum, sulfate, chloride, total
dissolved solids (TDS), nitrate, vanadium, thorium-230, and radium-226/-228.
Pore water seepage from the LTP has impacted shallow groundwater, specifically in
the alluvial aquifer directly beneath and downgradient of the LTP. This seepage is the
primary source of contamination at the site, and thus is the focus of restoration efforts,
which began in 1977 and are currently expected to continue through 2020. To limit
potential future contamination from the LTP and to inhibit the expansion of the
contaminant plume, a groundwater restoration program began in 1977, focusing on
both source control and plume mass removal. Active restoration efforts are currently
expected to continue through 2020, with final evaporation of extracted water continuing
through 2022. This program is described in more detail in Section 2.3.
The endpoint of the restoration program is the achievement of the site standards at the
points of compliance (POCs). The NRC, EPA, and NMED have agreed upon the
groundwater site standards for each COC for each aquifer, which were incorporated
into the NRC license through License Amendment No. 39 as “groundwater protection
standards” (GWPSs). The site standards were finalized in 2006 after background water
quality was evaluated. The standards were set at either background concentrations,

3
TPP Alluvial Pilot Testing Work Plan
Grants Reclamation Project Grants, New Mexico
which were calculated using data from 1995 through 2004, or appropriate drinking
water standards.
2.2 Site Conceptual Model
Geologic and Hydrogeologic Setting
The geologic and hydrogeologic settings of the site are complex, and significant effort
has been made over the past 40 years to understand the regional and local conditions
of the site. Much of that information is summarized in the Background Water Quality
Evaluation of the Chinle Formation report (HMC and Hydro-Engineering 2003) and in
Section 3 of the Updated CAP (HMC 2012).
The shallow unconfined aquifer in the area, the alluvial aquifer, includes the
Quaternary Alluvium and surficial volcanic flows. Deeper confined aquifers include
three aquifers within the Chinle Formation and a regional aquifer in the San Andres
Limestone and the Glorietta Sandstone. Table 1 summarizes hydraulic properties of
the alluvial aquifer near the two proposed alluvial pilot test locations (Figures 1 and
2).The proposed location of Pilot Test S is west of the LTP near well S4 (Figure 1),
and the proposed location of Pilot Test X is east of the LTP near well X26 in the vicinity
of the HMC office (Figure 2). The approximate locations of these two areas are
depicted on Figures 3 through 9, which portray information about the alluvial aquifer
pertaining to the two test site locations, as described below.
The average total thickness of the saturated and unsaturated portions of the alluvium
near the site is approximately 95 feet, with a maximum thickness of approximately 120
feet. The deepest portion of the alluvial aquifer is below the western side of the LTP,
while the shallowest portion of the alluvial aquifer extends from the eastern Murray
Acres subdivision to the STP (Figure 3). The thickness and extent of the saturated
portion of the alluvial aquifer are shown on Figure 4. Saturated thickness ranges from
0 to 80 feet thick, with an average thickness of approximately 35 feet near the site.
Figure 5 illustrates the hydraulic conductivity of the alluvial aquifer at the site.
Measured hydraulic conductivity values are relatively high, ranging from approximately
1 to more than 200 feet per day (ft/day) (HMC and Hydro-Engineering 2010).
Figure 6 illustrates the transmissivity of the alluvial aquifer at the site. Estimated
transmissivity values range three orders of magnitude from approximately 500 to more
than 40,000 gallons per day per foot (gpd/ft) (HMC and Hydro-Engineering 2010).

4
TPP Alluvial Pilot Testing Work Plan
Grants Reclamation Project Grants, New Mexico
Groundwater elevations and approximate flow directions for the alluvial aquifer are
shown on Figure 7. While local groundwater flow directions in the alluvial aquifer near
the site are highly variable, the flow direction is generally to the southwest. Local flow
directions are reversed between the injection and collection well networks to the
southwest of the LTP. This reversal constitutes the plume control program; the mounds
and depressions imposed on the piezometric surface limit advancement of the
groundwater contaminant plume.
The Chinle Formation is the shallowest bedrock unit in the vicinity of the site. In
general, the Chinle Formation is approximately 850 feet thick and consists of very low
permeability, massive shale that greatly restricts vertical groundwater flow (HMC and
Hydro-Engineering 2010). Within the Chinle Formation, are three hydraulically isolated
and uniformly distributed aquifer units (the Upper Chinle, Middle Chinle, and Lower
Chinle Aquifers), each bounded by overlying and underlying low permeability shale.
Each aquifer unit subcrops at the base of the alluvium, where hydraulic connectivity
occurs in areas of alluvium saturation (“mixing zone”). Two bedrock faults traverse the
site area along a northeast-southwest orientation, adding to the subcrop zone
complexity (Figure 8).
Alluvial Groundwater Quality
The primary source of groundwater contamination at the site is draindown from the
LTP, which consists of gradual seepage of pore water from the tailings as they
consolidate and drain after deposition. This tailings pore water contains elevated
concentrations of uranium and other COCs as a result of the residual chemistry of the
alkaline leach milling process. This impacted water moves from the bottom of the LTP
into the partially saturated zone above the alluvial aquifer directly beneath the LTP.
This impacted water then flows downgradient, to the southwest of the LTP, where it is
currently managed by the plume control program.
Figure 9 depicts the concentration of dissolved uranium in the alluvial aquifer based on
data from 2010; the areas immediately to the south and southwest of the LTP register
the highest uranium concentrations. Uranium concentrations in these areas within the
alluvial aquifer have not changed significantly since 2010; therefore, the data
presented in Figure 9 reasonably represent the current status of the alluvial aquifer.
5
TPP Alluvial Pilot Testing Work Plan
Grants Reclamation Project Grants, New Mexico
2.3 Existing Site Restoration Strategy
The CAP (HMC 2012) includes five major operational components: (1) source control,
(2) plume control, (3) reverse osmosis (RO) treatment, (4) evaporation, and (5) land
treatment. These five components of the current CAP work in combination as a proven
strategy to achieve source control and plume remediation. The source control program
limits future contaminant migration from the LTP. The plume control program inhibits
the downgradient migration of contaminated groundwater and sends highly
contaminated groundwater to the RO plant for treatment. Evaporation and land
treatment are essential water management practices that allow HMC to achieve target
treatment rates.
2.4 Alternative Technologies Feasibility Analysis
HMC is committed to the continuous optimization of the five existing CAP components
and to the evaluation of alternative treatment technologies. The CAP is a constantly
evolving process to improve operation performance and expedite restoration progress.
HMC has completed and is currently conducting numerous evaluations to determine if
the performance and/or operation of the five operational components of the CAP can
be optimized. HMC has also completed and is currently conducting evaluations of
alternative treatment technologies, as described in the Alternative Treatment
Technologies Feasibility Analysis (ARCADIS 2012a).
This feasibility analysis was submitted to the NMED on June 20, 2012 by ARCADIS on
behalf of HMC. It includes detailed evaluations of ex situ and in situ technologies that
have been or are currently being evaluated at the site, including TPP. In this analysis,
ARCADIS committed to preparing a work plan for the alluvial pilot testing and
submitting this plan to regulatory agencies during the second half of 2012.
3. In Situ Phosphate Treatment
In Situ Treatment
In recent decades, in situ groundwater treatment technologies have proven to be a
viable alternative to conventional pump-and-treat and associated ex situ treatment
technologies; in situ treatment technologies are more effective at achieving
groundwater endpoints and site closure. Unlike ex situ treatment, in situ treatment does
not rely on the extraction of groundwater, which requires intensive operations and

6
TPP Alluvial Pilot Testing Work Plan
Grants Reclamation Project Grants, New Mexico
maintenance. In situ remediation technologies achieve treatment in the subsurface
through physical, chemical, and/or biological mechanisms and contaminant
transformation to non-toxic endpoints. In the case of metals or radionuclide
contaminants, treatment is achieved through precipitation and/or immobilization (with
sequestration of the contaminant in the aquifer) to stable, insoluble solid phases.
The success of in situ treatment requires a thorough understanding of treatment
mechanisms under site-specific hydrogeologic and geochemical conditions and an
implementation strategy that provides adequate reactive media and efficient treatment,
while minimizing any secondary water quality effects. Currently, the site CAP consists
of source control and ex situ processes with various components for water treatment
and management. Pending continued success during testing, the full-scale
implementation of an in situ technology would strategically augment the current CAP
and would reduce the reliance on the current ex situ water treatment and management
processes to achieve the approved site cleanup standards for groundwater.
In Situ Phosphate Treatment
In situ phosphate treatment is an emerging technology currently under evaluation at
the site for the removal of dissolved uranium. The technology uses a phosphate
amendment to promote uranyl phosphate precipitation, which immobilizes dissolved
uranium. This technology has been used in bench- and field-scale tests by the U.S.
Department of Energy (DOE) and Pacific Northwest National Laboratory at the Hanford
site to reduce uranium concentrations in impacted groundwater (Wellman et al. 2005,
Vermeul et al. 2009).
A source of phosphate is injected directly into the aquifer, where it reacts and
complexes with dissolved uranium to form uranium phosphate mineral precipitates.
These minerals include chernikovite (H[{UO2}{PO4}].4H2O), autunite hydrates
(Ca[{UO2}{PO4}]2.xH2O), and apatite (Ca5[PO4]3[F,Cl,OH]). In the presence of excess
phosphate, additional apatite is formed, which provides long-term treatment capacity
as future upgradient contaminated water passes through the treated zone (Hamdy et
al. 2008).
These uranium phosphate minerals have very low solubility under ambient aquifer
conditions (Wellman et al. 2005). The oxidation state of uranium is not changed by this
technology, so there is limited possibility of re-oxidation and resulting remobilization.
The application of phosphate through an injection-based approach can provide a
means of in situ groundwater treatment that results in the direct precipitation of

7
TPP Alluvial Pilot Testing Work Plan
Grants Reclamation Project Grants, New Mexico
uranium, as well as the establishment of a reactive barrier for longer-term treatment as
upgradient impacted groundwater water moves through the treatment zone.
Two sources of phosphate (orthophosphate and TPP) have been used in evaluations
of this technology. Orthophosphate is an immediately available source, whereas TPP
slowly hydrolyzes (reacts with water) and thereby provides a gradual source of
phosphate. The kinetics of the hydrolysis reactions can be fast or slow, depending
upon a number of factors, including pH and chemical composition of the groundwater.
Residual phosphate from both amendments is expected to react with calcium in
groundwater and in aquifer solids to precipitate apatite, forming a reactive barrier of
apatite and limiting residual orthophosphate concentration in the groundwater (Fuller et
al. 2002, Fuller et al. 2003, Vermeul et al. 2009).
3.1 Summary of Previous Evaluations
HMC and ARCADIS have evaluated the feasibility and effectiveness of in situ TPP
treatment on the bench and field scale. While the full-scale implementation concept
(Section 3.2) is to use a phosphate amendment to treat groundwater in the alluvial
aquifer, a pilot test was conducted in the LTP to evaluate the effectiveness of a TPP
amendment to immobilize uranium in situ and to support the approval and design of
alluvial pilot testing. NRC and NMED were notified of the LTP testing in a letter dated
August 13, 2010 (HMC 2010).
The TPP testing program was designed in distinct phases to facilitate decision points
and generate the data necessary to proceed to subsequent phases. These phases,
their associated objectives, and time frame are summarized in Table 2.
3.1.1 Phase 1 – Bench Testing
The objectives of the bench testing are summarized in Table 2.
The bench testing was conducted as an iterative process, with results from initial test
programs determining the experimental design parameters in subsequent tests.
Because the first pilot-scale test was conducted in the LTP, bench testing focused on
optimizing treatment for the LTP pore water before evaluating treatment in the alluvial
aquifer. These design parameters, and the test programs associated with them, are
described in greater detail in Appendix A.

8
TPP Alluvial Pilot Testing Work Plan
Grants Reclamation Project Grants, New Mexico
Bench testing is ongoing, and the current focus is on optimizing treatment for alluvial
groundwater in the presence of alluvial soils. The primary objectives of the current
testing program are: (1) to determine the optimal dose of TPP to achieve uranium
immobilization while minimizing residual phosphate concentrations in groundwater and
(2) to evaluate any secondary effects of TPP on alluvial groundwater and soils
(Appendix A). This bench testing program will continue to be used to finalize the
design details of the amendment solution that will be injected during the alluvial pilot
test.
3.1.2 Phase 2 – LTP Tracer Testing
Two tracer tests were conducted in the LTP to evaluate the flow regime and hydraulic
connectivity of the monitoring network and to determine the hydraulic parameters
necessary to implement the LTP pilot test phase. Two tests were performed to
evaluate these objectives at two areas known to have different properties: one
predominantly defined by coarser tailings solids (sands) and the other defined by finer-
grained tailings solids (slimes). The tracer tests were conducted using two
conservative, non-reactive tracers (fluorescein and potassium bromide) for visual
screening and analytical testing, respectively. The results of the tracer tests were used
to determine which area would be more suitable and provided critical pilot test design
information.
Detailed information about the testing procedure and results of the LTP tracer tests is
included in Appendix B.
3.1.3 Phase 3 – LTP Pilot Testing
A pilot test was conducted in the LTP in September 2011 to evaluate the effectiveness
of an injected TPP solution for immobilizing uranium in situ in the LTP. The pilot test
was conducted using one injection point and six monitoring wells to evaluate the
performance of the injected amendment for approximately 6 months after the injection
event. Based on the bench testing results, the amendment solution for the LTP pilot
test also required a pH adjustment and additional calcium amendment.
Detailed information about the testing procedure and results of the LTP pilot test is
included in Appendix B.

9
TPP Alluvial Pilot Testing Work Plan
Grants Reclamation Project Grants, New Mexico
3.1.4 Results
Phases 2 and 3 of the TPP testing program are complete, and results of these tests
are summarized below. Phase 1 is ongoing, and results collected to date are included
in Appendix A. HMC and ARCADIS are currently addressing the final objective of
Phase 1: the behavior and effectiveness of TPP under alluvial conditions, which
involves treating alluvial groundwater mixed with alluvial soils.
Phase 1 – Bench Testing Results
• TPP successfully immobilized uranium from LTP pore water at the bench scale
with a pH adjustment and the addition of calcium, both with and without the
presence of tailings solids:
– Up to 99.6 percent dissolved uranium removed from LTP pore water without
tailings solids.
– Up to 82 percent dissolved uranium removed from LTP pore water mixed with
tailings solids.
• pH adjustment of the LTP pore water was required due to the relatively high pH (8
to 9); at this pH, the dissolved uranium carbonate complex is very stable. The
addition of sulfuric acid to adjust the pH to 7 resulted in destabilization of the
dissolved uranium carbonate so that uranium was available to combine with
phosphate, resulting in precipitation. TPP successfully immobilized uranium from
alluvial groundwater at the bench scale with the addition of calcium and no pH
adjustment:
– Up to 97.4 percent dissolved uranium removed from alluvial groundwater.
Phase 2 – LTP Hydraulic Evaluation Results
• The LTP was sufficiently permeable in both the slimes and the sands for delivery
and distribution of an injected solution.
– The estimated mobile porosity of the slimes was determined to be
approximately 4 percent and greater than 8 percent in the sands.

10
TPP Alluvial Pilot Testing Work Plan
Grants Reclamation Project Grants, New Mexico
– Solutions could be safely injected at 3 gallons per minute (gpm) in the slimes
and at 9 gpm in the sands.
Phase 3 – LTP Pilot Testing Results
The pore water chemistry and hydraulic conductivity of the LTP are not representative
of the alluvial aquifer and present significantly more challenging conditions for in situ
treatment than the alluvial aquifer. For example, a pH adjustment was required for the
reaction of TPP with uranium in the LTP; however, this would not be required in the
alluvial aquifer because the reaction can proceed at the ambient pH of alluvial
groundwater.
In spite of the geochemical and hydrogeological challenges, Phase 3 successfully
demonstrated that dissolved uranium was immobilized by a TPP amendment. Uranium
was successfully immobilized (up to 81 percent) where the pH adjustment and
phosphate concentrations were sustained long enough for precipitation to occur. Other
key results from the LTP pilot test are:
• No significant or permanent mobilization of other COCs from the tailings was
observed.
• Phosphate minerals that were formed in situ were stable and did not re-dissolve
when the pore water geochemistry returned to pre-injection conditions.
• The injection solution was successfully delivered and distributed in the tailings,
creating an in situ emplaced reactive barrier to promote uranium precipitation and
immobilization.
The results of the LTP pilot test demonstrate that TPP can successfully remove
uranium in situ; that secondary geochemical and hydraulic effects can be managed;
and that the TPP amendment solution can be dissolved, delivered, and distributed in
the subsurface. There is potential for the effectiveness of TPP to be greater in the
alluvial aquifer, given that the desired reaction can proceed at the ambient pH and will
not rely on a pH adjustment.
3.2 Conceptual Approach
The conceptual full-scale design of this technology involves the injection of TPP or
another phosphate source in the alluvial aquifer to create emplaced reactive barriers of

11
TPP Alluvial Pilot Testing Work Plan
Grants Reclamation Project Grants, New Mexico
apatite. Injections would occur at a series of injection wells oriented perpendicular to
groundwater flow and spanning the width of the saturated alluvium that exceeds the
uranium site standard. As contaminated groundwater flows through the area, uranium
will precipitate as an insoluble mineral phase. The result will be in situ treatment of
dissolved uranium in groundwater (Figure 9). These emplaced reactive barriers could
be installed immediately downgradient of the LTP to prevent further contribution of
contaminants to the alluvial aquifer. The barriers would provide long-term in situ
treatment as an additional source control. The reactive barriers would be maintained
through additional injection events. The frequency and injection solution makeup of
these events would be determined by performance monitoring
Similar barriers could also be installed in other areas of the alluvial plume to treat
impacted groundwater and potentially increase cleanup timeframes. It may also be
possible to use this technology or a similar in situ phosphate technology in or
immediately underneath the LTP in the partially saturated zone as a source control
measure.
Because emplaced reactive barriers of TPP only treat uranium, this technology could
be coupled with another in situ treatment technology (i.e., injection of reductants) to
immobilize molybdenum and selenium in select areas where additional treatment may
be needed. The injection and distribution infrastructure used for TPP could be reused
for the injection of reductants to treat other COCs.
3.3 Pilot Test Locations
HMC proposes implementing Alluvial Pilot Testing in two different locations. The first
proposed location (Pilot Test S) is in the alluvial aquifer downgradient of the LTP and
STP and inside the hydraulic barrier within the site boundaries. The area is adjacent to
S4 directly west of the LTP, as depicted in Figure 1. The second proposed location
(Pilot Test X) is in the alluvial aquifer upgradient of the LTP near the HMC office
building. The area is near well X26, as depicted in Figure 2 and is also within the
hydraulic barrier. Each pilot testing location has specific objectives as well as distinct
advantages and disadvantages for evaluation of the technology. Conducting pilot-scale
field studies in two locations will allow a more robust evaluation of the technology and
consideration as a CAP component.
The scale and estimated geochemical and hydraulic footprint of the pilot tests
correspond to the box sizes shown in Figures 1 through 9, but the exact locations of
the pilot tests will be determined pending a detailed hydraulic review of the locations.

12
TPP Alluvial Pilot Testing Work Plan
Grants Reclamation Project Grants, New Mexico
The following considerations contributed to the selection of each of the proposed
locations.
Pilot Test S
The primary objective of the Pilot Test S location (Figure 1) is to evaluate the uranium
immobilization efficacy of TPP in a location exhibiting relatively high hydraulic
conductivity with a continuing, relatively high influx of higher uranium concentrations.
These two characteristics will allow HMC to evaluate the long-term treatment capacity
of emplaced TPP and the long-term stability of phosphate-uranium precipitates. The
results from Pilot Test S will be used to correlate the influx of uranium with an
appropriate dose of TPP to achieve long-term treatment capacity.
Advantages of the Pilot Test S location include:
• The proposed location (Figure 1) is within the same footprint of the full-scale
conceptual approach (Section 3.2) and thus would provide the most relevant
information necessary for the design and implementation of a full-scale approach.
• The area exhibits elevated uranium concentrations from LTP seepage; treatment
in this area would have significant remedial impact.
• The proposed location is upgradient of the hydraulic barrier. Groundwater in this
area is captured by the barrier and treated by the RO water treatment plant.
• The proposed location exhibits relatively high hydraulic conductivity, allowing
higher injection rates and more rapid reagent distribution (Figure 5).
• The area has existing wells that potentially could be used as additional monitoring
wells during the pilot test.
However, the proposed location also has several characteristics that will require
consideration during testing. Because the proposed location is upgradient of the
hydraulic barrier, the plume control program creates complicated and variable
hydraulics (Figure 7). Tracer testing will be conducted as part of the pilot test to
understand fluid injectability and the local groundwater flow regime in order to establish
a test area with stable, predictable hydraulics for evaluating treatment. Additionally,
the area exhibits a large saturated thickness (Figure 4), which can vary depending on
the operation of the upgradient RO collection wells. Therefore, HMC is planning to

13
TPP Alluvial Pilot Testing Work Plan
Grants Reclamation Project Grants, New Mexico
install shallow and deep well pairs, each with a screened interval of 20 ft for a total
screened interval at each location of 40 ft to monitor the entire saturated thickness.
Pilot Test X
The primary objective of the Pilot Test X location (Figure 2) is to evaluate the long-
term stability of uranium phosphate precipitates after TPP injections. The Pilot Test X
location exhibits relatively low hydraulic conductivity and relatively low uranium influx,
which will allow HMC to monitor any re-dissolution of the immobilized uranium.
Advantages of the Pilot Test X location include:
• The area exhibits slightly elevated uranium concentrations from LTP seepage, but
the continuing influx of uranium is relatively low.
• The proposed location is upgradient of the hydraulic barrier. Groundwater in this
area is captured by the barrier and treated by the RO water treatment plant.
• The proposed location exhibits relatively low hydraulic conductivity (Figure 5).
• The area has existing wells that potentially could be used as additional monitoring
wells during the pilot test.
• The area exhibits a relatively small saturated thickness (Figure 4), reducing the
required volume of injection solution and screened intervals of wells.
The local flow regime at the Pilot Test X area will be evaluated in more detail prior to
implementing pilot testing.
Depending on the results of the hydraulic evaluation conducted prior to the injection of
TPP (Section 4.1) for both pilot test areas, HMC may install an extraction well in the
immediate vicinity to exert the local hydraulic control needed for pilot testing.
4. Alluvial Pilot Testing
The pilot testing will be performed to demonstrate effective uranium immobilization in
the alluvial aquifer and to collect design parameters necessary for full-scale
implementation. To accomplish these objectives, the alluvial pilot tests will be

14
TPP Alluvial Pilot Testing Work Plan
Grants Reclamation Project Grants, New Mexico
conducted in two locations and in two phases, as discussed in the following sections
and summarized in Table 3.
4.1 Phase 1 – Hydraulic Evaluation
The objective of the alluvial hydraulic evaluation is to determine hydraulic and injection
parameters required for the final design of the alluvial pilot tests through tracer testing.
These parameters include safe and sustainable injection rates, volume-to-coverage
relationships, dilution of injected solutions, hydraulic connection of the monitoring
network, and fluid transport rates.
4.1.1 Well Installation
The wells installed for the hydraulic evaluation will also be used in the alluvial pilot
tests. The proposed well network is shown in Figures 11 and 12, and the proposed
well construction details are summarized in Tables 4 and 5.
These wells will be installed via a hollow-stem auger drill rig once HMC receives
approval to conduct the alluvial pilot tests. The wells will be installed by a driller
licensed in New Mexico.
After the wells are installed and prior to beginning the tracer test, the well network will
be developed by the driller.
4.1.2 Baseline Monitoring
Sampling prior to injections provides a baseline for constituent concentrations that will
be used to evaluate uranium treatment during the pilot test. All monitoring for the
hydraulic evaluation will use the analyte lists summarized in Table 6.
4.1.3 Tracer Testing
A fluorescent dye tracer, fluorescein, will be used for the tracer test. Fluorescent dye
tracers are safe, non-toxic, and have low visual and analytical detection limits. Field
staff will be able to determine tracer arrival through visual screening in the field, and
samples will also be sent to Ozark Underground Laboratories (OUL) for analysis.
The injection solution will be mixed using alluvial groundwater. The relationship
between the injected volume and the radius of influence (ROI) can be calculated using
the following equation:

15
TPP Alluvial Pilot Testing Work Plan
Grants Reclamation Project Grants, New Mexico
mhROIVolume 2
Where:
Volume = total injected volume
h = thickness of injected interval (i.e., screened interval)
Өm = mobile porosity
Assuming a 40 ft screened interval total and 20% mobile porosity for the Pilot Test S
location, approximately 18,800 gallons of injection solution will provide the target ROI
of 10 ft. Given the large saturated thickness at the Pilot Test S location, the injection
volume will be achieved using two injection wells screened at different intervals. Thus,
approximately 9,400 gallons will be injected per well for the total injection volume of
18,800 gallons. For the Pilot Test X location, the target ROI of 10 ft will be achieved
with an injection of 4,700 gallons of injection solution, assuming a 10 ft screened
interval and 20% mobile porosity.
Actual injection volumes will be determined in the field based on tracer breakthrough
and may exceed these estimated injection volumes.
Tracer Injections
Alluvial groundwater from a nearby extraction well or unimpacted groundwater from the
San Andres aquifer will be used for water supply to make the injection solution. The
tracer solution will be injected in batches using two 1,000 gal tanks. The tracer injection
solution will be delivered into the injection well via gravity feed, but pumps will be used
if necessary to achieve reasonable flow rates.
Monitoring
The monitoring program for the hydraulic evaluation will involve baseline monitoring,
monitoring during the tracer injection, and post-injection monitoring. It is anticipated
that tracer monitoring will continue for 2 to 3 months after the injection ends. The
monitoring program will include monitoring of tracer concentration and water levels.
The frequency and duration of the monitoring program will be adjusted if needed,
based on initial results.

16
TPP Alluvial Pilot Testing Work Plan
Grants Reclamation Project Grants, New Mexico
4.2 Phase 2 – Alluvial Pilot Test
Some detailed aspects of the pilot test design will be finalized after the hydraulic
evaluation is complete. The hydraulic evaluation will provide location-specific
information about hydraulic and injection parameters, including the hydraulic
connectivity of the well network, local direction of groundwater flow, safe and
sustainable injection rates, and the relationship between injected volume and ROI.
4.2.1 Injection Approach
It is anticipated that the amendment solution that will be injected for the pilot test will
consist of TPP and a tracer.
The amendment solution will be injected until the target phosphate concentrations are
observed at the dose response wells. The target in situ concentration will be
approximately 1,000 milligrams per liter (mg/L) as phosphate; this value will be refined
based on the results of ongoing bench testing.
The target injection volume will be refined by the results of the hydraulic evaluation to
provide an ROI of 10 ft. This target ROI was used to design the proposed well
networks (Figures 11 and 12). The volume of TPP injection solution may be greater
than the tracer injection volumes due to the in situ retardation of TPP by the alluvial
aquifer. The amendment solution will be injected via gravity feed.
4.2.2 Amendment Injection
Tables 7 and 8 summarize the preliminary design parameters for the alluvial pilot test.
These parameters will be finalized based on the results of ongoing bench testing and
the hydraulic evaluation.
The injection of the amendment solution will continue until the target in situ phosphate
concentrations have been achieved at the dose response wells. This process will
create an emplaced reactive barrier within the ROI. If calcium is added either at the
end of TPP injections or in alternating batches with TPP, calcium concentrations at the
dose response wells will also be monitored to determine how long calcium injection
should proceed.
The equipment necessary for the injection infrastructure will be similar to that used
during the hydraulic evaluation, and any modifications will be installed prior to

17
TPP Alluvial Pilot Testing Work Plan
Grants Reclamation Project Grants, New Mexico
commencing injections. Two 1,000 gal tanks will be placed near the injection well with
necessary tubing to connect the injection well to the tanks and to the water supply
(either a nearby extraction well or RO product water line).
4.2.3 Monitoring
Two monitoring programs will be used for the pilot test. Immediately before and during
the period of active injections, the injection monitoring program will be followed. The
performance monitoring program will be followed during the post-injection period.
These programs are summarized in Table 9. Additionally, a downgradient well outside
of the pilot test well network will be used to monitor the extent of any geochemical
effects of the TPP injection based on the hydraulic evaluation. The actual monitoring
frequencies will be modified based on the results of the hydraulic testing phase.
Performance monitoring will include analysis for the analytes listed in the Table 6.
Soil Coring and Sampling
Soil coring and analysis is planned after the pilot test injections. Soil cores will be taken
and analyzed to characterize precipitated mineral forms and to evaluate mechanisms
of uranium immobilization and resistance to remobilization. Samples will be taken from
within the emplaced reactive barrier in addition to control samples taken outside of the
barrier. This information will be used to refine the conceptual treatment approach,
specifically the long-term stability of the precipitates and residual treatment capacity.
Long-Term Stability Evaluation
HMC may evaluate the long-term stability of the uranium phosphate precipitates
pending the preliminary results of post-injection performance monitoring. This
evaluation would involve the injection of RO product water into the injection well to
simulate a longer evaluation period of the uranium phosphate precipitates and their
resistance to remobilization.
4.2.4 Contingency Planning
Preliminary results of bench testing suggest that additional calcium may be required to
optimize uranium immobilization. Unlike in the LTP pilot test, TPP and calcium will not
be injected concurrently. Instead, the injection monitoring program will be used to
evaluate phosphate distribution and hydrolysis and uranium immobilization to

18
TPP Alluvial Pilot Testing Work Plan
Grants Reclamation Project Grants, New Mexico
determine if a calcium addition is necessary. Calcium may be added in alternating
batches with TPP or after TPP injections are complete.
5. Data Evaluation and Reporting
Field and analytical data from the alluvial pilot test will be used to characterize the
following performance parameters:
• TPP distribution, hydrolysis, and residence time
• Uranium immobilization
• Residual treatment capacity (e.g., at Pilot Test S)
• Long-term stability of precipitated uranium phosphate minerals (e.g., at Pilot Test
X)
• Any secondary geochemical effects (i.e., mobilization or immobilization of other
COCs)
• Secondary hydrologic effects (i.e., reduction in aquifer permeability)
The performance of the alluvial pilot testing will be reported to the regulatory agencies
in a summary report to be submitted after the performance monitoring period. If the
results support the feasibility of TPP treatment, HMC and ARCADIS will prepare a full-
scale implementation plan and submit a concurrent request for implementation
approval. Based on the results of the alluvial pilot test, the full-scale approach (Section
3.2) will be updated and refined in that report.
19
TPP Alluvial Pilot Testing Work Plan
Grants Reclamation Project Grants, New Mexico
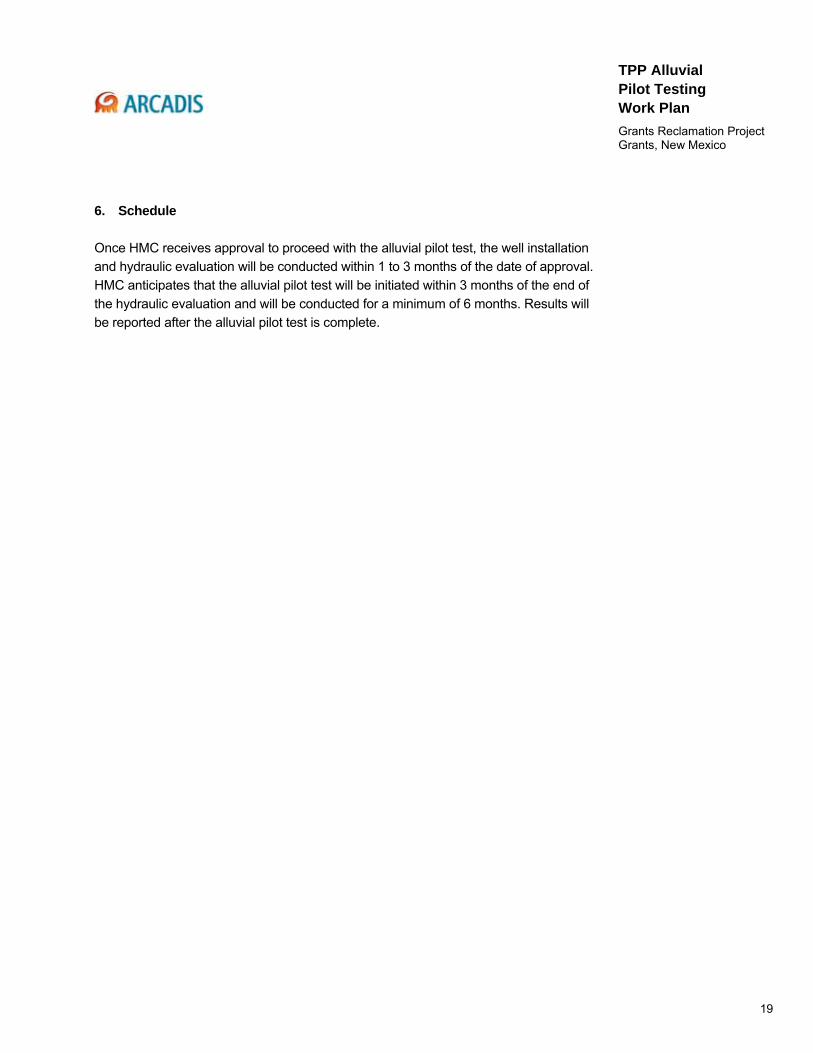
6. Schedule
Once HMC receives approval to proceed with the alluvial pilot test, the well installation
and hydraulic evaluation will be conducted within 1 to 3 months of the date of approval.
HMC anticipates that the alluvial pilot test will be initiated within 3 months of the end of
the hydraulic evaluation and will be conducted for a minimum of 6 months. Results will
be reported after the alluvial pilot test is complete.

20
TPP Alluvial Pilot Testing Work Plan
Grants Reclamation Project Grants, New Mexico
7. References
ARCADIS. 2012. Alternative Treatment Technologies Feasibility Analysis. Prepared on
behalf of HMC. June 20.
Fuller, C.C., J.R. Bargar, J.A. Davis, and M.J. Piana. 2002. Mechanisms of uranium
interactions with hydroxyapatite: Implications for groundwater remediation.
Environmental Science & Technology 36, pp. 158–165.
Fuller, C.C., J.R. Bargar, and J.A. Davis. 2003. Molecular-scale characterization of
uranium sorption by bone apatite materials for a permeable reactive barrier
demonstration. Environmental Science & Technology 37, pp. 4642–4649.
Hamdy, H., A. El-Naby, and Y.H. Dawood. 2008. Natural attenuation of uranium and
formation of autunite at the expense of apatite within an oxidizing environment, south
Eastern Desert of Egypt. Applied Geochemistry 23(12): 3741–3755.
HMC. 2012. Grants Reclamation Project Updated Corrective Action Program (CAP).
Prepared for the Nuclear Regulatory Commission. March.
HMC and Hydro-Engineering. 2003. Grants Reclamation Project, Background Water
Quality Evaluation of the Chinle Aquifers. Consulting Report for Homestake Mining
Company of California.
HMC and Hydro-Engineering. 2010. Ground-Water Hydrology, Restoration and
Monitoring at the Grants Reclamation Site for NMED DP-200. Prepared for the New
Mexico Environment Department. February.
HMC and Hydro-Engineering. 2012. Grants Reclamation Project, 2011 Annual
Monitoring Report/Performance Review for Homestake’s Grants Project Pursuant to
NRC License SUA-1471 and Discharge Plan DP-200. Consulting Report for
Homestake Mining Company, Grants, New Mexico.
Meyer, M. 2010. U.S. Nuclear Regulatory Commission. Complexities of
Decommissioning a Uranium Mill Site. NRC ADAMS ML100560341. August 5.
New Mexico Environment Department (NMED). 2010. Treatment Alternatives Testing
in the Large Tailings Pile (LTP). Response to November 7 correspondence from Al
Cox. November 22.

21
TPP Alluvial Pilot Testing Work Plan
Grants Reclamation Project Grants, New Mexico
Vermeul, V.R., B.N. Bjornstad, B.G. Fritz, J.S. Fruchter, R.D. Mackley, D.P. Mendoza,
D.R. Newcomer, M.L. Rockhold, D.M. Wellman, and M.D. Williams. 2009. 300 Area
Uranium Stabilization through Polyphosphate Injection: Final Report. Pacific Northwest
National Library. PNNL-18529. June
Wellman, D.M., J.P. Icenhower, E.M. Pierce, B.K. McNamara, S.D. Burton, K.N.
Geiszler, S.R. Baum, and B.C. Butler. 2005. Polyphosphate Amendments for In-Situ
Immobilization of Uranium Plume. Proceedings of the Third International Conference
on the Remediation of Contaminated Sediments. PNNL-SA-43638.

g:\aproject\barrick\ao000120.0001 grants uranium project - nm\task 1 alternative groundwater treatment\alluvial implementation\work plan\final alluvial pilot test work plan.docx 22
TPP Alluvial Pilot Testing Work Plan
Grants Reclamation Project Grants, New Mexico
8. Tables
Table 1 Hydraulic Properties of the Alluvial Aquifer
Parameter Value Location and Notes
Pilot Test S
Saturated Thickness (ft) 37.5 Well BC
50.7 Well S4
53.1 Well S2
Hydraulic Conductivity (ft/day) 2.4 Well S4
1.5 Well SO
Transmissivity (gpd/ft) 281 Well S4
281 Well SO
1800 Well S2
Pilot Test X
Saturated Thickness (ft) 11.9 Well X18
9.0 Well X26
Hydraulic Conductivity (ft/day) 2.6 Well X14
1.0 Well X17
3.2 Well 1B
Transmissivity (gpd/ft) 75 Well 1G
71 Well 1F
283 Well 1B

g:\aproject\barrick\ao000120.0001 grants uranium project - nm\task 1 alternative groundwater treatment\alluvial implementation\work plan\final alluvial pilot test work plan.docx 23
TPP Alluvial Pilot Testing Work Plan
Grants Reclamation Project Grants, New Mexico
Table 2 Summary of Previous Testing
Phase and Schedule
Objectives Testing Design and Procedures
Phase 1 – Bench Testing October 2010 to Present
Determine optimal TPP concentration
Determine the kinetics of the TPP reaction
Identify need for additional chemical manipulation of groundwater to optimize the TPP reaction
Characterize the fate and behavior of TPP in alluvial conditions
Iterative process involving the following parameters:
Test media: LTP pore water, an LTP pore water and tailings solids slurry, alluvial groundwater, and an alluvial groundwater and alluvial soils slurry
Phosphate sources: orthophosphate and sodium tripolyphosphate (STPP)
Chemical manipulation: pH adjustment and calcium addition
Phase 2 – LTP Tracer Testing November 2010 to July 2011
Evaluate the hydraulic connectivity and local flow directions
Determine injectability parameters
Characterize the velocity, dilution, and transport behavior of injected amendments
Test locations: two locations in the LTP (one slimes-dominated, one sands-dominated)
Tracers: potassium bromide (analytical tracer) and sodium fluorescein (visual field tracer)
Monitoring: continued for 250 days after injection
Phase 3 – LTP Pilot Testing September 2011 to March 2012
Evaluate injectability and distribution of the amendment solution in the tailings
Evaluate geochemical and COC trends to demonstrate uranium immobilization and to characterize any secondary effects
Test location: slimes-dominated LTP location from Phase 2
Injection solution: LTP pore water mixed with STPP, calcium chloride, tracers (rhodamine WT and deuterium), and sulfuric acid
Monitoring: continued for 170 days after injection

g:\aproject\barrick\ao000120.0001 grants uranium project - nm\task 1 alternative groundwater treatment\alluvial implementation\work plan\final alluvial pilot test work plan.docx 24
TPP Alluvial Pilot Testing Work Plan
Grants Reclamation Project Grants, New Mexico
Table 3 Summary of Alluvial Pilot Testing Phases
Phase and Schedule
Objectives Testing Design and
Procedures Phase 1 – Alluvial Hydraulic Evaluation Late 2012 to early 2013, pending approval
Evaluate the hydraulic connectivity and local flow directions for well network
Determine injectability parameters
Characterize the velocity, dilution, and transport behavior of injected amendments
Test location: western side of the LTP (near S4) and eastern side of LTP (near X26), both upgradient of the hydraulic barrier
Tracers used: conservative (non-reactive, non-sorbing) tracer (i.e., fluorescent dye)
Phase 2 – Alluvial Pilot Testing Late 2013, pending approval
Determine the injectability of the amendment solution and subsequent distribution and transport in the alluvial aquifer
Evaluate geochemical trends to demonstrate uranium sequestration and to characterize any secondary effects on geochemistry and hydrogeology
In Pilot Test S location, evaluate long-term treatment capacity of emplaced TPP. Correlate uranium influx with appropriate TPP dose.
In Pilot Test X location, evaluate the long-term stability of uranium phosphate precipitates after TPP injections.
Collect data necessary for the design of a full-scale TPP injection program in the alluvial aquifer
Test location: same well networks as in Phase 1
Injection solution: alluvial groundwater mixed with STPP, a source of calcium, and tracer
Multiple injection events or injection of calcium may be required in the Pilot Test S location (determined through performance monitoring)

g:\aproject\barrick\ao000120.0001 grants uranium project - nm\task 1 alternative groundwater treatment\alluvial implementation\work plan\final alluvial pilot test work plan.docx 25
TPP Alluvial Pilot Testing Work Plan
Grants Reclamation Project Grants, New Mexico
Table 4 Well Network and Construction for Pilot Test S
ft in ft bgs ft bgs
SIW-1S 2 55 – 75 75
SIW-1D 2 75 – 95 95
SDR-1S 2 55 – 75 75
SDR-1D 2 75 – 95 95
SDR-2S 2 55 – 75 75
SDR-2D 2 75 – 95 95
SDR-3S 2 55 – 75 75
SDR-3D 2 75 – 95 95
SDR-4S 2 55 – 75 75
SDR-4D 2 75 – 95 95
SMW-1S 2 55 – 75 75
SMW-1D 2 75 – 95 95
SMW-4S 2 55 – 75 75
SMW-4D 2 75 – 95 95
SMW-6S 2 55 – 75 75
SMW-6D 2 75 – 95 95Key
f t = feet
ft bgs = feet below ground surface
in = inches
ROI = radius of inf luence
SMW-5 2 65 – 85 85
SMW-2 2 65 – 85 85
SMW-3 2 65 – 85 85
Upgradient Monitoring Well
20(2.0 ROI)
Distance from IW
DiameterScreened Interval
Dose Response Well
10 ft (ROI)
Dose Response Well
7.5 (0.75 ROI)
15 (1.5 ROI)
Total Depth
10 ft (ROI)
Dose Response Well
Well IDPurpose
Injection Well N/A
7.5 (0.75 ROI)
Dose Response Well
Monitoring Well
Monitoring Well25
(2.5 ROI)
Monitoring Well25
(2.5 ROI)
Monitoring Well25
(2.5 ROI)
Monitoring Well15
(1.5 ROI)

g:\aproject\barrick\ao000120.0001 grants uranium project - nm\task 1 alternative groundwater treatment\alluvial implementation\work plan\final alluvial pilot test work plan.docx 26
TPP Alluvial Pilot Testing Work Plan
Grants Reclamation Project Grants, New Mexico
Table 5 Well Network and Construction for Pilot Test X
ft in ft bgs ft bgs
Injection Well N/A XIW-1 2 45 – 55 55
10 ft X26
(ROI) (XDR-1)
7.5 ft
(0.75 ROI)
10 ft
(ROI)
7.5 ft
(0.75 ROI)
15 ft
(1.5 ROI)
25 ft
(2.5 ROI)
25 ft
(2.5 ROI)
15 ft
(1.5 ROI)
25 ft
(2.5 ROI)
Upgradient 20 ft
Monitoring Well (2.0 ROI)
Key
f t = feet
ft bgs = feet below ground surface
in = inches
ROI = radius of inf luence
Purpose
Distance from IW Well ID
DiameterScreened Interval
Total Depth
37 – 57
XDR-3 2 45 – 55
Monitoring Well
Monitoring Well
57
XDR-2 2 45 – 55 55
XDR-3 2 45 – 55 55
2
55
Monitoring Well XMW-1 2 45 – 55 55
XMW-2 2 45 – 55 55
Monitoring Well XMW-3 2 45 – 55 55
45 – 55 55
Monitoring Well XMW-5 2 45 – 55 55
XMW-6 2 45 – 55 55
Dose Response Well
Dose Response Well
Dose Response Well
Dose Response Well
XMW-4 2

g:\aproject\barrick\ao000120.0001 grants uranium project - nm\task 1 alternative groundwater treatment\alluvial implementation\work plan\final alluvial pilot test work plan.docx 27
TPP Alluvial Pilot Testing Work Plan
Grants Reclamation Project Grants, New Mexico
Table 6 Alluvial Pilot Test Analyte Lists
Parameter Unit Method
Analytical
Uranium (U)
Uranium Precision
Molybdenum (Mo) mg/L E 200.7
Selenium (Se) mg/L E 200.8
Bicarbonate as HCO3- mg/L A2320 B
Calcium (Ca) mg/L E 200.7
Magnesium (Mg) mg/L E200.7
Potassium (K) mg/L E200.7
Sodium (Na) mg/L E200.7
Sulfate (SO42-) mg/L E 200.0
Total Dissolved Solids (TDS) @ 180°C mg/L A2540 C
Alkalinity (as CaCO3) mg/L A2320 B
Carbonate (as CO3) mg/L A2320 B
pH s.u. E 4500 H B
Phosphorous, Total as P mg/L
Phosphorous, Ortho as P (dissolved) mg/L
Tracer (TBD) TBD TBD
Field Parameters
Water Level ft bgs Water level meter
Temperature °C Field probe
Oxidation Reduction Potential (ORP) mV Field probe
Conductivity µmhos/cm Field probe
Dissolved Oxygen (DO) mg/L Field probe
Key
All parameters are dissolved, unless otherw ise noted. N/A = Not Analyzed
mg/L = milligrams per liter N/M = Not Measured
µmhos/cm - micromhos per centimeter TBD = to be determined
ft bgs = feet below ground surface s.u. = standard units
° C = degrees Celcius mV = millivolts
ICP- 6010B, 365.4, SM4500-P B,F
mg/L E 200.8

g:\aproject\barrick\ao000120.0001 grants uranium project - nm\task 1 alternative groundwater treatment\alluvial implementation\work plan\final alluvial pilot test work plan.docx 28
TPP Alluvial Pilot Testing Work Plan
Grants Reclamation Project Grants, New Mexico
Table 7 Design Parameters for Alluvial Pilot Test S
Injection Design
10 Target ROI (ft) 18,800 Target Injection Volume (gal) of TPP 1,000 Batch Volume (gal) 19+ No. of Batches of TPP
1 – 5 gpm (gravity) Injection Rate
Chemical Amendments
2,000 Target Phosphate Concentration in Injection Solution (mg/L as PO4)
1,000 Target In Situ Phosphate Concentration (mg/L as PO4)
TBD Calcium Addition 40 Fluorescent organic dye (mg/L)
Table 8 Design Parameters for Alluvial Pilot Test X
Injection Design
10 Target ROI (ft) 4,700 Target Injection Volume (gal) of TPP 1,000 Batch Volume (gal)
5 No. of Batches of TPP 1 – 5 gpm (gravity) Injection Rate
Chemical Amendments
2,000 Target Phosphate Concentration in Injection Solution (mg/L as PO4)
1,000 Target In Situ Phosphate Concentration (mg/L as PO4)
TBD Calcium Addition 40 Fluorescent organic dye (mg/L)

g:\aproject\barrick\ao000120.0001 grants uranium project - nm\task 1 alternative groundwater treatment\alluvial implementation\work plan\final alluvial pilot test work plan.docx 29
TPP Alluvial Pilot Testing Work Plan
Grants Reclamation Project Grants, New Mexico
Table 9 Alluvial Pilot Test Monitoring Program
Injection
Well Dose Response Wells
Monitoring Wells
Parameter Monitoring Frequency
Bas
e-l
ine Analytical 1x 1x 1x
Tracer 1x 1x 1x
Inje
ctio
n M
on
ito
rin
g
Analytical • At arrival • Every 5,000 gal injected• End of injections
• At 15,000 gal injected • Every 5,000 gal injected• End of injections
Tracer
• Field screening every 2,000 gal • Every 5,000 gal injected after arrival • End of injections
• Every 5,000 gal injected after arrival • End of injections
Water Levels 2x daily 2x daily
Per
form
ance
Mo
nit
ori
ng
Analytical • 2x/month for 1 month
• 1x/week for 1 month • 2x/month for 1 month • 1x/month for 3 to 6 months
• 1x/week for 1 month • 2x/month for 1 month • 1x/month for 3 to 6 months
Tracer • 2x/month for 1 month
• 1x/week for 1 month • 2x/month for 1 month • 1x/month for 3 to 6 months
• 1x/week for 1 month • 2x/month for 1 month • 1x/month for 3 to 6 months
Water Levels • After 1st month
• 1x/week for 1 month • 2x/month for 1 month • 1x/month for 3 to 6 months
• 1x/week for 1 month • 2x/month for 1 month • 1x/month for 3 to 6 months

g:\aproject\barrick\ao000120.0001 grants uranium project - nm\task 1 alternative groundwater treatment\alluvial implementation\work plan\final alluvial pilot test work plan.docx 30
TPP Alluvial Pilot Testing Work Plan
Grants Reclamation Project Grants, New Mexico
9. Figures


HIGHW
AY 60
5
COLLECTIONPOND LINED
EVAP PONDNO. 2 LINED
EVAP PONDNO. 1
SMALL TAILINGSPILE
HMCOFFICE
LARGE TAILINGS PILE(RECLAMATION IN PROGRESS)
MURRAY ACRES
BROADVIEW ACRES
22 2327 26
23 2426 25
26 2535 36
27 2634 35
±0 1,200 2,400
Feet
GRANTS RECLAMATION PROJECTTPP Alluvial Pilot Test Work Plan
FIGURE 3BASE OF ALLUVIUM
3D BASE OF ALLUVIUM ANDBEDROCK GEOLOGY - FACING NORTHEAST
LEGENDS:
K:\AO
0001
20-G
rants\
GIS\A
rcMap
s\201
2 TPP
Alluv
ial P
ilot T
est W
ork P
lan\Fi
gure
3_Ba
se of
Alluv
ium.m
xd - 1
1/29/2
012 @
11:27
:16 AM
West Fault
East Fault
Base of Alluvium N
Base ofAlluviumElevation(FT-AMSL)
6,5706,5506,5306,5106,4906,4706,4506,4306,410
BedrockHydrostratigraphy
Chinle Shale
Chinle Shale
Chinle Shale
Chinle ShaleSan Andres-Glorietta Aquifer
Upper Chinle Aquifer
Middle Chinle Aquifer
Lower Chinle Aquifer
PILOT TEST S
PILOT TEST X
Approximate Pilot Test Location
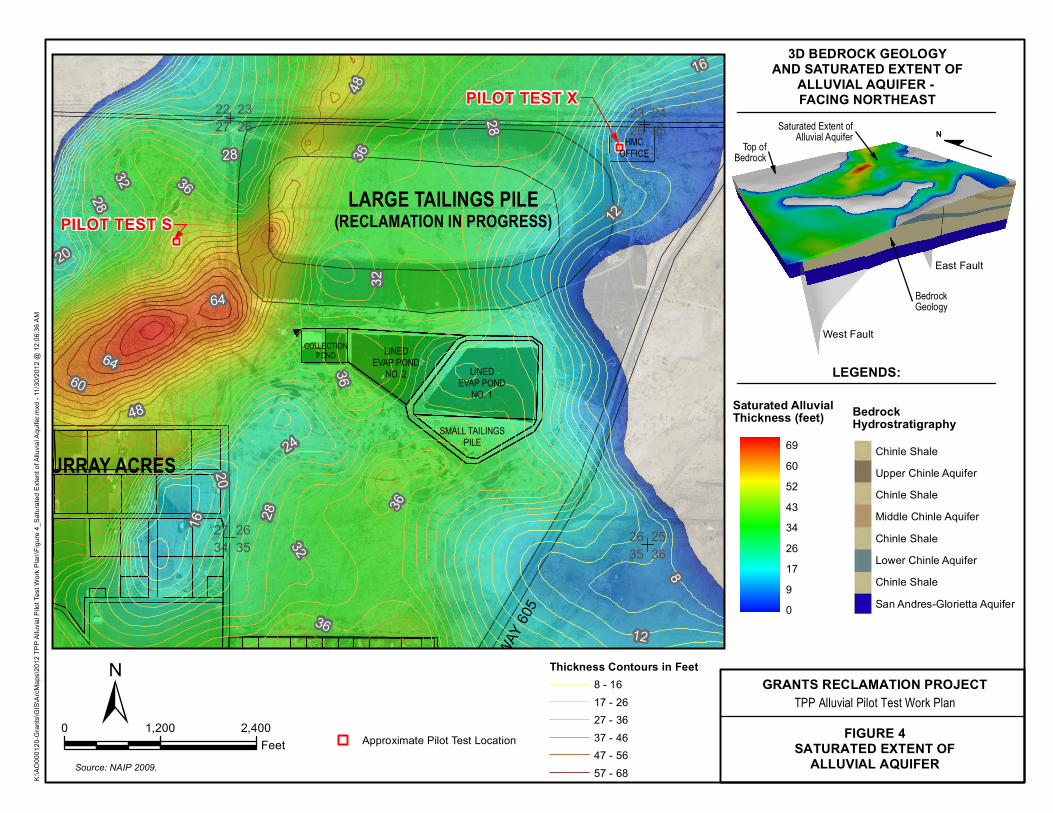
GRANTS RECLAMATION PROJECTTPP Alluvial Pilot Test Work Plan
FIGURE 4SATURATED EXTENT OF
ALLUVIAL AQUIFER
3D BEDROCK GEOLOGYAND SATURATED EXTENT OF
ALLUVIAL AQUIFER - FACING NORTHEAST
LEGENDS:
K:\AO
0001
20-G
rants\
GIS\A
rcMap
s\201
2 TPP
Alluv
ial P
ilot T
est W
ork P
lan\Fi
gure
4_Sa
turate
d Exte
nt of
Alluv
ial Aq
uifer.
mxd -
11/30
/2012
@ 12
:06:36
AM
West Fault
East Fault
N
HIGHW
AY 60
5
COLLECTIONPOND LINED
EVAP PONDNO. 2 LINED
EVAP PONDNO. 1
SMALL TAILINGSPILE
HMCOFFICE
LARGE TAILINGS PILE(RECLAMATION IN PROGRESS)
MURRAY ACRES
22 2327 26
23 2426 25
26 2535 36
27 2634 35
28 3664
48
20
28
48
3256
24
36
28
16
3640
64
16
20
36
16
12
8
32
60
2832 36
12
±0 1,200 2,400Feet
Saturated Extent ofAlluvial Aquifer
BedrockGeology
Saturated AlluvialThickness (feet)
6960524334261790
Source: NAIP 2009.
Top ofBedrock
BedrockHydrostratigraphy
Chinle Shale
Chinle Shale
Chinle Shale
Chinle ShaleSan Andres-Glorietta Aquifer
Upper Chinle Aquifer
Middle Chinle Aquifer
Lower Chinle Aquifer
Thickness Contours in Feet8 - 1617 - 2627 - 3637 - 4647 - 5657 - 68
PILOT TEST S
PILOT TEST X
Approximate Pilot Test Location

PILOT TEST S
PILOT TEST X
HIGHW
AY 60
5
COLLECTIONPOND LINED
EVAP PONDNO. 2 LINED
EVAP PONDNO. 1
SMALL TAILINGSPILE
HMCOFFICE
PLEASANT VALLEYESTATES
LARGE TAILINGS PILE(RECLAMATION IN PROGRESS)
MURRAY ACRES
21 2228 27 22 23
27 2623 2426 25
26 2535 36
27 2634 35
28 2733 34
EAST FAULT
WEST FAULT
1
2
6
2
71
15
35
26
82
1525
53
16
35
1710
3723
8267 27375292
74
5913
41
30
25
0.2
4.1
1693.1
2.69.8
0.4
7.4
1.5
2.4
138
1.7
0.2
434227
3.2
3.15.5
2.8
5.6
0.71.1
5.63.4
4.2
770
124163
190180
4.5
0.7 4.40.60.8
7.66.5
3.7
4.1
4.13.8
4.7
3.2
36.327.1
22.218.5
17.4
75.3
14.4
33.9
34.6
91.6
38.635.1
27.8
80.2
43.3
17.2
13.9
75.9
12.891.658.6
39.4
10.6
14.1
14.254.5
11.3
23.445.927.4
39.678.2
67.1
90.970.722.9
19.8
53.6
1.2
0.2
2.8
0.22
12.7
12.7
10
10
10
20
50
10
20
50
20
20
20
10
20
50
10
20
0 450 900Feet
CITY
: Bou
lder, C
O D
RAFT
ER: J
. CHE
N
±Basemap features from:Hydro-Engineering, 2011
K:\AO
0001
20-G
rants\
GIS\A
rcMap
s\201
2 TPP
Alluv
ial Pi
lot Te
st Wo
rk Pla
n\Figu
re 5_
Hydra
ulic C
ondu
ctivit
y of A
lluvia
l Aqu
ifer.m
xd - 1
1/29/2
012 @
10:14
:54 PM
FIGURE 5HYDRAULIC CONDUCTIVITY
OF ALLUVIAL AQUIFER
GRANTS RECLAMATION PROJECTTPP Alluvial Pilot Test Work Plan
LEGEND:FaultWell Location andHydraulic Conductivity Value (ft/day)Hydraulic Conductivity Contourfor Alluvial Aquifer (ft/day)Alluvial Aquifer
Approximate Pilot Test Location
20
67

HIGHW
AY 60
5
COLLECTIONPOND LINED
EVAP PONDNO. 2 LINED
EVAP PONDNO. 1
SMALL TAILINGSPILE
HMCOFFICE
PLEASANT VALLEYESTATES
LARGE TAILINGS PILE(RECLAMATION IN PROGRESS)
MURRAY ACRES
21 2228 27 22 23
27 2623 2426 25
26 2535 36
27 2634 35
28 2733 34
EAST FAULT
WEST FAULT
13
70
5924
40
14
83
7571
540
624
281313
756
185
317
467900
347
452
180850
486
380330
154200
788631
590
460
110
100
283
5410
1300
40601760316032901250
22502790
4010
1600
1210
1600
1800
360047006500
6640
6600
2040
2410
1970
5700
2600
34005300
5300
810013501010 6200
40706500
630031003380
3220
1070
3170
6050
1080
7010
7210
94702950
4080
4140
12500
11400
18500 8770054300
63000
1350030600
37000
11000
2900046600 1300016000
1100011000
25205
21100
11600
13600
16700
24205
14500
22200
15000
186200
222000
186
770
1610
13702420
21800
106005,000
1,000
10,000
5000
1,000
10,000
1,000
1,000
5,000
10,000
5,000
50,000
500
1,000
0 450 900Feet
CITY
: Bou
lder, C
O D
RAFT
ER: J
. CHE
N
±Basemap features from:Hydro-Engineering, 2011
K:\AO
0001
20-G
rants\
GIS\A
rcMap
s\201
2 TPP
Alluv
ial Pi
lot Te
st Wo
rk Pla
n\Figu
re 6_
Trans
miss
ivity o
f Allu
vial A
quife
r.mxd
- 11/3
0/201
2 @ 12
:10:22
AM
FIGURE 6TRANSMISSIVITY OF ALLUVIAL AQUIFER
GRANTS RECLAMATION PROJECTTPP Alluvial Pilot Test Work Plan
LEGEND:FaultWell Location andTransmissivity Value (gpd/ft)Transmissivity Contour forAlluvial Aquifer (gpd/ft)Alluvial Aquifer
Approximate Pilot Test Location
1,000
15000
PILOT TEST S
PILOT TEST X

HIGHW
AY 60
5
LINEDEVAP POND
NO. 2 LINEDEVAP POND
NO. 1
SMALL TAILINGSPILE
HMCOFFICE
PLEASANT VALLEYESTATES
LARGE TAILINGS PILE(RECLAMATION IN PROGRESS)
MURRAY ACRES
21 2228 27 22 23
27 2623 2426 25
26 2535 36
27 2634 35
28 2733 34
6533
6533.1
6542.68
6543.24
6535.99 6544.87
6604.18* 6523.85 6539.526515.276538.57
6538.986515.56 6535.67
6537.846516.066515.09
6537.45
6518.33 6535.746515.15 6537.48
6536.676517.29
6536.566535.69 6539.596518.656518.846506.98
6501.566514.12 6535.48
6528.596523.46 6534.816547.626500.84 6532.38
6533.73
6525.73
6535.136528.22 6530.54 6547.946503.41
6541.82
6546.36
6544.86 6544.836529.09
6533.026532.77
6528.57 6530.25 6566.76
6520.15
6538.11
6525
65356540
6515
6520
6510
6505
6545
6500 6534
6535
6535
6540
6540
65456535
6540
0 400 800Feet
CITY
: Bou
lder, C
O D
RAFT
ER: J
. CHE
N
±Basemap features from:Hydro-Engineering, 2011
K:\AO
0001
20-G
rants\
GIS\A
rcMap
s\201
2 TPP
Alluv
ial Pi
lot Te
st Wo
rk Pla
n\Figu
re 7_
Grou
ndwa
ter Fl
ow in
the A
lluvia
l Aqu
ifer.m
xd - 1
1/30/2
012 @
12:20
:42 AM
FIGURE 7GROUNDWATER FLOWIN ALLUVIAL AQUIFER
GRANTS RECLAMATION PROJECTTPP Alluvial Pilot Test Work Plan
LEGEND:Alluvial Well withGroundwater Elevation (ft-amsl)Groundwater Elevation Contour(ft-amsl)
Groundwater Flow DirectionAlluvial Aquifer
6535
6440.34NOTES:1. Groundwater elevation contours are based on water levels measured in December 2010.
Water Level MeasurementExcluded from Contouring*
PILOT TEST S
Approximate Pilot Test Location
PILOTTEST X

HIGHW
AY 60
5
COLLECTIONPOND LINED
EVAP PONDNO. 2 LINED
EVAP PONDNO. 1
SMALL TAILINGSPILE
HMCOFFICE
LARGE TAILINGS PILE(RECLAMATION IN PROGRESS)
MURRAYACRES
BROADVIEW ACRES
22 2327 26
23 2426 25
26 2535 36
27 2634 35
EAST FAULT
WEST FAULT
±0 500 1,000
Feet
LEGEND:
Source: NAIP 2009.
K:\AO000120-Grants\GIS\ArcMaps\2012 TPP Alluvial Pilot Test Work Plan\Figure 8_Subcrops of Chinle Fm Aquifers.mxd - 11/30/2012 @ 12:23:52 AM
GRANTS RECLAMATION PROJECTTPP Alluvial Pilot Test Work Plan
FIGURE 8SUBCROPS OF
CHINLE FORMATION AQUIFERS
Subcrop of Upper ChinleAlluvium Overlies Sandstone
Subcrop of Middle ChinleAlluvium Overlies Sandstone
Saturated Alluvium
Saturated Alluvium
Fault
PILOTTEST S
PILOTTEST X
Approximate Pilot Test Location

HIGHW
AY 60
5
COLLECTIONPOND
LINEDEVAP POND
NO. 2LINED
EVAP PONDNO. 1
SMALL TAILINGSPILE
HMCOFFICE
LARGE TAILINGS PILE(RECLAMATION IN PROGRESS)
MURRAYACRES
BROADVIEWACRES
22 2327 26 23 24
26 25
26 2535 36
27 2634 35
EAST FAULT
WEST FAULT
BEDROCKHIGH
T 7.28
SA 8.5
W 0.142
TB 1.77
SV 16.5SS
3.08
L 0.935
K4 1.13
D1 1.52 C6
1.11BP
1.38
BC 1.23
B 0.041
1J 1.31
X 0.0398
L9 0.152
L6 0.187
I 0.0722
F 0.0648
B11 4.17
0802 0.4
NC 0.0291
KZ 0.0782
FB 0.0775
DC 0.0948
0844 0.173
Sub3 0.0227
TA 3.16
ST 2.24
S3 1.52
S2 11.1
S4 0.506
M5 0.134
L8 0.188
K5 0.571
L10 0.288
M9M6
1
10 0.160.16
K:\AO000120-Grants\GIS\ArcMaps\2012 TPP Alluvial Pilot Test Work Plan\Figure 9_Uranium in Alluvial Aquifer 2010.mxd - 11/15/2012 @ 9:46:13 AM
LEGEND:
GRANTS RECLAMATION PROJECTTPP Alluvial Pilot Test Work Plan
FIGURE 9URANIUM IN
ALLUVIAL AQUIFER(2010)
0869 0.31
Well IDUranium Dissolved (mg/L)
±
mg/L = milligrams per liter
Dissolved UraniumNotes:1. All well locations shown on map represent locations with contaminant concentration results used for contouring.2. Well locations with posted contaminant concentrations represent wells that are sampled frequently with available concentration data.
0 500 1,000Feet
Well in Alluvial AquiferFaultAlluvial Aquifer
Dissolved UraniumConcentration Contours (mg/L)
0.16110
PILOTTEST S
Approximate Pilot Test Location
PILOTTEST X

GRANTS RECLAMATION PROJECT TTP Alluvial Pilot Test Work Plan
FIGURE 10CONCEPTUAL APPROACH OF
TREATMENT
K:\A
O00
0120
-Gra
nts\
Illus
trato
rs\2
012
TTP
\Fig
ure
10_C
once
ptua
l App
roac
h of
Tre
atm
ent.a
i @ 1
1/04
/201
2
P
RE
PAR
ED
BY:
JC
Note: 1. Uranium is present in solution in a number of different complexes, mainly the calcium uranyl carbonate complex, under alluvial conditions.2. This figure is for illustration only, and is not to scale.
GROUND SURFACE INJECTION WELL
BEDROCKEMPLACED
REACTIVE ZONE
TREATEDGROUNDWATER
IMPACTEDGROUNDWATER
LTP
PERCHED ZONE
ALLUVIAL AQUIFER
MIXING ZONE
MIDDLE CHINLE
SUBCROP
U < 0.16 mg/L U > 0.16 mg/LAlluvium
Med/Coarse SandK = 1-50 ft/day
Thickness = 50 ft
Sodium Tripolyphosphate (STPP)target In Situ concentration = 1 g/L1/2 life = days to weeks
Ca-TPP
PO4
PO4
Apatite
Autunite
Ca
P3O10
P3O10
U
U4
4
21
3
1
5
2
2
55
1
4
3
3
Ca
Ca
U
Soil Matrix
Groundwater1. Adsorption of phosphate, polyphosphate, and uranium.
2. Hydrolysis of precipitated, adsorbed, and aqueous polyphosphate.
3. Precipitation of amorphous calcium-polyphosphate (may temporarily take up uranium).
4. Precipitation of calcium phosphate (e.g., apatite); uranium may adsorb or coprecipitate.
5. Precipitation of calcium-uranyl-phosphate (autunite); primary long-term uranium removal pathway.


Imagine the result
Homestake Mining Company of
California
Appendix A
Bench Testing Procedures and
Results
TPP Alluvial Pilot Test Work Plan
December 3, 2012
Appendix ABench Testing Procedures andResults
TPP Alluvial Pilot Test Work Plan
Mike Hay, PhDProject Scientist
Jeff Gillow, PhDTechnical Expert
Phil DeDyckerPrincipal in Charge / Project Manager
Prepared for:
Homestake Mining Company of California
Prepared by:
ARCADIS U.S., Inc.
630 Plaza Drive
Suite 100
Highlands Ranch
Colorado 80129
Tel 720 344 3500
Fax 720 344 3535
Our Ref.:
AO000120
Date:
December 3, 2012
This document is intended only for the use
of the individual or entity for which it was
prepared and may contain information that
is privileged, confidential and exempt from
disclosure under applicable law. Any
dissemination, distribution or copying of
this document is strictly prohibited.
i
Table of Contents
1. Introduction 1
1.1 Objectives 1
2. Bench Testing Methods and Materials 2
2.1 Test Media and Collection 2
2.2 Laboratory Procedures and Analyses 3
3. Preliminary Evaluation 3
4. Alluvial Bench Testing Program Design 5
5. Alluvial Bench Testing Results and Interpretation 7
5.1 Aqueous TPP Stability (Series 1) 7
5.2 TPP Behavior in Contact with Alluvial Solids (Series 2) 7
5.3 Uranium Fate and Behavior 9
5.3.1 Uranium Immobilization 9
5.3.2 Effect of Calcium 10
5.3.3 Precipitate Characterization 10
5.4 Secondary Effects 11
5.4.1 Treatment of Other COCs: Molybdenum and Selenium 11
5.4.2 Downgradient Effects: Orthophosphate and Arsenic 11
6. Summary and Recommendations for Alluvial Implementation 12
7. Tables 14
8. Figures 15
Tables
Table A-1 Batch Test 2 precipitate analysis 14
Table A-2 Alluvial bench testing program 14

ii
Table of Contents
Figures
Figure A-1 Uranium Immobilization in Preliminary Evaluation
Figure A-2 Calcium and Phosphorus Concentrations in TPP-AmendedGroundwater
Figure A-3 Calcium and Phosphorus Released from Precipitates, Normalized toOriginal Solution Volume
Figure A-4 Total Phosphorus and Orthophosphate after 2 Days of Reaction inAlluvial Groundwater with and without Alluvial Soil
Figure A-5 Total Phosphorus and Orthophosphate over Time in Series 2AExperiments
Figure A-6 Total Calcium over Time in Series 2A Experiments
Figure A-7 Calculated Saturation Indices in Series 2A Experiments
Figure A-8 Calcium and Phosphate Uptake in the Presence and Absence of aSeed Crystal
Figure A-9 Uranium Concentrations in Series 2A Experiments
Figure A-10 Uranium Concentrations in Series 2B and Series 3 Experiments
Figure A-11 Solution pH in Series 2B and Series 3 Experiments
Figure A-12 Aqueous Phosphorus Concentrations in Series 2B and Series 3Experiments
Figure A-13 Concentrations of Uranium in Solution and Entrapped in ExtractableSolid Phases in Series 2A, 1,000 mg/L TPP as PO4 Experiment
Figure A-14 Total Phosphorus and Orthophosphate Concentrations in Solutionand Extractable Solid Phases in Series 2A, 1,000 mg/L TPP as PO4
Experiment
Figure A-15 Arsenic Concentrations in Series 2B and Series 3 Experiments

1
Appendix A
Bench Testing Proceduresand Results
1. Introduction
The bench testing program is a collaborative effort of ARCADIS and Chemac
Environmental Services (Chemac), located in Centennial, Colorado. ARCADIS leads
the test design and result interpretation while Chemac performs the actual laboratory
testing under ARCADIS direction. Chemac relies on ACZ Laboratories Inc. (ACZ) in
Steamboat Springs, Colorado to perform the analytical testing.
The bench testing was conducted as an iterative process, with results from initial test
programs determining the experimental design parameters in subsequent tests.
Because the first pilot-scale test was conducted in the LTP, bench testing focused on
optimizing treatment for the LTP pore water before evaluating treatment in the alluvial
aquifer. A discussion of the LTP pilot test and associated laboratory testing is included
in Appendix B.
1.1 Objectives
Bench testing is currently ongoing, with a focus on optimizing treatment for alluvial
groundwater in the presence of alluvial soils. The primary objectives of the current
testing program are:
• To determine the optimal doses of calcium and tripolyphosphate (TPP) to achieve
uranium immobilization while minimizing residual phosphate concentrations in
groundwater.
• To determine potential secondary effects of TPP on alluvial groundwater and soils.
The current testing program was also designed to address specific objectives that have
been formulated based on previous bench testing programs and the results of the LTP
pilot test, as described in Section 3 below and Appendix B. These objectives include:
• Determine the uptake capacity of TPP of the alluvial soils (i.e., how much of the
injected soluble TPP sorbs onto alluvial soil) and estimate the uptake capacity to
predict TPP retardation (i.e., sorption/desorption of TPP to/from alluvial soil leading
to retarded movement of TPP in groundwater).
• Determine the role of the aquifer solids in catalyzing the hydrolysis of TPP and
precipitation as orthophosphate.

2
Appendix A
Bench Testing Proceduresand Results
• Determine specifically how the addition of calcium affects the uptake and fate
(hydrolysis and precipitation) of TPP, understand the types of calcium-phosphate
precipitates formed, and optimize calcium addition to yield maximal precipitation
within the aquifer while maintaining a stable injection solution.
• Understand the role of calcite and determine whether significant amounts of calcite
are forming when calcium is added to the amendment solution.
2. Bench Testing Methods and Materials
2.1 Test Media and Collection
Soil samples were collected via direct-push sampling from the saturated zone west of
the LTP in March 2012. Samples were collected in the vicinity of monitoring wells SUR,
SQ, S, SZ, and 3J from depths ranging from approximately 35 to 50 feet below ground
surface (ft bgs), below the local potentiometric surface. The sample from near SQ was
air-dried, homogenized, and sieved; the minus 10 mesh fraction was used as the
alluvial solids in the bench testing program.
Groundwater used in the bench tests was collected from wells SV, S4, and L10. Well
L10 water was used in the preliminary evaluation described in Section 3, while
groundwater from SV and S4 was used in all other tests. Groundwater was collected
from well SV in May 2012 and from well S4 in October 2012. The groundwater was
collected in Nalgene™ carboys with minimal headspace to minimize gas diffusion from
the groundwater. The field pH was measured throughout the purging process; the
ambient pH was 7.71. Groundwaters collected from wells SV and S4 had field pH
values of 7.71 and 7.09, respectively. Well SV groundwater had a dissolved uranium
concentration of 14.5 mg/L and was used directly in the bench test program. Well S4
groundwater had much less dissolved uranium (0.32 mg/L), and the sample was mixed
with a small quantity of well SV groundwater to achieve a uranium concentration of 2.0
mg/L before use in bench tests.
Reagent grade chemicals (calcium chloride, sodium TPP [STPP], sodium carbonate,
sodium bicarbonate, sodium acetate, and acetic acid) were purchased from Sigma-
Aldrich for use in experiments. High purity STPP (>99%) was used in laboratory tests,
although technical grade STPP (approximately 85% purity) was used in the field
implementation of the LTP pilot test. The higher purity reagent was used in laboratory
tests to better understand and quantify conversion of polyphosphate to
orthophosphate, but would be cost-prohibitive for pilot- and full-scale applications.

3
Appendix A
Bench Testing Proceduresand Results
2.2 Laboratory Procedures and Analyses
Bench tests described below were performed in 250-milliliter (mL) plastic bottles using
groundwater and alluvial soil, from the site and reagent stock solutions. After
preparation, each bottle was closed and agitated continuously for the duration of the
test to maximize mixing. Kinetic tests were run with a separate bottle for each sample
point, with test durations varying between 1 hour and 106 days, as described below.
The test environment was maintained near 25 degrees Celsius (°C) at all times.
Aqueous samples were analyzed for pH immediately after opening the bottles. Filtered
samples (through a 0.45 micron [m] filter) were analyzed for total alkalinity and sulfate
by Chemac according to standard published test methods, and filtered samples were
submitted to ACZ for analysis of dissolved metals (calcium, molybdenum, selenium,
uranium, vanadium, and arsenic), total phosphorus, and orthophosphate.
Testing was performed using written procedures and results recorded in laboratory
notebooks. Analyses performed by Chemac were done in accordance with published
test methods (APHA 1992). Analyses performed by ACZ Laboratories Inc. were done
in accordance with standard operating procedures, US EPA test methods, and a
laboratory quality assurance program. These controls on testing and analyses assure
that the data generated under this laboratory testing program are accurate,
reproducible, and able to withstand critical and peer review.
3. Preliminary Evaluation
Previous bench testing programs focused on uranium immobilization in the LTP to
prepare for the LTP pilot test (Appendix B). Because the pore water in the LTP differs
in chemical composition as compared to the alluvial aquifer, the test parameters that
resulted in successful uranium removal in LTP pore water cannot necessarily be
applied to groundwater. Therefore, a preliminary evaluation of uranium immobilization
in alluvial groundwater was performed as a proof-of-concept. These results are briefly
summarized below.
Two batch tests were prepared for the preliminary evaluation using alluvial
groundwater from well L10. Both tests were dosed with 100 mg/L as PO4 of TPP and
were left at ambient pH (approximately 8 at the beginning of the test program). Batch
test 1 did not have any additional calcium added (the ambient calcium concentration
was 91 mg/L), whereas calcium chloride was added to batch test 2 to achieve a target
added calcium to phosphorus (Ca:P) mass ratio of 2.4 (the combined ambient and
added calcium concentration was 170 mg/L).

4
Appendix A
Bench Testing Proceduresand Results
Dissolved uranium and calcium concentrations through time in the two tests are shown
in Figure A-1. A precipitate formed in Test 2, which was submitted for total digestion
and analysis. The results of the digestion analysis are shown in Table A-1. Results of
the preliminary analysis are summarized as follows:
Uranium immobilization in batch test 2 was 97.4% after 81 days post-treatment,
whereas no uranium immobilization was observed in batch test 1 (Figure A-1),
demonstrating that TPP can, in principle, successfully immobilize uranium from
alluvial groundwater with added calcium.
Addition of calcium in Test 2 quickly resulted in the formation of a precipitate with
an approximately 1:1 molar ratio of calcium to phosphorus and a 7,500:1 molar
ratio of calcium to uranium. However, it is unclear whether the precipitate contains
phosphorus as orthophosphate or as TPP (i.e., whether complete hydrolysis of
TPP has occurred). It is also unclear whether calcium carbonate (calcite)
constitutes a significant fraction of the precipitate formed.
Tests 1 and 2 differed markedly with regard to uranium removal and precipitate
formation, although initial calcium content was only increased by approximately
85%. This result suggests that precipitate formation and uranium uptake was
controlled by solubility rather than calcium-catalyzed TPP hydrolysis. Accordingly,
the precipitate may contain un-hydrolyzed TPP, rather than orthophosphate.
Based on these preliminary alluvial test results, in combination with the LTP pilot test
results (Appendix B), the following observations guided the direction of the current
alluvial bench testing:
Addition of calcium and TPP must be balanced against rapid precipitate formation
in the injection solution. Specifically, the injection solution must be sufficiently
stable so that calcium phosphate precipitates do not form before the solution is
injected into the aquifer.
Uranium is immobilized quickly by calcium and TPP, although it is not clear
whether the precipitate formed is a uranium-containing calcium-orthophosphate
phase (highly stable relative to redissolution) or a calcium-polyphosphate (less
resistant to redissolution).

5
Appendix A
Bench Testing Proceduresand Results
TPP is significantly retarded after injection into the aquifer, likely due to adsorption
to mineral surfaces. In contrast, calcium is highly mobile and migrates out of the
radius of influence at the same rate as a conservative tracer.
4. Alluvial Bench Testing Program Design
The alluvial bench testing program was designed to address the objectives described
in Section 1.1. The bench tests included three series of experiments, as outlined in
Table A-2.
Series 1 involved site groundwater from well SV with varying concentrations of TPP
(100 to 2,000 milligrams per liter as phosphate [mg/L as PO4]). This experiment was
intended to expand on previous results (described in Section 3) indicating that TPP
stability in solution is controlled by the solubility of a calcium phosphate phase.
Experiments were run for 2 days, since this is a reasonable timeframe over which
stability of an injection solution would be required in the field. The objective in the new
Series 1 experiments was to determine the solubility of the calcium phosphate phase
formed, such that undersaturation could be maintained in an injection solution, as well
as the nature of the precipitate, particularly the content of orthophosphate versus
polyphosphate. To assess the composition of the precipitate, the precipitate formed
after 2 days was collected, redissolved in deionized water, and analyzed for calcium,
orthophosphate, and polyphosphate. This procedure is less destructive than an acid
digestion, which would be expected to hydrolyze TPP. This series of experiments did
not include added calcium, instead relying on the calcium already present in the
groundwater at a concentration of 258 mg/L.
Series 2 included a similar range of TPP concentrations as Series 1 (100 to 2,000
mg/L as PO4), but with alluvial soils added. As in Series 1, no calcium was added, but
the groundwater itself contained 258 mg/L of calcium. The objectives of Series 2 were:
Assess the uptake of TPP by the solids, where the amount of TPP removed from
solution over the amount removed in Series 1 is attributable to TPP sorption onto
soil surfaces.
Determine the degree of TPP hydrolysis in the presence of solids and determine
whether TPP sorption to surfaces further catalyzes hydrolysis.
Determine the uptake of uranium over time in a system representative of alluvial
aquifer conditions, including alluvial soil, alluvial groundwater, and added TPP.

6
Appendix A
Bench Testing Proceduresand Results
Determine the chemical association of the immobilized uranium (i.e., the form,
content, and lability of the calcium phosphate coprecipitate).
Three sets of experiments were run as part of Series 2. The first set (2A) used a solid
to solution ratio of 0.2 kilograms per liter (kg/L), with groundwater from well SV,
containing 14.5 mg/L uranium. After reviewing the results, a second set of experiments
(2B) was planned that more closely represents in situ conditions in an area where the
treatment would be implemented. The solid-solution ratio of the batch test was
doubled to 0.44 kg/L, and the uranium concentration in solution was decreased to 2
mg/L. The 2 mg/L uranium concentration, achieved via mixing of groundwaters from
well SV and S4, was targeted as a representative average in areas where alluvial pilot
testing would be implemented. A third set of experiments (2C) was run under similar
concentrations to 2B, but with a small quantity of fish bone apatite added. These
experiments were performed to test the effect of an apatite seed crystal on the stability
of aqueous orthophosphate generated by TPP hydrolysis.
To determine the chemical associations of the immobilized uranium in the alluvial soil,
the precipitates collected after reaction were extracted using bicarbonate and acetate
solutions (redissolution extraction tests). The extractants were then analyzed for
metals, total phosphorus, and orthophosphate. The bicarbonate solution consisted of
sodium carbonate and sodium bicarbonate, its total alkalinity was 20 millimolar (mM),
and its pH was 9.5. The bicarbonate solution was used to solubilize easily-extractable
calcium phosphate phases while limiting the dissolution of calcium carbonate. The
acetate solution consisted of 1 molar (M) sodium acetate acidified to pH 5 with acetic
acid. The acetate solution was used to solubilize calcium phosphate and calcium
carbonate phases. The difference in the amount of solubilized phosphate between the
two extractions was attributable to carbonate dissolution, thereby yielding an estimate
of the quantity of uranium immobilized in carbonate minerals.
Series 3 included a program similar to 2B, but with added calcium. In particular, the
experiments were designed to mimic a phased injection approach that could be used
during field implementation to avoid calcium phosphate precipitation in the injection
solution. Alluvial soil and groundwater suspensions were established at a lower initial
groundwater content (i.e., a higher solids to solution ratio) and were allowed to react for
24 hours. The following day, the bottles were topped off with calcium chloride
dissolved in deionized water at a concentration of 2,000 to 5,000 mg/L as calcium, thus
diluting the TPP added the previous day. This sequential addition allows time for the
TPP to adsorb to solid surfaces before reaction with added calcium, simulating field

7
Appendix A
Bench Testing Proceduresand Results
injections of TPP and calcium separated by one day. At the end of the reaction period,
the solids were collected for acetate extraction and analysis.
5. Alluvial Bench Testing Results and Interpretation
5.1 Aqueous TPP Stability (Series 1)
Site groundwater containing 258 mg/L calcium was mixed with varying concentrations
of TPP between 100 and 2,000 mg/L as PO4 to assess the short-term stability and
solubility of TPP. Observations from this series of experiments are summarized as
follows:
TPP exhibits limited solubility in the presence of ambient concentrations of calcium
in alluvial groundwater. Precipitation is evident for concentrations of TPP at and
above 500 mg/L as PO4, based on aqueous calcium and total phosphorus content
(Figure A-2) and the presence of a visible white precipitate in solution.
Redissolution of the solid retained on the filter demonstrate that the solid primarily
contains phosphorus as un-hydrolyzed TPP, with smaller quantities of
orthophosphate (Figure A-3). The precipitate consists of a calcium-TPP gel with
Ca:P ratio varying between 2 and 3 in proportion to the aqueous calcium to
phosphorus ratio. This varying Ca:P ratio in the solids makes it difficult to calculate
a solubility directly from the experimental results.
Diluting the groundwater with deionized water to reduce the calcium content
enables more TPP to remain in solution, suggesting a potential strategy for
stabilization of an injection solution with high TPP.
5.2 TPP Behavior in Contact with Alluvial Solids (Series 2)
Series 2 experiments contained alluvial soil and groundwater with added TPP, as
summarized in Table A-2, to assess the uptake and hydrolysis behavior of TPP in
contact with soil, as well as the uptake of uranium exposed to added TPP, alluvial soil,
and ambient levels of dissolved calcium. Results of the uranium analyses are
described further in Section 4.4.
The levels of phosphorus in solution in the presence and absence of alluvial soil
(Series 2A and 1A, respectively) are shown in Figure A-4, expressed as a fraction of
the total initial phosphorus after two days of reaction. The presence of alluvial solids

8
Appendix A
Bench Testing Proceduresand Results
clearly results in less TPP in solution after 2 days, likely due to adsorption of TPP to
solid surfaces. The fraction of TPP remaining in solution (between 52 and 61%) is
strikingly uniform across a range of TPP concentrations, suggestive of a uniform
partitioning behavior. This information can be used to calculate a distribution
coefficient for TPP according to the equation:
Cs = KD Caq,
where Cs is the sorbed concentration (mg/kg), Caq is the aqueous concentration (mg/L),
and KD is the distribution coefficient (L/kg). The results of Series 2A were used to
calculate an average KD value of 3.8 L/kg.
Concentrations of orthophosphate in solution resulting from the hydrolysis of TPP are
higher in the presence of solids (Figure A-4). This result suggests that TPP hydrolysis
may be enhanced or catalyzed by mineral surfaces; this result is favorable for the
immobilization of uranium as stable uranium phosphate mineral phases. It is also
possible that solution pH played a role in the enhanced hydrolysis rate, although the
pH difference is small. Solution pH in the Series 2A experiments was approximately
7.4 and was slightly lower than in the absence of solids (approximately 7.7), likely due
to pH buffering by the solids.
Over time, as observed in the LTP pilot test (Appendix B), phosphorus in solution
decreases, while the fraction of orthophosphate increases until it is the primary
phosphate species in solution (Figure A-5). Decreases in aqueous phosphorus are
associated with a corresponding decrease in dissolved calcium over time (Figure A-6),
suggesting the formation of a calcium phosphate precipitate, as previously observed in
the absence of solids (Figure A-1).
Orthophosphate concentrations in solution remain high for extended periods, even
though calcium and orthophosphate is expected to precipitate. To evaluate which
calcium orthophosphate minerals are expected to precipitate under the geochemical
conditions of the experiment, saturation indices were calculated for various calcium
phosphate phases using the geochemical modeling software PHREEQC. The
saturation index is a measure of the degree of saturation of a particular mineral phase
with respect to dissolved constituents; a positive saturation index indicates a mineral
that is expected to precipitate (the higher the number, the higher the degree of
oversaturation), while a negative saturation indicates that the mineral would dissolve if
present in the solid phase. Saturation indices for hydroxyapatite, CaHPO4:2H2O, -
Ca3(PO4)2, and Ca4H(PO4)3:3H2O (calcium phosphate phases listed in the MINTEQ

9
Appendix A
Bench Testing Proceduresand Results
thermodynamic database) were calculated for Series 2A experiment results (Figure A-
7). These results indicate that all experiments with added TPP are supersaturated with
respect to hydroxyapatite and -Ca3(PO4)2 after 7 days. After approximately 40 days,
the 1,000 mg/L TPP as PO4 experiment also becomes supersaturated with respect to
Ca4H(PO4)3:3H2O. These results demonstrate that higher-than-expected
concentrations of calcium and orthophosphate may be necessary to generate calcium
orthophosphate precipitates.
A test was run to determine whether the apparent supersaturation of calcium
orthophosphate phases in the experiment was due to a nucleation limitation, i.e.,
whether the presence of a pre-existing calcium phosphate phase would decrease
aqueous calcium and orthophosphate concentrations (Series 2B compared to 2C).
These experiments were run by performing tests in the presence and absence of a
small quantity of fish bone apatite, used as a seed crystal. No strong difference was
apparent in the presence and absence of the seed crystal (Figure A-8). This suggests
that even though calcium orthophosphate phases are supersaturated, precipitation is
apparently not limited by nucleation.
5.3 Uranium Fate and Behavior
5.3.1 Uranium Immobilization
The uptake of uranium by addition of TPP to sediment suspensions without additional
calcium was tested in Series 2 experiments. In Series 2A (50 grams [g] soil to 250 mL
of groundwater with 15 mg/L uranium), aqueous concentrations of uranium were
reduced from approximately 15 mg/L down to just below 12 mg/L over the timeframe of
the experiments with TPP doses of 1,000 and 2,000 mg/L as PO4 (Figure A-9). The
treatment was capable of removing nearly 3 mg/L of uranium from solution,
approximately 20% of the initial dissolved uranium.
The experiments were repeated with a uranium aqueous concentration of 2 mg/L to
test the treatment under uranium loadings more applicable to the pilot test areas. The
experiment also utilized a higher solid to solution ratio of 100 g to 225 mL. The results
without added calcium indicate no treatment of uranium (Figure A-10). These tests
were complicated by uranium desorption from the solids over time, as aqueous
uranium concentrations were higher after suspension in soil than the initial value of 2.0
mg/L measured in the groundwater. The tests also had higher pH values than in the
previous tests (Figure A-11), possibly resulting from pH buffering by the soil and/or

10
Appendix A
Bench Testing Proceduresand Results
CO2 degassing from the bottles during experiment preparation. The increased pH may
have resulted in decreased TPP effectiveness and/or enhanced desorption of uranium.
5.3.2 Effect of Calcium
Similar experiments were run with a fixed TPP concentration of 2,000 mg/L as PO4 and
varying calcium. These results demonstrate that calcium addition substantially
enhanced remedy treatment, with uranium removal of 60 to 70% in the calcium-added
samples after 10 days (Figure A-10). The downward trend suggests that further
removal may be possible on longer timescales.
Solution pH may have been playing a role in these experiments as well, as the pH
decreased with increasing calcium content from above 8 to below 7 (Figure A-11).
The pH decrease may have been caused by numerous factors, including ion exchange
of Ca2+
for H+
(releasing protons into solution), precipitation of calcium carbonate
(calcite), or precipitation of a calcium orthophosphate phase. Although it is possible
that calcite precipitation may have accounted for some of the decrease in uranium
content, calcium phosphate precipitation (as orthophosphate and/or TPP) is clearly
evident based on the reduction in aqueous phosphorus content (Figure A-12).
5.3.3 Precipitate Characterization
The uranium-containing precipitates formed in the Series 2 and 3 experiments were
characterized based on post-reaction solid phase extractions by bicarbonate at pH 9.5
and by acetate at pH 5, as described in Section 4. The uranium and phosphate
results of these extractions for Series 2A, 1,000 mg/L TPP experiments are
summarized in Figure A-13 and Figure A-14, respectively, with concentrations plotted
on an original reaction solution volume basis. In this way, the extractable
concentration is equivalent to the original solution concentration of the analyte before it
was removed from solution. The green bars in Figure A-13 represent the acetate-
extractable content minus the bicarbonate-extractable content, since the acetate
solution always extracted more than the bicarbonate solution. Note that the
bicarbonate extraction (blue bars) was not performed at every time point; in those
cases, the green bars represent the full acetate extractable concentration.
The results of these analyses can be summarized as follows:
The majority of the uranium sequestered is extractable by acetate, and nearly all of
the uranium extractable by acetate is also extractable by bicarbonate. The fact

11
Appendix A
Bench Testing Proceduresand Results
that the uranium is extractable by bicarbonate suggests that calcium carbonate
(calcite) is not playing a substantial role in uranium removal, since calcite would
not redissolve in a carbonate solution.
Uranium is initially sequestered within calcium polyphosphate precipitates, but over
time, calcium orthophosphate precipitates form. The phosphate extracted from the
solids is primarily polyphosphate at Day 15, but the fraction of phosphorus as
orthophosphate in the extraction solution increases with increasing time.
The extractable concentrations of uranium and phosphate decrease over time,
indicating greater stabilization over time of the uranium-containing phosphate
precipitates formed. This stabilization is likely related to the increase in
orthophosphate content of the precipitates, noted above. This observation is
consistent with the hypothesis that polyphosphate in solution and in solid-bound
phases hydrolyzes over time to orthophosphate.
5.4 Secondary Effects
5.4.1 Treatment of Other COCs: Molybdenum and Selenium
Molybdenum and selenium concentrations were also monitored along with uranium in
Series 2 and 3 experiments. No significant treatment of molybdenum or selenium was
observed in any of the experiments.
5.4.2 Downgradient Effects: Orthophosphate and Arsenic
As TPP is hydrolyzed, orthophosphate is generated and is present in solution. The
results in Figure A-12 suggest that the residual orthophosphate concentrations can be
controlled with calcium, as increased calcium results in enhanced phosphate
precipitation. In addition, the pilot test results indicate that the transport of aqueous
orthophosphate generated in the aquifer is substantially retarded (Appendix B), likely
due to sorption and precipitation reactions. For these reasons, excessive
orthophosphate concentrations are not expected downgradient of the treatment zone in
field implementations.
Arsenic concentrations in the alluvial groundwater used in bench testing varied from
less than 1 micrograms per liter (g/L) at well S4 to 20 g/L at well SV. On addition of
TPP in the bench tests, aqueous arsenic concentrations increased to between 30 and
75 g/L. This increase in arsenic concentrations may be due to a combination of

12
Appendix A
Bench Testing Proceduresand Results
arsenic contained in the TPP stock (i.e., originating from the injection reagent), as well
as arsenic sorbed to soil surfaces that is displaced by adsorbing phosphate (i.e.,
originating from the aquifer soil). Based on previous bench tests performed on behalf
of ARCADIS, reagent grade STPP can contain arsenic as high as 40 mg arsenic per
kg STPP. Bulk STPP used in pilot testing will need to be analyzed for arsenic content,
and the implications of added arsenic will need to be assessed. Ultimately, trace
arsenic added along with reagents and arsenic desorbed within the treatment zone is
expected to have a minimal impact on groundwater downgradient of the treatment
zone, since arsenic that desorbs from aquifer solids within the treatment zone is
expected to readsorb immediately downgradient.
6. Summary and Recommendations for Alluvial Implementation
The bench testing results described above, in combination with the results of previous
pilot testing (Appendix B), demonstrate that treatment of uranium using TPP and
calcium is highly effective. The method is particularly effective when additions of TPP
are followed by additions of calcium. Extraction results indicate that the initial calcium-
TPP phase that precipitates on injection gradually transforms to a calcium
orthophosphate phase. Results of tests investigating the aqueous solubility of TPP in
the presence of calcium will be useful in designing injection solutions that are stable
against precipitation before injection, yet result in immobilization of phosphate and
uranium when injected into the aquifer. Based on these results, the strategy is
expected to substantially decrease aqueous uranium concentrations in field
implementations.
Based on the results of these bench tests, the following recommendations for the
alluvial pilot test are proposed (these recommendations are focused on enhancing
overall effectiveness of the treatment approach):
Pilot test injections should include both TPP and calcium to optimize effectiveness.
A phased injection approach should be employed, in which TPP is injected first,
followed by the injection of calcium (e.g., as calcium chloride) into the same
injection wells. Since TPP is highly retarded due to sorption to the aquifer matrix
while calcium is not, a high degree of contact between the added TPP and calcium
is anticipated (i.e., calcium will pass over sorbed TPP during the calcium injection).

13
Appendix A
Bench Testing Proceduresand Results
TPP may be dissolved in groundwater for injection. Concentrations of TPP
between 1,000 and 2,000 mg/L as PO4 are expected to be stable, as long as the
ambient calcium concentration of the groundwater is sufficiently low.
The calcium reagent should be dissolved in water with very low alkalinity for
injection (e.g., RO product water), rather than groundwater. This will ensure that
dissolved calcium will not precipitate as calcite in the injection solution, and will
also increase the fraction of “free” calcium for reaction with phosphate (i.e., less
calcium will be in the form of carbonate complexes in solution).
Since clean water will be used for the injection of calcium, acidification of the
calcium injection solution can also be considered. This acidification would result in
a temporary decrease in the pH of the aquifer, expected to enhance the hydrolysis
of TPP and prevent the formation of calcite. Acidifying the clean water would not
result in the same complicating effects of CO2 off-gassing observed in the LTP pilot
test (Appendix B), since the total inorganic carbon content (i.e., alkalinity) of the
clean water is substantially less than in the groundwater. Further, the pH of the
injection solution will be buffered by the aquifer solids before migrating out of the
treatment radius.
Injection of a mixture of orthophosphate and TPP rather than just TPP may be
considered. Although orthophosphate poses a greater risk of precipitation in the
immediate vicinity of the injection wells, the bench test results demonstrate that low
concentrations of orthophosphate are stable against precipitation when calcium
concentrations are also sufficiently low. This result may be used advantageously
to distribute additional orthophosphate into the treatment zone for enhanced short-
term effectiveness in immobilizing uranium. Care would need to be taken to use
an injection solution with very low calcium to ensure stability.
Groundwater chemical parameters will need to be monitored within and
downgradient of the treatment zone. The results of this monitoring will be used to
evaluate the effects on water chemistry as a result of the interaction of phosphate
with soil and to assure that any localized changes in water chemistry are
moderated as water moves downgradient.

14
Appendix A
Bench Testing Proceduresand Results
7. Tables
Table A-1 Batch Test 2 precipitate analysis
ParameterMass Concentration
(mg/kg)Molar
ConcentrationCalcium 193,000 4.82
Phosphorus 148,000 4.79Uranium 153 0.000643
Molybdenum 1.4 0.0000146Selenium 0.3 0.0000038
Table A-2 Alluvial bench testing program
SeriesSoil(SQ)
GroundwaterTPP
(concentrationas PO4)
Added CaCl2(concentration as
Ca)
Fish-BoneApatite
Time Points(Days)
1 --- 250-300 mL (SV)
0 g/L
--- ---
2
100 mg/L 2
500 mg/L 2
1000 mg/L 2
2000 mg/L 2
2A 50 g 250 mL (SV)
0 mg/L
--- ---
2, 7
100 mg/L 2,7,15,30,106
500 mg/L 2, 7, 15
1000 mg/L 2,7,15,30,106
2000 mg/L 2, 7, 15
2B 100 g 225 mL (S4+SV)
0 mg/L
--- ---
2, 10
1000 mg/L 2, 10, 30
2000 mg/L 2, 10, 30
2C 100 g 225 mL (S4+SV)0 mg/L
---100 mg 2, 10, 30
1000 mg/L 100 mg 2, 10, 30
3 100 g 125 mL (S4+SV)
2000 mg/L ---
---
2
2000 mg/L 0 g/L (100 mL) 2, 10, 30
2000 mg/L 2000 mg/L (100 mL) 2, 10, 30
2000 mg/L 5000 mg/L (100 mL) 2, 10, 30

15
Appendix A
Bench Testing Proceduresand Results
8. Figures

GRANTS RECLAMATION PROJECT TTP Alluvial Pilot Test Work Plan
FIGURE A-1URANIUM IMMOBILIZATION IN PRELIMINARY EVALUATION
K:\A
O00
0120
-Gra
nts\
Illus
trato
rs\2
012
TTP
\Fig
ure
A-1
Ura
nium
imm
obili
zatio
n in
pre
limin
ary
eval
uatio
n.ai
@ 1
2/03
/201
2
P
RE
PAR
ED
BY:
JC
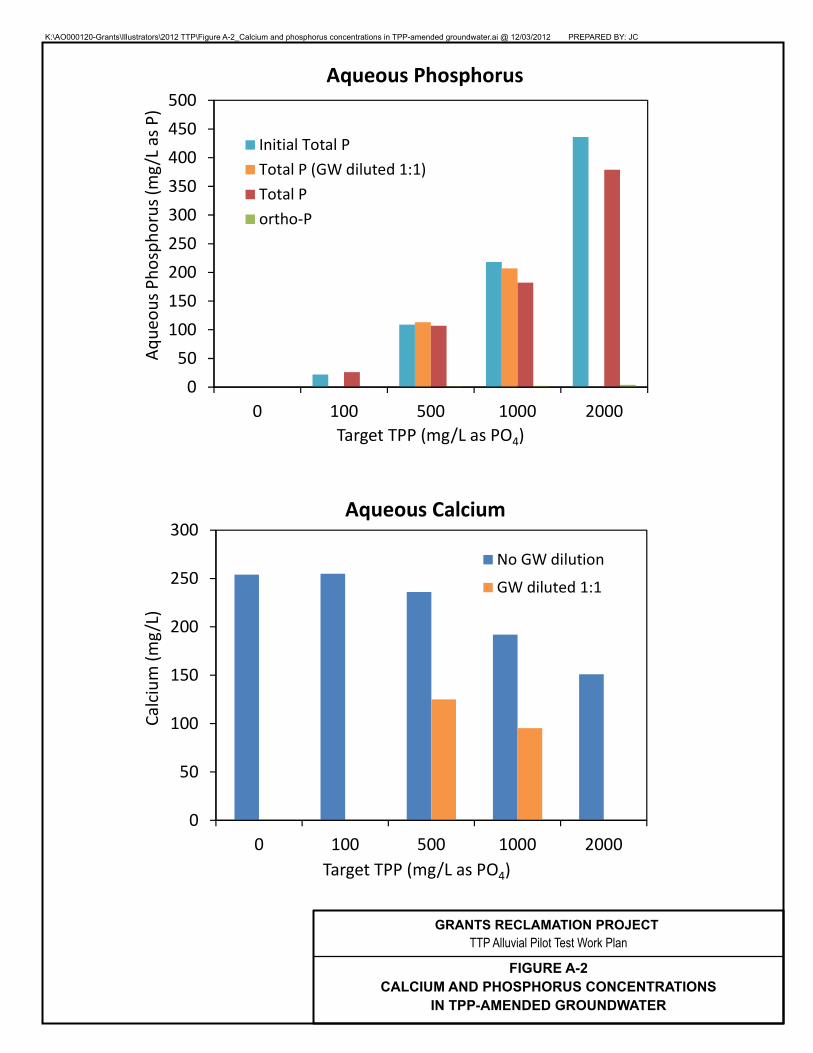
K:\AO000120-Grants\Illustrators\2012 TTP\Figure A-2_Calcium and phosphorus concentrations in TPP-amended groundwater.ai @ 12/03/2012 PREPARED BY: JC
GRANTS RECLAMATION PROJECT TTP Alluvial Pilot Test Work Plan
FIGURE A-2CALCIUM AND PHOSPHORUS CONCENTRATIONS
IN TPP-AMENDED GROUNDWATER
050100150200250300350400450500
0 100 500 1000 2000
Aque
ousP
hospho
rus(mg/Las
P)
Target TPP (mg/L as PO4)
Aqueous Phosphorus
Initial Total PTotal P (GW diluted 1:1)Total Portho P
0
50
100
150
200
250
300
0 100 500 1000 2000
Calcium
(mg/L)
Target TPP (mg/L as PO4)
Aqueous Calcium
No GW dilution
GW diluted 1:1

K:\AO000120-Grants\Illustrators\2012 TTP\Figure A-3 Calcium and phosphorus released from precipitates, normalized to original solution volume.ai @ 12/03/2012 PREPARED BY: JC
0
5
10
15
20
25
30
35
40
0 100 500 1000 2000
Phosph
orus
(mg/Las
P)
Target TPP (mg/L as PO4)
Phosphorus from Redissolution
Total P
ortho P
0
5
10
15
20
25
0 100 500 1000 2000
Calcium
(mg/L)
Target TPP (mg/L as PO4)
Calcium from Redissolution
GRANTS RECLAMATION PROJECT TTP Alluvial Pilot Test Work Plan
FIGURE A-3CALCIUM AND PHOSPHORUS RELEASED FROM
PRECIPITATES, NORMALIZED TO ORIGINAL SOLUTION VOLUME

GRANTS RECLAMATION PROJECT TTP Alluvial Pilot Test Work Plan
FIGURE A-4TOTAL PHOSPHORUS AND ORTHOPHOSPHATE
AFTER 2 DAYS OF REACTION IN ALLUVIAL GROUNDWATERWITH AND WITHOUT ALLUVIAL SOIL
K:\AO000120-Grants\Illustrators\2012 TTP\Figure A-4 Total phosphorus and orthophosphate after 2 days of reaction in alluvial groundwater with and without alluvial soil .ai @ 12/03/2012 PREPARED BY: JC
00.10.20.30.40.50.60.70.80.91
0 100 500 1000 2000Target TPP (mg/L as PO4)
Day 2: Fraction Total P Remaining in Solution
Series 1A (No Soil)
Series 2A (With Soil)
0
2
4
6
8
10
12
14
0 100 500 1000 2000
Ortho
phosph
ateP(m
g/L)
Target TPP (mg/L as PO4)
Day 2: Orthophosphate
Series 1A (No Soil)
Series 2A (With Soil)

GRANTS RECLAMATION PROJECT TTP Alluvial Pilot Test Work Plan
FIGURE A-5TOTAL PHOSPHORUS AND ORTHOPHOSPHATE
OVER TIME IN SERIES 2A EXPERIMENTS
K:\A
O00
0120
-Gra
nts\
Illus
trato
rs\2
012
TTP
\Fig
ure
A-5
Tot
al p
hosp
horu
s an
d or
thop
hosp
hate
ove
r tim
e in
Ser
ies
2A e
xper
imen
ts.a
i @ 1
2/03
/201
2
P
RE
PAR
ED
BY:
JC
0
20
40
60
80
100
120
140
160
180
0 20 40 60 80 100
Concen
tration(m
g/Las
P)
Time (Days)
Total vs. Orthophosphate PTarget TPP = 1000 mg/L as PO4
Total P
Orthophosphate P
02468
101214161820
0 20 40 60 80 100
Concen
tration(m
g/Las
P)
Time (Days)
Total vs. Orthophosphate PTarget TPP = 100 mg/L as PO4
Total P
Orthophosphate P
0
50
100
150
200
250
300
350
400
450
0 20 40 60 80 100
Concen
tration(m
g/Las
P)
Time (Days)
Total Phosphorus
0 mg/L as PO4
100 mg/L
500 mg/L
1000 mg/L
2000 mg/L
0
10
20
30
40
50
60
70
0 20 40 60 80 100
Concen
tration(m
g/Las
P)
Time (Days)
Orthophosphate
0 mg/L as PO4
100 mg/L
500 mg/L
1000 mg/L
2000 mg/L

GRANTS RECLAMATION PROJECT TTP Alluvial Pilot Test Work Plan
FIGURE A-6TOTAL CALCIUM OVER TIME IN SERIES 2A EXPERIMENTS
K:\A
O00
0120
-Gra
nts\
Illus
trato
rs\2
012
TTP
\Fig
ure
A-6
Tot
al c
alci
um o
ver t
ime
in S
erie
s 2A
exp
erim
ents
.ai @
12/
03/2
012
PR
EPA
RE
D B
Y: J
C
0
50
100
150
200
250
0 20 40 60 80 100
Conc
entr
ation
(mg/
L)
Time (Days)
Calcium
0 mg/L as PO4
100 mg/L
500 mg/L
1000 mg/L
2000 mg/L

K:\AO000120-Grants\Illustrators\2012 TTP\Figure A-7_Calculated saturation indices in Series 2A experiments.ai @ 12/03/2012 PREPARED BY: JC
GRANTS RECLAMATION PROJECT TTP Alluvial Pilot Test Work Plan
FIGURE A-7CALCULATED SATURATION INDICES IN SERIES 2A EXPERIMENTS
6
4
2
0
2
4
6
0 100 500 1000 2000
Saturatio
nInde
x
Target TPP (mg/L as PO4)
Series 2A Saturation Indices, 2 days
HydroxyapatiteCaHPO4:2H2OBeta Ca3(PO4)2Ca4H(PO4)3:3H2O
21012345678
0 20 40 60 80 100 120
Saturatio
nInde
x
Time (Days)
Series 2A Saturation IndicesTarget TPP = 1000 mg/L as PO4
HydroxyapatiteCaHPO4:2H2OBeta Ca3(PO4)2Ca4H(PO4)3:3H2O
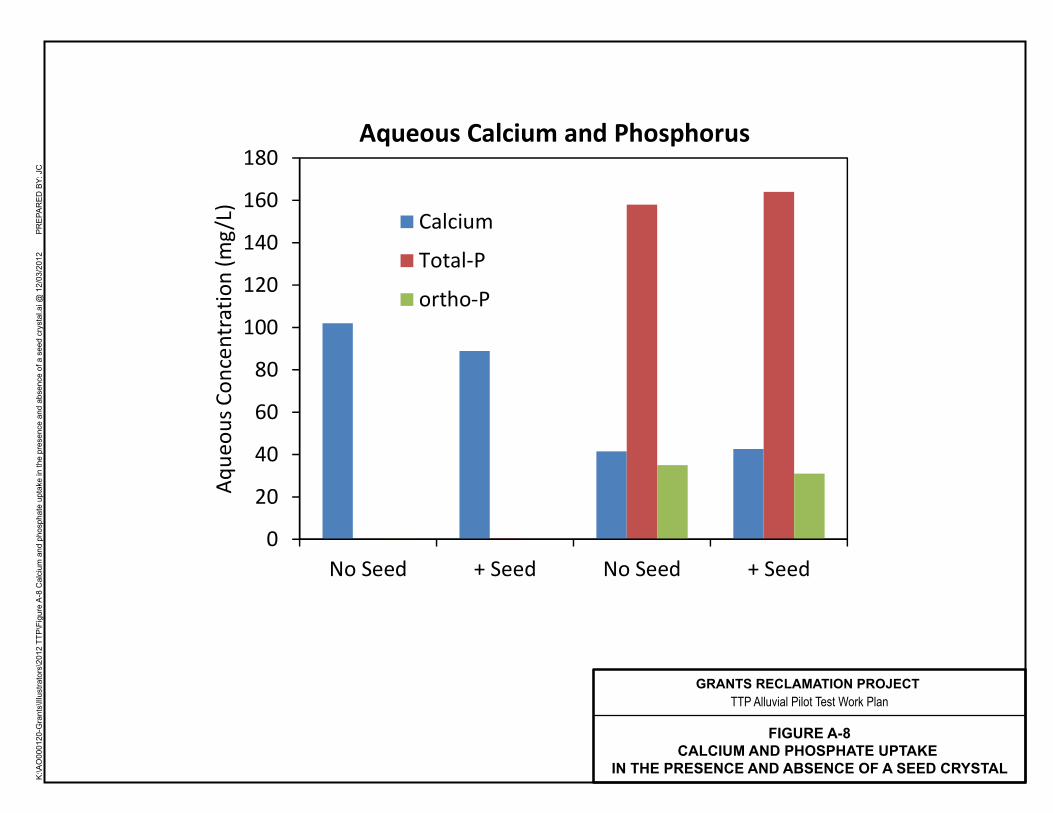
GRANTS RECLAMATION PROJECT TTP Alluvial Pilot Test Work Plan
FIGURE A-8CALCIUM AND PHOSPHATE UPTAKE
IN THE PRESENCE AND ABSENCE OF A SEED CRYSTAL
K:\A
O00
0120
-Gra
nts\
Illus
trato
rs\2
012
TTP
\Fig
ure
A-8
Cal
cium
and
pho
spha
te u
ptak
e in
the
pres
ence
and
abs
ence
of a
see
d cr
ysta
l.ai @
12/
03/2
012
PR
EPA
RE
D B
Y: J
C
0
20
40
60
80
100
120
140
160
180
No Seed + Seed No Seed + Seed
Aque
ousC
oncentratio
n(m
g/L)
Aqueous Calcium and Phosphorus
Calcium
Total P
ortho P

K:\AO000120-Grants\Illustrators\2012 TTP\Figure A-9_Uranium concentrations in Series 2A experiments.ai @ 12/03/2012 PREPARED BY: JC
GRANTS RECLAMATION PROJECT TTP Alluvial Pilot Test Work Plan
FIGURE A-9URANIUM CONCENTRATIONS IN SERIES 2A EXPERIMENTS
0
2
4
6
8
10
12
14
16
0 20 40 60 80 100
Conc
entr
ation
(mg/
L)
days
Uranium
0 mg/L as PO4100 mg/L500 mg/L1000 mg/L2000 mg/L
10
11
12
13
14
15
16
0 20 40 60 80 100
Conc
entr
ation
(mg/
L)
days
Uranium (finer concentration scale)

K:\AO000120-Grants\Illustrators\2012 TTP\Figure A-10_Uranium concentrations in Series 2B and Series 3 experiments.ai @ 12/03/2012 PREPARED BY: JC
GRANTS RECLAMATION PROJECT TTP Alluvial Pilot Test Work Plan
FIGURE A-10URANIUM CONCENTRATIONS
IN SERIES 2B AND SERIES 3 EXPERIMENTS
0
0.5
1
1.5
2
2.5
3
3.5
4
0 2 4 6 8 10 12 14 16
Uranium
(mg/L)
days
Varying TPP, No added Ca
0 mg/L as PO4
1000 mg/L
2000 mg/L
0
0.5
1
1.5
2
2.5
3
3.5
4
0 2 4 6 8 10 12 14 16
Uranium
(mg/L)
days
TPP = 2000 mg/L as PO4, Varying Ca
0 mg/L Ca
890 mg/L

K:\AO000120-Grants\Illustrators\2012 TTP\Figure A-11_Solution pH in Series 2B and Series 3 experiments.ai @ 12/03/2012 PREPARED BY: JC
GRANTS RECLAMATION PROJECT TTP Alluvial Pilot Test Work Plan
FIGURE A-11SOLUTION pH IN SERIES 2B AND SERIES 3 EXPERIMENTS
6
6.5
7
7.5
8
8.5
9
0 2 4 6 8 10 12 14 16
pH
days
Varying TPP, No added Ca
0 mg/L as PO4
1000 mg/L
2000 mg/L
6
6.5
7
7.5
8
8.5
9
0 2 4 6 8 10 12 14 16
pH
days
TPP = 2000 mg/L as PO4, Varying Ca
0 mg/L Ca
890 mg/L

K:\AO000120-Grants\Illustrators\2012 TTP\Figure A-12_Aqueous phosphorus concentrations in Series 2B and Series 3 experiments.ai @ 12/03/2012 PREPARED BY: JC
GRANTS RECLAMATION PROJECT TTP Alluvial Pilot Test Work Plan
FIGURE A-12AQUEOUS PHOSPHORUS CONCENTRATIONSIN SERIES 2B AND SERIES 3 EXPERIMENTS
0
50
100
150
200
250
300
350
0 2 4 6 8 10 12 14 16
Concen
tration(m
g/Las
P)
days
Total Phosphorus
0 mg/L Ca
890 mg/L
0
5
10
15
20
25
30
35
40
0 2 4 6 8 10 12 14 16
Concen
tration(m
g/Las
P)
days
Orthophosphate P
0 mg/L Ca
890 mg/L

K:\AO000120-Grants\Illustrators\2012 TTP\Figure A-13_Concentrations of uranium in solution and entrapped in extractable solid phases in Series 2A.ai @ 12/03/2012 PREPARED BY: JC
GRANTS RECLAMATION PROJECT TTP Alluvial Pilot Test Work Plan
FIGURE A-13CONCENTRATIONS OF URANIUM IN SOLUTION
AND ENTRAPPED IN EXTRACTABLE SOLID PHASES IN SERIES 2A,1,000 MG/L TPP AS PO4 EXPERIMENT
0
2
4
6
8
10
12
14
16
18
20
0 days 15 days 30 days 106 days
Effectiv
e Aq
ueou
s Ura
nium
(mg/
L)
Reaction Time
Uranium accounting, 1000 mg/L TPP test
Ac - HCO3
HCO3
Aqueous
11
12
13
14
15
16
17
0 days 15 days 30 days 106 days
Effectiv
e Aq
ueou
s Ura
nium
(mg/
L)
Reaction Time
Uranium accounting (finer concentration scale)

K:\AO000120-Grants\Illustrators\2012 TTP\Figure A-14_Total P and orthophosphate concentrations in solution and extractable solid phases in Series 2A.ai @ 12/03/2012 PREPARED BY: JC
GRANTS RECLAMATION PROJECT TTP Alluvial Pilot Test Work Plan
FIGURE A-14TOTAL PHOSPHORUS AND ORTHOPHOSPHATE CONCENTRATIONS
IN SOLUTION AND EXTRACTABLE SOLID PHASESIN SERIES 2A, 1,000 MG/L TPP AS PO4 EXPERIMENT
0
50
100
150
200
250
300
0 days 15 days 30 days 106 days
Effectiv
e Aq
ueou
s P (
mg/
L)
Reaction Time
Total P accounting, 1000 mg/L TPP test
0
20
40
60
80
100
120
0 days 15 days 30 days 106 days
Effectiv
e Aq
ueou
s P (
mg/
L)
Reaction Time
Ortho-P accounting, 1000 mg/L TPP test
Ac - HCO3
HCO3
Aqueous

K:\AO000120-Grants\Illustrators\2012 TTP\Figure A-15_Arsenic concentrations in Series 2B and Series 3 experiments.ai @ 12/03/2012 PREPARED BY: JC
GRANTS RECLAMATION PROJECT TTP Alluvial Pilot Test Work Plan
FIGURE A-15ARSENIC CONCENTRATIONS
IN SERIES 2B AND SERIES 3 EXPERIMENTS
0
10
20
30
40
50
60
70
80
0 2 4 6 8 10 12 14 16
Arsenicconcen
tration(ug/L)
days
Varying TPP, No added Ca
0 mg/L as PO4
1000 mg/L
2000 mg/L
0
10
20
30
40
50
60
70
80
0 2 4 6 8 10 12 14 16
Arsenicconcen
tration(ug/L)
days
TPP = 2000 mg/L as PO4, Varying Ca
0 mg/L Ca
890 mg/L

Appendix B
LTP Pilot Test Procedures and
Results

Imagine the result
Homestake Mining Company of California
Appendix B LTP Pilot Test Procedures and Results
TPP Alluvial Pilot Test Work Plan
December 3, 2012

Appendix B LTP Pilot Test Procedures and Results TPP Alluvial Pilot Testing Work Plan
Adam Griffin Project Engineer
Jeff Gillow, PhD Technical Expert
Phil DeDycker Principal in Charge / Project Manager
Prepared for:
Homestake Mining Company of California
Prepared by:
ARCADIS U.S., Inc.
630 Plaza Drive
Suite 100
Highlands Ranch
Colorado 80129
Tel 720 344 3500
Fax 720 344 3535
Our Ref.:
AO000120
Date:
December 3, 2012
This document is intended only for the use
of the individual or entity for which it was
prepared and may contain information that
is privileged, confidential and exempt from
disclosure under applicable law. Any
dissemination, distribution or copying of
this document is strictly prohibited.

i
Table of Contents
1. Introduction 1
2. LTP Pilot Test 1
2.1 Phase 1 – Bench Testing 3
2.2 Phase 2 – Tracer Testing 6
2.3 Phase 3 – LTP Pilot Test 8
2.3.1 Amendment Injection 8
2.3.2 Monitoring 10
3. LTP Pilot Test Results and Interpretation 11
4. References 14
5. Tables 15
6. Figures 16
Tables
Table B-1 Injection Solution Target and Actual Design Parameters 15
Figures
Figure B-1 LTP Pilot Test Locations
Figure B-2 Laboratory Testing Summary
Figure B-3 LTP Pilot 1 Well Network
Figure B-4 LTP Pilot 2 Well Network
Figure B-5 LTP Pilot 1 Tracer Breakthrough Curve
Figure B-6 LTP Pilot 2 Tracer Breakthrough Curve
Figure B-7 LTP Pilot Test Well Network

ii
Table of Contents
Figure B-8 Phosphate Breakthrough Curve
Figure B-9 Uranium and pH at WU11 and WU10
Figure B-10 Deuterium Breakthrough Curves

1
Appendix B
LTP Pilot Test Procedures and Results
1. Introduction
On behalf of Homestake Mining Company of California (HMC), ARCADIS has
prepared this summary of the tripolyphosphate (TPP) pilot test in the Large Tailings
Pile (LTP) at the Grants Reclamation Project (site).
HMC is currently evaluating the in situ immobilization and treatment of uranium using a
TPP amendment to strategically augment the existing Corrective Action Program
(CAP) for the site. In order to expedite the evaluation of the TPP emplaced reactive
zone, a pilot test program was conducted in the Large Tailings Pile (LTP). The New
Mexico Environmental Department (NMED) was notified of the proposed LTP Pilot
Test in a letter dated August 13, 2010 (HMC 2010) and approved the pilot testing on
November 22, 2010 (NMED 2010).
While the full-scale implementation conceptual design (Section 3.2 of the Work Plan) is
to use TPP to immobilize uranium in the alluvial aquifer, a pilot test was conducted in
the LTP to demonstrate that application of TPP is effective at immobilizing uranium in
situ and to support the design of alluvial implementation. Based on the results of the
LTP Pilot Test and supporting laboratory testing described in this Appendix, HMC
proposes the continued evaluation of TPP for uranium immobilization through Pilot
Testing in the alluvial aquifer.
2. LTP Pilot Test
The LTP Pilot Testing program was designed in three phases to facilitate decision
points and generate the data necessary to proceed to subsequent phases. The three
phases and associated specific objectives of the LTP Pilot Testing program were:
• Phase 1 – Bench Testing: Evaluate the feasibility of polyphosphate to initiate
uranium precipitation.
– Determine the optimal TPP concentration in the injection solution.
– Characterize the kinetics of the TPP reaction.
– Identify any necessary chemical manipulation of injection solution (i.e., pH
adjustment or addition of other amendments) to counter potentially
unfavorable LTP geochemical conditions for uranium precipitation.

2
Appendix B
LTP Pilot Test Procedures and Results
Phase 2 – Tracer Testing: Collect area-specific data about hydraulic properties of
the LTP.
– Evaluate the hydraulic connectivity and local flow directions in the pilot well
network.
– Determine injectability parameters, including sustainable injection rates and
the relationship between the injection volume and resulting radius of
influence.
– Characterize the velocity, dilution, and transport behavior of injected
amendments.
Phase 3 – LTP Pilot Test: Evaluate the effectiveness of TPP at immobilizing
uranium in situ in the LTP.
– Determine injectability of the amendment solution and subsequent distribution
and transport in the tailings.
– Evaluate geochemical trends via performance monitoring to demonstrate
uranium sequestration as low solubility phosphate minerals and to
characterize any secondary effects (e.g., mobilization of other COCs).
– Collect data necessary for design of a TPP injection program in the alluvial
aquifer.
LTP Pilot Test field activities were initiated in two areas of the LTP (Figure B-1). The
tailings matrix of the first area, LTP Pilot 1, is primarily fine-grained material (slimes);
the matrix of the second area, LTP Pilot 2, is primarily medium- to coarse-grained
material (sands). In general, the slimes are less permeable than the sands. These two
areas have unique geochemical and hydrological characteristics, but were both initially
selected for pilot testing based on their relatively moderate chemistry (low uranium
concentrations, low alkalinity, low TDS, and more neutral pH) as compared to pore
water in other areas of the LTP, and established well networks for injection and/or
monitoring.
Phases 1 and 2 included evaluation of both test areas but Phase 3 was only
implemented in LTP Pilot 1 area.

3
Appendix B
LTP Pilot Test Procedures and Results
2.1 Phase 1 – Bench Testing
The laboratory testing program is a collaborative effort of ARCADIS and Chemac
Environmental Services (Chemac) in Centennial, Colorado. ARCADIS leads the
laboratory testing program through test design and result interpretation while Chemac
performs the laboratory testing under ARCADIS direction. Chemac relies on ACZ
Laboratories Inc. (ACZ) in Steamboat Springs, Colorado to perform the sample
analytical analyses.
The laboratory testing was designed to evaluate the feasibility of TPP to initiate
uranium precipitation in the LTP. Specifically, the laboratory testing was used to
determine the optimal TPP concentration of the injection solution, to characterize the
kinetics of the TPP reaction, and to identify any necessary chemical manipulation of
injection water to counter unfavorable LTP geochemical conditions.
Testing was performed using written procedures and results recorded in laboratory
notebooks. Analyses performed by Chemac were done in accordance with published
test methods (APHA 1992). Analyses performed by ACZ Laboratories Inc. were done
in accordance with standard operating procedures, US EPA test methods, and a
laboratory quality assurance program. These controls on testing and analyses assure
that the data generated under this laboratory testing program are accurate,
reproducible, and able to withstand critical and peer review.
Laboratory Testing Design
The laboratory testing was conducted as an iterative process, with results from initial
test programs determining the experimental design parameters in subsequent tests.
Each program was designed with a combination of the following variables:
• Test Media
– Pore water from slimes-dominated area of LTP (LTP Pilot 1)
– Pore water from sands-dominated area of LTP (LTP Pilot 2)
– Tailings solids collected from slimes-dominated area of LTP (60 ft depth)

4
Appendix B
LTP Pilot Test Procedures and Results
• Phosphate Source and Dose
– Orthophosphate (from various phosphate salts, including Na3PO4, K2HPO4,
KH2PO4, and H3PO4)
– Sodium TPP
– Typically, 100 and 1,000 milligrams per liter as phosphate (mg/L as PO4)
doses
• Chemical Manipulation
– pH adjustment: target pH ranged from 5 to 7 standard units (s.u.)
– Calcium addition (as calcium chloride) to achieve a target calcium to
phosphorus (Ca:P) mass ratio of 2.4
The initial testing programs only used pore water from the LTP. Since the tailings
themselves were expected to buffer changes in solution chemistry (including uranium
concentration), HMC anticipated that in situ uranium immobilization in the LTP would
be different than in pore water alone.
In order to mimic in situ conditions as closely as possible in the laboratory to inform
pilot testing, ARCADIS designed a mixture of pore water and tailings solids (LTP Mix)
that was used in later phases of laboratory testing. The LTP Mix consisted of one part
by weight of tailings solids and four parts by weight of tailings pore water. This ratio of
solids to water ensured that there were enough solids present to participate in
reactions while maintaining a slurry consistency that allowed for aqueous sampling.
These tests were designed after the LTP Pilot 1 area had been selected for pilot
testing, so only pore water from this area was used. The specific objectives associated
with the LTP Mix tests included:
• Characterize the pH and COC buffering capacity of the tailings solids.
• Characterize the effect of tailings solids on uranium immobilization from pore water
and potential effects on the concentrations of molybdenum and selenium in pore
water.
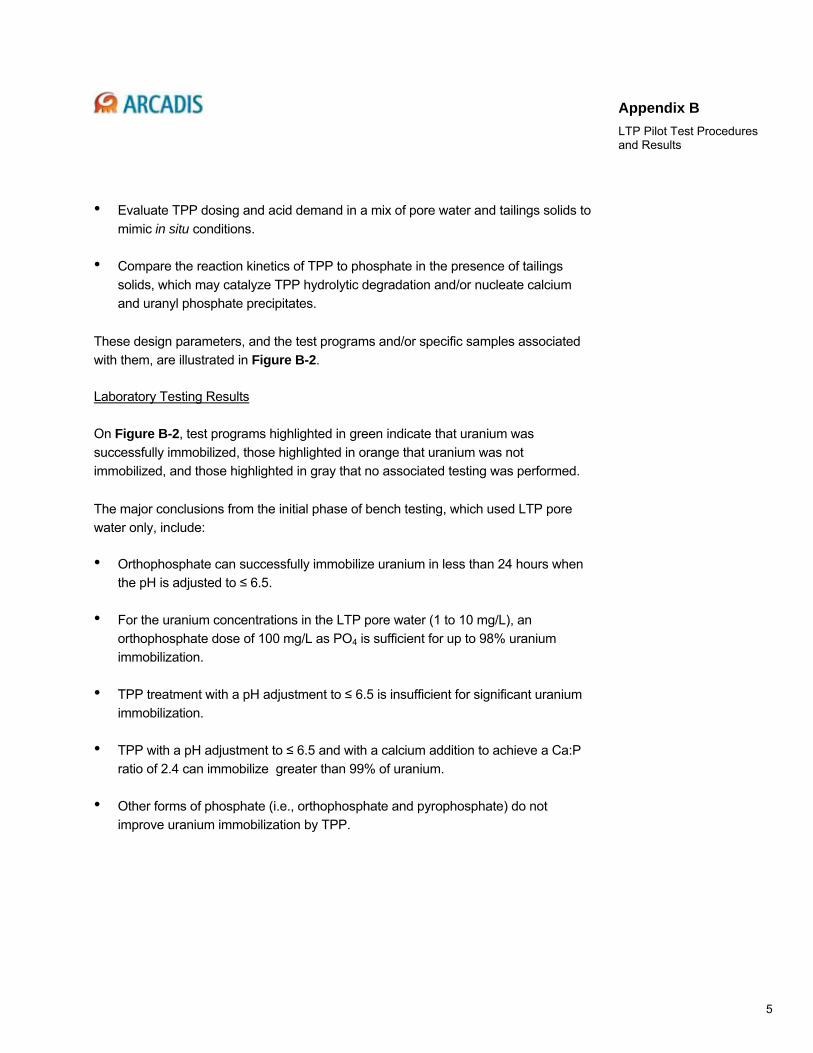
5
Appendix B
LTP Pilot Test Procedures and Results
• Evaluate TPP dosing and acid demand in a mix of pore water and tailings solids to
mimic in situ conditions.
• Compare the reaction kinetics of TPP to phosphate in the presence of tailings
solids, which may catalyze TPP hydrolytic degradation and/or nucleate calcium
and uranyl phosphate precipitates.
These design parameters, and the test programs and/or specific samples associated
with them, are illustrated in Figure B-2.
Laboratory Testing Results
On Figure B-2, test programs highlighted in green indicate that uranium was
successfully immobilized, those highlighted in orange that uranium was not
immobilized, and those highlighted in gray that no associated testing was performed.
The major conclusions from the initial phase of bench testing, which used LTP pore
water only, include:
• Orthophosphate can successfully immobilize uranium in less than 24 hours when
the pH is adjusted to ≤ 6.5.
• For the uranium concentrations in the LTP pore water (1 to 10 mg/L), an
orthophosphate dose of 100 mg/L as PO4 is sufficient for up to 98% uranium
immobilization.
• TPP treatment with a pH adjustment to ≤ 6.5 is insufficient for significant uranium
immobilization.
• TPP with a pH adjustment to ≤ 6.5 and with a calcium addition to achieve a Ca:P
ratio of 2.4 can immobilize greater than 99% of uranium.
• Other forms of phosphate (i.e., orthophosphate and pyrophosphate) do not
improve uranium immobilization by TPP.

6
Appendix B
LTP Pilot Test Procedures and Results
The major conclusions from the second phase of bench testing, which used the LTP
Mix to mimic in situ conditions, are:
• In the presence of tailing solids, uranium is immobilized by TPP with a pH
adjustment to ≤ 7.2 and the addition of calcium (up to 82% by 30 days after
treatment).
• Selenium is mobilized from the tailings solids by the pH adjustment, but
molybdenum is not.
• The presence of tailings solids does not appear to significantly affect the hydrolysis
and reaction kinetics of TPP.
The injection solution used in the Phase 3 LTP Pilot Test was specified based on the
observed results of laboratory testing. The design parameters of the injection solution
are summarized in Table B-1.
2.2 Phase 2 – Tracer Testing
The second phase of the LTP Pilot Test consisted of tracer testing to collect hydraulic
data specific to each pilot test area. The tracer test involved injections of a
conservative (i.e., non-reactive and non-sorbing) tracer in both the LTP Pilot 1 and LTP
Pilot 2 areas (Figure B-1) in November 2010. The well networks for each area are
depicted in Figures B-3 and B-4.
Tracer Testing Design and Procedures
Two tracers were used concurrently: bromide (as potassium bromide) and fluorescein
(as sodium fluorescein). Fluorescein was used for field screening because of its low
visual detection limits and bromide was quantitatively analyzed by Energy Laboratories
in Casper, Wyoming (Energy Labs).
Tracer injections were conducted from November 3 to 5, 2010 using 1,000-gallon (gal)
tanks, filled with water from supply well WE-13 in LTP Pilot 1 area and from the L-
Series alluvial pumping wells transect (L-Series) in LTP Pilot 2 area.
In the LTP Pilot 1 area, 4,500 gallons of tracer solution were injected at an approximate
injection rate of 3 gallons per minute (gpm). In the LTP Pilot 2 area, a total of 22,000
gallons were injected at an approximate rate of 9 gpm. Injections at the LTP Pilot 2

7
Appendix B
LTP Pilot Test Procedures and Results
area were accomplished by preparing concentrated 1,000 gallon batches of tracer and
mixing with a non-amended water stream at the injection wellhead to achieve the
desired tracer concentration. Approximate injected concentrations of bromide and
fluorescein for both areas were 500 milligrams per liter (mg/L) and 5 mg/L, respectively.
Post-injection monitoring began on November 8, 2010 after the end of tracer injections
and continued through March 2011, with select wells sampled again in July 2011 to
evaluate longer-term “washout”. Post-injection monitoring provides valuable data to
evaluate transport rates and other aquifer parameters. A total of 13 post-injection
monitoring events were conducted over a period of 250 days; samples were sent to
Energy Labs for bromide and uranium analysis.
Tracer Testing Results
Breakthrough curves for LTP Pilot 1 and LTP Pilot 2 are included as Figures B-5 and
B-6, respectively. The breakthrough curves illustrate bromide concentration data
versus time (elapsed since injection), where the concentration data has been
normalized to the injected concentration.
The tracer testing results were very different in the two pilot test areas due to the
different hydrogeologic characteristics. In the LTP Pilot 1 area (slimes-dominated), an
injection rate of approximately 3 gpm was observed and a hydraulic and tracer
response was observed at WU11 during the injection phase (Figure B-5). Tracer
response at WU11, which is approximately 5.5 feet away from the injection well, was
observed after the injection of 1,800 gallons. Based on this response, the estimated
mobile porosity (the pore space where the majority of flow occurs) was calculated
assuming a cylindrical distribution to be approximately 4% in this area.
Based on the results of the tracer test, four additional monitoring wells were installed to
the north and northeast of well WM4 in May 2011 to expand the monitoring well
network for the LTP Pilot Test (Figure B-7).
In the LTP Pilot 2 area (sands), an injection rate of 9 gpm was achieved with the water
level inside the injection well casing remaining below the ground surface. Based on
the lack of observed tracer response at ES3 after the injection of 22,000 gallons, the
estimated mobile porosity in this pilot test area is greater than 8%. Post-injection tracer
monitoring has confirmed the arrival of tracer solution at monitoring wells ES3, ES6,
and PW3, all at normalized concentrations greater than 0.1 (Figure B-6). The different

8
Appendix B
LTP Pilot Test Procedures and Results
tracer breakthrough curve characteristics are attributed to geologic heterogeneities and
the large screened intervals of the monitoring wells.
Based on these results, both the slimes and the sands in areas LTP Pilot 1 and 2,
respectively, were determined to be adequately permeable for the implementation of
the Phase 3 LTP Pilot Test. LTP Pilot 1 was chosen for the Phase 3 LTP Pilot Test
because of its tighter well spacing and lower mobile porosity (requiring a significantly
smaller injection volume) and more moderate pore water chemistry.
2.3 Phase 3 – LTP Pilot Test
The third and final phase was the field implementation of the LTP Pilot Test in
September 2011. Based on the results of Phases 1 and 2, the LTP Pilot 1 area was
selected for the implementation of the LTP Pilot Test. The LTP Pilot 1 area required
less chemical manipulation (i.e., a smaller pH adjustment) and a smaller volume of
injection solution than the LTP Pilot 2 area. The well network used for the LTP Pilot
Test is depicted in Figure B-7.
Results of the Phase 1 bench testing determined the chemical amendments necessary
for uranium immobilization from LTP pore water in the presence of tailings solids. The
pH of the amendment solution was adjusted with sulfuric acid and amended with
sodium TPP, calcium chloride, and two tracers (rhodamine WT, a dye tracer for field
screening, and deuterium, for laboratory analysis). The design and actual parameters
of the injection solution are summarized in Table B-1.
Results of the Phase 2 Tracer Testing allowed the determination of hydraulic and
injection parameters including safe injection rates, the relationship between injection
volume and radius of influence (ROI), hydraulic connection of the monitoring network,
and solute transport rates.
2.3.1 Amendment Injection
The injection system for the Pilot Test was constructed during the week of September
12, 2011. The primary components of the injection system include: two 1,000-gal
horizontal tanks, a delivery pump, a 600-gal vertical tank with mixer, an acid metering
pump, and the injection line with pressure relief. Schedule 80 polyvinyl chloride (PVC)
piping was used for all system piping downstream of the 600-gal tank that contained
the pH-adjusted solution. Schedule 80 PVC piping was also used for the majority of
piping upstream for system durability.
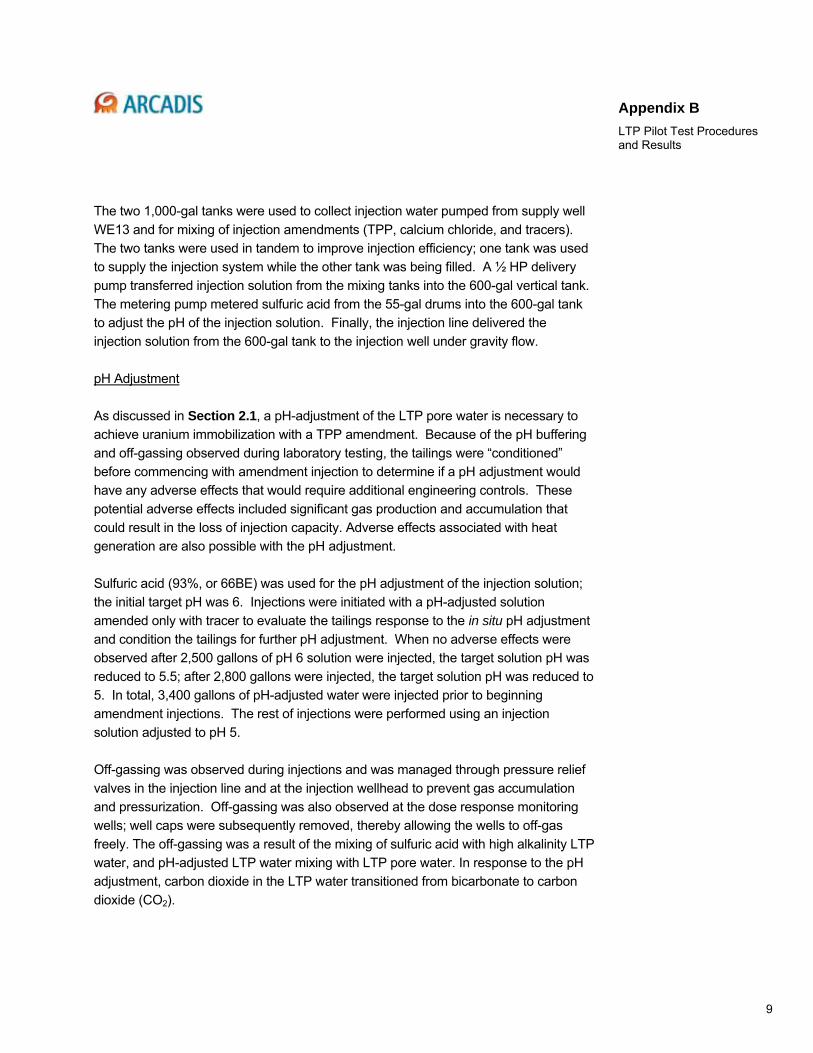
9
Appendix B
LTP Pilot Test Procedures and Results
The two 1,000-gal tanks were used to collect injection water pumped from supply well
WE13 and for mixing of injection amendments (TPP, calcium chloride, and tracers).
The two tanks were used in tandem to improve injection efficiency; one tank was used
to supply the injection system while the other tank was being filled. A ½ HP delivery
pump transferred injection solution from the mixing tanks into the 600-gal vertical tank.
The metering pump metered sulfuric acid from the 55-gal drums into the 600-gal tank
to adjust the pH of the injection solution. Finally, the injection line delivered the
injection solution from the 600-gal tank to the injection well under gravity flow.
pH Adjustment
As discussed in Section 2.1, a pH-adjustment of the LTP pore water is necessary to
achieve uranium immobilization with a TPP amendment. Because of the pH buffering
and off-gassing observed during laboratory testing, the tailings were “conditioned”
before commencing with amendment injection to determine if a pH adjustment would
have any adverse effects that would require additional engineering controls. These
potential adverse effects included significant gas production and accumulation that
could result in the loss of injection capacity. Adverse effects associated with heat
generation are also possible with the pH adjustment.
Sulfuric acid (93%, or 66BE) was used for the pH adjustment of the injection solution;
the initial target pH was 6. Injections were initiated with a pH-adjusted solution
amended only with tracer to evaluate the tailings response to the in situ pH adjustment
and condition the tailings for further pH adjustment. When no adverse effects were
observed after 2,500 gallons of pH 6 solution were injected, the target solution pH was
reduced to 5.5; after 2,800 gallons were injected, the target solution pH was reduced to
5. In total, 3,400 gallons of pH-adjusted water were injected prior to beginning
amendment injections. The rest of injections were performed using an injection
solution adjusted to pH 5.
Off-gassing was observed during injections and was managed through pressure relief
valves in the injection line and at the injection wellhead to prevent gas accumulation
and pressurization. Off-gassing was also observed at the dose response monitoring
wells; well caps were subsequently removed, thereby allowing the wells to off-gas
freely. The off-gassing was a result of the mixing of sulfuric acid with high alkalinity LTP
water, and pH-adjusted LTP water mixing with LTP pore water. In response to the pH
adjustment, carbon dioxide in the LTP water transitioned from bicarbonate to carbon
dioxide (CO2).

10
Appendix B
LTP Pilot Test Procedures and Results
TPP Dosing
The actual amendment dosing was reduced from the design dosing based on field
observations (Table B-1). The reductions in dosing were made after significant solids
precipitation in the batch tank was observed in the first batch of solution prepared at
target dose concentrations. The observed precipitation had the potential to foul the
injection system and more importantly, potentially foul the tailings, thereby reducing
injection capacity.
In total, 16,600 gallons of pH-adjusted amendment solution were injected over eight
days. The injection rate was generally related to the elevation head in the tank, but
varied through the test from 2 to 10 gpm and averaged approximately 6 gpm over the
entire injection period.
Approximately 231 pounds (lb) of sodium TPP and 200 lb of calcium chloride were
injected (excluding phosphorus and calcium in the injection water from WE13). There
were no observations of solids formation and/or precipitation with this amendment
dosing.
Two different tracers were used during the LTP Pilot Test to satisfy different objectives.
Rhodamine WT allowed field staff to identify tracer arrival at the dose response and
monitoring wells and was injected at an approximate concentration of 240 mg/L. The
deuterium results were used to determine the dilution and washout of the amendment
solution; it was injected at an approximate concentration of 1119 delta per mil (δ‰).
The natural background concentration of deuterium ranged from -70 to -75 δ‰ in the
LTP Pilot 1 area.
2.3.2 Monitoring
Two distinct monitoring programs were implemented to evaluate the performance of
the STPP injections. The first, injection monitoring, was conducted for the duration of
active injections in September 2011. The focus of the injection monitoring program
was to provide data to confirm that injections were proceeding as designed so that any
necessary adjustments could be made. The second monitoring program was
performance monitoring, which was initiated after injections ended and lasted through
March 2012.

11
Appendix B
LTP Pilot Test Procedures and Results
The injection monitoring activities included:
• Hourly monitoring of the pH of the injection solution, plus three samples of injection
solution for laboratory analysis.
• Monitoring of the injection flow rate, cumulative injected volume, and pressure at
the injection wellhead at approximately 30 minute intervals.
• Monitoring at the dose response wells (WU11, WM4-A, WM4-B, and WM4-C),
including twice daily pH measurements and twice daily water level measurements,
plus five samples for laboratory analysis every day after visual tracer arrival.
Performance monitoring continued for six months after injections until March 2012. A
total of 12 performance monitoring events were performed approximately 2, 8, 14, 18,
23, 28, 42, 52, 63, 81, 126, and 169 days elapsed after injections. Samples were sent
to Energy Labs for analysis and to the University of California at Davis (UC Davis) for
deuterium analysis. At four weeks post-injection, monitoring was reduced to the
downgradient wells WU10 and WU11 where sustained pH adjustment and phosphate
concentrations warranted continued monitoring/evaluation.
The results of the LTP Pilot Test are discussed in Section 3.
3. LTP Pilot Test Results and Interpretation
The LTP Pilot Test was successfully implemented in the LTP and achieved its primary
objectives:
• Uranium was successfully immobilized (up to 81%) where the pH adjustment and
phosphate concentrations were sustained long enough for the precipitation to
occur.
• The phosphate minerals that were formed were stable and did not re-dissolve
when the pore water geochemistry returned to pre-injection conditions.
• No significant mobilization of molybdenum and selenium from the tailings solids
was observed.
• TPP and calcium were successfully delivered and distributed in the tailings,
creating an emplaced reactive zone to promote uranium immobilization.

12
Appendix B
LTP Pilot Test Procedures and Results
• The TPP is significantly retarded in the pilot test injection zone. This retardation is
likely due to adsorption of the TPP onto the tailings solids. However, there was no
indication of solids/precipitate fouling of the injection system and/or the tailings
matrix.
• Off-gassing and heat generation caused by the pH adjustment was successfully
controlled/mitigated and did not affect the performance of the pilot test.
Phosphate breakthrough curves (Figure B-9) for all of the monitoring wells show the
concentration of phosphate in the wells during and after the injections (the injection
period was -11 to 0 days). The wells to the northeast are shown as dashed lines
(WM4-A, WM4-B, WM4-C, and WM4-D); and the monitoring wells to the southwest are
shown as solid lines (WU11 and WU10). Peak phosphate concentrations were
observed at wells WU11, WM4-A, WM4-B, and WM4-C (the dose response wells)
during the injection since these wells are within the radius of influence; however,
phosphate concentrations quickly declined in WM4-A, WM4-B, and WM4-C after
injections ended (less than 20 mg/L as PO4 was observed 7 days post injection), and
less than 1 mg/L as PO4 was observed in the most distal monitoring well, WM4-D. The
phosphate concentration in the downgradient monitoring well to the west, WU10,
increased to a peak concentration of 17.2 mg/L after 30 days post-injection.
The phosphate breakthrough curves (Figure B-8) indicate wells WU11 and WU10 are
downgradient of the injection well during the pilot test. The in situ concentration of
phosphate at the other four monitoring wells (WM4-A, WM4-B, WM4-C, and WM4-D)
was not sustained long enough for uranium to be effectively removed, thus
performance monitoring and interpretation focused on WU11 and WU10.
Figure B-9 compares the pH (measured in the laboratory) and the concentration of
dissolved uranium at WU11 and WU10. The ambient pH at WU11 was approximately
8.1 and the ambient pH at WU10 was approximately 8.4; the pH was decreased to
minimums of 6.71 and 7.69 at WU11 and WU10, respectively. The pH decrease (< X
s.u.) was maintained approximately 60 days post-injection, whereas the pH decrease
observed in other monitoring wells quickly rebounded to pre-injection levels after
injections ended.
Uranium concentrations were reduced at wells WU11 and WU10 because of the
sustained pH decrease and available phosphate and calcium; uranium concentrations
were reduced to minimums of 0.464 and 0.485 mg/L at WU11 (October 10, 2011) and
WU10 (January 31, 2012), respectively (Figure B-9). It is important to note that when

13
Appendix B
LTP Pilot Test Procedures and Results
pH increased post-injection, uranium concentrations in WU11 and WU10 did not return
to baseline concentrations, which indicates the uranium-calcium-phosphate precipitate
that was formed is stable and insoluble.
Deuterium breakthrough curves are shown on Figure B-10 Figure B-9 and reveal a
slight increase in uranium concentrations post-injection, and deuterium data confirms
that this minimal rebound is due to an influx of untreated water and not to the
dissolution of the precipitate.
When evaluating performance, COC concentrations of the injected solution must be
considered. The injection solution (WE13) had higher concentrations of uranium
(ranged from 2.62 to 3.50 mg/L) than the baseline concentrations in the monitoring
wells. To account for COC concentrations in the injected water, deuterium tracer data
were also used to correct estimates of immobilization since the normalized deuterium
concentration represents the fraction of the sampled water that is injected water. Using
this approach to estimate percent uranium immobilization, a maximum of 81% of
uranium was immobilized in WU11 and 69% was immobilized in WU10.
Based on the observed results at WU11 and WU10, the amendment successfully
immobilized uranium. The geochemical and hydrogeological conditions of the LTP are
very different from the alluvial aquifer and present significant complications to the
performance of in situ treatment. These complications include: 1) the reactivity of the
tailings solids; 2) the buffering capacity of the tailings solids and pore water; 3) limited
hydraulic access to fine-grained materials; 4) continuous influx of contaminated,
untreated water; and 5) the relatively extreme quality of the pore water. Given these
complicating factors, uranium immobilization of 81% and 69% is significant.
The results of the LTP Pilot Test demonstrate:
• TPP can successfully immobilize uranium in situ.
• Secondary geochemical and hydraulic effects are minimal and temporal but should
be monitored.
• A phosphate and calcium amendment solution can be dissolved, delivered, and
distributed in the subsurface.
It is important to note that a pH adjustment is not required for alluvial groundwater,
and so the primary constraint observed during the LTP Pilot Test (the pH adjustment)

14
Appendix B
LTP Pilot Test Procedures and Results
will not be an issue. Therefore, ARCADIS anticipates the effectiveness of this
treatment technology will be greater in the alluvial aquifer.
4. References
American Public Health Association (APHA). 1992. Standard Methods for the
Examination of Water and Wastewater. 18th Edition. Washington, DC.
Homestake Mining Company (HMC). 2010. Grants Reclamation Project – Treatment
Alternatives Testing in Large Tailings Pile. August 13, 2010
New Mexico Environment Department (NMED). 2010. Treatment Alternatives Testing
in the Large Tailings Pile (LTP). Response to November 7 correspondence from Al
Cox. November 22.
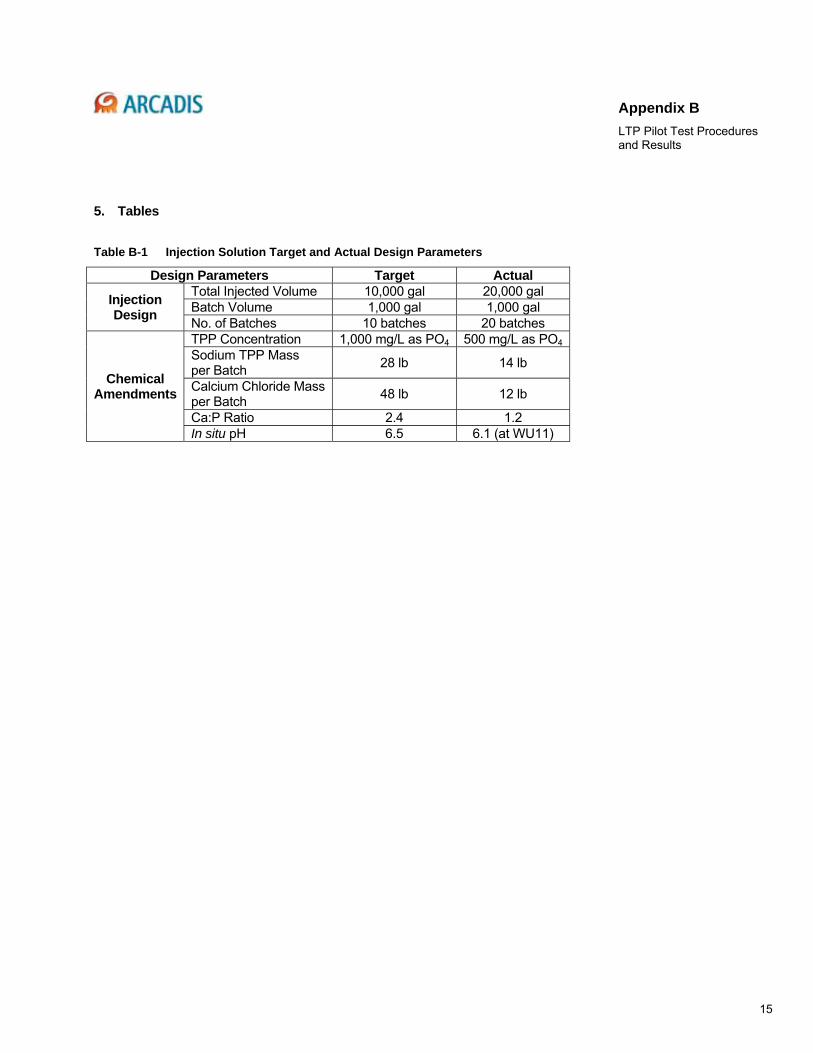
15
Appendix B
LTP Pilot Test Procedures and Results
5. Tables
Table B-1 Injection Solution Target and Actual Design Parameters
Design Parameters Target Actual
Injection Design
Total Injected Volume 10,000 gal 20,000 gal Batch Volume 1,000 gal 1,000 gal No. of Batches 10 batches 20 batches
Chemical Amendments
TPP Concentration 1,000 mg/L as PO4 500 mg/L as PO4
Sodium TPP Mass per Batch
28 lb 14 lb
Calcium Chloride Mass per Batch
48 lb 12 lb
Ca:P Ratio 2.4 1.2 In situ pH 6.5 6.1 (at WU11)

16
Appendix B
LTP Pilot Test Procedures and Results
6. Figures

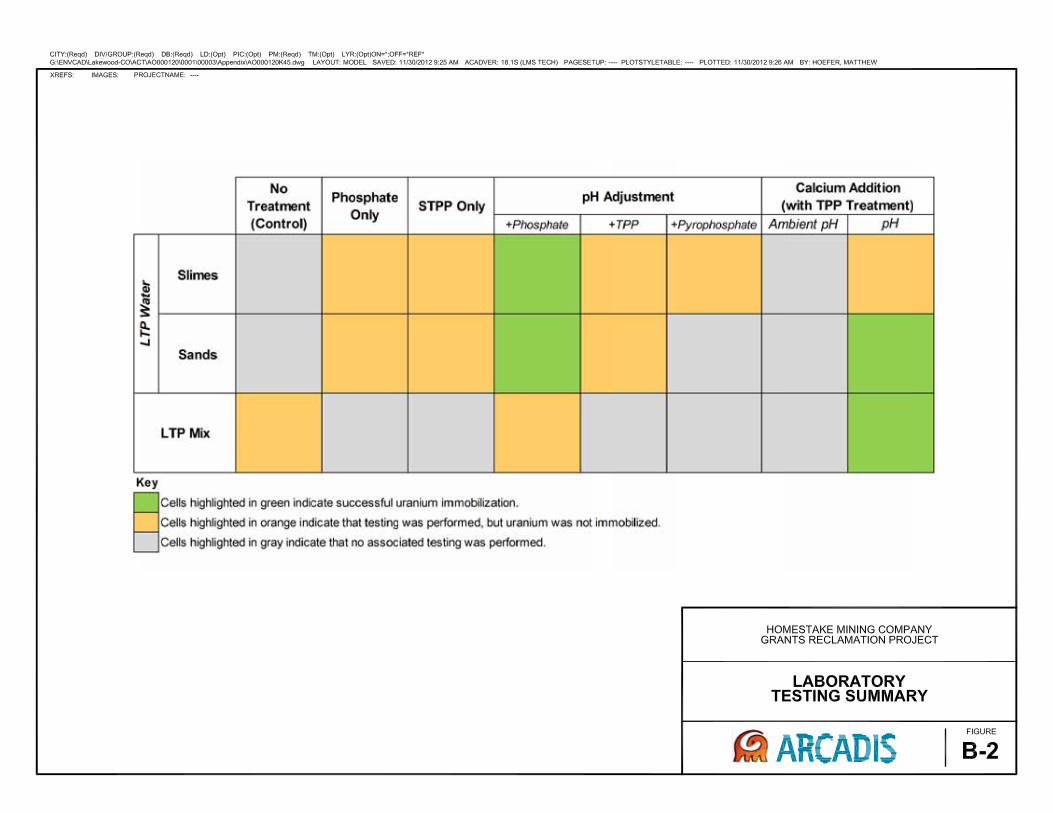


Appendix C
Material Safety Data Sheets

Material Safety Data Sheet Collection
Sodium Tripolyphosphate
SOD8950 DSC61 RTF Template version: 2006-06-05-00
Issue Date: 2006-06
Copyright © 2006 by Genium Group, Inc. Any commercial use or reproduction without the publisher’s permission is prohibited. Judgments as to the suitability of information herein for the purchaser’s purposes are necessarily the purchaser’s responsibility. Although reasonable care has been taken in the preparation of such information, Genium Group, Inc. extends no warranties, makes no representations, and assumes no responsibility as to the accuracy or suitability of such information for application to the purchaser’s intended purpose or for consequences of its use.
Section 1 - Chemical Product and Company Identification 61 Material Name: Sodium Tripolyphosphate CAS Number: 7758-29-4 Chemical Formula: Na5O10P3 Structural Chemical Formula: [(NaO)2P(O)O]2P(O)ONa EINECS Number: 231-838-7 ACX Number: X1003400-3 Synonyms: ARMOFOS; EMPIPHOS STP-D; NATRIUMTRIPOLYPHOSPHAT; PENTASODIUM
TRIPHOSPHATE; PENTASODIUM TRIPOLYPHOSPHATE; POLY; POLYGON; RHODIAPHOS LV; S 400; SODIUM PHOSPHATE; SODIUM TRIPHOSPHATE; SODIUM TRIPOLYPHOSPHATE; STPP; THERMPHOS; THERMPHOS L 50; THERMPHOS N; THERMPHOS SPR; TRIPHOSPHORIC ACID,PENTASODIUM SALT; TRIPOLY; TRIPOLYPHOSPHATE
General Use: builder for synthetic detergents; additive for processed meat, tuna, & poultry, livestock feed, & paper coatings; water softening (calcium & magnesium hardness sequestered from soln without precipitation); peptizing agent; emulsifier & dispersing agent, cleansers in oil well drilling fluids to control mud viscosity; to seal leaking ponds; phosphorus source for cattle; deflocculating agent; texturizer; hydrogen peroxide stabilizer; in imitation dairy products.
Section 2 - Composition / Information on Ingredients Name CAS % sodium tripolyphosphate 7758-29-4 >95
OSHA PEL
ACGIH TLV
NIOSH REL
Section 3 - Hazards Identification
0 1 2 3 4
FlammabilityToxicity
Body ContactReactivity
Chronic
ChemWatch Hazard Ratings
Min Low Moderate High Extreme
ANSI Signal Word
Caution
Emergency Overview White powder or granules. Irritating to eyes/skin/respiratory tract. Other Acute Effects: may be harmful by inhalation, ingestion, or skin absorption.
Potential Health Effects Target Organs: eyes, skin, respiratory system Primary Entry Routes: skin contact, inhalation of generated dust Acute Effects Inhalation: The solid/dust is discomforting to the upper respiratory tract and lungs. Persons with impaired respiratory
function, airway diseases, or conditions such as emphysema or chronic bronchitis may incur further disability if excessive concentrations of particulate are inhaled.
Eye: The dust may be discomforting to the eyes and is capable of causing a mild, temporary redness of the conjunctiva (similar to wind-burn), temporary impairment of vision and/ or other transient eye damage/ ulceration.
Skin: The material is moderately discomforting to the skin.

2006-06 Sodium Tripolyphosphate SOD8950
Copyright © 2006 Genium Group, Inc. Any commercial use or reproduction without the publisher’s permission is prohibited. Page 2 of 4
Ingestion: The solid/dust is regarded as harmful if swallowed and discomforting to the gastrointestinal tract. Considered an unlikely route of entry in commercial/industrial environments. Ingestion of large quantities may result in nausea, vomiting and diarrhea.
Carcinogenicity: NTP - Not listed; IARC - Not listed; OSHA - Not listed; NIOSH - Not listed; ACGIH - Not listed; EPA - Not listed; MAK - Not listed.
Chronic Effects: Dogs given daily doses of sodium phosphate dibasic for 9-22 weeks showed calcium deposits in the kidneys (nephrocalcinosis) with disseminated atrophy of the proximal tubule. Animals fed on sodium phosphate dibasic and potassium dihydrogen phosphate, in both short- and long-term studies, showed increased bone porosity; hyperparathyroidism and soft tissue calcification were also evident.
Section 4 - First Aid Measures Inhalation: • If fumes or combustion products are inhaled, remove to fresh air. • Lay patient down. Keep warm and rested. • If breathing is shallow or has stopped, ensure clear airway and apply resuscitation, preferably with a demand valve
resuscitator, bag-valve mask device, or pocket mask as trained. Perform CPR if necessary. • Transport to hospital or doctor. Eye Contact: • Immediately hold the eyes open and flush with fresh running water. • Ensure complete irrigation of the eye by keeping eyelids apart and away from eye and moving the eyelids by
occasionally lifting the upper and lower lids. • Seek medical attention if pain persists or recurs. • Removal of contact lenses after an eye injury should only be undertaken by skilled personnel. Skin Contact: • Immediately remove all contaminated clothing, including footwear (after rinsing with water). • Wash affected areas thoroughly with water (and soap if available). • Seek medical attention in event of irritation. Ingestion: • DO NOT induce vomiting. Contact a Poison Control Center. If vomiting occurs, lean patient forward or
place on left side (head-down position, if possible) to maintain open airway and prevent aspiration. • Observe the patient carefully. • Never give liquid to a person showing signs of being sleepy or with reduced awareness; i.e., becoming unconscious. • Give water (or milk) to rinse out mouth, then provide liquid slowly and as much as casualty can comfortably drink. • Seek medical advice. After first aid, get appropriate in-plant, paramedic, or community medical support.
Note to Physicians: Treat symptomatically.
Section 5 - Fire-Fighting Measures Flash Point: Nonflammable Extinguishing Media: Water spray or fog. Bromochlorodifluoromethane (BCF) (where regulations permit). Dry
chemical powder. Do not use CO2 extinguishers. General Fire Hazards/Hazardous Combustion Products: • Noncombustible. • Not considered to be a significant fire risk; however, containers may burn. Decomposes on heating and produces
sodium orthophosphate, phosphorus oxides (POx) and sodium oxide (Na2O). Fire Incompatibility: Avoid reaction with acids. Avoid excessive heat. Fire-Fighting Instructions: • Contact fire department and tell them location and nature of hazard. • Wear breathing apparatus plus protective gloves. • Prevent, by any means available, spillage from entering drains or waterways. • Cool fire-exposed containers with water spray from a protected location. • Do not approach containers suspected to be hot. • If safe to do so, remove containers from path of fire. • Use fire fighting procedures suitable for surrounding fire.
Section 6 - Accidental Release Measures Small Spills: • Clean up all spills immediately. • Absorbs water and carbon dioxide from the air. • Avoid contact with skin and eyes. • Wear protective clothing, gloves, safety glasses and dust respirator. • Use dry clean up procedures and avoid generating dust. • Vacuum up or sweep up. • Place spilled material in clean, dry, sealable, labeled container. Large Spills: • Clear area of personnel and move upwind. • Contact fire department and tell them location and nature of hazard. • Control personal contact by using protective equipment and dust respirator. • Prevent spillage from entering drains, sewers or waterways. • Recover product wherever possible. Avoid generating dust.

2006-06 Sodium Tripolyphosphate SOD8950
Copyright © 2006 Genium Group, Inc. Any commercial use or reproduction without the publisher’s permission is prohibited. Page 3 of 4
• Sweep/shovel up. • If required, wet with water to prevent dusting. • Put residues in labeled plastic bags or other containers for disposal. • Wash area down with large quantity of water and prevent runoff into drains. • If contamination of drains or waterways occurs, advise emergency services.
Regulatory Requirements: Follow applicable OSHA regulations (29 CFR 1910.120).
Section 7 - Handling and Storage Handling Precautions: • Limit all unnecessary personal contact. • Wear protective clothing when risk of exposure occurs. • Use in a well-ventilated area. • Avoid contact with incompatible materials. • When handling, DO NOT eat, drink or smoke. • Keep containers securely sealed when not in use. • Avoid physical damage to containers. • Always wash hands with soap and water after handling. • Work clothes should be laundered separately. • Follow good occupational work practices. • Observe manufacturer's storage and handling recommendations. • Atmosphere should be regularly checked against established exposure standards to ensure safe working conditions are
maintained. Recommended Storage Methods: Glass container. Plastic container. Plastic pail. Polyethylene or polypropylene
container. Plastic drum. Polylined drum. Check that containers are clearly labeled. Regulatory Requirements: Follow applicable OSHA regulations.
Section 8 - Exposure Controls / Personal Protection Engineering Controls: • Local exhaust ventilation is required where solids are handled as powders or crystals; even
when particulates are relatively large, a certain proportion will be powdered by mutual friction. • If in spite of local exhaust an adverse concentration of the substance in air could occur, respiratory protection should
be considered. Such protection might consist of: (a): particle dust respirators, if necessary, combined with an absorption cartridge; (b): filter respirators with absorption cartridge or canister of the right type; (c): fresh-air hoods or masks
• Build-up of electrostatic charge on the dust particle, may be prevented by bonding and grounding. • Powder handling equipment such as dust collectors, dryers and mills may require additional protection measures such
as explosion venting. Personal Protective Clothing/Equipment: Eyes: Chemical goggles. Safety glasses with side shields. Contact lenses pose a special hazard; soft lenses may absorb
irritants and all lenses concentrate them. Hands/Feet: Plastic gloves. Rubber gloves. PVC gloves. Other: • Overalls. • Eyewash unit.
Section 9 - Physical and Chemical Properties Appearance/General Info: Odorless white powder. Hygroscopic. There are two isomers, chemically the same but
differing in crystal structure and rate of hydration; are formed in the manufacturing process. These isomers can be custom blended to obtain a specified hydration rate. There are two grades: technical and food-grade.
Physical State: white powder or granules Formula Weight: 367.86 pH (1% Solution): 9.7 to 9.8 at 25 °C
Freezing/Melting Point: Transition at 417 °C (782.6 °F) Water Solubility: 14.5 g/100 cc at 25 °C
Section 10 - Stability and Reactivity Stability/Polymerization/Conditions to Avoid: Product is considered stable. Hazardous polymerization will not occur. Storage Incompatibilities: Segregate from acids.
Section 11 - Toxicological Information Toxicity Oral (rat) LD50: 5190 mg/kg Irritation Nil reported
See RTECS YK4570000, for additional data.

2006-06 Sodium Tripolyphosphate SOD8950
Copyright © 2006 Genium Group, Inc. Any commercial use or reproduction without the publisher’s permission is prohibited. Page 4 of 4
Section 12 - Ecological Information Environmental Fate: No data found. Ecotoxicity: No data found.
Section 13 - Disposal Considerations Disposal: Recycle wherever possible. Consult manufacturer for recycling options. Follow applicable local, state, and
federal regulations. Bury or incinerate residue at an approved site. Recycle containers if possible, or dispose of in an authorized landfill.
Section 14 - Transport Information DOT Hazardous Materials Table Data (49 CFR 172.101):
Shipping Name and Description: No data found.
Section 15 - Regulatory Information EPA Regulations:
RCRA 40 CFR: Not listed CERCLA 40 CFR 302.4: Listed per CWA Section 311(b)(4) 5000 lb (2268 kg) SARA 40 CFR 372.65: Not listed SARA EHS 40 CFR 355: Not listed TSCA: Listed
Section 16 - Other Information Disclaimer: Judgments as to the suitability of information herein for the purchaser’s purposes are necessarily the purchaser’s
responsibility. Although reasonable care has been taken in the preparation of such information, Genium Group, Inc. extends no warranties, makes no representations, and assumes no responsibility as to the accuracy or suitability of such information for application to the purchaser’s intended purpose or for consequences of its use.

MSDS Number: C0357 * * * * * Effective Date: 09/23/09 * * * * * Supercedes: 11/09/07
CALCIUM CHLORIDE
1. Product IdentificationSynonyms: calcium dichloride; calcium chloride anhydrous; Caltac®; DowflakeCAS No.: 10043-52-4Molecular Weight: 110.98Chemical Formula: CaCl2Product Codes:J.T. Baker: 1311Mallinckrodt: 0771, 3266, 3630, 4225, 4748, 4777, 4822, 4870, 4875, 4880
2. Composition/Information on Ingredients
Ingredient CAS No Percent Hazardous --------------------------------------- ------------ ------------ ---------
Calcium Chloride 10043-52-4 93 - 100% Yes
3. Hazards IdentificationEmergency Overview--------------------------WARNING! CAUSES IRRITATION TO SKIN, EYES AND RESPIRATORY TRACT. HARMFUL IFSWALLOWED OR INHALED.
SAF-T-DATA (tm) Ratings (Provided here for your convenience)-----------------------------------------------------------------------------------------------------------Health Rating: 1 - SlightFlammability Rating: 0 - NoneReactivity Rating: 2 - ModerateContact Rating: 3 - SevereLab Protective Equip: GOGGLES; LAB COATStorage Color Code: Green (General Storage)-----------------------------------------------------------------------------------------------------------
Potential Health EffectsDistributed by Rocky Mountain Reagents, Inc Part# CF4880

----------------------------------
Inhalation:Granular material does not pose a significant inhalation hazard, but inhalation of dust may cause irritation to therespiratory tract, with symptoms of coughing and shortness of breath.Ingestion:Low toxicity material but ingestion may cause serious irritation of the mucous membrane due to heat ofhydrolysis. Large amounts can cause gastrointestinal upset, vomiting, abdominal pain.Skin Contact:Solid may cause mild irritation on dry skin; strong solutions or solid in contact with moist skin may cause severeirritation, even burns.Eye Contact:Hazard may be either mechanical abrasion or, more serious, burns from heat of hydrolysis and chlorideirritation.Chronic Exposure:No information found.Aggravation of Pre-existing Conditions:No information found.
4. First Aid MeasuresInhalation:Remove to fresh air. If not breathing, give artificial respiration. If breathing is difficult, give oxygen. Getmedical attention.Ingestion:Induce vomiting immediately as directed by medical personnel. Never give anything by mouth to anunconscious person. Get medical attention.Skin Contact:Wipe off excess material from skin then immediately flush skin with plenty of water for at least 15 minutes.Remove contaminated clothing and shoes. Get medical attention. Wash clothing before reuse. Thoroughly cleanshoes before reuse.Eye Contact:Immediately flush eyes with plenty of water for at least 15 minutes, lifting lower and upper eyelids occasionally.Get medical attention immediately.
Note to Physician:Oral ingestion may cause serum acidosis.
5. Fire Fighting MeasuresFire:Not considered to be a fire hazard.Explosion:Not considered to be an explosion hazard.Fire Extinguishing Media:Use any means suitable for extinguishing surrounding fire.Special Information:In the event of a fire, wear full protective clothing and NIOSH-approved self-contained breathing apparatus withfull facepiece operated in the pressure demand or other positive pressure mode. At high temperatures or whenmoistened under fire conditions, calcium chloride may produce toxic or irritating fumes.
Distributed by Rocky Mountain Reagents, Inc Part# CF4880

6. Accidental Release MeasuresVentilate area of leak or spill. Wear appropriate personal protective equipment as specified in Section 8. Spills:Sweep up and containerize for reclamation or disposal. Vacuuming or wet sweeping may be used to avoid dustdispersal. Small amounts of residue may be flushed to sewer with plenty of water.
7. Handling and StorageKeep in a tightly closed container, stored in a cool, dry, ventilated area. Protect against physical damage. Moistcalcium chloride and concentrated solutions can corrode steel. When exposed to the atmosphere, calciumchloride will absorb water and form a solution. Containers of this material may be hazardous when empty sincethey retain product residues (dust, solids); observe all warnings and precautions listed for the product.
8. Exposure Controls/Personal ProtectionAirborne Exposure Limits:None established.Ventilation System:A system of local and/or general exhaust is recommended to keep employee exposures as low as possible. Localexhaust ventilation is generally preferred because it can control the emissions of the contaminant at its source,preventing dispersion of it into the general work area. Please refer to the ACGIH document, IndustrialVentilation, A Manual of Recommended Practices, most recent edition, for details.Personal Respirators (NIOSH Approved):For conditions of use where exposure to dust or mist is apparent and engineering controls are not feasible, aparticulate respirator (NIOSH type N95 or better filters) may be worn. If oil particles (e.g. lubricants, cuttingfluids, glycerine, etc.) are present, use a NIOSH type R or P filter. For emergencies or instances where theexposure levels are not known, use a full-face positive-pressure, air-supplied respirator. WARNING:Air-purifying respirators do not protect workers in oxygen-deficient atmospheres.Skin Protection:Wear protective gloves and clean body-covering clothing.Eye Protection:Use chemical safety goggles and/or full face shield where dusting or splashing of solutions is possible. Maintaineye wash fountain and quick-drench facilities in work area.Other Control Measures:Maintain good housekeeping in work area. Dust deposits on floors and other surfaces may pick up moisture andcause the surfaces to become slippery and present safety hazards.
9. Physical and Chemical PropertiesAppearance:White or gray-white granules.Odor:Odorless.Solubility:Freely soluble in water, exothermic.Density:2.15pH:8 - 9 Aqueous solution% Volatiles by volume @ 21C (70F):0Boiling Point:
Distributed by Rocky Mountain Reagents, Inc Part# CF4880

> 1600C (> 2912F)Melting Point:772C (1422F)Vapor Density (Air=1):No information found.Vapor Pressure (mm Hg):No information found.Evaporation Rate (BuAc=1):No information found.
10. Stability and ReactivityStability:Stable under ordinary conditions of use and storage. Substance will pick up moisture from the air and go intosolution if exposed in open containers.Hazardous Decomposition Products:Emits toxic chlorine fumes when heated to decomposition. May form hydrogen chloride in presence of sulfuricor phosphoric acids or with water at elevated temperatures.Hazardous Polymerization:Will not occur.Incompatibilities:Methyl vinyl ether, water, zinc, bromine trifluoride, mixtures of lime and boric acid, barium chloride, and2-furan percarboxylic acid. Metals will slowly corrode in aqueous calcium chloride solutions. Aluminum (andalloys) and yellow brass will be attacked by calcium chloride.Conditions to Avoid:Incompatibles.
11. Toxicological Information
Oral rat LD50: 1000 mg/kg. Investigated as a tumorigen and mutagen.
--------\Cancer Lists\------------------------------------------------------ ---NTP Carcinogen--- Ingredient Known Anticipated IARC Category ------------------------------------ ----- ----------- ------------- Calcium Chloride (10043-52-4) No No None
12. Ecological InformationEnvironmental Fate:Based on available information for Calcium Chloride anhydrous, this material will not biodegrade orbioaccumulate.Environmental Toxicity:The LC50/96-hour values for fish are over 100 mg/l.
13. Disposal ConsiderationsWhatever cannot be saved for recovery or recycling should be managed in an appropriate and approved wastedisposal facility. Processing, use or contamination of this product may change the waste management options.State and local disposal regulations may differ from federal disposal regulations. Dispose of container andunused contents in accordance with federal, state and local requirements.
Distributed by Rocky Mountain Reagents, Inc Part# CF4880

14. Transport InformationNot regulated.
15. Regulatory Information --------\Chemical Inventory Status - Part 1\--------------------------------- Ingredient TSCA EC Japan Australia ----------------------------------------------- ---- --- ----- --------- Calcium Chloride (10043-52-4) Yes Yes Yes Yes
--------\Chemical Inventory Status - Part 2\--------------------------------- --Canada-- Ingredient Korea DSL NDSL Phil. ----------------------------------------------- ----- --- ---- ----- Calcium Chloride (10043-52-4) Yes Yes No Yes
--------\Federal, State & International Regulations - Part 1\---------------- -SARA 302- ------SARA 313------ Ingredient RQ TPQ List Chemical Catg. ----------------------------------------- --- ----- ---- -------------- Calcium Chloride (10043-52-4) No No No No
--------\Federal, State & International Regulations - Part 2\---------------- -RCRA- -TSCA- Ingredient CERCLA 261.33 8(d) ----------------------------------------- ------ ------ ------ Calcium Chloride (10043-52-4) No No No
Chemical Weapons Convention: No TSCA 12(b): No CDTA: NoSARA 311/312: Acute: Yes Chronic: No Fire: No Pressure: NoReactivity: No (Pure / Solid)
Australian Hazchem Code: None allocated.Poison Schedule: None allocated.WHMIS:This MSDS has been prepared according to the hazard criteria of the Controlled Products Regulations (CPR) andthe MSDS contains all of the information required by the CPR.
16. Other InformationNFPA Ratings: Health: 1 Flammability: 0 Reactivity: 1Label Hazard Warning:WARNING! CAUSES IRRITATION TO SKIN, EYES AND RESPIRATORY TRACT. HARMFUL IFSWALLOWED OR INHALED.Label Precautions:Avoid contact with eyes, skin and clothing.Wash thoroughly after handling.Avoid breathing dust.Keep container closed.Use only with adequate ventilation.
Distributed by Rocky Mountain Reagents, Inc Part# CF4880

Label First Aid:If swallowed, induce vomiting immediately as directed by medical personnel. Never give anything by mouth toan unconscious person. In case of contact, wipe off excess material from skin then immediately flush eyes orskin with plenty of water for at least 15 minutes. Remove contaminated clothing and shoes. Wash clothingbefore reuse. If inhaled, remove to fresh air. If not breathing, give artificial respiration. If breathing is difficult,give oxygen. In all cases, get medical attention.Product Use:Laboratory Reagent.Revision Information:No Changes.Disclaimer:************************************************************************************************Mallinckrodt Baker, Inc. provides the information contained herein in good faith but makes norepresentation as to its comprehensiveness or accuracy. This document is intended only as a guide to theappropriate precautionary handling of the material by a properly trained person using this product.Individuals receiving the information must exercise their independent judgment in determining itsappropriateness for a particular purpose. MALLINCKRODT BAKER, INC. MAKES NOREPRESENTATIONS OR WARRANTIES, EITHER EXPRESS OR IMPLIED, INCLUDINGWITHOUT LIMITATION ANY WARRANTIES OF MERCHANTABILITY, FITNESS FOR APARTICULAR PURPOSE WITH RESPECT TO THE INFORMATION SET FORTH HEREIN ORTHE PRODUCT TO WHICH THE INFORMATION REFERS. ACCORDINGLY, MALLINCKRODTBAKER, INC. WILL NOT BE RESPONSIBLE FOR DAMAGES RESULTING FROM USE OF ORRELIANCE UPON THIS INFORMATION.************************************************************************************************Prepared by: Environmental Health & SafetyPhone Number: (314) 654-1600 (U.S.A.)
Distributed by Rocky Mountain Reagents, Inc Part# CF4880

Material Safety Data Sheet Collection
Fluorescein
FLU3730 DSC61 RTF Template version: 2006-06-05-00
Issue Date: 2006-06
Copyright © 2006 by Genium Group, Inc. Any commercial use or reproduction without the publisher’s permission is prohibited. Judgments as to the suitability of information herein for the purchaser’s purposes are necessarily the purchaser’s responsibility. Although reasonable care has been taken in the preparation of such information, Genium Group, Inc. extends no warranties, makes no representations, and assumes no responsibility as to the accuracy or suitability of such information for application to the purchaser’s intended purpose or for consequences of its use.
Section 1 - Chemical Product and Company Identification 61 Material Name: Fluorescein CAS Number: 2321-07-5 Chemical Formula: C20H12O5 EINECS Number: 219-031-8 ACX Number: X1001002-9 Synonyms: 11712 YELLOW; 11712 YELLOW9-(O-CARBOXYPHENYL)-6-HYDROXY-3H-XANTHEN-3-ONE;
BENZOIC ACID,2-(6-HYDROXY-3-OXO-3H-XANTHEN-9-YL); BENZOIC ACID,O-(6-HYDROXY-3-OXO-3H-XANTHEN-9-YL)-; C.I. 45350; C.I. 45350 (FREE ACID); C.I. 45350:1; C.I. 45350A; C.I. ACID YELLOW 73; C.I. SOLVENT YELLOW 94; 9-(O-CARBOXYPHENYL)-6-HYDROXY-3-ISOXANTHENONE; 9-(O-CARBOXYPHENYL)-6-HYDROXY-3H-XANTHEN-3-ONE; D AND C YELLOW NO 7; D&C YELLOW NO. 7; 3',4'-DEHYDROXYFLUORAN; 3',6'-DIHYDROXYFLUORAN; DIHYDROXYFLUORANE; 3',6'-DIHYDROXYSPIRO(ISOBENZOFURAN-1(3H),9'(9H)-XANTHEN)-3-ONE; 3,6-DIHYDROXYSPIRO(XANTHENE-9,3'-PHTHALIDE); DIRESORCINOLPHTHALEIN; FLUORAN,3',6'-DIHYDROXY-; 3',6'-FLUORANDIOL; 3,6-FLUORANDIOL; FLUORESCEIN; FLUORESCEIN RED; FLUORESCEINE; HIDACID FLUORESCEIN; O-(6-HYDROXY-3-OXO-3H-XANTHEN-9-YL)BENZOIC ACID; RESORCINOLPHTHALEIN; SOAP YELLOW F; SPIRO(ISOBENZOFURAN-1(3H),9'-(9H)XANTHEN)-3-ONE,3',6'-DIHYDROXY-; 3H-XANTHEN-3-ONE,9-(O-CARBOXYPHENYL)-6-HYDROXY-; ZLUT KYSELA 73
General Use: water flow tracer for examining subterranean waters, dyeing silk and wool, diagnostic aid(corneal trauma indicator), indicator and reagent for bromine, dye in drugs and cosmetics
Section 2 - Composition / Information on Ingredients Name CAS % fluorescein 2321-07-5 >98
OSHA PEL
ACGIH TLV
NIOSH REL
Section 3 - Hazards Identification
0 1 2 3 4
FlammabilityToxicity
Body ContactReactivity
Chronic
ChemWatch Hazard Ratings
Min Low Moderate High Extreme
ANSI Signal Word
Caution
Emergency Overview Yellowish-red to red powder or prisms. Irritating to eyes/skin/respiratory tract. Other Acute Effects: may be harmful by inhalation, ingestion, or skin absorption. Will burn.
Potential Health Effects Target Organs: eyes, skin, respiratory system, kidneys Primary Entry Routes: skin contact/absorption, inhalation of generated dust Acute Effects Inhalation: The dust may be discomforting to the upper respiratory tract. Persons with impaired respiratory function,
airway diseases, or conditions such as emphysema or chronic bronchitis may incur further disability if excessive concentrations of particulate are inhaled.

2006-06 Fluorescein FLU3730
Copyright © 2006 Genium Group, Inc. Any commercial use or reproduction without the publisher’s permission is prohibited. Page 2 of 4
Eye: The material is moderately discomforting to the eyes and is capable of causing a mild, temporary redness of the conjunctiva (similar to wind-burn), temporary impairment of vision and/ or other transient eye damage/ ulceration.
Skin: The material may be mildly discomforting to the skin. Open cuts and abraded or irritated skin should not be exposed to this material. The material may accentuate any pre-existing skin condition. Exposure to the material may result in a form of sunlight-initiated dermatitis (phototoxicity). This form of dermatitis may be contrasted to photoallergic dermatitis produced by specific sensitizing agents through immunological intervention. Phototoxic reactions have been described following contact, ingestion or injection of causal agents. The actual skin changes vary with the agent and circumstances of the exposure. Swelling and redness (erythema) frequently occur, and blistering may also result; increased skin temperature and pruritus may follow. This is analagous to irritant contact dermatitis and occurs immediately following contact. Hyperpigmentation may also follow the reaction. Phototoxicity designates a chemically-induced increased reactivity of a target tissue to ultraviolet (UV) and/or visible radiation on a non-immunological basis. Photodermatitis of this type requires activation of a chemical substance on the skin surface by UV radiation (290 to 490 nm wavelength) for its clinical expression. In all cases, inflammation develops on the body surfaces normally exposed to sunlight (dorsal hands, arms, neck, face), provided that the responsible photosensitizer also contacts the anatomic areas. Covered skin, the eyelids, submental chin and upper ears covered by hair are characteristically spared. Phototoxic reactions are typically accompanied by immediate burning, stinging or "smarting" of the skin shortly following sun exposure, and clinical inflammation appears more like an acute sunburn than an eczematous dermatitis. Inflammation is the result of a toxic photodynamic effect and is not mediated by immunologic mechanisms.
Ingestion: Considered an unlikely route of entry in commercial/industrial environments. The material is moderately discomforting and harmful if swallowed in large quantity.
Carcinogenicity: NTP - Not listed; IARC - Not listed; OSHA - Not listed; NIOSH - Not listed; ACGIH - Not listed; EPA - Not listed; MAK - Not listed.
Chronic Effects: No human exposure data available.
Section 4 - First Aid Measures Inhalation: • If dust is inhaled, remove to fresh air. • Encourage patient to blow nose to ensure clear breathing passages. • Rinse mouth with water. Consider drinking water to remove dust from throat. • Seek medical attention if irritation or discomfort persist. Eye Contact: • Immediately hold the eyes open and flush with fresh running water. • Ensure complete irrigation of the eye by keeping eyelids apart and away from eye and moving the eyelids by
occasionally lifting the upper and lower lids. • Seek medical attention if pain persists or recurs. • Removal of contact lenses after an eye injury should only be undertaken by skilled personnel. Skin Contact: • Immediately remove all contaminated clothing, including footwear (after rinsing with water). • Wash affected areas thoroughly with water (and soap if available). • Seek medical attention in event of irritation. Ingestion: Rinse mouth out with plenty of water. Seek medical attention if irritation or discomfort persist. After first aid, get appropriate in-plant, paramedic, or community medical support.
Note to Physicians: Treat symptomatically.
Section 5 - Fire-Fighting Measures Flash Point: Not available; probably combustible Extinguishing Media: Foam. Dry chemical powder. BCF (where regulations permit). Carbon dioxide. Water spray
or fog - Large fires only. General Fire Hazards/Hazardous Combustion Products: • Solid which exhibits difficult combustion or is difficult
to ignite. • Avoid generating dust, particularly clouds of dust in a confined or unventilated space, as dust may form an
explosive mixture with air and any source of ignition, e.g., flame or spark, will cause fire or explosion. • Dry dust can also be charged electrostatically by turbulence, pneumatic transport, pouring, in exhaust ducts and
during transport. • Build-up of electrostatic charge may be prevented by bonding and grounding. • Powder handling equipment such as dust collectors, dryers and mills may require additional protection measures
such as explosion venting. Combustion products include carbon dioxide (CO2). Fire Incompatibility: Avoid contamination with strong oxidizing agents as ignition may result. Fire-Fighting Instructions: • Use water delivered as a fine spray to control fire and cool adjacent area. • Do not approach containers suspected to be hot. • Cool fire-exposed containers with water spray from a protected location. • If safe to do so, remove containers from path of fire. • Equipment should be thoroughly decontaminated after use.

2006-06 Fluorescein FLU3730
Copyright © 2006 Genium Group, Inc. Any commercial use or reproduction without the publisher’s permission is prohibited. Page 3 of 4
Section 6 - Accidental Release Measures Small Spills: • Clean up all spills immediately. • Avoid contact with skin and eyes. • Wear impervious gloves and safety glasses. • Use dry clean up procedures and avoid generating dust. • Vacuum up or sweep up. • Place spilled material in clean, dry, sealable, labeled container. Large Spills: • Clear area of personnel and move upwind. • Contact fire department and tell them location and nature of hazard. • Control personal contact by using protective equipment and dust respirator. • Prevent spillage from entering drains, sewers or waterways. • Avoid generating dust. • Sweep, shovel up. Recover product wherever possible. • Put residues in labeled plastic bags or other containers for disposal. • If contamination of drains or waterways occurs, advise emergency services.
Regulatory Requirements: Follow applicable OSHA regulations (29 CFR 1910.120).
Section 7 - Handling and Storage Handling Precautions: • Limit all unnecessary personal contact. • Wear protective clothing when risk of exposure occurs. • Use in a well-ventilated area. • When handling, do NOT eat, drink or smoke. • Always wash hands with soap and water after handling. • Avoid physical damage to containers. • Follow good occupational work practices. • Observe manufacturer's storage and handling recommendations. Recommended Storage Methods: Multi-ply paper bag with sealed plastic liner or heavy gauge plastic bag. Bags
should be stacked, blocked, interlocked, and limited in height so that they are stable and secure against sliding or collapse. Check that all containers are clearly labeled and free from leaks.
Regulatory Requirements: Follow applicable OSHA regulations.
Section 8 - Exposure Controls / Personal Protection Engineering Controls: General exhaust is adequate under normal operating conditions. If risk of overexposure exists,
wear NIOSH-approved respirator. Provide adequate ventilation in warehouse or closed storage areas. Personal Protective Clothing/Equipment: Eyes: Safety glasses, safety glasses with side shields, or chemical goggles. Contact lenses pose a special hazard; soft
lenses may absorb irritants and all lenses concentrate them. Hands/Feet: Wear general protective gloves, e.g. light weight rubber gloves. Other: Overalls; impervious protective clothing. Eyewash unit.
Section 9 - Physical and Chemical Properties Appearance/General Info: Yellowish-red to red powder. Soluble in hot alcohol or glacial acetic acid, alkali
hydroxides and carbonates with bright green fluorescence appearing red by transmitted light. Physical State: yellowish-red to red powder or prisms Vapor Pressure (kPa): Negligible Formula Weight: 332.30
Freezing/Melting Point: 314 °C (597.2 °F) Volatile Component (% Vol): Negligible Water Solubility: Insoluble in Water
Section 10 - Stability and Reactivity Stability/Polymerization/Conditions to Avoid: Product is considered stable. Hazardous polymerization will not occur. Storage Incompatibilities: Avoid storage with oxidizers.
Section 11 - Toxicological Information Mutagenic: Bacteria - E Coli DNA Adduct; Dose: 15 umol/L.
See RTECS LM5075000, for additional data.
Section 12 - Ecological Information Environmental Fate: No data found. Ecotoxicity: No data found.

2006-06 Fluorescein FLU3730
Copyright © 2006 Genium Group, Inc. Any commercial use or reproduction without the publisher’s permission is prohibited. Page 4 of 4
Section 13 - Disposal Considerations Disposal: • Consult manufacturer for recycling options and recycle where possible. • Follow applicable local, state, and federal regulations. • Incinerate residue at an approved site. • Recycle containers if possible, or dispose of in an authorized landfill.
Section 14 - Transport Information DOT Hazardous Materials Table Data (49 CFR 172.101):
Shipping Name and Description: No data found.
Section 15 - Regulatory Information EPA Regulations:
RCRA 40 CFR: Not listed CERCLA 40 CFR 302.4: Not listed SARA 40 CFR 372.65: Not listed SARA EHS 40 CFR 355: Not listed TSCA: Listed
Section 16 - Other Information Disclaimer: Judgments as to the suitability of information herein for the purchaser’s purposes are necessarily the purchaser’s
responsibility. Although reasonable care has been taken in the preparation of such information, Genium Group, Inc. extends no warranties, makes no representations, and assumes no responsibility as to the accuracy or suitability of such information for application to the purchaser’s intended purpose or for consequences of its use.