Embed Size (px)
Citation preview

http://tpx.sagepub.com/Toxicologic Pathology
http://tpx.sagepub.com/content/30/4/452The online version of this article can be found at:
DOI: 10.1080/01926230290105604
2002 30: 452Toxicol PatholKevin T. Morgan
H. Roger Brown, Hong Ni, Gina Benavides, Lawrence Yoon, Karim Hyder, Jaisri Giridhar, Guy Gardner, Ronald D. Tyler andof Adriamycin-Induced Cardiomyopathy in the Rat
Correlation of Simultaneous Differential Gene Expression in the Blood and Heart with Known Mechanisms
Published by:
http://www.sagepublications.com
On behalf of:
Society of Toxicologic Pathology
can be found at:Toxicologic PathologyAdditional services and information for
http://tpx.sagepub.com/cgi/alertsEmail Alerts:
http://tpx.sagepub.com/subscriptionsSubscriptions:
http://www.sagepub.com/journalsReprints.navReprints:
http://www.sagepub.com/journalsPermissions.navPermissions:
http://tpx.sagepub.com/content/30/4/452.refs.htmlCitations:
What is This?
- Jun 1, 2002Version of Record >>
at PENNSYLVANIA STATE UNIV on February 21, 2013tpx.sagepub.comDownloaded from
P1: GTJ/HAK P2: GTJ/HAK Tally: GTJ/HAK QC: GTJ/HAK T1: GTJ
July 13, 2002 14:48 TJ357-05(TXP) TJ501-03
TOXICOLOGIC PATHOLOGY, vol 30, no 4, pp 452–469, 2002Copyright C© 2002 by the Society of Toxicologic PathologyDOI: 10.1080/01926230290105604
Correlation of Simultaneous Differential Gene Expression in the Bloodand Heart with Known Mechanisms of Adriamycin-Induced
Cardiomyopathy in the Rat
H. ROGERBROWN,1 HONG NI,1 GINA BENAVIDES,1 LAWRENCEYOON,1 KARIM HYDER,3 JAISRI GIRIDHAR,2GUY GARDNER,2 RONALD D. TYLER,1 AND KEVIN T. MORGAN1
1Drug Safety, Toxicogenomics, GlaxoSmithKline, Inc, Research Triangle Park, North Carolina 277092 Medicine Safety Evaluation, GlaxoSmithKline, Inc, Research Triangle Park, North Carolina 27709, and
3Clontech Laboratories, Inc, Palo Alto, California 94303
ABSTRACT
As the genomes of mammalian species become sequenced and gene functions are ascribed, the use of differential gene expression (DGE) toevaluate organ function will become common in the experimental evaluation of new drug therapies. The ability to translate this technology into usefulinformation for human exposures depends on tissue sampling that is impractical or generally not possible in man. The possibility that the DGE ofnucleated cells, reticulocytes, or platelets in blood may present the necessary link with target organ toxicity provides an opportunity to correlatepreclinical with clinical outcomes. Adriamycin is highly effective alone and more frequently in combination with other chemotherapeutic agentsin the treatment of a variety of susceptible malignancies. Adriamycin-induced cardiomyopathy was examined as an endpoint to measure the utilityof DGE on whole blood as a predictor of cardiac toxicity. Statistically significant gene changes were observed between relevant blood and cardiacgene profiles that corroborated the accepted mechanisms of toxicity (oxidative stress, effects on carnitine transport, DNA intercalation). There were,however, clear indications that other target organs (bone marrow and intestinal tract) were affected. The divergent expression of some genes betweenthe blood and the heart on day 7 may also indicate the timing and mechanism of development of the cardiomyopathy and confirm current therapeuticapproaches for its prevention. The data demonstrate that whole blood gene expression particularly in relation to oxidative stress, in conjunction withstandard hematology and clinical chemistry, may be useful in monitoring and predicting cardiac damage secondary to adriamycin administration.
Appendices A & B, referenced in this paper, are not printed in this issue ofToxicologic Pathology. They are available as downloadable text files athttp://taylorandfrancis.metapress.com/openurl.asp?genre= journal&issn=0192-6233. To access them, click on the issue link for 30(4), then selectthis article. A download option appears at the bottom of this abstract. In order to access the full article online, you must either have an individualsubscription or a member subscription accessed through www.toxpath.org.
Keywords. Blood; heart; gene expression; doxorubicin.
INTRODUCTION
Therapeutic agents, and particularly anticancer chemo-therapies, carry the promise of effective treatments andperhaps cures for the disease entities targeted. However, asuccessful treatment may also entail added burdens at themolecular, tissue, and organ levels that may lead to cellular,tissue, and organ damage as an unavoidable consequence. Inthe face of malignancy, the risk-to-benefit ratio may seemobvious. For a variety of disease entities, knowing the riskby monitoring both the disease progression as well as the cu-mulative damage from the therapy, necessitates a continuingreassessment by the physician of whether a specific therapycontinues. Blood profiling of clinical chemistry parametershas, over a prolonged period of development, provided valu-able information about disease progression and physiologicfunction of most of the organs of the body. However, themechanistic pathways leading to the observed changes andthe time course involved are often obscured once the lesion isdetectable. The presence of sufficient numbers of nucleatedcells (predominantly neutrophils, lymphocytes, and mono-cytes) in the blood offers the opportunity to use blood as a
Address correspondence to: H. Roger Brown, GlaxoSmithKline, Inc,Mai. T 1158, Five Moore Drive, Research Triangle Park, NC, 27709;e-mail: [email protected]
tissue for differential gene expression (DGE). The contribu-tion of platelets (1) and reticulocytes (2) to gene expressionwill need to be examined further as both contain residualtranscripts reflecting precursor responses in the bone mar-row. DGE reveals relative changes in mRNA transcript levelsin control vs treated cell populations. DGE can provide in-sight into both the current molecular state of the populationand clues as to the mechanisms by which known perturba-tions occur. Sequential sampling also provides the opportu-nity to detect divergences from the normal state. The timingof those divergences can be compared against biochemicalsubstrates and endogenous protectants to identify possibleinterventions that will reverse or prevent consequential dam-age. For this premise to be meaningful, the therapeutic agentmust (a) target responses in the genome that are common be-tween the first cells to “see” the agent (blood) and the cellsof the definitive target organs, and then (b) induce sharedtranscriptional responses (not necessarily translational andbiochemical) that are indicators of events that lead to toxicityin the target organ(s) by virtue of specific inadequacies ofprotection or exaggerated needs or responses of the tissue.
Clearly not all therapeutic agents will lend themselves tothis type of evaluation but the extent to which DGE canbe used in this fashion is clearly only now being evalu-ated and the understanding of the uses and limitations ofthe technology is embryonic. To test the value of blood
452 0192-6233/02$3.00+$0.00
at PENNSYLVANIA STATE UNIV on February 21, 2013tpx.sagepub.comDownloaded from
P1: GTJ/HAK P2: GTJ/HAK Tally: GTJ/HAK QC: GTJ/HAK T1: GTJ
July 13, 2002 14:48 TJ357-05(TXP) TJ501-03
Vol. 30, No. 4, 2002 ADRIAMYCIN-INDUCED CARDIOMYOPATHY IN THE RAT 453
DGE as a surrogate for detecting toxicity in other organswe exposed rats to weekly adriamycin treatment by IPinjection, at doses reported to lead to adriamycin-inducedcardiomyopathy. Clontech cDNA gene arrays were used tomeasure DGE in both the blood and hearts of treated andcontrol animals. Blood and tissues were sampled 4 hours af-ter the initial dose and 24 hours after dosing on days 1, 8,and 38. At the end of the 38-day period there was clearhistopathologic evidence of adriamycin-induced cardiomy-opathy. Genes differentially expressed on days 1 and 8 inboth the blood and heart consistently pointed to known mech-anisms of adriamycin-induced toxicity. Beginning on day 8there were key gene divergences between the heart and bloodthat may indicate the point at which the heart is committedto a cardiomyopathic state. Other sites of adriamycin toxicitywere also indicated by the specific gene patterns expressed.
MATERIALS AND METHODS
In Vivo MeasurementsFour-to-5-month-old male rats [Crl:WI(Glx/BRL/Han)
IGSBR] Taconic, Germantown, NY, USA] were housed onstainless steel wire mesh, suspension cages (1 per cage). An-imals were maintained at a temperature of 64–79◦F, relativehumidity of 30–70%, 12 hours light/dark cycle, 10–15 roomair changes per hour, and were fed ad libitum Certified Ro-dent Diet 5002 pellets (PMI Feeds) and reverse osmosis/UVlight-treated water. All animals were observed at least twicedaily for mortality and moribundity. Clinical observationswere recorded at least twice daily for all animals duringthe treatment period of the study. All experiments were per-formed using protocols approved by the GlaxoSmithKlineInstitutional Animal Care and Use Committee. A brief sum-mary of the study design and dosing schedule is presented inTable 1.
Three rats per group were injected intraperitoneallywith adriamycin hydrochloride (adriamycin PFS, PharmaciaUpJohn) at a dose of 4.0 mg/kg/week (considered to approx-imate a toxic but therapeutic dose) or 15.0 mg/kg as a singledose (acutely toxic and producing cardiomyopathy as a frac-tionated dose) on day 1. A third set of 5 animals per group re-ceived a second intraperitoneal injection at 4.0 mg/kg 1 weekafter the first injection. The remaining treated group of 5 ani-
TABLE 1.—Study design.
Dosage of adriamycin Interval between Number of injections Duration of exposureHCl (IP) Number of rats injections (total dose received) before euthanasia Clontech array (no of arrays)
Saline control∗ 3 — 1 (0) 4 h ToxII array #7732-1 (3)4 mg/kg∗ 3 — 1(∼1.2 mg) 4 h ToxII array #7732-1 (3)15 mg/kg∗ 3 — 1(∼4.5 mg) 4 h ToxII array #7732-1 (3)Saline control∗ 3 — 1 (0) 24 h ToxII array #7732-1 (3)4 mg/kg∗ 3 — 1(∼1.2 mg) 24 h ToxII array #7732-1 (3)15 mg/kg∗ 3 — 1(∼4.5 mg) 24 h ToxII array #7732-1 (3)Saline control∗∗ 5 1 week 2 (0) 8 days ToxII array #7732-1 (3)4 mg/kg∗∗ 5 1 week 2 (∼2.4 mg) 8 days ToxII array #7732-1 (3)Saline control∗∗∗ 5 1 week 4 (0) 38 days Stress array #7735-1 (2)
CDNA expression array #7738-1 (2)4 mg/kg∗∗∗ 5 1 week 4 (∼4.8 mg) 38 days Stress array #7735-1 (2)
CDNA expression array #7738-1 (2)∗A single dose on day 1 at the dose indicated (either 4 or 15 mg/kg) and blood and tissue collection at the time indicated.∗∗A single 4-mg/kg dose (or 0 mg/kg for controls) on day 1 followed by a second 4-mg/kg dose (or 0 mg/kg for controls) on day 7 and blood and tissue collection collection 24 hours
later.∗∗∗Weekly dosing of 4 mg/kg (or 0 mg/kg for controls) for a total of 4 doses with dosing being interrupted during week 3 due to the poor condition of the animals.
mals per group received weekly injections of 4 mg/kg for upto 4 total doses (4.8 mg total dose-euthanasia at 38 days).Control animals were injected with saline adjusted to the pHof the adriamycin solution. The intraperitoneal route of ad-ministration on a once-per-week basis was chosen based onreports by Doroshow et al (3) as to the rapid time course ofheart failure by this method. Sampling times of 24 hours,8 days, and 38 days were based on these same reports andefforts to sample early, intermediate, and late changes in geneexpression. Body weights were taken on 3 occasions prior toinitiation of treatment and were used in conjunction withserum insulin and glucose levels to assign animals to equalgroups. Body weights were then taken on a weekly basisand at the termination of the study. Food consumption wasmeasured 1 week prior to initiation and at weekly intervalsthereafter.
Urinalysis was performed at a single time point duringweek 3 on all animals from the 38-day time point study.For urine collection, animals were placed in individual urinecollection cages for approximately 16 hours and were sup-plied with water but not food. Samples were analyzed usingthe Yellow IRIS (International Remote Imaging Systems,Chatsworth, CA) for quantity, color, appearance, specificgravity, pH, protein, glucose, ketone, blood, nitrite, urobilino-gen, leukocytes, erythrocytes, bacteria, epithelial cells, casts,crystals, sodium, potassium, creatine, creatinine, calcium,and chloride. Urine bilirubin was measured with Ictotest-Reagent tablets (Miles Laboratories).
Postmortem Evaluations and HistopathologyFive animals per group were euthanized with carbon diox-
ide either at 4 or 24 hours after dosing for both the 4.0-and the 15-mg/kg-dosed animals. Animals that received thesecond 4 mg/kg dose after 7 days were euthanized 24 hourslater. Animals that received the third dose were euthanized onday 38.
Blood for hematology and chemistry measurements wascollected at terminal necropsies on days 2, 8, and 38. Stan-dard hematology measurements were taken on a TechniconH1 analyzer using laser optics and cytochemical stainingand included total leukocyte counts, total erythrocyte counts,hematocrit, hemoglobin, platelet counts, and differential
at PENNSYLVANIA STATE UNIV on February 21, 2013tpx.sagepub.comDownloaded from
P1: GTJ/HAK P2: GTJ/HAK Tally: GTJ/HAK QC: GTJ/HAK T1: GTJ
July 13, 2002 14:48 TJ357-05(TXP) TJ501-03
454 BROWN ET AL TOXICOLOGIC PATHOLOGY
leukocyte counts (neutrophils, lymphocytes, and mono-cytes). Reticulocyte counts were performed on a SysmexR3000, semiautomated reticulocyte analyzer. Routine serumchemistries were performed on a BMC/Hitachi 911 in-strument using standard reagents and protocols andincluded albumin, alkaline phosphatase, alanine aminotrans-ferase (ALT), aspartate aminotransferase (AST), total biliru-bin (direct and indirect bilirubin was determined if totalbilirubin was≥1.2 mg/dL), blood urea nitrogen, cholesterol,triglycerides, total protein, calcium, glucose, total bile acids,phosphorus, sodium, potassium, chloride, globulin (calcu-lated), and albumin/globulin ratio (calculated) (A/G Ratio).Insulin levels were determined using an ELISA Assay fromMecordia AB, Uppsala, Sweden according to the manufac-turer’s instructions.
All animals received complete postmortem examinationsand the following tissues were collected for histopathologicevaluation: heart, liver, blood, kidney, ileum, colon, cecum,bone marrow (sternum and femur), and gross abnormalities.
Upon removal of the heart and after heart weights wereobtained, midventricular transverse sections were taken andfixed in 10% neutral buffered formalin for routine histologicprocessing, and paraffin embedding and staining with hema-toxylin and eosin. The remainder of the heart was snap frozenin liquid nitrogen for Total RNA isolation.
Blood Sample RNA IsolationBlood samples for gene analysis were collected at 4 and
24 hours and 8 days (24 hours after the second dose) forthe 4-mg/kg/wk dose and at 4 hours and 24 hours for the15-mg/kg dose group. In each case, 2 ml of whole blood werecollected directly into 3 ml of Trizol Reagent. Total RNAwas isolated by chloroform extraction and isopropanol andethanol precipitation and samples were suspended in RNase-free water and frozen at−80◦C.
Heart Sample RNA IsolationSnap-frozen hearts were placed directly into Trizol
Reagent and homogenized using a Polytron model PCU11.Total RNA was isolated by chloroform extraction and iso-propanol and ethanol precipitation and samples were sus-pended in RNase-free water and frozen at−80◦C.
cDNA Array HybridizationClontech Rat Toxicology II arrays were used to evaluate
differential gene expression for all but the 38-day time point.For the 38-day time point, Clontech Rat AtlasTM cDNA Ex-pression and Stress Arrays were used. Each of these cDNAarrays use plasmid and bacteriophage DNAs as negative con-trols and have several housekeeping genes as positive con-trols for normalization, although a global method of nor-malization was used in this experiment. Details of the genecomposition of each of the arrays used can be found at〈www.atlasinfo.clontech.com〉. A brief summary of each ar-ray is listed below:
Gene array Catalog number Number of genes on the array
Rat Tox II 7732-1 465Rat Stress 7735-1 207Rat cDNA expression 7738-1 588
In all cases, total RNA was evaluated for degradationby electrophoresis through a formaldehyde containing 1%agarose gel with ethidium bromide staining prior to use.Five micrograms of total RNA from 3 treated and 3 controlhearts and blood samples were used for generating33P la-beled probes by reverse transcription. Probes were hybridizedovernight at 62◦C using Microhyb buffer (Research Genet-ics). After stringent washes, filters were placed on a PackardCyclone Phosphor Image Scanner and scanned images savedas TIFF files. TIFF files were aligned using Clontech AtlasImage 1.5 or 2.0 software.
Statistical Analysis of Gene ArraysFollowing global background subtraction by Atlas Im-
age software, adjusted intensities were normalized and sta-tistically evaluated by a custom analysis software programwritten expressly for gene expression analysis called NLR[Normalization and Local Regression] (4). NLR was used tocompare control with treated groups (n= 3/group), generatep-values, an indication of signal intensity (MLI, mean logintensity), and ratios of differences between groups. Selectedgene expression changes were examined for confirmation ofthe direction and degree of change using RT-PCR (Taqman)based on the signal intensity and fold changes and on corre-lation with reported mechanisms of toxicity.
Taqman Real-Time Quantitative RT-PCRQuantification of mRNA was carried out using Molecular
Probes’ Ribogreen RNA Quantification kit. To prevent ampli-fication of genomic DNA sequences, all RNA samples weretreated with DNase I and diluted to 10 ng/µl. Taqman probeswere labeled with FAM (carboxyfluorescein) as the reporterdye on the 5′ position and TAMRA (carboxytetramethylrho-damine) as the quencher dye on the 3′ position. cDNA wasmade using MMuLV (Moloney Murine Leukemia Virus). Allreactions were carried out in a single tube reaction setupon an ABI PRISM 7700 Sequence Detection System (Ap-plied Biosystems, Inc). The following temperature profilewas used: 30 minutes at 48◦C for RT, 10 minutes at 95◦Cfor RT inactivation and AmpliTaq Gold activation, 40 cy-cles of 15 seconds at 94◦C, and 1 minute at 60◦C. To checkfor possible contamination in the reaction mix, No TemplateControl (NTC) wells without RNA template were used. Thecycle threshold Ct (ie, 10 times the standard deviation ofthe mean baseline emmision calculated during PCR cycles3 to 15) was used to calculate relative amounts of targetRNA. The delta Ct method was used to calculate relativefold expression levels, as described by Applied Biosystems.Primers and probes were purchased from Keystone Biosource(Camarillo, CA). Final concentrations of all primers were at900 nM, probes were at 200 nM. Primer sequences are listedin Table 2.
RESULTS
HematologyThe hematologic profiles for the control and treated sam-
ples reported here are summarized in Table 3. The hemato-logic profile comparing the vehicle to the untreated controlindicates that the pH of the injectable adriamycin, has very
at PENNSYLVANIA STATE UNIV on February 21, 2013tpx.sagepub.comDownloaded from
P1: GTJ/HAK P2: GTJ/HAK Tally: GTJ/HAK QC: GTJ/HAK T1: GTJ
July 13, 2002 14:48 TJ357-05(TXP) TJ501-03
Vol. 30, No. 4, 2002 ADRIAMYCIN-INDUCED CARDIOMYOPATHY IN THE RAT 455
TABLE 2.—Sequences of the primers and probes.
Gene Forward primer Reverse primer Probe
Cyclin D1 CCCACGATTTCATCGAACACT TGTGCATGTTTGCGGATGAT FAM-AAAATGCCAGAGGCGGATGAGAACAA-TAMRAGADD45 GCTGGCTGCGGATGAAGAT CACGAATGAGGGTGAAATGGA FAM-ACGACCGGGACGTGGCTCTGC-TAMRAGPX GTGTTCCAGTGCGCAGATACA GCAGGGCTTCTATATCGGGTT FAM-CAGGCGCTTTCGCACCATCGAC-TAMRAHO-1 GAAGGGCTGCCCTAGAGCA GGATGAGTACCTCCCACCTCG FAM-CACACCAGCCACACAGCACTACGTAAAGC-TAMRAHSP70 ACCATCCCCACCAAGCAGA CCTCGTACACCTGGATCAGCA FAM-CTTCACCACCTACTCGGACAACCAGCC-TAMRAPTGS1 TTCCAGTATCGCAACCGCA AGGAATCAGGCATGAACGGAT FAM-CGCCATGGAATTCAACCACCTCTATCAC-TAMRANMOR ATCCGCCCCCAACTTCTG CTCTCTGCGTGGGCCAATAC FAM-CATGGCGGTGAGAAGAGCCCTGA-TAMRAMDR1 CCACGATTGCCGAAAACATT CATTGGCTTCCTTGACAGCTT FAM-TGGCCGAGAAAACGTCACCATGGAT-TAMRAWAF1 GTTCCGCACAGGAGCAAAG CGGCTCAACTGCTCACTGTC FAM-ATGCCGTCGTCTGTTCGGTCCC-TAMRA
little effect as compared to the variability between animals, atthe 4- and 24-hour time points. In general, significant and doserelated decreases in lymphocytes were noted at the 4-hour,24-hour, and 8-day sampling periods, both as a result of theinevitable stress associated with administration of the drugand as a result of its lymphocyotoxic effects. Because lym-phocytes make up the most significant fraction of nucleatedwhite blood cells, the drop in lymphocyte number may haveinfluenced what was perceived as a downregulation of manyblood genes. Reticulocyte counts tended to be depressed atthe 15-mg/kg dose at 24 hours and to decrease with time at the4-mg/kg dose. There was no effect on hematocrit and no indi-cation of dehydration at the 4- and 24-hour time points, yet asignificant decline in hematocrit occurred by day 38. Plateletcounts did not fall in response to treatment. There were oc-casional immediate increases in neutrophils and monocytesin response to the necrotizing effects of ip injection of adri-amycin. At the 15-mg/kg dose at 24 hours, there was verylittle difference in neutrophils and monocytes as comparedto the vehicle control.
Clinical ChemistryClinical chemistry findings are presented in Table 4. There
were few significant changes in the clinical pathology param-eters measured at either the 4- or 24-hour sampling points atthe 15-mg/kg dose. There were changes in AST at all timepoints that suggested probable subperitoneal muscle damageat the site of injection (not discussed in this paper but noted byhistopathology), but these were not statistically significant.
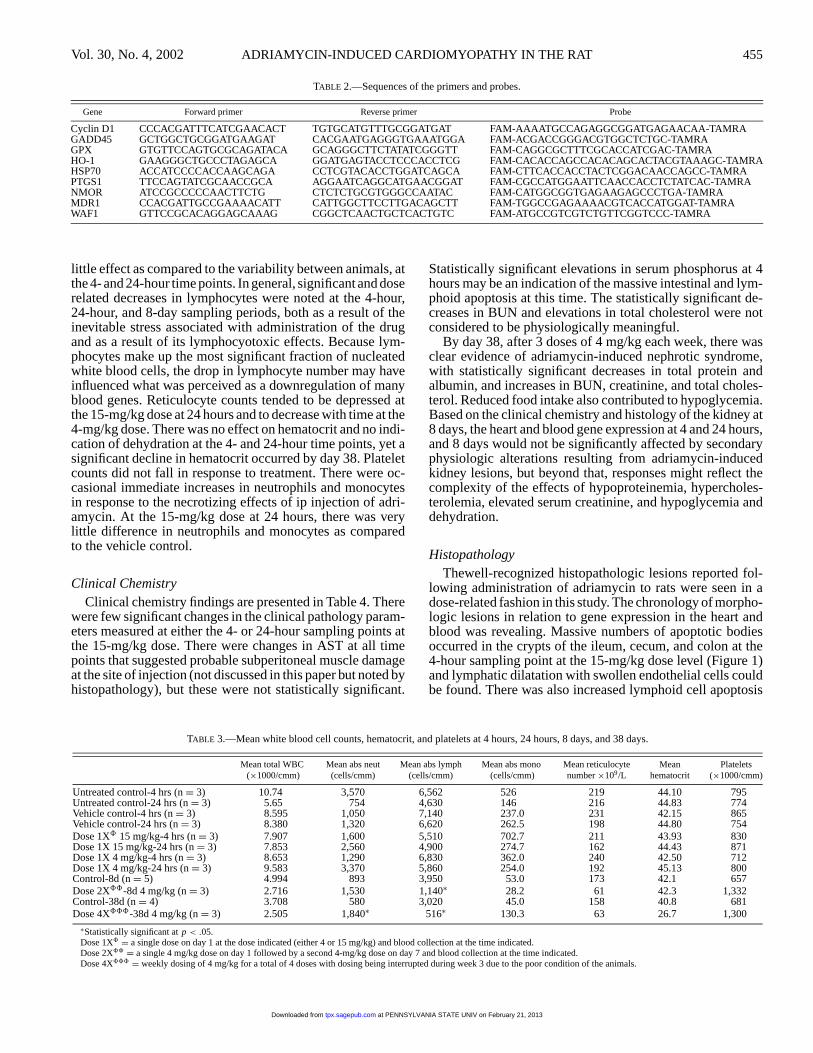
TABLE 3.—Mean white blood cell counts, hematocrit, and platelets at 4 hours, 24 hours, 8 days, and 38 days.
Mean total WBC Mean abs neut Mean abs lymph Mean abs mono Mean reticulocyte Mean Platelets(×1000/cmm) (cells/cmm) (cells/cmm) (cells/cmm) number×109/L hematocrit (×1000/cmm)
Untreated control-4 hrs (n= 3) 10.74 3,570 6,562 526 219 44.10 795Untreated control-24 hrs (n= 3) 5.65 754 4,630 146 216 44.83 774Vehicle control-4 hrs (n= 3) 8.595 1,050 7,140 237.0 231 42.15 865Vehicle control-24 hrs (n= 3) 8.380 1,320 6,620 262.5 198 44.80 754Dose 1X8 15 mg/kg-4 hrs (n= 3) 7.907 1,600 5,510 702.7 211 43.93 830Dose 1X 15 mg/kg-24 hrs (n= 3) 7.853 2,560 4,900 274.7 162 44.43 871Dose 1X 4 mg/kg-4 hrs (n= 3) 8.653 1,290 6,830 362.0 240 42.50 712Dose 1X 4 mg/kg-24 hrs (n= 3) 9.583 3,370 5,860 254.0 192 45.13 800Control-8d (n= 5) 4.994 893 3,950 53.0 173 42.1 657Dose 2X88-8d 4 mg/kg (n= 3) 2.716 1,530 1,140∗ 28.2 61 42.3 1,332Control-38d (n= 4) 3.708 580 3,020 45.0 158 40.8 681Dose 4X888-38d 4 mg/kg (n= 3) 2.505 1,840∗ 516∗ 130.3 63 26.7 1,300∗Statistically significant atp < .05.Dose 1X8 = a single dose on day 1 at the dose indicated (either 4 or 15 mg/kg) and blood collection at the time indicated.Dose 2X88 = a single 4 mg/kg dose on day 1 followed by a second 4-mg/kg dose on day 7 and blood collection at the time indicated.Dose 4X888 = weekly dosing of 4 mg/kg for a total of 4 doses with dosing being interrupted during week 3 due to the poor condition of the animals.
Statistically significant elevations in serum phosphorus at 4hours may be an indication of the massive intestinal and lym-phoid apoptosis at this time. The statistically significant de-creases in BUN and elevations in total cholesterol were notconsidered to be physiologically meaningful.
By day 38, after 3 doses of 4 mg/kg each week, there wasclear evidence of adriamycin-induced nephrotic syndrome,with statistically significant decreases in total protein andalbumin, and increases in BUN, creatinine, and total choles-terol. Reduced food intake also contributed to hypoglycemia.Based on the clinical chemistry and histology of the kidney at8 days, the heart and blood gene expression at 4 and 24 hours,and 8 days would not be significantly affected by secondaryphysiologic alterations resulting from adriamycin-inducedkidney lesions, but beyond that, responses might reflect thecomplexity of the effects of hypoproteinemia, hypercholes-terolemia, elevated serum creatinine, and hypoglycemia anddehydration.
HistopathologyThewell-recognized histopathologic lesions reported fol-
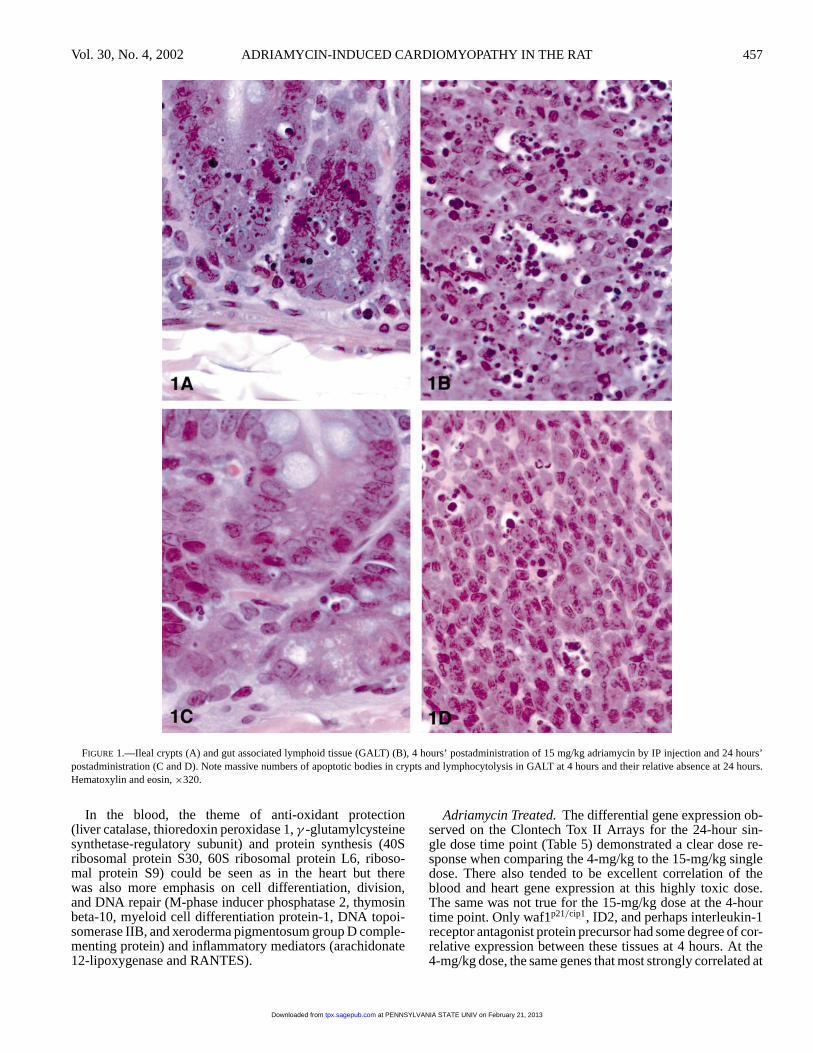
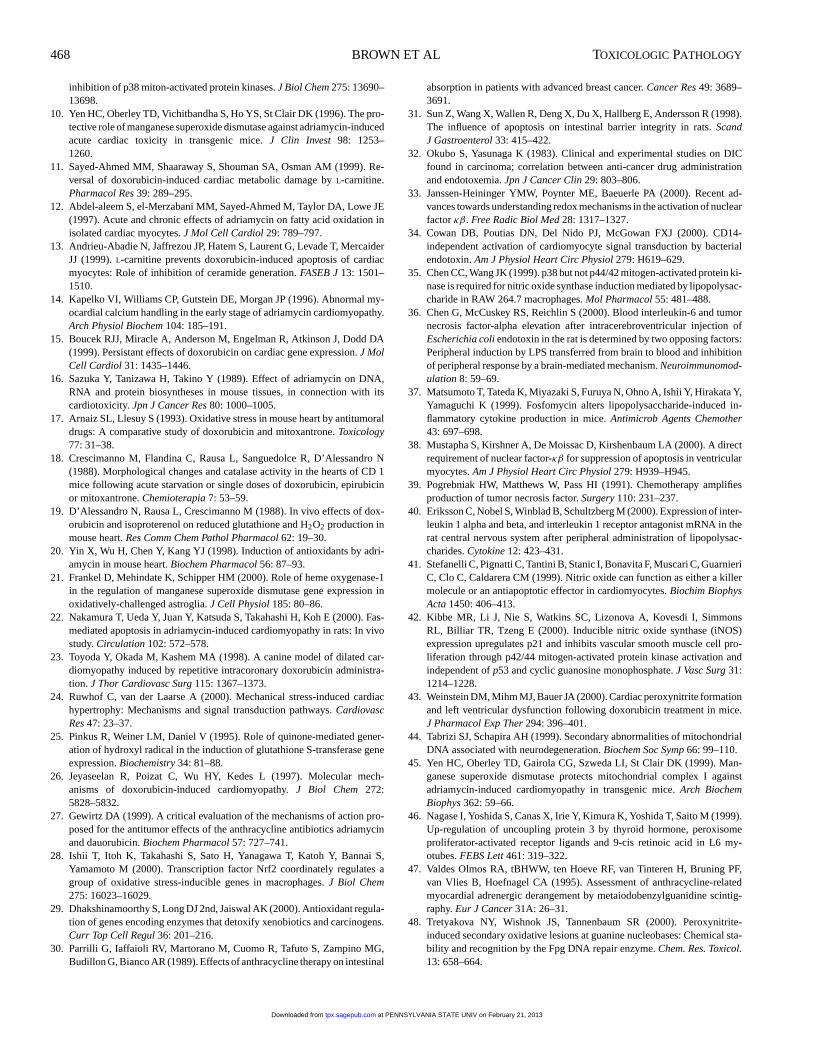
lowing administration of adriamycin to rats were seen in adose-related fashion in this study. The chronology of morpho-logic lesions in relation to gene expression in the heart andblood was revealing. Massive numbers of apoptotic bodiesoccurred in the crypts of the ileum, cecum, and colon at the4-hour sampling point at the 15-mg/kg dose level (Figure 1)and lymphatic dilatation with swollen endothelial cells couldbe found. There was also increased lymphoid cell apoptosis
at PENNSYLVANIA STATE UNIV on February 21, 2013tpx.sagepub.comDownloaded from
P1: GTJ/HAK P2: GTJ/HAK Tally: GTJ/HAK QC: GTJ/HAK T1: GTJ
July 13, 2002 14:48 TJ357-05(TXP) TJ501-03
456 BROWN ET AL TOXICOLOGIC PATHOLOGY
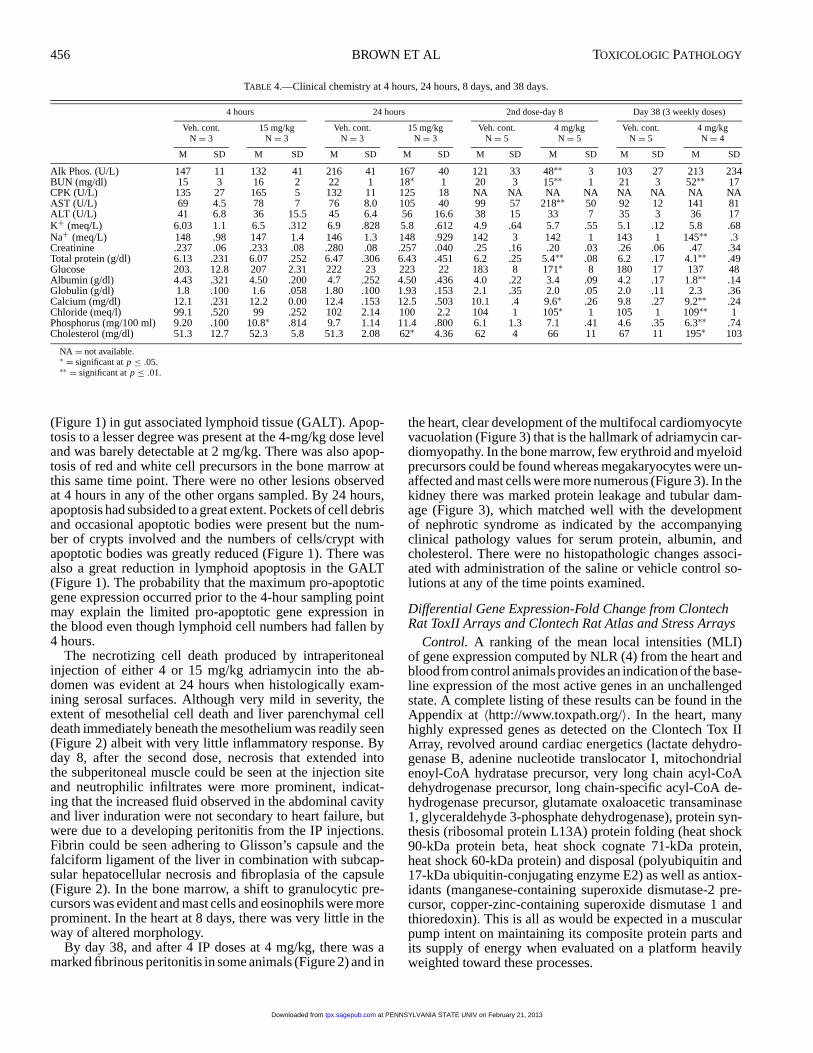
TABLE 4.—Clinical chemistry at 4 hours, 24 hours, 8 days, and 38 days.
4 hours 24 hours 2nd dose-day 8 Day 38 (3 weekly doses)
Veh. cont. 15 mg/kg Veh. cont. 15 mg/kg Veh. cont. 4 mg/kg Veh. cont. 4 mg/kgN = 3 N= 3 N= 3 N= 3 N= 5 N= 5 N= 5 N= 4
M SD M SD M SD M SD M SD M SD M SD M SD
Alk Phos. (U/L) 147 11 132 41 216 41 167 40 121 33 48∗∗ 3 103 27 213 234BUN (mg/dl) 15 3 16 2 22 1 18∗ 1 20 3 15∗∗ 1 21 3 52∗∗ 17CPK (U/L) 135 27 165 5 132 11 125 18 NA NA NA NA NA NA NA NAAST (U/L) 69 4.5 78 7 76 8.0 105 40 99 57 218∗∗ 50 92 12 141 81ALT (U/L) 41 6.8 36 15.5 45 6.4 56 16.6 38 15 33 7 35 3 36 17K+ (meq/L) 6.03 1.1 6.5 .312 6.9 .828 5.8 .612 4.9 .64 5.7 .55 5.1 .12 5.8 .68Na+ (meq/L) 148 .98 147 1.4 146 1.3 148 .929 142 3 142 1 143 1 145∗∗ .3Creatinine .237 .06 .233 .08 .280 .08 .257 .040 .25 .16 .20 .03 .26 .06 .47 .34Total protein (g/dl) 6.13 .231 6.07 .252 6.47 .306 6.43 .451 6.2 .25 5.4∗∗ .08 6.2 .17 4.1∗∗ .49Glucose 203. 12.8 207 2.31 222 23 223 22 183 8 171∗ 8 180 17 137 48Albumin (g/dl) 4.43 .321 4.50 .200 4.7 .252 4.50 .436 4.0 .22 3.4 .09 4.2 .17 1.8∗∗ .14Globulin (g/dl) 1.8 .100 1.6 .058 1.80 .100 1.93 .153 2.1 .35 2.0 .05 2.0 .11 2.3 .36Calcium (mg/dl) 12.1 .231 12.2 0.00 12.4 .153 12.5 .503 10.1 .4 9.6∗ .26 9.8 .27 9.2∗∗ .24Chloride (meq/l) 99.1 .520 99 .252 102 2.14 100 2.2 104 1 105∗ 1 105 1 109∗∗ 1Phosphorus (mg/100 ml) 9.20 .100 10.8∗ .814 9.7 1.14 11.4 .800 6.1 1.3 7.1 .41 4.6 .35 6.3∗∗ .74Cholesterol (mg/dl) 51.3 12.7 52.3 5.8 51.3 2.08 62∗ 4.36 62 4 66 11 67 11 195∗ 103
NA = not available.∗ = significant atp ≤ .05.∗∗ = significant atp ≤ .01.
(Figure 1) in gut associated lymphoid tissue (GALT). Apop-tosis to a lesser degree was present at the 4-mg/kg dose leveland was barely detectable at 2 mg/kg. There was also apop-tosis of red and white cell precursors in the bone marrow atthis same time point. There were no other lesions observedat 4 hours in any of the other organs sampled. By 24 hours,apoptosis had subsided to a great extent. Pockets of cell debrisand occasional apoptotic bodies were present but the num-ber of crypts involved and the numbers of cells/crypt withapoptotic bodies was greatly reduced (Figure 1). There wasalso a great reduction in lymphoid apoptosis in the GALT(Figure 1). The probability that the maximum pro-apoptoticgene expression occurred prior to the 4-hour sampling pointmay explain the limited pro-apoptotic gene expression inthe blood even though lymphoid cell numbers had fallen by4 hours.
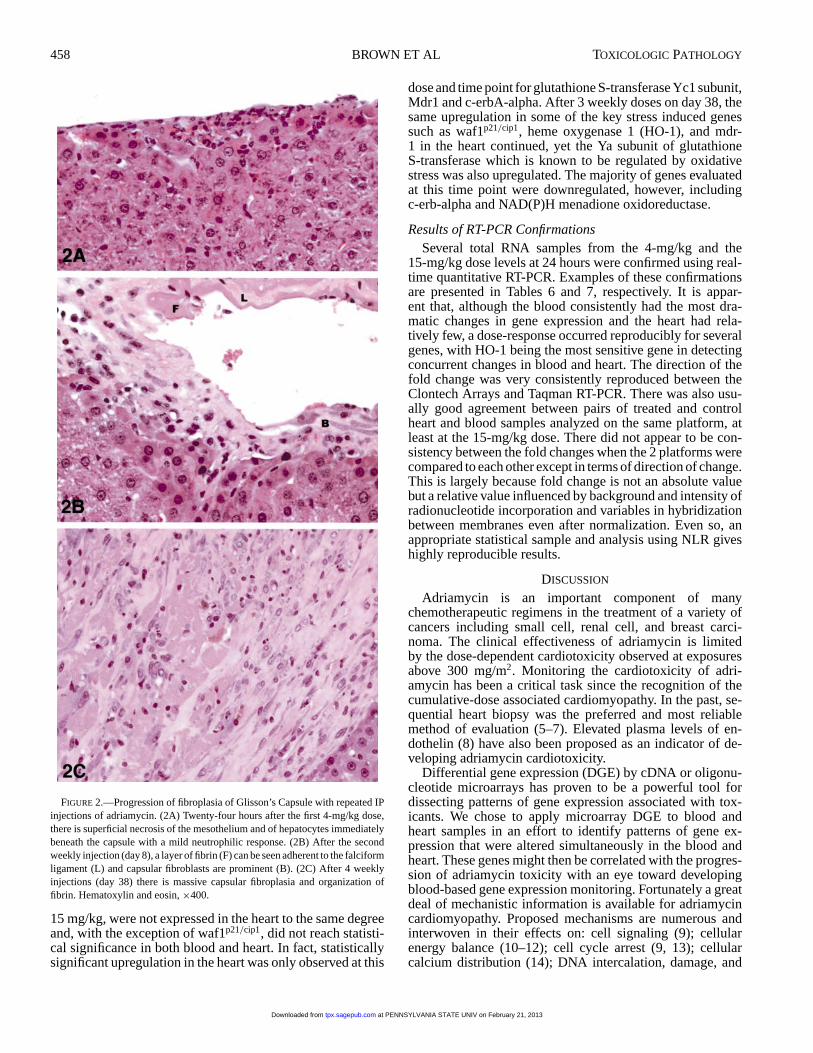
The necrotizing cell death produced by intraperitonealinjection of either 4 or 15 mg/kg adriamycin into the ab-domen was evident at 24 hours when histologically exam-ining serosal surfaces. Although very mild in severity, theextent of mesothelial cell death and liver parenchymal celldeath immediately beneath the mesothelium was readily seen(Figure 2) albeit with very little inflammatory response. Byday 8, after the second dose, necrosis that extended intothe subperitoneal muscle could be seen at the injection siteand neutrophilic infiltrates were more prominent, indicat-ing that the increased fluid observed in the abdominal cavityand liver induration were not secondary to heart failure, butwere due to a developing peritonitis from the IP injections.Fibrin could be seen adhering to Glisson’s capsule and thefalciform ligament of the liver in combination with subcap-sular hepatocellular necrosis and fibroplasia of the capsule(Figure 2). In the bone marrow, a shift to granulocytic pre-cursors was evident and mast cells and eosinophils were moreprominent. In the heart at 8 days, there was very little in theway of altered morphology.
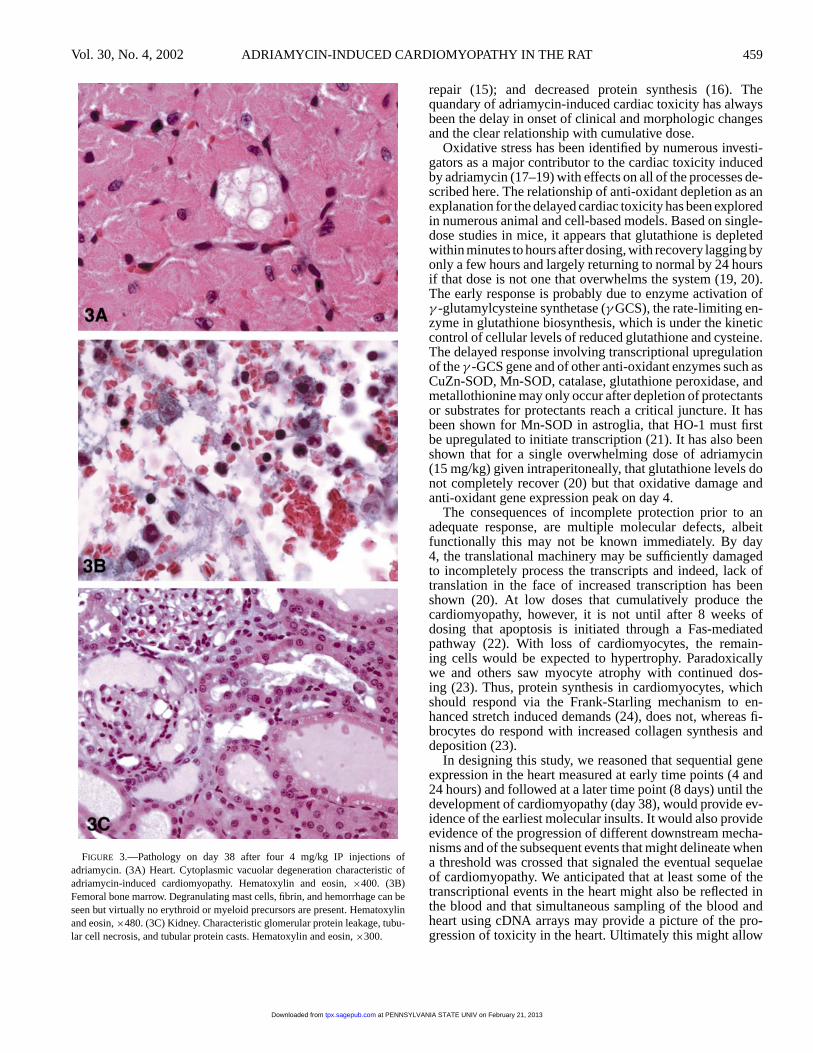
By day 38, and after 4 IP doses at 4 mg/kg, there was amarked fibrinous peritonitis in some animals (Figure 2) and in
the heart, clear development of the multifocal cardiomyocytevacuolation (Figure 3) that is the hallmark of adriamycin car-diomyopathy. In the bone marrow, few erythroid and myeloidprecursors could be found whereas megakaryocytes were un-affected and mast cells were more numerous (Figure 3). In thekidney there was marked protein leakage and tubular dam-age (Figure 3), which matched well with the developmentof nephrotic syndrome as indicated by the accompanyingclinical pathology values for serum protein, albumin, andcholesterol. There were no histopathologic changes associ-ated with administration of the saline or vehicle control so-lutions at any of the time points examined.
Differential Gene Expression-Fold Change from ClontechRat ToxII Arrays and Clontech Rat Atlas and Stress Arrays
Control. A ranking of the mean local intensities (MLI)of gene expression computed by NLR (4) from the heart andblood from control animals provides an indication of the base-line expression of the most active genes in an unchallengedstate. A complete listing of these results can be found in theAppendix at〈http://www.toxpath.org/〉. In the heart, manyhighly expressed genes as detected on the Clontech Tox IIArray, revolved around cardiac energetics (lactate dehydro-genase B, adenine nucleotide translocator I, mitochondrialenoyl-CoA hydratase precursor, very long chain acyl-CoAdehydrogenase precursor, long chain-specific acyl-CoA de-hydrogenase precursor, glutamate oxaloacetic transaminase1, glyceraldehyde 3-phosphate dehydrogenase), protein syn-thesis (ribosomal protein L13A) protein folding (heat shock90-kDa protein beta, heat shock cognate 71-kDa protein,heat shock 60-kDa protein) and disposal (polyubiquitin and17-kDa ubiquitin-conjugating enzyme E2) as well as antiox-idants (manganese-containing superoxide dismutase-2 pre-cursor, copper-zinc-containing superoxide dismutase 1 andthioredoxin). This is all as would be expected in a muscularpump intent on maintaining its composite protein parts andits supply of energy when evaluated on a platform heavilyweighted toward these processes.
at PENNSYLVANIA STATE UNIV on February 21, 2013tpx.sagepub.comDownloaded from
P1: GTJ/HAK P2: GTJ/HAK Tally: GTJ/HAK QC: GTJ/HAK T1: GTJ
July 13, 2002 14:48 TJ357-05(TXP) TJ501-03
Vol. 30, No. 4, 2002 ADRIAMYCIN-INDUCED CARDIOMYOPATHY IN THE RAT 457
FIGURE 1.—Ileal crypts (A) and gut associated lymphoid tissue (GALT) (B), 4 hours’ postadministration of 15 mg/kg adriamycin by IP injection and 24 hours’postadministration (C and D). Note massive numbers of apoptotic bodies in crypts and lymphocytolysis in GALT at 4 hours and their relative absence at 24 hours.Hematoxylin and eosin,×320.
In the blood, the theme of anti-oxidant protection(liver catalase, thioredoxin peroxidase 1,γ -glutamylcysteinesynthetase-regulatory subunit) and protein synthesis (40Sribosomal protein S30, 60S ribosomal protein L6, riboso-mal protein S9) could be seen as in the heart but therewas also more emphasis on cell differentiation, division,and DNA repair (M-phase inducer phosphatase 2, thymosinbeta-10, myeloid cell differentiation protein-1, DNA topoi-somerase IIB, and xeroderma pigmentosum group D comple-menting protein) and inflammatory mediators (arachidonate12-lipoxygenase and RANTES).
Adriamycin Treated.The differential gene expression ob-served on the Clontech Tox II Arrays for the 24-hour sin-gle dose time point (Table 5) demonstrated a clear dose re-sponse when comparing the 4-mg/kg to the 15-mg/kg singledose. There also tended to be excellent correlation of theblood and heart gene expression at this highly toxic dose.The same was not true for the 15-mg/kg dose at the 4-hourtime point. Only waf1p21/cip1, ID2, and perhaps interleukin-1receptor antagonist protein precursor had some degree of cor-relative expression between these tissues at 4 hours. At the4-mg/kg dose, the same genes that most strongly correlated at
at PENNSYLVANIA STATE UNIV on February 21, 2013tpx.sagepub.comDownloaded from
P1: GTJ/HAK P2: GTJ/HAK Tally: GTJ/HAK QC: GTJ/HAK T1: GTJ
July 13, 2002 14:48 TJ357-05(TXP) TJ501-03
458 BROWN ET AL TOXICOLOGIC PATHOLOGY
FIGURE 2.—Progression of fibroplasia of Glisson’s Capsule with repeated IPinjections of adriamycin. (2A) Twenty-four hours after the first 4-mg/kg dose,there is superficial necrosis of the mesothelium and of hepatocytes immediatelybeneath the capsule with a mild neutrophilic response. (2B) After the secondweekly injection (day 8), a layer of fibrin (F) can be seen adherent to the falciformligament (L) and capsular fibroblasts are prominent (B). (2C) After 4 weeklyinjections (day 38) there is massive capsular fibroplasia and organization offibrin. Hematoxylin and eosin,×400.
15 mg/kg, were not expressed in the heart to the same degreeand, with the exception of waf1p21/cip1, did not reach statisti-cal significance in both blood and heart. In fact, statisticallysignificant upregulation in the heart was only observed at this
dose and time point for glutathione S-transferase Yc1 subunit,Mdr1 and c-erbA-alpha. After 3 weekly doses on day 38, thesame upregulation in some of the key stress induced genessuch as waf1p21/cip1, heme oxygenase 1 (HO-1), and mdr-1 in the heart continued, yet the Ya subunit of glutathioneS-transferase which is known to be regulated by oxidativestress was also upregulated. The majority of genes evaluatedat this time point were downregulated, however, includingc-erb-alpha and NAD(P)H menadione oxidoreductase.
Results of RT-PCR ConfirmationsSeveral total RNA samples from the 4-mg/kg and the
15-mg/kg dose levels at 24 hours were confirmed using real-time quantitative RT-PCR. Examples of these confirmationsare presented in Tables 6 and 7, respectively. It is appar-ent that, although the blood consistently had the most dra-matic changes in gene expression and the heart had rela-tively few, a dose-response occurred reproducibly for severalgenes, with HO-1 being the most sensitive gene in detectingconcurrent changes in blood and heart. The direction of thefold change was very consistently reproduced between theClontech Arrays and Taqman RT-PCR. There was also usu-ally good agreement between pairs of treated and controlheart and blood samples analyzed on the same platform, atleast at the 15-mg/kg dose. There did not appear to be con-sistency between the fold changes when the 2 platforms werecompared to each other except in terms of direction of change.This is largely because fold change is not an absolute valuebut a relative value influenced by background and intensity ofradionucleotide incorporation and variables in hybridizationbetween membranes even after normalization. Even so, anappropriate statistical sample and analysis using NLR giveshighly reproducible results.
DISCUSSION
Adriamycin is an important component of manychemotherapeutic regimens in the treatment of a variety ofcancers including small cell, renal cell, and breast carci-noma. The clinical effectiveness of adriamycin is limitedby the dose-dependent cardiotoxicity observed at exposuresabove 300 mg/m2. Monitoring the cardiotoxicity of adri-amycin has been a critical task since the recognition of thecumulative-dose associated cardiomyopathy. In the past, se-quential heart biopsy was the preferred and most reliablemethod of evaluation (5–7). Elevated plasma levels of en-dothelin (8) have also been proposed as an indicator of de-veloping adriamycin cardiotoxicity.
Differential gene expression (DGE) by cDNA or oligonu-cleotide microarrays has proven to be a powerful tool fordissecting patterns of gene expression associated with tox-icants. We chose to apply microarray DGE to blood andheart samples in an effort to identify patterns of gene ex-pression that were altered simultaneously in the blood andheart. These genes might then be correlated with the progres-sion of adriamycin toxicity with an eye toward developingblood-based gene expression monitoring. Fortunately a greatdeal of mechanistic information is available for adriamycincardiomyopathy. Proposed mechanisms are numerous andinterwoven in their effects on: cell signaling (9); cellularenergy balance (10–12); cell cycle arrest (9, 13); cellularcalcium distribution (14); DNA intercalation, damage, and
at PENNSYLVANIA STATE UNIV on February 21, 2013tpx.sagepub.comDownloaded from
P1: GTJ/HAK P2: GTJ/HAK Tally: GTJ/HAK QC: GTJ/HAK T1: GTJ
July 13, 2002 14:48 TJ357-05(TXP) TJ501-03
Vol. 30, No. 4, 2002 ADRIAMYCIN-INDUCED CARDIOMYOPATHY IN THE RAT 459
FIGURE 3.—Pathology on day 38 after four 4 mg/kg IP injections ofadriamycin. (3A) Heart. Cytoplasmic vacuolar degeneration characteristic ofadriamycin-induced cardiomyopathy. Hematoxylin and eosin,×400. (3B)Femoral bone marrow. Degranulating mast cells, fibrin, and hemorrhage can beseen but virtually no erythroid or myeloid precursors are present. Hematoxylinand eosin,×480. (3C) Kidney. Characteristic glomerular protein leakage, tubu-lar cell necrosis, and tubular protein casts. Hematoxylin and eosin,×300.
repair (15); and decreased protein synthesis (16). Thequandary of adriamycin-induced cardiac toxicity has alwaysbeen the delay in onset of clinical and morphologic changesand the clear relationship with cumulative dose.
Oxidative stress has been identified by numerous investi-gators as a major contributor to the cardiac toxicity inducedby adriamycin (17–19) with effects on all of the processes de-scribed here. The relationship of anti-oxidant depletion as anexplanation for the delayed cardiac toxicity has been exploredin numerous animal and cell-based models. Based on single-dose studies in mice, it appears that glutathione is depletedwithin minutes to hours after dosing, with recovery lagging byonly a few hours and largely returning to normal by 24 hoursif that dose is not one that overwhelms the system (19, 20).The early response is probably due to enzyme activation ofγ -glutamylcysteine synthetase (γGCS), the rate-limiting en-zyme in glutathione biosynthesis, which is under the kineticcontrol of cellular levels of reduced glutathione and cysteine.The delayed response involving transcriptional upregulationof theγ -GCS gene and of other anti-oxidant enzymes such asCuZn-SOD, Mn-SOD, catalase, glutathione peroxidase, andmetallothionine may only occur after depletion of protectantsor substrates for protectants reach a critical juncture. It hasbeen shown for Mn-SOD in astroglia, that HO-1 must firstbe upregulated to initiate transcription (21). It has also beenshown that for a single overwhelming dose of adriamycin(15 mg/kg) given intraperitoneally, that glutathione levels donot completely recover (20) but that oxidative damage andanti-oxidant gene expression peak on day 4.
The consequences of incomplete protection prior to anadequate response, are multiple molecular defects, albeitfunctionally this may not be known immediately. By day4, the translational machinery may be sufficiently damagedto incompletely process the transcripts and indeed, lack oftranslation in the face of increased transcription has beenshown (20). At low doses that cumulatively produce thecardiomyopathy, however, it is not until after 8 weeks ofdosing that apoptosis is initiated through a Fas-mediatedpathway (22). With loss of cardiomyocytes, the remain-ing cells would be expected to hypertrophy. Paradoxicallywe and others saw myocyte atrophy with continued dos-ing (23). Thus, protein synthesis in cardiomyocytes, whichshould respond via the Frank-Starling mechanism to en-hanced stretch induced demands (24), does not, whereas fi-brocytes do respond with increased collagen synthesis anddeposition (23).
In designing this study, we reasoned that sequential geneexpression in the heart measured at early time points (4 and24 hours) and followed at a later time point (8 days) until thedevelopment of cardiomyopathy (day 38), would provide ev-idence of the earliest molecular insults. It would also provideevidence of the progression of different downstream mecha-nisms and of the subsequent events that might delineate whena threshold was crossed that signaled the eventual sequelaeof cardiomyopathy. We anticipated that at least some of thetranscriptional events in the heart might also be reflected inthe blood and that simultaneous sampling of the blood andheart using cDNA arrays may provide a picture of the pro-gression of toxicity in the heart. Ultimately this might allow
at PENNSYLVANIA STATE UNIV on February 21, 2013tpx.sagepub.comDownloaded from

P1: GTJ/HAK P2: GTJ/HAK Tally: GTJ/HAK QC: GTJ/HAK T1: GTJ
July 13, 2002 14:48 TJ357-05(TXP) TJ501-03
460 BROWN ET AL TOXICOLOGIC PATHOLOGY
TABLE 5.—Gene expression (fold change) in the heart and blood from 3 treated and 3 control animals as calculated by NLR from Clontech arrays or Taqman(where indicated).
4 h–1 dose 24 h–1 dose Day 8–2 doses 7 days apart
Gene IP dose Blood Heart Blood Heart Blood HeartDay 38–4 doses, at weekly
intervals heartε
P21(waf1p21/cip1) 4 mg/kg 2.5∗ 1.46∗ 2.7∗ 1.83∗ 1.98∗φ15 mg/kg 3.91∗ 4.48∗ 11.2∗φ 4.82∗φ
NAD(P)H oxido-reductase 4 mg/kg 2.67∗ 1.22 1.48 1.42 1.5φ8
15 mg/kg 1.45 1.32 3.59∗φ 2.95∗φHeme oxygenase I 4 mg/kg 2.31∗ 1.37 1.31 2.34∗ 17.6φ8
15 mg/kg 1.8∗ 1.04 3.61∗φ 2.6∗φMdr1 4 mg/kg 1.07 2.46∗ −1.199 4.77∗ 2.42∗φ
15 mg/kg −1.02 4.49∗ 1.8∗φ 16.6∗φMdm2 4 mg/kg 1.34 1.07 1.08 1.26 1.11
15 mg/kg 1.29 −1.07 2.32∗ 1.83∗Glutathione S-transferase 4 mg/kg −1.14 1.41∗ 2.77∗ 1.92∗ NA
Yc1 subunit 15 mg/kg −1.04 1.37 1.9∗ 6.52∗BTG2 4 mg/kg 1.23 1.19 −1.43 1.03 NA
15 mg/kg 1.02 2.52∗ 1.81∗ 1.52∗ID2 4 mg/kg 1.53 1.05 1.29 1.05 −1.86∗
15 mg/kg 1.53∗ 2.38∗ 1.92∗ 1.25MnSOD 4 mg/kg 2.44∗ −1.11 2.99∗ 1.05 1.1
15 mg/kg −1.06 1.17 4.48∗ 1.15iNOS 4 mg/kg 16.5∗ 1.16 −1.14 1.12 −1.18
15 mg/kg 1.76∗ −2.18∗ 10.9∗ 1.28Endothelin-converting enzyme 4 mg/kg 2.06∗ 1.04 1.16 1.18 1.43
15 mg/kg 1.67∗ 1.15 1.8∗ −1.00c-erb-alpha 4 mg/kg −1.13 1.32 1.32 4.69∗ −1.26
15 mg/kg −1.05 −1.39 1.47 2.73∗Microsomal GST 4 mg/kg 2.42 1.31 1.78∗ 1.73∗ 1.62
15 mg/kg 2.59∗ −1.23 1.74∗ 2.69∗Glutathione S-transferase Ya subunit 4 mg/kg −1.49 1.17 1.37 1.28 4.25∗∗
15 mg/kg −1.09 −1.16 −1.25 3.64∗Lipopolysaccharide binding protein 4 mg/kg 2.32∗ 1.29 2.01∗ 1.9∗ NA
15 mg/kg 2.86∗ −1.22 2.7∗ 1.33Interleukin 1 receptor antagonist 4 mg/kg 2.58∗ 1.69 1.19 1.01 NA
protein precursor 15 mg/kg 1.71∗ 1.3 4.84∗ 2.29∗
∗Statistically significant atp < .05.∗∗Statistically significant but signal is too low to be reliable (near background).εBlood was not available for evaluation.NA = Gene cDNA not available on membrane used.φ = Confirmed by RT-PCR at a level near the fold change reported.8 = Value based on the average of 2 RT-PCR runs.9 = Downregulated.
monitoring of that progression via blood gene expression inpatients. A large number of genes were both up and down-regulated in blood and heart by treatment with adriamycin.This discussion will be primarily confined to genes that wereupregulated at the 4- and 24-hour time points, due to possi-ble confounding effects of secondary toxicity and declinesin the most abundant altered nucleated cell population (lym-phocytes) in the blood with continued dosing.
TABLE 6.—Taqman confirmations vs Clontech Tox II array fold changes for adriamycin at the 15- and 4-mg/kg dose, 24 hours after dosing.
Fold change at 15 mg/kg Fold change at 4 mg/kg
Taqman result Clontech array result Taqman result Clontech array result
GenePairwise
comparison Blood Heart Blood HeartPairwise
comparison Blood Heart Blood Heart
Cyclin D1 13c v 37t 33457∗ 3.73 15 1.86 13c v 28t 1.0 −1.03 1.0 1.9414c v 38t 23905∗ 2.3 5∗∗ 3.06 14c v 29t 1.0 1.14 1.0 1.04
Gadd45 13c v 37t 2.01 3.15 4.03 2.12 13c v 28t 1.29 1.57 1.63 1.9114c v 38t 1.86 2.6 4.45 1.75 14c v 29t 3.07 1.13 2.0 1.56
Heme oxygenase 1 13c v 37t 14.77 55.52 25 4.91 13c v 28t 30.48 4.52 7∗∗ 1.6414c v 38t 36.63 3.77 6.67 5.38 14c v 29t 68.12 4.23 1.14 1.85
Mdr-1 13c v 37t 3.18 10.16 4∗∗ 88 13c v 28t 1.24 1.07 1.0 9.0∗∗14c v 38t 4.55 8.06 2 103 14c v 29t 2.25 −1.12 1.0 1.0
NAD(P)H menadione 13c v 37t 10.78 7.92 15.5 5.6 13c v 28t 7.14 1.51 4.25 2.24oxidoreductase 14c v 38t 3.94 4.29 6 6.5 14c v 29t 4.18 −1.25 3.3 1.32
Waf-1 13c v 37t 3.4 13.59 146 8.34 13c v 28t −1.02 1.28 4.75 1.7714c v 38t 2.08 5.98 49 13.60 14c v 29t −3.32 1.01 1.1 1.51
∗The fold difference on Taqman when a gene is not expressed in the controls yields a number divided by a value very close to 0, which produces an artifact when expressed as a ratio.∗∗The fold difference in Clontech when the signal in controls was below or at the background threshold consisted of the number of pixels above background in the treated.
Plotting the gene expression patterns over time andcorrelating the expression with the hematologic profile andthe observed tissue morphology produces a picture thatcorroborates what is known about adriamycin and suggestsadditional experiments for both ameliorative procedures andmonitoring. Based on transciptional responses, 4 initiatingevents were considered probable during the first 4 hours ofadriamycin exposure: generation of reactive oxygen species
at PENNSYLVANIA STATE UNIV on February 21, 2013tpx.sagepub.comDownloaded from
P1: GTJ/HAK P2: GTJ/HAK Tally: GTJ/HAK QC: GTJ/HAK T1: GTJ
July 13, 2002 14:48 TJ357-05(TXP) TJ501-03
Vol. 30, No. 4, 2002 ADRIAMYCIN-INDUCED CARDIOMYOPATHY IN THE RAT 461
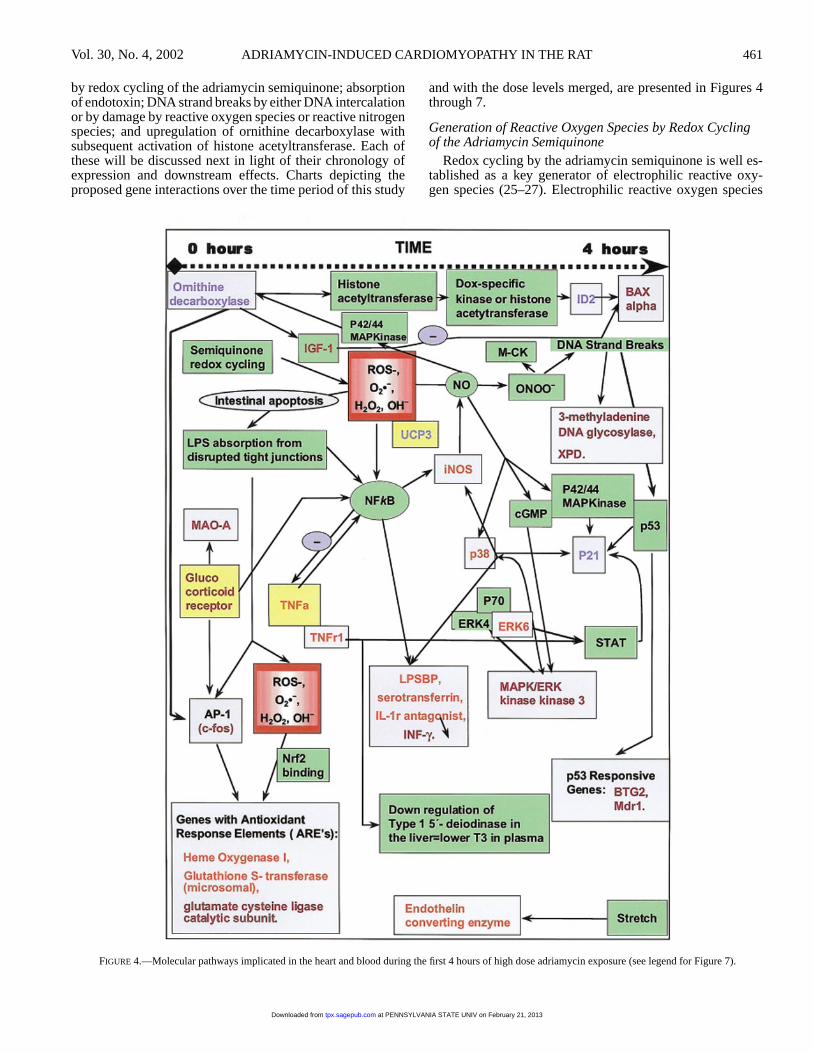
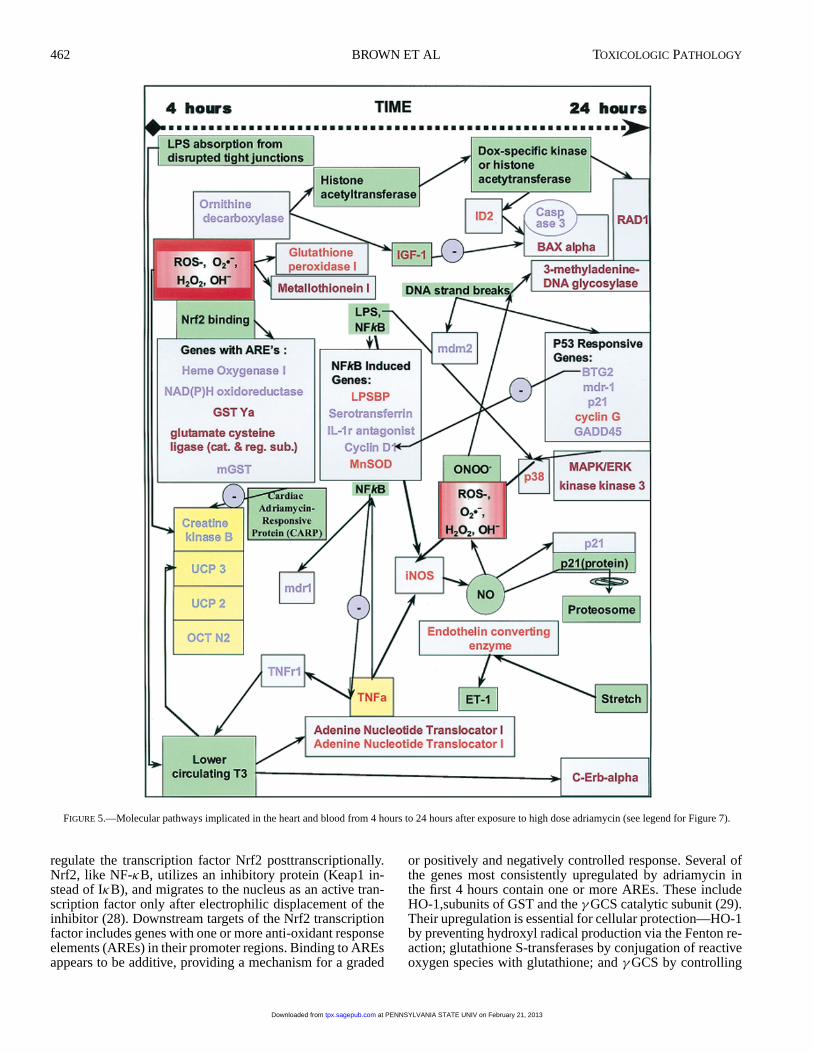
by redox cycling of the adriamycin semiquinone; absorptionof endotoxin; DNA strand breaks by either DNA intercalationor by damage by reactive oxygen species or reactive nitrogenspecies; and upregulation of ornithine decarboxylase withsubsequent activation of histone acetyltransferase. Each ofthese will be discussed next in light of their chronology ofexpression and downstream effects. Charts depicting theproposed gene interactions over the time period of this study
FIGURE 4.—Molecular pathways implicated in the heart and blood during the first 4 hours of high dose adriamycin exposure (see legend for Figure 7).
and with the dose levels merged, are presented in Figures 4through 7.
Generation of Reactive Oxygen Species by Redox Cyclingof the Adriamycin Semiquinone
Redox cycling by the adriamycin semiquinone is well es-tablished as a key generator of electrophilic reactive oxy-gen species (25–27). Electrophilic reactive oxygen species
at PENNSYLVANIA STATE UNIV on February 21, 2013tpx.sagepub.comDownloaded from
P1: GTJ/HAK P2: GTJ/HAK Tally: GTJ/HAK QC: GTJ/HAK T1: GTJ
July 13, 2002 14:48 TJ357-05(TXP) TJ501-03
462 BROWN ET AL TOXICOLOGIC PATHOLOGY
FIGURE 5.—Molecular pathways implicated in the heart and blood from 4 hours to 24 hours after exposure to high dose adriamycin (see legend for Figure 7).
regulate the transcription factor Nrf2 posttranscriptionally.Nrf2, like NF-κB, utilizes an inhibitory protein (Keap1 in-stead of IκB), and migrates to the nucleus as an active tran-scription factor only after electrophilic displacement of theinhibitor (28). Downstream targets of the Nrf2 transcriptionfactor includes genes with one or more anti-oxidant responseelements (AREs) in their promoter regions. Binding to AREsappears to be additive, providing a mechanism for a graded
or positively and negatively controlled response. Several ofthe genes most consistently upregulated by adriamycin inthe first 4 hours contain one or more AREs. These includeHO-1,subunits of GST and theγGCS catalytic subunit (29).Their upregulation is essential for cellular protection—HO-1by preventing hydroxyl radical production via the Fenton re-action; glutathione S-transferases by conjugation of reactiveoxygen species with glutathione; andγGCS by controlling
at PENNSYLVANIA STATE UNIV on February 21, 2013tpx.sagepub.comDownloaded from
P1: GTJ/HAK P2: GTJ/HAK Tally: GTJ/HAK QC: GTJ/HAK T1: GTJ
July 13, 2002 14:48 TJ357-05(TXP) TJ501-03
Vol. 30, No. 4, 2002 ADRIAMYCIN-INDUCED CARDIOMYOPATHY IN THE RAT 463
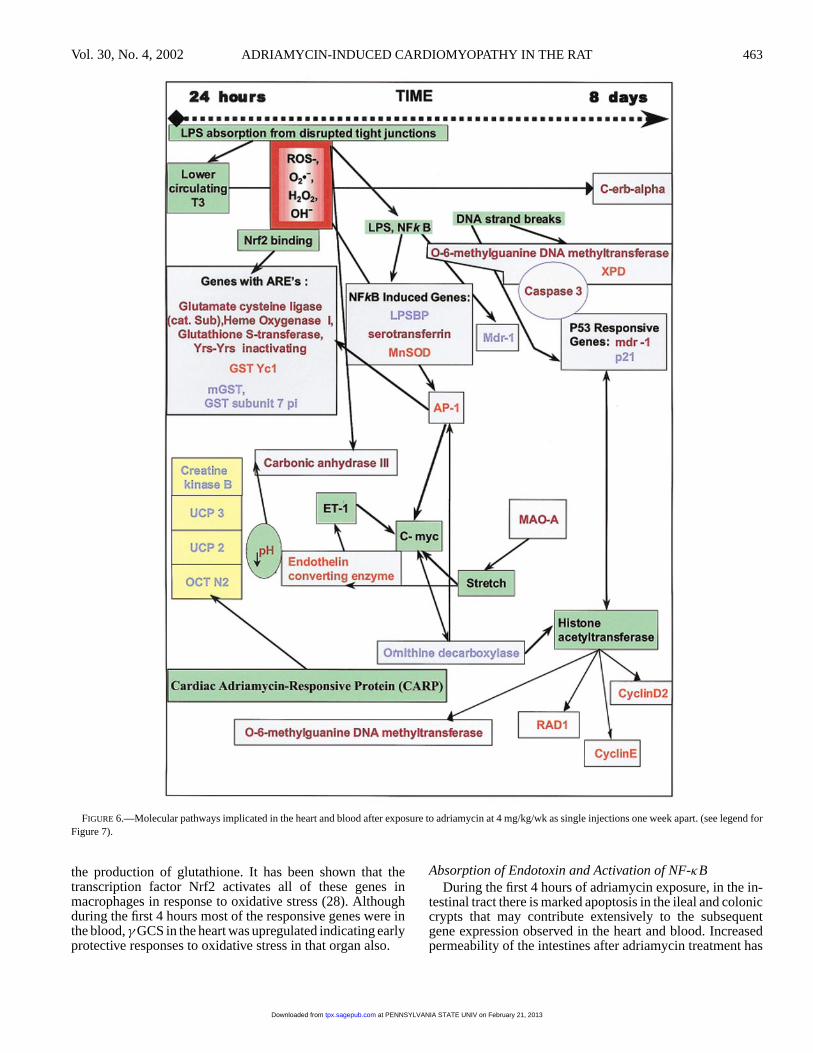
FIGURE 6.—Molecular pathways implicated in the heart and blood after exposure to adriamycin at 4 mg/kg/wk as single injections one week apart. (see legend forFigure 7).
the production of glutathione. It has been shown that thetranscription factor Nrf2 activates all of these genes inmacrophages in response to oxidative stress (28). Althoughduring the first 4 hours most of the responsive genes were inthe blood,γGCS in the heart was upregulated indicating earlyprotective responses to oxidative stress in that organ also.
Absorption of Endotoxin and Activation of NF-κBDuring the first 4 hours of adriamycin exposure, in the in-
testinal tract there is marked apoptosis in the ileal and coloniccrypts that may contribute extensively to the subsequentgene expression observed in the heart and blood. Increasedpermeability of the intestines after adriamycin treatment has
at PENNSYLVANIA STATE UNIV on February 21, 2013tpx.sagepub.comDownloaded from
P1: GTJ/HAK P2: GTJ/HAK Tally: GTJ/HAK QC: GTJ/HAK T1: GTJ
July 13, 2002 14:48 TJ357-05(TXP) TJ501-03
464 BROWN ET AL TOXICOLOGIC PATHOLOGY
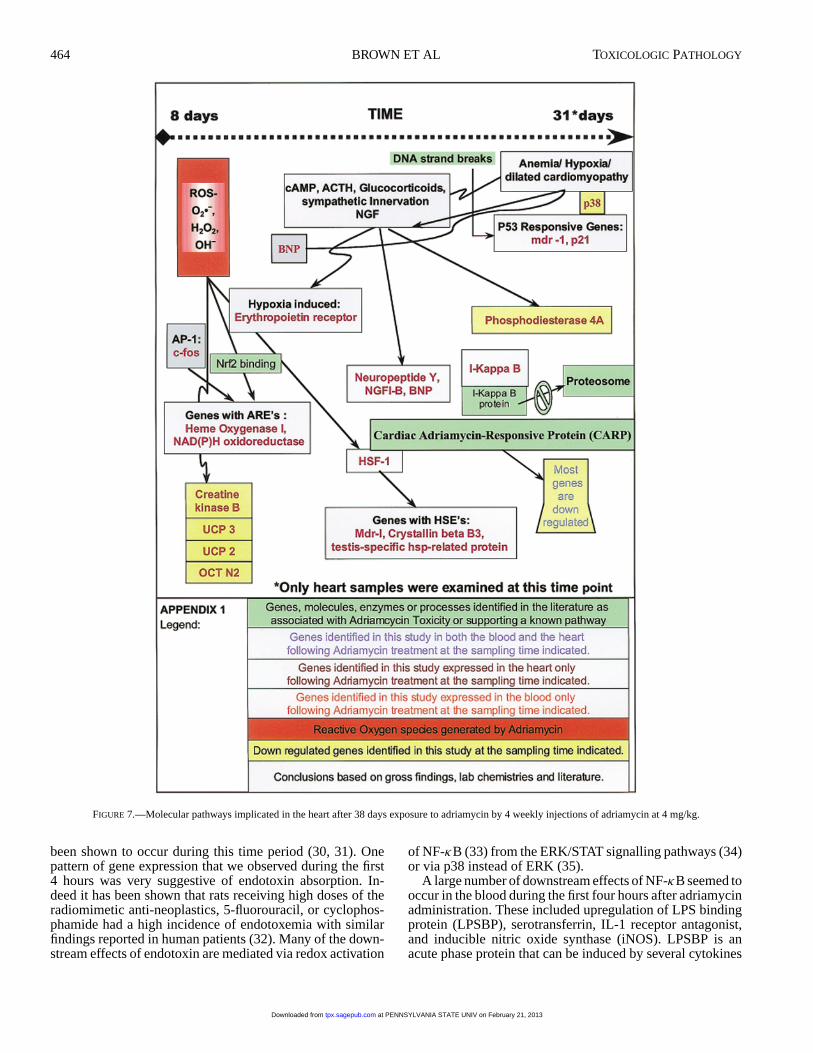
FIGURE 7.—Molecular pathways implicated in the heart after 38 days exposure to adriamycin by 4 weekly injections of adriamycin at 4 mg/kg.
been shown to occur during this time period (30, 31). Onepattern of gene expression that we observed during the first4 hours was very suggestive of endotoxin absorption. In-deed it has been shown that rats receiving high doses of theradiomimetic anti-neoplastics, 5-fluorouracil, or cyclophos-phamide had a high incidence of endotoxemia with similarfindings reported in human patients (32). Many of the down-stream effects of endotoxin are mediated via redox activation
of NF-κB (33) from the ERK/STAT signalling pathways (34)or via p38 instead of ERK (35).
A large number of downstream effects of NF-κB seemed tooccur in the blood during the first four hours after adriamycinadministration. These included upregulation of LPS bindingprotein (LPSBP), serotransferrin, IL-1 receptor antagonist,and inducible nitric oxide synthase (iNOS). LPSBP is anacute phase protein that can be induced by several cytokines
at PENNSYLVANIA STATE UNIV on February 21, 2013tpx.sagepub.comDownloaded from
P1: GTJ/HAK P2: GTJ/HAK Tally: GTJ/HAK QC: GTJ/HAK T1: GTJ
July 13, 2002 14:48 TJ357-05(TXP) TJ501-03
Vol. 30, No. 4, 2002 ADRIAMYCIN-INDUCED CARDIOMYOPATHY IN THE RAT 465
including IL-1beta, IL-6, and TNF-α. All of these transcriptsare induced by endotoxin (36, 37). If endotoxin absorptionoccurs within the first hour of adriamycin administration, itwould be expected that upregulation of LPSBP would oc-cur within the first 4 hours. This is the case for blood at the15 mg/kg dose. However, induction of LPSBP in the heartdoes not occur until after the second dose, which either indi-cates that repeated insults to the intestinal tract increases theabsorption of endotoxin or that the upregulation of this pro-tein in the heart is a sensitive indicator of cumulative toxicitythat has only reached a critical point and initiated the acutephase response after the second dose. Unfortunately, the levelof expression in the blood, although elevated at all time points,does not seem to indicate the timing of the heart upregulation.
TNF-α activates NF-κB, which in turn suppresses apop-tosis in ventricular cardiomyocytes (38). Although TNF isknown to activate NF-κB and AP1, various studies indicatea peculiarity when adriamycin is co-administered with en-dotoxin. These reports indicate that adriamycin inhibits orrepresses the activation of TNF that is normally producedby endotoxin alone (39). The downregulation of TNF-α ob-served in our study may simply be a counterweight to thenumerous NF-κB responses seen after adriamycin adminis-tration as a negative feedback loop. In any event, downregu-lation of TNF-αmRNA in the blood was consistently presentin our study while upregulation of the TNF receptor 1 maybe a response to the reduction in TNF.
The protein product of the NF-κB-induced gene serotrans-ferrin acts as a sequestering molecule to limit the oxida-tive availability of iron liberated from heme in the blood byHO-1. It is one of many indicators of the importance of isolat-ing iron from reactive oxygen species as a protective mech-anism during oxidative stress.
Interleukin I receptor antagonist (IL-1ra) is the physiologicantagonist of interleukin 1 beta and has anti-inflammatoryfunctions. The gene is also regulated by NF-κB. The upreg-ulation of IL-1ra in the blood in the first 4 hours of treatmentmay also be a response to absorbed endotoxin. Upregulationof IL-1ra mRNA in the brain following endotoxin administra-tion has been reported and attributed to increased expressionfrom peripherally derived monocytes and macrophages (40).Increased numbers of blood monocytes occur after 4 hours atthe 15-mg/kg dose level. Whether this increased number ofcells accounts for the apparent increased IL-1ra expressionin the blood will need to be pursued further.
Perhaps the most significant downstream effect of NF-κBactivation is upregulation of inducible nitric oxide synthase(iNOS) in the blood. It is probable that monocytes account forthe majority of this expression. Nitric oxide serves importantsignaling functions activating MAPK/ERK/p38 and STATpathways that upregulate p21waf1/cip1 and other stress genes,including HSF-1, which initiates mdr-1 transcription, or actsas a pro- or anti-apoptotic mediator in cardiomyocytes (41).Nitric oxide may also increase specific target protein activityby preventing its proteosomal degradation, as for p21waf1/cip1
in vascular smooth muscle (42). One of the effects of iNOSinduction can be seen in the heart as peroxynitrite formation,the result of NO generation in the presence of reactive oxygenspecies (43) that has been reported in mice after adriamycintreatment (43).
The resultant damage from the highly reactive peroxyni-trite affects a large number of key molecules including thekey Kreb’s cycle enzyme aconitase (44).
In the case of myofibrillar structure, one of the most heav-ily nitrated proteins was the myofibrillar isoform of creatinekinase (M-CK) (43). As a key provider of cardiac energyneeds, damage to the M-CK protein might be expected tolead to upregulation of the M-CK gene. Unfortunately, theM-CK isozyme was not present on the membranes used in ourexperiments. The B-CK isozyme was present on the filters,however, and this isoform was significantly downregulatedat each time point evaluated. During embryologic develop-ment, downregulation of B-CK follows the upregulation ofM-CK. This indicates a shift from aerobic to anaerobic res-piration. Such a shift would provide a survival advantagein an environment where aerobic metabolism was limited—as would occur due to mitochondrial dysfunction. Reducedmitochondrial creatine kinase activity has been reported fol-lowing adriamycin administration (45) due to ROS-inducedinhibition of the enzyme, and thus such a deficit in aero-bic metabolism does appear to be present. The downregula-tion of UCP3 is also telling as UCP3 expression in the heartmay be regulated by the availability of triiodothyronine (T3)(46), which is reduced following adriamycin administration(47), and which should signal reduced aerobic metabolism offatty acids.
Reactive Oxygen- or Nitrogen-Induced DNA DamageThe other primary consequence of the generation of per-
oxynitrite is the nitration of DNA, particularly but not exclu-sively at guanine nucleobases (48), and single strand DNAstrandbreaks that led to DNA repair (49). Downstream con-sequences of this DNA damage is evident in the upregulationof p53-responsive genes such as BTG2 and mdr1 as wellas DNA excision repair genes 3-methyladenine DNA gly-cosylase [known to be upregulated by adriamycin and otherclastogens (50)] and Xeroderma Pigmentosum Group D com-plementing protein.
Upregulation of Ornithine Decarboxylase, Increasesin Polyamines and Activation of Histone Acetylase
Although upregulation of ornithine decarboxylase (ODC)by adriamycin has previously been reported in a mouse modelof skin tumor promotion with 12-O-tetradecanoylphorbol-13-acetate (TPA) (51), upregulation of ODC transcripts in theheart by adriamycin has not been reported, to the best of ourknowledge. The significance of ODC regulation of polyaminesynthesis and of polyamine levels on cardiac growth and de-velopment was first recorded by Casti (52) using a rabbitmodel of cardiac hypertrophy. The importance of polyaminessuch as spermine, spermidine, and putrescine, in protein syn-thesis, stabilization of membranes, and intracellular calciumflux, has recently been addressed by Cohen (53). The impor-tance of polyamines as modulators of histone acetylation andthus gene expression may be their single most important func-tion. The number of genes controlled by polyamine-mediatedhyperacetylation has been discussed by Hobbs (54). It hasalso been shown that ODC in some cell types is upregulatedby p44/42 mitogen-activated protein kinase (MAPK) (55).
at PENNSYLVANIA STATE UNIV on February 21, 2013tpx.sagepub.comDownloaded from

P1: GTJ/HAK P2: GTJ/HAK Tally: GTJ/HAK QC: GTJ/HAK T1: GTJ
July 13, 2002 14:48 TJ357-05(TXP) TJ501-03
466 BROWN ET AL TOXICOLOGIC PATHOLOGY
ODC has been shown to be required for upregulation ofIGF-1 in a cardiac volume overload model (56) and in TGF-beta mediated cardiac hypertrophy from beta adrenergic stim-ulation (57). It also upregulates ID2 and BAX-α, both ofwhich are upregulated during the first 4 hours of adriamycinadministration. The control of ODC by c-myc provides an au-tostimulatory loop unless other factors intervene. Thus ODC,by controlling the level of polyamines in the nucleus and thedegree of hyperacetylation of histones, alters growth and im-mediate response genes (c-myc, c-fos, c-jun) (58), regulatesthe access of other transcription factors to DNA binding sites(ID2), and contributes to apoptotic pathways (BAX-α) andcaspase pathways via spermine (59) or prevents the activa-tion of these same pathways (IGF-1). All of these down-stream gene effects have been described in various studieswith adriamycin and were seen in this study (9, 13, 60–63).
Progression of Gene Expression After the First 4 HoursThe decline in blood concentrations of adriamycin over
time are not a reliable indicator of the molecular availabilityof adriamycin. It has been shown by quantitative microspec-trofluorometry that the intranuclear concentration of adri-amycin in human leukocytes after a single I.V. bolus injectionincreased over the first 30 minutes and then did not vary overthe next 24 hours even though the plasma volume of the drugdecreased (64).
At the 24-hour sampling point, much of the up- anddownregulated regulated gene expression seen at 4 hourscontinued. The major change at this time point was ashift in expression of both ARE-containing genes and NF-κB activated genes away from blood toward more ex-pression by the heart. NAD(P)H oxidoreductase and hemeoxygenase were excellent blood markers of ARE car-diac gene changes at 24 hours. The importance of these2 enzymes as cardiac protectants cannot be overemphasized.NAD(P)H menadione oxidoreductase is expressed at its high-est level in the heart in rodents (65). Cardiac anti-oxidants,such as reduced glutathione, glutathione peroxidase, cata-lase, and superoxide dismutase are usually present at verylow levels in the heart (3, 66).
Upregulation of NAD(P)H menadione oxidoreductase hasbeen reported following treatment with electrophiles, includ-ing adriamycin (29, 67). This enzyme catalyzes obligate 2electron transfers that provide protection against the redoxcycling that occurs with adriamycin, to produce stable hy-droquinones that can be removed by conjugation with glu-tathione or UDP glucuronic acid. For NAD(P)H oxidoreduc-tase to be effective there must be adequate glutathione andglutathione transferase available for conjugation of the hy-droquinone produced. Time course studies, largely reportedin mice, show fairly rapid reductions in reduced glutathionelevels (GSH) beginning within the first 5 hours after a sin-gle dose and extending to 16 hours, followed by recovery inthe heart and blood beginning between 12 and 16 hours afterdosing (19). At 24 hours, the levels of GSH are reportedlynormal. Without NAD(P)H menadione oxidoreductase ac-tivity, the anthracycline quinone undergoes a single electrontransfer to form a semiquinone that then transfers the electronto superoxide that dismutates to hydrogen peroxide. Unlessthere is an oxidant-induced increase in intracellular ferritin,
hydroxyl radicals are generated by Fenton chemistry, whichthen react with DNA, proteins, and lipids to form a varietyof adducts that alter essential cell functions. Thus, NAD(P)Hmenadione oxidoreductase is a key detoxifying enzyme foranthracycline quinones and its upregulation is an essentialprotectant against oxidative damage.
Heme oxygenase 1, an acute phase protein, contains 5ARE elements (68, 69). It is known to be induced by oxida-tive stress and to serve 2 important anti-oxidant functions—formation of the antioxidant bilirubin and removal of thepro-oxidant heme to release iron and carbon monoxide (70).Degradation of heme proteins may also expose cells to in-creased risk from available iron via Fenton chemistry. The in-crease in intracellular ferritin induced by either HO-1 (71) orvia a direct response of the ferritin gene through an ARE in thepromoter region (72) effectively sequesters free iron. Also,the coordinated regulation of the genes for HO-1 and ubiq-uitin has been reported in a porcine model of ischemia andreperfusion in the heart that would link degradation of proteinand generation of by-products of heme metabolism, perhapsunder the same transciptional controls. Heme oxygenase-2,which is also responsible for iron turnover during oxidantstress typically, is not upregulated.
At 24 hours, the oxidative stress signaling pathways, orat least the heart response to the signaling, clearly had in-creased, suggesting that oxidative stress in the heart or atleast the response to oxidative stress was elevated comparedto the 4-hour time point, even with upregulation of protec-tive genes at the earlier time point. There was also more cu-mulative transcriptional evidence of DNA damage and p53responsive genes being upregulated in the heart. Again atthis time point, upregulation by ornithine decarboxylase wasprominent in both the blood and heart; downsteam gene ef-fectors of histone acetylation were particularly prominent inthe heart. Increased evidence of apoptosis (BAX-α and cas-pase 3) or prevention of activation of these same pathways(IGF-1) may have signalled an increase in programmed celldeath, with time and continued dosing, under the influenceof upregulated ODC expression (58).
There were also some new genes being downregulated inthe heart and blood, particularly in the area of energy han-dling that may have signaled the progression of an energydeficit that began at 4 hours and would continue through theremainder of the study. Downregulated genes included cre-atine kinase B and UCP3 as previously discussed, but alsoUCP2 and the carnitine transporter OCT N2. The signifi-cance of the latter downregulation may be in the loss of theability of the heart to transport carnitine necessary for the mi-tochondrial entry and metabolism of long chain fatty acids,a primary energy source for the heart. At high-dose levels,another gene indicator of altered energetics in the heart andblood—adenine nucleotide translocator I (ANT1)—was up-regulated at 24 hours. Upregulation of this gene is particularlypertinent in the heart due to reports of upregulation of thisisoform in hearts progressing to dilated cardiomyopathy (73).Although the level of induction in the blood was relativelylow (1.62-fold) and slightly missed statistical significance(p = .066), if the sensitivity of detection in the blood canbe improved, then ANT1 might also serve as a reliable in-dicator of the onset of dilated cardiomyopathy secondary toadriamycin treatment.
at PENNSYLVANIA STATE UNIV on February 21, 2013tpx.sagepub.comDownloaded from

P1: GTJ/HAK P2: GTJ/HAK Tally: GTJ/HAK QC: GTJ/HAK T1: GTJ
July 13, 2002 14:48 TJ357-05(TXP) TJ501-03
Vol. 30, No. 4, 2002 ADRIAMYCIN-INDUCED CARDIOMYOPATHY IN THE RAT 467
The upregulation of rev-erb alpha (designated c-erb on theClontech ToxII array) seems to provide a wonderful exampleof the circuitous effects of adriamycin on gene expression inthe heart. Adriamycin lowers circulating T3 (74). The exactmechanism by which this occurs has not been establishedbut in line with our previous observation of probable ab-sorption of endotoxin, we believe it is by downregulating1,5′deiodinase in the heart and liver, which converts T4 to T3(75). T3 represses expression of c-erbα in the heart. Rev-erbalpha is transcribed from the opposite strand of the c-erb al-pha gene and is a transcriptional repressor. We reason, there-fore, that the downregulation of T3 by endotoxin may wellbe the cause of the upregulation of rev-erbα in the heart andrepression of c-erb alpha.
Overall, the 24-hour gene expression pattern, particularlyat the highest dose level, indicated even with anti-oxidantgenes being upregulated, a progression toward bioenergeticfailure, increased apoptosis and dilated cardiomyopathy eventhough there was no morphologic or functional evidence tothis effect at this time.
At 8 days, there was continued expression of ARE respon-sive genes, especially in the heart and of NF-κB activatedgenes in both the heart and blood. Functionally, protectionagainst oxidative stress, sequestration of iron and DNA re-pair were again indicated by the genes in these categories.
The gene expression at 38 days in the heart largely in-dicated downregulation of most gene expression and dif-fered from that seen at the earlier time points in that afunctional worsening seemed to be indicated. Selective in-hibition of cardiac muscle gene expression by adriamycinhas previously been reported (76). The clinical conditionof the animals had deteriorated, food intake was reduced;grossly and histologically, all animals had some evidence ofdilated cardiomyopathy. Increases in BNP, neuropeptide Y,and NGFI-B receptor and decreases in phosphodiesterase4A all indicate volumetric distension and poor outflowaccompanied by a compensatory rapid poorly functional rateof contraction and efforts to maximize inotropic activity.There was also an increase in I-κβtranscripts due to the prob-able increased proteosomal destruction of I-κβ protein andthe feedback stimulation of I-κβ transcription. Upregulationof some ARE-responsive genes also continued.
Limitations of this Experiment and of Whole BloodGene Expression
The direct cytotoxicity of adriamycin is well known. In-traperitoneal injection results in some limited local tissuedamage (see histopathology), which probably acts as a stimu-lus for endogenous corticosteroid and catecholamine release.The changes in cellular composition in the blood and in thetissues due to inflammation appears to be mild at the 4 hourtime point, and more apparent at the 24-hour time point. Itis not clear to what extent that these limited alterations incell counts and endogenous stress responses modify the geneexpression. We are currently evaluating different techniquesfor blood collection and separation to answer the cell countissue. Other confounding factors that result from the toxicityof adriamycin and that further alter gene expression includereductions in food intake and renal damage that eventuallyresults in nephrotic syndrome. Because this is not a signifi-cant factor at the 4- and 24-hour time points, the early gene
expression appears to be the most informative. This study ex-emplifies the need for pathologic correlation and contextualinterpretation of gene expression studies.
SUMMARY
The goal of using blood gene expression to monitor oxida-tive stress in target organs seems to hold some promise, par-ticularly at high-dose levels. Further studies will be needed toestablished the boundaries of this correlation and clearer as-sociations of levels of gene expression or gene product withcumulative dose and the development of cardiomyopathy.Detailed time course studies will also be necessary to morecompletely understand the sequence of gene expression ascorrelated with morphologic and biochemical changes. Withtime and the addition of further and perhaps more sensitivegene detection arrays, low-dose effects may become easierto detect. It would seem that even with the limited data avail-able that monitoring of blood gene expression of NAD(P)Hmenadione oxidoreductase, ornithine decarboxylase, ANT1and p21waf1/cip1 in relation to clinical outcome, might lead topredictive parameters for the dose regulation of adriamycinand perhaps other oxidative stressors. Therapies that targetcorrection of these limiting gene responses might be useful inameliorating the toxic effects of the drug, hopefully withoutaltering its chemotherapeutic value. A therapeutic approachaimed at reducing the effects of endotoxin on the cardiovas-cular system in the first few hours after adriamycin adminis-tration seems particularly promising as a prophylactic againstearly cardiac damage.
ACKNOWLEDGMENTS
We appreciate the assistance received from many people,with special thanks to Dirk Sprenger, Betty Gaskill, and LeighBrown.
REFERENCES
1. Khetawat G, Faraday N, Nealen ML, Vijayan KV, Bolton E, Noga SJ, BrayPF (2000). Human megakaryocytes and platelets contain the estrogen recep-tor beta and androgen receptor (AR): Testosterone regulates AR expression.Blood95: 2289–2296.
2. Brugnara C (2000). Reticulocyte cellular indices: A new approach in thediagnosis of anemias and monitoring of erythropoietic function.Crit RevClin Lab Sci37: 93–130.
3. Doroshow JH, Locker GY, Myers CE (1980). Enzymatic defenses of themouse heart against reactive oxygen metabolites.J Clin Invest65: 128–135.
4. Crosby LM, Hyder KS, DeAngelo AB, Kepler TB, Gaskill B, BenavidesGR, Yoon L, Morgan KT (2000). Morphologic analysis correlates withgene expression changes in cultured F344 rat mesothelial cells.ToxicolAppl Pharmacol169: 205–221.
5. Billingham ME, Mason JW, Bristow MR, Daniels JR (1978). Anthracyclinecardiomyopathy monitered by morphologic changes.Cancer Treat Rep62:865–872.
6. Rowan RA, Masek MA, Billingham ME (1988). Ultrastructural morpho-metric analysis of endomyocardial biopsies.Am J Cardiovasc Pathol2:137–144.
7. Bristow MR (1978). Early anthracycline cardiotoxicity.Am J Med65: 823–832.
8. Yamashita J, Ogawa M, Shirakusa T (1995). Plasma endothelin-1 as amarker for doxorubicin cardiotoxicity.Int J Cancer62: 542–547.
9. Kang YJ, Zhou ZX, Wang GW, Buridi A, Klein JB (2000). Suppression byMetallothionein of Doxorubicin-induced cardiomyocyte apoptosis through
at PENNSYLVANIA STATE UNIV on February 21, 2013tpx.sagepub.comDownloaded from
P1: GTJ/HAK P2: GTJ/HAK Tally: GTJ/HAK QC: GTJ/HAK T1: GTJ
July 13, 2002 14:48 TJ357-05(TXP) TJ501-03
468 BROWN ET AL TOXICOLOGIC PATHOLOGY
inhibition of p38 miton-activated protein kinases.J Biol Chem275: 13690–13698.
10. Yen HC, Oberley TD, Vichitbandha S, Ho YS, St Clair DK (1996). The pro-tective role of manganese superoxide dismutase against adriamycin-inducedacute cardiac toxicity in transgenic mice.J Clin Invest 98: 1253–1260.
11. Sayed-Ahmed MM, Shaaraway S, Shouman SA, Osman AM (1999). Re-versal of doxorubicin-induced cardiac metabolic damage byL-carnitine.Pharmacol Res39: 289–295.
12. Abdel-aleem S, el-Merzabani MM, Sayed-Ahmed M, Taylor DA, Lowe JE(1997). Acute and chronic effects of adriamycin on fatty acid oxidation inisolated cardiac myocytes.J Mol Cell Cardiol29: 789–797.
13. Andrieu-Abadie N, Jaffrezou JP, Hatem S, Laurent G, Levade T, MercaiderJJ (1999).L-carnitine prevents doxorubicin-induced apoptosis of cardiacmyocytes: Role of inhibition of ceramide generation.FASEB J13: 1501–1510.
14. Kapelko VI, Williams CP, Gutstein DE, Morgan JP (1996). Abnormal my-ocardial calcium handling in the early stage of adriamycin cardiomyopathy.Arch Physiol Biochem104: 185–191.
15. Boucek RJJ, Miracle A, Anderson M, Engelman R, Atkinson J, Dodd DA(1999). Persistant effects of doxorubicin on cardiac gene expression.J MolCell Cardiol31: 1435–1446.
16. Sazuka Y, Tanizawa H, Takino Y (1989). Effect of adriamycin on DNA,RNA and protein biosyntheses in mouse tissues, in connection with itscardiotoxicity.Jpn J Cancer Res80: 1000–1005.
17. Arnaiz SL, Llesuy S (1993). Oxidative stress in mouse heart by antitumoraldrugs: A comparative study of doxorubicin and mitoxantrone.Toxicology77: 31–38.
18. Crescimanno M, Flandina C, Rausa L, Sanguedolce R, D’Alessandro N(1988). Morphological changes and catalase activity in the hearts of CD 1mice following acute starvation or single doses of doxorubicin, epirubicinor mitoxantrone.Chemioterapia7: 53–59.
19. D’Alessandro N, Rausa L, Crescimanno M (1988). In vivo effects of dox-orubicin and isoproterenol on reduced glutathione and H2O2 production inmouse heart.Res Comm Chem Pathol Pharmacol62: 19–30.
20. Yin X, Wu H, Chen Y, Kang YJ (1998). Induction of antioxidants by adri-amycin in mouse heart.Biochem Pharmacol56: 87–93.
21. Frankel D, Mehindate K, Schipper HM (2000). Role of heme oxygenase-1in the regulation of manganese superoxide dismutase gene expression inoxidatively-challenged astroglia.J Cell Physiol185: 80–86.
22. Nakamura T, Ueda Y, Juan Y, Katsuda S, Takahashi H, Koh E (2000). Fas-mediated apoptosis in adriamycin-induced cardiomyopathy in rats: In vivostudy.Circulation102: 572–578.
23. Toyoda Y, Okada M, Kashem MA (1998). A canine model of dilated car-diomyopathy induced by repetitive intracoronary doxorubicin administra-tion. J Thor Cardiovasc Surg115: 1367–1373.
24. Ruwhof C, van der Laarse A (2000). Mechanical stress-induced cardiachypertrophy: Mechanisms and signal transduction pathways.CardiovascRes47: 23–37.
25. Pinkus R, Weiner LM, Daniel V (1995). Role of quinone-mediated gener-ation of hydroxyl radical in the induction of glutathione S-transferase geneexpression.Biochemistry34: 81–88.
26. Jeyaseelan R, Poizat C, Wu HY, Kedes L (1997). Molecular mech-anisms of doxorubicin-induced cardiomyopathy.J Biol Chem 272:5828–5832.
27. Gewirtz DA (1999). A critical evaluation of the mechanisms of action pro-posed for the antitumor effects of the anthracycline antibiotics adriamycinand dauorubicin.Biochem Pharmacol57: 727–741.
28. Ishii T, Itoh K, Takahashi S, Sato H, Yanagawa T, Katoh Y, Bannai S,Yamamoto M (2000). Transcription factor Nrf2 coordinately regulates agroup of oxidative stress-inducible genes in macrophages.J Biol Chem275: 16023–16029.
29. Dhakshinamoorthy S, Long DJ 2nd, Jaiswal AK (2000). Antioxidant regula-tion of genes encoding enzymes that detoxify xenobiotics and carcinogens.Curr Top Cell Regul36: 201–216.
30. Parrilli G, Iaffaioli RV, Martorano M, Cuomo R, Tafuto S, Zampino MG,Budillon G, Bianco AR (1989). Effects of anthracycline therapy on intestinal
absorption in patients with advanced breast cancer.Cancer Res49: 3689–3691.
31. Sun Z, Wang X, Wallen R, Deng X, Du X, Hallberg E, Andersson R (1998).The influence of apoptosis on intestinal barrier integrity in rats.ScandJ Gastroenterol33: 415–422.
32. Okubo S, Yasunaga K (1983). Clinical and experimental studies on DICfound in carcinoma; correlation between anti-cancer drug administrationand endotoxemia.Jpn J Cancer Clin29: 803–806.
33. Janssen-Heininger YMW, Poynter ME, Baeuerle PA (2000). Recent ad-vances towards understanding redox mechanisms in the activation of nuclearfactorκβ. Free Radic Biol Med28: 1317–1327.
34. Cowan DB, Poutias DN, Del Nido PJ, McGowan FXJ (2000). CD14-independent activation of cardiomyocyte signal transduction by bacterialendotoxin.Am J Physiol Heart Circ Physiol279: H619–629.
35. Chen CC, Wang JK (1999). p38 but not p44/42 mitogen-activated protein ki-nase is required for nitric oxide synthase induction mediated by lipopolysac-charide in RAW 264.7 macrophages.Mol Pharmacol55: 481–488.
36. Chen G, McCuskey RS, Reichlin S (2000). Blood interleukin-6 and tumornecrosis factor-alpha elevation after intracerebroventricular injection ofEscherichia coliendotoxin in the rat is determined by two opposing factors:Peripheral induction by LPS transferred from brain to blood and inhibitionof peripheral response by a brain-mediated mechanism.Neuroimmunomod-ulation8: 59–69.
37. Matsumoto T, Tateda K, Miyazaki S, Furuya N, Ohno A, Ishii Y, Hirakata Y,Yamaguchi K (1999). Fosfomycin alters lipopolysaccharide-induced in-flammatory cytokine production in mice.Antimicrob Agents Chemother43: 697–698.
38. Mustapha S, Kirshner A, De Moissac D, Kirshenbaum LA (2000). A directrequirement of nuclear factor-κβ for suppression of apoptosis in ventricularmyocytes.Am J Physiol Heart Circ Physiol279: H939–H945.
39. Pogrebniak HW, Matthews W, Pass HI (1991). Chemotherapy amplifiesproduction of tumor necrosis factor.Surgery110: 231–237.
40. Eriksson C, Nobel S, Winblad B, Schultzberg M (2000). Expression of inter-leukin 1 alpha and beta, and interleukin 1 receptor antagonist mRNA in therat central nervous system after peripheral administration of lipopolysac-charides.Cytokine12: 423–431.
41. Stefanelli C, Pignatti C, Tantini B, Stanic I, Bonavita F, Muscari C, GuarnieriC, Clo C, Caldarera CM (1999). Nitric oxide can function as either a killermolecule or an antiapoptotic effector in cardiomyocytes.Biochim BiophysActa1450: 406–413.
42. Kibbe MR, Li J, Nie S, Watkins SC, Lizonova A, Kovesdi I, SimmonsRL, Billiar TR, Tzeng E (2000). Inducible nitric oxide synthase (iNOS)expression upregulates p21 and inhibits vascular smooth muscle cell pro-liferation through p42/44 mitogen-activated protein kinase activation andindependent ofp53 and cyclic guanosine monophosphate.J Vasc Surg31:1214–1228.
43. Weinstein DM, Mihm MJ, Bauer JA (2000). Cardiac peroxynitrite formationand left ventricular dysfunction following doxorubicin treatment in mice.J Pharmacol Exp Ther294: 396–401.
44. Tabrizi SJ, Schapira AH (1999). Secondary abnormalities of mitochondrialDNA associated with neurodegeneration.Biochem Soc Symp66: 99–110.
45. Yen HC, Oberley TD, Gairola CG, Szweda LI, St Clair DK (1999). Man-ganese superoxide dismutase protects mitochondrial complex I againstadriamycin-induced cardiomyopathy in transgenic mice.Arch BiochemBiophys362: 59–66.
46. Nagase I, Yoshida S, Canas X, Irie Y, Kimura K, Yoshida T, Saito M (1999).Up-regulation of uncoupling protein 3 by thyroid hormone, peroxisomeproliferator-activated receptor ligands and 9-cis retinoic acid in L6 my-otubes.FEBS Lett461: 319–322.
47. Valdes Olmos RA, tBHWW, ten Hoeve RF, van Tinteren H, Bruning PF,van Vlies B, Hoefnagel CA (1995). Assessment of anthracycline-relatedmyocardial adrenergic derangement by metaiodobenzylguanidine scintig-raphy.Eur J Cancer31A: 26–31.
48. Tretyakova NY, Wishnok JS, Tannenbaum SR (2000). Peroxynitrite-induced secondary oxidative lesions at guanine nucleobases: Chemical sta-bility and recognition by the Fpg DNA repair enzyme.Chem. Res. Toxicol.13: 658–664.
at PENNSYLVANIA STATE UNIV on February 21, 2013tpx.sagepub.comDownloaded from
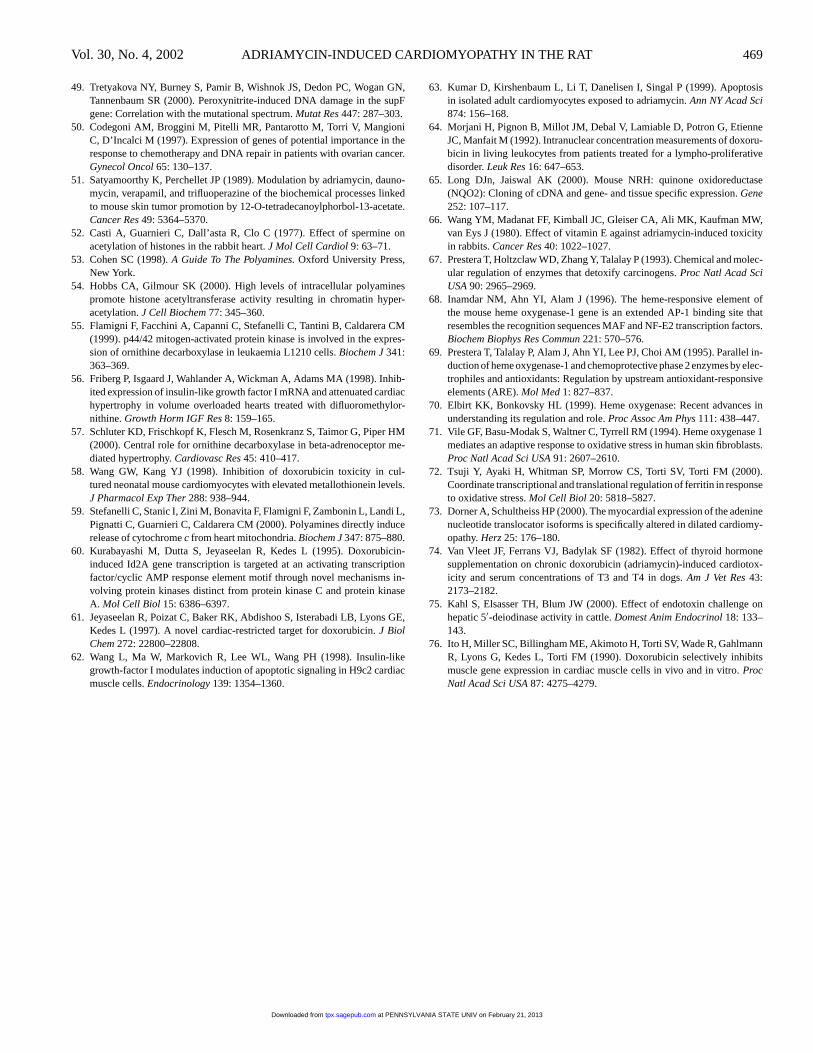
P1: GTJ/HAK P2: GTJ/HAK Tally: GTJ/HAK QC: GTJ/HAK T1: GTJ
July 13, 2002 14:48 TJ357-05(TXP) TJ501-03
Vol. 30, No. 4, 2002 ADRIAMYCIN-INDUCED CARDIOMYOPATHY IN THE RAT 469
49. Tretyakova NY, Burney S, Pamir B, Wishnok JS, Dedon PC, Wogan GN,Tannenbaum SR (2000). Peroxynitrite-induced DNA damage in the supFgene: Correlation with the mutational spectrum.Mutat Res447: 287–303.
50. Codegoni AM, Broggini M, Pitelli MR, Pantarotto M, Torri V, MangioniC, D’Incalci M (1997). Expression of genes of potential importance in theresponse to chemotherapy and DNA repair in patients with ovarian cancer.Gynecol Oncol65: 130–137.
51. Satyamoorthy K, Perchellet JP (1989). Modulation by adriamycin, dauno-mycin, verapamil, and trifluoperazine of the biochemical processes linkedto mouse skin tumor promotion by 12-O-tetradecanoylphorbol-13-acetate.Cancer Res49: 5364–5370.
52. Casti A, Guarnieri C, Dall’asta R, Clo C (1977). Effect of spermine onacetylation of histones in the rabbit heart.J Mol Cell Cardiol9: 63–71.
53. Cohen SC (1998).A Guide To The Polyamines.Oxford University Press,New York.
54. Hobbs CA, Gilmour SK (2000). High levels of intracellular polyaminespromote histone acetyltransferase activity resulting in chromatin hyper-acetylation.J Cell Biochem77: 345–360.
55. Flamigni F, Facchini A, Capanni C, Stefanelli C, Tantini B, Caldarera CM(1999). p44/42 mitogen-activated protein kinase is involved in the expres-sion of ornithine decarboxylase in leukaemia L1210 cells.Biochem J341:363–369.
56. Friberg P, Isgaard J, Wahlander A, Wickman A, Adams MA (1998). Inhib-ited expression of insulin-like growth factor I mRNA and attenuated cardiachypertrophy in volume overloaded hearts treated with difluoromethylor-nithine.Growth Horm IGF Res8: 159–165.
57. Schluter KD, Frischkopf K, Flesch M, Rosenkranz S, Taimor G, Piper HM(2000). Central role for ornithine decarboxylase in beta-adrenoceptor me-diated hypertrophy.Cardiovasc Res45: 410–417.
58. Wang GW, Kang YJ (1998). Inhibition of doxorubicin toxicity in cul-tured neonatal mouse cardiomyocytes with elevated metallothionein levels.J Pharmacol Exp Ther288: 938–944.
59. Stefanelli C, Stanic I, Zini M, Bonavita F, Flamigni F, Zambonin L, Landi L,Pignatti C, Guarnieri C, Caldarera CM (2000). Polyamines directly inducerelease of cytochromec from heart mitochondria.Biochem J347: 875–880.
60. Kurabayashi M, Dutta S, Jeyaseelan R, Kedes L (1995). Doxorubicin-induced Id2A gene transcription is targeted at an activating transcriptionfactor/cyclic AMP response element motif through novel mechanisms in-volving protein kinases distinct from protein kinase C and protein kinaseA. Mol Cell Biol 15: 6386–6397.
61. Jeyaseelan R, Poizat C, Baker RK, Abdishoo S, Isterabadi LB, Lyons GE,Kedes L (1997). A novel cardiac-restricted target for doxorubicin.J BiolChem272: 22800–22808.
62. Wang L, Ma W, Markovich R, Lee WL, Wang PH (1998). Insulin-likegrowth-factor I modulates induction of apoptotic signaling in H9c2 cardiacmuscle cells.Endocrinology139: 1354–1360.
63. Kumar D, Kirshenbaum L, Li T, Danelisen I, Singal P (1999). Apoptosisin isolated adult cardiomyocytes exposed to adriamycin.Ann NY Acad Sci874: 156–168.
64. Morjani H, Pignon B, Millot JM, Debal V, Lamiable D, Potron G, EtienneJC, Manfait M (1992). Intranuclear concentration measurements of doxoru-bicin in living leukocytes from patients treated for a lympho-proliferativedisorder.Leuk Res16: 647–653.
65. Long DJn, Jaiswal AK (2000). Mouse NRH: quinone oxidoreductase(NQO2): Cloning of cDNA and gene- and tissue specific expression.Gene252: 107–117.
66. Wang YM, Madanat FF, Kimball JC, Gleiser CA, Ali MK, Kaufman MW,van Eys J (1980). Effect of vitamin E against adriamycin-induced toxicityin rabbits.Cancer Res40: 1022–1027.
67. Prestera T, Holtzclaw WD, Zhang Y, Talalay P (1993). Chemical and molec-ular regulation of enzymes that detoxify carcinogens.Proc Natl Acad SciUSA90: 2965–2969.
68. Inamdar NM, Ahn YI, Alam J (1996). The heme-responsive element ofthe mouse heme oxygenase-1 gene is an extended AP-1 binding site thatresembles the recognition sequences MAF and NF-E2 transcription factors.Biochem Biophys Res Commun221: 570–576.
69. Prestera T, Talalay P, Alam J, Ahn YI, Lee PJ, Choi AM (1995). Parallel in-duction of heme oxygenase-1 and chemoprotective phase 2 enzymes by elec-trophiles and antioxidants: Regulation by upstream antioxidant-responsiveelements (ARE).Mol Med1: 827–837.
70. Elbirt KK, Bonkovsky HL (1999). Heme oxygenase: Recent advances inunderstanding its regulation and role.Proc Assoc Am Phys111: 438–447.
71. Vile GF, Basu-Modak S, Waltner C, Tyrrell RM (1994). Heme oxygenase 1mediates an adaptive response to oxidative stress in human skin fibroblasts.Proc Natl Acad Sci USA91: 2607–2610.
72. Tsuji Y, Ayaki H, Whitman SP, Morrow CS, Torti SV, Torti FM (2000).Coordinate transcriptional and translational regulation of ferritin in responseto oxidative stress.Mol Cell Biol 20: 5818–5827.
73. Dorner A, Schultheiss HP (2000). The myocardial expression of the adeninenucleotide translocator isoforms is specifically altered in dilated cardiomy-opathy.Herz25: 176–180.
74. Van Vleet JF, Ferrans VJ, Badylak SF (1982). Effect of thyroid hormonesupplementation on chronic doxorubicin (adriamycin)-induced cardiotox-icity and serum concentrations of T3 and T4 in dogs.Am J Vet Res43:2173–2182.
75. Kahl S, Elsasser TH, Blum JW (2000). Effect of endotoxin challenge onhepatic 5′-deiodinase activity in cattle.Domest Anim Endocrinol18: 133–143.
76. Ito H, Miller SC, Billingham ME, Akimoto H, Torti SV, Wade R, GahlmannR, Lyons G, Kedes L, Torti FM (1990). Doxorubicin selectively inhibitsmuscle gene expression in cardiac muscle cells in vivo and in vitro.ProcNatl Acad Sci USA87: 4275–4279.
at PENNSYLVANIA STATE UNIV on February 21, 2013tpx.sagepub.comDownloaded from