Embed Size (px)
Citation preview
STUDY
PAVEMENT ASSESSMENT
TOWN OF SUPERIOR
JANUARY 2017
EXECUTIVE SUMMARY
This report was funded in part through grants from the Federal Highway Administration, U.S. Department of Transportation. The contents of this report reflect the views of the authors, who are
responsible for the facts and the accuracy of the data, and for the use or adaptation of previously published material, presented
herein. The contents do not necessarily reflect the official views or policies of the Arizona Department of Transportation or the
Federal Highway Administration, U.S. Department of Transportation. This report does not constitute a standard,
specification, or regulation. Trade or manufacturers’ names that may appear herein are cited only because they are considered
essential to the objectives of the report. The U.S. government and the State of Arizona do not endorse products or manufacturers.
The Town of Superior’s Council approved and adopted the study on January 12th, 2017.
TABLE OF CONTENTS
STUDY OVERVIEW ............................................................................................................................... 1
EXISTING CONDITIONS ANALYSIS ........................................................................................................ 3
Pavement Condition Assessment....................................................................................... 3 Roadway Pavement Conditions ........................................................................................ 4 Summary of Existing Issues ............................................................................................... 4
MAINTENANCE AND REPAIR PLAN ....................................................................................................... 7 Prioritization Criteria ....................................................................................................... 7 Recommended Improvements .......................................................................................... 8 Funding Sources ........................................................................................................... 14 Implementation Strategies .............................................................................................. 15
LIST OF TABLES Page
1: Prioritization Scale .......................................................................................................... 7
2: Summary of Recommended Short-Term Improvements ...................................................... 8
3: Recommended Short-Term Improvements ....................................................................... 10
4: Summary of Recommended Mid-Term Improvements ...................................................... 11
5: Summary of Recommended Long-Term Improvements ..................................................... 11
LIST OF FIGURES Page
1: Study Area ..................................................................................................................... 2
2: PCI Rating by Mileage..................................................................................................... 4
3: Pavement Condition Survey Results .................................................................................. 5
4: Summary of Existing Issues .............................................................................................. 6
5: Recommended Short-Term Improvements ......................................................................... 9
6: Recommended Mid-Term Improvements ......................................................................... 12
7: Recommended Long-Term Improvements ....................................................................... 13
8: Recommended Implementation Steps ............................................................................. 15
1
STUDY OVERVIEW The Superior Pavement Assessment Study is a joint effort by the Town of Superior (Town) and the Arizona Department of Transportation (ADOT) to evaluate the Town’s existing pavement conditions in an effort to develop a pavement management plan that prioritizes projects and maximizes limited funding. Pavement management is the systematic process of planning the upgrade and maintenance of pavements in a cost-effective manner that maximizes return on investments and enhances the life of the roadway. Due to a significant decline in the Town’s population and a decrease in revenue, roadway maintenance funds have substantially reduced, requiring the Town to assess and prioritize roadway maintenance needs.
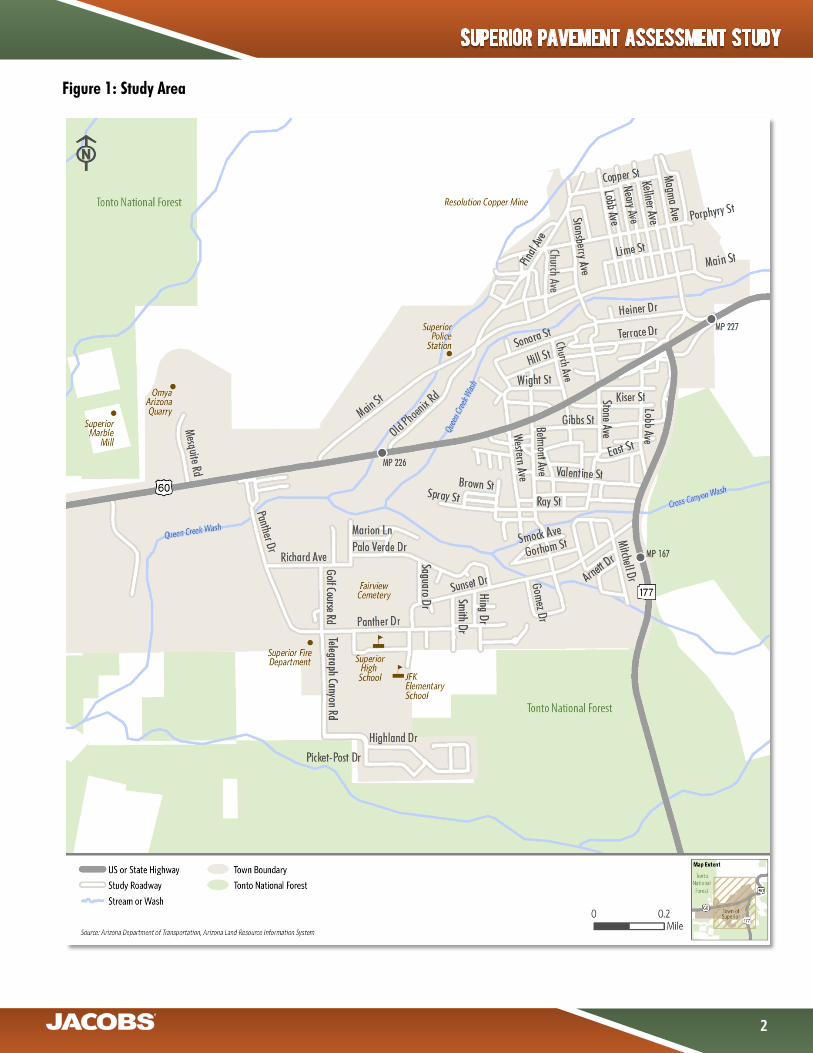
Study Area Situated in the northeast portion of Pinal County, the Town is located at the crossroads of the major regional corridors of US Highway 60 (US 60) and State Route 177 (SR 177).The Town is connected by a series of local roadways and a small network of sidewalks. In total the Town is comprised of 25.6 miles of local roadways, both paved and unpaved. Figure 1 illustrates the study area and study roadway network for this project.
Purpose and Need With the ultimate purpose of enhancing safety and maximizing the value and life of the pavement network, the Superior Pavement Assessment Study was initiated to evaluate the condition of the Town’s infrastructure to develop short- and long-term strategies for the maintenance and repair of the Town’s system of roadways, sidewalks, and pathways. Due to substantial reductions in maintenance funds, the need for this study stemmed directly from the Town’s desire to develop a systematic approach for infrastructure maintenance and rehabilitation that leverages funding to best address the needs of the local transportation network. The project purpose is demonstrated with the following statement of need:
Inventory of Roadway, Sidewalk, Trail, and Path Pavement Conditions. The last full-scale pavement evaluation for the Town was conducted for the 2008 Superior Small Area Transportation Study. Since this study, multiple roadways have been rehabilitated and others have deteriorated for various reasons (i.e., drainage, weathering, usage of heavy-trucks, etc.). Additionally, the Town does not have a current evaluation of sidewalk, trail, and path conditions.
Standardized Pavement Evaluation and Rating. In order to systematically evaluate each roadway section’s health, a standardized pavement condition rating system and evaluation methodology needs to be established.
Develop Prioritized List of Maintenance and Construction Needs. This report will serve as guidance for the planning and prioritization of infrastructure improvements in order for the Town to allocate and obtain funding. The maintenance and construction plan includes: routine and preventative maintenance needs, spot treatments, major and minor rehabilitation, reconstruction, construction of system gaps, and maintenance strategies to provide the best benefit for the dollar.
2
Figure 1: Study Area
3
EXISTING CONDITIONS ANALYSIS
To determine the existing condition and needs of roadways within the Town, the project team performed a detailed evaluation of 23.4 miles of Town maintained roadways. Pavement conditions were compiled via a comprehensive field assessment and video log that spanned three weeks in June/July 2016.
PAVEMENT CONDITION ASSESSMENT
Identification of Pavement Facilities In order to seamlessly collect, store, and analyze pavement condition, a network of roadways to be inspected and inventoried was identified and divided into a series of manageable units based on usage, pavement composition, and condition. For this study, the study area roadways were subdivided into smaller units:
Network: Town maintained roadways used for inventory and analysis. In total, the network includes 23.4 miles of roadways.
Route: an identifiable segment of the network, such a road name or distinct function.
Section: division of routes based on various characteristics, such as change in land use, change in pavement width, crossing US 60, etc.
Sample Unit: smaller segments of each section which manual inspection of pavement distresses and condition are performed on. Distress data from the inspection is used to calculate Pavement Condition Index (PCI) for each sample unit, and in turn, the PCI of each section is calculated based on the PCI values of the sample units within each section.
Methodology The assessment included a comprehensive field review as well as a windshield survey to obtain sidewalk conditions and to determine the overall roughness of a roadway. The field inspection condition survey consisted of a visual inspection of the pavement surfaces for signs of pavement distress resulting from the influence of traffic, materials performance, and the environment. In addition to field inspection, a windshield survey was also conducted for this study to obtain an overall perspective of the roughness of roadways and to collect sidewalk and bicycle facility conditions. A detailed review of the survey methods is available in Superior Pavement Assessment Final Report.
Condition Rating System The Pavement Condition Index (PCI) is a numerical rating of the pavement condition that ranges from 0 to 100 and indicates the general condition of a pavement with the worst possible condition being 0 as Failed, and 100 being rated as Good. Data collected during the field inspection and windshield survey was organized and analyzed using standards and guidelines outlined in the ASTM D6433-11 “Standard Practice for Roads and Parking Lots Pavement Condition Index Surveys” and the PCI rating was calculated for each segment.
4
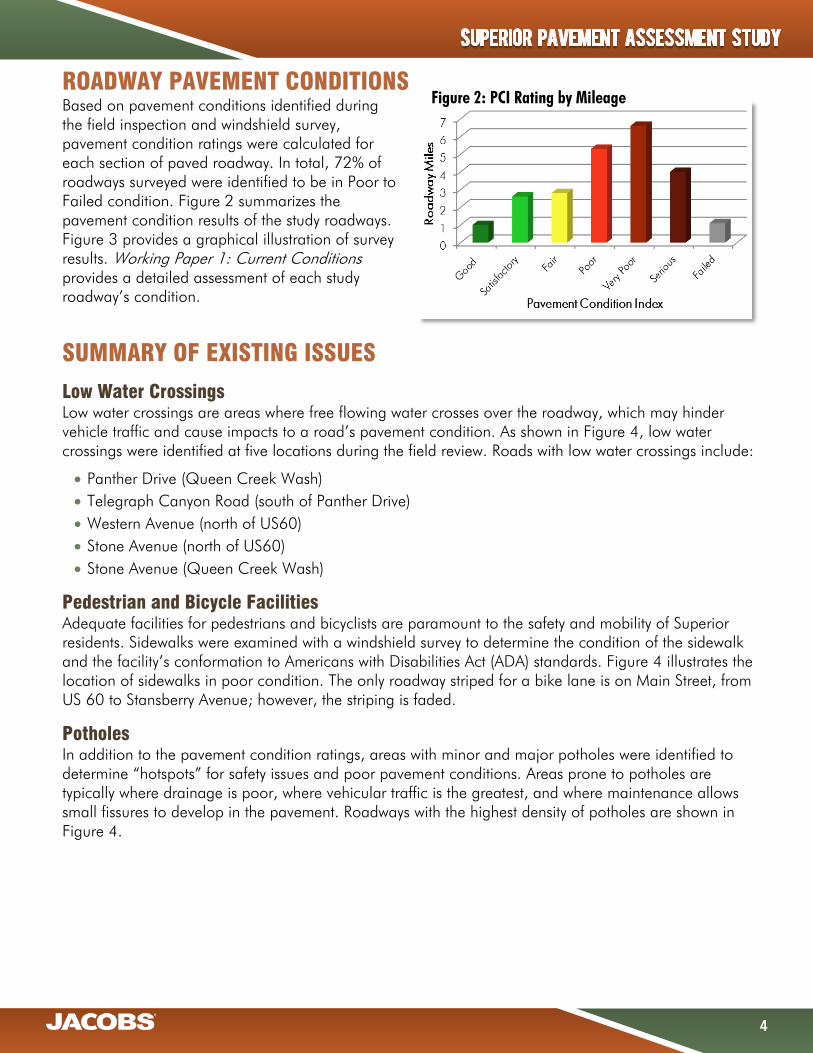
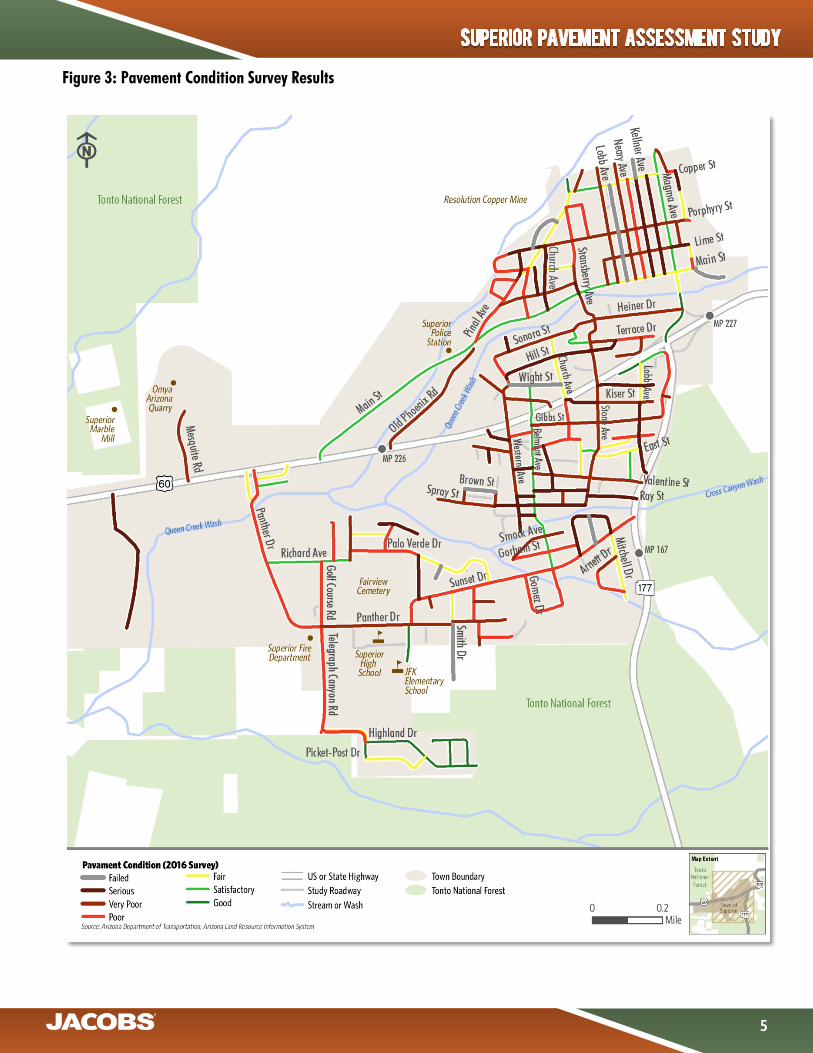
Figure 2: PCI Rating by Mileage ROADWAY PAVEMENT CONDITIONS Based on pavement conditions identified during the field inspection and windshield survey, pavement condition ratings were calculated for each section of paved roadway. In total, 72% of roadways surveyed were identified to be in Poor to Failed condition. Figure 2 summarizes the pavement condition results of the study roadways. Figure 3 provides a graphical illustration of survey results. Working Paper 1: Current Conditions provides a detailed assessment of each study roadway’s condition.
SUMMARY OF EXISTING ISSUES
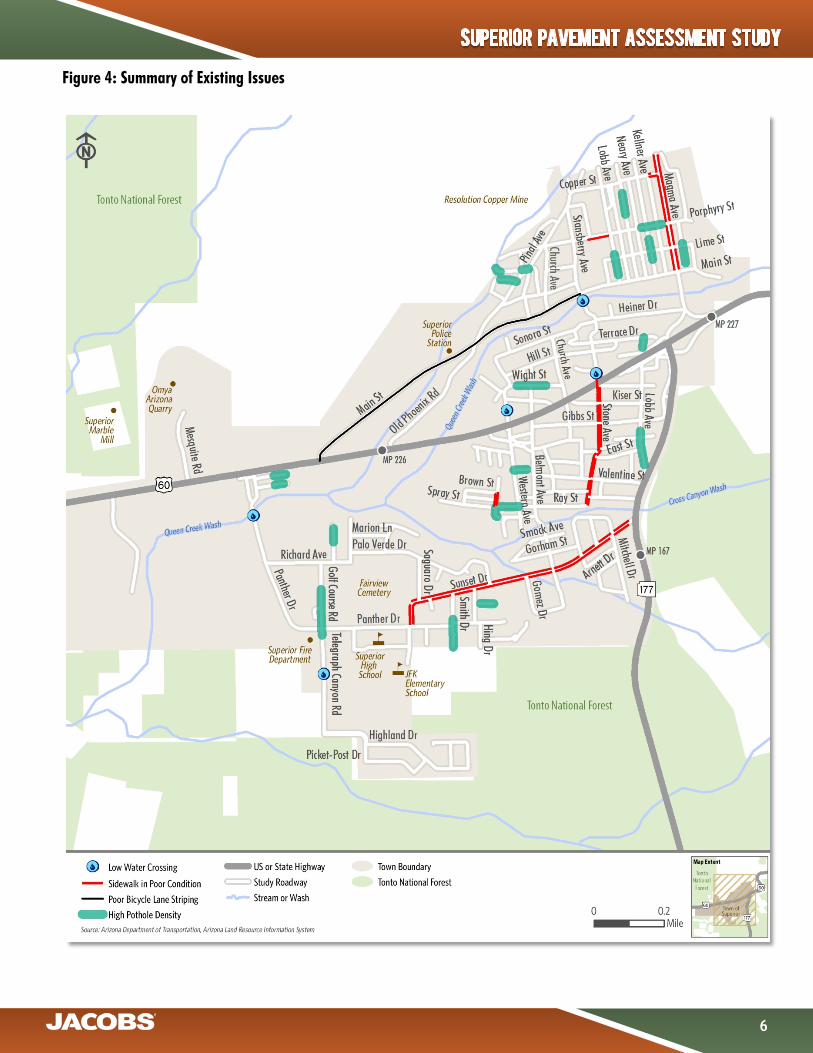
Low Water Crossings Low water crossings are areas where free flowing water crosses over the roadway, which may hinder vehicle traffic and cause impacts to a road’s pavement condition. As shown in Figure 4, low water crossings were identified at five locations during the field review. Roads with low water crossings include:
• Panther Drive (Queen Creek Wash) • Telegraph Canyon Road (south of Panther Drive) • Western Avenue (north of US60) • Stone Avenue (north of US60) • Stone Avenue (Queen Creek Wash)
Pedestrian and Bicycle Facilities Adequate facilities for pedestrians and bicyclists are paramount to the safety and mobility of Superior residents. Sidewalks were examined with a windshield survey to determine the condition of the sidewalk and the facility’s conformation to Americans with Disabilities Act (ADA) standards. Figure 4 illustrates the location of sidewalks in poor condition. The only roadway striped for a bike lane is on Main Street, from US 60 to Stansberry Avenue; however, the striping is faded.
Potholes In addition to the pavement condition ratings, areas with minor and major potholes were identified to determine “hotspots” for safety issues and poor pavement conditions. Areas prone to potholes are typically where drainage is poor, where vehicular traffic is the greatest, and where maintenance allows small fissures to develop in the pavement. Roadways with the highest density of potholes are shown in Figure 4.
5
Figure 3: Pavement Condition Survey Results
6
Figure 4: Summary of Existing Issues
7
MAINTENANCE AND REPAIR PLAN
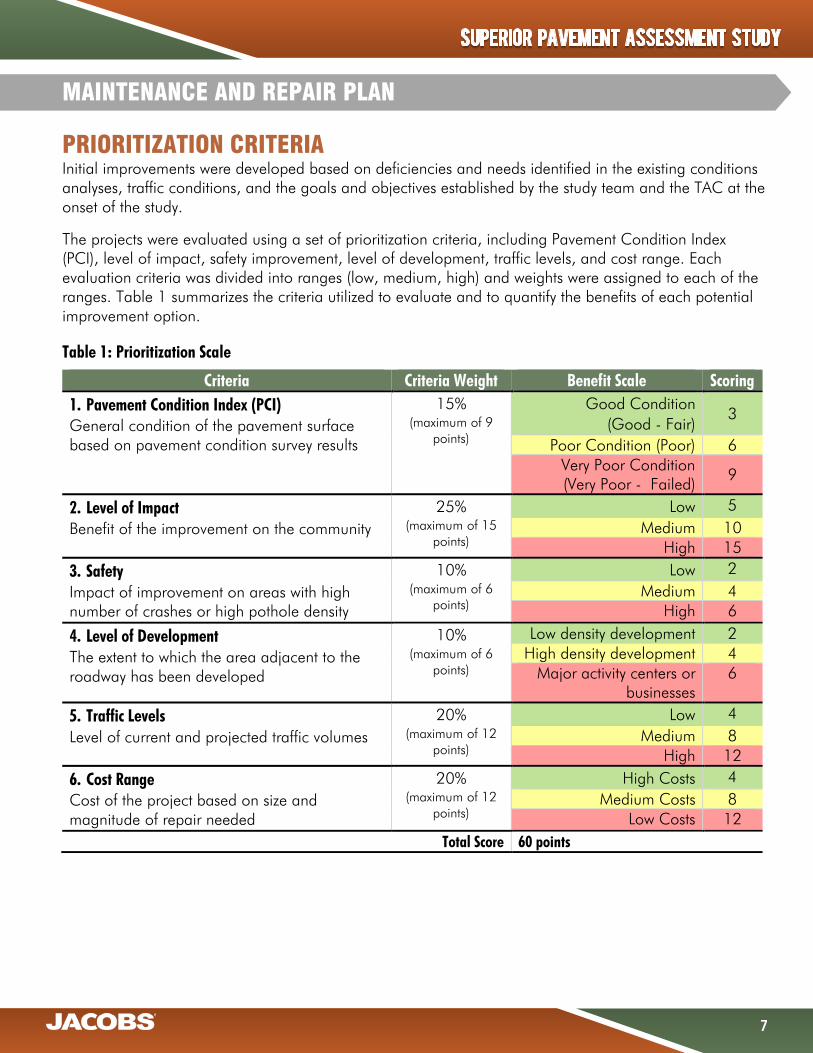
PRIORITIZATION CRITERIA Initial improvements were developed based on deficiencies and needs identified in the existing conditions analyses, traffic conditions, and the goals and objectives established by the study team and the TAC at the onset of the study.
The projects were evaluated using a set of prioritization criteria, including Pavement Condition Index (PCI), level of impact, safety improvement, level of development, traffic levels, and cost range. Each evaluation criteria was divided into ranges (low, medium, high) and weights were assigned to each of the ranges. Table 1 summarizes the criteria utilized to evaluate and to quantify the benefits of each potential improvement option.
Table 1: Prioritization Scale
Criteria Criteria Weight Benefit Scale Scoring 1. Pavement Condition Index (PCI) General condition of the pavement surface based on pavement condition survey results
15% (maximum of 9
points)
Good Condition (Good - Fair)
3
Poor Condition (Poor) 6 Very Poor Condition (Very Poor - Failed)
9
2. Level of Impact Benefit of the improvement on the community
25% (maximum of 15
points)
Low 5 Medium 10
High 15
3. Safety Impact of improvement on areas with high number of crashes or high pothole density
10% (maximum of 6
points)
Low 2 Medium 4
High 6
4. Level of Development The extent to which the area adjacent to the roadway has been developed
10% (maximum of 6
points)
Low density development 2 High density development 4
Major activity centers or businesses
6
5. Traffic Levels Level of current and projected traffic volumes
20% (maximum of 12
points)
Low 4 Medium 8
High 12
6. Cost Range Cost of the project based on size and magnitude of repair needed
20% (maximum of 12
points)
High Costs 4 Medium Costs 8
Low Costs 12 Total Score 60 points
8
RECOMMENDED IMPROVEMENTS This section presents the Maintenance and Repair Plan for the short (2016-2021), mid (2022-2026), and long-term (2027-2036) planning horizons. During discussions with Town staff, the Town anticipates spending $250,000 per year on pavement maintenance projects. Utilizing this estimate, the Town may have approximately $1,250,000 available to spend on pavement preservation during the short-term phase.
Based on the prioritization process and the potential funding availability, a three-phased (short-, mid-, long-term) maintenance and repair plan has been developed to address the Town’s pavement repair needs. Recommended short-term improvements are provided in Tables 2 – 3 and illustrated in Figure 5. Tables 4 – 5 and Figures 6 – 7 present the mid- and long-term recommendations, respectively. If additional funding becomes available, projects from the mid- and long-term phases could be implemented earlier.
Note: Cost estimates developed for the projects are planning level costs and are based on typical per-mile/foot construction costs in 2016 dollars. Estimated costs for each project are expressed in 2016 dollars and do not include costs associated with right-of-way acquisitions and drainage improvements. Actual costs for projects could vary at the time of implementation; therefore, a detailed analysis may need to be performed on a case-by-case basis to determine actual costs. Unless otherwise noted, the recommended projects are not yet funded. The costs include 15% for design (except crack seal projects) and a 10% contingency.
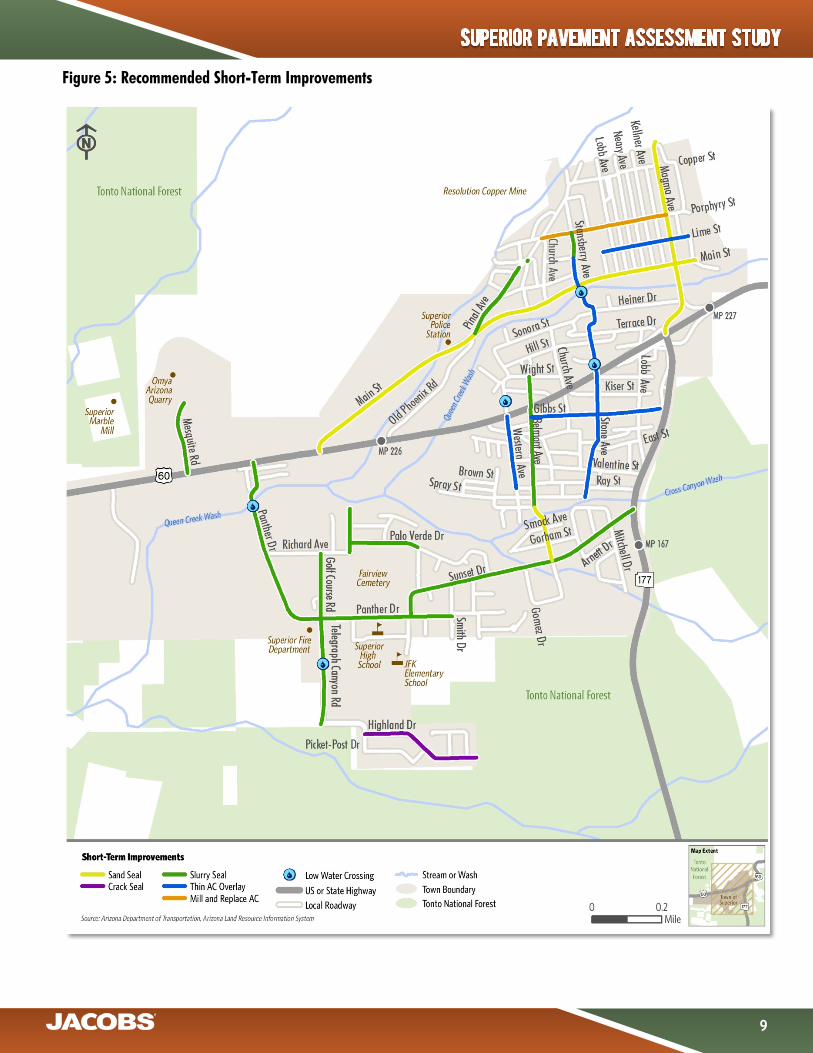
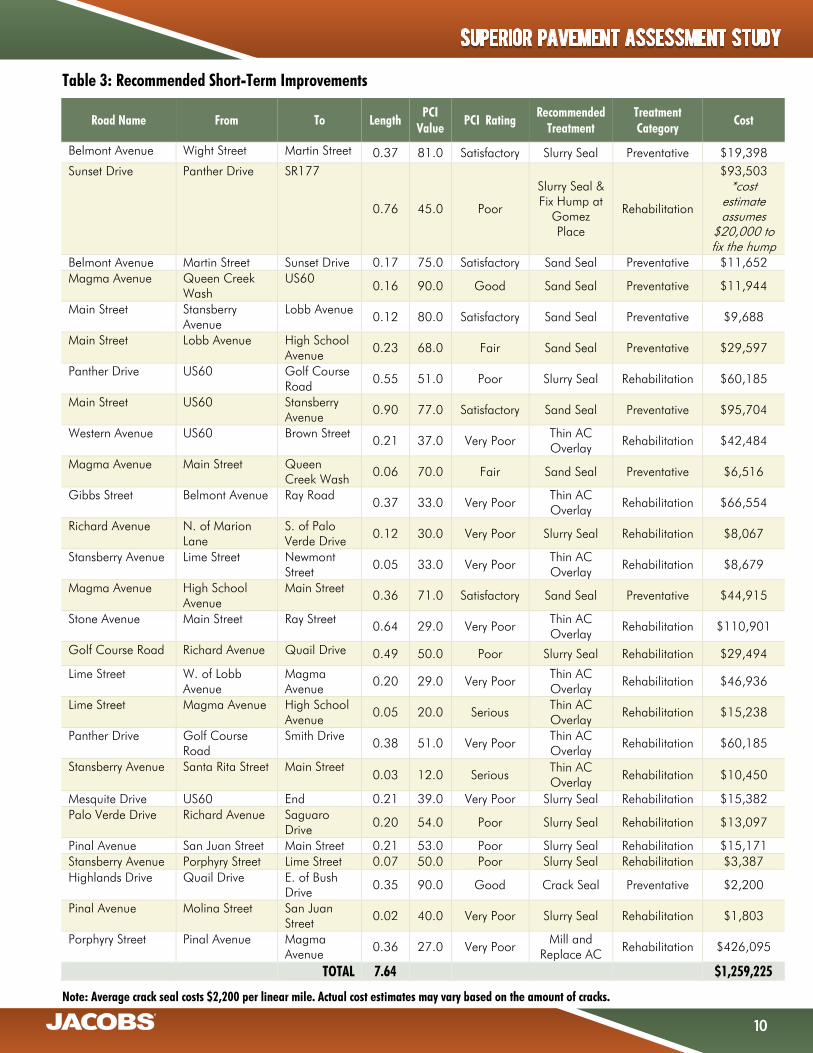
Recommended Short-Term Improvements Recommended pavement treatment options and their estimated costs are presented in Table 3. Table 2 summarizes the total mileage and cost for the short-term phase. Figure 5 provides an illustration of the recommended improvements for the short-term phase.
Table 2: Summary of Recommended Short-Term Improvements
Recommended Treatment Total Length Estimated Cost
Preventative 2.72 $ 231,614
Crack Seal 0.35 $2,200
Sand Seal 2 $210,016
Slurry Seal 0.37 $19,398
Rehabilitation 4.92 $1,027,611
Mill and Replace AC 0.36 $426,095
Slurry Seal 3.01 $300,274
Thin AC Overlay 1.55 $301,242
TOTAL 7.64 $1,259,225
9
Figure 5: Recommended Short-Term Improvements
10
Table 3: Recommended Short-Term Improvements
Road Name From To Length PCI
Value PCI Rating
Recommended Treatment
Treatment Category
Cost
Belmont Avenue Wight Street Martin Street 0.37 81.0 Satisfactory Slurry Seal Preventative $19,398 Sunset Drive Panther Drive SR177
0.76 45.0 Poor
Slurry Seal & Fix Hump at
Gomez Place
Rehabilitation
$93,503 *cost
estimate assumes
$20,000 to fix the hump
Belmont Avenue Martin Street Sunset Drive 0.17 75.0 Satisfactory Sand Seal Preventative $11,652 Magma Avenue Queen Creek
Wash US60
0.16 90.0 Good Sand Seal Preventative $11,944
Main Street Stansberry Avenue
Lobb Avenue 0.12 80.0 Satisfactory Sand Seal Preventative $9,688
Main Street Lobb Avenue High School Avenue 0.23 68.0 Fair Sand Seal Preventative $29,597
Panther Drive US60 Golf Course Road 0.55 51.0 Poor Slurry Seal Rehabilitation $60,185
Main Street US60 Stansberry Avenue 0.90 77.0 Satisfactory Sand Seal Preventative $95,704
Western Avenue US60 Brown Street 0.21 37.0 Very Poor
Thin AC Overlay Rehabilitation $42,484
Magma Avenue Main Street Queen Creek Wash 0.06 70.0 Fair Sand Seal Preventative $6,516
Gibbs Street Belmont Avenue Ray Road 0.37 33.0 Very Poor
Thin AC Overlay Rehabilitation $66,554
Richard Avenue N. of Marion Lane
S. of Palo Verde Drive 0.12 30.0 Very Poor Slurry Seal Rehabilitation $8,067
Stansberry Avenue Lime Street Newmont Street 0.05 33.0 Very Poor
Thin AC Overlay Rehabilitation $8,679
Magma Avenue High School Avenue
Main Street 0.36 71.0 Satisfactory Sand Seal Preventative $44,915
Stone Avenue Main Street Ray Street 0.64 29.0 Very Poor Thin AC Overlay
Rehabilitation $110,901
Golf Course Road Richard Avenue Quail Drive 0.49 50.0 Poor Slurry Seal Rehabilitation $29,494
Lime Street W. of Lobb Avenue
Magma Avenue
0.20 29.0 Very Poor Thin AC Overlay
Rehabilitation $46,936
Lime Street Magma Avenue High School Avenue
0.05 20.0 Serious Thin AC Overlay
Rehabilitation $15,238
Panther Drive Golf Course Road
Smith Drive 0.38 51.0 Very Poor Thin AC Overlay
Rehabilitation $60,185
Stansberry Avenue Santa Rita Street Main Street 0.03 12.0 Serious
Thin AC Overlay Rehabilitation $10,450
Mesquite Drive US60 End 0.21 39.0 Very Poor Slurry Seal Rehabilitation $15,382 Palo Verde Drive Richard Avenue Saguaro
Drive 0.20 54.0 Poor Slurry Seal Rehabilitation $13,097
Pinal Avenue San Juan Street Main Street 0.21 53.0 Poor Slurry Seal Rehabilitation $15,171 Stansberry Avenue Porphyry Street Lime Street 0.07 50.0 Poor Slurry Seal Rehabilitation $3,387 Highlands Drive Quail Drive E. of Bush
Drive 0.35 90.0 Good Crack Seal Preventative $2,200
Pinal Avenue Molina Street San Juan Street 0.02 40.0 Very Poor Slurry Seal Rehabilitation $1,803
Porphyry Street Pinal Avenue Magma Avenue 0.36 27.0 Very Poor
Mill and Replace AC Rehabilitation $426,095
TOTAL 7.64 $1,259,225
Note: Average crack seal costs $2,200 per linear mile. Actual cost estimates may vary based on the amount of cracks.
11
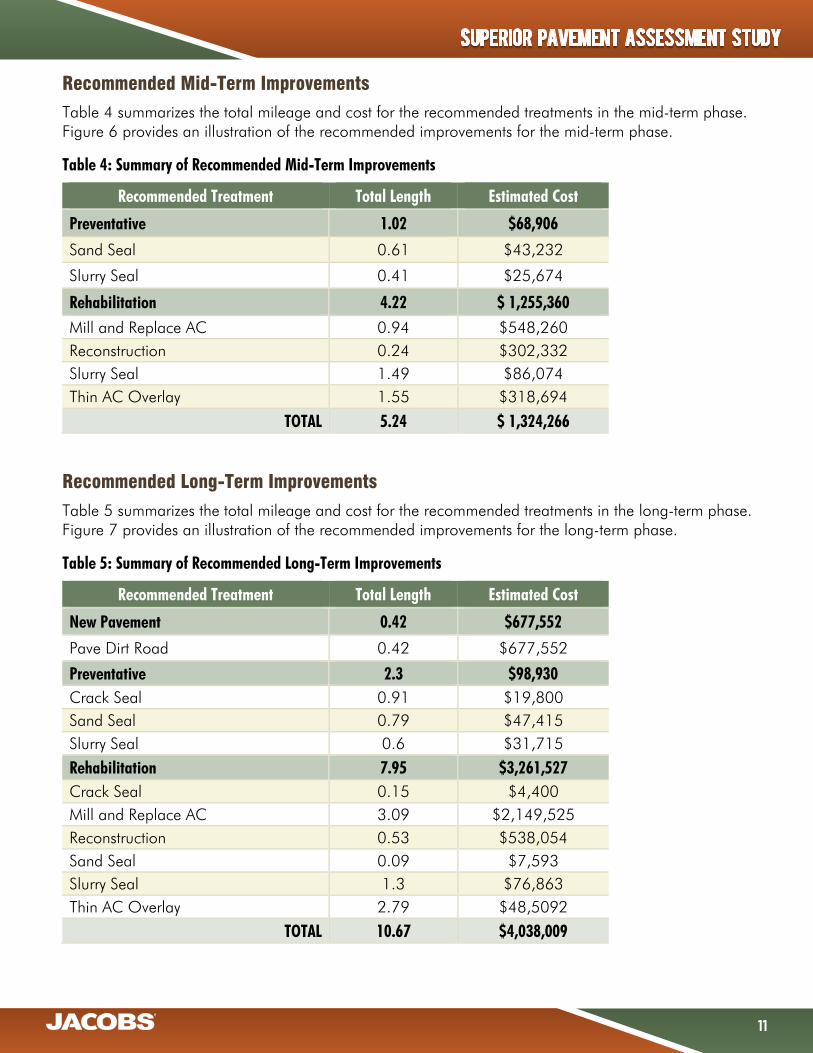
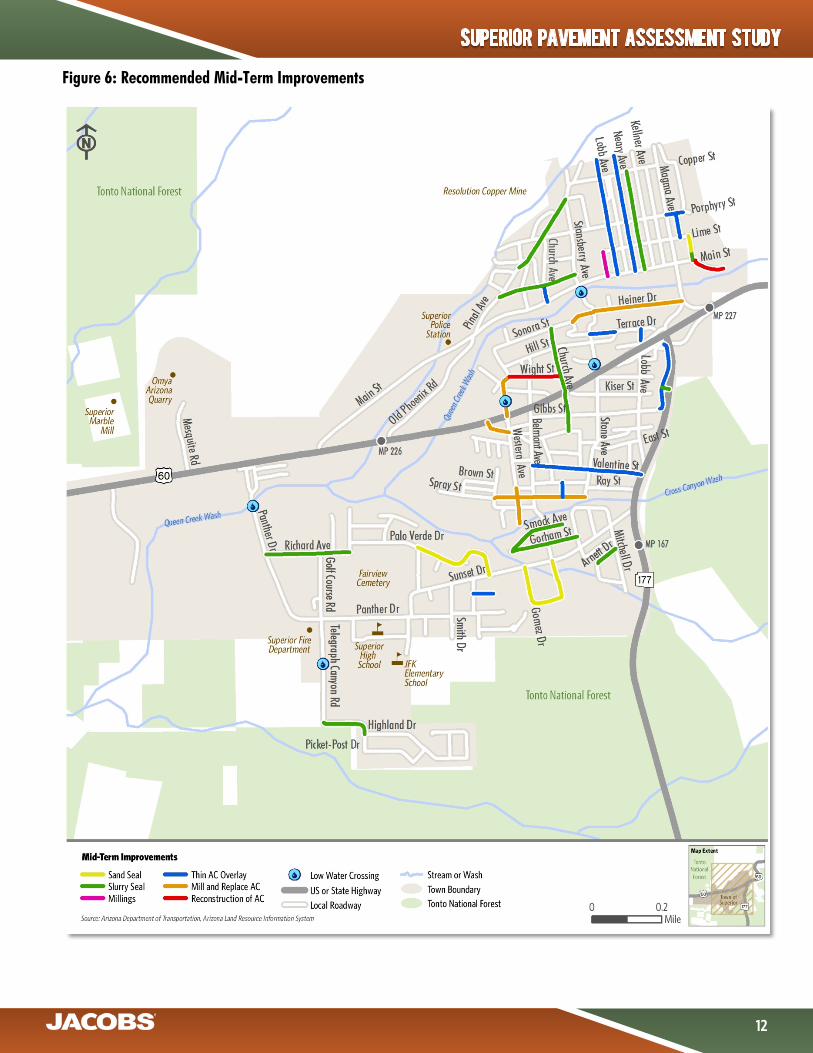
Recommended Mid-Term Improvements Table 4 summarizes the total mileage and cost for the recommended treatments in the mid-term phase. Figure 6 provides an illustration of the recommended improvements for the mid-term phase.
Table 4: Summary of Recommended Mid-Term Improvements
Recommended Treatment Total Length Estimated Cost
Preventative 1.02 $68,906
Sand Seal 0.61 $43,232
Slurry Seal 0.41 $25,674
Rehabilitation 4.22 $ 1,255,360 Mill and Replace AC 0.94 $548,260 Reconstruction 0.24 $302,332 Slurry Seal 1.49 $86,074 Thin AC Overlay 1.55 $318,694
TOTAL 5.24 $ 1,324,266
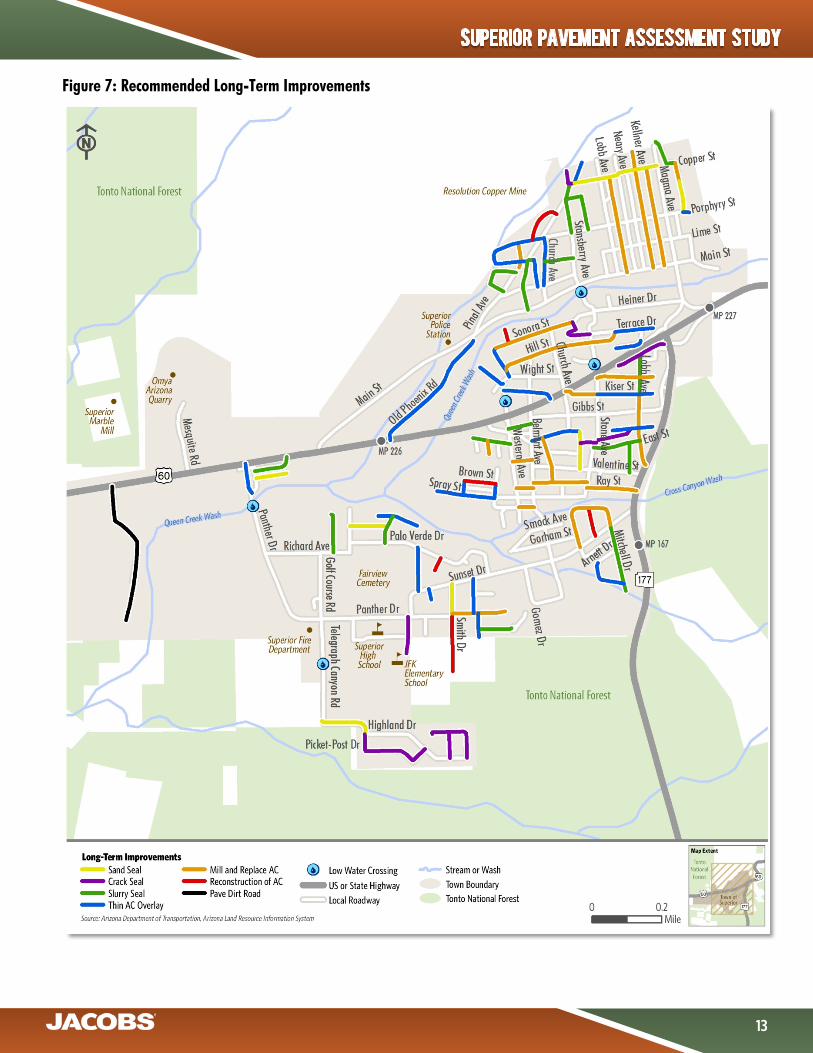
Recommended Long-Term Improvements Table 5 summarizes the total mileage and cost for the recommended treatments in the long-term phase. Figure 7 provides an illustration of the recommended improvements for the long-term phase.
Table 5: Summary of Recommended Long-Term Improvements
Recommended Treatment Total Length Estimated Cost
New Pavement 0.42 $677,552
Pave Dirt Road 0.42 $677,552
Preventative 2.3 $98,930 Crack Seal 0.91 $19,800 Sand Seal 0.79 $47,415 Slurry Seal 0.6 $31,715
Rehabilitation 7.95 $3,261,527 Crack Seal 0.15 $4,400 Mill and Replace AC 3.09 $2,149,525 Reconstruction 0.53 $538,054 Sand Seal 0.09 $7,593 Slurry Seal 1.3 $76,863 Thin AC Overlay 2.79 $48,5092
TOTAL 10.67 $4,038,009
12
Figure 6: Recommended Mid-Term Improvements
13
Figure 7: Recommended Long-Term Improvements
14
FUNDING SOURCES
Existing Funding Sources Paved roads require routine maintenance such as patching, crack sealing, repair and cleaning, and striping. The successful implementation of the Superior Pavement Assessment Study is contingent upon the availability of funding for design and construction of improvements. Primary funding sources for the area include Highway User Revenue Funds (HURF), federal programs, ADOT, and other regional government agencies such as CAG.
Highway User Revenue Fund (HURF) The State of Arizona taxes motor fuels and collects a variety of fees relating to the registration and operation of motor vehicles in the state. These collections include gasoline and use fuel taxes, motor carrier fees, vehicle license taxes, motor vehicle registration fees, and other miscellaneous fees. These revenues are distributed to the cities, towns, and counties of the state and to the State Highway Fund, which is administered by ADOT. These taxes and fees represent a source of revenue available for highway-related expenses. In fiscal year 2016, the HURF distribution to Pinal County was $19.1 million, of which $212,169 was allocated to the Town. Additionally, the potentially upcoming HURF exchange program can be utilized to secure funds. This program can be used to exchange funding obtained through Federal funds for HURF funds.
Supplementary Funding Sources
Pinal Regional Transportation Authority (RTA) In addition to the funding allocated from the Highway User Revenue Fund, the Town has an opportunity to obtain additional funding from the Pinal RTA for projects which improve local roadways. The Town is one of four jurisdictions which will receive $300,000 per year of available revenues to be utilized on local roadway development if the regional transportation plan and tax is approved by Pinal County voters.
Potential Federal Funding The Federal government allocates a certain amount of money for roadway improvements and other development activities through grants. Grants such as the Community Development Block Grant Program (CDBG) are administered by the Arizona Department of Housing and can be used on projects such as property acquisition; construction or reconstruction of streets, sidewalks, pathways; and planning activities.
15
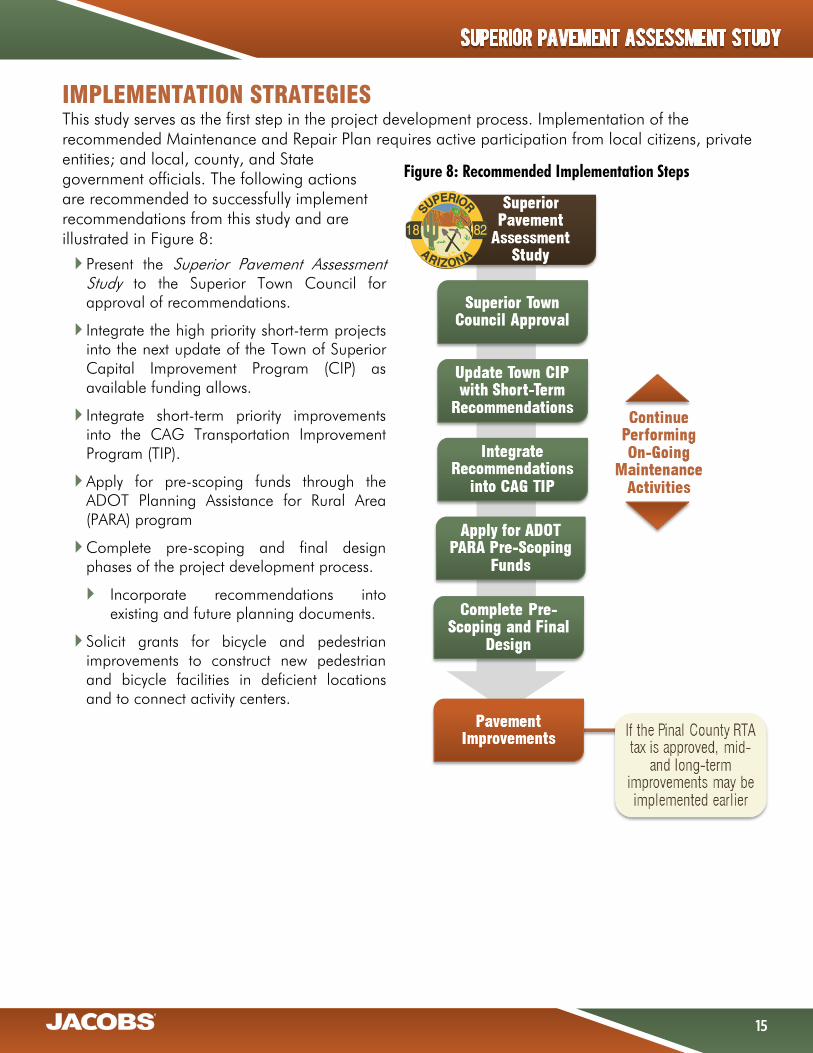
IMPLEMENTATION STRATEGIES This study serves as the first step in the project development process. Implementation of the recommended Maintenance and Repair Plan requires active participation from local citizens, private entities; and local, county, and State government officials. The following actions are recommended to successfully implement recommendations from this study and are illustrated in Figure 8:
Present the Superior Pavement Assessment Study to the Superior Town Council for approval of recommendations.
Integrate the high priority short-term projects into the next update of the Town of Superior Capital Improvement Program (CIP) as available funding allows.
Integrate short-term priority improvements into the CAG Transportation Improvement Program (TIP).
Apply for pre-scoping funds through the ADOT Planning Assistance for Rural Area (PARA) program
Complete pre-scoping and final design phases of the project development process.
Incorporate recommendations into existing and future planning documents.
Solicit grants for bicycle and pedestrian improvements to construct new pedestrian and bicycle facilities in deficient locations and to connect activity centers.
Figure 8: Recommended Implementation Steps