Embed Size (px)
Citation preview
Fax +41 61 306 12 34E-Mail [email protected]
Special Applications
Cytogenet Genome Res 114:367–378 (2006) DOI: 10.1159/000094227
Towards many colors in FISH on 3D-preserved interphase nuclei J. Walter
a B. Joffe
b A. Bolzer
b H. Albiez
b P.A. Benedetti
c S. Müller
b M.R. Speicher
d T. Cremer
b M. Cremer
b I. Solovei
b a
TILL I.D. GmbH, c\o BioImaging Zentrum, Martinsried ; b Chair of Anthropology and Human Genetics,
Department of Biology II, Ludwig-Maximilians-University, Martinsried (Germany); c
IPCF-CNR, Pisa (Italy); d Technical University and GSF, Institute of Human Genetics, Munich (Germany)
evolved to a widely used tool for studying the spatial organi-zation of the genome from individual chromosome territo-ries (CTs) and subchromosomal domains down to single gene loci and nascent RNA transcripts. The combination of 3D-FISH techniques with DNA replication labeling or im-munostaining of defined nuclear proteins has widened the options to study nuclear architecture in a functional context (for recent reviews see Parada et al., 2004; Foster and Brid-ger, 2005). Such studies necessitate the simultaneous visual-ization of numerous differently labeled intranuclear targets. This can be achieved by multicolor approaches such as 3D-multicolor-FISH, further referred to as 3D-M-FISH.
The basic requirement for 3D-FISH is a good preserva-tion of native chromatin arrangement in fixed nuclei. Fixa-tion methods and pretreatments necessary for successful 3D-FISH on DNA and RNA targets, including protocols for combinatorial FISH/immunostaining techniques, were de-scribed in detail in earlier publications from our and other laboratories (Bridger and Lichter, 1999; Solovei et al., 2002a, b; Tam et al., 2002; Cremer et al., 2006). Here we will focus on the synopsis of 3D-M-FISH and microscopy as two inter-related parts of a single process.
Abstract. The article reviews the existing methods of mul-ticolor FISH on nuclear targets, first of all, interphase chro-mosomes. FISH proper and image acquisition are considered as two related components of a single process. We discuss (1) M-FISH (combinatorial labeling + deconvolution + wide-field microscopy); (2) multicolor labeling + SIM (structured illumination microscopy); (3) the standard approach to mul-ticolor FISH + CLSM (confocal laser scanning microscopy; one fluorochrome – one color channel); (4) combinatorial
Request reprints from Irina SoloveiChair of Anthropology and Human Genetics, Department of Biology IILudwig-Maximilians-University, BiozentrumGrosshadernerstrasse 2, DE–82152 Martinsried (Germany)telephone: (+49) 89 2180 74 326; fax: (+49) 89 2180 74 331e-mail: [email protected]
Present address of A.B.: Carl Zeiss AGZeppelinstrasse 4, DE–85399 Hallbergmoos (Germany)
Present address of M.R.S.: Institute for Medical Biology and Human Genetics, Medical University of GrazHarrachgasse 21/8, AT–8010 Graz (Austria)
J.W. and B.J. contributed equally to this work.
© 2006 S. Karger AG, Basel1424–8581/06/1144–0367$23.50/0
Accessible online at:www.karger.com/cgr
labeling + CLSM; (5) non-combinatorial labeling + CLSM + linear unmixing. Two related issues, deconvolution of im-ages acquired with CLSM and correction of data for chro-matic Z-shift, are also discussed. All methods are illustrated with practical examples. Finally, several rules of thumb help-ing to choose an optimal labeling + microscopy combination for the planned experiment are suggested.
Copyright © 2006 S. Karger AG, Basel
Fluorescence in situ hybridization of DNA/RNA probes to three-dimensionally preserved cells, so called 3D-FISH, allows three-dimensional visualization of specific DNA or RNA targets within the interphase nucleus. 3D-FISH has
This work was supported by grants to T. Cremer and M. Speicher from the Wilhelm-Sanderstiftung (2001.079.2) and from the Bundesministerium für Bildung und Forschung NGFN II-EP (0313377A), to T. Cremer from the Deutsche Forschungsgesellschaft (CR 59/22-2), to S. Müller from the Deutsche Forschungsgesellschaft (MU 1850/2-1) and to M. Speicher from the Deutsche Forschungsgesellschaft (SP 460/5-1).
Manuscript received 31 January 2006; accepted in revised form for publication by T. Liehr, 19 February 2006.
Cytogenet Genome Res 114:367–378 (2006)368
It should be kept in mind that 3D-microscopy and mul-ticolor 3D-microscopy are not restricted to expensive confo-cal laser scanning microscopes (CLSMs). As a matter of fact, when multiple labeling is concerned, conventional (wide-field) microscopes have important advantages of their own, especially, in combination with modern methods of image processing (first of all, deconvolution). Unfortunately, most often researchers do not have a free choice of the microscope for image acquisition but are restricted to instruments avail-able at their scientific institutions. At the same time, the ad-vantages of different labeling schemes can only be realized by an appropriate method of image acquisition. This means that the method of microscopy should already be taken into account when a multicolor experiment is planned: labeling scheme and microscopy technique come as a package. A comprehensive review of 3D-microscopy (optical sectioning microscopy) has recently been published by Conchello and Lichtman (2005). This article is focused on its applications in nuclear biology.
Combinatorial labeling and wide-field epifluorescence microscopy in combination with image deconvolution
Multicolor FISH is currently an important tool for stain-ing metaphase chromosomes and their subregions (Schröck et al., 1996; Speicher et al., 1996; Chudoba et al., 1999; Tanke et al., 1999; Speicher and Carter, 2005). High-resolution multicolor banding has also been successfully applied to dif-ferential staining of chromosome subregions in human in-terphase nuclei (Lemke et al., 2002). The principal practical application of multicolor FISH, differential staining of mi-totic chromosomes and their subregions on metaphase spreads, is performed with wide-field microscopes. Their most important advantage is narrow bandpass filters (Azo-feifa et al., 2000) that can distinguish between fluorochromes with as similar spectra as, e.g., Cy3 (emission maximum at 568 nm) and Cy3.5 (emission maximum at 588 nm). There-fore, with a strong signal (or sufficiently extended exposure time), one can reliably distinguish between up to 8 fluoro-chromes at the hardware level. The disadvantage of wide-field epifluorescence microscopy, especially with regard to 3D studies, is that wide-field images comprise light coming from objects (or parts of the same object) that are not situ-ated in the plane of focus. These out-of-focus objects gener-ate a blurred background, which partially or completely ob-scures objects in the plane of focus. This is a serious problem since 3D-microscopy requires image stacks made at different Z-levels. However, as blur formation follows well known laws of optics, one can try to reduce blur by processing the images after acquisition. This method is known as deconvo-lution. The necessary technical prerequisite for this approach is that the microscope is supplied with a motorized focus drive, preferably a piezoelectric one, to ensure the accuracy of Z-movement of the stage.
The number of differentially visualized DNA-targets can be increased by combinatorial labeling, allowing e.g. the si-multaneous visualization of all chromosomes in the human
karyotype. There are two common variants of this method: M-FISH (Speicher et al., 1996) and SKY-FISH (Schröck et al., 1996). COBRA-FISH employs a combination of both ra-tio and combinatorial labeling (Tanke et al., 1999). M-FISH, based on using narrow band pass filters, is the most appro-priate variant for 3D-microscopy of interphase nuclei – at least, the only one that has so far been successfully used for this purpose. Modern microscopes have motorized filter wheels with eight to ten filters. In practice, one filter has to be reserved for DNA counterstain (e.g., DAPI), which leaves seven or nine filters, respectively, for fluorochromes used in multi-color staining. The main principle of M-FISH is to la-bel different chromosomes with different combinations of fluorochromes (for a review of combinational multicolor strategies see Fauth and Speicher, 2001). The image of a sam-ple is made with each filter. After that, a special software dis-tinguishes between differently labeled chromosomes or their regions after superimposition of acquired raw images and produces a resulting image in which each chromosome is marked with a unique ‘false’ color (Eils et al., 1998). Theo-retically, with seven fluorochromes one can distinguish be-tween 127 staining patterns (2 n – 1; n = number of fluoro-chromes).
The fact that chromosome territories (CTs) occupy dis-tinct nuclear regions makes it possible to apply combinato-rial labeling of CTs to the interphase nucleus and has allowed the differential staining and simultaneous visualization of all 46 chromosome territories in interphase nuclei of primary human fibroblasts using seven fluorochromes (Bolzer et al., 2005). This approach requires an appropriate labeling scheme ( Fig. 1 A), which determines not only the labeling patterns for individual chromosomes (columns), but also groups of chromosomes to be labeled with each fluorochrome (rows). DNA for painting probes was obtained by flow-sorting and DNA samples of each chromosome to be labeled with the same fluorochrome (or hapten) were mixed to generate sev-en different pools: one for each fluorochrome (Eils et al., 1998; Azofeifa et al., 2000). Pooled DNA was amplified and labeled by DOP-PCR (Telenius et al., 1992) with the corre-sponding fluorochrome. For staining, the pools were mixed together in proportions that were checked and adjusted for correctness and evenness on metaphase spreads ( Fig. 1 B). Hybridization on the 3D-preserved cell nuclei was per-formed in a standard way at 37 ° C for 72 h (Solovei et al., 2002b; Bolzer et al., 2005). After washing and detection the nuclei were counterstained with DAPI and mounted on a slide in phenylene diamine antifade solution.
3D-image stacks were acquired on a Leica DMRXA epi-fluorescence microscope equipped with an eight-filter wheel, a mechanic motorized stage, and the software QFLUORO (Leica) used for image acquisition. Image stacks were ac-quired with 250-nm interval between optical sections, a sampling density that satisfied Nyquist criterion (McNally et al., 1999) for the objective used (63 ! /1.4 NA). To be able to make deconvolution, image stacks of 100-nm beads (Mo-lecular Probes, Invitrogen) were acquired with the same im-age acquisition settings that allowed calculation of the point spread function (PSF). The PSF shows how much light from

Cytogenet Genome Res 114:367–378 (2006) 369
a known point-like source will be detected in different parts of optical sections below and above this source: it serves as the master-pattern for deconvolution. Deconvolution was carried out with the software Huygens (SVI, Netherlands). Deconvolved images were processed with a software devel-oped by Saracoglu et al. (2001) that classified voxels to stain-ing patterns, i.e., chromosomes ( Fig. 1 C, D).
Deconvolution plays a crucial role when 3D-imaging is performed by wide-field microscopy. Correspondingly, the results always depend to a certain degree on the algorithm chosen for deconvolution, its realization in the software used, and experience of the researcher, because deconvolu-tion always includes a certain arbitrary element (see for re-view Conchello and Lichtman, 2005). Though Huygens soft-
Fig. 1. Multicolor FISH using wide-field microscopy. ( A–F ) Mapping all chromosome territories in the interphase human fibroblast nucleus by M-FISH. ( A ) Labeling scheme. ( B ) Testing of the M-FISH mixture on a metaphase spread. A mid section ( C ) and section taken at a 2- � m dis-tance from the mid section ( D ) before deconvolution (left), after decon-volution (middle), and after analysis by the color classification software that assigns chromosomes (numbered) individual false colors (right). Bar = 10 � m. ( E–F ) Application of structured illumination microscopy (SIM) for visualization of interphase chromosomes. The ViCo system was based on a Nikon TE-2000 inverted microscope, equipped with a
100-Watt Hg arc lamp and a triple-band dichroic filter (#82000, Chroma Technology, USA) with suitable excitation filters. Acquisition time was about 60 s per optical section (64 mask positions). Voxel size of theimage was 120 ! 120 ! 520 nm (X ! Y ! Z). Chromosome territories 18 (red) and 19 (green) were detected by 3D-FISH in the nucleus of a Jurkat cell (T-cell derived leukemic cell line); the nucleus was counterstained with DAPI (blue). A gallery of sequential optical sections ( E ) and the maximum intensity projection ( F ) from the image stack are shown.Bar = 10 � m.
Cytogenet Genome Res 114:367–378 (2006)370
ware became the deconvolution software of choice in our laboratory, several other packages exist, some of them much less expensive than Huygens: ZeissVision (Carl Zeiss, Ger-many), VayTek Image (Vay Tek Inc, USA), TILLvisION (TILL Photonics, Germany), Autodeblur (Autoquant, USA), free plugins in Image J, the internet site with Conchello’s method (http://www.omrfcosm.omrf.org), etc.
Application of structured illumination microscopy (SIM)
Structured illumination is a promising relatively new ap-proach to epifluorescence 3D-microscopy. This approach is bound stronger to real physical measurements and is less de-pendent on calculations with many changeable parameters than deconvolution. Three systems of structured illumina-tion microscopy (SIM) are now commercially available: OptiGrid from Optem (USA), ApoTome from Zeiss (Ger-many), and ViCo from Biomedica Mangoni (Italy). The vari-ant of SIM exploited by the two former systems illuminates the sample through a mask, which superimposes a grid of illuminated and non-illuminated areas on the sample. Three images are made with different positions of the mask, so that each point of the sample is imaged in an illuminated and in a shielded state. ViCo uses illumination through a mask car-rying an array of pinholes. To cover the whole field, several images are taken with different positions of the mask. The exact number of images is at least nine but, depending on the pinhole size and distances between pinholes, may be much higher. Therefore, there is a tradeoff between the used pin-hole density and acquisition speed. The main idea of SIM is that the structures of interest – those in the focus plane – will not be seen when they are shielded, while structures seen in the shielded parts are out of focus light sources. Roughly speaking, the difference between the shielded and non-shielded images of the same area is the ‘purified’ image of the focus plane only. The formulae really used by SIM systems for calculation of the final image are more sophisticated, but still wholly transparent (Benedetti et al., 2000; Conchello and Lichtman, 2005) and include only parameters derived from the original images themselves.
SIM systems allow obtaining images comparable with those obtained with point scanning confocal laser scanning microscopy (see next chapter), while their price is not much above that of wide-field setups. In addition, SIM wholly ben-efits from using narrow-band filters. The main disadvantage of SIM is the need to make several images for each optical section. This increases acquisition time and, in some imple-mentations, can cause bleaching of FISH signals. Another problem is related to overexposure. Quite obviously, overex-posed regions cannot be recalculated correctly and appear black in the resulting image. Intensities of signal in inter-phase CTs vary in a very wide range and – in order not to lose weaker signals from the regions of dispersed chroma-tin – one nearly always has to overexpose the regions with highly condensed chromatin.
We have practically tested Apotome and ViCo. We will use ViCo to exemplify the application of the SIM-system to
3D-imaging of interphase nuclei ( Fig. 1 E, F) since our expe-rience with this system is more extensive. Additional infor-mation and representative images for Apotome and Opti-Grid may be found on the respective web pages.
Figure 1 E, F shows a gallery of optical sections collected with ViCo from a nucleus of a Jurkat cell (T-cell derived leu-kemic cell line). Cells were hybridized with paints for chro-mosomes 18 (detected with FITC, shown in red) and 19 (de-tected with Cy3, shown in green); the nucleus was counter-stained with DAPI (blue). The ViCo system was based on a Nikon TE-2000 inverted microscope, equipped with a 100 Watt Hg arc lamp and a triple-band dichroic filter (#82000, Chroma Technology, USA) with suitable excitation filters. Acquisition time was about 60 seconds per optical section (64 mask positions). Voxel size of the image is 120 ! 120 ! 520 nm (X ! Y ! Z).
Approaches using confocal laser scanning microscopes
Confocal laser scanning microscopes (CLSM, in com-mon parlance, confocals) solve the blur problem at the hard-ware level and assure a much better resolution than wide-field microscopes. However, they have three limitations, not to mention the price. The first disadvantage is a compara-tively high level of photobleaching of the studied specimens. The second, most important limitation is that laser illumina-tion, essential for confocals, restricts the set of fluorochromes that may be excited effectively by the number of available excitation wavelengths. Older instruments usually have only three channels: with ‘green’ emission (for e.g., FITC, Alexa 488, and GFP), ‘orange/red’ emission (for e.g., TRITC, Cy3, and DS Red), and ‘far red’ emission (for e.g., Cy5, Alexa 633, and TO-PRO-3). Modern instruments mostly have in addi-tion a UV or Diode 405 laser for ‘blue’ emission of fluoro-chromes like DAPI or Alexa 350. There can also be an ‘or-ange’ laser (on Leica microscopes) for ‘red’ emission of such fluorochromes as Texas Red or Cy3.5. A laser wavelength of457 nm is also often available, but is rarely used for FISH ex-periments due to lack of reliably working fluorochromes ex-cited at this wavelength. The third limitation is caused by relatively broad-band emission filters, which do not allow the separation of spectrally close fluorochromes. This limita-tion has been overcome to a great degree in modern systems with spectral detection, like META-detector of Zeiss micro-scopes, programmable emission filters (SP-option) of Leica confocals, or variable slits on FluoView confocals from Olympus. Spectral microscopy (the combination of spectral detection and special processing of data, called linear un-mixing) allows the separation of fluorochromes that are ex-cited with the same laser and have similar emission spectra.
A microscope with four to five lasers and narrow emis-sion filters allows one to obtain top quality data for four to five target fluorochromes. Speaking plainly, the above men-tioned strategy is the best strategy of multicolor imaging with a confocal microscope unless one is bound to fluoro-chromes with similar emission spectra, as, e.g., GFP and YFP, or Cy5 and Alexa 633, etc. We illustrate this straightforward
Cytogenet Genome Res 114:367–378 (2006) 371
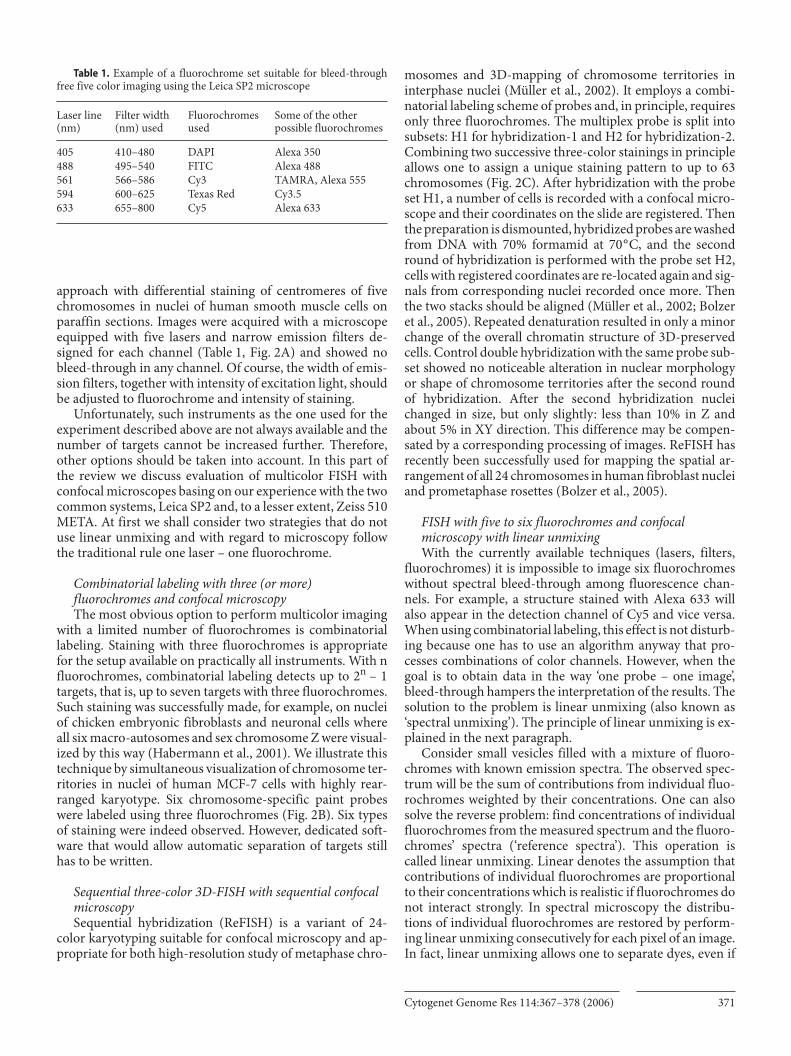
approach with differential staining of centromeres of five chromosomes in nuclei of human smooth muscle cells on paraffin sections. Images were acquired with a microscope equipped with five lasers and narrow emission filters de-signed for each channel ( Table 1 , Fig. 2 A) and showed no bleed-through in any channel. Of course, the width of emis-sion filters, together with intensity of excitation light, should be adjusted to fluorochrome and intensity of staining.
Unfortunately, such instruments as the one used for the experiment described above are not always available and the number of targets cannot be increased further. Therefore, other options should be taken into account. In this part of the review we discuss evaluation of multicolor FISH with confocal microscopes basing on our experience with the two common systems, Leica SP2 and, to a lesser extent, Zeiss 510 META. At first we shall consider two strategies that do not use linear unmixing and with regard to microscopy follow the traditional rule one laser – one fluorochrome.
Combinatorial labeling with three (or more) fluorochromes and confocal microscopy The most obvious option to perform multicolor imaging
with a limited number of fluorochromes is combinatorial labeling. Staining with three fluorochromes is appropriate for the setup available on practically all instruments. With n fluorochromes, combinatorial labeling detects up to 2 n – 1 targets, that is, up to seven targets with three fluorochromes. Such staining was successfully made, for example, on nuclei of chicken embryonic fibroblasts and neuronal cells where all six macro-autosomes and sex chromosome Z were visual-ized by this way (Habermann et al., 2001). We illustrate this technique by simultaneous visualization of chromosome ter-ritories in nuclei of human MCF-7 cells with highly rear-ranged karyotype. Six chromosome-specific paint probes were labeled using three fluorochromes ( Fig. 2 B). Six types of staining were indeed observed. However, dedicated soft-ware that would allow automatic separation of targets still has to be written.
Sequential three-color 3D-FISH with sequential confocal microscopy Sequential hybridization (ReFISH) is a variant of 24-
color karyotyping suitable for confocal microscopy and ap-propriate for both high-resolution study of metaphase chro-
mosomes and 3D-mapping of chromosome territories in interphase nuclei (Müller et al., 2002). It employs a combi-natorial labeling scheme of probes and, in principle, requires only three fluorochromes. The multiplex probe is split into subsets: H1 for hybridization-1 and H2 for hybridization-2. Combining two successive three-color stainings in principle allows one to assign a unique staining pattern to up to 63 chromosomes ( Fig. 2 C). After hybridization with the probe set H1, a number of cells is recorded with a confocal micro-scope and their coordinates on the slide are registered. Then the preparation is dismounted, hybridized probes are washed from DNA with 70% formamid at 70 ° C, and the second round of hybridization is performed with the probe set H2, cells with registered coordinates are re-located again and sig-nals from corresponding nuclei recorded once more. Then the two stacks should be aligned (Müller et al., 2002; Bolzer et al., 2005). Repeated denaturation resulted in only a minor change of the overall chromatin structure of 3D-preserved cells. Control double hybridization with the same probe sub-set showed no noticeable alteration in nuclear morphology or shape of chromosome territories after the second round of hybridization. After the second hybridization nuclei changed in size, but only slightly: less than 10% in Z and about 5% in XY direction. This difference may be compen-sated by a corresponding processing of images. ReFISH has recently been successfully used for mapping the spatial ar-rangement of all 24 chromosomes in human fibroblast nuclei and prometaphase rosettes (Bolzer et al., 2005).
FISH with five to six fluorochromes and confocal microscopy with linear unmixing With the currently available techniques (lasers, filters,
fluorochromes) it is impossible to image six fluorochromes without spectral bleed-through among fluorescence chan-nels. For example, a structure stained with Alexa 633 will also appear in the detection channel of Cy5 and vice versa. When using combinatorial labeling, this effect is not disturb-ing because one has to use an algorithm anyway that pro-cesses combinations of color channels. However, when the goal is to obtain data in the way ‘one probe – one image’, bleed-through hampers the interpretation of the results. The solution to the problem is linear unmixing (also known as ‘spectral unmixing’). The principle of linear unmixing is ex-plained in the next paragraph.
Consider small vesicles filled with a mixture of fluoro-chromes with known emission spectra. The observed spec-trum will be the sum of contributions from individual fluo-rochromes weighted by their concentrations. One can also solve the reverse problem: find concentrations of individual fluorochromes from the measured spectrum and the fluoro-chromes’ spectra (‘reference spectra’). This operation is called linear unmixing. Linear denotes the assumption that contributions of individual fluorochromes are proportional to their concentrations which is realistic if fluorochromes do not interact strongly. In spectral microscopy the distribu-tions of individual fluorochromes are restored by perform-ing linear unmixing consecutively for each pixel of an image. In fact, linear unmixing allows one to separate dyes, even if
Table 1. Example of a fluorochrome set suitable for bleed-through free five color imaging using the Leica SP2 microscope
Laser line (nm)
Filter width (nm) used
Fluorochromesused
Some of the otherpossible fluorochromes
405 410–480 DAPI Alexa 350488 495–540 FITC Alexa 488561 566–586 Cy3 TAMRA, Alexa 555594 600–625 Texas Red Cy3.5633 655–800 Cy5 Alexa 633

Cytogenet Genome Res 114:367–378 (2006)372
Fig. 2. Multicolor FISH with three to five fluorochromes using confo-cal microscopy. ( A ) Maximum intensity projections of 42 consecutive confocal sections through smooth muscle tissue in a paraffin section af-ter FISH with four differentially labeled centromere probes and DAPI counterstaining. Alphoid centromere probes were directly labeled with fluorochromes: centromere #1 with Cy5-dUTP; #8: Texas Red-dUTP; #17: FITC-dUTP; #18: Cy3-dUTP. Excitation wave lengths for each fluo-rochrome are indicated in the left top corner of the respective channel images (see Table 1 for emission filter settings). Note the complete ab-
sence of bleed-through. Bar = 10 � m. ( B ) Serial confocal sections col-lected from an interphase nucleus of an MCF-7 breast cancer cell after multicolor FISH with chromosome paints specific for human chromo-somes 5, 7, 8, 10, 16, and 18. Paint probes were combinatorially labeled using three fluorochromes (FITC, Cy3, and Cy5) according to the label-ing scheme shown in the top left corner. Bar = 5 � m. ( C ) Mapping all chromosomes in the prometaphase human fibroblast rosette (46,XY) by ReFISH. Top: schemes for combinatorial labeling of paint probes in two probe subsets, H1 and H2, used for the two sequential hybridizations.

Cytogenet Genome Res 114:367–378 (2006) 373
their emission maxima are only several nanometers apart (e.g. GFP and FITC) or they have similar wavelength range and only differ in shape.
In practical microscopy there are two approaches for ac-quiring data for linear unmixing. (1) Acquiring as many flu-orescence channels as there are fluorochromes in the speci-men, each channel collecting light from a relatively large wavelength-band (in this case one can think of unmixing as detecting and eliminating the bleed-through of channels into one another). (2) Acquiring a full spectrum of the spec-imen, where each spectral channel covers a smaller spectral range ( � 5–10 nm). It has been argued that the second ap-proach is more likely to give an exact restoration of the fluo-rochrome concentrations, because it uses more finely grained data. However, there are theoretical considerations indicat-ing that the gain from using more channels is not dramatic (Neher and Neher, 2004). The real advantage of wide spectra is that they take into account additional maxima and differ-ences in shapes of spectra, which is especially useful with e.g. endogenous fluorescence of biological samples.
Data for linear unmixing theoretically can be obtained with ‘classical’ confocal microscopes using fluorescence fil-ters to define the detection channels. However, in practice linear unmixing is associated with ‘spectral’ confocal micro-scopes. Such microscopes split the emission light into its spectral components, and use movable light stops to flexibly
define emission channels (Leica TCS SP/SP2, Olympus FV1000) or image the whole spectrum on a multi-element detector (Zeiss LSM510 Meta, Nikon C1si). The detectors in the microscopes with moveable light stops are the same pho-tomultipliers (PMTs) that are used in filter-based micro-scopes. The instruments that acquire full spectra use a multi-element PMT, which is capable of acquiring 32 channels at the same time, but has a lower sensitivity, especially in the red.
We have tested linear unmixing as a possible tool for mul-ticolor FISH on interphase chromosomes with both Zeiss LSM 510 META and Leica SP2. On the LSM 510 META, data for unmixing are acquired by recording a wide spectrum (up to 32 images per Z-section in case of the full range of ca. 390 to 720 nm) of the sample. Due to limitations in the current implementation of the read-out electronics, only eight chan-nels may be recorded simultaneously and the instrument ac-tually records the full spectrum in four scans. On the TCS SP2, one usually defines the width of each channel to maxi-mize the spectral separation of fluorochromes. As the instru-ment has four PMTs, all required channels may be recorded in two scans. Between the two scans the borders of the detec-tion channels are changed. The above strategies are the ‘main’ ones for the respective instruments, but not the only ones. META detector of Zeiss microscopes also allows defining narrow channels. This option physically reduces bleed-through and the results are not supposed to be unmixed. Vice versa, the new Leica SP5 allows collecting and unmix-ing wide spectra, but for each point in the spectrum a sepa-rate scan is required.
Characteristic results of multicolor FISH on interphase chromosomes in combination with spectral microscopy us-ing the labeling schemes presented in Table 2 are shown in Fig. 3 . They need several comments. The first step of linear unmixing is to determine reference spectra for all fluoro-chromes. Both systems rely on reference images/spectra
Fluoro-chrome
Absorption/emission
Laserline
Probe labeling
Scheme 1
DAPI 350/460 405Alexa 488 490/520 488 Bio C Avidin-Alexa 488 TAMRA 552/565 561 TAMRA-dUTP or Cy3-dUTPTexas Red 580/615 594 Texas Red-dUTPAlexa 633 633/647 633 DNP C Rabbit-anti-DNP C Goat-anti-Rabbit-Alexa 633Cy5 650/667 633 Dig C Mouse-anti-Dig-Cy5 C Goat-anti-Mouse-Cy5
Scheme 2
DAPI 350/460 405Alexa 488 490/520 488 Bio C Avidin-Alexa 488 Alexa 514 518/540 488 DNP C Rabbit-anti-DNP C Goat-anti-Rabbit-Alexa 514TAMRA 552/565 561 TAMRA-dUTP or Cy3-dUTPTexas Red 580/615 594 Texas Red-dUTPCy5 650/667 633 Dig C Mouse-anti-Dig-Cy5 C Goat-anti-Mouse-Cy5
Table 2. Labeling schemes used for experi-ments with linear unmixing
Image stacks were collected using a Zeiss LSM 410 microscope. After the first hybridization XY coordinates of recorded cells were noted. The same cells were found after the second FISH and imaged the second time. For the shown cell, both stacks had 24 optical sections at a 200-nm dis-tance. Figures H1 and H2 show maximum intensity projections of three substacks (section numbers are shown in yellow) after the first and sec-ond hybridizations, respectively. In this rosette 38 chromosomes could be identified (white numbers). Bar = 5 � m.

Cytogenet Genome Res 114:367–378 (2006)374
which are acquired from samples where fluorochromes are spatially separated from each other. For FISH-samples meta-phase spreads seemed to be the best choice for this purpose, but they are not necessarily, because it is desirable to take references from the same slide as unmixed images and, in
principle, laser intensities should not be changed after taking references. One also has to take care not to overexpose im-ages because overexposed pixels cannot be unmixed. Zeiss software explicitly indicates such pixels in the unmixed im-ages by making them black. One has to be especially careful
Fig. 3. Multicolor FISH with more than five fluorochromes using con-focal microscopy and linear unmixing. ( A , B ) Visualization of chromo-some territories 5, 12, 13, 17, and X in a human fibroblast nucleus using a Leica SP2 microscope (labeling scheme 1 in Table 2). ( A ) Metaphase spread with the respective chromosomes used to determine spectra be-fore (upper row) and after unmixing (bottom row). Color arrows in the upper row show channel bleed-through, which is removed after unmix-ing. ( B ) A 3D-preserved nucleus after unmixing shows the distinct and specific painting of the respective chromosome territories. ( C ) Visualiza-tion of five chromosome territories 6, 10, 13, 15, and 17 in a human fi-broblast nucleus using a Zeiss LSM 510 META microscope. For the label-
ing scheme used in this experiment (scheme 2 in Table 2), unmixing was necessary mainly to separate Alexa 488 and Alexa 514 which have strong-ly overlapping spectra. ( D ) Differential staining of chromosome territo-ries 11 and 12, specific gene loci of these chromosomes using two pools of BAC clones, and a pool of small size chromosomes (17, 19, and 20) in a human fibroblast nucleus before (upper row) and after unmixing (bot-tom row). Unmixing was necessary primarily to separate Alexa 488 and Alexa 514 (arrows), but also to rid images of bleed-through of TAMRA to the Texas Red channel caused by too intense staining of the pool of small chromosomes. Bars = 5 � m.

Cytogenet Genome Res 114:367–378 (2006) 375
about this matter working with interphase chromosomes that have an intrinsically wide range of fluorescence inten-sity. The most serious problem, however, is the difference of fluorescence intensities between structures labeled with dif-ferent fluorochromes. Such differences arise, e.g., between an abundant target and a sparse one, or due to difference in quality of DNA probes, or because of a strong difference in excitation maxima of two fluorochromes that must be ex-cited by the same laser line. If fluorochromes of brightly and weakly stained chromosomes overlap spectrally, weakly stained CTs (chromosome territories) may fail to be resolved and/or a ‘shadow’ of brightly stained chromosome may be seen in the channel of the weakly stained chromosome. Therefore, successful mapping of interphase CTs using un-mixing is only possible if fluorescence intensities of signals of all chromosomes are well balanced, a condition that de-mands high quality of preparation.
With both tested instruments we had wholly satisfactory results when unmixing different metaphase plates with the same reference spectra. The situation was different with in-terphase CTs: with both instruments, references suitablefor one nucleus were not necessarily good for other nuclei, which means a low reproducibility of the results of unmix-ing. Therefore, currently one still has to be careful with un-mixing when it is applied to interphase CTs (and objects comparably difficult for unmixing). On the other hand, moderate success with unmixing several interphase CTs does not deflate spectral microscopy that is now success-fully used for many biological applications. Below we present an example of multicolor staining ( Fig. 3 D) designed in such a way that the problems mentioned in the previous para-graph are reduced or avoided. Territories of human chromo-somes 11 and 12 were stained with respective chromosome paints. The two CTs were stained fairly evenly and had sim-ilar intensities of fluorescence. Since chromosomes were la-beled with Alexa 488 and Alexa 514 which have overlapping emission spectra, they were indeed unmixed from one other. A pool of three pairs of small chromosomes (HSA17, 19, and 20) produced staining with some very bright portions. With acquisition settings optimal for BACs from HSA12 labeled with Texas Red, the regions of bright TAMRA label bled through in the Texas Red channel. Small, compact, homoge-neously bright signals were unmixed from the pool. Finally, BACs from HSA12 were labeled with Cy5 that did not need unmixing ( Fig. 3 D). A still better strategy would probably have been to label the chromosome pool with Cy5 and to unmix (if at all necessary) two BACs from one other.
Deconvolution of image stacks after multicolor confocal microscopy
The growing need for high-resolution microscopy of cel-lular structures has recently greatly increased interest in de-convolution of confocal images. In confocal microscopes, most, but not all of the out of focus light is rejected by the narrow pinhole. Several authors argued that deconvolution (see above) of confocal images can improve the resolution
(Shaw and Rawlins, 1991; van der Voort and Strasters, 1995; Boutet de Monvel et al., 2001; Landmann, 2002). On the oth-er hand, in typical confocal images of 3D-FISH stained nu-clei, the number of photons per pixel is low and Poisson noise (the noise that arises due to random variation of this num-ber) is relatively high, as well as the background noise (signal observed in the channel without image). Noise hinders ana-lytical restoration of images. For example, accuracy of the PSF measurement strongly affects reliability of deconvolu-tion (Markham and Conchello, 2001; Wallace et al., 2001) while obtaining the PSF becomes more difficult with confo-cal than with wide-field microscopes. Different deconvolu-tion methods applied to the same image lead to different results, though the maximum-likelihood method currently establishes as the method of choice (Conchello and Licht-man, 2005). Deconvolution in practice also necessarily in-cludes arbitrary choice of a number of parameters (the num-ber of iterations, estimated signal to noise ratio, etc.). There-fore, established criteria for the choice of parameters, as well as for the validation of the results of deconvolution of confo-cal images are necessary – biologists need more evidence that images they obtain after deconvolution not only look more informative, but are also closer to reality.
Here we exemplify deconvolution by images obtained from a nucleus of an MCF-7 cell after replication labeling of mid-replicating chromatin by BrdU incorporation ( Fig. 4 ). Mid-replicating chromatin typically forms replication foci at the nuclear periphery and around nucleoli. It is packed more densely and therefore stains brighter with DNA-specific dyes than chromatin in the surrounding regions of the nucleus. Deconvolution of the same structures stained by different fluorochromes provides a test for consistency of the results of deconvolution. Though brighter stainings with TO-PRO-3 and mid replicating chromatin do not overlap completely, to a certain degree they are suitable for such a test. For de-convolution we applied the fast maximum-likelihood esti-mation (MLE) algorithm implemented in the software Huy-gens (SVI). Deconvolved images indeed show more clearly the similarity in the distribution patterns of mid replicating chromatin and stronger staining with TO-PRO-3 ( Fig. 4 ): it revealed both structures masked by blur ( Fig. 4 , region 1) and characteristic shape similarities between the observed structures ( Fig. 4 , region 2).
Working with image stacks after multicolor confocal microscopy
Basic methods of the analysis of multicolor images are well known and include such operations as defining the vol-ume or intensity gravity centers of structures, measuring dis-tances between them, and quantifying fluorochrome colo-calization. It is rarely mentioned that some preprocessing steps are required before quantitative image analysis. Ac-quired stacks usually need correction for the chromatic shift. XY-shift is eliminated in modern microscopes by adjusting the system, but some Z-shift, changing with time, still takes place. Therefore, Z-shift should be measured regularly and

Cytogenet Genome Res 114:367–378 (2006)376
image stacks should be corrected. As standard software sup-plied by microscope vendors makes no provisions for Z-shift correction, the methods to do it and necessary software are described in online supplements 1 and 2 . A related matter that we would like to mention here briefly is the direction in which stack is acquired. With thicker specimens it is desir-able that the deepest layers of the specimen that lose more emitted signal are not imaged at the end of the stack acquisi-tion when bleaching is maximal. Therefore, it is advisable to acquire stacks so that the focus plane moves in the direction to the objective lens. This rule of thumb applies in the first place to inverted and newer setups. With older and, espe-cially, upright setups it may, however, be reasonable to make stacks in the opposite direction to assure more constant Z-step size.
Convenient viewing of multicolor data necessitates dedi-cated software capable of handling more color channels. Though in vivo observations were not discussed in this pa-per, it should be mentioned here that in principle one needs to view not only multicolor stacks, but time series of multi-color stacks . Standard software supplied with confocal mi-croscopes usually satisfies this need, as well as a number of software packages from independent vendors. However, such software mostly comes with a price-tag of several €1000 per license. Microscope vendors also have free versions of their standard software, which are very useful but have a re-stricted functionality. Therefore, we find it helpful to intro-duce here another convenient free option.
Recently a set of plugins for ImageJ, (Rasband, 1997–2006) called Image5D, has become available, which brings multi-channel-capability to ImageJ. With these plugins, multi-channel images can be displayed in the overlay mode. They allow browsing through multi-channel time-series of image-stacks, as well as making galleries and projections of multi-channel data (for example see Fig. 2 A, the right pane). It may be added that ImageJ plugins now also suggest con-venient and (in our experience) wholly sufficient tools for finding geometrical centers of segmented 3D-structures, measuring shift, and the analysis of colocalization.
Conclusions
Today, a wide range of imaging methods is open to re-searchers interested in the 3D-organization of the genome. Summing up the accumulated practical know-how in multi-color labeling of nuclear structures, we would like to suggest several rules of thumb that may be helpful in choosing the strategy of 3D-M-FISH studies, with a focus on interphase CTs.
When the number of targeted chromosomes is large and one is mostly interested in their positions in the nucleus, one should consider a combination of wide-field microscopy with deconvolution. Even now many studies of this kind may also be done quickly and cost-efficiently with SIM instruments. Rapid development of SIM that has been observed in the last years will probably widen the scope of applications of this type of microscopy in nuclear biology quickly and strongly.
Fig. 4. Deconvolution of structures labeled by two different fluoro-chromes. Maximum intensity projection of four consecutive confocal sections (with interval 200 nm) through the mid part of the nucleus of an MCF-7 cell after replication labeling with BrdU during mid S phase (green in overlay) and DNA counterstaining with TO-PRO-3 (red in overlay). Mid replicating chromatin, corresponding to gene-poor tran-scriptionally silent chromatin, is present at the nuclear periphery and around nucleoli. This chromatin has increased density and is stained brightly by DNA counterstain. The four lower rows show at a higher magnification the regions 1 and 2. Note the restoration of a ring of con-densed chromatin nearly completely obscured by blur in the region 1 and strongly improved correspondence in shape of the condensed chromatin ring in the region 2. Bar = 5 � m.

Cytogenet Genome Res 114:367–378 (2006) 377
CLSM is still the gold standard in optical microscopy in terms of resolution and absence of artifacts. Confocal mi-croscopy is necessary first of all when high-resolution mor-phology of a smaller number of fluorochromes is needed. In this case to do a study using a CLSM with a sufficient number of lasers will probably prove a more effective solution than investing time and money in any other strategy. We would definitely recommend taking other options only if the neces-sary number of colors is above four to five or appropriate instruments are absolutely unavailable. Deconvolution of CLSM images is presently not widely used and there is no reliable method to validate the results of deconvolution. Nevertheless, both theoretical considerations and available practical results suggest that this approach may prove very useful and deserves more attention from practical biolo-gists.
Using CLSM in combination with combinatorial labeling is currently limited by lack of software for automatic classi-fication of staining in voxels (correspondingly, segmentation of CTs). If segmentation is not necessary, combinatorial la-beling may be a good option available with any CLSM instru-ment. In skillful hands, ReFISH allows one to stain a high number of targets using any confocal instrument with an XY motorized stage. Unfortunately, this method is time con-suming (because of the necessity to find and record the same nuclei twice) and associated with the risk of losing the work done for the first round of staining and microscopy because of a failed second hybridization.
Laser confocal microscopy with unmixing as a method for simultaneous staining of, e.g., more than five to six CTs in the interphase nuclei is currently hindered by serious dif-ficulties, but the rapid progress in this area may change the situation very quickly. Even now unmixing may be well ap-plied to 3D-M-FISH on interphase nuclei if some of the tar-gets are more suitable for unmixing than interphase CTs. When unmixing is used, the main attention should be paid to equalizing intensities of signals in the stained sample. The recommendations we would tentatively suggest are (1) to limit intensity of staining of more dense targets, (2) to use spectrally distant fluorochromes for targets producing very different intensities, and (3) to avoid real unmixing for tar-gets showing strong natural local variation in intensity of staining (i.e., not to apply in the same sample fluorochromes spectrally similar to the one used for such structures). This way the number of structures targeted with 3D-M-FISH may be increased while the high CLSM resolution will be retained and additional time-consuming operations will be avoided.
Acknowledgements
We are grateful to G. Weißer, A. Kölbl and R. Zinner (University of Munich) for providing image stacks; to S. Lassman (University of Frei-burg) for tissue microarrays; to M. Hausner (TU of Munich) for the op-portunity to work with a Zeiss LSM 510 META microscope; to M. Brich and M. Schacht (Carl Zeiss AG), and to S. Liebe (Leica Microsystems), as well as to both companies, for instructions and technical help.
References
Azofeifa J, Fauth C, Kraus J, Maierhofer C, Langer S, Bolzer A, Reichman J, Schuffenhauer S, Speicher MR: An optimized probe set for the detection of small interchromosomal aberrations by use of 24-color FISH. Am J Hum Genet 66: 1684–1688 (2000).
Benedetti PA, Evangelista V, Guidarini D, Vestri S: Method for the acquisition of images by confocal microscopy. US Patent 6.016.367 (2000).
Bolzer A, Kreth G, Solovei I, Koehler D, Saracoglu K, Fauth C, Muller S, Eils R, Cremer C, Speicher MR, Cremer T: Three-dimensional maps of all chromosomes in human male fibroblast nuclei and prometaphase rosettes. PLoS Biol 3:e157 (2005).
Boutet de Monvel J, Le Calvez S, Ulfendahl M: Image restoration for confocal microscopy: improving the limits of deconvolution, with application to the visualization of the mammalian hearing or-gan. Biophys J 80: 2455–2470 (2001).
Bridger JM, Lichter P: Analysis of mammalian inter-phase chromsomes by FISH and immunofluo-rescence, in Bickmore WA (ed): Chromosome Structural Analysis, pp 103–123 (Oxford Univer-sity Press, Oxford 1999).
Chudoba I, Plesch A, Lorch T, Lemke J, Claussen U, Senger G: High resolution multicolor-banding: a new technique for refined FISH analysis of hu-man chromosomes. Cytogenet Cell Genet 84:
156–160 (1999). Conchello JA, Lichtman JW: Optical sectioning mi-
croscopy. Nat Methods 2: 920–931 (2005).
Cremer M, Weierich C, Solovei I: http://www.epigenome-noe.net/researchtools/protocols.php (2006).
Eils R, Uhrig S, Saracoglu K, Satzler K, Bolzer A, Pe-tersen I, Chassery J, Ganser M, Speicher MR: An optimized, fully automated system for fast and accurate identification of chromosomal rear-rangements by multiplex-FISH (M-FISH). Cyto-genet Cell Genet 82: 160–171 (1998).
Fauth C, Speicher MR: Classifying by colors: FISH-based genome analysis. Cytogenet Cell Genet 93:
1–10 (2001). Foster HA, Bridger JM: The genome and the nucleus:
a marriage made by evolution. Genome organi-sation and nuclear architecture. Chromosoma 114: 212–229 (2005).
Habermann FA, Cremer M, Walter J, Kreth G, von Hase J, Bauer K, Wienberg J, Cremer C, Cremer T, Solovei I: Arrangements of macro- and micro-chromosomes in chicken cells. Chromosome Res 9: 569–584 (2001).
Landmann L: Deconvolution improves colocaliza-tion analysis of multiple fluorochromes in 3D confocal data sets more than filtering techniques. J Microsc 208: 134–147 (2002).
Lemke J, Claussen J, Michel S, Chudoba I, Muhlig P, Westermann M, Sperling K, Rubtsov N, Grummt UW, Ullmann P, Kromeyer-Hauschild K, Liehr T, Claussen U: The DNA-based structure of human chromosome 5 in interphase. Am J Hum Genet 71: 1051–1059 (2002).
Markham J, Conchello JA: Artefacts in restored im-ages due to intensity loss in three-dimensional fluorescence microscopy. J Microsc 204: 93–98 (2001).
McNally JG, Karpova T, Cooper J, Conchello JA: Three-dimensional imaging by deconvolution microscopy. Methods 19: 373–385 (1999).
Müller S, Neusser M, Wienberg J: Towards unlimited colors for fluorescence in-situ hybridization (FISH). Chromosome Res 10: 223–232 (2002).
Neher RA, Neher E: Applying spectral fingerprinting to the analysis of FRET images. Microsc Res Tech 64: 185–195 (2004).
Parada LA, Sotiriou S, Misteli T: Spatial genome or-ganization. Exp Cell Res 296: 64–70 (2004).
Rasband WS: ImageJ. U. S. National Institutes of Health, Bethesda, Maryland, USA, http://rsb.info.nih.gov/ij/ (1997–2006).
Saracoglu K, Brown J, Kearney L, Uhrig S, Azofeifa J, Fauth C, Speicher MR, Eils R: New concepts to improve resolution and sensitivity of molecular cytogenetic diagnostics by multicolor fluores-cence in situ hybridization. Cytometry 44: 7–15 (2001).
Schröck E, Du Manoir S, Veldman T, Schoell B, Wienberg J, Ferguson Smith MA, Ning Y, Led-better DH, Bar Am I, Soenksen D, Garini Y, Ried T: Multicolor spectral karyotyping of human chromosomes. Science 273: 494–497 (1996).
Shaw PJ, Rawlins DJ: The point-spread function of a confocal microscope: its measurement and use in deconvolution of 3-D data. J Microsc 163: 151–165 (1991).

Cytogenet Genome Res 114:367–378 (2006)378
Solovei I, Cavallo A, Schermelleh L, Jaunin F, Scas-selati C, Cmarko D, Cremer C, Fakan S, Cremer T: Spatial preservation of nuclear chromatin ar-chitecture during three-dimensional fluores-cence in situ hybridization (3D-FISH). Exp Cell Res 276: 10–23 (2002a).
Solovei I, Walter J, Cremer M, Habermann F, Scher-melleh L, Cremer T: FISH on three-dimension-ally preserved nuclei, in Beatty B, Mai S, Squire J (eds): FISH, A Practical Approach, pp 119–157 (Oxford University Press, Oxford 2002b).
Speicher MR, Carter NP: The new cytogenetics: blur-ring the boundaries with molecular biology. Nat Rev Genet 6: 782–792 (2005).
Speicher MR, Ballard GS, Ward DC: Karyotyping hu-man chromosomes by combinatorial multi-fluor FISH. Nat Genet 12: 368–375 (1996).
Tam R, Shopland LS, Johnson CV, McNeil JA, Law-rence JB: Application of RNA FISH for visualiz-ing gene expression and nuclear architecture, in Beatty B, Mai S, Squire J (eds): FISH, a Practical Approach pp 93–118 (Oxford University Press, Oxford 2002).
Tanke HJ, Wiegant J, van Gijlswijk RP, Bezrookove V, Pattenier H, Heetebrij RJ, Talman EG, Raap AK, Vrolijk J: New strategy for multi-colour fluores-cence in situ hybridisation: COBRA: COmbined Binary RAtio labelling. Eur J Hum Genet 7: 2–11 (1999).
Telenius H, Carter NP, Bebb CE, Nordenskjold M, Ponder BA, Tunnacliffe A: Degenerate oligonu-cleotide-primed PCR: general amplification of target DNA by a single degenerate primer. Ge-nomics 13: 718–725 (1992).
van der Voort HTM, Strasters KC: Restoration of confocal images for quantitative image analysis. J Microsc 178: 165–181 (1995).
Wallace W, Schaefer LH, Swedlow JR: Workingper-son’s guide to deconvolution in light microscopy. BioTechniques 31: 1076–1097 (2001).