Embed Size (px)
Citation preview

Rowan University Rowan University
Rowan Digital Works Rowan Digital Works
Theses and Dissertations
6-26-2014
Towards an automated system for evaluation of visualizations Towards an automated system for evaluation of visualizations
Douglas Taggart
Follow this and additional works at: https://rdw.rowan.edu/etd
Part of the Computer Sciences Commons
Recommended Citation Recommended Citation Taggart, Douglas, "Towards an automated system for evaluation of visualizations" (2014). Theses and Dissertations. 318. https://rdw.rowan.edu/etd/318
This Thesis is brought to you for free and open access by Rowan Digital Works. It has been accepted for inclusion in Theses and Dissertations by an authorized administrator of Rowan Digital Works. For more information, please contact [email protected].

A Thesis
Submitted to the
at Rowan University
Thesis Chair:
by
In partial fulfillment of the requirement For the degree of
Douglas P. Taggart
May 2014
Adrian Rusu, Ph.D.
College of Sciences and Mathematics
TOWARDS AN AUTOMATED SYSTEM FOR EVALUATION OF VISUALIZATIONS
Master of Science in Computer Science
Department of Computer Science

© 2014 Douglas P. Taggart

iii
Acknowledgments
I would like to thank my thesis advisor, Dr. Adrian Rusu, for guiding me through
the thesis process. His advice, motivations and guidance has helped me find success
academically and professionally. It has been a pleasure working with Dr. Rusu. I would
also like to graciously thank Dr. Gabriela Hristescu and Dr. Stephen Hartley for serving
on my thesis committee, and for their support throughout the thesis process.
Additionally I would like to thank Stan Schwertly and Kevin Desmond for
assisting me with the implementation of my thesis, as well as acting as a sounding board
throughout the entire development of my thesis.

iv
Abstract
Douglas P. Taggart TOWARDS AN AUTOMATED SYSTEM FOR EVALUATION OF
VISUALIZATIONS Adrian Rusu, Ph.D.
2012/2014 Master of Science in Computer Science
The Information Visualization field focuses on the visualization of abstract data,
and with the growing interest in big data analysis, the need for analyzing complex
datasets is nowadays highly relevant. With the growing amount and diversity of these
datasets new and exciting ways to visualize them are being developed. However, being
able to thoroughly test and evaluate the effectiveness of these new visualization
techniques is an arduous manual process. Moreover, different researchers hold different
opinions on how to thoroughly evaluate a new visualization method. A step towards
automating the process of evaluation of visualizations, called the Framework for the
Evaluation of VizTools (FEV), was developed and is presented in this thesis. The
FEV Framework combines, guidelines, scenarios, and tasks, generated by an extensive
literature review, into an easy to use open-source and expandable software package. With
FEV, researchers are able to generate evaluation task lists based on their own data, and
using evaluation methods that have already been vetted by the visualization community.
By using the FEV tool with a variety of visualizations, it was possible to generate full
evaluation task lists for each of them. By making the framework open-source and with
an adaptable architecture, new functionality can easily be added, enabling it to be used by
researchers to evaluate an almost limitless number of visualization methods.

v
Table of Contents Abstract .............................................................................................................................. iv
List of Figures .................................................................................................................. viii
List of Tables ...................................................................................................................... x
Chapter 1 : Introduction ...................................................................................................... 1
1.1 Related Software ....................................................................................................... 4
1.2 Contributions and Outline ......................................................................................... 4
Chapter 2 : Intelligent and Defensive Framework for Decision-Making Systems of
Systems with Applications to Healthcare ........................................................................... 6
2.1 Introduction ............................................................................................................... 6
2.2 General Systems Overview ....................................................................................... 7
2.3 Framework Internal Details ...................................................................................... 9
2.3.1 Input Module .................................................................................................... 11
2.3.2 Storage Module ................................................................................................ 11
2.3.3 Artificial Intelligence Module .......................................................................... 12
2.3.4 Expert Module ................................................................................................. 12
2.3.5 Decision Module .............................................................................................. 13
2.4 Application to Healthcare ....................................................................................... 14
2.4.1 Introduction ...................................................................................................... 14
2.4.2 Setup ................................................................................................................ 17
2.4.3 Experiment ....................................................................................................... 21
2.5 Evaluation ............................................................................................................... 21
2.6 Conclusion .............................................................................................................. 22

vi
Chapter 3 : A User Evaluation of Map and Node-Link Visualization of Graphs ............. 23
3.1 Experiment Design .................................................................................................. 26
3.1.1 Data Set ................................................................................................................ 26
3.1.2 Hypothesis........................................................................................................... 28
3.2 User Study .............................................................................................................. 29
3.3 Evaluation Questions .............................................................................................. 30
3.3.1 Graph Questions ............................................................................................... 31
3.3.2 Recomendation Questions ............................................................................... 32
3.3.3 Low Level Questions ....................................................................................... 33
3.3.4 Memeory Questions ......................................................................................... 33
3.3.5 Data Exploration Questions ............................................................................. 34
3.3.6 Feedback Questions ......................................................................................... 34
3.4 Results ..................................................................................................................... 34
3.4.1 Graph Question Results ................................................................................... 35
3.4.2 Recommendation Question Results ................................................................. 36
3.4.3 Low Level Question Results ............................................................................ 39
3.4.4 Memory Question Results ................................................................................ 41
3.4.5 Exploration Question Results .......................................................................... 42
3.4.6 User Feedback .................................................................................................. 45
3.5 Discussion ............................................................................................................... 45
3.6 Conclusion .............................................................................................................. 46
Chapter 4 : An Adaptive and Automated Framework for the Evaluation of Visualization
Tools ................................................................................................................................. 48

vii
4.1 Introduction ............................................................................................................ 48
4.2 Background and Related Work ............................................................................... 49
4.3 Conceptual Design .................................................................................................. 52
4.4 System Design ........................................................................................................ 55
4.4.1 Data-Inload Package ........................................................................................ 57
4.4.2 Data Object Package ........................................................................................ 59
4.4.3 Database ........................................................................................................... 60
4.4.4 Database Connection Package ......................................................................... 60
4.4.5 Graphical User Interface Package .................................................................... 61
4.4.6 Data Analysis Package ..................................................................................... 62
4.5 System Testing ........................................................................................................ 65
4.5.1 AGX Line Plot Use Case ................................................................................. 65
4.5.2 AGX and ZN Scatter Plot Use Case ................................................................ 66
4.5.3 Author Collaboration GMap Use Case ............................................................ 68
4.5.4 Results .............................................................................................................. 69
4.6 Future Work ............................................................................................................ 71
4.7 Conclusion .............................................................................................................. 72
Chapter 5 : Conclusion and Future Work ......................................................................... 74
List of References ............................................................................................................. 79
viii
List of Figures
Figure Page Figure 2.1 Patient Monitoring Implementation 8 Figure 2.2 IFSoS Framework Components 10 Figure 2.3 Tissue Samples and Extracted Features 16 Figure 2.4 Slide Processing System 19 Figure 2.5 System configuration for slide processing 20 Figure 3.1 XKCD's map of online communities 24 Figure 3.2 Node-Link representation of Amazon "1984" book data. 27 Figure 3.3 GMap representation of Amazon "1984" book data. 28 Figure 3.4 Time spent per question (in seconds) by Node-Link 36 and GMap subjects Figure 3.5 Subjects were asked to provide recommendations 38 for books “The Lord of the Flies”(top) and “Cat‘s Cradle”(bottom). Red indicates the percentage of recommendations that did not match those provided by Amazon, while Blue shows the percentage which matched. Figure 3.6 Recommendations for customers that purchased 39 "Lord of the Flies" (left) and recommendations for customers that purchased "Cat's Cradle" (right). Figure 3.7 When asked to estimate the number of books 40 in a subset (KFC) subjects performed better in the Node-Link representation that the GMap.

ix
Figure 3.8 Subjects were asked to name two 42 neighbors for the books "Heart of Darkness" and "The Scarecrow". The results between GMap and Node-Link were identical for the first book but significantly different for the second. Figure 4.1 Package Diagram for the FEV framework 53 Figure 4.2 Sample XMl file. Data shows closing prices for 58 the AGX stock, visualized using a line chart. Figure 4.3 Graphical User Interface for the FEV system 62 Figure 4.4 Partial Class Diagram for the DataAnalysis Package 63 Figure 4.5 Line Chart showing the closing ticker price 66 of the AGX stock, in the US dollars, over a three year period Figure 4.6 Scatter Chart showing the closing ticker 67 price of the AGX(blue) and Zn(red), in US dollars, over a three year period. Figure 4.7 GMap representation of joint authorship 70

x
List of Tables
Table Page Table 1. Predefined Questions 55

1
Chapter 1: Introduction
The challenge of verifying the capabilities, strengths, and shortcomings of
visualization systems grows in parallel with the complexity of visualization tools, and to
a lesser with the extent the data itself. Being able to generate an evaluation method that
not only properly tests the abilities of different visualization tools, but does so in a data
independent approach. Currently the evaluation of visualization tools is a subjective and
much discussed process whose methods and principles are rigorously debated by those
in the visualization community. As it stands there is no current standard within the
visualization community for what defines an evaluation, only a collection of principles,
scenarios, and guidelines published piecemeal over the years in various journals and
conference proceedings. Centralizing the various visualization evaluation principles and
automating the overall evaluation processes is something that could be beneficial to
researchers throughout the visualization community while bringing definition to a vague
and subjective process. However accomplishing this in a manner that is generic enough to
accommodate any type of visualization but still provides detailed and specific evaluation
tasks is a non-trivial problem.
To better understand the problems associated with not just visualization
evaluations, but the evaluation of experimental and nonstandard visualization was
undertaken. In addition to the use of an experimental visualization, a web-based crowd
sourcing tool, Amazon Mechanical Turk (MTurk), was used to provide a diverse test
group.
The goal of the evaluation was to explore the GMap, an algorithm designed to
display relational data in a style similar to a geographic map. The evaluation focused on

2
the GMaps ability to act as a recommendation tool, its ability to promote data
exploration and its ability to hold user interest. Additionally an identical evaluation was
conducted concurrently with a Node-Link diagram, which shares basic similarities with
the GMap. Both visualizations shared an identical data set, books purchased from
Amazon.com, where each node is a book, and a vertex between them represents that they
were purchased together.
The evaluation process yielded significant results, but at the expense of a large
amount of time. Almost A extensive list of sample tasks were generated manually and
given to a small user group to test before they went to the actual test group. The tasks
underwent a large number of revisions in both scope of question and general mechanics,
such as time to answer as their effect on the intended user became apparent to the
investigators. This was primarily a result of many of the questions being open-ended and
not having a single correct answer. This also required the investigators to design a
ranking system for correct answers, as many answers can be correct but the degree of
their correctness can vary.
The GMap evaluation left us asking the question "How can this process be
improved?" A large amount of time had been invested in the creation of the evaluation,
but was there any way to reduce that time, or even automate part of the process.
The questions following in the wake of the GMap evaluation served as the
inspiration of the Intelligent Frame Work for Systems of Systems(IFSoS). IFSoS is a
framework designed to be able to generate an action or decision based off of inputted
data. The framework was designed to be as general as possible, thus giving a user the
ability to modify it at will allowing it to function in as many roles as possible.

3
The framework is composed of four modules, each capable of being deployed on
a separate machine, and each with its own unique responsibility: data input, data storage,
analysis and decision, and expert. The system is also capable of being deployed in
multiple instances, each focused on an individual part of a larger system. The general
idea being that processed data or commands from one deployment cane be transferred
into another deployment for further actions. Areas of application for the framework are
varied and range from medical procedures to defense. The framework was designed to be
as adaptable as possible and design choices such as expected data input, data storage
protocols, and decision making abilities are not tied into any of the system internals and
are able to be modified and altered to fit any problem domain.
Using the IFSoS framework as a basis a new tool was developed to focus on the
improvement if the visualization process. The Framework for the Evaluation of
Visualization Tools (FEV). Was created by utilizing the modularity, adaptability, and
functionality of the IFSoS system but with a strong focus on the visualization evaluation
process. Combining the groundwork done previously in visualizations and system
engineering the application gives users the ability to automate the evaluation processes,
independent of the data or visualization tool used.
The FEV application provides users with the ability to automatically generate
evaluation task lists for a number of different visualization tools and evaluation scenarios.
Much like the IFSoS system the FEV framework is designed to be highly customizable
and easy to expand. Components supporting new visualization tools and techniques can
be added to the system without great difficulty. The true strength of the system is its
ability to generate evaluation tasks based on the specific data used to generate the

4
visualization under evaluation. The Framework for the evaluation of visualizations is
unique in that it is currently the first and only tool that automates the generation of
evaluation task lists.
1.1 Related Software
Currently there is very little in the way of existing software that automates the
visualization processes. There are, however, a few tools that assist with different aspects
of the evaluation process such as digital evaluation environment and crowd sourcing
tools.
EvalBench is a software library first published in the 2013 proceedings of
EuroViz. EvalBench gives researchers the ability to create a controlled, digital,
environment to perform evaluations in. It includes a wide range of functions, such as the
ability to time users completions of tasks, and supports string logging features. However
it does not provide researchers any way to automatically generate tasks lists. Amazon
also offers a similar service, Mechanical Turk, where researchers can upload tasks to its
website and have them completed by a large pool of workers.
1.2 Contributions and Outline
The major contributions to this thesis are as follows. The first section details the
principles and design of an evaluation for an experimental visualization method, the
GMap algorithm. Different evaluation methods are also discussed. Secondly the design,
implementation, and areas of application are discussed for a novel System of Systems
(SoS) framework. Several use cases are also explored. Thirdly a system that combines the
principles of visualization evaluation and system engineering is discussed. The

5
implementation and design of said system is discussed in detail, along with several user
studies. Finally a series of expansions and alterations to the evaluation system are
proposed along with future work.
This thesis will follow the outline as described below:
• In Chapter 1 (this chapter) we give an overview of the issues plaguing the evaluation
of visualization tools and techniques and propose a solution that eases these processes
• Chapter 2 discusses the design and implementation of a software system that can
react to real-time data as well as presents several case studies.
• Chapter 3 discusses the in depth study of experimental visualization tools and the
evaluations that accompany them
• Chapter 4 discusses the design and implementation of a system that automates the
visualization evaluation process
• Chapter 5 summarizes the work presented in this thesis, and explains future
modifications and improvements

6
Chapter 2: Intelligent and Defensive Framework for Decision-Making Systems of
Systems with Applications to Healthcare1
2.1 Introduction
The need to be able to monitor, control, and interact with a complex system grows
daily as more systems move towards computerized control. Applications currently in use
are at a growing disadvantage as systems become more complex and detailed. Such
systems-of-systems (SoS) allow user-provided or computer-generated inputs, and make
independent or assisted decisions about the overall state of the system.
Our proposed framework can be used to handle multitier system-of-systems and
expands on the traditional role of decision-making and monitoring systems to support
their growing complexity.
SoS frameworks for various types of systems have been proposed. For example,
an analysis SoS framework with the goal of overcoming existing methodological
problems in System of Innovation studies is described in [1]. Another SoS framework,
which applies to decision-making systems such as the ones in our approach, is based on
the idea of social interactions, and proposes that the systems composing the SoS behave
as autonomous social agents [2]. While the systems composing the SoS in our framework
also operate independently, internally they are controlled by an artificial intelligence
component.
1 Components from this chapter were published at the 7th Annual IEEE International Systems Conference
(SysCon 2013) in Collaboration with Adrian Rusu, Kevin Desmond, and Hector Lopez

7
2.2 General Systems Overview
Our framework, which we call Intelligent Framework for Systems-of-Systems
(IFSoS), is designed to allow multiple individual deployments to be implemented in a
hierarchical or circular configuration, allowing for greater control and monitoring of a
decision-making system or system of systems. Each individual deployment of the
framework is considered to be an independent component which can be configured to
share data with other deployments as well as utilize their functionality. Such a design
configuration gives the framework ability to handle a variety of systems and processes.
For example, several systems using our framework can be implemented to
monitor a patient's vitals and dispense medication as needed. Such an application would
require several independent deployments, each with its own unique task. One deployment
would monitor a patient's blood-sugar levels, and as it lowers, it would activate a
different framework deployment responsible for dispensing insulin. Other similar
deployments would monitor critical signals like heart rate and blood pressure, dispensing
blood thinners and other narcotics as required. These deployments are then monitored by
a separate process that would alert a nurse or doctor if any of the levels spiked. A
potential system such as this could be monitoring every patient bed in a given hospital
wing encompassing tens or even hundreds of systems working together by sharing data
and functionality with each other.
Each instance of our framework has an associated decision-making component,
which is being used for two purposes, depending on the system using it. One purpose
could simply be to alert a human or computer-controlled operator. The other is to validate
data or functionality received from other systems. The latter uses the concept of "garbage

8
in does not mean garbage out". In this case, the decision-making component identifies
erroneous information which does not satisfy the internal rules, and decides not to
propagate it. Depending on the criticality of the system, the decision-making component
Figure 2.1 Patient monitoring implementation may decide to either: return an error code, return a neutral value, substitute the next piece
of data and continue as planned, return the same answer as previous time, use the closest
legal value, or shut down. For the example above, the insulin system may receive
erroneous data from the blood sugar monitor. By identifying the problem internally, the
insulin system would decide not to dispense it.
In a hierarchical or circular deployment, an instance of the framework is deployed
for each component of the system. Each deployment of the system feeds data into the
data plug-in module of another IFSoS system. This method allows the systems to be

9
stacked so that one IFSoS deployment is monitoring the decisions of several other
deployments.
In addition to utilizing data from one system to another, each deployment is
capable of utilizing the functionally of another system. New data in one of the framework
deployments may necessitate a reevaluation of the rules in a separate deployment.
Allowing individual deployments access to the functionality of other deployments makes
a more robust control scheme and a more fluid proliferation of data and functionality
across the system.
2.3 Framework Internal Details
Our framework is composed of five major modules: Input, Storage, Artificial
Intelligence, Expert, and Decision (see Fig. 2.1). These modules are designed to run on
separate machines, as well as together on one machine. The Input module is responsible
for collecting information given to the framework, and redistributing it. This module is
designed to be modified to accommodate different types of input streams. Input can be
fed to the system from hardware, software, user, sensors, or other types of inputs. The
input is then sent to the Storage module for storage and redistribution to the other
framework components. The input stored in the Storage module is evaluated by the
Artificial Intelligence module, which creates and modifies rules that are processed by the
Expert module.

10
Figure 2.2 IFSoS Framework Components The Expert module stores knowledge and is divided in two parts: the inference
engine and the knowledge base [3]. The inference engine produces reasoning on rules
based on logic exerted by the Artificial Intelligence module. With logic, the engine is
able to generate new information from the knowledge contained in the rule base and
inputs to be processed. The Expert module’s analysis is then sent to the Decision module
for final outcome. The Decision module regulates how the system and its associated
information are interacted with and determines how to proceed once a decision has been
made. The results are either presented to a human or computer operator through a
graphical or text interface, or they are sent to other modules. However, if an error has
been detected, the Decision module might not propagate the error. Below we describe
each module in detail.

11
2.3.1 Input Module The main function of this module is to facilitate inputs into the system. The only
component for this module included in the framework is an input transmitter that feeds
incoming inputs to the Storage module. However, customized components are required
for the system to allow data and functionality. The need for custom input feeds allows the
system to work for any client or user needs.
Since the framework is designed to handle any type of system, it needs
functionality to handle an infinite number of input types. For this purpose, the open
source framework Jodd provides a simple and eloquent way for Java classes to be loaded
into the system during runtime. If a new input type needs to be measured by IFSoS, a
new class file can be given to the Input module and fed to the other modules without the
need to rebuild the entire system.
Once the system is capable of understanding the new input type, input can be
added to the system. This can be done based on the needs of the user.
2.3.2 Storage Module The Storage module is tasked with the housing and checking of inputs for each
framework deployment. The module is responsible for checking the types of the input
coming into the framework from the Input module, and informs it of any type error.
Additionally the module is also responsible for checking the uniqueness of incoming
input. When inputs from the Input module arrive in real-time, some of the existing ones
might not have changed. In order to avoid memory and storage issues, only the most
recent inputs are kept, while inputs which already exist and which are unchanged are not
stored. However, when updated inputs are available, the Storage module is responsible

12
for notifying the other modules that new inputs are available. Specifically, the Artificial
Intelligence module and the Expert module, as new inputs might require the rules to be
reevaluated.
The type of storage receptacle used to store the inputs should be deployment
specific. In some cases a large database may be needed to keep track of the data, while in
others a simple flat file will suffice. In tiered systems the storage receptacle used does not
have to be universal across the entire system. The framework deployed at the apex of the
system may not require as robust of a storage receptacle as one of its children.
2.3.3 Artificial Intelligence Module The Artificial Intelligence Module processes the inputs from the Storage module
and creates the knowledge base, which is part of the Expert module. The more
information is available, the more this module is able to make intelligent decisions.
Advanced artificial intelligence algorithms can be added as part of this module, based on
the target application. An example is described in the section 2.4.
2.3.4 Expert Module The main responsibility of the Expert module is to add to the existing knowledge
base and to compare inputs processed by the Artificial Intelligence module to a set of
rules, to determine the quality of the information travelling through the system. Rules
express the knowledge to be exploited by the Expert module. Such a module may be
implemented using an open source rule engine such as Drools or CLIPS. By using the
rule engine we eliminate the need for recompilation of the system when new rules are
required for the system. Rules can be inserted into the engine during runtime with no
side-effects on the system. Using a rule engine along with the Java Jodd class loader,
13
gives the system extreme modularity, especially at runtime. Any type of information
recognized by the running implementation of IFSoS can be evaluated by the rule engine.
If the Drools rule engine is used, the actual rules are inserted into the system
through a file with extension .drl. The format of a rule file is similar to that of an if
statement. It contains two clauses, when and then. The when clause is where the
condition of the rule is defined. It is written in simple Drools syntax. The then clause
states what will happen if the condition is met. This part of the file can be written in Java.
Any amount of code can be executed if necessary for that rule. This formulation has the
advantage of listing in everyday language.
The Expert module is designed to run conversationally: not all the necessary
information is available to process from the beginning. It uses a mixed chaining strategy
to use new information towards improving its knowledge base.
2.3.5 Decision Module The Decision Module decides how the framework will proceed once the Expert
module has evaluated the data. There are several possible outcomes dependent on how
the framework is deployed within the overall system and the nature of the information
coming from the Expert module.
During the design of the Decision Module, a defensive programming strategy
based on design by contract or assertions was utilized [4]. This strategy ensures that any
garbage information flushed into the framework will not reach any of the other
deployments. When the system encounters information believed to be erroneous or
corrupt, it has several options on how to proceed. The module can contain the bad
information so that it is not shared with any of the other processes. How the module alerts

14
the rest of the system is largely dependent on the specific framework deployment. The
error can be ignored and the next clean data set can be sent on as planned. Alternatively
some type of error message can be logged and the end user will be notified so that the
error can be corrected.
The Decision module is also the location of any potential user interface
deployment. The type of user interface deployed is dependent on the framework
deployment and it's place in the overall system. At each level the data does not necessary
need to be viewed by a user; thus the complexity and functionality of a potential interface
is directly proportional to the framework's placement in the overall system. In many cases
an interface is not necessarily as the information from the module will just be passed into
the Input module of a separate framework deployment.
2.4 Application to Healthcare
As expected, SoS research has included the growing healthcare field [5]. In this section
we present application of our framework as a solution to a healthcare open problem [6].
2.4.1 Introduction When discussing the applications of the framework it is important to note the
ability to use multiple instances of the framework to build systems of systems. An
example of this is illustrated in Fig. 2.1. Each of the five systems is an instance of the
framework containing all of the modules described in the previous section. Connections
between each of the systems can be implemented to fit the needs of the overall system.
The example shows a deployment involving certain systems being able to send data to
other systems, as well as control aspects of their functionality.

15
The medical field provides many potential applications for the IFSoS framework
using multiple systems similar to the example in Fig. 2.1. An example of this is
diagnostic tools. These tools can often be more complicated than a single machine
monitoring one patient. There will usually be several patients grouped together or a series
of machines working in tandem. It is important in these situations to have control over the
system.
Pathologists generate a qualitative assessment on thin tissue sections on glass
slides and perform a histopathologic evaluation. In the past decade, there has been a
growing interest for tools able to reduce human error, and subjectivity. In a small scale,
whole slide scanning technology combined with object oriented image analysis can offer
the capacity of generating fast and reliable results. Techniques that combined the use of

16
Figure 2.3 Tissue Sample and Extracted Features these emerging technologies to characterize models for chronic inflammation in lung
tissue have been developed. In Fig. 2.3 we show examples of lung infections and their
respective identification features. By monitoring the inflammatory changes over five
weeks by measuring the number of neutrophils and eosinophils present in the tissue, as
well as the bronchiolar associated lymphoid tissue (BALT) area on whole lungs sections,
it has been shown that inflammation assessment could be automated efficiently and
accurately. In comparison to human evaluation performed on the same set of sections,
computer generated data have been more descriptive and fully quantitative. Moreover,
optimization of these detection parameters allow scientists to be more sensitive and to

17
generate data in a larger dynamic range to traditional experimental evaluation, such as
bronchiolar lavage(BAL) inflammatory cell counts obtained by flow cytometry [6].
Computerized systems have been used to evaluate cervical intraneoplastic lesions
[CIN] by measuring several parameters with special reference to epithelial differentiation
[7]. Classification and analysis of liver non-alcoholic fatty changes with assessment of
steatosis (fat) grade (SG) have been determined with the development of high-resolution
scanning of liver biopsies and automated methods that process digitized images [8].
The use of our framework could increase the number of samples to be analyzed,
allowing the development of optimal study design and experimental conditions in order
to increase statistical significance between different groups. A combination of whole
slide digital scanning and image analysis could be fully automated and deliver more
descriptive and biologically relevant data over traditional methods evaluating
histopathological changes. 2.4.2 Setup Analyzing and controlling the flow of data as well as modifying the behavior of a
system during runtime is a prime example of a problem easily handled by the IFSoS
framework. The aforementioned situation presents a classic SoS problem: several
codependent processes relying on the data and functionality of each other to accomplish a
goal.
The process is broken down into three main steps. The initial data is generated
through biopsy resulting in a tissue sample, which is inputted into the system through the
Input module and then stored in the Storage module. From the tissue sample, prudent
information is extracted by the Artificial Intelligence module in such a way that it can be

18
easily analyzed further on. Once the data has been appropriately extracted it is then
analyzed in accordance with a robust knowledge base, which is stored in the Expert
module and continuously improved. The results are then provided for examination by a
professional through the Decision module, and the diagnosis is then confirmed or the
process is repeated with expanded parameters.
The cellular analysis problem would, at minimum, require three unique
implementations of the IFSoS system. Each deployment would be tasked with controlling
and monitoring
one of the three process phases. In Fig. 2.4 we show the overview of the application of
our framework to the cellular analysis problem, and in Fig. 2.5 we provide details of its
implementation.
The first deployment (D1) would handle extracting information from the slide
images provided by the lab. Fitting such a task, this deployment would have to
incorporate a feature extraction algorithm, such as David Lowe's SIFT algorithm [9], so
that the data from the tissue picture can be interpreted in a meaningful way. This
computer vision (CV) component would make the Artificial Intelligence module. When
images enter the system through the Input module, they are first sent to the Storage
module to be stored in a large storage receptacle. This is so the tissue sample images are
preserved in their original form. Additionally, the images are forwarded to the CV
component so that relevant data can be extracted. Rules are then used to validate the
processed images and to send them to the Decision module. Computer vision and image
processing are taxing and computationally intensive processes. In our proposed system
there is potential for several D1 deployments, each with a Feature Extraction component

19
implemented. This enables several slide images from separate laboratories to be
processed in parallel, thus helping to cut down on execution time.
In designing this framework we often used the Observer design pattern [10]. In
this pattern different objects are treated as observers or listeners. When data is formed or
manipulated in one module, the other modules are listening for these changes, and will be
updated accordingly. Custom listeners in D1's Decision module can be designed to act as
data transmitters that send the data to the next stage of the deployment. This allows data
to flow seamlessly from one implementation of the framework to the Input module of
another.
Figure 2.4 Slide Processing System
20
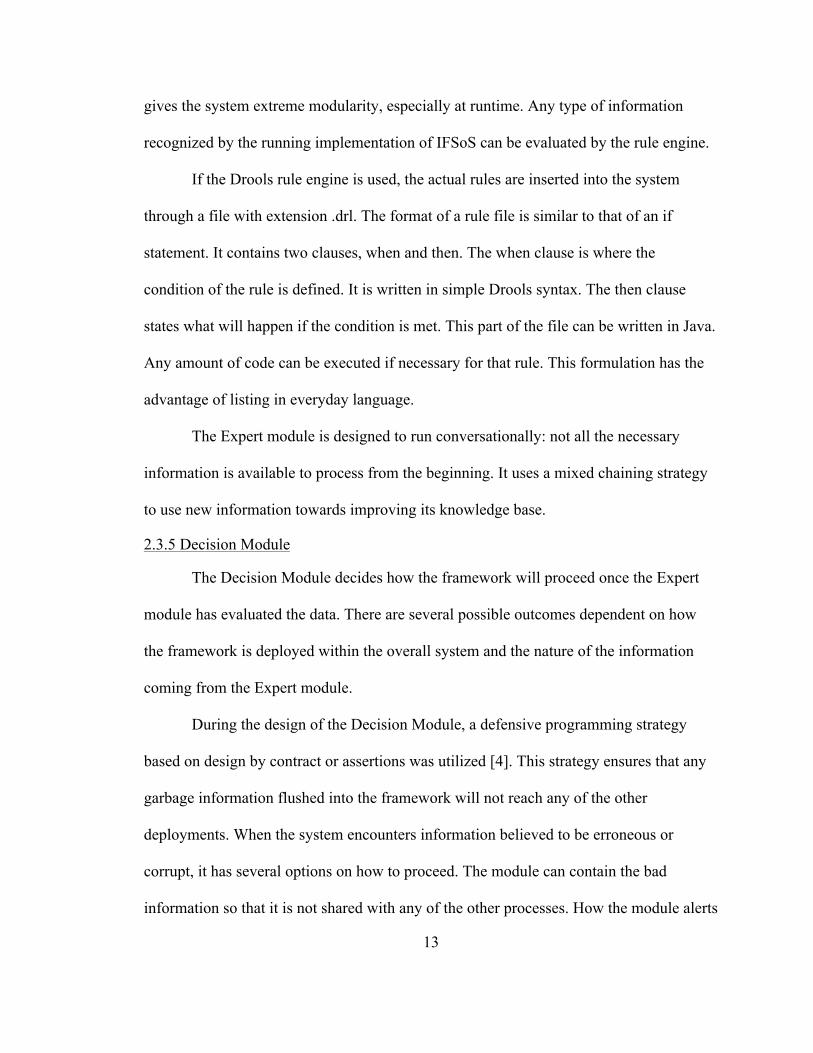
The second deployment (D2) will primarily be responsible for analyzing the
extracted data from D1. Its Input module receives data directly from the Decision module
of D1. Since D2 is not tasked with storing any information, it does not have a storage
receptacle. The data is passed directly into its Expert Module. The data is then analyzed
by a large and robust set of rules in the knowledge base. As the deployment is responsible
for detecting abnormalities and mutations within the tissue images, the rules must be
written with precision and accuracy. The connection between D2 and D3 follows the
same observer pattern as the connection between D1 and D2.
Figure 2.5 System Configuration for Slide Processing The third IFSoS deployment (D3) acts as a human interface into the system. It
receives the results of the tissue analysis from D2 and delivers the end result to the user.
The user would then be able to access the functionality and data of the other two
deployments. The original tissue slide image stored in the data receptacle of D1 can be
accessed and viewed. The diagnosis rule set in D2 can be modified and changed as well.
The Decision module of D3 acts as the control for the entire system. It can communicate

21
with all the levels of deployment and control their functionality. When necessary, it can
execute rules and access data from the other deployments.
2.4.3 Experiment We deployed the framework on three separate networked machines each running
one of the deployments (D1, D2, D3). In this type of deployment there is potential for a
bottleneck to be created, as the system can only run as fast as the slowest computer.
However, this type of problem can be avoided by running all deployments on a
multiprocessor server, although sometimes this might not always be feasible. In
simulation, the IFSoS system performed well. The individual framework deployments
were able to communicate with each other, and the rules engine behaved as expected. The
only minor note of concern is the large level of coordination it takes to initially
deploy the system. Each of the deployments needs to be initialized in a specific order.
While this problem is only a minor one, it can grow as the system becomes more
complex.
2.5 Evaluation
The IFSoS application performed admirably in a laboratory setting. However to
fully gauge its effectiveness and indentify any potential problems with the system, an
evaluation of the system was preformed with an unbiased participant.
The system was be tested under a scenario similar to the one described in section
IV part B, although some minor changes were introduced. The system is attempting to
model a scenario where medical data is presented to a physician after it has been
collected by a lab technician. Some analysis has already been performed by the system

22
for the doctors connivance. In this scenario the medical data being used is images of
blood slides.
The IFSoS system used in the evaluation makes use of three deployments, Storage
Module(D1), RulePlugin(D2), and a DataPlugin (D3). Several modifications have been
made to the system in order for it to work with the provided dataset and the scenario
being emulated.
The Storage Module (D1) underwent the most drastic change through the
inclusion of the Computer Vision (CV) module, who's' functionality is explained in detail
in section V subsection C. No external data storage module was used, as the necessity of
one did not fit within the parameters.
2.6 Conclusion
When faced with complex tasks, a systems of systems is a necessary approach,
which has potential to produce simpler solutions. Our IFSoS framework provides a viable
tool for handling such difficult tasks. Multiple instances of our framework can be
deployed in a systems-of-systems fashion. We have analyzed how the framework can be
used to determine biopsy results and have discussed how it could be implemented for
other uses in the medical field.
As a framework, IFSoS is modifiable and the components are meant to be altered
to fit each deployment. In the future we plan to expand the functionality of the Artificial
Intelligence component. A very robust and well crafted Artificial Intelligence component
can make dynamic changes to the knowledge base at run time.

23
Chapter 3: A User Evaluation of Map and Node-Link Visualization of Graphs2
In this chapter we present the inspiration, design and results of an evaluation exploring
the strengths and weaknesses of two different visualization tools: Map and Node-Link
graphs.
Information visualization is essential in making sense of large data sets. When it
comes to visualization of graphs, the node-link representation is typically used. In this
representation, vertices are represented by points in two- or three- dimensional space, and
edges are represented by lines between the corresponding vertices. The position of the
vertices can be decided using dimension reduction techniques [11] [12] [13] [14] that
attempt to preserve some notion of distance or neighborhood characteristics.
2 Components from this chapter were published in the IEEE Transactions on Visualization and Computer
Graphics (TVCG) in collaboration with Adrian Rusu, Radu Jianu, and Yifan Hu
24
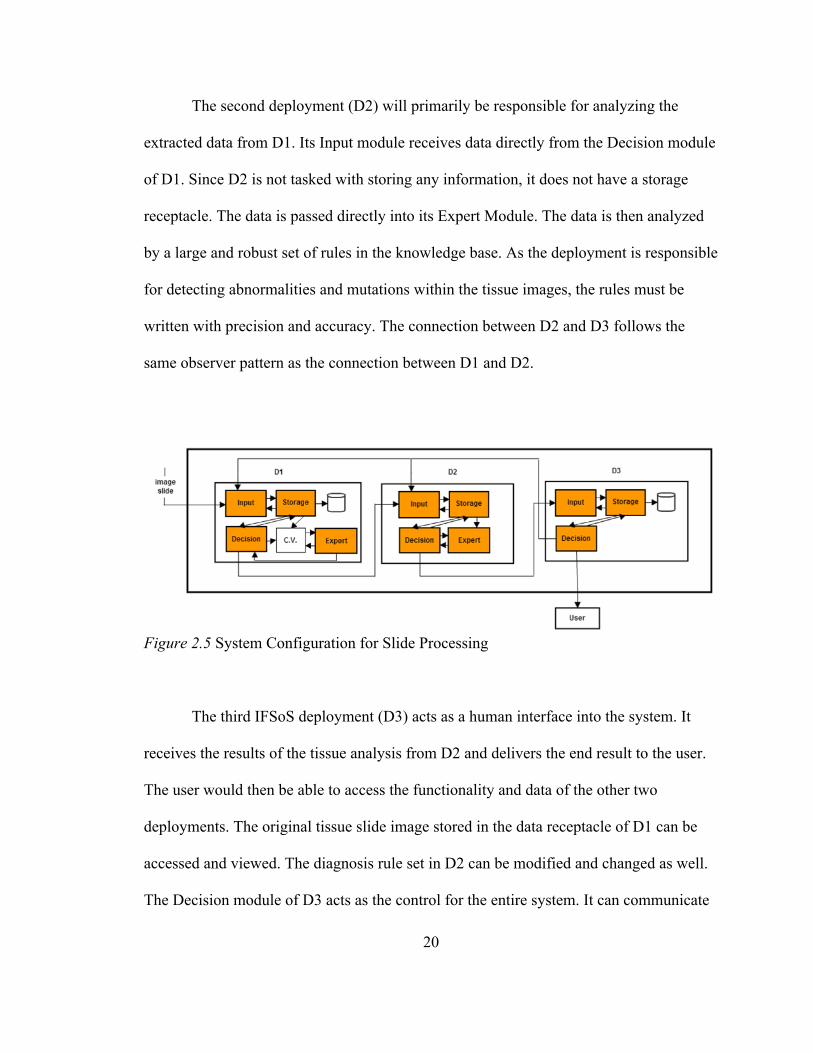
Figure 3.1 A Map of internet communities, with regions showing membership size Dimensional reduction algorithms tend to put similar items next to each other.
Visual examination is often sufficient to identify the presence of clusters. Sometimes,
however, the clusters are not as easy to see and additional visual clues are needed to
highlight them. One possibility is to use cluster analysis algorithms, such as k-means or
modularity clustering algorithms [15] [16] to explicitly find such clusters. The points and
labels can then be colored based on the clustering.
In recent years, in the graph drawing community, there have been increased
interests in representing graphs and the clustering relations among vertices with
geographical maps. It was argued [17] [18] that while in small examples it is possible to
convey the cluster information just with the use of colored nodes and their proximity, this

25
becomes difficult to do with large data. Geographical map based techniques [17] [18]
were proposed to represent the cluster information in high dimensional data. In this
representation, clusters of vertices are enclosed in countries, and the original node-link
diagram can be superimposed on top of the map. The belief is that maps are superior the
following ways:
• Enclosing clusters in counties with explicitly defined cluster boundaries and
colors makes visualization simpler
• Maps are familiar to most people, unlike node-link diagram, therefore they
require less effort to comprehend, and encourage people to explore more.
As far as we know, these assumptions come mostly from intuitions, little has
been done in evaluating the relative strengths and weaknesses of the map viruses the
node-link representations.
Graph and map-based visualization of high dimensional data are also useful in the
context of recommender systems. Traditionally a recommender system gives its
recommendation as a plain list of items. For users, recommendations in a plain list can
sometimes seem odd or counterintuitive. Visualizing recommendations can remove some
of this mystery, showing how a recommendation is grouped with other choices. Map has
the added feature that clusters are enclosed in colored regions, therefore it was argued
[18] that a map based recommendation could be more effective in visualizing similarities
and encourage exploration of the space of items. Therefore in addition to examining the
validity of the aforementioned assumptions that motivated the use of map representations
of graphs, we would like to answer the question: "Does the use of maps help or hurt when
used as part of a recommender system?" Furthermore, we like to know whether the

26
perceived advantage of the map metaphor also comes at a cost, specifically, "Does the
use of colored regions in maps degrade basic graph connectivity related tasks, such as
finding nodes of the highest degree? "
3.1 Experiment Design
The design of the experiment includes:
• Data set (information space), provided to the user for information-seeking
• Hypotheses, set prior to the evaluation, which drive the experiment
• User study, which contains information about the types of users and their interaction with the data set
• Questions, which are targeted at verifying the hypotheses as well as exploring
cases in which hypotheses could not be established 3.1.1 Data Set
The data set of our experiment consists of Amazon's 1984 book data which was
displayed using separate GMap and Node-Link representations (see Fig. 3.2 and Fig.
3.3). Each node represents a book and an edge exists from one book to another if
customers who purchased the former also purchased the latter. The graph is the result of a
web crawl on Amazon.com, starting from the book “1984”, and following the five to six
links given by Amazon under “Customers Who Bought This Item Also Bought...”. The
crawl was done in a breadth-first fashion, and was stopped after nine hops, which resulted
in a graph of 913 books and 2473 links (the graph is treated as undirected). In making the
node-link and map representations, we made sure that everything between these two
representations

27
Figure 3.2 A Node-Link representation of books purchased alongside George Orwell's 1984 stays the same, other than the colored regions in the map representation countries
(clusters), and the colored nodes in the node-link diagram highlighting clusters. By
keeping the difference between the two representations to a minimum, we hoped to factor
out aspects of the visualization that may have influenced the outcome of the user study,
such as font size of the node labels, or color of the nodes and edges.
28
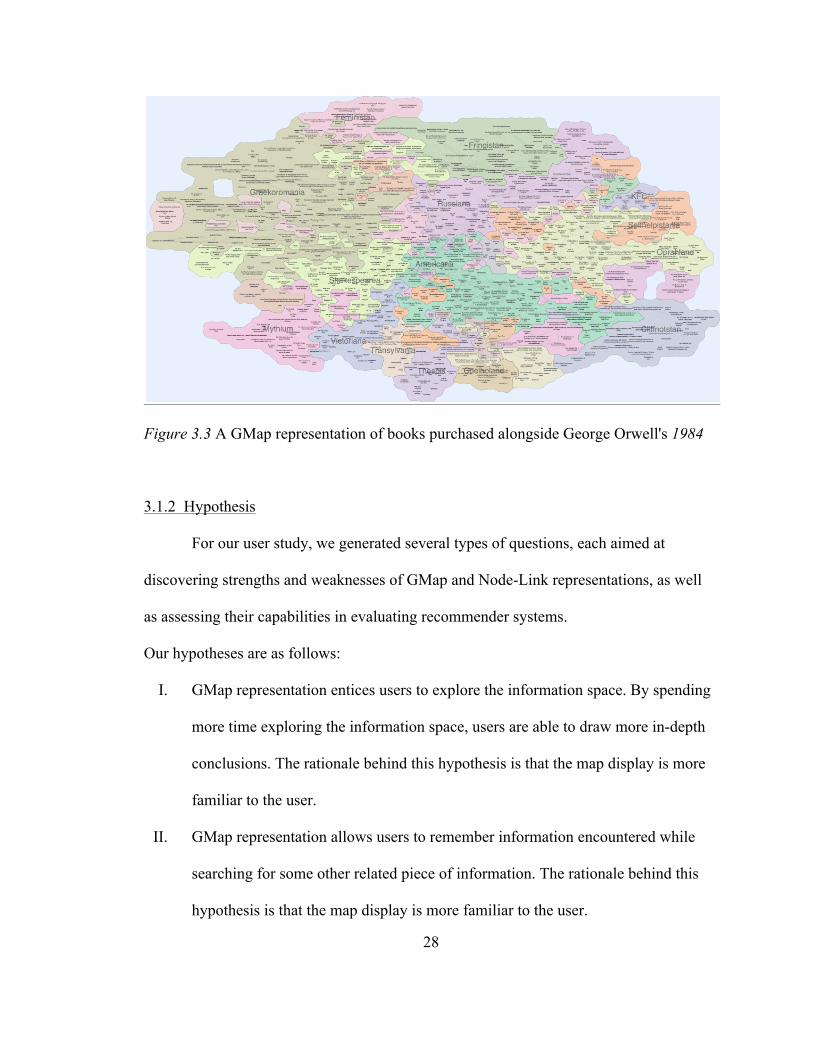
Figure 3.3 A GMap representation of books purchased alongside George Orwell's 1984 3.1.2 Hypothesis
For our user study, we generated several types of questions, each aimed at
discovering strengths and weaknesses of GMap and Node-Link representations, as well
as assessing their capabilities in evaluating recommender systems.
Our hypotheses are as follows:
I. GMap representation entices users to explore the information space. By spending
more time exploring the information space, users are able to draw more in-depth
conclusions. The rationale behind this hypothesis is that the map display is more
familiar to the user.
II. GMap representation allows users to remember information encountered while
searching for some other related piece of information. The rationale behind this
hypothesis is that the map display is more familiar to the user.

29
III. Node-Link representation gives users a way of identifying near-exact numerical
insight at node level, such as number of neighbors of a node. The rationale behind
this hypothesis is that the connections are easier to distinguish, and not hindered
by the use of colored regions and boundaries.
IV. Node-Link representation allows users to follow connected data (paths) in the
information space. The rationale behind this hypothesis is that node-link
connections are more intuitive to follow, while users would have more difficulty
following connections represented as borders.
V. Both GMap and Node-Link representations are able to evaluate the accuracy of
recommender systems. The rationale behind this hypothesis is that both
representations allow ready access to information neighboring the starting point.
VI. GMap representation is able to evaluate the serendipity and diversity of
recommender systems. The rationale behind this hypothesis is that user's
familiarity with the map display allows them to venture beyond the starting point.
In addition to the above hypotheses, we use types of questions which allow us to
identify GMap's and Node-Link's capabilities for basic tasks such as information space
read- ability, identifying subset relationships, or identifying the location of particular data
points.
3.2 User Study
Our experiment was conducted using Amazon’s Mechanical Turk (MTurk), a
Cloud web-based crowdsourcing service. The evaluation group was comprised of 50

30
subjects split into two groups. One group of 25 performed the evaluation using the GMap
representation, while the other group of 25 utilized the Node-Link representation.
MTurk is a web-based crowdsourcing tool that connects users to a large and diverse
population of workers, referred to as turkers. First introduced by Amazon in 2005, MTurk
enables users, referred to as requesters, to post a variety of small tasks for workers to
perform [19]. These tasks, referred to as Human Intelligence Tasks (HiTs), are often
short in duration and upon successful completion turkers are rewarded with a
proportional monetary compensation. A turker is able to view each task and decide on
whether or not they want to undertake the assignment. Once a turker has completed an
assignment, it is reviewed by the requester and approved before any payment is issued.
The demographic makeup of Amazon Turk workface is rather diverse. A majority of
turkers are young. A recent study found that 54% of all turkers are between the ages of 21
and 35, and 70% of all turkers are female [20]. In general most turkers hail from the
United States, although in recent years a growing number of turkers are located in India
[21]. The overall population of turkers roughly mirrors that of internet users [21].
3.3 Evaluation Questions
Each subject was given 11 questions to answer, relating to the provided
information space (Amazon's 1984 book data). Two additional questions involved
specific and general feedback on subject's experience with the evaluation. For each
question the subject was provided with a detailed list of instructions and information
pertaining to the given graph. Instructions define graph-related terminology such as edge
(link), node or degree, as well as map-related terminology such as region (country) and

31
border. They also give background information on the dataset being represented. Thus,
any of the evaluation questions can be answered purely from the given representations,
without any required background knowledge. We selected five distinct categories of
questions, targeted at verifying our hypotheses: general graph-based, recommendation,
memory, low level, and exploration. Each of the question types is aimed at exploring a
different aspect of data analysis and graph observation. After the subjects completed the
evaluation, they were prompted to answer two feedback questions, not directly related to
the given representation. The first requests general feedback regarding the overall
evaluation, while the second provides the user a link to the other visual representation
and asks which one makes performing the evaluation easier.
3.3.1 Graph Questions Graph-based questions aim at showing the overall strengths and weaknesses of
both representations. They address issues such as: readability, identifying subset
relationships, and identification and location of a particular datapoint. These questions
have specific answers that can be found using either graph. Graph questions usually
require the user to locate a particular node and finds its degree, or to estimate the number
of datapoints in a given subset. Due to the large size of the dataset, comprised of more
than 900 nodes, specific datapoints used in questions were highlighted in both
representations. Each subject had a maximum of two minutes to answer each graph-based
question, for a total of maximum six minutes. The three graph-based questions we
selected are as follows: What is the degree of the novel “The Scarecrow”?Are there any

32
data points or subsections that appear particularly isolated? What is the Degree of
"Heart of Darkness?”
3.3.2 Recomendation Questions A recommendation question provides the subject with a particular book and asks
that seven recommendations be made based on the information space. This type of
questions can be answered in a number of ways depending on which visual representation
the subject is using. Using a Node-Link representation, the subject can make
recommendations based explicitly on nodes that share edges with the given book. Given a
GMap representation, the subject can base their recommendations on several factors.
They may be based solely on books located within its own subset. Additionally, the
subject may select books from neighboring subsets that share a strong border with the
provided book’s subset. These recommendations are then compared against those
provided by Amazon.com. Currently the recommendation system used by Amazon bases
recommendations off of previously purchased items. Items are also suggested based on
similar purchases from other customers and popularity [22]. Subjects will be given two
recommendation questions, and are allotted two minutes to answer both questions. Each
subject had a maximum of two minutes to answer each recommendation question, for a
maximum of four minutes. The two recommendation questions we selected are as
follows: List 7 recommendations for a customer that purchases “TheLord of the Flies”,
List 7 recommendations for a customer that purchases “Cat's Cradle”.

33
3.3.3 Low Level Questions
Low level questions are simple, designed to be answered in a very short amount
of time. They are similar to graph-based questions, but allow much less time traversing
the information space. The goal of low-level questions is to see which visual
representation is easier in making fast evaluations and decisions. Each subject had
maximum thirty seconds to answer each low level question, for a total of maximum one
minute. The two low level questions we selected are as follows: Find the node with the
highest degree, Estimate the number of books in the subset “KFC".
3.3.4 Memeory Questions Memory questions are designed to test a subject's ability to recall information
indirectly related to a previously asked question. Each memory question is comprised of
two parts. The first part is a graph-type question given to the subject towards the
beginning of the evaluation, generally of the form locate node X in the given information
space. The second part is a question similar to the first one, but provided towards the end
of the evaluation. It deals directly with information the user has seen while answering the
first part. The goal is to see which visual representation lends itself better to a subject‘s
ability to recall information. We hypothesis that the GMap is the stronger candidate for
memory recall. Each subject had maximum one minute to answer each memory question,
for a total of maximum two minutes. The two memory questions we selected are as
follows: Name two books that share an edge with “The Scarecrow” and Name two books
that share an edge with “Heart of Darkness”.

34
3.3.5 Data Exploration Questions Data exploration questions are aimed at having the subject spend time examining
the information space. The goal is to determine which visual representation is best at
holding the subject's interest. No time constraints were applied to the exploration
questions. The amount of time each subject spent on each exploration question was
recorded. The two exploration questions we selected are as follows: Are there any errors
or misrepresentations within the dataset? Have any books been placed in an incorrect
subcategory? and List five books which you have not heard of and which you would be
interested in purchasing.
3.3.6 Feedback Questions After each subject finished answering the 11 questions in the five main categories,
they were presented with the other representation that they were not exposed to (the
subject who answered the questions using a GMap representation was then given the
node-link representation, and vice versa), and were asked two feedback questions, with
no time constraints. Please give us any feedback regarding the survey. Did you find the
questions very difficult? Did you have enough time? Any feedback is greatly appreciated.
You have utilized a GMap (resp. graph) for this survey would you have been able to
perform the previous tasks better had you been able to use Node-Link (resp. map).
3.4 Results
In this section we present the results of our experiment for each type of questions.
We directly relate the results with our initial hypotheses wherever pertinent.

35
3.4.1 Graph Question Results Subjects were tasked with answering several structural questions about the
information space. Two questions asked the subject to locate a datapoint and determine
its degree. Both of these are tightly coupled with memory questions and as such their
analysis is included in that section. The third question dealt with locating isolated
datapoints. The goal of Graph questions is in part to verify Hypothesis IV and in part to
obtain an overview on how each visual representation deals with basic graph-related
tasks. Subjects were able to successfully navigate both graphs and provide reasonable
answers as to what nodes they found to be isolated. Neither subject group offered more
insightful analysis than the other. Figure 3.4 shows that over the course of the evaluation,
subjects spent a similar amount of time performing their analysis of the information
space. Overall subjects spent an average of 48.6 seconds per question using GMap and
48.3 seconds using Node-Link. While this does not directly coincide with Hypothesis IV,
it supports the notion that GMaps are as intuitive to use as Link-Node representations for
spatial reasoning problems. This conclusion is less than surprising. In GMap, it is as easy
as in Node-Link to spot isolated nodes, due to their tendency to appear along the outskirts
of a given space.

36
Figure 3.4 Time spent per question (in seconds) by Node-Link and GMap subjects 3.4.2 Recommendation Question Results Subjects were tasked with examining the graph and providing seven
recommendations based on William Golding's “The Lord of the Flies” and Kurt
Vonnegut's “Cat's Cradle” books. The purpose of recommendation questions was to
verify Hypotheses V and VI. In Figure 3.5, we show how closely subjects
recommendations mirrored those of Amazon's recommender system. For books " The
Lord of the Flies and “Cat's Cradle”, subjects provided recommendations which matched
Amazon's 100% and 94% respectively. For both books, the recommendations provided
by the subjects matched Amazon's 98%. These findings verify Hypothesis V. When using
the Node-Link representation, subjects mostly followed edges to provide
their recommendations. On the other hand, when using the GMap representation, subjects
were more likely to go beyond direct links to provide their recommendations, as they

37
favored region proximity instead, as well as venturing further away from the starting
point. This finding verifies Hypothesis VI.
In Figure 3.6 we show the percentage of recommendations which followed direct
links versus the percentage of recommendations which did not. In the graph on the left,
subjects using GMap representation provided slightly more recommendations without
links than those using Node-Link representation. Both were a small percentage of the
total number of recommendations. It is not a surprise that for this particular book, GMap
and Node-Link performed similarly, and that generally subjects ventured little outside the
direct links. The reason for this behavior is that “The Lord of the Flies” is a highly
connected book in the information space. On the other hand, in the graph on the right,
subjects using GMap representation provided much more recommendations without links
than those using Node-Link representation. The reason for this behavior is that “Cat's
Cradle” is an isolated book in the information space, and while GMap subjects tend to
venture further away, Node-Link subjects continued to follow the links.

38
Figure 3.5 Subjects were asked to provide recommendations for books “The Lord of the Flies”(top) and “Cat‘s Cradle”(bottom). Red indicates the percentage of recommendations that did not match those provided by Amazon, while Blue shows the percentage which matched. In summary, the recommendations provided by subjects using both visual
representations were successfully able to mimic the recommendations provided by
Amazon's recommendation system, verifying our Hypothesis V and VI, and proving that
both visual representations can be used as viable evaluators of recommendation systems.
Using the GMap representation, subjects selected books from a wider range of categories
across the information space, which included books generally unique and independent of
the others. Conversely those subjects who used the Link-Node representation almost
exclusively selected books with shared edges located within the same subsection.
39
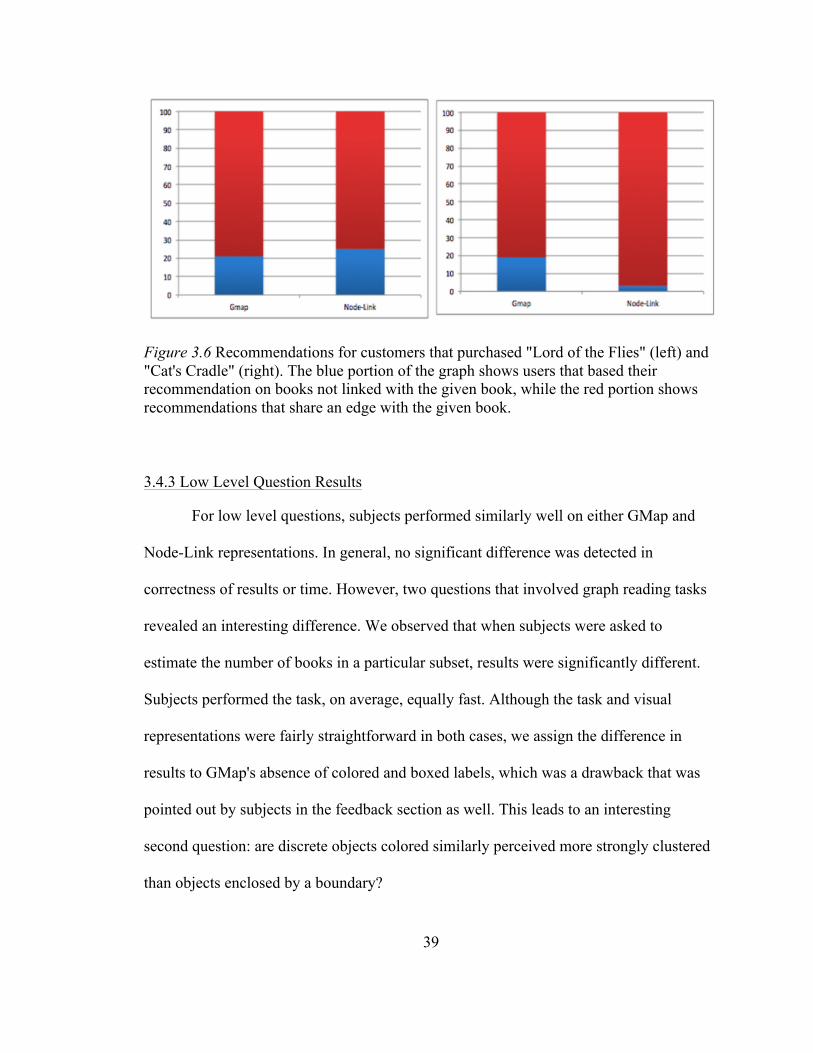
Figure 3.6 Recommendations for customers that purchased "Lord of the Flies" (left) and "Cat's Cradle" (right). The blue portion of the graph shows users that based their recommendation on books not linked with the given book, while the red portion shows recommendations that share an edge with the given book. 3.4.3 Low Level Question Results For low level questions, subjects performed similarly well on either GMap and
Node-Link representations. In general, no significant difference was detected in
correctness of results or time. However, two questions that involved graph reading tasks
revealed an interesting difference. We observed that when subjects were asked to
estimate the number of books in a particular subset, results were significantly different.
Subjects performed the task, on average, equally fast. Although the task and visual
representations were fairly straightforward in both cases, we assign the difference in
results to GMap's absence of colored and boxed labels, which was a drawback that was
pointed out by subjects in the feedback section as well. This leads to an interesting
second question: are discrete objects colored similarly perceived more strongly clustered
than objects enclosed by a boundary?

40
Figure 3.7 Recommendations for customers that purchased "Lord of the Flies" (left) and "Cat's Cradle" (right). The blue portion of the graph shows users that based their recommendation on books not linked with the given book, while the red portion shows recommendations that share an edge with the given book. To summarize, there are only small differences in subjects' performance on low
level tasks between GMap and Node-Link representations. We view this to some extent
as an encouraging result for GMap because it indicates users could potentially benefits
from the categorization and aesthetic attributes of GMap while not losing any “network
reading” abilities. However, it is important to note that GMap‘s added topology
information can in some cases generate misinterpretations of the original connectivity
data. This outcome confirms Hypotheses III and IV, although not to the extent we
initially envisioned.

41
3.4.4 Memory Question Results Memory questions are comprised of two parts. First, a graph-based question is asked
towards the beginning of the evaluation, of the form Find the degree of X in subset A. A
follow-up question with a very short time limit is asked towards the end of the evaluation,
usually of the form Find two neighbors of X. The goal of memory questions is to
demonstrate Hypothesis II.
The first graph-based question was answered easily by both GMap and Node-
Link users, with very little significant difference between their respective answers. This
result seems to contradict Hypothesis IV.
In the memory testing category, we asked users to name neighbors of two specific
books (see Figure 3.7). While for one book results between GMap and Node-Link were
more or less identical, for the second book the answers showed significant discrepancies.
Upon closer inspection, we noticed that the book ranked similarly in the two
representations, was lodged deeply into a GMap cluster. In the second case, the GMap
topology around that particular book was extremely varied and the book was placed in a
small, irregular region, that bordered many other regions. Based on the answers, it was
obvious that some subjects considered books in bordered regions as neighbors even
though no direct connection existed. The results from the memory questions do not
support Hypothesis II as it is currently stated. We believe this corroborates with our
observations in the recommendation section and shows that the overlaid topology of the
GMap introduces an additional layer of interpretation. This can be viewed as both a
drawback and benefit depending on the goals of the visualization. In the case of book
recommendations, going beyond strict node connectivity may be useful and encourage

42
users to use the connectivity more as a guideline while basing their choices on more
dimensions such as title or proximity to other books they know. However, for domains
where the connectivity information is important, GMap's additional coding of
connectivity through map information may be distorting users' interpretation of the data.
Figure 3.8 Subjects were asked to name two neighbors for the books "Heart of Darkness" and "The Scarecrow". The results between GMap and Node-Link representations were identical for the second book but slightly different for the first (left). We posit that the intricate topology of the GMap for the first book (middle) lead subjects to use proximity and borders to answer this. When the book was firmly lodged within a region (right), subjects relied on direct connectivity just as in Node-Link representations. 3.4.5 Exploration Question Results Exploration questions did not have specific answers or time constraints. Their purpose
was to allow the subjects to spend time analyzing the information space in order to verify
Hypothesis I, as well as to add insight into how subjects utilize each visual
representation.
The answers regarding data error and misrepresentation were quite interesting.
Real life data sets often contain errors. In addition, embedding high dimensional data in
two dimensions likely introduces another kind of errors, where data items are placed

43
close to other items that are not highly related to them; this is particularly true for large
graphs. Most of the errors in our dataset are small ones usually of the form of a book
being assigned to the wrong region or a duplicate occurrence of a datapoint. For example
Albert Camus’s “The Stranger” is categorized as a Russian book when it was written by a
Frenchman.
A significant number of subjects found duplicate entries. For example, in the
Shakesperea category, the book “Rosencrantz and Gildenstern are Dead” is represented
twice because the initial crawler which generated the information space also recorded
“Rosencrantz Gildenstern are Dead” as a separate book.
Generally, when looking for errors in the information space, 30% of GMap and
40% of Node-Link subjects reported errors. Interestingly, Node-Link subjects provided
more accurate information. This corroborates with significant longer times spent using
Node-Link (approximately 200 seconds) versus GMap (approximately 115 seconds) on
that particular question. Interestingly, the outcome of this question seems to contradict
Hypothesis I.
In addition to the two recommendation questions, the exploration question in
which subjects were prompted to search the information space for personal
recommendations (i.e. books they might find interesting), also gave us interesting results
that verify Hypothesis VI. The main difference between the two recommendation
questions and the exploration question is that, for the exploration question, the subjects
were given more freedom and not asked to start their recommendation process from a
specific book.

44
As opposed to the question where subjects were asked to locate errors in the
information space, and which contradicted Hypothesis I, their behavior changed when
they were asked to provide personal recommendations, which confirmed Hypothesis I.
Subjects using the Node-Link representation on average spent a shorter amount of time
examining the information space: average of 3.40 minutes versus 4.55 minutes for GMap
subjects. Additionally, the books selected by the subjects are even more telling than the
time differences. Subjects using GMap representation tended to traverse the majority of
the information space to find new books. For example one user selected: “2666: A
Novel”, “Can't buy my Love: How Advertising Changes the Way We Think and Feel”,
“Introductory Lectures on Psychoanalysis”, “The Inferno”, and “The Satanic Verses: a
Novel”. These books come from a wide variety of subsets. Another subject using the
GMap representation selected the following books: “Bird by Bird: Some Instructions on
Writing and Life” ,“Home: A Novel”, “Music and Mind,” “The Hour I First Believed: A
Novel”, and “The Help”. These books belong to a total of three different diverse subsets:
Russiana, Cliffsnotistan, and Oprahland. At the same time, those subjects using the Node-
Link representation, almost always selected books from the same subset or within two
closely connected subsets. Node-Link subjects generally would select a high degree book
in a subset and then select those books that share an edge with it. For example, a Node-
Link subject selected “The Lilad”, “Paradiso”, “Madea and Other Plays”, “Demian”, and
“Night”, which are all tightly connected points located between the border of Graeco-
Romania and Shakesperrea subsets.
Generally, subjects seemed to start with a node with a very high degree, for both
types of visual representations. The results of the exploration question which asked

45
subject to provide personal recommendations confirmed Hypothesis VI. Interestingly,
there were mixed results on Hypothesis I: the exploration question which asked subjects
to identify errors contradicted it, while the exploration questions which asked subjects to
provide personal recommendations confirmed it.
3.4.6 User Feedback
At the completion of the survey, the subjects were asked to provide feedback
regarding our experiment. They were then shown an image the other visual
representation, either Node-Link or GMap, and asked if the other one would have been
easier to use for the evaluation.
The results seem to be equal. When people used GMap first and were shown the
Node-Link representation second, half said they would have opted for GMap (7) while
half would have preferred Node-Link (7). Alternatively, when subjects used Node-Link
first, 6 voted for GMap and 7 for Node-Link.
A subject provided an interesting comment that reveals how automatic data
categorization can sometimes conflict with subjects‘ internal, mental categories and cause
negative effects. The subject mentioned that “I do not think that there are any misplaced
books although I believe that putting most of the canonical British work in the Americana
section is a bit overzealous.” While this problem is mentioned by a Node-Link subject,
the country-like clustering of nodes was an artifact of the GMap methodology.
3.5 Discussion
When asked to identify errors in the information space, surprisingly subjects'
actions contradicted Hypothesis I, by spending less time and finding fewer errors using

46
GMap representation. Hypothesis I was confirmed when subjects were asked to perform
a more personal task, to provide their own recommendations.
We were surprised to notice that Hypothesis II was contradicted by the results of
our experiment. Our initial assumption that familiarity with the map display would allow
subjects to easier localize and remember information seems to the overrun by the
additional coding of connectivity inherent
to GMap representation.
Another surprising result was the evaluation of Hypotheses III and IV. Our
original assumption was that the direct links available in Node-Link representation allows
the subject to have easier access to internal and connected information. We were able to
confirm these hypotheses, however, not to the extent we originally envisioned. In this
case, GMap seems to be a strong contender to satisfy such tasks.
It was interesting to confirm hypothesis V, that both GMap and Node-Link
representations can be used as reliable alternatives for the evaluation of accuracy of
recommender systems. In addition, GMap representation lent itself as a reliable
alternative for the evaluation of serendipity and diversity of recommender systems,
confirming Hypothesis VI.
3.6 Conclusion
We studied the node-link and map representations of graphs through a thirteen-
task user study. Our study utilize the Amazon MTurk service, and involved fifty users.
Results for many of the tasks, for example in graph connectivity related question, showed
no major differences between the two representations. To some extent this is favorable

47
for the map representation because it suggests that the added topological features (colored
regions with boundaries) in a map do not interfere with the “network reading” ability of
the user.
One significant finding is that when asked to use the graph to explore the space
of books, on the whole, map users selected books from a wide range of categories spread
across the map, unlike node-link diagram users who stayed within the same
neighborhood. This indicates that the map representation encourages users to explore
more, and thus should be favored over node-link diagram when used for the purpose of
recommendation, where serendipity and diversity of the recommended items are
desirable.
The use of the MTurk service allowed us to recruit a large number of users very
quickly, but does come at the expense that we have little control of the environmental
condition of the experiment, for example, we do not know what the screen resolution is.
We believe that mostly likely our users utilized a desktop or laptop computer display with
typical resolution, and therefore their zoomed-in view are somewhat confirmed and the
results may not be the same if the study was conducted using a display wall or a large
poster size print-out.
Our results are limited to “flat” maps, where the clusters are not nested, and the
map contains no mountains and valleys, as seen in other maps. How the addition of these
geographical features influence the user behavior remains to be investigated.

48
Chapter 4: An Adaptive and Automated Framework for the Evaluation of
Visualization Tools
4.1 Introduction
The field of information visualization is growing with stark rapidity, with each
year seeing the publication of a greater number of papers and studies. Even before the
conclusion of year 2013, the IEEE Explore Digital library lists over 2,400 new papers
using "visualization" as a keyword, published in its conferences and journals, and
conferences and workshops dedicated solely to visualization evaluations, such as BELIV
( http:www.beliv.org ), are growing in popularity. Typically these papers cover a wide
and diverse range of topics such as algorithm design, new visualization techniques,
development of visualization systems, and the engineering of hardware and display
technology, among many others. In most cases these studies produce software packages,
toolkits, and algorithms whose effectiveness and usability must be gauged and verified.
By far the most common forms of artifact validation are through user evaluation,
usability studies, and controlled experiments. Not only has the volume of produced
software artifacts increased but so has the complexity and uniqueness of these tools [24],
leaving many researchers searching for tools to test the effectiveness of their artifacts.
Evaluations in the field of information visualization vary significantly from case
to case. In most cases researchers test whether a particular user base reacts to a new
visualization tool, how swiftly they can learn the new system, and what new insights they
may gleam using the tool. Usually these evaluations and studies take place in controlled
environments such as research laboratories or academic settings. Therefore, it should

49
come as no surprise that there is an inherent difficulty with constructing and executing a
successful user evaluation or case study. Much of these difficulties come from the sheer
volume of varying avenues of choice one can take when approaching an evaluation [25].
There has been a plethora of work done in creating new software tools to aid in
the process of visualization data [26] [27]. However, there has been relatively little work
done towards the development of a tool that aids with the evaluation process.
In this chapter we present the design and testing of the Framework for the
Evaluation of VizTools (FEV) that streamlines and simplifies the information
visualization evaluation process by consolidating the parameters, structure, and
guidelines of the most commonly-used evaluation scenarios, into a single easy to use
toolkit. The toolkit’s simplicity is designed such that even those unfamiliar with
visualization are able to create visualization evaluations. Thus making the tool very
accessible to those not directly associated with the field of information visualization or
computer science. Our toolkit provides the users with questions specific to their domain,
as well as evaluation constraints and criteria in order to have a successful evaluation.
4.2 Background and Related Work
There has been a large amount of past work investigating the proper methodology
in performing evaluations of visualizations. Such work ranges in scope and topic to cover
a wide variety of methods and principles used in the visualization evaluation from basic
principles to complex methodologies. In this section we explore the background material
related to the research presented here.

50
The difficulty in setting up a proper information visualization evaluation is a
known topic to researchers. For years they have been deliberating over how to test new
visualization tools, and what makes a given evaluation a successful one.
There has been a significant amount of work put into defining and categorizing
the different types of Information Visualization Evaluations, and what defines each one.
A 2004 paper from the University of Maryland defines four distinct categories for
evaluations: Controlled Experiments Comparing Design Elements, Usability Evaluations,
Controlled Experiments Comparing Tools, and Case Studies[28]. One of the more
important facets to come out of the thesis is the idea of evaluation hindsight. After an
evaluation has been performed, many ask themselves whether their results would have
been different had they designed the evaluation differently. This issue can be remedied by
having an openly available collection of evaluation tasks [28].
Furthermore, the evaluation of visualization techniques can be quantified into
several scenarios. Different from the above, these scenarios focus more on what about the
visualization tool researchers test. First published by Lam et.al [25], these scenarios have
become widely accepted throughout the visualization community, and have been cited
frequently since their initial publication. In total there are seven different scenarios under
which a given evaluation can be conducted, each focusing on a different topic:
environments and work practices, visual data analysis and reasoning, communication
through visualization, collaborative data analysis, user performance, user experience, and
automated evaluation of visualization. These seven scenarios served as the basis for our
research, acting as the cornerstone on which the toolkit was built.

51
A large amount of work has gone into the development and understanding of what
makes a visualization evaluation successful [25] [28] [29]. However, there has been very
little work done on developing a tool to assist with the evaluation process. A very recent,
and currently one of the only published examples of an evaluation aid tool is EvalBench
[30]. Developed by researchers at the Vienna Institute of Technology, EvalBench's main
function is to provide researchers with libraries that enable them to perform evaluations
for different types of visualizations tools. Although it was inspired by some of the same
problems that drove our research, EvalBench proposes a significantly different solution to
some of the common problems of visualization evaluation. The goal of EvalBench is to
provide the different solution to some of the common problems of visualization
evaluation. The goal of EvalBench is to provide the researcher with an environment that
can be used to conduct and record evaluations, much like Amazon’s Mechanical Turk.
EvalBench has more flexibility and is more user-friendly in helping researchers set up
evaluations of their visualizations, while Mechanical Turk, in addition to aiding
researchers in setting up evaluations, also provides access to a large number of potential
subjects. On the other hand, the goal of our tool, as described here, and which we
developed independently and concurrently with EvalBench, is to provide researchers with
an automated task-list specific to their data and visualization tool. This task-list can then
be used as the basis for a full evaluation of their visualizations.
In addition to the large amount of work done by [25] and [28] defining the basic
principles of visualization evaluation design, there has been significant work done in
experimental visualization evaluation techniques and human information processing.
Much of this work has come from the BELIV workshop, which specializes in novel

52
evaluation methods for visualization. Much of this work focuses on the ever growing
complexity of data, and how to best evaluate the unique and novel methods that visualize
them. In many cases the proposed evaluation methodology is just as unique as the
software artifact it was created to evaluate. In [31] researchers experimented with
different evaluation questions that focused on how users used the tool regardless of the
answer's correctness. They argue that there are different levels of “correctness" and that
the way a user makes use of a tool will show evaluators the areas their tool needs
improvement. We included a similar idea in the FEV with the inclusion of exploration
questions. In these questions users are asked to explore the graph in order to discover
some unseen connection between datapoints. BELIV workshop researchers could use our
system as an open source tool by testing and adding newer evaluation techniques, thus
making our tool more comprehensive.
4.3 Conceptual Design
The problem often encountered when creating software geared towards dynamics
tasks, is enabling it to handle a growing number of scenarios. It is unreasonable to think
that the number of novel visualization methods being published will taper off anytime
soon. Thus the system should be designed in such a way that it is able to support the ever
growing number of visualization tools. In this section we present our solution to the
aforementioned problem along with the high level design of the FEV system and how it
interacts with other visualization evaluation tools.
The system was designed to support an initial 14 visualization methods. They
range in complexity from a very basic box and scatter plots, to the more complex GMaps
and Data Flow Diagrams. However, this is by no means an exhaustive list. To mitigate

53
the problem of creating a finite list of meaningful questions that can be applied to a
potential infinite list of visualization tools, the FEV System employees a modular design
strategy for handling different evaluation question, in modular programming, an ancestor
to Object Oriented Design, tasks are separated so that different packages are capable of
performing logically different functions. These packages communicate with the rest of
the system through a common interface, as long as the modules comply with it, the
system has no problem using them. The concept is analogous to a tape player, as long as
the correct format is used, the machine will work regardless of the content on the tape.
Such a method allows an almost infinite contents of specific
Figure 4.1 Package Diagram for the FEV Framework packages being explained in amount of modules to be written, to match the expanding
number of visualization techniques. It is our hope that as the system grows, the user base
will contribute to the growing number of visualization based question modules. Thus
creating a large a powerful library for the visualization evaluation community.

54
The FEV's design borrows heavily from the concepts discussed in Martin Rinard's
paper on Example-Driven Program Synthesis in End-User Systems [32] . This paper,
specifies four distinct development steps that should be taken when dealing with
advanced forms of data manipulation: Domain-specific language, data structures, learn
and intersect, and rank. In creating the FEV system we incorporated two of these steps,
creation of a domain-Specific language and corresponding data structures. These
elements allow the system to provide a more thorough evaluation task list by
incorporating the specific data points into the task list. For example, a task list generated
for a GMap would include a question such as “Which data points appear particularly
isolated", would have an answer selected from the provided dataset. A more in-depth
look into this appears in subsection 4.4.3 and 4.4.4.
While creating a meaningful task list is important for a successful evaluation,
having the proper environment to run it in is just as crucial. Both environment and
taxonomy are crucial to evaluating a new tool, but currently no software package exists to
handle both steps in the evaluation process. Currently the only other known tool to assist
with the evaluation process is EvalBench, which is discussed in-depth in section 4.2. To
further streamline the evaluation process the FEV system produces an evaluation task list
as an XML file that complies with the formatting constraints of EvalBench, an example
of such a file is included in the Appendix. This enables users to create a task list and

55
Table 4.1 Predefined Questions
seamlessly run it using EvalBench without any form of conversion. Such a feature is
crucial as the popularity of EvalBench will only grow.
4.4 System Design
In this section the design and structure of our system is documented. The
overarching design is described first with the contents of specific packages being
explained in detail in individual sections. The software engineering design principles

56
used in the construction of the system are explained as well as the rationale of why the
FEV system functions the way it does.
The system was designed in Java with a strong emphasis on Object Oriented
Design (OOD) and modular programming. The system adheres to many of the principles
of OOD, such as the Interface Segregation Principle, as well as several design patterns.
Additionally, MySQL was used as the database management system.
The FEV system is composed of six packages, with each package containing a
varying number of classes (see Figure 4.1). Each package is responsible for a specific
task. The functionality of each of these packages is hidden from the rest of the system.
Any class wishing to access the functionality of another package must do so by utilizing a
publicly accessible manager class implemented in each of these packages. This is done to
lessen the coupling between packages, and to reduce the complexity of communication
among classes.
The user interfaces with our system through a graphical user interface (GUI), that
allows them to specify what evaluation scenario they are using, and what visualization
tool will be used. They also use the GUI to upload the data file, if applicable, used by
their visualization tool. Currently the system supports the following fourteen
visualization tools:
1. Pie Chart
2. Line Chart
3. Bar Chart
4. Histogram
5. Scatter Plot

57
6. Box Plot
7. Data Map
8. Tree Map
9. Radar Chart
10. Data Flow Diagram
11. GMap
12. Knowledge Integration Map
13. Node Link Diagram
14. Communication Diagram
While this is not an all encompassing list, it does provide the user with some variety.
4.4.1 Data-Inload Package
The data in-load package is responsible for parsing the XML data file provided by
the user, and creating the necessary data structures used by the rest of the system to
access the data. The system accepts an XML file containing relevant information about
the data used in the visualization as described in Figure 4.2. It is possible that some of the
fields in the input file will remain unused. This is due to the fact that the input file must
be broad enough to work for a plethora of visualization tools. Thus fields such as
percentage, xy coordinates values, and percentages are all included; so that one input file
can work for a variety of visualization tools from simple line charts to more complex tree
maps. Similar to the other packages, the DataInload package makes use of a manager
class. The manager class provides a public interface that allows other classes to accesses

58
the functionality of the DataInload package.
Figure 4.2 Sample XML file. Data shows closing prices for the AGX stock, visualized using a line chart The XML input file is parsed using read and processed using two Java libraries:
the Document Object Model from W3C and the javax XML parser. Both are used to read
in the input file and extract the fields. All of the fields are extracted regardless if they are
used or not. For example, an input file representing a line chart would only have data for
the x and y coordinate fields. This data is then placed into a data structure. Once the file

59
has been fully parsed and all data extracted, the data structure containing all relevant
information about the evaluation is returned to the calling method by the data in-load
manager.
If that system fails to parse the input file, for whatever reason, the user is notified
of the exception. From there they can submit a new input file after they have made the
requested adjustments, if any, that were needed for the system to successfully read and
parse the input file.
4.4.2 Data Object Package
The Data Object Package holds the classes that represent the various data
structures used by the system. The system uses four unique data structures to represent
the data used in creating the evaluation task list: Datapoint, EvalObject, Question, and
XMLObject.
The most basic data structure is the Datapoint, which represents an individual data
point provided by the user in the XML input file. Each Datapoint object holds the values
for that Datapoint and the group and label if they are used. This is done for each data
point in the input file. The data points are then placed inside of the larger data structure
XMLObject. XMLObject acts as a wrapper class, holding references to the data points
and the other meta-data provided by the user.
Once the data has been processed and the tasks for the evaluations have been
generated, that data is then transferred into an EvalObject. Much like the XMLObject, the
EvalObject contains all relevant information for the evaluation task list. Each EvalObject
also contains a list of Question objects, which are generated from the data points. Each

60
Question object contains all prudent information about an individual evaluation task such
as: the question, answer, the type of question, and the recommended completion time for
the question.
4.4.3 Database Not every task generated for each evaluation is created based on the data provided
by the user. For each of the seven different scenarios, there are a number of predefined
tasks that can be used in an evaluation. In total there are 30 pre-made questions that can
be applied to the different evaluation scenarios. These questions can be broken down into
two different categories: short answer and paragraph. The differences between the two
categories are the expected answer length and the suggested amount of time given to the
user. Tasks designed as short answer generally require only a limited response, whereas a
paragraph task requires more elaboration and expose.
These questions are designed to gauge how effectively our system works in a
specific environment or task. In order to make the tool more applicable, the questions are
worded fairly general, and may require slight modification by the user to fit the specific
parameters and goals of their evaluation. Table 3.1 lists several of the predefined
questions along with their suggested times, and category. These questions are derived
from those presented by Lam et. al [25]. The entire question set has been included within
the appendix.
4.4.4 Database Connection Package The Database Connection package is responsible for retrieving questions from a
database. Like other packages this is done through a manager class. Not every question is

61
generated using the provided data. Several of the seven guiding information visualization
evaluation scenarios focus on aspects of visualization not directly related to extracting
information, although this always remains a strong part of any evaluation [25]. In fact, is
it widely thought that one of the most important questions one can ask during an
evaluation is to have the user freely explore the tool, documenting any insights they may
come up with [24] [28]. Thus it is important to have a series of pre-constructed tasks that
are geared more towards the seven guiding scenarios than to a specific tool.
The database package utilizes the Java SQL library for performing queries on the
database. The database manager is passed as a reference to the EvalObject currently
being created by the system. From the information contained in this object it creates a
query string, and retrieves all questions relating to the given scenario and tool. This data
is transferred into new created Question objects and stored in the EvalObject’s list of
questions.
4.4.5 Graphical User Interface Package As its name implies, the graphical user interface package, contains all classes
necessary for the construction of the graphical user interface(GUI). The GUI package
differs somewhat from the other packages in that it does not have a manager class. This is
mainly because the GUI package is not accessed by the any other classes.
The GUI serves as a user's main interface with the FEV system. From the GUI,
the user is able to set basic options for their evaluation, such as: the type of the
evaluation, what visualization tools were used, the name of the evaluation, and if the user
requires a limit on the number of questions. The user is not required to specify a limit on

62
the number of tasks the system will generate for them. Unless specified otherwise, the
framework will provide the user with all questions related to their selected tool and
scenario.
Figure 4.3 Graphical User Interface for the FEV system Users are able to upload the XML data file as well. In designing the GUI, simplicity was
highly emphasized (see Figure 4.3). There are only two drop down menus, one that
allows the user to upload a file, and the other gives the user access to various helpful tips
about the system.
4.4.6 Data Analysis Package The Data Analysis Package is responsible for creating a list of evaluation tasks
based on the data provided by the user in the XML input file. The Data Analysis is the
core of the FEV system. It creates custom evaluation tasks for user-specified

63
visualization tools. The entire communication with this package is through a manager
object. The manager object is given an object of type EvalObject, and from this creates
the required question generation class. The questions generated by these classes differ
significantly from those described in subsection 4.3.3 in that they are unique to the
visualization tool being used and the data provided by the user. These tasks are almost
exclusively used in evaluations where user performance is being evaluated. They tend to
focus on memory recall, quantitative analysis, and exploration of the visualization [25].
Figure 4.4 A Partial Class Diagram for the DataAbalysis Package Each visualization tool supported by the system has an individual class associated
with it that generates tasks specific to that tool. All of these classes extend the abstract
class QuestionBase (see Figure 4.4). The QuestionBase class includes methods that can
be applied to almost all types of visualization tools. Such tasks include finding the
maximum or minimum value presented in the data set, or finding any outliers in the data

64
set. Obviously these questions are not suitable for every type of visualization tool, for
example a Learning Map would have little use for any of these, but this is why each tool
implements their own version of the QuestionBase class.
Each visualization tool-specific class generates its own questions in addition to
those questions inherited from the QuestionBase class, if applicable. The types of tasks
produced by the concrete question classes vary significantly from class to class, as do the
visualization tools that they represent. The types of tools represented can be divided into
seven distinct categories, as explained by Lengler and Eppler [33]. It is unrealistic to
think that the system will be able to accommodate every visualization tool in every
scenario, as new visualization techniques are constantly being developed. To be able to
use this system even if their visualization tool is not directly supported, users can select a
tool that is from the same category as their own. For example, a user wishes to evaluate
the user preference of a Semantic Network [34], a visualization tool not currently
supported by the FEV system. To navigate around this dilemma, the user would only
have to select a tool that falls under the same category. As both Semantic Networks and
Tree Maps fall under the same category, Information Visualization, this could be an
acceptable substitute.
The system is able to operate in such a manner because the questions designed for
the individual visualization tools are designed to test not only those tools, but any tool
that falls under this category. While this does not provide a perfect fit for those tools not
currently supported by the system, it does provide a strong starting block to design an
evaluation.

65
4.5 System Testing
The FEV system was tested under three different scenarios in order to gauge how
it fulfills its design goals. To do this, three different tests were performed on the system.
In this section we describe the use cases we tested the FEV system with. Two of the cases
make use of fairly simple visualization tools, and one case uses a more advanced tool.
The first two use cases serve as a “proof of concept" for the system, illustrating its basic
functionality in a variety of settings, while the third use case involves a visualization tool,
and is intended to heavily tax the system, and thoroughly probe its abilities.
In each test a visualization tool was evaluated for user performance. The data used
in our study was collected from www.data.com. It represents closing ticker prices for two
stocks, AGX and ZN on the AMEX Exchange. Many financial institutions generate in-
house reports on stocks, mutual funds, and hedge funds. These reports generally present
this data in the form of graphs, charts, and other visualization tools [35]. Our tests
attempted to replicate the type of evaluation a financial institution would perform when
testing the effectiveness of different visualization tools.
4.5.1 AGX Line Plot Use Case The FEV system was first tested to see if it could successfully generate an
evaluation task list for a Line Chart. The chart depicted closing ticker prices for Argan
Incorporated (AGX) stock over a three-year period (see Figure 4.5). The data used was
from a publicly available repository, and was formatted using a small Perl program. See
Figure 4.2 for an example of properly formatted data.
The goal of the test evaluation was to see if users could successfully extract
meaningful data about the patterns of an individual stock from a line chart. For this

66
evaluation, the "Evaluating User Experience" scenario was selected, and Line-Chart was
set as the visualization tool. For this test evaluation, no limit was set on the number of
tasks provided by the system.
Figure 4.5 A Line Chart showing the closing ticker price of the AGX, in US dollars, over a three year period. Our system was able to read and extract all data from the input file with no
difficulty. All predefined questions were returned to the user along with those unique to
the LineQuestion concrete class. The system was successfully able to create data specific
questions such as: "What is the maximum value displayed on the graph?" and "What is
the minimum value displayed on the graph?" , as well as provide correct answers for both
of them based on the provided data. The task list, correct answers, and recommended
question times are outputted as an XML file.
4.5.2 AGX and ZN Scatter Plot Use Case

67
The second use case evaluation followed a similar theme as the first: a financial
institution wished to test the effectiveness of a visualization tool for its ability to convey
data to its users. In this test, the visualization tool used is slightly more complex. In this
scenario, a scatter plot comparing the closing ticker prices for AGX and ZN was used
(see Figure 4.6). This data could just as easily been visualized using a line chart as
before. However, to illustrate the robust nature of our system, a different, but appropriate,
tool was selected.
Figure 4.6 A scatter Chart showing the closing ticker price of the AGX(blue) and ZN(red), in US dollars, over a three year period. The data for this test was collected from the same location as before, only stock
prices for the ZN stock were also selected. The FEV tool was also configured similarly as
be- fore, with the scenario and number of questions remaining, as they were, only the

68
evaluation tool used was changed to Scatter Plot.
Our system was able to read and parse all input data and exhibited no difficulties
in differentiating between data points belonging to either stock, as well as successfully
producing the predefined tasks relating to the tool and scenario. As before, our system
was able to produce questions specific to the data set provided, along with the correct
answers as well.
4.5.3 Author Collaboration GMap Use Case In the third and most complex use case scenario the FEV system was used to create
an evaluation task list for a GMap, see figure 4.7. A GMap is a visualization tool
designed to display relational data in a geographical map, several examples can be found
here (http://www2.research.att. com/~yifanhu/GMap/). For this use case a GMap was
used that displays author collaboration over a ten-year period. Authors are broken up into
geographic regions similar to countries, and an edge exists between any two authors if
they have jointly published a paper in the Symposium on Graph Drawing (GD), between
1994 and 2004.
The GMap use case is perhaps the most significant for the FEV system as it fully
explores the system's primary directive, creating evaluation task lists for novel
visualization tools. The GMap is such a tool, new and unique it bears little resemblance
to any other visualization tool. So being successfully able to create a task list for such a
system is of crucial importance.
There were three phases in this use case: data preparation, class construction, and
system execution. In the first phase the data was taken from the Graphviz .gv file and
transferred into the FEV input language described throughout section 4.4. Following this,

69
a custom class was written to accommodate the nuances of the GMap, and fitting with the
modular design of the FEV system detailed in section 4.3. In keeping with GMaps
resemblance to a map many of the questions are based on exploration and drawing
inferences from data point location. For example questions such as “What authors have
published a significant amount of articles" and “Do any authors stand out as significant
names in their field" were used. These questions are intended to force the user to explore
the map. The answer to the first question can be inferred by looking for authors who
share an edge with a significant amount of other authors, Liotta, Leipert and Kobourov
are all acceptable answer.
4.5.4 Results While the system was able to generate task lists for specific visualization tools,
some issues did present themselves during testing.
The first issue became apparent before the first test case was even initialized. Our
system had no knowledge of what type of data the user would be providing. In earlier
iterations, we designed the system to only accept integer values for data input. What
began as a simple a coding oversight quickly became a pressing concern. It’s
unreasonable to assume that the user will only provide numerical data. In the test cases
above dates were given as strings to the system. Using defensive programming
techniques, and control statements as well as overloaded methods in the DataAnlaysis
package to avoid any type exceptions solved this. Depending on what type of exception
was thrown, the system would take steps to either convert the input, or would utilize a
method that expects that type of input. For example, in the test cases above, dates were

70
entered into the xValue field as "1/01/08"; such a format does not lend itself well to
numerical analysis and statistical inference. To circumvent this issue, functionality can be
incorporated into the system that converts lexicographical dates into numerical values,
thus simplifying the calculation of time passage. Alternatively, the classes in the
DataObject package can be reworked to accommodate a data of several types. While
there are many possible solutions to circumvent the data type issue, only through
extensive evaluation of the system will the most efficient method become apparent.
Figure 4.7 GMap representation of joint authorship

71
Upon completion of the evaluation test cases, it became clear that actual users
would require more options on how the evaluation task list is presented to them. The
system was able to successfully generate an evaluation task list based for the GMap based
on the joint authorship data. Furthermore more the questions generated for the GMap
evaluation where used in a successful evaluation. While a text file is useful in its
simplicity, many users might require more robust output formats. For example, it would
be beneficial for a user who is utilizing EvalBench as their testing environment to be able
to output their evaluation task list in a format that is compatible with EvalBench.
Similarly, any researcher utilizing Amazon’s Mechanical Turk for participant
requirement would greatly benefit from the ability to customize their output file to one
that blends well with MTurk.
4.6 Future Work
While our FEV system is a robust and easy to use tool, there are several potential
features that would greatly expand its functionality, versatility, and ease of use.
One of the reoccurring issues in visualization evaluation is the sheer volume of
techniques, scenarios, and guidelines in place. It’s overwhelming and difficult to sift
through. Our system aims to correct that by centralizing many of well-known and proven
visualization techniques and scenarios into a single location. However, the information
provided by our FEV system is not exhaustive. To remedy this issue, future iterations of
the system will include a Web component. Such a component will allow other researchers
to add their own questions, scenarios, and visualization tool specific questions to the
system. Thus, as time progresses, the system will learn and grow to mirror the academic
standard for what successful and thorough evaluation entails.

72
As the number of potential questions grows, a ranking system must be put in
place so that when users specify the number of questions returned, they will only receive
the higher ranked questions. In order to accommodate this functionality, the Web
interface will have incorporated a feedback system so that users can rank which questions
they found useful in their own evaluations.
Currently, the FEV system requires that all data is formatted according to a specific XML
structure (see Figure 4.2). While this format is relatively simple and flexible, as data used
in the evaluation was formatted using a simple Perl script, it can always be improved
upon. Future versions of our framework will implement an adapter system for data in-
load. Users will be able to make use of a number of adapters to read in data from a
variety of sources such as MySQL, CSV, and Microsoft Access. Written in Java with
publicly available APIs, the adaptors will allow users to use their data as it is without the
need for them to write their own conversion software.
4.7 Conclusion
Through meticulous design and adherence to established principles of computing
theory and software engineering, we were able to create a toolkit that solves some of the
pressing issues of information visualization evaluation. The Framework for the
Evaluation of VizTools provides researchers with a platform they can use to build
evaluations. It solves one of the current issues plaguing information visualization
evaluations, and includes centralizing a collection of metrics and benchmarks that can be
used in any evaluation.
Per our knowledge, our system is the first attempt at automating the task of
creating robust evaluations for visualization tools. It generates questions based on state-

73
of-the-art evaluation research, according to the type of the visualization tool a user needs
to evaluate.

74
Chapter 5: Conclusion and Future Work
The visualization of data is a fundamental part of not only computer science, but
all disciplines. Many fields are taking advantage of new data collection methods, and as a
result now have accesses to large swathes of data. However making sense of this data is
no easy task, as the dimensionality of the data grows so does the complexity in
understanding it. Thus researchers are developing new methods for visualizing all stripes
of data. As they are experimental in nature many of these news visualizations are far
from perfect, in the visualization community researchers will commonly perform a
visualization evaluation to test the effectiveness of their tool. Due to the wide range of
potential domains and tools these can range from a simple questioner to in-depth analysis.
They also tend to be very subjective, with researchers employing their own means and
methods in the process. Throughout the years there has been some work done to establish
what should be done to achieve a successful evaluation. This thesis presents a solution to
the taxing issue of how to successfully create an evaluation for any given visualization
tool. By incorporating these principles into an easy to use software package researchers
now have the ability to seamlessly create evaluations for any number of visualizations.
Initially we created a comprehensive evaluation for the GMap, a novel
visualization that visualizes the relationships between data subsets as borders between
countries. These study was aimed at not only thoroughly testing the GMap, but also as a
exploratory study into what makes a successful evaluation and the effectiveness of
current practices used in evaluation.
The study began by picking a comparable visualization, and examining how it
stood up to the GMap in several categories. When preparing the evaluation questions we

75
went through several versions of the task lists honing the questions and tasks with
feedback from a small user group. However this was a very time consuming process, with
each version taking several hours to create, as we had to continually reference the data set
being visualized, and decide on what answers would be considered correct and how we
would gauge the correctness of each answer. All of this work resulted in a successful
evaluation, but left us wondering how the process can be improved.
Secondly we created a framework that is able to interpret data, analyses it, and
then acts on it. Although a simple idea, we focused on more system related features such
as deployment, scalability and communication between components. The idea was to
build a framework that can be expanded upon and deployed in a variety of manners.
Although initially designed with application to health care, the versatility of the system
means it can be easily modified to work in a variety of settings.
Finally we combined the ideas of a dynamic and modifiable framework to the
problem of visualization evaluation. What resulted is a tool that can automatically
generate an evaluation task list for any number of visualization tools. Additionally it has
the ability to create unique tasks based specifically on the data being visualized, thus
saving the researcher hours of work.
The software applications presented in this thesis ultimately achieves the goal of
streamlining and automating the visualization evaluation process. Not only do they
automate the evaluation process but they also remove much of the bias associated with
the evaluation process.
The FEV tool has been used successfully in several different evaluations. Each
scenario used a completely different data set and visualization. Thus testing not only the

76
system's ability to generate evaluations, but testing the ability of the domain independent
input format to represent data.
Initially the system was tested using stock prices visualized with a line and scatter
chart, a basic dataset and visualization method. Following this we tested the system with
a more abstract tool a dataset. We utilized a dataset set complied by AT&T research
mapping author collaborations over the course of a few years. This data was visualized
using a GMap. The GMap evaluation is considerably more challenging those pervious, as
both the dataset and tool are fairly abstract. However the FEV tool was capable of
creating an evaluation with little difficulty. This is due largely in part to the FEV's
framework style design and the structure of the domain independent input language. It
was a simple matter to create a plug-in that would generate GMap specific questions, this
combined with the already sizable amount of questions in the system resulted in a large
evaluation task list. Finally the system was given a more through and real world case
study. Done in part with the Rowan University College of Engineering, an evaluation was
prepared using data collected by the Department of Electrical Engineering, mapping
brainwaves in Alzheimer's patients. Currently the Electrical Engineering department uses
a line chart for presenting their data. The data consisted of the brain's response to 28
different electrical tones in fifty patients with Alzheimer's disease. In total the dataset
encompasses over 1400 different data points. The goal of the evaluation is to determine
what is a better way to display the data, a basic line chart or the more uncommon parallel
coordinate plot.
A set of evaluation questions was generated, under the Evaluation User's
Experience scenario, with the FEV tool and given to a group of graduate students to

77
answer. In total there were six questions, with each one statistically focused. The students
were given 90% per question, but did not have to use the entire time to complete the
question. The subjects universally found the line graph easier to use, and found the
parallel coordinates plot more difficult to follow, with 75% percent of the students tested
blaming the parallel coordinates for their inability to locate minimum and maximum
values.
After fully reviewing the subject's answers, it is apparent that a line graph is
superior to a parallel coordinate plot when displaying multivariable data. This results are
somewhat surprising as a parallel coordinate plot is designed to display multivariable
data. However it is possible that the dataset used contained to many variables that
followed no common trend, thus making viewing very difficult due to the overlapping
nature of the plotted lines. This should serve to illustrate the FEV tool's strengths, as the
evaluation it generated disproved the researcher's hypothesis. Something that may not
have happened if the evaluation would have been generated by hand.
While the FEV tool currently exists as a full toolkit, it is hardly an end-all system.
There are still several features and additions that could greatly expand a user's experience
when using the tool. There are currently hundreds of different visualization methods, so
expanding the number of plugins will always be useful. A publicly accessible digital
location would also be greatly beneficial to the FEV user base. This would provide them
with information about the software, as well as the means to contribute to it in the form of
new plugins, similar to software products like EvalBench. The most impactful change to
the system would be to alter how the users interact with it. Written in Java, users
currently experience the system by using a Java executable. While java is a popular

78
language, there are better options for enabling user access to the tool. Tying in partially to
the aforementioned point, a web based interface would make it much easier on many
users, as well as reduce the learning curve for use.
Each of the ideas and developments presented in this thesis mark a significant
stride in not only the goal of automating the evaluations process but to the entire field of
information visualization.

79
List of References
[1] A. Mostafavi, D. Abraham, D. DeLaurentis, et. al., "Exploring the Dimensions of Systems of Systems of Innovation Analysis," in IEEE Systems Journal, Vo. 3 No. 3, pp. 256-265, 2011.
[2] M. J. DiMario, J. T. Boardman, B. J. Sauser, "System of Systems Collaborative Formation," in IEEE Systems Journal, Vol 3. No. 3, pp. 360-368, 2009.
[3] P. Jackson, Introduction to Expert Systems. Boston, MA: Addison Wesley, 1998.
[4] C. A. R. Hoare, "An axiomatic basis for computer programming," in Communications of the ACM, 1969.
[5] Y. Hata, S. Kobashi, and H. Nakajima, "Human Health Care System of Systems," in IEEE Systems Journal, Vol. 3 No. 2, pp. 231-238, 2009.
[6] S. Gawrieh, D. M. Knoedler, and K. Wallace, et. al., "effects if interventions on intra- and interobserver agreement on interpretation of nonalcoholic fatty liver disease history," in Diagnostic Pathology, Vol. 15, pp. 19-24, 2011.
[7] C. Apfeldorfer, K. Ulrich, G. Jones, et. al., "Object oriented automated image analysis: quantitative and qualitative estimation if inflammation in mouse lung," in Diagnostic pathology, July, 2008.
[8] M. Jondet, R. Algoli-Agbo, and L. Dehennin, "Automatic measurement of epithelium differentiation and classification of cervical intraneoplasia by computerized image analysis," in Diagnostic Pathology, Jan., 2010.
[9] D. Lowe, "Distinctive image features from scale-invariant key points," in International Journal of Computer Vision, Vol. 60, No. 2, pp. 91-110, 2004.
[10] E. Freeman, E. Robinson, B. Bates, and et. al., in "Keeping your objects in the know," Head First Design Patterns, Sebastopol: O'Reilly Media, 2004.
[11] E. Gansner, Y. Hu, and S. Kobourov, "GMap: Visualizing Graphs and clusters as maps," in PacificVis, pp. 201-208, 2010.
[12] H. Lam, E. Bertini, P. Isenberg, et. al., "Seven Guiding Scenarios for Information Visualization Evaluation," Unv. Calgary, Calgary, CND, 2012
[13] An Introduction to GraphViz and dot, 1st ed., O'Reily, 2004
[14] J. Heer, "Prefuse: A Toolkit for interactive information visualization," in Proc. of SIGCHI, pp. 421-430, 2005.
[15] C. Plaisant, "The Challenge of information visualization evaluations," in Proc. of working conference on advanced visualization interfaces, pp. 109-116, 2004.
[16] K. Andrews, "Evaluating information visualizations, " in Proc. Beyond time and errors: novel evaluation methods for information visualization, pp. 1-5, 2006.
[17] W. Aigner, S. Hoffman, and A. Rind, "Evalbench: A software library for visualization evaluation," in Proc. of EuroViz, pp. 41-50, 2013.
[18] E. Mayr, M. Smuc, and H. Risku, "Many roads lead to Rome: mapping users problem solving strategies," in Information Visualization, Vol. 10, No. 3, pp. 232-247, 2011.
[19] M. Rinard, "Example Driven program synthesis for end user programming: technical perspective," in Communications of the ACM, Vol. 55, No. 8, pp. 96-97, 2012.

80
[20] R. Lengler and M. Eppler, "Towards a periodic table of visualization methods of management, " in Proc. of International Conf.on Graphics and Visualization, pp. 83-88, 2007.
[21] J. Sowa, Principles of Semantic Networks, Morgan Kaufmann, 1992.
[22] H. Michael, P. Swathi, and L. Brian, "Global Investment Strategy: the longest year," Merrill Lynch, 2013.
[23] Requester Best Practice Guide, Amazon Inc., 2011.
[24] J. B. Kruskal and M. Wish, "Multidimensional Scaling," Sage Unv., Beverly Hills and London, CA. 1978
[25] T. M. Fruchterman and E. M. Reingold, "Graph Drawing by Force Directed Path," in Software Practice and Experience, 1991, pp. 1129-1164.
[26] S. Rowies and L. Saul, "Nonlinear dimensionality reduction by locally linear embedding," in Science, 2000, pp. 2323-2326.
[27] J. B. Tenenbaum and J. C. Langford, "A global geometric framework for nonlinear dimensionality reduction," in Science, 2000, pp. 2319-2323
[28] S. Lloyd, "Least Squares Quantization in pcm," in IEEE Transactions on Information Theory, 2010, 129-137.
[29] M. E. J. Newman, "Modularity and Community Structure in Networks," in Proc. National Academy of Science, 2006, pp. 8577-8585.
[30] E. Gansner and Y. Hu, "Visualizing graphs and clusters as maps," in IEEE Computer Graphics and Application, 2010, pp. 54-66.
[31] E. Gansner and Y. Hu, "Putting Recommendations on the Map-visualizing clusters and relations," in Proceedings of Recommender Systems, 2009.
[32] Amazon Mechanical Turk Requester, Amazon Digital Services, Seattle Wsh., 2012
[33] P. Ipeirotis, "Demographics of Mechanical Turk," MIT CeDAR Group, Mass., 2010.
[34] P. Ipeirotis, "Analyzing the Amazon Mechanical Turk Market Place," in Crossroads for Arts and Sciences, 2010, pp. 16-21.
[35] J. A. Jacobie, G. D. Linden, "The Distance-similarity metaphor in region display specialization," U.S. Patent 7 113 917 B2, 2006
[36] M. Gronemann, and M. Jaijnger, "Drawing clustered graphs as topographic maps," in International Symposium on Graph Drawing," 2012.