Embed Size (px)
Citation preview

TOURISM AND TERRORISM: THE NATIONAL AND
INTERREGIONAL ECONOMIC IMPACTS OF ATTACKS ON
MAJOR U.S. THEME PARKS
By
Harry W. Richardson, Peter Gordon, James E. Moore II, Soojung Kim
and Jiyoung Park, University of Southern California, and Qisheng Pan,
Texas Southern University
August 2005
1. Introduction
This paper is one of a series of studies by our group on the economic
impact of a variety of terrorist attacks in the United States. These studies use
either or both of two economic impact models, SCPM (the Southern
California Planning Model) and NIEMO (the National Interstate Economic
Model). This research uses only the latter model and traces the interregional
economic effects of attacks on major theme parks (13, including two clusters)
located in a modest number of States (eight). The theme parks are identified
by State but not by metropolitan area to mask specific identity. It is important
to note that our results are underestimates because our analysis, by focusing
on the major theme parks, ignores some of the smaller parks. We have also
omitted one park that would have passed the scale threshold. We left it out
because the theme park was a relatively minor component of economic
activities at the site.
1

2. NIEMO
The details of the model used in this analysis (NIEMO) are explained
in a parallel paper (Park et al., 2005) so only a brief description is offered
here, just enough for the paper to stand independently. The model revives an
approach adopted in the late 1970s and the early 1980s (Polenske, 1980; Jack
Faucett Associates, 1983), the development of a MRIO (multiregional input-
output) model. Our version combines State level data from the IMPLAN
input-output models with interregional trade flows based on the Commodity
Flow Survey (CFS) aggregated to 47 economic sectors over 52 regions (50
States, Washington, D.C., and the “Rest of the World”). This results in an
MRIO matrix with almost 6 million cells. Construction of the model involved
substantial data assembly and considerable data manipulation.
More recently, there have been two attempts to estimate interregional
trade flows using data from the 1997 Commodity Flow Survey (CFS).
Jackson et al. (2004) used IMPLAN data to adjust incomplete CFS
information primarily by adopting gravity models constrained via distance.
The second attempt (Park et al., 2005) is the foundation of this study. It uses
the same basic data sources, but adopts a different estimation approach to
update missing CFS data and a doubly-constrained Fratar model (DFM) to
estimate the MRIO matrix.
Constructing NIEMO requires two basic kinds of tables: industrial
trade coefficients tables and regional interindustry coefficients tables. While
trade tables by industry are difficult to construct because of incomplete
information in the CFS data, the interindustry tables present fewer problems
because reliable data are available from IMPLAN at the state and industry
levels. For details of the procedure used to estimate values for the empty cells
in the trade flow matrix, see Park et al. (2005). A temporary problem is that
2

the currently available 1997 CFS data had to be updated to match the 2001
IMPLAN data. In the near future, the 2002 CFS data will be available
permitting a direct match with 2002 IMPLAN data, although because of
sample size there are questions about the adequacy of the new data. Once
initial trade flow matrices are estimated for sectors based on a reconciliation
of CFS, IMPLAN and SCPM data), these can then be iteratively refined via a
Fratar model. However, the conventional Fratar model cannot estimate the
diagonal (intrastate flow) values, so NIEMO incorporates a DFM (doubly-
constrained Fratar Model) to supplement the off-diagonal flow estimates from
the standard Fratar model, providing consistent estimates for on- and off-
diagonal values.
Direct and Indirect but not Induced Impacts
Usually, input-output models measure the direct (final demand),
indirect (intermediate input flows) and induced (secondary consumption
associated with direct and indirect employment) effects of changes in
economic activity. In applying NIEMO we have chosen to measure the direct
and indirect impacts only, for several reasons. First, it is a convention in
MRIO to ignore induced effects (Miller and Blair, 1985), presumably because
induced consumption is less likely to cross interregional, e.g. interstate,
boundaries. Second, although there are local induced impacts associated with
local indirect effects, the local and the imported indirect impacts are typically
allocated in a MRIO model via some assumption that falls short of the
accurate allocations of the “ideal” interregional input-output model. For
example, imported inputs of an origin sector are allocated to a particular
destination sector in the same proportion as local inputs. Third, in the
specifics of the theme park application, there may be positive induced effects
in origin States associated with negative direct effects in theme park States. In
3

other words, if would-be visitors to the theme parks stay home they may
spend some of their tourist money on additional consumption. This is not a
conventional induced impact of the kind measured in input-output models
because it is not a secondary consumption effect resulting from employment
change. For these reasons, we chose not to measure induced impacts, even if
the net effect is to generate under-bounded estimates.
The direct impacts in this research are not limited to theme park
expenditures. Overnight visitors to theme parks spend money on
accommodation and often on transportation (such as rental cars), and all
visitors buy food and often shop. Our estimates include these expenditures
(see Appendix Table 15 for the allocation of sectors). However, we do not
include air transportation because of the difficulty of assigning impacts to
individual States because most have major operations in several States, not
merely the headquarters State. However, the maximum impact would be
sizeable, about $11.85 billion over the eighteen-month recovery period
assumed in our base scenario.
Terrorism and Tourism
Because there has never been a major terrorist attack on any tourist site in
the United States. The attack of domestic origin by Eric Rudolph in
Centennial Park, Atlanta, during the 1996 Olympic Games is the closest
approximation. Consequently, we have no history on which to construct
feasible scenarios. We have chosen to analyse a relatively simple type of
attack: a large conventional bomb attack at a major theme park. Our focus is
on economic impacts, so we do not explore the potential deaths and injuries
and damage to tourist facilities and infrastructure. The scale of attack that we
have in mind might kill about twenty people, injure ten times as many, and
destroy sufficient tourist attractions and facilities to close at least part of a
4

theme park for a few months during reconstruction, and the park overall for
perhaps the first month. Our best estimate is that in terms of human and
infrastructure impacts, this would be a $250 million event, and thus relatively
small in terms of potential terrorist events. In any event, our analysis is
restricted to economic impacts, specifically business interruption. We leave it
to others to estimate the human and physical infrastructure costs of terrorist
events. In our view, the human and infrastructure costs would be swamped by
the long-term blow to the theme park component of the tourist sector as
visitors stayed away in droves out of fear. A major research task is to estimate
the recovery period. We discuss this important but difficult task below.
Another key point is that the economic losses we report in our main
findings would be gross not net losses. However, this may be based on an
unreasonable assumption because tourists would not necessarily stay at home
but would substitute other, presumably safer, destinations, or alternatively
(not examined here) spend vacation savings on other expenditures. To capture
the possibility of diversion, we explore one scenario that is not meant to be
very realistic, merely illustrative. We assume that all the daily visitors to the
theme parks stay home while the overnighters substitute visits to national
parks, broadly defined to include some national monuments, national
historical parks and national resort areas. In this scenario, then, there are net
losses but also some redistribution of tourist revenues from some locations
and sites to others, often in different States.
Drakos and Kutan (2003) hypothesize a “zero sum game” in which total
tourist revenues remain the same, but tourists switch from destinations
affected by terrorism to others that are currently considered safe. Their study
looked at tourism in Greece, Turkey and Israel, with Italy included as a
control destination not affected by terrorism in recent years. A terrorist
5

incident in Greece was estimated to reduce the country’s market share among
the four destinations by one per cent. Specifically, in our substitution
scenario, we assume that the 55 percent of total visitors who are daytrippers
to the theme parks stay home while the 45 percent of overnight visitors to
theme parks are allocated to a fairly comprehensive group of national parks
and similar nationally designated destinations. These shifts are allocated in
proportion to the national parks’ most recent visitor rolls.
We explore a range of alternative attacks, not simultaneous attacks. In
this paper, we are not identifying specific theme parks, but are looking at
some of the major theme parks distributed across eight states. Also, in a few
cases several theme parks are located in the same metropolitan region; we
refer to these as “clusters.” We hypothesize that an attack at one theme park
in a cluster will have more of an impact on other theme parks in the cluster
than on theme parks outside the cluster, e.g. in other States. Our rationale for
studying several attacks in several States is to illustrate the capacity of our
national interstate model (NIEMO) to trace multiregional economic impacts
from any source of changes in final demand.
Our expectation is that the theme park sector of U.S. tourism would
take a long time to recover from a terrorist attack on a single theme park, and
that the economic impacts would be nationwide in scope. There are several
reasons for this view. One is the role played by theme parks in shaping the
American psyche. Another is our focus on protecting children who form a
sizeable share, perhaps the majority, of theme park visitors. A third is the
concept of “probability neglect.” This concept means that for psychological
reasons we may suffer from fear that exaggerates risk and discounted harm,
because this fear fails to take sufficient account of the low probability of
being a victim. The same phenomenon explained some of the downward trend
6

in air travel after 9/11. A fourth reason is the power of the “displacement
effect.” There are so many tourist substitutions available that it is easy to
cancel (or postpone) a theme park trip and go somewhere else. We explore
the national parks case that we justify in terms of the argument that lower
densities reduce risk, but there is a wide range of alternatives to theme park
visits such as a beach holiday, a motoring holiday, a foreign trip, and many
others.
International Evidence
In the absence of prior episodes in the United States, we decided to
look at the evidence from international terrorist attacks on tourist sites.
However, the previous literature on tourism recovery from terrorism is
relatively thin. Drakos and Kutan (2001) present evidence for a relatively
short time period (1996-99) on the recoveries from tourist attacks in three
countries: seven months in Greece and Turkey and four months in Israel. The
shorter time period in Israel probably reflects a degree of immunity and
reduced sensitivity for residents, and even for tourists, associated with the
greater frequency of terrorist events. This raises a more general point:
infrequency combined with a larger attack in the United States might make
for a longer recovery period.
A related point to the scale issue is that what seems to count most in
terms of impact is not the number of incidents but the number of fatalities.
Moreover, the negative relationship between tourist revenues and the number
of fatalities appears to be non-linear. Another approach, adopted by Enders
and Sandler (1991) is to calculate the number of international terrorists
deterred by each terrorist incident. In their study of Spain, they calculated
140,000 tourists deterred by each Basque incident. This results in a second
calculation that in 1988, with 5.392 million foreign tourists visiting Spain and
7

18 terrorist incidents, there would have been 50 percent more tourists without
them. Finally, Frey, Luechinger and Stutzer (2004) surveyed a range of
studies with divergent results, with recovery periods as short as 2-3 months or
as long as 18-21 months.
We decided to use the extreme attacks in Luxor (Egypt) in 1997 and in
Bali (Indonesia) in 2002 as the best predictors of the recovery phase of a
theme park attack in the United States. It is too soon to evaluate the
repercussions of the more recent attacks in Egypt in Taba in October 2004
and Sharma el Sheikh in July 2005, but we expect the recovery period to be
broadly similar. The principal reasons for these choices are the scale of the
attacks and the quality of the data. A monthly data series for international
visitors is available in both cases. Moreover, the results of the two cases are
broadly consistent with each other. In both cases, the number of visitors
declined precipitiously immediately after the attacks and then recovered very
slowly over the next six months. The somewhat different example of the post-
tsunami recovery of Phuket in Thailand after December 2004 is also
consistent with this finding. This was the short-term impact. In the Bali case,
annual tourism did not return to the pre-attack levels until 2004, and monthly
data did not consistently (month after month) exceed the pre-attack levels
until eighteen months after the attack.
Of course, in the absence of a historical record, any scenario is little
better than a hypothetical guess. Nevertheless, it is useful as an illustration,
and the scenario we chose is consistent with the international evidence. The
other key assumption is that if one theme park is attacked attendance will
suffer at all US theme parks.
Our working assumptions are as follows:
8

i. a cluster consisting of several theme parks in the same
Consolidated Metropolitan Statistical Area (CMSA) or Primary
Metropolitan Statistical Area (PMSA) and an individual
(isolated) theme park are treated as equivalents;
ii. a theme park (or cluster) attacked would be closed for one
month, would then operate at 30 percent capacity for the next six
months and approach normal (pre-attack) levels linearly through
to the 18th month;1 and
iii. the major theme parks (our sample) in the country would
operate at 50% of normal capacity for six months and then
recover to normal (pre-attack) levels linearly through to the 18th
month.2
Of course, theme park visits are subject to seasonal fluctuations, e.g.
opening hours change during the year, as is international tourism. For
example, the peak months in Bali are May and June. We chose to ignore this
complication. However, any deviation from our assumptions is easily
accommodated within the model.
1 The calculation is as follows: Let the i month be and theiM j jyear be , where i =1, …, 18 and jY = 1 and 2.
1M =(Raw_Data)/12.
iM = - *0.3= *0.7, where i = 2 ,…, 7. iM iM iMAlso, = - *0.3 - *0.7* iM iM iM iM )7( −i /(18-7) = *0.7*(1- iM )7( −i /11) , where = 8 ,…, 18.
i
Hence, = = [1+0.7*6+0.7*{5-(1+…+5)/11}] and =∑ = *0.7*{6-
(6+…+11)/11}.
∑=
12
1iiM
=
18
13iiM1Y 1M 2Y 1M
2 Similarly to footnote 1, by letting the j year be , = = *0.5[6+0.5*{6-
(1+…+6)/12}] and =∑ = *0.5*{6-(7+…+12)/12}.
∑=
12
1iiM1'Y 1MjY '
=
18
13iiM2'Y 1M
9

Results
We analyzed attacks on 13 theme park complexes in eight States. Two
of the complexes were clusters of several parks within the same metropolitan
region in Florida and California. We designate them Cluster A (FL) and
Cluster B (CA) respectively. Table 1 presents a summary of the results, and
much more detail is given in Appendix Tables 1-13. Recall our assumption
about the spillover effects on other theme parks not under direct attack,
namely that other theme parks in a cluster would suffer the same fate in terms
of impacts as if they were directly attacked. A cluster attack would result in
an economic impact of $21.83 – 23.05 billion. In comparison, the latest
estimate of the cost of the 9/11 attack is $31.7 billion (New York Times, July
10, 2005), although it is unclear whether this estimate reflects the full costs of
business interruption. Outside the clusters in Florida and California, the
impacts would be smaller, in the $19.2 – 19.4 billion range, but still sizeable.
Of course, this result is a consequence of our specific assumptions that an
attack on any major theme park would have nationwide repercussions on all
major theme parks. We report below on the most conservative of
assumptions, i.e. no spillover effects.
The foreign indirect impacts are in the $290-293 million range except
for Florida and California, and $352 million and $329 million in these two
States. Note that there are no foreign direct impacts because the direct impacts
measure the effects on the theme park States. The term “foreign” measures
leakages to the rest of the world outside the United States, and these impacts
are all indirect. Despite the importance of international tourism, the foreign
impacts are quite small but consistent with the two percent estimate of
international visitors at the theme parks.
10

The direct impacts are in the range of $11.82 billion to $14.19 billion
and the indirect impacts fall within a range of $7.37 billion to $8.86 billion.
The Florida and California clusters have somewhat larger impacts, whereas
the impacts of attacks in other States are of similar magnitude.
The No-Spillovers Case
These results are very sensitive to the spillover effect assumptions. We
do not believe that other theme parks in the country would be immune from
the effects of an attack on a theme park in another State, but we can combine
some of the data in Table 1 into another table (Table 2) to demonstrate the
implications if this belief was incorrect. The data here show the results if the
economic impacts are confined to the theme park(s) in the State subject to
attack. This is the limiting case of minimal impacts, and is useful from that
perspective even if not very realistic. As shown in Table 2, the differences are
very dramatic, with impacts varying from less than half a billion dollars in
Virginia up to more than $11.28 billion in the Florida cluster. The economic
multipliers are more or less very similar, in the 1.46 to 1.70 range. Remember
that these may be underestimates because of the exclusion of induced
impacts.
The overall conclusion is that, if there are no spillovers, the terrorist
payoff is maximized by attacking a large theme park or a park in a major
metropolitan area with many theme parks, such as in Florida or California. On
the other hand, if there are significant spillovers, an attack on any known
theme park, even one of modest size with presumably less protection because
the expense risks are lower, will result in similar nationwide economic
impacts. Unfortunately, we do not and will not know which is the more likely
scenario unless it happens.
11

On the other hand, it is a reasonable argument that the spillover
scenarios are more plausible. It is our belief that a successful attack on any
theme park in the country would have national repercussions. The reason is
based on public perception of risks and behavioral adjustments. Given that a
theme park visit is a deferrable event and has many attractive alternative
vacation trip substitutes, why would a rational person not postpone such a
visit by either going elsewhere or staying at home? This behavior is consistent
with the hypothesis of “probability neglect” mentioned above. If valid, any
theme park attack would result in nationwide fear, if not panic, and a
widespread if temporary shunning of all theme parks. Perception also
influences the recovery period. In this research, we have used the Bali (2002)
and the Luxor (1997) attacks as a template for the decline and recovery
trajectory. This is probably conservative, given that an American family with
children considering a visit to a theme park after an attack might react more
cautiously than, say, Australian singles to a holiday in Bali after a bar attack.
A Diversion Scenario: The National Parks
A standard objection to models of the kind used in this research is that,
as noted above, declines in final demand are not necessarily net losses. For
example, the business interruptions and structural damage associated with a
natural disaster, such as an earthquake or a hurricane, are usually offset later
by a revival of pent-up demand and an injection of reconstruction funds.
There are losses involved, such as the opportunity costs of resources diverted
to reconstruction, but there are offsets to many losses.
So it may be in this case. A decline in visitors to theme parks after a
terrorist attack is likely to be partially offset by an increase in other,
presumably considered safer, types of tourist activities. It is not reasonable to
expect everyone to stay home. Thus, part of the change in the tourist scene
12

will be a redistribution of tourist expenditures rather than a total loss. To
illustrate this effect, we consider a single substitution scenario to measure the
potential offset. Theme park visitors are divided into two categories:
daytrippers (55 percent) and overnighters (45 percent). We assume that the
daytrippers stay home. An alternative would be for them to spend the money
saved on other items of consumer expenditure. We divert the overnighters to
other tourist activities. In the example explored here, we assume –somewhat
unrealistically – that they all go to national parks and similar nationally
designated destinations. The diversion impacts by State and sector are shown
in Appendix Table 14, the classification of sectors is shown in Appendix
Table 15, and the total list of national parks and facilities from which the
sample is drawn is given in Appendix Table 16. The results of this scenario
are reported in Table 3.
We consider the maximum impact case, an attack on a theme park in
Cluster A (Florida), and reallocate all the lost overnight visitors at all theme
parks in the country over the eighteen-month recovery period to the
designated set of national parks and resort areas in proportion to their current
visitor levels. We excluded all parks with less than 0.5 million annual visitors,
national highways and monuments in New York City and Washington, D.C.
The consequences, as shown in Table 3, are a marked geographical
redistribution of tourist expenditures and their impacts because theme parks
are typically located in densely populated urban settings while national parks
are usually located in lower-density rural settings. Other substitution
scenarios, such as a shift to beach holidays, would also have marked, but very
different, geographical impacts, perhaps less consequential because of the
relatively high concentration of both theme parks and beaches in Florida and
California.
13

More specifically, the big losers are Florida ($10.59 billion) and
California ($4.67 billion), with Ohio a distant third ($0.73 billion). Although
California, and to a lesser extent Florida, are well endowed with national park
related facilities, their potential positive economic impacts are swamped by
losses associated with theme parks. The top gainers are Arizona ($0.72
billion), Utah ($0.63 billion), New York ($0.57 billion), North Carolina
($0.55 billion), Massachusetts ($0.53 billion) and Wyoming ($0.42 billion).
At least, one half of these are very low density, sparsely populated states
which presumably would be much safer in terms of the risks of death or
injuries to visitors. Overall, the impacts are well dispersed so that no gainer is
anywhere near the ballpark of the two main losers. Overall, given the
assumptions, the diversion scenario still involves a net loss of $8.29 billion.
The Distribution of Geographical Impacts
One question is the sensitivity of the spatial distribution of indirect
impacts to the location(s) of the direct impact. To test this, we assumed a
$100 million decline in theme park revenues in each of the nine major theme
park states. Note that for this simple test, we did not include the ripple effects
of revenue losses at theme parks in States other than in the State attacked, so
this analysis is somewhat distinct from the other scenarios discussed in this
paper. The results are displayed in Table 4. They are not surprising. More
than 90 percent of the impacts are intrastate, and the interstate impacts reflect
a significant distance decay effect. In other words, the proportionate indirect
impacts tend to be larger in States that are nearby to the State where the direct
impacts occur.
Conclusions
This study reports on a preliminary analysis of the economic impacts of
terrorist attacks on America’s more prominent theme parks. A key assumption
14

of the research is that in the public’s psyche, an attack on one theme park will
be perceived as an attack on all. However, we also report results of a more
conservative assumption, specifically that of a “no spillover” effect. We also
recognize that even a major terrorist attack on a theme park will not ruin
American vacation habits. Vacationers will probably switch to holidays
considered safer. We examine one scenario: substituting visits to national
parks, and their low-density environments, for theme parks.
The results can be easily summarized. In the spillover cases, even an
attack on a moderately sized theme park will result in more than a $19 billion
hit to the economy. An attack on a cluster could result in $23 billion of
economic damages. In addition, the loss in airline revenues could run as high
as almost $12 billion. These numbers combined are in the same neighborhood
as the costs of the 9/11 disaster. On the other hand, if the repercussions are
constrained in terms of spillovers, the impact could be as low as $500 million
or as high as $11.3 billion, depending upon which theme park was attacked.
In the diversion scenario, i.e. substitution of national parks for theme parks,
there still is an economic loss as some people will stay home, increase their
savings and plan a vacation for the following year. However, there is a
significant offset. Florida and California are net losers, because even though
they have important national parks their economic impacts are modest
compared with their theme parks. The big winners, i.e. in terms of net gains,
are sparsely populated States with rich natural and recreational resources,
such as Arizona, Utah, and Wyoming.
Policy Implications
Because of the scarcity of both Department of Homeland Security and
private sector resources, any study of the economic impact of a terrorist attack
needs to consider the cost effectiveness of the scale and scope of alternative
15

prevention measures. It is somewhat easier to do this with economic impact
analyses because they generate implicit guidelines on how much it is worth to
spend. The economic impact estimates in this study are sizeable, yet are
probably underestimates because of our exclusion of induced impacts and our
focus on only the largest theme parks. They certainly justify significant
expenditures on prevention, probably much more than those (based on
anecdotal evidence) currently in place. The problem is the distribution of
those expenditures among theme parks. In the spillovers scenarios, even the
smaller theme parks are attractive terrorist targets because they are less
protected but may have nationwide economic impacts almost as damaging as
in the case of a cluster attack. If such scenarios are considered more probable,
it may pay DHS to subsidize, or offer other incentives for, prevention
measures in smaller theme parks. In no-spillovers scenarios, the implication is
to focus on the larger theme parks, especially in the clusters. Also, if there is a
case for subsidies in these cases, the provider should be local or State entities
because the externalities will be more local than national. However, we
suspect that, regardless of spillovers or not, the most visible theme parks,
nationally and/or internationally, are the most vulnerable because of their
symbolic value as representatives of American culture.
References
Aly, H.Y. and M.C. Strazicich (2000), “Terrorism and Tourism:
Is the Impact Permanent or Transitory?” Columbus: Ohio State
University, Department of Economics.
Drakos, K. and A. M. Kutan (2003), “Regional Effects of
Terrorism and Tourism in Three Mediterranean Countries,”
Journal of Conflict Resolution, 47(5), 621-641.
16

Enders, W.K. and T. Sandler (1991), “Causality between
Transnational Terrorism and Tourism: The Case of Spain,”
Terrorism, 14:1, 49-58.
Jack Faucett Associates (1983), The Multiregional Input-Output Accounts
1977: Introduction and Summary, Vol. I (Final Report), prepared for the US
Department of Health and Human Services, Washington, D.C.
Frey, B.S., S. Luechinger and A. Stutzer (2004), “Calculating Tragedy:
Assessing the Costs of Terrorism.” Institute of Empirical Research in
Economics, University of Zurich, WP 205.
Gordon, P., J.E. Moore II, H.W. Richardson (2005), “The Economic Impact
of Terrorist Attack on the Twin Ports of Los Angeles-Long Beach,” in H.W.
Richardson, P. Gordon and J.E. Moore II, eds., The Economic Impacts of
Terrorist Attacks. Cheltenham: Edward Elgar.
Miller, R.E. and Shao (1990), Spatial and Sectoral Aggregation in the
Commodity-Industry Multiregional Input-Output Model, Environment and
Planning A 22: 1637-1656.
Park, J., P. Gordon, J.E. Moore II, H.W. Richardson and Q. Pan (2005),
“Simulating the State-by-State Effects of Terrorist Attacks on Three Major
U.S. Ports: Applying NIEMO (National Interstate Economic Model).” Paper
presented at the 2nd CREATE Symposium on the Economic Impacts of
Terrorist Attacks, August 19-20, University of Southern California.
Pizam, A. and G. Smith (2000), “Tourism and Terrorism: A Quantitative
Analysis of Terrorist Attacks and their Impact on Tourist Destinations,”
Tourism Economics, 6(2), 123-138.
Polenske, K.R. (1980), The US Multiregional Input-Output Accounts and
Model, DC Heath, Lexington, MA
17
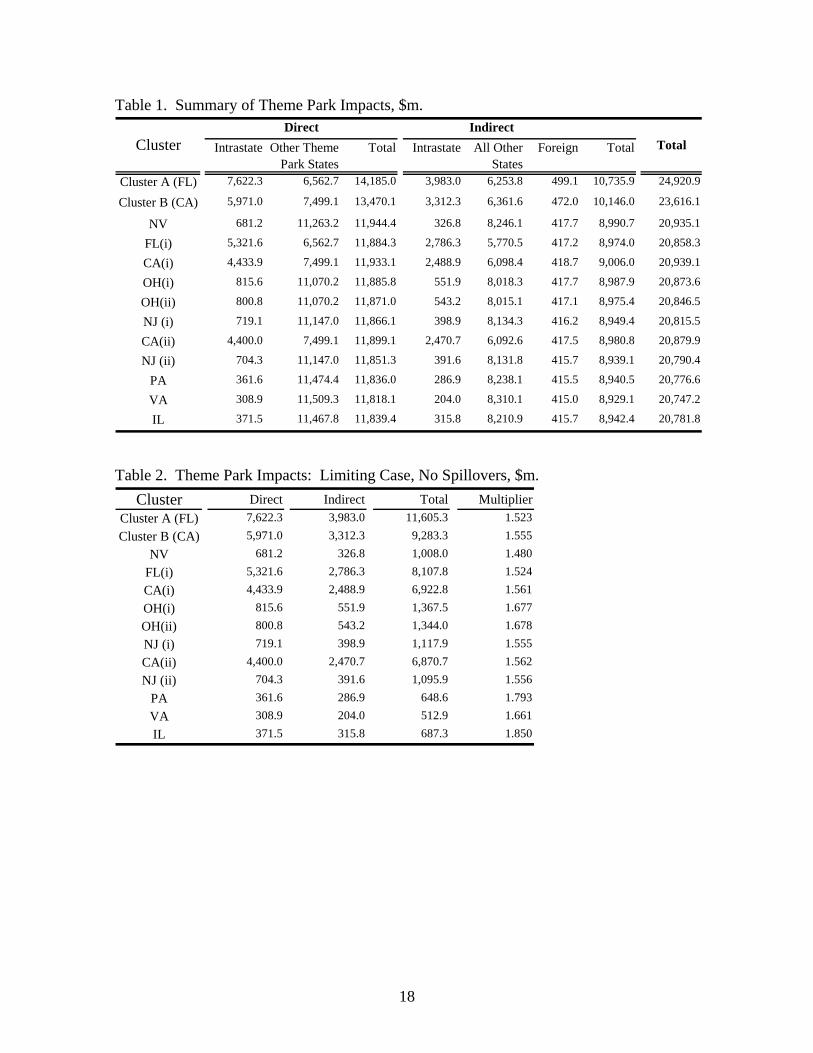
Table 1. Summary of Theme Park Impacts, $m.
Intrastate Other Theme Park States
Total Intrastate All Other States
Foreign Total
Cluster A (FL) 7,622.3 6,562.7 14,185.0 3,983.0 6,253.8 499.1 10,735.9 24,920.9
Cluster B (CA) 5,971.0 7,499.1 13,470.1 3,312.3 6,361.6 472.0 10,146.0 23,616.1
NV 681.2 11,263.2 11,944.4 326.8 8,246.1 417.7 8,990.7 20,935.1
FL(i) 5,321.6 6,562.7 11,884.3 2,786.3 5,770.5 417.2 8,974.0 20,858.3
CA(i) 4,433.9 7,499.1 11,933.1 2,488.9 6,098.4 418.7 9,006.0 20,939.1
OH(i) 815.6 11,070.2 11,885.8 551.9 8,018.3 417.7 8,987.9 20,873.6
OH(ii) 800.8 11,070.2 11,871.0 543.2 8,015.1 417.1 8,975.4 20,846.5
NJ (i) 719.1 11,147.0 11,866.1 398.9 8,134.3 416.2 8,949.4 20,815.5
CA(ii) 4,400.0 7,499.1 11,899.1 2,470.7 6,092.6 417.5 8,980.8 20,879.9
NJ (ii) 704.3 11,147.0 11,851.3 391.6 8,131.8 415.7 8,939.1 20,790.4
PA 361.6 11,474.4 11,836.0 286.9 8,238.1 415.5 8,940.5 20,776.6
VA 308.9 11,509.3 11,818.1 204.0 8,310.1 415.0 8,929.1 20,747.2
IL 371.5 11,467.8 11,839.4 315.8 8,210.9 415.7 8,942.4 20,781.8
TotalDirect Indirect
Cluster
Table 2. Theme Park Impacts: Limiting Case, No Spillovers, $m. Cluster Direct Indirect Total Multiplier
Cluster A (FL) 7,622.3 3,983.0 11,605.3 1.523 Cluster B (CA) 5,971.0 3,312.3 9,283.3 1.555
NV 681.2 326.8 1,008.0 1.480 FL(i) 5,321.6 2,786.3 8,107.8 1.524 CA(i) 4,433.9 2,488.9 6,922.8 1.561 OH(i) 815.6 551.9 1,367.5 1.677 OH(ii) 800.8 543.2 1,344.0 1.678 NJ (i) 719.1 398.9 1,117.9 1.555 CA(ii) 4,400.0 2,470.7 6,870.7 1.562 NJ (ii) 704.3 391.6 1,095.9 1.556
PA 361.6 286.9 648.6 1.793 VA 308.9 204.0 512.9 1.661 IL 371.5 315.8 687.3 1.850
18
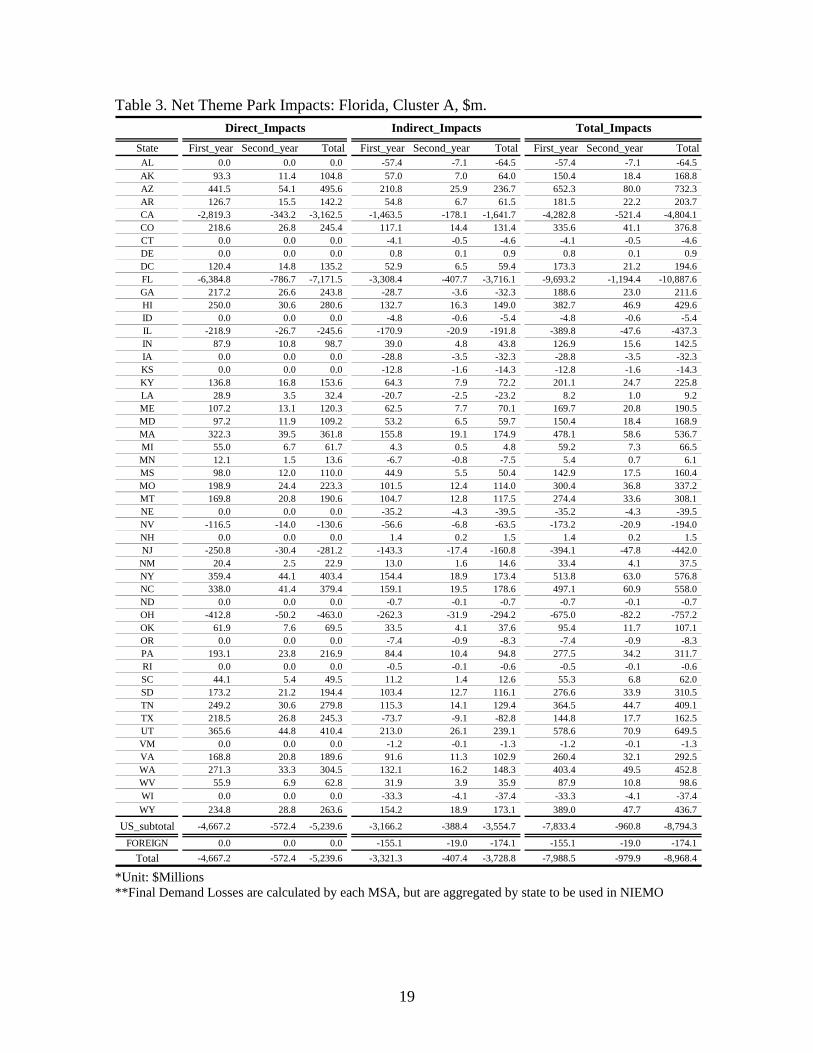
Table 3. Net Theme Park Impacts: Florida, Cluster A, $m.
State First_year Second_year Total First_year Second_year Total First_year Second_year TotalAL 0.0 0.0 0.0 -57.4 -7.1 -64.5 -57.4 -7.1 -64.5AK 93.3 11.4 104.8 57.0 7.0 64.0 150.4 18.4 168.8AZ 441.5 54.1 495.6 210.8 25.9 236.7 652.3 80.0 732.3AR 126.7 15.5 142.2 54.8 6.7 61.5 181.5 22.2 203.7CA -2,819.3 -343.2 -3,162.5 -1,463.5 -178.1 -1,641.7 -4,282.8 -521.4 -4,804.1CO 218.6 26.8 245.4 117.1 14.4 131.4 335.6 41.1 376.8CT 0.0 0.0 0.0 -4.1 -0.5 -4.6 -4.1 -0.5 -4.6DE 0.0 0.0 0.0 0.8 0.1 0.9 0.8 0.1 0.9DC 120.4 14.8 135.2 52.9 6.5 59.4 173.3 21.2 194.6FL -6,384.8 -786.7 -7,171.5 -3,308.4 -407.7 -3,716.1 -9,693.2 -1,194.4 -10,887.6GA 217.2 26.6 243.8 -28.7 -3.6 -32.3 188.6 23.0 211.6HI 250.0 30.6 280.6 132.7 16.3 149.0 382.7 46.9 429.6ID 0.0 0.0 0.0 -4.8 -0.6 -5.4 -4.8 -0.6 -5.4IL -218.9 -26.7 -245.6 -170.9 -20.9 -191.8 -389.8 -47.6 -437.3IN 87.9 10.8 98.7 39.0 4.8 43.8 126.9 15.6 142.5IA 0.0 0.0 0.0 -28.8 -3.5 -32.3 -28.8 -3.5 -32.3KS 0.0 0.0 0.0 -12.8 -1.6 -14.3 -12.8 -1.6 -14.3KY 136.8 16.8 153.6 64.3 7.9 72.2 201.1 24.7 225.8LA 28.9 3.5 32.4 -20.7 -2.5 -23.2 8.2 1.0 9.2ME 107.2 13.1 120.3 62.5 7.7 70.1 169.7 20.8 190.5MD 97.2 11.9 109.2 53.2 6.5 59.7 150.4 18.4 168.9MA 322.3 39.5 361.8 155.8 19.1 174.9 478.1 58.6 536.7MI 55.0 6.7 61.7 4.3 0.5 4.8 59.2 7.3 66.5MN 12.1 1.5 13.6 -6.7 -0.8 -7.5 5.4 0.7 6.1MS 98.0 12.0 110.0 44.9 5.5 50.4 142.9 17.5 160.4MO 198.9 24.4 223.3 101.5 12.4 114.0 300.4 36.8 337.2MT 169.8 20.8 190.6 104.7 12.8 117.5 274.4 33.6 308.1NE 0.0 0.0 0.0 -35.2 -4.3 -39.5 -35.2 -4.3 -39.5NV -116.5 -14.0 -130.6 -56.6 -6.8 -63.5 -173.2 -20.9 -194.0NH 0.0 0.0 0.0 1.4 0.2 1.5 1.4 0.2 1.5NJ -250.8 -30.4 -281.2 -143.3 -17.4 -160.8 -394.1 -47.8 -442.0
NM 20.4 2.5 22.9 13.0 1.6 14.6 33.4 4.1 37.5NY 359.4 44.1 403.4 154.4 18.9 173.4 513.8 63.0 576.8NC 338.0 41.4 379.4 159.1 19.5 178.6 497.1 60.9 558.0ND 0.0 0.0 0.0 -0.7 -0.1 -0.7 -0.7 -0.1 -0.7OH -412.8 -50.2 -463.0 -262.3 -31.9 -294.2 -675.0 -82.2 -757.2OK 61.9 7.6 69.5 33.5 4.1 37.6 95.4 11.7 107.1OR 0.0 0.0 0.0 -7.4 -0.9 -8.3 -7.4 -0.9 -8.3PA 193.1 23.8 216.9 84.4 10.4 94.8 277.5 34.2 311.7RI 0.0 0.0 0.0 -0.5 -0.1 -0.6 -0.5 -0.1 -0.6SC 44.1 5.4 49.5 11.2 1.4 12.6 55.3 6.8 62.0SD 173.2 21.2 194.4 103.4 12.7 116.1 276.6 33.9 310.5TN 249.2 30.6 279.8 115.3 14.1 129.4 364.5 44.7 409.1TX 218.5 26.8 245.3 -73.7 -9.1 -82.8 144.8 17.7 162.5UT 365.6 44.8 410.4 213.0 26.1 239.1 578.6 70.9 649.5VM 0.0 0.0 0.0 -1.2 -0.1 -1.3 -1.2 -0.1 -1.3VA 168.8 20.8 189.6 91.6 11.3 102.9 260.4 32.1 292.5WA 271.3 33.3 304.5 132.1 16.2 148.3 403.4 49.5 452.8WV 55.9 6.9 62.8 31.9 3.9 35.9 87.9 10.8 98.6WI 0.0 0.0 0.0 -33.3 -4.1 -37.4 -33.3 -4.1 -37.4WY 234.8 28.8 263.6 154.2 18.9 173.1 389.0 47.7 436.7
US_subtotal -4,667.2 -572.4 -5,239.6 -3,166.2 -388.4 -3,554.7 -7,833.4 -960.8 -8,794.3
FOREIGN 0.0 0.0 0.0 -155.1 -19.0 -174.1 -155.1 -19.0 -174.1Total -4,667.2 -572.4 -5,239.6 -3,321.3 -407.4 -3,728.8 -7,988.5 -979.9 -8,968.4
Direct_Impacts Indirect_Impacts Total_Impacts
*Unit: $Millions **Final Demand Losses are calculated by each MSA, but are aggregated by state to be used in NIEMO
19

Table 4. Interstate Impacts of a $100m. Direct Loss in Theme Park States, $m.
State CA % FL % IL % NV % NJ % OH % PA % VA %AL 0.26 0.1% 1.00 0.6% 0.31 0.2% 0.11 0.1% 0.29 0.2% 0.58 0.3% 0.18 0.1% 0.25 0.1%AK 0.08 0.0% 0.02 0.0% 0.02 0.0% 0.02 0.0% 0.01 0.0% 0.05 0.0% 0.01 0.0% 0.06 0.0%AZ 0.44 0.3% 0.10 0.1% 0.08 0.0% 0.21 0.1% 0.05 0.0% 0.07 0.0% 0.07 0.0% 0.08 0.0%AR 0.44 0.3% 0.46 0.3% 0.43 0.2% 0.13 0.1% 0.16 0.1% 0.50 0.3% 0.40 0.2% 0.21 0.1%CA 153.51 88.2% 1.28 0.7% 1.51 0.8% 5.27 3.2% 1.18 0.7% 1.25 0.7% 1.17 0.7% 0.91 0.5%CO 0.34 0.2% 0.18 0.1% 0.60 0.3% 0.11 0.1% 0.14 0.1% 0.28 0.2% 0.14 0.1% 0.22 0.1%CT 0.09 0.0% 0.15 0.1% 0.10 0.1% 0.09 0.1% 0.21 0.1% 0.11 0.1% 0.18 0.1% 0.15 0.1%DE 0.04 0.0% 0.04 0.0% 0.03 0.0% 0.01 0.0% 0.18 0.1% 0.04 0.0% 0.14 0.1% 0.62 0.3%DC 0.01 0.0% 0.01 0.0% 0.01 0.0% 0.01 0.0% 0.01 0.0% 0.01 0.0% 0.01 0.0% 0.05 0.0%FL 0.24 0.1% 152.00 86.2% 0.24 0.1% 0.16 0.1% 0.34 0.2% 0.49 0.3% 0.36 0.2% 0.35 0.2%GA 0.24 0.1% 2.46 1.4% 0.40 0.2% 0.14 0.1% 0.61 0.4% 0.67 0.4% 0.56 0.3% 0.79 0.4%HI 0.11 0.1% 0.03 0.0% 0.04 0.0% 0.02 0.0% 0.02 0.0% 0.03 0.0% 0.02 0.0% 0.04 0.0%ID 0.29 0.2% 0.09 0.1% 0.16 0.1% 0.06 0.0% 0.09 0.1% 0.17 0.1% 0.08 0.0% 0.06 0.0%IL 0.87 0.5% 1.02 0.6% 155.75 87.2% 0.30 0.2% 0.64 0.4% 1.48 0.8% 0.87 0.5% 0.73 0.4%IN 0.35 0.2% 0.39 0.2% 0.99 0.6% 0.19 0.1% 0.30 0.2% 1.03 0.6% 0.36 0.2% 0.69 0.4%IA 0.78 0.5% 0.41 0.2% 1.42 0.8% 0.14 0.1% 0.37 0.2% 0.63 0.3% 0.38 0.2% 0.31 0.2%KS 0.56 0.3% 0.18 0.1% 0.51 0.3% 0.15 0.1% 0.80 0.5% 0.52 0.3% 0.15 0.1% 0.60 0.3%KY 0.20 0.1% 0.35 0.2% 0.46 0.3% 0.11 0.1% 0.18 0.1% 0.96 0.5% 0.31 0.2% 0.65 0.4%LA 0.55 0.3% 0.71 0.4% 0.47 0.3% 0.19 0.1% 0.17 0.1% 0.26 0.1% 0.24 0.1% 0.28 0.2%ME 0.08 0.0% 0.06 0.0% 0.08 0.0% 0.02 0.0% 0.06 0.0% 0.05 0.0% 0.12 0.1% 0.07 0.0%MD 0.07 0.0% 0.08 0.0% 0.10 0.1% 0.05 0.0% 0.29 0.2% 0.10 0.1% 0.44 0.2% 1.21 0.7%MA 0.14 0.1% 0.21 0.1% 0.15 0.1% 0.11 0.1% 0.26 0.2% 0.18 0.1% 0.21 0.1% 0.24 0.1%MI 0.45 0.3% 0.56 0.3% 0.71 0.4% 0.31 0.2% 0.57 0.3% 1.68 0.9% 0.57 0.3% 0.80 0.4%MN 0.55 0.3% 0.32 0.2% 0.90 0.5% 0.17 0.1% 0.32 0.2% 0.72 0.4% 0.39 0.2% 0.28 0.2%MS 0.15 0.1% 0.34 0.2% 0.24 0.1% 0.06 0.0% 0.13 0.1% 0.23 0.1% 0.16 0.1% 0.16 0.1%MO 0.39 0.2% 0.30 0.2% 0.73 0.4% 0.74 0.5% 0.40 0.2% 0.36 0.2% 0.34 0.2% 0.29 0.2%MT 0.17 0.1% 0.03 0.0% 0.21 0.1% 0.03 0.0% 0.03 0.0% 0.04 0.0% 0.04 0.0% 0.02 0.0%NE 0.68 0.4% 0.53 0.3% 0.55 0.3% 0.09 0.1% 0.27 0.2% 0.55 0.3% 0.54 0.3% 0.27 0.1%NV 0.13 0.1% 0.03 0.0% 0.02 0.0% 146.93 89.7% 0.02 0.0% 0.03 0.0% 0.02 0.0% 0.02 0.0%NH 0.05 0.0% 0.04 0.0% 0.04 0.0% 0.03 0.0% 0.03 0.0% 0.04 0.0% 0.06 0.0% 0.06 0.0%NJ 0.31 0.2% 0.46 0.3% 0.41 0.2% 0.14 0.1% 149.39 88.2% 0.36 0.2% 0.70 0.4% 0.40 0.2%NM 0.06 0.0% 0.07 0.0% 0.07 0.0% 0.04 0.0% 0.04 0.0% 0.08 0.0% 0.05 0.0% 0.03 0.0%NY 0.42 0.2% 0.50 0.3% 0.49 0.3% 0.20 0.1% 1.54 0.9% 0.79 0.4% 1.57 0.9% 0.65 0.4%NC 0.26 0.1% 0.77 0.4% 0.28 0.2% 0.13 0.1% 0.44 0.3% 0.60 0.3% 0.61 0.3% 2.11 1.2%ND 0.10 0.1% 0.05 0.0% 0.17 0.1% 0.06 0.0% 0.06 0.0% 0.12 0.1% 0.11 0.1% 0.04 0.0%OH 0.53 0.3% 0.71 0.4% 0.85 0.5% 0.54 0.3% 0.66 0.4% 158.75 86.4% 1.12 0.6% 0.86 0.5%OK 0.31 0.2% 0.22 0.1% 0.21 0.1% 0.13 0.1% 0.16 0.1% 0.19 0.1% 0.14 0.1% 0.15 0.1%OR 0.48 0.3% 0.12 0.1% 0.20 0.1% 0.18 0.1% 0.09 0.1% 0.20 0.1% 0.08 0.0% 0.10 0.1%PA 0.47 0.3% 0.65 0.4% 0.59 0.3% 0.34 0.2% 1.86 1.1% 1.24 0.7% 157.60 87.9% 1.56 0.9%RI 0.03 0.0% 0.05 0.0% 0.02 0.0% 0.03 0.0% 0.04 0.0% 0.05 0.0% 0.04 0.0% 0.04 0.0%SC 0.11 0.1% 0.37 0.2% 0.14 0.1% 0.07 0.0% 0.12 0.1% 0.28 0.2% 0.20 0.1% 0.37 0.2%SD 0.18 0.1% 0.07 0.0% 0.20 0.1% 0.04 0.0% 0.06 0.0% 0.22 0.1% 0.13 0.1% 0.07 0.0%TN 0.29 0.2% 0.53 0.3% 0.30 0.2% 0.16 0.1% 0.38 0.2% 0.48 0.3% 0.39 0.2% 0.85 0.5%TX 2.52 1.4% 3.50 2.0% 0.94 0.5% 2.01 1.2% 1.95 1.1% 0.99 0.5% 2.50 1.4% 1.21 0.7%UT 0.29 0.2% 0.11 0.1% 0.08 0.0% 0.19 0.1% 0.04 0.0% 0.09 0.1% 0.07 0.0% 0.06 0.0%VM 0.03 0.0% 0.04 0.0% 0.05 0.0% 0.01 0.0% 0.04 0.0% 0.03 0.0% 0.06 0.0% 0.03 0.0%VA 0.13 0.1% 0.27 0.2% 0.30 0.2% 0.09 0.1% 0.27 0.2% 0.36 0.2% 0.47 0.3% 157.67 86.7%WA 0.93 0.5% 0.25 0.1% 0.25 0.1% 0.27 0.2% 0.15 0.1% 0.22 0.1% 0.18 0.1% 0.16 0.1%WV 0.05 0.0% 0.05 0.0% 0.06 0.0% 0.03 0.0% 0.06 0.0% 0.73 0.4% 0.26 0.1% 0.80 0.4%WI 0.70 0.4% 0.63 0.4% 1.97 1.1% 0.26 0.2% 0.58 0.3% 1.00 0.5% 0.85 0.5% 0.50 0.3%WY 0.06 0.0% 0.02 0.0% 0.17 0.1% 0.07 0.0% 0.02 0.0% 0.06 0.0% 0.03 0.0% 0.02 0.0%
US_subtotal 170.51 98.0% 172.85 98.0% 174.99 98.0% 160.97 98.3% 166.09 98.0% 179.95 97.9% 175.67 98.0% 178.20 98.0%
FOREIGN 3.45 2.0% 3.54 2.0% 3.63 2.0% 2.87 1.7% 3.33 2.0% 3.78 2.1% 3.59 2.0% 3.67 2.0%
Total 173.96 100.0% 176.39 100.0% 178.61 100.0% 163.84 100.0% 169.42 100.0% 183.73 100.0% 179.26 100.0% 181.87 100.0%
Total_Impacts
*$100m. are distributed according to sector proportions, which are adopted from the proportions in Cluster B .
20

Appendix Table 1. Theme Park Impacts: Florida, Cluster A, $m.
State First_year Second_year Total First_year Second_year Total First_year Second_year TotalAL 0.0 0.0 0.0 85.1 10.5 95.6 85.1 10.5 95.6 AK 0.0 0.0 0.0 4.8 0.6 5.4 4.8 0.6 5.4 AZ 0.0 0.0 0.0 25.6 3.1 28.7 25.6 3.1 28.7 AR 0.0 0.0 0.0 54.6 6.7 61.3 54.6 6.7 61.3 CA 3,756.2 458.1 4,214.3 2,141.8 261.3 2,403.0 5,897.9 719.4 6,617.3 CO 0.0 0.0 0.0 29.9 3.7 33.6 29.9 3.7 33.6 CT 0.0 0.0 0.0 16.6 2.0 18.6 16.6 2.0 18.6 DE 0.0 0.0 0.0 6.8 0.8 7.6 6.8 0.8 7.6 DC 0.0 0.0 0.0 1.0 0.1 1.1 1.0 0.1 1.1 FL 6,786.3 836.0 7,622.3 3,546.2 436.8 3,983.0 10,332.6 1,272.8 11,605.3 GA 0.0 0.0 0.0 188.6 23.2 211.8 188.6 23.2 211.8 HI 0.0 0.0 0.0 7.1 0.9 8.0 7.1 0.9 8.0 ID 0.0 0.0 0.0 19.6 2.4 22.0 19.6 2.4 22.0 IL 218.9 26.7 245.6 241.4 29.5 270.9 460.3 56.2 516.5 IN 0.0 0.0 0.0 52.6 6.5 59.1 52.6 6.5 59.1 IA 0.0 0.0 0.0 68.3 8.4 76.7 68.3 8.4 76.7 KS 0.0 0.0 0.0 43.8 5.4 49.2 43.8 5.4 49.2 KY 0.0 0.0 0.0 41.0 5.0 46.0 41.0 5.0 46.0 LA 0.0 0.0 0.0 74.8 9.2 84.0 74.8 9.2 84.0 ME 0.0 0.0 0.0 8.4 1.0 9.4 8.4 1.0 9.4 MD 0.0 0.0 0.0 13.7 1.7 15.4 13.7 1.7 15.4 MA 0.0 0.0 0.0 23.7 2.9 26.6 23.7 2.9 26.6 MI 0.0 0.0 0.0 73.3 9.0 82.3 73.3 9.0 82.3 MN 0.0 0.0 0.0 52.6 6.4 59.1 52.6 6.4 59.1 MS 0.0 0.0 0.0 32.6 4.0 36.6 32.6 4.0 36.6 MO 0.0 0.0 0.0 45.3 5.5 50.8 45.3 5.5 50.8 MT 0.0 0.0 0.0 9.5 1.2 10.7 9.5 1.2 10.7 NE 0.0 0.0 0.0 70.1 8.6 78.7 70.1 8.6 78.7 NV 401.3 48.9 450.2 195.4 23.8 219.2 596.6 72.8 669.4 NH 0.0 0.0 0.0 5.1 0.6 5.7 5.1 0.6 5.7 NJ 504.8 61.6 566.4 298.4 36.4 334.8 803.2 98.0 901.2 NM 0.0 0.0 0.0 8.7 1.1 9.8 8.7 1.1 9.8 NY 0.0 0.0 0.0 68.9 8.4 77.3 68.9 8.4 77.3 NC 0.0 0.0 0.0 74.7 9.2 83.8 74.7 9.2 83.8 ND 0.0 0.0 0.0 9.1 1.1 10.2 9.1 1.1 10.2 OH 573.3 69.9 643.2 417.4 51.0 468.3 990.6 120.9 1,111.5 OK 0.0 0.0 0.0 30.5 3.7 34.2 30.5 3.7 34.2 OR 0.0 0.0 0.0 29.3 3.6 32.9 29.3 3.6 32.9 PA 213.0 26.0 239.0 207.1 25.3 232.4 420.2 51.3 471.4 RI 0.0 0.0 0.0 5.4 0.7 6.0 5.4 0.7 6.0 SC 0.0 0.0 0.0 33.1 4.1 37.2 33.1 4.1 37.2 SD 0.0 0.0 0.0 14.3 1.7 16.0 14.3 1.7 16.0 TN 0.0 0.0 0.0 55.7 6.8 62.6 55.7 6.8 62.6 TX 0.0 0.0 0.0 367.4 45.1 412.5 367.4 45.1 412.5 UT 0.0 0.0 0.0 20.5 2.5 23.0 20.5 2.5 23.0 VM 0.0 0.0 0.0 4.7 0.6 5.3 4.7 0.6 5.3 VA 181.9 22.2 204.1 134.0 16.4 150.3 315.9 38.5 354.5 WA 0.0 0.0 0.0 56.9 7.0 63.8 56.9 7.0 63.8 WV 0.0 0.0 0.0 12.2 1.5 13.7 12.2 1.5 13.7 WI 0.0 0.0 0.0 86.4 10.6 97.0 86.4 10.6 97.0 WY 0.0 0.0 0.0 5.1 0.6 5.7 5.1 0.6 5.7
US_subtotal 12,635.7 1,549.3 14,185.0 9,118.7 1,118.1 10,236.8 21,754.4 2,667.4 24,421.8
FOREIGN 0.0 0.0 0.0 444.6 54.5 499.1 444.6 54.5 499.1
Total 12,635.7 1,549.3 14,185.0 9,563.3 1,172.7 10,735.9 22,199.0 2,722.0 24,920.9
Direct_Impacts Indirect_Impacts Total_Impacts
21

Appendix Table 2. Theme Park Impacts: California, Cluster B, $m.
State First_year Second_year Total First_year Second_year Total First_year Second_year TotalAL 0.0 0.0 0.0 66.9 8.2 75.1 66.9 8.2 75.1AK 0.0 0.0 0.0 5.6 0.7 6.3 5.6 0.7 6.3AZ 0.0 0.0 0.0 30.1 3.7 33.8 30.1 3.7 33.8AR 0.0 0.0 0.0 51.3 6.3 57.6 51.3 6.3 57.6CA 5,316.7 654.3 5,971.0 2,949.5 362.9 3,312.3 8,266.1 1,017.2 9,283.3CO 0.0 0.0 0.0 31.3 3.8 35.1 31.3 3.8 35.1CT 0.0 0.0 0.0 14.6 1.8 16.3 14.6 1.8 16.3DE 0.0 0.0 0.0 6.5 0.8 7.3 6.5 0.8 7.3DC 0.0 0.0 0.0 0.9 0.1 1.1 0.9 0.1 1.1FL 4,590.8 559.9 5,150.7 2,407.9 293.7 2,701.6 6,998.8 853.5 7,852.3GA 0.0 0.0 0.0 137.9 16.8 154.7 137.9 16.8 154.7HI 0.0 0.0 0.0 8.2 1.0 9.2 8.2 1.0 9.2ID 0.0 0.0 0.0 22.1 2.7 24.8 22.1 2.7 24.8IL 218.9 26.7 245.6 232.6 28.4 261.0 451.4 55.1 506.5IN 0.0 0.0 0.0 49.4 6.0 55.5 49.4 6.0 55.5IA 0.0 0.0 0.0 71.7 8.8 80.4 71.7 8.8 80.4KS 0.0 0.0 0.0 48.6 6.0 54.5 48.6 6.0 54.5KY 0.0 0.0 0.0 36.5 4.5 40.9 36.5 4.5 40.9LA 0.0 0.0 0.0 67.8 8.3 76.1 67.8 8.3 76.1ME 0.0 0.0 0.0 8.2 1.0 9.2 8.2 1.0 9.2MD 0.0 0.0 0.0 13.1 1.6 14.7 13.1 1.6 14.7MA 0.0 0.0 0.0 21.1 2.6 23.7 21.1 2.6 23.7MI 0.0 0.0 0.0 68.1 8.3 76.4 68.1 8.3 76.4MN 0.0 0.0 0.0 54.3 6.7 60.9 54.3 6.7 60.9MS 0.0 0.0 0.0 27.4 3.3 30.7 27.4 3.3 30.7MO 0.0 0.0 0.0 44.8 5.5 50.3 44.8 5.5 50.3MT 0.0 0.0 0.0 11.6 1.4 13.0 11.6 1.4 13.0NE 0.0 0.0 0.0 69.0 8.5 77.4 69.0 8.5 77.4NV 401.3 48.9 450.2 196.8 24.0 220.8 598.0 72.9 671.0NH 0.0 0.0 0.0 5.0 0.6 5.6 5.0 0.6 5.6NJ 504.8 61.6 566.4 293.1 35.8 328.8 797.9 97.3 895.2NM 0.0 0.0 0.0 8.1 1.0 9.1 8.1 1.0 9.1NY 0.0 0.0 0.0 64.4 7.9 72.2 64.4 7.9 72.2NC 0.0 0.0 0.0 61.6 7.5 69.2 61.6 7.5 69.2ND 0.0 0.0 0.0 9.5 1.2 10.6 9.5 1.2 10.6OH 573.3 69.9 643.2 409.9 50.0 460.0 983.2 119.9 1,103.1OK 0.0 0.0 0.0 30.5 3.7 34.3 30.5 3.7 34.3OR 0.0 0.0 0.0 34.1 4.2 38.3 34.1 4.2 38.3PA 213.0 26.0 239.0 200.0 24.4 224.4 413.1 50.4 463.5RI 0.0 0.0 0.0 4.7 0.6 5.2 4.7 0.6 5.2SC 0.0 0.0 0.0 26.7 3.3 29.9 26.7 3.3 29.9SD 0.0 0.0 0.0 15.4 1.9 17.3 15.4 1.9 17.3TN 0.0 0.0 0.0 48.4 5.9 54.3 48.4 5.9 54.3TX 0.0 0.0 0.0 329.7 40.4 370.1 329.7 40.4 370.1UT 0.0 0.0 0.0 22.7 2.8 25.5 22.7 2.8 25.5VM 0.0 0.0 0.0 4.3 0.5 4.8 4.3 0.5 4.8VA 181.9 22.2 204.1 130.1 15.9 145.9 312.0 38.1 350.1WA 0.0 0.0 0.0 66.0 8.1 74.1 66.0 8.1 74.1WV 0.0 0.0 0.0 11.9 1.5 13.4 11.9 1.5 13.4WI 0.0 0.0 0.0 83.5 10.2 93.7 83.5 10.2 93.7WY 0.0 0.0 0.0 5.5 0.7 6.2 5.5 0.7 6.2
US_subtotal 12,000.7 1,469.4 13,470.1 8,618.7 1,055.3 9,673.9 20,619.4 2,524.7 23,144.1
FOREIGN 0.0 0.0 0.0 420.5 51.5 472.0 420.5 51.5 472.0
Total 12,000.7 1,469.4 13,470.1 9,039.2 1,106.7 10,146.0 21,039.9 2,576.2 23,616.1
Direct_Impacts Indirect_Impacts Total_Impacts
22

Appendix Table 3. Theme Park Impacts: Nevada, $m.
State First_year Second_year Total First_year Second_year Total First_year Second_year TotalAL 0.0 0.0 0.0 63.1 7.7 70.8 63.1 7.7 70.8AK 0.0 0.0 0.0 4.4 0.5 5.0 4.4 0.5 5.0AZ 0.0 0.0 0.0 23.7 2.9 26.6 23.7 2.9 26.6AR 0.0 0.0 0.0 44.7 5.4 50.1 44.7 5.4 50.1CA 3,756.2 458.1 4,214.3 2,124.3 259.1 2,383.4 5,880.5 717.2 6,597.7CO 0.0 0.0 0.0 26.2 3.2 29.3 26.2 3.2 29.3CT 0.0 0.0 0.0 13.4 1.6 15.0 13.4 1.6 15.0DE 0.0 0.0 0.0 6.0 0.7 6.7 6.0 0.7 6.7DC 0.0 0.0 0.0 0.8 0.1 0.9 0.8 0.1 0.9FL 4,590.8 559.9 5,150.7 2,404.5 293.2 2,697.8 6,995.3 853.1 7,848.4GA 0.0 0.0 0.0 134.4 16.4 150.8 134.4 16.4 150.8HI 0.0 0.0 0.0 6.4 0.8 7.2 6.4 0.8 7.2ID 0.0 0.0 0.0 17.7 2.2 19.8 17.7 2.2 19.8IL 218.9 26.7 245.6 219.4 26.8 246.2 438.3 53.5 491.7IN 0.0 0.0 0.0 44.3 5.4 49.7 44.3 5.4 49.7IA 0.0 0.0 0.0 59.6 7.3 66.8 59.6 7.3 66.8KS 0.0 0.0 0.0 40.1 4.9 45.0 40.1 4.9 45.0KY 0.0 0.0 0.0 33.6 4.1 37.6 33.6 4.1 37.6LA 0.0 0.0 0.0 59.4 7.3 66.7 59.4 7.3 66.7ME 0.0 0.0 0.0 7.0 0.9 7.9 7.0 0.9 7.9MD 0.0 0.0 0.0 12.1 1.5 13.6 12.1 1.5 13.6MA 0.0 0.0 0.0 19.2 2.3 21.5 19.2 2.3 21.5MI 0.0 0.0 0.0 61.6 7.5 69.1 61.6 7.5 69.1MN 0.0 0.0 0.0 45.9 5.6 51.5 45.9 5.6 51.5MS 0.0 0.0 0.0 25.1 3.1 28.2 25.1 3.1 28.2MO 0.0 0.0 0.0 40.2 4.9 45.1 40.2 4.9 45.1MT 0.0 0.0 0.0 9.0 1.1 10.1 9.0 1.1 10.1NE 0.0 0.0 0.0 58.5 7.1 65.6 58.5 7.1 65.6NV 606.4 74.7 681.2 291.0 35.9 326.8 897.4 110.6 1,008.0NH 0.0 0.0 0.0 4.3 0.5 4.8 4.3 0.5 4.8NJ 504.8 61.6 566.4 288.5 35.2 323.7 793.4 96.8 890.1NM 0.0 0.0 0.0 7.1 0.9 8.0 7.1 0.9 8.0NY 0.0 0.0 0.0 58.2 7.1 65.3 58.2 7.1 65.3NC 0.0 0.0 0.0 57.8 7.1 64.9 57.8 7.1 64.9ND 0.0 0.0 0.0 8.1 1.0 9.1 8.1 1.0 9.1OH 573.3 69.9 643.2 402.7 49.1 451.8 976.0 119.0 1,095.0OK 0.0 0.0 0.0 25.9 3.2 29.0 25.9 3.2 29.0OR 0.0 0.0 0.0 27.0 3.3 30.3 27.0 3.3 30.3PA 213.0 26.0 239.0 193.4 23.6 217.0 406.5 49.6 456.0RI 0.0 0.0 0.0 4.3 0.5 4.8 4.3 0.5 4.8SC 0.0 0.0 0.0 25.1 3.1 28.2 25.1 3.1 28.2SD 0.0 0.0 0.0 12.7 1.6 14.3 12.7 1.6 14.3TN 0.0 0.0 0.0 44.2 5.4 49.6 44.2 5.4 49.6TX 0.0 0.0 0.0 294.3 35.9 330.2 294.3 35.9 330.2UT 0.0 0.0 0.0 18.5 2.3 20.7 18.5 2.3 20.7VM 0.0 0.0 0.0 3.8 0.5 4.3 3.8 0.5 4.3VA 181.9 22.2 204.1 128.2 15.6 143.8 310.1 37.8 347.9WA 0.0 0.0 0.0 51.9 6.3 58.2 51.9 6.3 58.2WV 0.0 0.0 0.0 11.2 1.4 12.5 11.2 1.4 12.5WI 0.0 0.0 0.0 73.0 8.9 81.9 73.0 8.9 81.9WY 0.0 0.0 0.0 4.7 0.6 5.3 4.7 0.6 5.3
US_subtotal 10,645.4 1,299.0 11,944.4 7,640.7 932.3 8,572.9 18,286.1 2,231.3 20,517.3
FOREIGN 0.0 0.0 0.0 372.3 45.4 417.7 372.3 45.4 417.7
Total 10,645.4 1,299.0 11,944.4 8,013.0 977.7 8,990.7 18,658.4 2,276.7 20,935.1
Direct_Impacts Indirect_Impacts Total_Impacts
23

Appendix Table 4. Theme Park Impacts: Florida (i), $m.
State First_year Second_year Total First_year Second_year Total First_year Second_year TotalAL 0.0 0.0 0.0 64.4 7.9 72.3 64.4 7.9 72.3AK 0.0 0.0 0.0 4.4 0.5 5.0 4.4 0.5 5.0AZ 0.0 0.0 0.0 23.4 2.9 26.3 23.4 2.9 26.3AR 0.0 0.0 0.0 45.1 5.5 50.6 45.1 5.5 50.6CA 3,756.2 458.1 4,214.3 2,115.4 258.0 2,373.4 5,871.6 716.1 6,587.7CO 0.0 0.0 0.0 26.2 3.2 29.4 26.2 3.2 29.4CT 0.0 0.0 0.0 13.4 1.6 15.1 13.4 1.6 15.1DE 0.0 0.0 0.0 6.0 0.7 6.7 6.0 0.7 6.7DC 0.0 0.0 0.0 0.8 0.1 0.9 0.8 0.1 0.9FL 4,742.6 578.9 5,321.6 2,483.1 303.1 2,786.3 7,225.8 882.1 8,107.8GA 0.0 0.0 0.0 137.9 16.8 154.7 137.9 16.8 154.7HI 0.0 0.0 0.0 6.5 0.8 7.2 6.5 0.8 7.2ID 0.0 0.0 0.0 17.7 2.2 19.8 17.7 2.2 19.8IL 218.9 26.7 245.6 220.4 26.9 247.2 439.2 53.6 492.8IN 0.0 0.0 0.0 44.5 5.4 50.0 44.5 5.4 50.0IA 0.0 0.0 0.0 59.9 7.3 67.2 59.9 7.3 67.2KS 0.0 0.0 0.0 40.1 4.9 44.9 40.1 4.9 44.9KY 0.0 0.0 0.0 33.9 4.1 38.0 33.9 4.1 38.0LA 0.0 0.0 0.0 60.1 7.3 67.5 60.1 7.3 67.5ME 0.0 0.0 0.0 7.1 0.9 7.9 7.1 0.9 7.9MD 0.0 0.0 0.0 12.1 1.5 13.6 12.1 1.5 13.6MA 0.0 0.0 0.0 19.3 2.4 21.6 19.3 2.4 21.6MI 0.0 0.0 0.0 61.8 7.5 69.4 61.8 7.5 69.4MN 0.0 0.0 0.0 46.1 5.6 51.7 46.1 5.6 51.7MS 0.0 0.0 0.0 25.5 3.1 28.7 25.5 3.1 28.7MO 0.0 0.0 0.0 39.1 4.8 43.9 39.1 4.8 43.9MT 0.0 0.0 0.0 9.0 1.1 10.0 9.0 1.1 10.0NE 0.0 0.0 0.0 59.1 7.2 66.3 59.1 7.2 66.3NV 401.3 48.9 450.2 194.8 23.8 218.5 596.1 72.7 668.7NH 0.0 0.0 0.0 4.3 0.5 4.8 4.3 0.5 4.8NJ 504.8 61.6 566.4 288.9 35.2 324.2 793.8 96.8 890.6NM 0.0 0.0 0.0 7.2 0.9 8.0 7.2 0.9 8.0NY 0.0 0.0 0.0 58.6 7.1 65.7 58.6 7.1 65.7NC 0.0 0.0 0.0 58.8 7.2 65.9 58.8 7.2 65.9ND 0.0 0.0 0.0 8.1 1.0 9.0 8.1 1.0 9.0OH 573.3 69.9 643.2 402.7 49.1 451.8 975.9 119.0 1,095.0OK 0.0 0.0 0.0 25.9 3.2 29.1 25.9 3.2 29.1OR 0.0 0.0 0.0 26.8 3.3 30.1 26.8 3.3 30.1PA 213.0 26.0 239.0 193.7 23.6 217.3 406.7 49.6 456.4RI 0.0 0.0 0.0 4.3 0.5 4.8 4.3 0.5 4.8SC 0.0 0.0 0.0 25.5 3.1 28.6 25.5 3.1 28.6SD 0.0 0.0 0.0 12.8 1.6 14.3 12.8 1.6 14.3TN 0.0 0.0 0.0 44.7 5.5 50.2 44.7 5.5 50.2TX 0.0 0.0 0.0 295.5 36.1 331.6 295.5 36.1 331.6UT 0.0 0.0 0.0 18.2 2.2 20.5 18.2 2.2 20.5VM 0.0 0.0 0.0 3.9 0.5 4.4 3.9 0.5 4.4VA 181.9 22.2 204.1 128.4 15.7 144.1 310.3 37.8 348.2WA 0.0 0.0 0.0 51.7 6.3 58.0 51.7 6.3 58.0WV 0.0 0.0 0.0 11.2 1.4 12.5 11.2 1.4 12.5WI 0.0 0.0 0.0 73.5 9.0 82.4 73.5 9.0 82.4WY 0.0 0.0 0.0 4.6 0.6 5.2 4.6 0.6 5.2
US_subtotal 10,592.0 1,292.3 11,884.3 7,626.3 930.5 8,556.8 18,218.3 2,222.7 20,441.1
FOREIGN 0.0 0.0 0.0 371.8 45.4 417.2 371.8 45.4 417.2
Total 10,592.0 1,292.3 11,884.3 7,998.1 975.8 8,974.0 18,590.1 2,268.1 20,858.3
Direct_Impacts Indirect_Impacts Total_Impacts
24

Appendix Table 5. Theme Park Impacts: California (i), $m.
State First_year Second_year Total First_year Second_year Total First_year Second_year TotalAL 0.0 0.0 0.0 63.4 7.7 71.2 63.4 7.7 71.2AK 0.0 0.0 0.0 4.6 0.6 5.1 4.6 0.6 5.1AZ 0.0 0.0 0.0 24.1 2.9 27.1 24.1 2.9 27.1AR 0.0 0.0 0.0 45.3 5.5 50.8 45.3 5.5 50.8CA 3,951.3 482.6 4,433.9 2,218.0 270.9 2,488.9 6,169.3 753.5 6,922.8CO 0.0 0.0 0.0 26.6 3.2 29.8 26.6 3.2 29.8CT 0.0 0.0 0.0 13.4 1.6 15.0 13.4 1.6 15.0DE 0.0 0.0 0.0 6.0 0.7 6.7 6.0 0.7 6.7DC 0.0 0.0 0.0 0.8 0.1 0.9 0.8 0.1 0.9FL 4,590.8 559.9 5,150.7 2,404.7 293.3 2,697.9 6,995.5 853.1 7,848.6GA 0.0 0.0 0.0 134.6 16.4 151.0 134.6 16.4 151.0HI 0.0 0.0 0.0 6.6 0.8 7.4 6.6 0.8 7.4ID 0.0 0.0 0.0 18.1 2.2 20.3 18.1 2.2 20.3IL 218.9 26.7 245.6 220.5 26.9 247.4 439.4 53.6 493.0IN 0.0 0.0 0.0 44.6 5.4 50.1 44.6 5.4 50.1IA 0.0 0.0 0.0 60.8 7.4 68.3 60.8 7.4 68.3KS 0.0 0.0 0.0 40.9 5.0 45.9 40.9 5.0 45.9KY 0.0 0.0 0.0 33.7 4.1 37.8 33.7 4.1 37.8LA 0.0 0.0 0.0 60.1 7.3 67.5 60.1 7.3 67.5ME 0.0 0.0 0.0 7.1 0.9 8.0 7.1 0.9 8.0MD 0.0 0.0 0.0 12.1 1.5 13.6 12.1 1.5 13.6MA 0.0 0.0 0.0 19.2 2.3 21.6 19.2 2.3 21.6MI 0.0 0.0 0.0 61.9 7.5 69.4 61.9 7.5 69.4MN 0.0 0.0 0.0 46.7 5.7 52.3 46.7 5.7 52.3MS 0.0 0.0 0.0 25.3 3.1 28.4 25.3 3.1 28.4MO 0.0 0.0 0.0 39.4 4.8 44.2 39.4 4.8 44.2MT 0.0 0.0 0.0 9.3 1.1 10.4 9.3 1.1 10.4NE 0.0 0.0 0.0 59.6 7.3 66.9 59.6 7.3 66.9NV 401.3 48.9 450.2 195.0 23.8 218.8 596.3 72.7 669.0NH 0.0 0.0 0.0 4.4 0.5 4.9 4.4 0.5 4.9NJ 504.8 61.6 566.4 288.9 35.2 324.1 793.7 96.8 890.5NM 0.0 0.0 0.0 7.2 0.9 8.1 7.2 0.9 8.1NY 0.0 0.0 0.0 58.6 7.2 65.8 58.6 7.2 65.8NC 0.0 0.0 0.0 58.1 7.1 65.2 58.1 7.1 65.2ND 0.0 0.0 0.0 8.2 1.0 9.2 8.2 1.0 9.2OH 573.3 69.9 643.2 402.6 49.1 451.7 975.9 119.0 1,094.9OK 0.0 0.0 0.0 26.2 3.2 29.4 26.2 3.2 29.4OR 0.0 0.0 0.0 27.6 3.4 30.9 27.6 3.4 30.9PA 213.0 26.0 239.0 193.6 23.6 217.2 406.7 49.6 456.3RI 0.0 0.0 0.0 4.3 0.5 4.8 4.3 0.5 4.8SC 0.0 0.0 0.0 25.2 3.1 28.3 25.2 3.1 28.3SD 0.0 0.0 0.0 13.0 1.6 14.6 13.0 1.6 14.6TN 0.0 0.0 0.0 44.5 5.4 49.9 44.5 5.4 49.9TX 0.0 0.0 0.0 295.1 36.0 331.1 295.1 36.0 331.1UT 0.0 0.0 0.0 18.6 2.3 20.9 18.6 2.3 20.9VM 0.0 0.0 0.0 3.9 0.5 4.3 3.9 0.5 4.3VA 181.9 22.2 204.1 128.2 15.6 143.9 310.2 37.8 348.0WA 0.0 0.0 0.0 53.1 6.5 59.6 53.1 6.5 59.6WV 0.0 0.0 0.0 11.2 1.4 12.6 11.2 1.4 12.6WI 0.0 0.0 0.0 73.9 9.0 82.9 73.9 9.0 82.9WY 0.0 0.0 0.0 4.7 0.6 5.3 4.7 0.6 5.3
US_subtotal 10,635.3 1,297.7 11,933.1 7,653.4 933.9 8,587.3 18,288.8 2,231.6 20,520.4
FOREIGN 0.0 0.0 0.0 373.2 45.5 418.7 373.2 45.5 418.7
Total 10,635.3 1,297.7 11,933.1 8,026.6 979.4 9,006.0 18,661.9 2,277.1 20,939.1
Direct_Impacts Indirect_Impacts Total_Impacts
25

Appendix Table 6. Theme Park Impacts: Ohio (i), $m.
State First_year Second_year Total First_year Second_year Total First_year Second_year TotalAL 0.0 0.0 0.0 63.8 7.8 71.6 63.8 7.8 71.6AK 0.0 0.0 0.0 4.5 0.5 5.0 4.5 0.5 5.0AZ 0.0 0.0 0.0 23.4 2.8 26.2 23.4 2.8 26.2AR 0.0 0.0 0.0 45.2 5.5 50.7 45.2 5.5 50.7CA 3,756.2 458.1 4,214.3 2,115.4 258.0 2,373.4 5,871.6 716.1 6,587.6CO 0.0 0.0 0.0 26.4 3.2 29.6 26.4 3.2 29.6CT 0.0 0.0 0.0 13.4 1.6 15.0 13.4 1.6 15.0DE 0.0 0.0 0.0 6.0 0.7 6.7 6.0 0.7 6.7DC 0.0 0.0 0.0 0.8 0.1 0.9 0.8 0.1 0.9FL 4,590.8 559.9 5,150.7 2,404.9 293.3 2,698.2 6,995.8 853.1 7,848.9GA 0.0 0.0 0.0 135.1 16.5 151.6 135.1 16.5 151.6HI 0.0 0.0 0.0 6.5 0.8 7.2 6.5 0.8 7.2ID 0.0 0.0 0.0 17.8 2.2 20.0 17.8 2.2 20.0IL 218.9 26.7 245.6 221.1 27.0 248.1 440.0 53.7 493.6IN 0.0 0.0 0.0 45.5 5.6 51.1 45.5 5.6 51.1IA 0.0 0.0 0.0 60.3 7.4 67.6 60.3 7.4 67.6KS 0.0 0.0 0.0 40.6 5.0 45.5 40.6 5.0 45.5KY 0.0 0.0 0.0 34.8 4.2 39.1 34.8 4.2 39.1LA 0.0 0.0 0.0 59.4 7.3 66.7 59.4 7.3 66.7ME 0.0 0.0 0.0 7.1 0.9 7.9 7.1 0.9 7.9MD 0.0 0.0 0.0 12.1 1.5 13.6 12.1 1.5 13.6MA 0.0 0.0 0.0 19.2 2.3 21.6 19.2 2.3 21.6MI 0.0 0.0 0.0 63.6 7.8 71.3 63.6 7.8 71.3MN 0.0 0.0 0.0 46.7 5.7 52.4 46.7 5.7 52.4MS 0.0 0.0 0.0 25.4 3.1 28.5 25.4 3.1 28.5MO 0.0 0.0 0.0 39.2 4.8 44.0 39.2 4.8 44.0MT 0.0 0.0 0.0 9.0 1.1 10.1 9.0 1.1 10.1NE 0.0 0.0 0.0 59.1 7.2 66.3 59.1 7.2 66.3NV 401.3 48.9 450.2 194.8 23.8 218.6 596.1 72.7 668.8NH 0.0 0.0 0.0 4.3 0.5 4.9 4.3 0.5 4.9NJ 504.8 61.6 566.4 288.8 35.2 324.0 793.6 96.8 890.4NM 0.0 0.0 0.0 7.2 0.9 8.1 7.2 0.9 8.1NY 0.0 0.0 0.0 59.0 7.2 66.2 59.0 7.2 66.2NC 0.0 0.0 0.0 58.5 7.1 65.6 58.5 7.1 65.6ND 0.0 0.0 0.0 8.2 1.0 9.2 8.2 1.0 9.2OH 726.4 89.2 815.6 491.6 60.3 551.9 1,218.0 149.5 1,367.5OK 0.0 0.0 0.0 25.9 3.2 29.0 25.9 3.2 29.0OR 0.0 0.0 0.0 26.9 3.3 30.2 26.9 3.3 30.2PA 213.0 26.0 239.0 194.6 23.7 218.4 407.7 49.7 457.4RI 0.0 0.0 0.0 4.3 0.5 4.8 4.3 0.5 4.8SC 0.0 0.0 0.0 25.4 3.1 28.5 25.4 3.1 28.5SD 0.0 0.0 0.0 13.0 1.6 14.6 13.0 1.6 14.6TN 0.0 0.0 0.0 44.7 5.4 50.1 44.7 5.4 50.1TX 0.0 0.0 0.0 291.7 35.6 327.3 291.7 35.6 327.3UT 0.0 0.0 0.0 18.2 2.2 20.4 18.2 2.2 20.4VM 0.0 0.0 0.0 3.9 0.5 4.3 3.9 0.5 4.3VA 181.9 22.2 204.1 128.5 15.7 144.2 310.5 37.9 348.3WA 0.0 0.0 0.0 51.6 6.3 57.9 51.6 6.3 57.9WV 0.0 0.0 0.0 12.2 1.5 13.7 12.2 1.5 13.7WI 0.0 0.0 0.0 74.0 9.0 83.1 74.0 9.0 83.1WY 0.0 0.0 0.0 4.7 0.6 5.2 4.7 0.6 5.2
US_subtotal 10,593.3 1,292.5 11,885.8 7,638.2 932.0 8,570.2 18,231.6 2,224.4 20,456.0
FOREIGN 0.0 0.0 0.0 372.2 45.4 417.7 372.2 45.4 417.7
Total 10,593.3 1,292.5 11,885.8 8,010.5 977.4 8,987.9 18,603.8 2,269.8 20,873.6
Direct_Impacts Indirect_Impacts Total_Impacts
26

Appendix Table 7. Theme Park Impacts: Ohio (ii), $m.
State First_year Second_year Total First_year Second_year Total First_year Second_year TotalAL 0.0 0.0 0.0 63.7 7.8 71.5 63.7 7.8 71.5AK 0.0 0.0 0.0 4.5 0.5 5.0 4.5 0.5 5.0AZ 0.0 0.0 0.0 23.3 2.8 26.2 23.3 2.8 26.2AR 0.0 0.0 0.0 45.1 5.5 50.6 45.1 5.5 50.6CA 3,756.2 458.1 4,214.3 2,115.2 258.0 2,373.2 5,871.4 716.0 6,587.5CO 0.0 0.0 0.0 26.3 3.2 29.5 26.3 3.2 29.5CT 0.0 0.0 0.0 13.4 1.6 15.0 13.4 1.6 15.0DE 0.0 0.0 0.0 6.0 0.7 6.7 6.0 0.7 6.7DC 0.0 0.0 0.0 0.8 0.1 0.9 0.8 0.1 0.9FL 4,590.8 559.9 5,150.7 2,404.9 293.3 2,698.2 6,995.7 853.1 7,848.8GA 0.0 0.0 0.0 135.1 16.5 151.5 135.1 16.5 151.5HI 0.0 0.0 0.0 6.5 0.8 7.2 6.5 0.8 7.2ID 0.0 0.0 0.0 17.8 2.2 19.9 17.8 2.2 19.9IL 218.9 26.7 245.6 220.9 26.9 247.8 439.8 53.6 493.4IN 0.0 0.0 0.0 45.4 5.5 50.9 45.4 5.5 50.9IA 0.0 0.0 0.0 60.2 7.3 67.5 60.2 7.3 67.5KS 0.0 0.0 0.0 40.5 4.9 45.5 40.5 4.9 45.5KY 0.0 0.0 0.0 34.7 4.2 38.9 34.7 4.2 38.9LA 0.0 0.0 0.0 59.4 7.2 66.7 59.4 7.2 66.7ME 0.0 0.0 0.0 7.1 0.9 7.9 7.1 0.9 7.9MD 0.0 0.0 0.0 12.1 1.5 13.6 12.1 1.5 13.6MA 0.0 0.0 0.0 19.2 2.3 21.6 19.2 2.3 21.6MI 0.0 0.0 0.0 63.3 7.7 71.1 63.3 7.7 71.1MN 0.0 0.0 0.0 46.6 5.7 52.3 46.6 5.7 52.3MS 0.0 0.0 0.0 25.3 3.1 28.4 25.3 3.1 28.4MO 0.0 0.0 0.0 39.2 4.8 44.0 39.2 4.8 44.0MT 0.0 0.0 0.0 9.0 1.1 10.1 9.0 1.1 10.1NE 0.0 0.0 0.0 59.0 7.2 66.2 59.0 7.2 66.2NV 401.3 48.9 450.2 194.8 23.8 218.5 596.1 72.7 668.8NH 0.0 0.0 0.0 4.3 0.5 4.8 4.3 0.5 4.8NJ 504.8 61.6 566.4 288.8 35.2 324.0 793.6 96.8 890.3NM 0.0 0.0 0.0 7.2 0.9 8.0 7.2 0.9 8.0NY 0.0 0.0 0.0 58.9 7.2 66.1 58.9 7.2 66.1NC 0.0 0.0 0.0 58.4 7.1 65.5 58.4 7.1 65.5ND 0.0 0.0 0.0 8.2 1.0 9.1 8.2 1.0 9.1OH 713.3 87.5 800.8 483.9 59.3 543.2 1,197.2 146.8 1,344.0OK 0.0 0.0 0.0 25.9 3.2 29.0 25.9 3.2 29.0OR 0.0 0.0 0.0 26.9 3.3 30.2 26.9 3.3 30.2PA 213.0 26.0 239.0 194.5 23.7 218.2 407.5 49.7 457.2RI 0.0 0.0 0.0 4.3 0.5 4.8 4.3 0.5 4.8SC 0.0 0.0 0.0 25.4 3.1 28.5 25.4 3.1 28.5SD 0.0 0.0 0.0 13.0 1.6 14.5 13.0 1.6 14.5TN 0.0 0.0 0.0 44.6 5.4 50.0 44.6 5.4 50.0TX 0.0 0.0 0.0 291.6 35.6 327.1 291.6 35.6 327.1UT 0.0 0.0 0.0 18.2 2.2 20.4 18.2 2.2 20.4VM 0.0 0.0 0.0 3.9 0.5 4.3 3.9 0.5 4.3VA 181.9 22.2 204.1 128.5 15.7 144.2 310.4 37.9 348.3WA 0.0 0.0 0.0 51.6 6.3 57.9 51.6 6.3 57.9WV 0.0 0.0 0.0 12.1 1.5 13.6 12.1 1.5 13.6WI 0.0 0.0 0.0 73.9 9.0 82.9 73.9 9.0 82.9WY 0.0 0.0 0.0 4.7 0.6 5.2 4.7 0.6 5.2
US_subtotal 10,580.2 1,290.8 11,871.0 7,627.7 930.6 8,558.4 18,207.9 2,221.4 20,429.4
FOREIGN 0.0 0.0 0.0 371.7 45.4 417.1 371.7 45.4 417.1
Total 10,580.2 1,290.8 11,871.0 7,999.5 976.0 8,975.4 18,579.7 2,266.8 20,846.5
Direct_Impacts Indirect_Impacts Total_Impacts
27

Appendix Table 8. Theme Park Impacts: New Jersey (i), $m.
State First_year Second_year Total First_year Second_year Total First_year Second_year TotalAL 0.0 0.0 0.0 63.3 7.7 71.0 63.3 7.7 71.0AK 0.0 0.0 0.0 4.4 0.5 5.0 4.4 0.5 5.0AZ 0.0 0.0 0.0 23.3 2.8 26.2 23.3 2.8 26.2AR 0.0 0.0 0.0 44.6 5.4 50.1 44.6 5.4 50.1CA 3,756.2 458.1 4,214.3 2,115.1 257.9 2,373.0 5,871.3 716.0 6,587.3CO 0.0 0.0 0.0 26.1 3.2 29.3 26.1 3.2 29.3CT 0.0 0.0 0.0 13.5 1.6 15.1 13.5 1.6 15.1DE 0.0 0.0 0.0 6.2 0.8 6.9 6.2 0.8 6.9DC 0.0 0.0 0.0 0.8 0.1 0.9 0.8 0.1 0.9FL 4,590.8 559.9 5,150.7 2,404.7 293.3 2,697.9 6,995.5 853.1 7,848.6GA 0.0 0.0 0.0 134.9 16.5 151.4 134.9 16.5 151.4HI 0.0 0.0 0.0 6.4 0.8 7.2 6.4 0.8 7.2ID 0.0 0.0 0.0 17.6 2.2 19.8 17.6 2.2 19.8IL 218.9 26.7 245.6 219.7 26.8 246.5 438.5 53.5 492.0IN 0.0 0.0 0.0 44.3 5.4 49.7 44.3 5.4 49.7IA 0.0 0.0 0.0 59.8 7.3 67.1 59.8 7.3 67.1KS 0.0 0.0 0.0 40.9 5.0 45.9 40.9 5.0 45.9KY 0.0 0.0 0.0 33.6 4.1 37.7 33.6 4.1 37.7LA 0.0 0.0 0.0 59.3 7.2 66.5 59.3 7.2 66.5ME 0.0 0.0 0.0 7.1 0.9 7.9 7.1 0.9 7.9MD 0.0 0.0 0.0 12.4 1.5 13.9 12.4 1.5 13.9MA 0.0 0.0 0.0 19.3 2.4 21.7 19.3 2.4 21.7MI 0.0 0.0 0.0 61.7 7.5 69.3 61.7 7.5 69.3MN 0.0 0.0 0.0 46.0 5.6 51.6 46.0 5.6 51.6MS 0.0 0.0 0.0 25.2 3.1 28.3 25.2 3.1 28.3MO 0.0 0.0 0.0 39.2 4.8 44.0 39.2 4.8 44.0MT 0.0 0.0 0.0 9.0 1.1 10.0 9.0 1.1 10.0NE 0.0 0.0 0.0 58.6 7.2 65.8 58.6 7.2 65.8NV 401.3 48.9 450.2 194.8 23.8 218.5 596.0 72.7 668.7NH 0.0 0.0 0.0 4.3 0.5 4.8 4.3 0.5 4.8NJ 640.4 78.6 719.1 355.3 43.6 398.9 995.7 122.2 1,117.9NM 0.0 0.0 0.0 7.1 0.9 8.0 7.1 0.9 8.0NY 0.0 0.0 0.0 59.9 7.3 67.2 59.9 7.3 67.2NC 0.0 0.0 0.0 58.2 7.1 65.3 58.2 7.1 65.3ND 0.0 0.0 0.0 8.1 1.0 9.0 8.1 1.0 9.0OH 573.3 69.9 643.2 402.5 49.1 451.6 975.8 119.0 1,094.7OK 0.0 0.0 0.0 25.8 3.1 29.0 25.8 3.1 29.0OR 0.0 0.0 0.0 26.7 3.3 30.0 26.7 3.3 30.0PA 213.0 26.0 239.0 195.3 23.8 219.1 408.3 49.8 458.1RI 0.0 0.0 0.0 4.3 0.5 4.8 4.3 0.5 4.8SC 0.0 0.0 0.0 25.1 3.1 28.2 25.1 3.1 28.2SD 0.0 0.0 0.0 12.7 1.6 14.3 12.7 1.6 14.3TN 0.0 0.0 0.0 44.4 5.4 49.8 44.4 5.4 49.8TX 0.0 0.0 0.0 292.8 35.7 328.5 292.8 35.7 328.5UT 0.0 0.0 0.0 18.1 2.2 20.3 18.1 2.2 20.3VM 0.0 0.0 0.0 3.9 0.5 4.3 3.9 0.5 4.3VA 181.9 22.2 204.1 128.4 15.7 144.0 310.3 37.8 348.1WA 0.0 0.0 0.0 51.5 6.3 57.8 51.5 6.3 57.8WV 0.0 0.0 0.0 11.2 1.4 12.6 11.2 1.4 12.6WI 0.0 0.0 0.0 73.3 8.9 82.2 73.3 8.9 82.2WY 0.0 0.0 0.0 4.6 0.6 5.2 4.6 0.6 5.2
US_subtotal 10,575.8 1,290.3 11,866.1 7,605.3 927.8 8,533.2 18,181.2 2,218.1 20,399.2
FOREIGN 0.0 0.0 0.0 371.0 45.3 416.2 371.0 45.3 416.2
Total 10,575.8 1,290.3 11,866.1 7,976.3 973.1 8,949.4 18,552.1 2,263.3 20,815.5
Direct_Impacts Indirect_Impacts Total_Impacts
28

Appendix Table 9. Theme Park Impacts: California (ii), $m.
State First_year Second_year Total First_year Second_year Total First_year Second_year TotalAL 0.0 0.0 0.0 63.3 7.7 71.1 63.3 7.7 71.1AK 0.0 0.0 0.0 4.5 0.6 5.1 4.5 0.6 5.1AZ 0.0 0.0 0.0 24.0 2.9 26.9 24.0 2.9 26.9AR 0.0 0.0 0.0 45.1 5.5 50.6 45.1 5.5 50.6CA 3,921.2 478.8 4,400.0 2,201.8 268.9 2,470.7 6,123.0 747.7 6,870.7CO 0.0 0.0 0.0 26.5 3.2 29.7 26.5 3.2 29.7CT 0.0 0.0 0.0 13.3 1.6 15.0 13.3 1.6 15.0DE 0.0 0.0 0.0 6.0 0.7 6.7 6.0 0.7 6.7DC 0.0 0.0 0.0 0.8 0.1 0.9 0.8 0.1 0.9FL 4,590.8 559.9 5,150.7 2,404.6 293.2 2,697.8 6,995.4 853.1 7,848.5GA 0.0 0.0 0.0 134.5 16.4 150.9 134.5 16.4 150.9HI 0.0 0.0 0.0 6.6 0.8 7.4 6.6 0.8 7.4ID 0.0 0.0 0.0 18.0 2.2 20.2 18.0 2.2 20.2IL 218.9 26.7 245.6 220.3 26.9 247.1 439.1 53.6 492.7IN 0.0 0.0 0.0 44.5 5.4 49.9 44.5 5.4 49.9IA 0.0 0.0 0.0 60.6 7.4 68.0 60.6 7.4 68.0KS 0.0 0.0 0.0 40.7 5.0 45.7 40.7 5.0 45.7KY 0.0 0.0 0.0 33.7 4.1 37.8 33.7 4.1 37.8LA 0.0 0.0 0.0 60.0 7.3 67.3 60.0 7.3 67.3ME 0.0 0.0 0.0 7.1 0.9 8.0 7.1 0.9 8.0MD 0.0 0.0 0.0 12.1 1.5 13.6 12.1 1.5 13.6MA 0.0 0.0 0.0 19.2 2.3 21.5 19.2 2.3 21.5MI 0.0 0.0 0.0 61.7 7.5 69.2 61.7 7.5 69.2MN 0.0 0.0 0.0 46.5 5.7 52.2 46.5 5.7 52.2MS 0.0 0.0 0.0 25.3 3.1 28.3 25.3 3.1 28.3MO 0.0 0.0 0.0 39.3 4.8 44.1 39.3 4.8 44.1MT 0.0 0.0 0.0 9.2 1.1 10.3 9.2 1.1 10.3NE 0.0 0.0 0.0 59.4 7.2 66.6 59.4 7.2 66.6NV 401.3 48.9 450.2 195.0 23.8 218.7 596.2 72.7 668.9NH 0.0 0.0 0.0 4.3 0.5 4.9 4.3 0.5 4.9NJ 504.8 61.6 566.4 288.8 35.2 324.0 793.6 96.8 890.4NM 0.0 0.0 0.0 7.2 0.9 8.0 7.2 0.9 8.0NY 0.0 0.0 0.0 58.5 7.1 65.6 58.5 7.1 65.6NC 0.0 0.0 0.0 58.0 7.1 65.1 58.0 7.1 65.1ND 0.0 0.0 0.0 8.1 1.0 9.1 8.1 1.0 9.1OH 573.3 69.9 643.2 402.5 49.1 451.6 975.7 119.0 1,094.7OK 0.0 0.0 0.0 26.1 3.2 29.3 26.1 3.2 29.3OR 0.0 0.0 0.0 27.4 3.3 30.8 27.4 3.3 30.8PA 213.0 26.0 239.0 193.5 23.6 217.1 406.5 49.6 456.1RI 0.0 0.0 0.0 4.3 0.5 4.8 4.3 0.5 4.8SC 0.0 0.0 0.0 25.1 3.1 28.2 25.1 3.1 28.2SD 0.0 0.0 0.0 12.9 1.6 14.5 12.9 1.6 14.5TN 0.0 0.0 0.0 44.4 5.4 49.8 44.4 5.4 49.8TX 0.0 0.0 0.0 294.3 35.9 330.2 294.3 35.9 330.2UT 0.0 0.0 0.0 18.6 2.3 20.8 18.6 2.3 20.8VM 0.0 0.0 0.0 3.9 0.5 4.3 3.9 0.5 4.3VA 181.9 22.2 204.1 128.2 15.6 143.8 310.1 37.8 348.0WA 0.0 0.0 0.0 52.9 6.5 59.3 52.9 6.5 59.3WV 0.0 0.0 0.0 11.2 1.4 12.6 11.2 1.4 12.6WI 0.0 0.0 0.0 73.7 9.0 82.6 73.7 9.0 82.6WY 0.0 0.0 0.0 4.7 0.6 5.2 4.7 0.6 5.2
US_subtotal 10,605.2 1,293.9 11,899.1 7,632.1 931.2 8,563.3 18,237.3 2,225.1 20,462.4
FOREIGN 0.0 0.0 0.0 372.1 45.4 417.5 372.1 45.4 417.5
Total 10,605.2 1,293.9 11,899.1 8,004.2 976.6 8,980.8 18,609.4 2,270.5 20,879.9
Direct_Impacts Indirect_Impacts Total_Impacts
29

Appendix Table 10. Theme Park Impacts: New Jersey (ii), $m.
State First_year Second_year Total First_year Second_year Total First_year Second_year TotalAL 0.0 0.0 0.0 63.3 7.7 71.0 63.3 7.7 71.0AK 0.0 0.0 0.0 4.4 0.5 5.0 4.4 0.5 5.0AZ 0.0 0.0 0.0 23.3 2.8 26.2 23.3 2.8 26.2AR 0.0 0.0 0.0 44.6 5.4 50.0 44.6 5.4 50.0CA 3,756.2 458.1 4,214.3 2,114.9 257.9 2,372.9 5,871.1 716.0 6,587.1CO 0.0 0.0 0.0 26.1 3.2 29.3 26.1 3.2 29.3CT 0.0 0.0 0.0 13.5 1.6 15.1 13.5 1.6 15.1DE 0.0 0.0 0.0 6.2 0.8 6.9 6.2 0.8 6.9DC 0.0 0.0 0.0 0.8 0.1 0.9 0.8 0.1 0.9FL 4,590.8 559.9 5,150.7 2,404.6 293.2 2,697.9 6,995.4 853.1 7,848.5GA 0.0 0.0 0.0 134.9 16.4 151.3 134.9 16.4 151.3HI 0.0 0.0 0.0 6.4 0.8 7.2 6.4 0.8 7.2ID 0.0 0.0 0.0 17.6 2.2 19.8 17.6 2.2 19.8IL 218.9 26.7 245.6 219.6 26.8 246.4 438.5 53.5 491.9IN 0.0 0.0 0.0 44.3 5.4 49.7 44.3 5.4 49.7IA 0.0 0.0 0.0 59.8 7.3 67.0 59.8 7.3 67.0KS 0.0 0.0 0.0 40.8 5.0 45.7 40.8 5.0 45.7KY 0.0 0.0 0.0 33.6 4.1 37.6 33.6 4.1 37.6LA 0.0 0.0 0.0 59.3 7.2 66.5 59.3 7.2 66.5ME 0.0 0.0 0.0 7.1 0.9 7.9 7.1 0.9 7.9MD 0.0 0.0 0.0 12.3 1.5 13.8 12.3 1.5 13.8MA 0.0 0.0 0.0 19.3 2.4 21.6 19.3 2.4 21.6MI 0.0 0.0 0.0 61.7 7.5 69.2 61.7 7.5 69.2MN 0.0 0.0 0.0 46.0 5.6 51.6 46.0 5.6 51.6MS 0.0 0.0 0.0 25.2 3.1 28.2 25.2 3.1 28.2MO 0.0 0.0 0.0 39.2 4.8 43.9 39.2 4.8 43.9MT 0.0 0.0 0.0 9.0 1.1 10.0 9.0 1.1 10.0NE 0.0 0.0 0.0 58.6 7.1 65.8 58.6 7.1 65.8NV 401.3 48.9 450.2 194.8 23.8 218.5 596.0 72.7 668.7NH 0.0 0.0 0.0 4.3 0.5 4.8 4.3 0.5 4.8NJ 627.3 77.0 704.3 348.8 42.8 391.6 976.1 119.7 1,095.9NM 0.0 0.0 0.0 7.1 0.9 8.0 7.1 0.9 8.0NY 0.0 0.0 0.0 59.7 7.3 67.0 59.7 7.3 67.0NC 0.0 0.0 0.0 58.1 7.1 65.2 58.1 7.1 65.2ND 0.0 0.0 0.0 8.1 1.0 9.0 8.1 1.0 9.0OH 573.3 69.9 643.2 402.4 49.1 451.5 975.7 119.0 1,094.7OK 0.0 0.0 0.0 25.8 3.1 28.9 25.8 3.1 28.9OR 0.0 0.0 0.0 26.7 3.3 30.0 26.7 3.3 30.0PA 213.0 26.0 239.0 195.0 23.8 218.8 408.1 49.8 457.8RI 0.0 0.0 0.0 4.3 0.5 4.8 4.3 0.5 4.8SC 0.0 0.0 0.0 25.1 3.1 28.2 25.1 3.1 28.2SD 0.0 0.0 0.0 12.7 1.6 14.3 12.7 1.6 14.3TN 0.0 0.0 0.0 44.4 5.4 49.8 44.4 5.4 49.8TX 0.0 0.0 0.0 292.5 35.7 328.2 292.5 35.7 328.2UT 0.0 0.0 0.0 18.1 2.2 20.3 18.1 2.2 20.3VM 0.0 0.0 0.0 3.9 0.5 4.3 3.9 0.5 4.3VA 181.9 22.2 204.1 128.3 15.6 144.0 310.3 37.8 348.1WA 0.0 0.0 0.0 51.5 6.3 57.8 51.5 6.3 57.8WV 0.0 0.0 0.0 11.2 1.4 12.5 11.2 1.4 12.5WI 0.0 0.0 0.0 73.2 8.9 82.1 73.2 8.9 82.1WY 0.0 0.0 0.0 4.6 0.6 5.2 4.6 0.6 5.2
US_subtotal 10,562.7 1,288.6 11,851.3 7,596.6 926.7 8,523.4 18,159.3 2,215.3 20,374.7
FOREIGN 0.0 0.0 0.0 370.5 45.2 415.7 370.5 45.2 415.7
Total 10,562.7 1,288.6 11,851.3 7,967.2 971.9 8,939.1 18,529.9 2,260.5 20,790.4
Direct_Impacts Indirect_Impacts Total_Impacts
30

Appendix Table 11. Theme Park Impacts: Pennsylvania, $m.
State First_year Second_year Total First_year Second_year Total First_year Second_year TotalAL 0.0 0.0 0.0 63.1 7.7 70.8 63.1 7.7 70.8AK 0.0 0.0 0.0 4.4 0.5 5.0 4.4 0.5 5.0AZ 0.0 0.0 0.0 23.3 2.8 26.2 23.3 2.8 26.2AR 0.0 0.0 0.0 44.8 5.5 50.3 44.8 5.5 50.3CA 3,756.2 458.1 4,214.3 2,114.7 257.9 2,372.6 5,870.9 716.0 6,586.9CO 0.0 0.0 0.0 26.1 3.2 29.3 26.1 3.2 29.3CT 0.0 0.0 0.0 13.4 1.6 15.0 13.4 1.6 15.0DE 0.0 0.0 0.0 6.1 0.7 6.8 6.1 0.7 6.8DC 0.0 0.0 0.0 0.8 0.1 0.9 0.8 0.1 0.9FL 4,590.8 559.9 5,150.7 2,404.6 293.2 2,697.8 6,995.4 853.1 7,848.5GA 0.0 0.0 0.0 134.7 16.4 151.1 134.7 16.4 151.1HI 0.0 0.0 0.0 6.4 0.8 7.2 6.4 0.8 7.2ID 0.0 0.0 0.0 17.6 2.1 19.8 17.6 2.1 19.8IL 218.9 26.7 245.6 219.8 26.8 246.6 438.6 53.5 492.1IN 0.0 0.0 0.0 44.3 5.4 49.7 44.3 5.4 49.7IA 0.0 0.0 0.0 59.7 7.3 67.0 59.7 7.3 67.0KS 0.0 0.0 0.0 39.9 4.9 44.8 39.9 4.9 44.8KY 0.0 0.0 0.0 33.7 4.1 37.8 33.7 4.1 37.8LA 0.0 0.0 0.0 59.3 7.2 66.6 59.3 7.2 66.6ME 0.0 0.0 0.0 7.1 0.9 8.0 7.1 0.9 8.0MD 0.0 0.0 0.0 12.5 1.5 14.0 12.5 1.5 14.0MA 0.0 0.0 0.0 19.2 2.3 21.5 19.2 2.3 21.5MI 0.0 0.0 0.0 61.6 7.5 69.1 61.6 7.5 69.1MN 0.0 0.0 0.0 46.0 5.6 51.6 46.0 5.6 51.6MS 0.0 0.0 0.0 25.2 3.1 28.3 25.2 3.1 28.3MO 0.0 0.0 0.0 39.0 4.8 43.8 39.0 4.8 43.8MT 0.0 0.0 0.0 9.0 1.1 10.1 9.0 1.1 10.1NE 0.0 0.0 0.0 58.9 7.2 66.0 58.9 7.2 66.0NV 401.3 48.9 450.2 194.8 23.8 218.5 596.0 72.7 668.7NH 0.0 0.0 0.0 4.3 0.5 4.9 4.3 0.5 4.9NJ 504.8 61.6 566.4 289.0 35.2 324.3 793.8 96.8 890.6NM 0.0 0.0 0.0 7.1 0.9 8.0 7.1 0.9 8.0NY 0.0 0.0 0.0 59.5 7.3 66.8 59.5 7.3 66.8NC 0.0 0.0 0.0 58.2 7.1 65.4 58.2 7.1 65.4ND 0.0 0.0 0.0 8.1 1.0 9.1 8.1 1.0 9.1OH 573.3 69.9 643.2 402.8 49.1 451.9 976.1 119.0 1,095.1OK 0.0 0.0 0.0 25.7 3.1 28.9 25.7 3.1 28.9OR 0.0 0.0 0.0 26.7 3.3 30.0 26.7 3.3 30.0PA 322.0 39.7 361.6 255.5 31.4 286.9 577.5 71.1 648.6RI 0.0 0.0 0.0 4.3 0.5 4.8 4.3 0.5 4.8SC 0.0 0.0 0.0 25.2 3.1 28.3 25.2 3.1 28.3SD 0.0 0.0 0.0 12.8 1.6 14.4 12.8 1.6 14.4TN 0.0 0.0 0.0 44.3 5.4 49.7 44.3 5.4 49.7TX 0.0 0.0 0.0 292.9 35.7 328.6 292.9 35.7 328.6UT 0.0 0.0 0.0 18.1 2.2 20.4 18.1 2.2 20.4VM 0.0 0.0 0.0 3.9 0.5 4.4 3.9 0.5 4.4VA 181.9 22.2 204.1 128.5 15.7 144.2 310.4 37.9 348.3WA 0.0 0.0 0.0 51.5 6.3 57.8 51.5 6.3 57.8WV 0.0 0.0 0.0 11.4 1.4 12.8 11.4 1.4 12.8WI 0.0 0.0 0.0 73.4 9.0 82.4 73.4 9.0 82.4WY 0.0 0.0 0.0 4.6 0.6 5.2 4.6 0.6 5.2
US_subtotal 10,549.1 1,286.9 11,836.0 7,598.1 926.9 8,525.0 18,147.2 2,213.8 20,361.0
FOREIGN 0.0 0.0 0.0 370.3 45.2 415.5 370.3 45.2 415.5
Total 10,549.1 1,286.9 11,836.0 7,968.4 972.1 8,940.5 18,517.6 2,259.0 20,776.6
Direct_Impacts Indirect_Impacts Total_Impacts
31

Appendix Table 12. Theme Park Impacts: Virginia, $m.
State First_year Second_year Total First_year Second_year Total First_year Second_year TotalAL 0.0 0.0 0.0 63.1 7.7 70.9 63.1 7.7 70.9AK 0.0 0.0 0.0 4.5 0.5 5.0 4.5 0.5 5.0AZ 0.0 0.0 0.0 23.3 2.8 26.2 23.3 2.8 26.2AR 0.0 0.0 0.0 44.6 5.4 50.0 44.6 5.4 50.0CA 3,756.2 458.1 4,214.3 2,114.3 257.8 2,372.2 5,870.5 715.9 6,586.4CO 0.0 0.0 0.0 26.1 3.2 29.3 26.1 3.2 29.3CT 0.0 0.0 0.0 13.4 1.6 15.0 13.4 1.6 15.0DE 0.0 0.0 0.0 6.5 0.8 7.3 6.5 0.8 7.3DC 0.0 0.0 0.0 0.9 0.1 1.0 0.9 0.1 1.0FL 4,590.8 559.9 5,150.7 2,404.5 293.2 2,697.8 6,995.3 853.1 7,848.4GA 0.0 0.0 0.0 134.8 16.4 151.3 134.8 16.4 151.3HI 0.0 0.0 0.0 6.4 0.8 7.2 6.4 0.8 7.2ID 0.0 0.0 0.0 17.6 2.1 19.7 17.6 2.1 19.7IL 218.9 26.7 245.6 219.5 26.8 246.3 438.4 53.5 491.8IN 0.0 0.0 0.0 44.6 5.4 50.0 44.6 5.4 50.0IA 0.0 0.0 0.0 59.6 7.3 66.8 59.6 7.3 66.8KS 0.0 0.0 0.0 40.3 4.9 45.3 40.3 4.9 45.3KY 0.0 0.0 0.0 33.9 4.1 38.1 33.9 4.1 38.1LA 0.0 0.0 0.0 59.3 7.2 66.5 59.3 7.2 66.5ME 0.0 0.0 0.0 7.1 0.9 7.9 7.1 0.9 7.9MD 0.0 0.0 0.0 13.1 1.6 14.7 13.1 1.6 14.7MA 0.0 0.0 0.0 19.2 2.3 21.5 19.2 2.3 21.5MI 0.0 0.0 0.0 61.7 7.5 69.2 61.7 7.5 69.2MN 0.0 0.0 0.0 45.8 5.6 51.4 45.8 5.6 51.4MS 0.0 0.0 0.0 25.2 3.1 28.2 25.2 3.1 28.2MO 0.0 0.0 0.0 38.9 4.7 43.7 38.9 4.7 43.7MT 0.0 0.0 0.0 8.9 1.1 10.0 8.9 1.1 10.0NE 0.0 0.0 0.0 58.5 7.1 65.7 58.5 7.1 65.7NV 401.3 48.9 450.2 194.8 23.8 218.5 596.0 72.7 668.7NH 0.0 0.0 0.0 4.3 0.5 4.8 4.3 0.5 4.8NJ 504.8 61.6 566.4 288.6 35.2 323.8 793.4 96.8 890.2NM 0.0 0.0 0.0 7.1 0.9 7.9 7.1 0.9 7.9NY 0.0 0.0 0.0 58.4 7.1 65.5 58.4 7.1 65.5NC 0.0 0.0 0.0 59.6 7.3 66.8 59.6 7.3 66.8ND 0.0 0.0 0.0 8.0 1.0 9.0 8.0 1.0 9.0OH 573.3 69.9 643.2 402.4 49.1 451.5 975.7 119.0 1,094.6OK 0.0 0.0 0.0 25.7 3.1 28.9 25.7 3.1 28.9OR 0.0 0.0 0.0 26.7 3.3 30.0 26.7 3.3 30.0PA 213.0 26.0 239.0 194.2 23.7 217.9 407.2 49.7 456.9RI 0.0 0.0 0.0 4.3 0.5 4.8 4.3 0.5 4.8SC 0.0 0.0 0.0 25.3 3.1 28.4 25.3 3.1 28.4SD 0.0 0.0 0.0 12.7 1.6 14.3 12.7 1.6 14.3TN 0.0 0.0 0.0 44.7 5.5 50.2 44.7 5.5 50.2TX 0.0 0.0 0.0 291.3 35.5 326.8 291.3 35.5 326.8UT 0.0 0.0 0.0 18.1 2.2 20.3 18.1 2.2 20.3VM 0.0 0.0 0.0 3.8 0.5 4.3 3.8 0.5 4.3VA 275.0 33.9 308.9 181.7 22.4 204.0 456.7 56.2 512.9WA 0.0 0.0 0.0 51.5 6.3 57.7 51.5 6.3 57.7WV 0.0 0.0 0.0 11.9 1.4 13.3 11.9 1.4 13.3WI 0.0 0.0 0.0 73.0 8.9 81.9 73.0 8.9 81.9WY 0.0 0.0 0.0 4.6 0.6 5.1 4.6 0.6 5.1
US_subtotal 10,533.2 1,284.9 11,818.1 7,588.4 925.7 8,514.1 18,121.6 2,210.6 20,332.2
FOREIGN 0.0 0.0 0.0 369.9 45.1 415.0 369.9 45.1 415.0
Total 10,533.2 1,284.9 11,818.1 7,958.3 970.8 8,929.1 18,491.5 2,255.7 20,747.2
Direct_Impacts Indirect_Impacts Total_Impacts
32
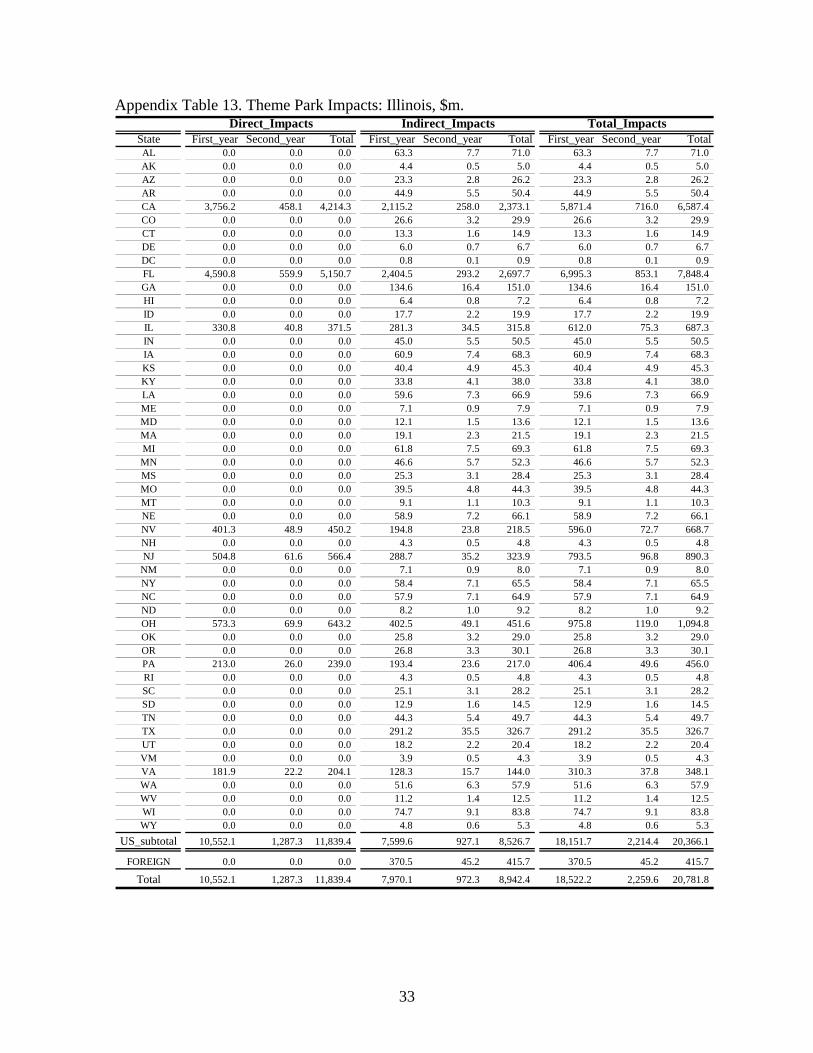
Appendix Table 13. Theme Park Impacts: Illinois, $m.
State First_year Second_year Total First_year Second_year Total First_year Second_year TotalAL 0.0 0.0 0.0 63.3 7.7 71.0 63.3 7.7 71.0AK 0.0 0.0 0.0 4.4 0.5 5.0 4.4 0.5 5.0AZ 0.0 0.0 0.0 23.3 2.8 26.2 23.3 2.8 26.2AR 0.0 0.0 0.0 44.9 5.5 50.4 44.9 5.5 50.4CA 3,756.2 458.1 4,214.3 2,115.2 258.0 2,373.1 5,871.4 716.0 6,587.4CO 0.0 0.0 0.0 26.6 3.2 29.9 26.6 3.2 29.9CT 0.0 0.0 0.0 13.3 1.6 14.9 13.3 1.6 14.9DE 0.0 0.0 0.0 6.0 0.7 6.7 6.0 0.7 6.7DC 0.0 0.0 0.0 0.8 0.1 0.9 0.8 0.1 0.9FL 4,590.8 559.9 5,150.7 2,404.5 293.2 2,697.7 6,995.3 853.1 7,848.4GA 0.0 0.0 0.0 134.6 16.4 151.0 134.6 16.4 151.0HI 0.0 0.0 0.0 6.4 0.8 7.2 6.4 0.8 7.2ID 0.0 0.0 0.0 17.7 2.2 19.9 17.7 2.2 19.9IL 330.8 40.8 371.5 281.3 34.5 315.8 612.0 75.3 687.3IN 0.0 0.0 0.0 45.0 5.5 50.5 45.0 5.5 50.5IA 0.0 0.0 0.0 60.9 7.4 68.3 60.9 7.4 68.3KS 0.0 0.0 0.0 40.4 4.9 45.3 40.4 4.9 45.3KY 0.0 0.0 0.0 33.8 4.1 38.0 33.8 4.1 38.0LA 0.0 0.0 0.0 59.6 7.3 66.9 59.6 7.3 66.9ME 0.0 0.0 0.0 7.1 0.9 7.9 7.1 0.9 7.9MD 0.0 0.0 0.0 12.1 1.5 13.6 12.1 1.5 13.6MA 0.0 0.0 0.0 19.1 2.3 21.5 19.1 2.3 21.5MI 0.0 0.0 0.0 61.8 7.5 69.3 61.8 7.5 69.3MN 0.0 0.0 0.0 46.6 5.7 52.3 46.6 5.7 52.3MS 0.0 0.0 0.0 25.3 3.1 28.4 25.3 3.1 28.4MO 0.0 0.0 0.0 39.5 4.8 44.3 39.5 4.8 44.3MT 0.0 0.0 0.0 9.1 1.1 10.3 9.1 1.1 10.3NE 0.0 0.0 0.0 58.9 7.2 66.1 58.9 7.2 66.1NV 401.3 48.9 450.2 194.8 23.8 218.5 596.0 72.7 668.7NH 0.0 0.0 0.0 4.3 0.5 4.8 4.3 0.5 4.8NJ 504.8 61.6 566.4 288.7 35.2 323.9 793.5 96.8 890.3NM 0.0 0.0 0.0 7.1 0.9 8.0 7.1 0.9 8.0NY 0.0 0.0 0.0 58.4 7.1 65.5 58.4 7.1 65.5NC 0.0 0.0 0.0 57.9 7.1 64.9 57.9 7.1 64.9ND 0.0 0.0 0.0 8.2 1.0 9.2 8.2 1.0 9.2OH 573.3 69.9 643.2 402.5 49.1 451.6 975.8 119.0 1,094.8OK 0.0 0.0 0.0 25.8 3.2 29.0 25.8 3.2 29.0OR 0.0 0.0 0.0 26.8 3.3 30.1 26.8 3.3 30.1PA 213.0 26.0 239.0 193.4 23.6 217.0 406.4 49.6 456.0RI 0.0 0.0 0.0 4.3 0.5 4.8 4.3 0.5 4.8SC 0.0 0.0 0.0 25.1 3.1 28.2 25.1 3.1 28.2SD 0.0 0.0 0.0 12.9 1.6 14.5 12.9 1.6 14.5TN 0.0 0.0 0.0 44.3 5.4 49.7 44.3 5.4 49.7TX 0.0 0.0 0.0 291.2 35.5 326.7 291.2 35.5 326.7UT 0.0 0.0 0.0 18.2 2.2 20.4 18.2 2.2 20.4VM 0.0 0.0 0.0 3.9 0.5 4.3 3.9 0.5 4.3VA 181.9 22.2 204.1 128.3 15.7 144.0 310.3 37.8 348.1WA 0.0 0.0 0.0 51.6 6.3 57.9 51.6 6.3 57.9WV 0.0 0.0 0.0 11.2 1.4 12.5 11.2 1.4 12.5WI 0.0 0.0 0.0 74.7 9.1 83.8 74.7 9.1 83.8WY 0.0 0.0 0.0 4.8 0.6 5.3 4.8 0.6 5.3
US_subtotal 10,552.1 1,287.3 11,839.4 7,599.6 927.1 8,526.7 18,151.7 2,214.4 20,366.1
FOREIGN 0.0 0.0 0.0 370.5 45.2 415.7 370.5 45.2 415.7
Total 10,552.1 1,287.3 11,839.4 7,970.1 972.3 8,942.4 18,522.2 2,259.6 20,781.8
Direct_Impacts Indirect_Impacts Total_Impacts
33

Appendix Table 14. Diversion of Theme Park Overnight Visitors to National Parks, by State and USC sectors, $m.
ch
Code Prop USC 33 USC 35 USC 44 USC 45 1st_Total USC 33 USC 35 USC 44 USC 45 2nd_Total
AK 0.012 13.74 20.85 18.28 40.46 93.33 1.68 2.56 2.24 4.96 11.44AZ 0.055 65.00 98.64 86.44 191.37 441.46 7.97 12.09 10.60 23.46 54.12AR 0.016 18.66 28.31 24.81 54.92 126.70 2.29 3.47 3.04 6.73 15.53CA 0.118 137.95 209.35 183.46 406.16 936.91 16.91 25.66 22.49 49.79 114.86CO 0.027 32.18 48.84 42.80 94.75 218.57 3.95 5.99 5.25 11.62 26.79DC 0.015 17.73 26.91 23.58 52.21 120.43 2.17 3.30 2.89 6.40 14.76FL 0.050 59.12 89.72 78.63 174.07 401.55 7.25 11.00 9.64 21.34 49.23GA 0.027 31.98 48.54 42.53 94.16 217.21 3.92 5.95 5.21 11.54 26.63HI 0.031 36.80 55.85 48.95 108.36 249.96 4.51 6.85 6.00 13.28 30.64IN 0.011 12.94 19.64 17.21 38.10 87.89 1.59 2.41 2.11 4.67 10.77KY 0.017 20.14 30.57 26.79 59.30 136.80 2.47 3.75 3.28 7.27 16.77LA 0.004 4.25 6.46 5.66 12.53 28.89 0.52 0.79 0.69 1.54 3.54ME 0.013 15.78 23.95 20.99 46.47 107.19 1.93 2.94 2.57 5.70 13.14MD 0.012 14.32 21.73 19.04 42.16 97.24 1.76 2.66 2.33 5.17 11.92MA 0.040 47.46 72.02 63.12 139.73 322.33 5.82 8.83 7.74 17.13 39.52MI 0.007 8.09 12.28 10.76 23.82 54.95 0.99 1.50 1.32 2.92 6.74MN 0.002 1.78 2.70 2.37 5.24 12.09 0.22 0.33 0.29 0.64 1.48MS 0.012 14.43 21.90 19.19 42.48 97.99 1.77 2.68 2.35 5.21 12.01MO 0.025 29.29 44.44 38.95 86.23 198.91 3.59 5.45 4.78 10.57 24.38MT 0.021 25.00 37.93 33.24 73.59 169.76 3.06 4.65 4.08 9.02 20.81NV 0.036 41.92 63.62 55.75 123.43 284.74 5.14 7.80 6.84 15.13 34.91NJ 0.032 37.41 56.76 49.75 110.13 254.04 4.59 6.96 6.10 13.50 31.14NM 0.003 3.00 4.55 3.99 8.83 20.37 0.37 0.56 0.49 1.08 2.50NY 0.045 52.91 80.30 70.37 155.78 359.36 6.49 9.84 8.63 19.10 44.05NC 0.042 49.77 75.52 66.18 146.52 337.99 6.10 9.26 8.11 17.96 41.43OH 0.020 23.63 35.86 31.43 69.58 160.51 2.90 4.40 3.85 8.53 19.68OK 0.008 9.12 13.84 12.13 26.85 61.93 1.12 1.70 1.49 3.29 7.59PA 0.051 59.80 90.75 79.53 176.07 406.14 7.33 11.12 9.75 21.59 49.79SC 0.006 6.49 9.84 8.63 19.10 44.06 0.80 1.21 1.06 2.34 5.40SD 0.022 25.50 38.70 33.92 75.09 173.21 3.13 4.74 4.16 9.21 21.23TN 0.031 36.70 55.69 48.80 108.04 249.23 4.50 6.83 5.98 13.25 30.55TX 0.027 32.17 48.82 42.79 94.72 218.51 3.94 5.98 5.25 11.61 26.79UT 0.046 53.83 81.68 71.58 158.48 365.57 6.60 10.01 8.78 19.43 44.82VA 0.044 51.65 78.38 68.68 152.06 350.76 6.33 9.61 8.42 18.64 43.00WA 0.034 39.94 60.61 53.12 117.59 271.26 4.90 7.43 6.51 14.42 33.25WV 0.007 8.23 12.49 10.95 24.24 55.92 1.01 1.53 1.34 2.97 6.85WY 0.029 34.57 52.46 45.97 101.78 234.79 4.24 6.43 5.64 12.48 28.78Total 1.000 1173.28 1780.52 1560.34 3454.41 7968.55 143.84 218.23 191.29 423.50 976.87
*In the cases where one national park is located in two or more states, the number of diverted visitors is allocated to eastate according to the total proportions in each state
34

Appendix Table 15. Definitions of USC Two-Digit Sectors Classification USC Description SCTG NAICS
USC01 (1+5) 11,31 Live animals and live fish & Meat, fish, seafood, and their preparations USC02 Cereal grains & Other agricultural products except for Animal Feed (2+3) 11,31 USC03 Animal feed and products of animal origin, n.e.c. 4 11,31 USC04 Milled grain products and preparations, and bakery products 6 31 USC05 Other prepared foodstuffs and fats and oils 7 11,31 USC06 Alcoholic beverages 8 31,32 USC07 Tobacco products 9 11,31
Nonmetallic minerals (Monumental or building stone, Natural sands, Gravel and crushed stone, n.e.c.) USC08 (10~13) 21,32
USC09 Metallic ores and concentrates 14 21,32 USC10 Coal and petroleum products (Coal and Fuel oils, n.e.c.) (15~19) 21,32 USC11 Basic chemicals 20 32 USC12 Pharmaceutical products 21 32,33 USC13 Fertilizers 22 32 USC14 Chemical products and preparations, n.e.c. 23 31,32 USC15 Plastics and rubber 24 31,32,33 USC16 Logs and other wood in the rough & Wood products (25+26) 11,32
Commodity Sectors
USC17 Pulp, newsprint, paper, and paperboard & Paper or paperboard articles (27+28) 32 USC18 Printed products 29 32,51 USC19 Textiles, leather, and articles of textiles or leather 30 11,31,32,33 USC20 Nonmetallic mineral products 31 32,33 USC21 Base metal in primary or semi-finished forms and in finished basic shapes 32 33 USC22 Articles of base metal 33 33 USC23 Machinery 34 32,33 USC24 Electronic and other electrical equipment and components, and office equipment 35 32,33,51 USC25 Motorized and other vehicles (including parts) 36 32,33 USC26 Transportation equipment, n.e.c. 37 33 USC27 Precision instruments and apparatus 38 33
Furniture, mattresses and mattress supports, lamps, lighting fittings, and illuminated signs USC28 39 33
USC29 Miscellaneous manufactured products, Scrap, Mixed freight, and Commodity unknown (40~99) 11,31,32,33 USC30 Utility 22 USC31 23 Construction
USC32 42 Wholesale Trade
USC33 48 Transportation
USC34 49 Postal and Warehousing
USC35 (44+45) Retail Trade
USC36 (515~519) Broadcasting and information services*
USC37 Finance and Insurance 52 USC38 Real estate and rental and leasing 53 USC39 Professional, Scientific, and Technical services 54
Non-Commodity
(Service) USC40 Management of companies and enterprises 55 Sectors USC41 56 Administrative support and waste management
USC42 61 Education Services
USC43 62 Health Care and Social Assistances
USC44 71 Arts, Entertainment, and Recreation
USC45 72 Accommodation and Food services
USC46 92 Public administration
USC47 81 Other services except public administration**
*Publishing, Motion pictures, and Recording (IMPLAN 413-415, 417-419, or NAICS 511~512) are excluded in this sector and included in the commodity sectors **USC47 includes NAICS 81 plus Support activities (18=Agriculture and forestry, 27-29=Mining) and etc. (243=Machine shops) in IMPLAN
35

Appendix Table 16. Visitors to Selected National Parks (million, 2004) Park State Visitors
Gateway NRA New York 6.58 Lake Mead NRA Nevada 5.86 Great Smoky Mountains NP Tennessee 5.13 Grand Canyon NP Arizona 4.33 Cape Cod NS Massachusetts 4.11 Independence NHP Pennsylvania 4.09 San Francisco Maritime NHP California 4.06 Great Smoky Mountains NP North Carolina 4.03 Delaware Water Gap NRA New Jersey 3.59 Colonial NHP Virginia 3.33 Cuyahoga Valley NP Ohio 3.31 Yosemite NP California 3.28 Gulf Islands NS Florida 3.18 Olympic NP Washington 3.07 Rocky Mountain NP Colorado 2.78 Jefferson NEM Missouri 2.78 Zion NP Utah 2.68 Chattahoochee River NRA Georgia 2.67 Chesapeake & Ohio Canal NHP District of Columbia 2.48 Grand Teton NP Wyoming 2.36 Cape Hatteras NS North Carolina 2.21 Acadia NP Maine 2.21 Mount Rushmore NMEM South Dakota 2.04 Glacier NP Montana 2.03 Point Reyes NS California 1.96 Lake Mead NRA Arizona 1.95 Mammoth Cave NP Kentucky 1.89 Indiana Dunes NL Indiana 1.81 Gettysburg NMP Pennsylvania 1.72 Glen Canyon NRA Utah 1.69 Fort Point NHS California 1.66 Gateway NRA New Jersey 1.65 USS Arizona MEM Hawaii 1.57 Delaware Water Gap NRA Pennsylvania 1.47 Yellowstone NP Montana 1.46 Haleakala NP Hawaii 1.46 Amistad NRA Texas 1.45 Hot Springs NP Arkansas 1.42 Yellowstone NP Wyoming 1.41 Assateague Island NS Virginia 1.37 Ozark NSR Missouri 1.32 Hawaii Volcanoes NP Hawaii 1.31 Lake Roosevelt NRA Washington 1.28 Chickasaw NRA Oklahoma 1.28 Shenandoah NP Virginia 1.26 Joshua Tree NP California 1.24 Kennesaw Mountain NBP Georgia 1.22 Mount Rainier NP Washington 1.22 Buffalo NR Arkansas 1.19 Everglades NP Florida 1.18
36

Appendix Table 16 (continued). Visitors to Selected National Parks (million, 2004) Park State Visitors
New River Gorge NR West Virginia 1.15 Sleeping Bear Dunes NL Michigan 1.11 San Antonio Missions NHP Texas 1.10 Valley Forge NHP Pennsylvania 1.09 San Juan NHS Puerto Rico 1.07 Minute Man NHP Massachusetts 1.07 John D. Rockefeller, Jr. MEM PKWY Wyoming 1.07 Gulf Islands NS Mississippi 1.06 Canaveral NS Florida 1.05 Curecanti NRA Colorado 1.01 Sequoia NP California 1.00 Bryce Canyon NP Utah 0.99 Vicksburg NMP Mississippi 0.96 Badlands NP South Dakota 0.94 Canyon de Chelly NM Arizona 0.94 Cumberland Gap NHP Kentucky 0.93 Fort Matanzas NM Florida 0.92 Cabrillo NM California 0.90 Klondike Gold Rush NHP Alaska Alaska 0.84 Pu'uhonua O Honaunau NHP Hawaii 0.82 Fire Island NS New York 0.82 Salem Maritime NHS Massachusetts 0.78 Fort Sumter NM South Carolina 0.78 Muir Woods NM California 0.78 Lake Meredith NRA Texas 0.77 Death Valley NP California 0.76 Timucuan EHP Florida 0.75 Whiskeytown NRA California 0.75 Arches NP Utah 0.73 Manassas NBP Virginia 0.72 Cape Lookout NS North Carolina 0.72 Catoctin Mountain Park Maryland 0.70 Lowell NHP Massachusetts 0.68 Assateague Island NS Maryland 0.68 Saguaro NP Arizona 0.65 Montezuma Castle NM Arizona 0.64 Padre Island NS Texas 0.64 Castillo de San Marcos NM Florida 0.64 Fort McHenry NM Maryland 0.63 Jean Lafitte NHP & PRES Louisiana 0.60 Wind Cave NP South Dakota 0.59 Martin Luther King, Jr. NHS Georgia 0.58 Petrified Forest NP Arizona 0.58 Capitol Reef NP Utah 0.55 Mojave NPRES California 0.55 Wolf Trap NP for the Performing Arts Virginia 0.54 Channel Islands NP California 0.54 Santa Monica Mountains NRA California 0.53 Kings Canyon NP California 0.53 Cedar Breaks NM Utah 0.52
37

Appendix Table 16 Continued: Visitors for Selected National Park (Million, 2004) Park State Visitors
Biscayne NP Florida 0.48 Mesa Verde NP Colorado 0.45 Carlsbad Caverns NP New Mexico 0.42 Denali NP Alaska 0.40 Redwood NP California 0.39 Lassen Volcanic NP California 0.38 Canyonlands NP Utah 0.37 Big Bend NP Texas 0.36 Glacier Bay NP & PRES Alaska 0.35 Great Sand Dunes NP & PRES Colorado 0.27 Voyageurs NP Minnesota 0.25 Kenai Fjords NP Alaska 0.24 Guadalupe Mountains NP Texas 0.18 Congaree NP South Carolina 0.13 Dry Tortugas NP Florida 0.07 Katmai NP Alaska 0.06 Isle Royale NP Michigan 0.02 North Cascades NP Washington 0.02 Gates of the Arctic NP & PRES Alaska 0.01 Lake Clark NP Alaska 0.00 Kobuk Valley NP Alaska 0.00 Total 165.21
Source: Summary Report, Public Use Statistics Office, National Park Service, US Department of the Interior, 2005
38