Embed Size (px)
Citation preview

lable at ScienceDirect
Polymer 50 (2009) 4066–4079
Contents lists avai
Polymer
journal homepage: www.elsevier .com/locate/polymer
Toughening of unmodified polyvinylchloride through the additionof nanoparticulate calcium carbonate
I. Kemal a,b, A. Whittle c, R. Burford b, T. Vodenitcharova a, M. Hoffman a,*
a School of Materials Science and Engineering, University of New South Wales, Sydney, NSW 2052, Australiab School of Chemical Sciences and Engineering, University of New South Wales, Sydney, NSW 2052, Australiac IPLEX Pipelines Australia Pty Ltd., 35 Alfred Road, Chipping Norton, NSW 2170, Australia
a r t i c l e i n f o
Article history:Received 29 March 2009Received in revised form14 June 2009Accepted 15 June 2009Available online 21 June 2009
Keywords:PVC nanocompositeFracture toughnessFinite element analysis
* Corresponding author. Tel.: þ61 2 9385 4432; faxE-mail address: [email protected] (M. Hoff
0032-3861/$ – see front matter � 2009 Elsevier Ltd.doi:10.1016/j.polymer.2009.06.028
a b s t r a c t
PVC/CaCO3 polymer nanocomposites of differing compositions were produced using a two-roll mill andcompression molding. The morphology was observed using transmission electron microscopy, and thestatic and dynamic mechanical and fracture properties determined. The presence of nanometer-sizedCaCO3 particles led to a slight decrease in the tensile strength but improved the impact energy, the storagemodulus and the fracture toughness. Fracture surface examination by scanning electron microscopyindicated that the enhanced fracture properties in the nanocomposites were caused by the assisted voidformation at the particles. This hypothesis is supported by a microstructure-based finite element modelingbased upon elastic–plastic deformation around a weakly bonded particle. Hence, this provides an expla-nation of both the uniaxial tensile behavior and enhanced toughness of the nanocomposites.
� 2009 Elsevier Ltd. All rights reserved.
1. Introduction
The use of inorganic fillers has been practiced for many decadesin both elastomers and plastic materials. In regard to elastomers,the key aim is either to provide a major reinforcement, for examplein synthetic elastomers using carbon black and silica, or to cheapenthe compounds using clay and other materials [1].
For thermoplastics like PVC, the latter aim is often achieved byusing cheap fillers to stiffen the material or control the acousticproperties [2]. In engineering applications where a combination ofstiffness and toughness is desired, such as for PVC pipes, largequantities of inorganic fillers are usually avoided [3]. However,there is an increasing awareness of possibilities to simultaneouslyimprove a broad range of mechanical properties and reduce costsby incorporating nanometer-sized particles [4–7].
Conventionally, the toughness of rigid unplasticized PVC (u-PVC) can be improved by using an impact modifier of rubberyparticles, such as chlorinated polyethylene (CPE) or acrylonitrilebutadiene styrene (ABS) to make what is known as modified PVC(m-PVC). The increase in toughness can be attributed to cavityformation in the rubbery particles when stress is applied, thusdeforming the matrix through the formation of shear bands or
: þ61 2 9385 5956.man).
All rights reserved.
crazes which can absorb energy [8]. Despite excellent tougheningeffects, the presence of rubbery particles decreases the modulusand yield strength, and can increase cost.
Ground calcium carbonate of particle size greater than 1 mm isoften added to PVC compounds to reduce cost, but at the expense ofperformance through reduction in tensile and impact strength[2,9,10]. However, it has been found that the addition of nanometer-sized calcium carbonate (nano-CaCO3) significantly improves boththe toughness and stiffness of PVC, while having little effect on thetensile strength [11,12]. The recent development of techniques forcheap processing of nano-CaCO3 means that this new process haspotential applications in commodity applications of PVC such aspiping materials.
The question at hand, however, is to ascertain the mechanismwhereby nanoparticles lead to enhanced toughness. For a poly-mer matrix with rigid inorganic particles, an improvement inmodulus is expected according to conventional rules of mixing.On the other hand, toughening by micron-sized inorganicparticles can generally be explained by a crack pinning mecha-nism [13] and/or crack deflection theory [14]. However, theapplication of these theories to nanometer-sized particles doesnot predict a toughness enhancement in PVC as the nano-particles may be too small to effectively interact with thepropagating crack [15].
When designing both materials and components, it is necessaryto ascertain the true fracture toughness of a material. In the field ofplastics, toughness is often measured using Charpy and Izod impact

Fig. 1. (a) Schematic of the FE model assuming homogeneous particles’ distribution inthe matrix and (b) modeled structure following application of axisymmetricconstraints.
I. Kemal et al. / Polymer 50 (2009) 4066–4079 4067
tests due to their simplicity. However, the results of these testsdepend upon specimen geometry. Although, results are expressedas energy absorbed per unit area or energy absorbed per specimenwidth, they are known to vary non-proportionally with thesedimensions. Hence, impact toughness cannot be utilized as anintrinsic measure of a material property for use in component ormaterial design due to the size-dependent deformation processes[16]. However, a method for the determination of fracture tough-ness has been developed by Marshall et al. [16] and Brown [17],which measures the strain energy release rate Gc directly from theresults of impact tests on multiple specimens with different notchdepths. The method was further extended by Plati and Williams[18] who examined a range of plastic materials, including PVC. Thismethod was then adopted as part of a U.K. Water Industry speci-fication [19] and as an ESIS protocol [20] for polyethylene and PVCpipes. The critical strain energy release rate, Gc, test method hasbeen successfully used to measure the fracture toughness of bothu-PVC and m-PVC by Whittle et al. [21]. The Gc test has shown anincreasing fracture toughness with increasing CPE volume fractionin m-PVC. Typical fracture toughness values of 2.7 kJ/m2 for u-PVCand 4.9 kJ/m2 for m-PVC with 6 phr CPE were found under highloading rate conditions.
In this study, we seek to ascertain the deformation mechanismsassociated with the increase in toughness and stiffness as a result ofthe inclusion of inorganic nanoparticles in a PVC matrix. Consid-eration was also made of the effect of these deformation processesupon strength. The results obtained were compared with the use ofimpact modifiers for toughness enhancement. PVC nano-composites with differing nano-CaCO3 levels were processed bya melt blending method and the fracture toughness, dynamicmoduli and strength, obtained. Microstructures were determinedusing transmission electron microscopy and the extensive fracturesurface analysis utilized to elucidate the deformation mechanisms.A mechanistic deformation model was then constructed to explainthe effect of microstructure upon strength and fracture toughness.
2. Experimental procedures
2.1. Material processing
Commercial-grade raw materials consisting of PVC resins (K57,Australian Vinyls), Ca–Zn-based thermal stabilizers (CP 1009,Chemson Pacific) and lubricants (L4000, Chemson Pacific) werecombined with 3, 6, 9, 12 and 20 parts per hundred of resin (phr) byweight of nanoparticle calcium carbonate (NPCC, Singapore NanoMaterial Technology) in a dry blend. A monolithic sample containingno NPCC was also manufactured along with a reference m-PVC,which contains 6 phr of CPE rubbery particles. Dry powder blendswere produced in a 2-L Papenmeier mixer heated from roomtemperature to 120 �C over approximately 15 min followed by coolmixing at room temperature for 2 min. Dry blends were processedusing a two-roll mill operating at equal roll speeds and a temperatureof 160 �C. The resulting compounds were cooled and granulated intoflakes using a bench-top mechanical granulator. The flakes were thenmolded into rectangular sheets by compression molding at 185 �Cand 2 MPa pressure for 5 min using a Carver type press.
2.2. Microstructural characterisation
The calcium carbonate nanoparticle was characterized by TEMand the ImageJ analysis software (NIH freeware). The surface areawas calculated by BET surface area measurement technique, usingMicromeritics Tristar 3000 Analyser under a nitrogen environment.The particles were pretreated at 150 �C under vacuum to removemoistures prior to BET measurement.
The composite morphology was examined using a JEOL 1400TEM at an accelerating voltage of 75 kV. Samples were preparedusing a Reichert Jung ultra-microtome equipped with a diamondknife to cut films of 80–100 nm thickness at room temperature. Thecut sections were placed on a formvar-coated copper grid forobservation in the TEM. Fracture surface examination followingmechanical testing was undertaken using a JEOL S900 field emis-sion scanning electron microscope (FESEM). Samples were coatedwith chromium prior to observation. The crack process zone underthe impact fracture surface was also examined by FESEM. A cross-section perpendicular to the fracture plane was cut in the centrealong the notch. The surface was trimmed by ultra-microtome andcoated with chromium prior to observation by SEM.
2.3. Mechanical property testing
Six tensile dumbbell specimens conforming to type 1 ISOR527:1966 [22] of each composition were machined from eachcompression-molded slab using a pantograph cutting tool. To deter-mine the yield stress, tensile testing was carried out according toAS1145.1-2001 [23] using an Instron model 1185 universal tensiletesting machine at an extension rate of 10 mm/min. The gauge lengthextension was measured using a laser extensometer. Dynamicmechanical analysis (DMA) was undertaken from room temperatureto 135 �C using a TA Instruments DMA Q800, cycling at 5 mm ampli-tude and 1 Hz frequency. The samples (45 mm� 12 mm� 5 mm)were cut from the compression-molded slab. A three point bendingmode with a dual cantilever configuration was used.
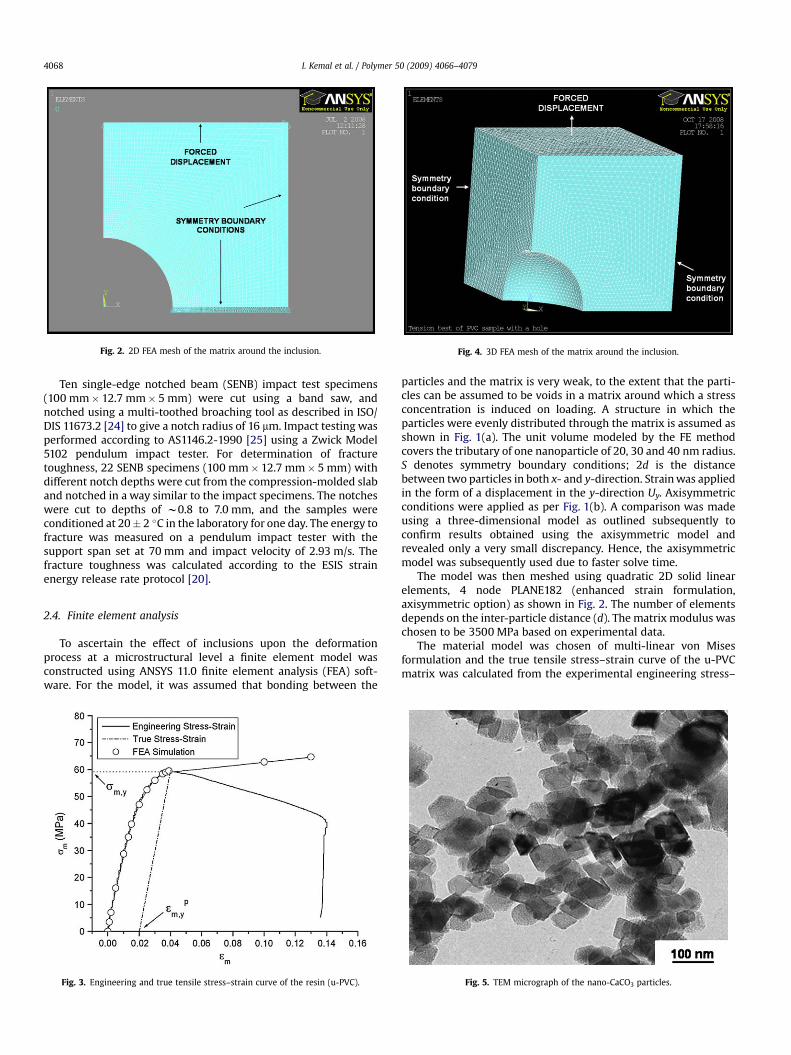
Fig. 4. 3D FEA mesh of the matrix around the inclusion.Fig. 2. 2D FEA mesh of the matrix around the inclusion.
I. Kemal et al. / Polymer 50 (2009) 4066–40794068
Ten single-edge notched beam (SENB) impact test specimens(100 mm� 12.7 mm� 5 mm) were cut using a band saw, andnotched using a multi-toothed broaching tool as described in ISO/DIS 11673.2 [24] to give a notch radius of 16 mm. Impact testing wasperformed according to AS1146.2-1990 [25] using a Zwick Model5102 pendulum impact tester. For determination of fracturetoughness, 22 SENB specimens (100 mm� 12.7 mm� 5 mm) withdifferent notch depths were cut from the compression-molded slaband notched in a way similar to the impact specimens. The notcheswere cut to depths of w0.8 to 7.0 mm, and the samples wereconditioned at 20� 2 �C in the laboratory for one day. The energy tofracture was measured on a pendulum impact tester with thesupport span set at 70 mm and impact velocity of 2.93 m/s. Thefracture toughness was calculated according to the ESIS strainenergy release rate protocol [20].
2.4. Finite element analysis
To ascertain the effect of inclusions upon the deformationprocess at a microstructural level a finite element model wasconstructed using ANSYS 11.0 finite element analysis (FEA) soft-ware. For the model, it was assumed that bonding between the
Fig. 3. Engineering and true tensile stress–strain curve of the resin (u-PVC).
particles and the matrix is very weak, to the extent that the parti-cles can be assumed to be voids in a matrix around which a stressconcentration is induced on loading. A structure in which theparticles were evenly distributed through the matrix is assumed asshown in Fig. 1(a). The unit volume modeled by the FE methodcovers the tributary of one nanoparticle of 20, 30 and 40 nm radius.S denotes symmetry boundary conditions; 2d is the distancebetween two particles in both x- and y-direction. Strain was appliedin the form of a displacement in the y-direction Uy. Axisymmetricconditions were applied as per Fig. 1(b). A comparison was madeusing a three-dimensional model as outlined subsequently toconfirm results obtained using the axisymmetric model andrevealed only a very small discrepancy. Hence, the axisymmetricmodel was subsequently used due to faster solve time.
The model was then meshed using quadratic 2D solid linearelements, 4 node PLANE182 (enhanced strain formulation,axisymmetric option) as shown in Fig. 2. The number of elementsdepends on the inter-particle distance (d). The matrix modulus waschosen to be 3500 MPa based on experimental data.
The material model was chosen of multi-linear von Misesformulation and the true tensile stress–strain curve of the u-PVCmatrix was calculated from the experimental engineering stress–
Fig. 5. TEM micrograph of the nano-CaCO3 particles.

I. Kemal et al. / Polymer 50 (2009) 4066–4079 4069
strain curve according to a method proposed by Du et al. [26] asshown in Fig. 3. From the stress–strain curve, the maximum stress(sm,y) was estimated to be 59.5 MPa, providing a 2% plastic strain(3m,y
p ). The von Mises failure criterion is applied in this study, suchthat the composites fail under applied load when the equivalentstress (sm
eqv) and equivalent plastic strain (3meqv,p) become equal to
the maximum stress (sm,y) and 2% plastic strain (3m,yp ), respectively.
The material model was introduced in the FEA software ina table format where the discrete values of stresses and strainsclosely follow the true stress–strain curve, represented by hollowcircles in Fig. 3.
To simulate the test conditions, a strain was applied in thepositive y-direction ð3c ¼ ðUy=dþ rpÞÞ and the applied stress sc
calculated as the reaction force along the x-axis (P) divided by thedimension dþ rp.
Fig. 6. TEM micrograph of PVC nanocomposite with (a) 3 phr, (b) 6 phr, (c) 9 phr, (d) 12 phr,20 phr nano-CaCO3.
For the yield criteria it is assumed that the composite will yieldwhen the matrix has yielded – i.e., the applied tension on thecomposite (sc) reaches the point of yield of the composite (sc,y)when the von Mises stress at any point in the matrix reaches theyield stress of the matrix (sm,y) or when the von Mises strain in thematrix becomes equal to the 2%.
The particle spacing (d) can be calculated based on the volumefractions (fp) and particles size (rp) as described by Equation (1)where k is a geometric constant representing the spatial arrange-ment of the particles in the matrix, i.e., k¼ 1 for simple cubic lattice,21/3 for body-centered lattice and 41/3 for face-centered lattice [27]:
d ¼ rp
"k
p
6fp
!1=3
�1
#(1)
(e) 20 phr NPCC, (f) higher magnification TEM micrograph of PVC nanocomposite with

Fig. 7. Histogram of the particle size distribution from the TEM micrograph.
I. Kemal et al. / Polymer 50 (2009) 4066–40794070
The effects of variation of particle spacing (d) and particle size onthe evolution of the plastic zone in the composites were alsostudied by FEA simulation. Nanoparticle radii of 20, 30 and 40 nmwere considered along with several values of d which correspond to3, 6, 9, 12 and 20 phr nanoparticle fraction for simple cubic, BCC andFCC configurations.
Large displacement solving was carried out and the resultsanalysed at each loading step. The loading step chosen wasDUy¼ 0.033 nm; however, it was halved at small values of d inorder to ensure convergence of the results. Plasticity was deemedto have been initiated when the von Mises stress in the matrixreached 59.5 MPa which first occurred adjacent to the nanoparticle.At higher loads, the distributions of the equivalent von Mises stressand strain were also analysed to ascertain the evolution of theshape and dimensions of the plastic zone.
The axisymmetric model considers that the matrix is ina cylindrical shape. A 3-dimensional FEA analysis where theparticle lies in the centre of a cubical shape matrix was made toverify this assumption: for the purpose, one quarter of the hole andone quarter of its tributary volume were modeled. Two FEA simu-lations of a cubical matrix of d¼ 50 nm and d¼ 23 nm with a holeof 30 nm radius in the centre were made to confirm that the stress–strain behavior is similar to the FEA modeling with axisymmetricconstraints. A free mesh of 3D solid linear elements, 8-node brickSOLID185 using enhanced strain formulation options was incor-porated with symmetry boundary conditions applied on all planesexcept that with an applied displacement as illustrated in Fig. 4. Thematerial model and the type of analysis match the conditions in the2D axisymmetric model explained above.
3. Results and discussion
3.1. Composite microstructure
Fig. 5 shows a TEM micrograph of the calcium carbonate nano-particles used to reinforce the PVC. The average particle size of thenano-CaCO3 was found to be 60� 20 nm. The sample was found tohave a surface area of 24 m2/g using BET, which, assuming a sphericalparticle and density of 2.65 g/cm3, gives an average particle size of47 nm.
Fig. 6(a) shows a TEM micrograph of the PVC matrix with 3 phrnano-CaCO3 where the filler appears to be distributed homoge-neously within the polymer. Particle dispersion has been achievedby high levels of shear produced in the two-roll mill. Fig. 6(b–e)shows that particle agglomeration increases with increasingconcentration of nano-CaCO3 up to 12 phr. There are no obvioussigns of delamination between the particle and matrix from thespecimen preparation process.
Particle agglomeration is analysed using image analysis andresults shown in Fig. 7. As all nano-CaCO3 particles have the same sizedistribution when added to the mixture and assuming that noreaction between them takes place during processing, larger particlesdetermined using image analysis are taken to be agglomerates. Thefraction of dispersed particles gradually decreased with increasingparticle volume fraction, showing increasing agglomeration.
Fig. 8. Effect of the nano-CaCO3 content on the tensile strength of PVCnanocomposites.
3.2. Mechanical properties
The addition of nanoparticles led to a slight decrease in thetensile strength (Fig. 8). It is believed that rigid inorganic particlesmay promote localized yielding of the polymer matrix leading tovoid coalescence and fracture. The effect of the volume fraction offiller particle (fp) upon yield stress sc,y of a particulate-filledcomposite has been explained by [28]:
sc;y ¼ sm;y
�1� fp
�exp
bfp
1þ 2:5fp(2)
where sm,y is the yield stress of the matrix, b is an interfacialparameter describing the interaction of the matrix and nano-particles, and was found to be 1.31 by fitting it to the experimentaldata. Similar results were reported by Sun et al. [29] who obtaineda value of b¼ 1.39 for PVC reinforced with 80 nm CaCO3 particles.The interfacial parameter b was found to increase with decreasingparticle size [29]. Similarly, in this study the average particle sizegenerally increases with volume fraction due to agglomeration and,thus, the composites with high particle volume fractions attend tolower b value which is represented by the lower tensile strength.
An alternative relationship commonly used for micron-sizedrigid particles is given as Equation (3) [30]. However, when this isapplied the correlation is poor, as shown in Fig. 8. Nakamura et al.[9] reported a slight decrease in tensile properties of PVCcomposites when reinforced with fine calcium carbonate particles

Fig. 11. Variation of storage modulus of PVC nanocomposites of different nano-CaCO3
content with temperature.Fig. 9. Effect of the nano-CaCO3 content on the strain at break of PVC nanocomposites.
I. Kemal et al. / Polymer 50 (2009) 4066–4079 4071
(diameters between 0.4 and 0.6 mm), whereas PVC compositesreinforced with larger calcium carbonate particles display a signif-icant decrease in tensile strength.
sc;y ¼ sm;y
�1� 1:21f2=3
p
�(3)
It is hypothesized that the nanoparticles promote better particle–matrix phase bonding compared with the micron-sized particlesdue to the larger surface area, thus higher stress is required to formcavities [9]. Despite the decrease in yield strength with increasingfiller loading, the yield stress of nanocomposites with 20 phr nano-CaCO3 is still higher than the yield stress of the m-PVC with 6 phrCPE.
Tensile strain at break gradually decreased with increasingnano-CaCO3 reinforcement, as shown in Fig. 9. Decrease in strain atbreak was also observed in PVC reinforced with micron-sizedCaCO3 particles [31] as the result of interfacial debonding. However,this contradicts the observation in recent work on PVC reinforcedwith nano-CaCO3 particles [11,12], in which significant increases in
Fig. 10. Effect of the nano-CaCO3 content on the Young’s modulus of PVCnanocomposites.
elongation at break was observed, which was attributed to ellip-soidal voids formation allowing ductile pull out [12]. This discrep-ancy may be attributed to different processing techniques andadditives used in their study which resulted in a more ductilematrix with lower strength, delaying void coalescence.
Tensile testing showed that the nanoparticles increased thecomposites’ stiffness as shown in Fig. 10. In addition, dynamicmechanical analysis (Fig. 11) also showed an increase in storagemodulus with increasing fraction of calcium carbonate nano-particulates below the glass transition temperature. Fig. 12 showsthat ambient storage modulus at 25 �C increased with nano-particulate fraction and was stiffer than monolithic PVC and m-PVC.A similar observation was made by Xie et al. [12] who recordeda stiffening effect due to the addition of nano-CaCO3 particles inPVC matrix.
The increase in both Storage and Young’s modulus, E, of thecomposite reinforced by the rigid inorganic particles can bedescribed by the iso-stress rule of mixtures:
Fig. 12. Effect of the nano-CaCO3 content on the storage modulus of PVC nano-composites at 25 �C.

Fig. 15. Selected experimental results of strain energy release rate test.
Fig. 13. Effect of the nano-CaCO3 content on the Charpy impact energy per unit area offracture surface of PVC nanocomposites.
Fig. 14. Effect of nano-CaCO3 content on the fracture toughness – expressed as strainenergy release rate – of PVC nanocomposites.
I. Kemal et al. / Polymer 50 (2009) 4066–40794072
E ¼
EpEm�1� fp
�Ep þ fpEm
!(4)
where f the volume fraction and the subscripts p and m signify theparticulate and matrix phases, respectively. Taking Ep¼ 179 GPa[32], and noting at Em¼ 3.56 GPa, the predicted value of Young’smodulus can be seen as the dashed line in Fig. 10. At higher volumefraction however, the increase in modulus exceeded that predictedby Equation (4). Differences between the predicted data andexperimental data that could be due to the rule of mixture, whichare more suitable for laminate structures than particulate-rein-forced composites, do not account for particle size distribution.Alternatively, Nielsen’s modified Kerner’s equation for composite’sYoung’s modulus accounts of the filler geometry and packingfraction as explained by [33,34]:
Ec ¼ Em
1þ ABfp
1� Bjfp
!(5)
where A is a constant dependent on the geometry of the filler phaseand the Poisson’s ratio of the matrix, B is a constant dependent onthe relative stiffness of the particulate filler and the matrix and j isdependent on the packing fraction of the filler. Taking Poisson’sratio of the matrix to be 0.4 [35], A is calculated to be 1.25 and B iscalculated to be close to 1 due to the high filler to matrix modulusratio. Taking a packing fraction of 0.37 [36] for random closepacking of the agglomerates, the value of the predicted moduluscan be seen as the dotted line in Fig. 10.
The discrepancy between the rule of mixture and Nielsen’smodified Kerner’s equation arises as the rule of mixtures do notconsider particle geometry, while generally the modulus increasesas the particle decreases [33]. On the other hand, Nielsen’s modifiedKerner’s equation considers individual particulate effect ratherthan the iso-stress conditions more appropriate to laminates.Furthermore, it takes into account the particle size distributionthrough the maximum packing fractions. When a packing fractionvalue of 0.37 for random close packing with agglomerates wasadopted, the predicted Young’s modulus data correlated well withthe experimental data (Fig. 10). This agrees also with particleagglomeration at higher particle fractions as observed in the TEMmicrographs (Fig. 6).
Charpy impact energy shows a 95% increase with the intro-duction of 20 phr nanoparticles (Fig. 13) compared with unmodi-fied PVC, and is higher than that of m-PVC. Similar results were alsoshown by Wu et al. [11]. Notably, the toughness enhancement ascompared with the monolith is greater than that which has beenachieved following the introduction of larger micron-sized CaCO3
particles in which the addition of 20 phr by weight of 3 mm CaCO3
into a rigid PVC pipe could achieve only a 53% increase in impacttoughness [2,37–39]. This will be discussed later.
The strain energy release rate or toughness (Gc) is ascertainedfrom the impact tests as described by the following equation [20]:
G ¼ Us
TW,
�dC
C da
�¼ Us
TWFðaÞ (6)
where W is the specimen width, T the specimen thickness and Us
the impact energy absorbed. The calibration factor, F(a) isa geometric term dependent upon compliance, C, and the ratio ofcrack length, over specimen width, a (¼a/W), and calculated usingthe method of Plati and Williams [18]. Plotting the energy lost bythe absorbed under impact loading, Us is divided by the cross-

Fig. 16. FESEM micrographs of the impact fracture surface of (a) u-PVC, PVC with: (b) 3 phr, (c) 6 phr, (d) 9 phr, (e) 12 phr and (f) 20 phr nano-CaCO3 content.
I. Kemal et al. / Polymer 50 (2009) 4066–4079 4073
sectional area of the specimen TW, versus the calibration factorF(a) producing a linear graph, the slope of which is Gc. The graph ofGc for increasing nanoparticle volume fractions is shown in Fig. 14.Equation (6) implies the line of best fit will pass through the origin,but there are other energy sinks – for example, the kinetic energyassociated with movement of the specimen. In this work, it has
been assumed all the other energy losses are constant and the lineof best fit is displaced vertically but otherwise unaltered. Selectedresults are shown in Fig. 15.
Fracture toughness (Gc), determined as described above,increased significantly with increasing fractions of nanoparticulateCaCO3 filler (Fig.14), from 2.89 kJ/m2 for monolithic PVC to 5.03 kJ/m2
Fig. 17. FESEM micrographs of the tensile fracture surface of (a) u-PVC, PVC with: (b) 3 phr, (c) 6 phr, (d) 9 phr, (e) 12 phr and (f) 20 phr nano-CaCO3 content.
I. Kemal et al. / Polymer 50 (2009) 4066–40794074
for PVC with 20 phr nano-CaCO3, slightly higher compare to m-PVC(4.79 kJ/m2). The increasing fracture toughness corresponds with theimpact test results shown in Fig. 13 but additionally provides a valueof toughness which may be used in design. This further indicates alsothat the presence of nano-CaCO3 particles can improve compositetoughness.
3.3. Fracture surface observations
Impact fracture surface images show that the addition ofnanoparticulate fillers alters the fracture behavior compared withunplasticized PVC (Fig. 16). While the latter shows a relativelysmooth brittle fracture surface (Fig. 16(a)), nano-CaCO3 particles

Fig. 18. FESEM micrographs of microtome cut cross-section of process zone of the impact fractured PVC nanocomposites with 9 phr nano-CaCO3 content at (a) low magnificationand (b) high magnification.
I. Kemal et al. / Polymer 50 (2009) 4066–4079 4075
can be clearly seen on the fracture surface of the composites(Fig. 16(b–f)) and appear, in many cases, to be clearly debondedfrom the matrix. No such separation at the particle–matrix inter-face is seen in microstructural observations of the composites priorto mechanical testing (Fig. 6) indicating that debonding hasoccurred during the mechanical loading process. The formation ofthese voids around the particles is a result of their stress-concen-trating effect. The scale and number of voids increased withnanofiller loading.
The fracture surface of unplasticized PVC following tensiletesting shows a fibrous surface and extensive ductile deformation(Fig. 17(a)) compared with the smooth impact fracture surface(Fig. 16(a)). The addition of nanoparticles changes the fracturesurface, with clearly observable cavities (Fig. 17(b–e)). The fibrousstructure and number of voids increased with nanofiller loadingwhich supports the proposal that cavity formation around thenanoparticles promotes yielding. This is consistent with theobservations of several other workers who observed a large plasticdeformation accompanied by a large number of voids on the frac-ture surface of PVC nanocomposites [11,12].
SEM analysis on the cross-section of a fracture surface showscavitation close to the crack flanks in the fracture process and wakezones with the extent of cavitation decreasing as one moves awayfrom the fracture plane (Fig. 18(a)). A higher magnification image ofthe near crack-tip plastic zone (Fig.18(b)) shows the presence of fillerparticles in each cavity. This further confirms a deformation mech-anism where cavitation occurs within the crack-tip process zone.
3.4. Finite element analysis
The purpose of the model is to explain the experimentally-observed effect of the addition of a nanoparticle phase uponmechanical behavior in terms of microstructural deformationprocesses. The contour plots of von Mises stress at different appliedtensile strains show that stress evolves as an elliptical shell aroundthe particles (Fig. 19(a–c)). Fig. 20(a–c) shows the contours of vonMises strain with shapes similar to the equivalent stress. Plasticdeformation is initiated at the side of the particles, and eventuallyencapsulated the whole particle as shown in Fig. 20.
Furthermore, the von Mises stress at the onset of plastic defor-mation in the matrix (at the edge of the particles) increases withthe normalized inter-particle distance (2d/rp) (Fig. 21). This implies
that the stress at the beginning of plasticity decreased withincreasing particle volume fractions, indicating that inter-particleproximity affects the stress field and therefore the yield point of thecomposite. This corresponds to the decrease of the experimentalvalue of tensile yield strength with increasing particle volumefraction and size and supports the hypothesis that weakly bondednanoparticles promote matrix yielding due to the enhanced cavityformation as seen in the tensile fracture surfaces in Fig. 17.
A 3-dimensional FEA analysis was also performed to ascertainthe compatibility between the axisymmetrical model, assuminga cylindrical matrix, and the cube-shaped matrix. Fig. 22 describesthe 3D contour plot of the von Mises equivalent stress (Fig. 22(a))and strain (Fig. 22(b)), for particles spacing d¼ 50 nm and particleradius of rp¼ 30 nm at 3c¼ 2% applied tensile strain. It is clear thatthe distribution of the equivalent stress is similar to the one in theaxisymmetric model, in which the high stress level is in an ellipticalshape around the particles and the low stress region is above theparticles. Fig. 22(a) also shows the area above the particles which isnot affected by the neighboring particles. This confirmed the val-idity of the axisymmetric constraint to model the stress–strainbehavior of the hole in the matrix.
From the stress–strain curve of the monolithic matrix (Fig. 3),the onset of plasticity occurs at a tensile stress of sm,y¼ 59.5 MPaand at a tensile strain of approximately 3m,y
p ¼ 2%. We then ascertainthe geometry of the plastic zone around the particles by consid-ering a contour plot of the von Mises equivalent strain – forexample, in Fig. 20(b–c), the grey area represents an equivalentplastic strain (3m
eqv,p) of greater than 2%. The dimensions of theelliptical plastic zone at applied tensile stress and strain ofsc¼ 102 MPa and 3c¼ 2%, respectively, are plotted in Fig. 23 fordifferent inter-particle distances where rh is the horizontal radiusand rv is the vertical radius of the ellipsoidal plastic zone. Fig. 23also shows that the ratio of the volume of the plastic zone(Vin¼ 4prh
2rv/3) over the volume of the particle (Vp¼ 4prp3/3) –
represented as Vin/Vp – increases with increasing 2d/rp. Theincrease in the plastic zone size with increasing inter-particlespacing (d) indicates that the particles proximity affects the plasticzone size by limiting its growth.
The variation of the particle radius rp for a certain volumefractions did not change the dimensions of the plastic zone withrespect to the particle radius (i.e., the ratio of rh/rp and rv/rp).However the plastic zone is significantly influenced by the inter-
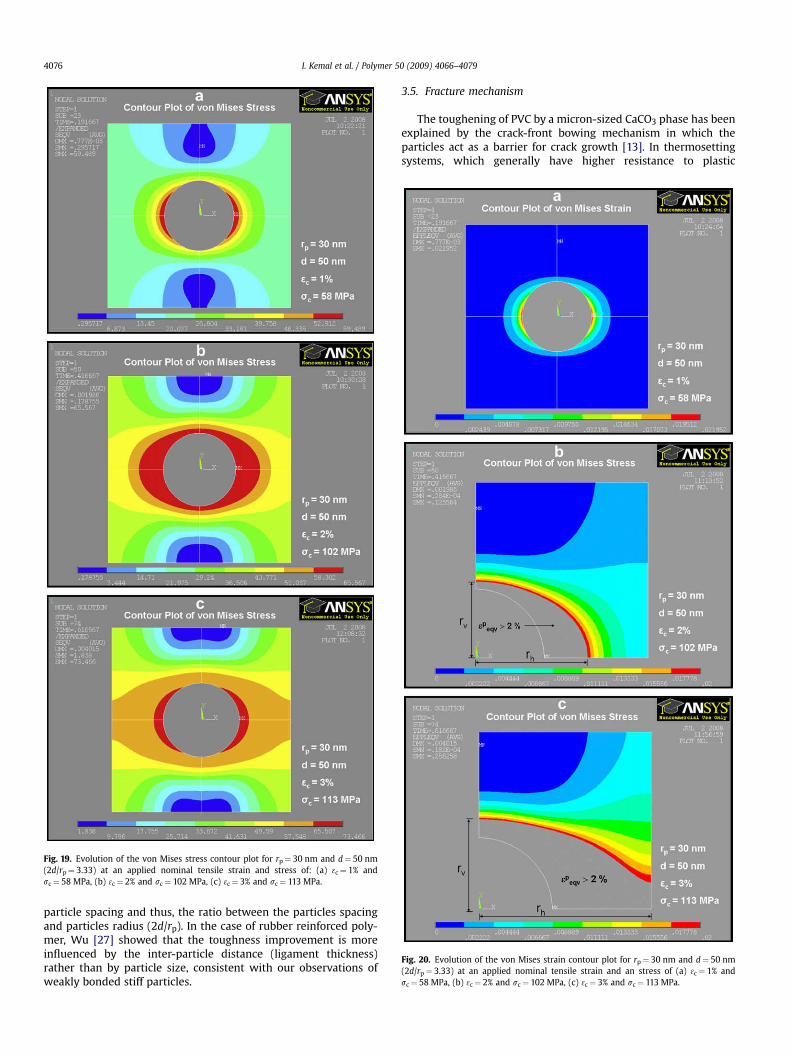
Fig. 19. Evolution of the von Mises stress contour plot for rp¼ 30 nm and d¼ 50 nm(2d/rp¼ 3.33) at an applied nominal tensile strain and stress of: (a) 3c¼ 1% andsc¼ 58 MPa, (b) 3c¼ 2% and sc¼ 102 MPa, (c) 3c¼ 3% and sc¼ 113 MPa.
Fig. 20. Evolution of the von Mises strain contour plot for rp¼ 30 nm and d¼ 50 nm(2d/rp¼ 3.33) at an applied nominal tensile strain and an stress of (a) 3c¼ 1% andsc¼ 58 MPa, (b) 3c¼ 2% and sc¼ 102 MPa, (c) 3c¼ 3% and sc¼ 113 MPa.
I. Kemal et al. / Polymer 50 (2009) 4066–40794076
particle spacing and thus, the ratio between the particles spacingand particles radius (2d/rp). In the case of rubber reinforced poly-mer, Wu [27] showed that the toughness improvement is moreinfluenced by the inter-particle distance (ligament thickness)rather than by particle size, consistent with our observations ofweakly bonded stiff particles.
3.5. Fracture mechanism
The toughening of PVC by a micron-sized CaCO3 phase has beenexplained by the crack-front bowing mechanism in which theparticles act as a barrier for crack growth [13]. In thermosettingsystems, which generally have higher resistance to plastic

Fig. 21. Variation of von Mises equivalent stress at the onset of plastic deformationaccording to FEA with normalized inter-particle distance.
Fig. 22. 3D contour plot of the von Mises equivalent (a) stress and (b) strain for FEAmodel of rp¼ 30 nm and d¼ 50 nm and at an applied nominal tensile strain and stressof 2% and 102 MPa, respectively. The contour plot of the von Mises stress (a) also showsthe area above the particle which is not affected by the neighboring particles, thusconfirming the validity of axisymmetric FEA model.
Fig. 23. Normalized plastic zone dimensions in horizontal (rh/rp) and vertical direction(rv/rp), and the corresponding volume of plastic deformation around the particles asa function of normalized inter-particle distance (2d/rp) measured at sc¼ 101.86 MPaand 3c¼ 2%.
I. Kemal et al. / Polymer 50 (2009) 4066–4079 4077
deformation, SEM micrographs have shown the possibility of crackpinning by rigid nano-sized particles [40]; but this is not observedin thermoplastics such as PVC. Instead, observations of the fracturesurface and crack process zone indicate that in the case of nano-meter-sized inclusions, the filler particles act as nucleation sites forcavitation. This cavitation precipitates localized plastic deformationthrough the release of mechanical plastic constraint [11] increasingthe size of the crack-tip process zone and, thus, the work requiredfor crack propagation.
A further difference between micron- and nanometer-sizedfillers is that the former are sufficiently large to initiate Griffith-type cracking whereas the latter are comparable in size withpolymer substructures in PVC [41] and, therefore, promote plasticdeformation rather than initiate fracture.
The overall increase in toughness depends on the size of theprocess zone and the number of debonded particles, which can becalculated based on the height of the process zone (h), particlevolume fraction (fp) and particle radius (rp). Thus, the number ofparticles debonded per unit area (Np) is the product of the span ofprocess zone, both above and below the fracture plane (2h), andthe volume fraction of the particles, divided by the particlevolume. The height of the process zone itself can be measured orcalculated by an Irwin approach. Thus the number of particlesdebonded per unit area (assuming unit thickness) can be ex-pressed as [42]:
Np ¼3hfp
2pr3p
(7)
The energy needed to break the particle–matrix bond willcontribute to the overall increase in toughness, and the interfacialfracture energy per unit area is estimated using [42,43]:
Gic;i ¼3s2
maxrp
4pEm(8)
where Em is the matrix modulus and rp is the particle radius. smax isthe debonding strength which is set to be the strength at whichinelastic deformation was initiated according to the tensile testcurve [43], i.e., the yield point of the PVC matrix which occur at3m,y
p ¼ 2% plastic strain (Fig. 3).

References
Sc
–64Phys
–52
500.(19)
blue
torsites
–40
s o
nce
.
New
4(1):
16F):
[1] Voet A. J Polym Sci Part D Macromol Rev 1980;15(1):327–73.[2] Katz HS, Milewski JV. Handbook of fillers for plastics. Springer; 1987.[3] Titow WV. PVC technology. 4th ed.; 1984.[4] Sumita M, Tsukihi H, Miyasaka K, Ishikawa K. J Appl Polym
1984;29(5):1523–30.[5] Sumita M, Tsukumo Y, Miyasaka K, Ishikawa K. J Mater Sci 1983;18(6):1758[6] Sumita M, Shizuma T, Miyasaka K, Ishikawa K. J Macromol Sci Part B
1983;22(4):601–18.[7] Jiang L, Lam YC, Tam KC, Chua TH, Sim GW, Ang LS. Polymer 2005;46(1):243[8] Bucknall CB, Paul DR. Polymer blends. John Wiley & Sons; 2000.[9] Nakamura Y, Fukuoka Y, Iida T. J Appl Polym Sci 1998;70:311–6.
[10] Mishra S, Perumal GB, Naik JB. Polym Plast Technol Eng 1997;36(4):489–[11] Wu DZ, Wang XD, Song YZ, Jin RG. J Appl Polym Sci 2004;92(4):2714–23[12] Xie XL, Liu QX, Li RKY, Zhou XP, Zhang QX, Yu ZZ, et al. Polymer 2004;45
6665–73.[13] Lange FF, Radford KC. J Mater Sci 1971;6(9):1197–203.[14] Faber KT, Evans AG. Acta Metall 1983;31:565–76.[15] Cotterell B, Chia JYH, Hbaieb K. Eng Fract Mech 2007;74(7):1054–78.[16] Marshall GP, Williams JG, Turner CE. J Mater Sci 1973;8(7):949–56.[17] Brown HR. J Mater Sci 1973;8(7):941–8.[18] Plati E, Williams JG. Polym Eng Sci 1975;15(6):470–7.[19] WRc water industry specification no. 4-31-06 issue 1: specification for
unplasticised PVC pressure pipes ijap-fbfcpwuu.[20] Pavan A. ESIS publication 28. In: Moore DR, Pavan A, Williams JG, edi
Fracture mechanics testing methods for polymer adhesives and composAmsterdam: Elsevier Science; 2001.
[21] Whittle AJ, Burford RP, Hoffman MJ. Plast Rubber Compos 2001;30(9):434[22] ISO R527:1966, Plastic – determination of tensile properties.[23] AS1145.1-2001, Determination of tensile properties of plastic materials.[24] ISO/DIS 11673.2:1999. Determination of the fracture toughness propertie
unplasticized poly(vinyl chloride) (PVC-U) pipes; 1999.[25] AS1146.2-1990, Methods for impact tests on plastics – Charpy impact resista
i
.
.
.
:
.
.
.
f
.
[26] Du XW, Sun G, Nie C. Key Eng Mater 2004;274:1077–82.[27] Wu S. J Appl Polym Sci 1988;35(2):549–61.[28] Voros G, Fekete E, Pukanszky B. J Adhes 1997;64(1):229–50.[29] Sun S, Li C, Zhang L, Du HL, Burnell-Gray JS. Polym Int 2006;55:158–64[30] Nicolais LNM. Polym Eng Sci 1971;11(3).[31] Nakamura Y, Azuma F, Iida T. Polym Polym Compos 1998;6(1):7–13.[32] Kelly A, Zweben C. Comprehensive composite materials. Amsterdam;
York: Elsevier; 2000.[33] Lewis T, Nielsen L. J Appl Polym Sci 1970;14:1449–71.[34] Nielsen LE. J Polym Sci Part B Polym Phys 1979;17(11):1897–901.[35] Erhard G. Designing with plastics. Hanser Publishers; 2006.[36] Vassileva E, Friedrich K. J Appl Polym Sci 2003;89(14):3774–85.[37] Zuiderduin WCJ, Westzaan C, Huetink J, Gaymans RJ. Polymer 2003;4
261–75.[38] Lee J, Yee AF. Polymer 2001;42(2):577–88.[39] Lee J, Yee AF. Polymer 2001;42(2):589–97.[40] Wetzel B, Rosso P, Haupert F, Friedrich K. Eng Fract Mech 2006;73(
2375–98.[41] Burgess RH. Manufacture and processing of PVC. UK: Spon E&FN; 1982.[42] Gent AN. J Mater Sci 1980;15(11):2884–8.[43] Norman DA, Robertson RE. Polymer 2003;44(8):2351–62.

![Polyvinylchloride-Single-WalledCarbonNanotubeComposites ...site.icce-nano.org/Clients/iccenanoorg/hui pub/2012 polyvinylchloride... · insulating capabilities [24]. The use of SWNTs](https://img.dokumen.tips/doc/110x75/5f0246257e708231d4037284/polyvinylchloride-single-walledcarbonnanotubecomposites-siteicce-nanoorgclientsiccenanoorghui.jpg)