Embed Size (px)
Citation preview

Warwick Economics Research Papers
ISSN 2059-4283 (online)
ISSN 0083-7350 (print)
Tough on young offenders : harmful orhelpful?
Giulia Lotti
July 2016 No: 1126

1
Tough on young offenders: harmful or helpful?
Giulia Lotti*
ABSTRACT
How harshly should society punish young lawbreakers in order to prevent or reduce their
criminal activity in the future? Through a fuzzy regression discontinuity design, we shed light
on the question by exploiting two quasi-natural experiments stemming to compare outcomes
from relatively harsh or rehabilitative criminal incarceration practices involving young
offenders in the 1980’s in England and Wales. According to our local linear regression
estimates, young offenders exposed to the harsher youth facilities are 20.7 percent more
likely to recidivate in the nine years subsequent to their custody, and they commit on average
2.84 offences more than offenders who experienced prison. Moreover, they are more likely to
commit violent offences, thefts, burglaries and robberies. On the contrary, offenders who
were sent to the more rehabilitative youth facilities are less likely to reoffend in the future
when compared to offenders sent to prison. We conclude that it is effective to keep young
offenders separate from their older peers in prison, but only when they are held in institutions
that are not solely focused on punishment.
JEL Codes: K42, Z13
Keywords: young offenders; recidivism; custodial sentence; crime; deterrence effects.
*Inter-American Development Bank; [email protected]. I thank particularly Fabian Waldinger and
Sascha O. Becker for their constant guidance in this project. I thank Clément de Chaisemartin, Mirko
Draca, Victor Lavy, Rocco Macchiavello, Roland Rathelot, Marian Vidal-Fernandez, Chris Woodruff
and seminar participants at the Warwick CAGE work in progress seminars, the Warwick PhD
Conference, the Scottish Economic Society Conference and the Spring Meeting of Young Economists
for useful comments. I am also indebted to Stephen Machin and Robin Naylor for their helpful
suggestions. I gratefully acknowledge the financial support of the Royal Economic Society (RES) and
I thank the Research, Development and Statistics Directorate of the UK Home Office for providing the
data.

2
1. Introduction
How tough societies should be on young criminal offenders has always been at the centre of a
heated debate in history. Currently the answer is still unknown, and the evidence mixed.
On the one hand, tough policies and harsh sentences may have a general deterrence
effect by discouraging people from embarking on criminal activity. Severe punishment could
also have a specific deterrence effect by discouraging people who have already undertaken
criminal activity from committing new crimes in the future (Galbiati et al. 2014).2
On the other hand, severe punishment may have instead a negative effect on offenders
who are incarcerated, weakening their already fragile links with society, nourishing negative
networks, and, as a result, increasing the likelihood of future criminal activity. Furthermore,
keeping offenders in custody is expensive for society. In England and Wales for example,
“the average annual overall cost of a prison place is now £36,259”, but “46% of adults are
reconvicted within one year of release” (Bromley Briefings, 2016). Hence, looking for ways
in which taxpayers’ resources can be spent effectively is important.
Because the subject is difficult to study, and quality evaluations are few, supporters
and opponents of tough policies have often based their stances on differing views and
personal opinions rather than on empirical, causal evidence.
In this paper we investigate the outcomes of two quasi-natural experiments in
incarceration practices that occurred in the 1980’s in England and Wales. At the beginning of
the decade, offenders younger than 21 who were given a custodial sentence were sent to
youth custody and detention centres. At the time, youth custody centres and detention centres
in Britain were managed as more punitive facilities than previously had been the case, and,
thus, young offenders held there experienced a tougher regime than had been usual. Towards
the end of the decade, these tough regimes were abolished and turned into young offender
2 The idea that punishment could have a deterrence effect is not recent, but goes back at least to the
18th century, with Beccaria (1764) and Jeremy Bentham (1789). In the 20th century Nobel laureate
Gary Becker was the first economist to incorporate deterrence theory into a model of criminal
behaviour. In Crime and Punishment: An Economic Approach (1968) he described individuals as
rational actors choosing whether to commit crime through a comparison of benefits and costs; if the
expected costs exceed the expected benefits, the offence will not be pursued. Measures that increase
the expected costs, such as harsh punishment, will deter potential criminals from offending.

3
institutions more oriented towards rehabilitation. This change allows us to evaluate the
outcomes for young offenders under distinct scenarios, in which offenders experience
incarceration in settings that are more punitive or more rehabilitative in nature.
To undertake the analysis, we first consider a sample of young offenders who
appeared in court when 20/21 years old and were given a custodial sentence at the beginning
of the decade, when these tough regimes were in place. Our first sample includes all the
offenders in England and Wales who were born in three randomly sampled weeks in 1963. In
total they are 558 young offenders. We observe their criminal records until they are 30 years
old. Through a fuzzy regression discontinuity design, we exploit the fact that young offenders
who appeared in court when below 21 years old were sent to youth custody centres and
detention centres, while young offenders who were 21 or older were sent to prison.
Everything else being equal, the only reason why offenders were sent to one of the two
different types of custody was the age at court appearance. To capture the effects of the
different custodial treatments we exploit the plausibly exogenous variation in the age at
which offenders appeared in court which, in turn, determined the type of custody the offender
was sentenced to. We compare the future offences of these two groups and find that young
offenders who were exposed to the harsher youth facilities are 20.7 percent more likely to
recidivate in the nine years subsequent to their custody, they commit on average 2.84
offences more than offenders who experienced prison, and they are also brought to court on
average 1.39 times more. The crimes committed by young offenders who were exposed to a
harsher regime also appear to be more serious, as suggested by the fact that in the future they
are sentenced more often to prison (even though the effect is not significantly different from
zero). Moreover, their felonies are not minor, but major crimes, such as violent offences,
thefts, burglaries and robberies.
Second, we analyse a cohort of young offenders who appeared in court when 20/21 at
the end of the decade. This sample is formed by all the offenders born in four randomly
sampled weeks in 1968. In this second group there are 297 young offenders. However, we
can observe their future offences only for 2.5 years after their release from custody. Through

4
a second fuzzy regression discontinuity design, we exploit the fact that young offenders who
appeared in court when younger than 21 were sent to the new young offender institutions,
while young offenders who were 21 or older were sent to adults’ prisons. Once again, the
choice of sentencing offenders to one of the two types of custody depended only on their age
at court appearance. Thanks to the plausibly exogenous random variation in the age at court
appearance we also compare the future outcomes of these two groups. We find that offenders
who were sent to the more rehabilitative youth facilities are less likely to reoffend in the
future when compared to offenders sent to prison, they commit fewer offences, and they are
less likely to be brought to court over a 2.5-year time period, even though all of these effects
are not significantly different from zero. Moreover, offenders experiencing the rehabilitative
regime are sentenced to custody again 1.28 times less than offenders experiencing prison
(significant at 5%), and they are significantly less likely to commit burglaries and robberies.
While prisons do not change much across the decade, the regimes in the youth
custody facilities do. This setup allows us to compare the effects of experiencing a
milder/harsher custody on recidivism. We conclude that keeping young offenders separate
from their older peers in prison is beneficial only if they are not kept in a solely punitive
regime.
Our strategy relies on the exogenous variation in the offenders’ age at court
appearance, which guarantees for the continuity of the conditional expectation of
counterfactual outcomes. The ability of agents (offenders, judges, police force) to partially or
completely manipulate the age at court appearance would invalidate our identification
strategy. If this was the case, we would observe a discontinuity in the density function of the
age at court appearance around the threshold. We perform a McCrary test and show that there
is no evidence of a discontinuity in the running variable (age at court appearance) around the
cut-off in neither of the two cohorts.
Our results are robust to a series of other checks: different estimation techniques
(parametric and non-parametric); adding control variables in the estimation; adopting
different bandwidths, samples and time windows; testing for discontinuities around the cut-

5
off in pre-treatment variables; testing for discontinuities at points different from the cut-off in
the running variable.
The remainder of the paper is organized as follows: in Section 2 we discuss the most
relevant empirical literature related to the effects of detention on criminal re-offending. In
Section 3 we outline the background of the quasi-natural experiment and the design. In
Section 4 we describe the data. In Section 5 we present the empirical strategy and the results.
In Section 6 we conduct some robustness checks and in Section 7 we conclude.
2. Literature Review
The empirical literature on the general and specific deterrent effects is still scarce (Galbiati
and Drago, 2014). The main reason for this research gap is the difficulty in identifying a
causal link between custody conditions and crime rates. In most cases, self-selection impedes
establishing connections that are anything more meaningful than correlations: the most
dangerous criminals are both more likely to be sentenced to harsher custody conditions and to
reoffend in the future precisely because they are intrinsically more prone to criminal activity.
Therefore, whether higher reoffending rates are driven by harsher custody conditions or by
the offenders’ higher propensity to recidivate cannot be distinguished.
The difficulty of identification is exacerbated by the challenges in gaining access to
data on offenders at the micro level that are necessary to isolate a specific deterrence effect,
and to determine the causal link between the harsh conditions of a custodial system and the
offenders’ propensity to be reconvicted. Moreover, the time span over which offenders are
observed is usually short.
The findings from the literature so far are mixed. Among those who find evidence of
deterrent effects, Katz, Levitt and Shustorovich (2003) use aggregate data on prison death
rates (per state per year) as a proxy for prison conditions, providing evidence of a general
deterrence effect; they find a negative relationship between death rates among prisoners and
violent and property crime rates in the United States between 1950 and 1990. However, the
effect they report is very small (they find elasticities smaller than 0.05). Hjalmarsson (2009)

6
finds evidence of a specific deterrence effect in examining juveniles (16 years old on
average) sentenced to custody in juvenile residential facilities in the State of Washington.
Exploiting the discontinuities in punishment in juvenile sentencing, he finds that after 1.5
years incarcerated offenders are 13 percent less likely to reoffend than offenders who were
not incarcerated. However, the study only examined juvenile residential facilities in the
State of Washington, and, as a result, the author points out that “it is certainly feasible that
incarceration has an exacerbating effect in states other than Washington, which have, for
instance, worse prison conditions or educational programs” (Hjalmarsson, 2009). Lee and
McCrary (2009) analyse arrests in Florida and take advantage of the more punitive sanctions
for offenders who turn 18. They also find support for a specific deterrence effect, but a very
small one: when offenders turn 18 and the punishment is harsher (as measured by a higher-
than-expected sentence length), crime rates decline by 2 percent.
Another stream of researchers finds the opposite - showing no evidence of either
general or specific deterrent effects stemming from harsh treatment - with some cases in
literature concluding that harsh treatment increases the likelihood of recidivism, or that more
rehabilitative facilities show deterrent effects. Aizer and Doyle (2015) look at a slightly
younger population: juvenile offenders, ages 10 to 16. They use randomly assigned judges as
an instrumental variable to show that offenders who have been incarcerated are more likely to
recidivate over a 10-year period. Chen and Shapiro (2007) also find no deterrent effect of a
harsher punishment. They observe 949 inmates for three years after release. Exploiting the
discontinuities in the assignment rules of prisoners to security levels, they estimate that the
offenders incarcerated in higher security prisons are no less prone to being rearrested than
offenders in minimum security facilities. Drago and Galbiati (2011) employ the variation in
the prison assignment to evaluate the impact of prison harshness (as measured by prison
overcrowding and prisoner death rates), and the degree of isolation of a prison on the
propensity to recidivate. They conclude that the harshness of Italian prisons actually increases
the likelihood of re-offending in the seven months following release. Moreover, Mastrobuoni
and Terlizzese (2014) estimate the effects of being exposed to a rehabilitative environment

7
rather than to the usual prison conditions on recidivism over a three-year time window; they
find that spending one more year in a rehabilitating prison (instead of one year in a regular
prison) lowers the offenders’ future likelihood of committing crimes by 10 percent, implying
that the deterrence effect is given by the softer punishment rather than the harsher.
The evidence on the specific deterrence effect is mixed mainly due to the difference
in punitive treatments, targeted populations and time windows in which offenders are
observed: it is hard to draw conclusions from few and diverse studies.
The literature frequently distinguishes between the effects on offenders by their age,
and whether they are classified as adults or juveniles. The former are more mature and less
likely to change in response to the circumstances. The latter are more vulnerable to the
surrounding environment. Malleability is not a desirable or undesirable trait per se: it implies
that a young individual who lives in a negative environment is more likely to be negatively
affected by it; at the same time, a young individual who lives in an edifying environment is
more likely to positively change. How an individual is affected in the context of custody
environments might push the individual in one of two directions: either he/she will be
damaged and become more likely to reoffend in the future or he/she will not be willing to
engage in crime anymore to avoid experiencing custody again.
How offenders respond to the environment when they are 20 or 21 is even more
uncertain: individuals at those ages fall into a gap, in that they are not considered juveniles,
and yet, at the same time, they are not as mature as adults. There is no study we are aware of
that looks at how 20/21 years old offenders respond to harsh prison conditions.
3. Background and Design
We will compare the effect of sending a young offender to prison rather than to one of the
two types of youth facilities: either the tougher youth custody and detention centres or the
educational young offender institutions (YOIs). Because the regimen in prisons did not
change much in these years, the comparisons also allow us to say something about the
8
difference between keeping young offenders in establishments oriented towards punishment
(youth custody/detention centres) or towards rehabilitation (young offender institutions).
3.1 Youth Custody and Detention Centres
The desire to keep young offenders separate from their older peers in the prison
environment gained traction at the beginning of the 20th century in England. The idea of
focusing on education rather than punishment led to the birth of a new type of youth
detention centre: the borstal, an institution initially meant to guard and rehabilitate young
offenders. Its name derived from the city where the first centre was opened in 1902: Borstal,
Kent, England.
In 1952 detention centres were also opened to “provide a sanction for those who
could not be taught to respect the law by such milder measures as fines, probation and
attendance centres, but for whom long-term residential training was not yet necessary or
desirable…” (Walker, 1965).
In the first decades borstals appeared to be successful. Despite their initial success,
across the years, borstals did not adapt to the new, more criminally sophisticated generations,
and 70 percent of the offenders released from borstals were reconvicted within two years
(Warder and Wilson, 1973). More generally, crime rates, particularly among youths, rose in
the 1970s, and the public attitude toward young offenders became more concerned with
punishment (Pyle and Deadman, 1994).
Hence, in 1979 the conservative party pushed for the implementation of a “short,
sharp shock” on young offenders in detention centres. “The theory was that if a young man
who was convicted of a first crime was given a short period of intense regimented activity
from morning till night, with everything done ‘at the double’, the experience would give him
such a shock that he would give up any idea of a life of crime” (Coyle, 2005). The life in
detention centres during the “short, sharp shock” became tough, mainly as a result of the
isolation it produced:
“Two visits were permitted each month and new arrivals
were entitled to a mere 30 minutes, increasing to 45 minutes

9
and then to an hour […]. From this point (5:45 a.m.),
prisoners were under a rule of silence, with commands
shouted at them by prison officers. […] By 1pm the
prisoners had changed their clothes three times, been
inspected twice, marched everywhere and had remained in
total silence. The routine continued throughout the day. At 8
p.m., following a lengthy period spent in isolation in their
cells, prisoners were allowed 30 minutes’ recreation. For
five days each week prisoners were able to talk to each other
for only 30 minutes daily. […] The rule of silence created an
atmosphere of mental isolation. At weekends that mental
isolation was consolidated by long periods of physical
isolation. […] Lining the corridors, awaiting barked
instructions, the sullen, pale-faced boys fixed their eyes on
their jailers. It was a collective stare of silenced resentment.”
(Newburn, 2009)
In the same spirit, the 1982 Criminal Justice Act (CJA) abolished borstals and
replaced them with youth custody centres. The name of the sentence was changed from
“borstal training recommendation” to “youth custody order”, reflecting “the view that
containment is more appropriate than attempts to rehabilitate via ‘training’”. The 1982 CJA
“for good or ill abandons the notions that young people are sent to penal establishments for
treatment or rehabilitation” (Muncie 1984). The institution of the “short, sharp shock” and the
replacement of borstals with youth custody centres represented a shift from a welfare policy
system targeting rehabilitation towards a justice and retributive system focused on tighter
control (Muncie, 2005; Smith, 2007). Anecdotal evidence highlights the suffering that both
these centres imposed on young offenders (Muncie 1984; Taylor et al 1979); “(the centres)
were, if anything, more brutal jungles than the adult prisons” (Smith, 1984). The young
custody centres were not imposing the “short, sharp shock”, but life in these institutions was
also tough:
“If the rule of silence, heavy discipline and limited
recreation created conditions of mental and physical
isolation in the Detention Centre, the endemic verbal
harassment and physical violence in the Young Offenders’
Institution (Youth Custody Centres) created a climate of fear
and aggression. ‘Doing time’ in either regime was about
negotiating and handling punitive conditions created
formally (institutionally) and informally (cultural).”
(Newburn, 2009)

10
Magistrates were given the power to choose whether an offender below 21 was to be
sent to youth custody or detention centres. However, they were not convinced about the new
“short, sharp shock” regime in detention centres (Pilcher and Wagg, 2005), and they
preferred to sentence young offenders to youth custody. This led to an increase in the number
of young offenders in youth custody centres, and to a lower staff to prisoners’ ratio, making
the general conditions even more unbearable (Scanlan and Emmins, 1988):
“Staff were so stretched that inmates were now regularly
locked up for 23 hours a day, and control problems were
rapidly reaching crisis proportions. […] Since the centres
were established the number of assaults on staff had more
than doubled and there were now five times as many attacks
by inmates against other inmates. Violence, bullying, drug-
taking, and solvent abuse were becoming regular features of
the system.”
Source: “Youth centres' reaching crisis point'”, The
Guardian, May 25, 1985.
In general during the “short, sharp shock” members of staff were often cited in the
news for being violent against the offenders:
“The incident3 is the latest in a series of disturbing episodes concerning
alleged staff mistreatment of youths since the Government
introduced the short, sharp shock regime, with its emphasis
on discipline, parades and physical activity, at all 18
detention centres in England and Wales last year. […] It
seems that assaults on young people in end have become
institutionalised and are viewed by some staff as an intrinsic
part of the ‘short sharp shock’. […] we should not go along
the road of cruelty in our prisons and turn out youths who
were more aggressive when they came out of custody than
they were when they went in”.
Source: Ballantyne, Aileen. “Youth centre report criticises
discipline”, The Guardian, Nov 25, 1985.
“Two dossiers containing fresh allegations of assaults by
prison officers on youths at ‘short sharp shock’ detention
centres are to be sent to Mr Douglas Hurd, the Home
Secretary. They have been prepared by the National
Association of Probation Officers and the Children’s Legal
Centre after several complaints from probation officers and
social workers who have come into contact with boys who
say they have been slapped and punched at Blantyre House in
Kent and Haslar in Hampshire.”
3 An officer who behaved violently towards a youth in custody.

11
Source: Ballantyne, Aileen. “Prison officers punched youth,
Hurd told: The practice—and…;” The Guardian, Nov 24,
1986
“Boys (in custody) are alleged to have been punched for
forgetting to say “sir”, for not knowing their numbers before
being given any, and for not running quickly enough. […]
“We are talking about people being punched quite forcibly in
the stomach, and being given quite hard slaps around the
face. I have seen a boy whose lip had been split by a blow.”
[…] The baton they were jumping over had been raised by
the instructor just as they had estimated the height of it and
had started the jump. They were clipped on the ankles, and
the baton they were running under was deliberately lowered
in the same way so that they were whacked on the back. […]
As soon as he arrived, he said, he was subjected to racial
abuse and slapped in the face with a ruler. A prison officer
then punched him in the stomach and took off his belt and
slapped him around his face with it.”
Source: Ballantyne Aileen. “Punching inquiry at sharp shock
centre”, The Guardian, Apr 26 1985
It is in these years that our first quasi-natural experiment takes place. As the 1982
CJA stated, if an offender was to be punished with custody in England and Wales, he/she
would have been sentenced to detention/youth custody centres if he/she was below 21 years
old and to prison if he/she was 21 or older. Hence, the first comparison that we will make in
this paper will be between being sentenced to a normal adults’ prison, and being sentenced to
a youth custody/detention centre, where the government had decided to be more punitive.
At the time, adults’ prisons were just as tough as usual. Inmates in prison, like
offenders in youth custody, could be locked up for 23 hours per day, and there were very few
intermittent opportunities to work, and “little or no access to educational facilities, recreation
or association” (Her Majesty’s Chief Inspector of Prisons for England and Wales, 1993).
The main differences that young offenders experienced in prison rather than in youth
custody/detention centres were a) the exposure to older peers (from 21 years old onwards)
and b) overcrowded cells. As Table 1 shows, local prisons could hold up to 150 percent of the
population that the facility was originally intended to allow.

12
3.2 Young Offender Institutions
Due to their failure4, in 1988 the experiments under the “short, sharp shock” regime were
abolished, and detention centres and youth custody centres were merged into young offender
institutions (YOIs). The rules by which a young offender could be sentenced to a YOI rather
than to a prison were the same in 1988 as in 1982: the offender needed to be below 21 when
convicted of an imprisonable offence, and the court needed to be satisfied that he qualified
for a custodial sentence (Scanlan and Emmins, 1988, p. 98).
These rules give us the opportunity for our second quasi-natural experiment.
It is relevant for the purpose of our study to highlight that the new institutions for
young offenders were not meant to be tough anymore: at the end of the ‘80s there was a
switch from a punitive system for young offenders towards a rehabilitative system (Coleman
and Warren-Adamson, 1992; Muncie, 1990).
The first main differences between YOIs and prisons were that young offenders in
prisons were exposed to a) older peers and to b) an overcrowded environment. As Table 2
shows, at the end of the ‘80s local prisons could be filled with 150 percent of the certified
normal accommodation, as it used to happen at the beginning of the decade. A further
dissimilarity between prisons and YOIs was c) the new educational and rehabilitative target
of the latter: the aim of young offender institutions was now “to help offenders to prepare for
their return to the outside community.” (HC Deb 06 June 1989). The target was to be met by
“providing a programme of activities, including education, training and work designed to
assist offenders to acquire or develop personal responsibility, self-discipline, physical fitness,
interests and skills and to obtain suitable employment after release; fostering links between
the offender and the outside community; co-operating with the services responsible for the
offender’s supervision after release.” (CJA 1988, rule 3). Encouraged to maintain their
networks with the outside world, young offenders were entitled to send and to receive a letter
4 Crime rates did not decrease, nor the propensity to recidivate of the criminals who experienced the
short, sharp shock.

13
once a week, and to receive a visit once in four weeks. Outside contacts with persons and
agencies were also encouraged.
By contrast, the provision of educational or training opportunities was still low for
inmates in prison:
“[...] for many imprisonment results not only in a loss of
liberty in stark conditions but also in the imposition of a
regimented and unconstructive way of life. Meals are taken at
close intervals during the day, opportunities for socialising
can be few and far between, and evening activities and
recreation, where they exist at all, are crammed into a few
hours with nothing to occupy inmates after lock up.
Employment, if it exists, can be soulless and unrelated to
sentence and needs. In most cases very little is done to
prepare prisoners for release and equip them for a life
outside.” (Her Majesty’s Chief Inspector of Prisons for
England and Wales, 1993)
Towards the end of the decade the time during which inmates were confined in their
cells diminished, but to a much larger extent in YOIs than in prisons. Among all offenders in
custody, inmates in open YOIs were forced to stay in their cells for the fewest hours (42
percent of weekend hours, 40 percent on weekdays), while inmates in male local prisons were
locked up in their dormitories for approximately 60 percent of their time (with peaks in
London of even 83 percent during weekends)5. (Her Majesty’s Chief Inspector of Prisons for
England and Wales, 1993).
The number of monitored activities provided in the establishments also differed. For
example, 23 out of 35 male and female YOIs in England and Wales offered inmates the
option of undertaking agricultural and horticultural work in the open air (HC Deb 30
November 1989, HC Deb 07 November 1991), and, more generally, the largest range of
activities (12–15) was provided by YOIs. Table 3 shows that the most popular activities were
usually either equally likely to be available in both prisons and YOIs or more likely to be
offered and practiced in the latter6.
5 The study from the Report of a Review of Regimes in Prison Service Establishments in England and
Wales is based on 64 prison establishments in England and Wales in 1991/2. 6 There were few exceptions, mainly related to activities whose availability depended on whether the
establishment had the necessary ground to host them (like Farms Party) or to Prison Service Industries

14
4. Data
Data provided by the Research, Development and Statistics Directorate of the Home Office
allow for examination of a wide range of variables: gender; ethnicity7; the type and number of
offences for which the transgressors appeared in court; the length of the sentence they were
given; the disposal; whether or not they pleaded guilty; the type of proceedings (e.g.
summoned by police, committed to Crown Court for trial, breach of probation order, etc.);
and the date of birth (day, month and year).
We are able to access the offenders’ crime records of the first (second) cohort since
their birth year until 1993, which means until they are 30 (25) years old. We measure the age
at which they commit their first offence to have an indication of their initial propensity to
commit a crime.
We construct several outcome variables: the likelihood of being brought to court at
least once in the future; the number of offences for which an individual is sent to court; the
number of times the offender appears in court again8; and the number of sentences to prison.
These outcomes refer to different time spans depending on the cohort considered. For the
cohort born in 1963, the future time window in which offenders are observed is nine years (or
four years after release)9. Due to data constraints, we can observe the crime records of the
and Farms (PSIF) activities, that were not necessarily good quality workshops (Her Majesty’s Chief
Inspector of Prisons for England and Wales, 1993). 7 Unfortunately the variable describing the ethnicity of the offenders of the 1963 cohort has a high
percentage of missing values. 8 Please note that the number of offences for which an individual is brought to court is different from
the number of times the individual is brought to court: an offender could be brought to court once for
having committed multiple offences. For example, an individual who stole a car and, when escaping,
broke a shop window will go to court once but he/she will be sentenced for two different offences. 9 We reduce the time window in which we analyse the future criminal records of the offenders to nine
years (instead of 10) so that the outcomes of the two groups of offenders are comparable: we could
observe for 10 years the offenders in our sample who have been sentenced at age 20, but we cannot do
the same with the offenders who are sentenced when 21. This is why we choose a time window of nine
years to construct our outcome variables. Therefore, we measure the future offences of the offenders
who are sentenced when 20 (looking at their outcomes when they are 21 to 29), and we compare them
with the future offences of the offenders who are sentenced at 21 (looking at their outcomes when they
are 22 to 30). Let us point out that in the nine-year time window we are also considering offenders with
a sentence longer than one year, i.e. offenders who are still in custody in this period. However, as we
will see later, the sentence length is balanced between offenders assigned to youth custody/detention
centres, and offenders assigned to prison, meaning that the time spent in custody by offenders from the
two groups is not significantly different, and consequently, should not affect the estimates. As a
robustness check we will re-conduct the analysis by looking at the offences committed only in a time
window where we can observe all the offenders after release. This time window will necessarily be

15
offenders born in 1968 for a shorter time period. In order to maximize the time span after
release in which we can observe the offenders born in 1968, we only consider the offenders
who are sentenced to custody for one year or less, and we restrict the sample to offenders
who turned 20/21 before June 199010
. This way we broaden the time window in which we
observe the future offences of the second cohort to 2.5 years after release.
We can also observe the type of offences committed in the future: whether they are
thefts, violent offences, sexual offences, burglaries/robberies, frauds, criminal damages, drug
offences, minor offences or other offences. This way we can have a measure of both the
quantity and quality of future crimes.
Our first (second) sample consists of all the offenders who were born in three (four)
randomly sampled weeks11
of 1963 (1968), and who were sent to either youth
custody/detention centres (young offender institutions) or adults’ prisons in England and
Wales when they were 20/21 years old.
The Criminal Justice Act 1982 that established the rules for youth custody and
detention centres was implemented on the 24th of May 1983. We therefore include in our
first sample only offenders who were 20/21 years old after that date. In total there are 558
offenders12
. Of them 315 offenders were sent to adults’ prisons (our treatment group), and
243 offenders were sent to youth custody/detention centres (our control group). The Criminal
Justice Act 1988, which abolished youth custody/detention centres and established YOIs, was
implemented on the 1st of October 1988. Following the same reasoning, we include in our
sample offenders who appeared in court when 20/21 after that date. In total there are 297
shorter: four years. As expected, results are perfectly in line with what is found over the nine-year
period. 10
We do this because we can observe offenders until December 1993, and if we limit our sample to
offenders who turn 20/21 before June 1990, we can observe them for a longer time period. Otherwise,
we would also observe offenders who turned 20/21 between July and December 1990, but we would
examine their post-release behaviour for two years only. 11
Dates for the 1963 cohort: 3rd
-9th
March, 28th
September-4th
October, 17th
-23rd
December. Dates for
the 1968 cohort: 3rd
-9th
March, 28th
September-4th
October, 17th
-23rd
December and 19th
-25th
June for
the 1968 cohort. 12
We exclude from the 1963 cohort offenders who committed their first crime when they were
younger than 14 years old. This way we get rid of the most dangerous criminals, who are more
numerous in our control group and consequently might bias our results. In a robustness check, we will
re-conduct the analysis in the full sample, including offenders who committed their first crime when
younger than 14 years old.

16
offenders. Of them, 132 were sentenced to adults’ prisons (our treatment group), and 165
were sentenced to YOIs (our control group).
Summary statistics of the observable characteristics of offenders from both cohorts
are reported in Table 4. Most of the offenders born in 1963 (Panel A) are male (93.2 percent),
and they appeared in court for the first time when they were almost 17 years old on average.
Around 90 percent of them pleaded guilty when 20/21, and they were given a sentence of
approximately 9.5 months on average. The offences were: burglaries (36.7 percent), violent
offences (17 percent), and thefts of different kinds (30.5 percent). Most of the offenders born
in 196813
(Panel B) are male (97.3 percent) and of White European ethnicity (58.1%). The
offences committed by the 1968 cohort are also mainly burglaries (30.7 percent), violent
offences (22.6 percent) and thefts (26.4 percent).
4.1 Treatment-Control Comparisons: Balancing Tests
We rely on a standard regression discontinuity (RD) design assumption, specifically in this
case that the assignment to treatment is not correlated to individuals’ characteristics other
than age. Therefore, we provide visual evidence of whether other covariates exhibit a jump
around the threshold. As shown in Appendix Figure A 1 (Online Appendix), this is not the
case for any of the available observable characteristics: gender, ethnicity, birth year (the
members of the groups we compare are all born in the same year), month of birth (March,
June14
, September/October, December), whether they pleaded guilty, the type of offence, the
age at which they committed their first offence and the proceedings types. The absence of a
jump in observable characteristics around the cut-off further supports our analysis.
13
We limit our sample of offenders born in 1968 to offenders who were given a custodial sentence of
one year maximum, which makes summary statistics of the 1968 cohort slightly different compared to
the 1963 cohort. 14
June is available only for the 1968 cohort.

17
5. Empirical Strategy and Results
5.1 Empirical Strategy
The 1963 and 1968 cohorts are analysed separately through a fuzzy RD design. It is a fuzzy
RD because not all the offenders who should be sentenced to either prison or separate youth
establishments are effectively sentenced to them. That is, 230 (160) offenders out of the 243
(164) who appeared in court when age 20 from the 1963 (1968) cohort were sent to youth
custody/detention centres (young offender institutions), and 297 (128) young offenders out of
the 315 (132) who appeared in court when age 21 were sent to adults’ prisons. This gives us
the possibility of estimating the local average treatment effects (LATE) by two-stage least
squares (2SLS). The following model illustrates how.
First stage equation:
𝐷𝑖 = 𝛼 + 𝑓1(�̃�𝑖) + 𝜌𝑇𝑖 + 𝜂𝑖 (1)
Second-stage equation:
𝑌𝑖 = 𝛼 + 𝑓2(�̃�𝑖) + 𝛾𝐷𝑖 + 𝑒𝑖 (2)
Where:
Yi = the outcome for individual i, i.e. the likelihood to re-offend in the future, the
number of crimes committed, the number of court appearances, the number of sentences to
prison, the number of specific types of crime committed;
Di = the treatment variable, equal to 1 if individual i is sentenced to an adults’ prison,
and 0 otherwise;
Ti = 1 if individual i is 21 years old or older, and 0 otherwise; it is used as instrument
for Di.

18
Xi = age of individual i when sentenced, centred so that it is 0 when the individual
turns 21 years old, positive if the individual is sentenced when 21 years old or older, and
negative when the individual is younger than 21 years old15
.
The functional forms f1 and f2 need to be correctly specified.
Our main specification is estimated through a non-parametric approach,
implementing a local linear regression constructed with a triangular kernel regression16
. As
Lee and Lemieux (2010) suggest, it is better not to rely on one method only, so we will also
estimate equations (1) and (2) through a parametric approach. To allow for non-linearities,
we use polynomials, but up to the second order only. We do not control for higher
polynomials (third, fourth, etc.) of the forcing variable because it could lead to misleading
results (see Gelman and Imbens, 2014). We also allow the treatment to have a different
impact before and after the cut-off by including an interaction of the centred variable and the
treatment variable. Finally, for a further robustness check, we also include in our parametric
approach estimations control variables such as gender, month of birth, ethnicity, age at which
the offender committed the first offence, sentence length, plea, proceedings and type of
offence when the offender was sentenced to youth custody/detention centres/young offender
institutions or adults’ prisons.
5.2 Results
For both our cohorts, the first stages are strong: the estimated coefficients in equation (1) are
0.761 for the 1963 cohort and 0.891 for the 1968 cohort (Table 5), very precisely estimated.
We can visualize the strength of our first stages in Figure 1.
5.2.1. Prison vs. harsher youth punishment
Let us begin our treatment effects analysis by looking at the future offences of the 1963
cohort through the local linear regression (Table 6). In the first column we report the
15
The centred running variable is equal to 1 the day after the offender turned 21 and -1 the day before
his 21st birthday.
16 A triangular kernel is ideal for estimating effects at the boundary (Fan and Gijbels 1996, Lee and
Lemieux 2014). Moreover, results (available upon request) are robust to using different kernels, like
the uniform or Epanechnikov.

19
estimated treatment effect when the bandwidth is one year on both sides17
. In column (2) we
present the estimates with the bandwidth suggested by Ludwig and Miller (2007), in column
(3) we restrict the bandwidth to ¾ of a year and in column (4) to half a year.
We find that young offenders who experienced custody in prison are 20.7 percent less
likely to re-offend than those who were exposed to a harsher treatment over a nine-year time
span. The effect is significant and does not change even when we reduce the bandwidth
around the cut-off from one year to the optimal bandwidth suggested by Ludwig and Miller
(2007) or to ¾ of a year. The effect is no longer significantly different from zero at
conventional significance levels only if we reduce the bandwidth to half a year. Hence, young
offenders exposed to a harsher punishment are more likely to reoffend, and this is also
reflected in the number of future offences they commit over the nine-year period: on average
2.84 offences more than their peers who were subject to less severe incarceration conditions.
This is true across all different bandwidths. Not only young offenders who experienced the
harsher treatment are more likely to be sentenced for more offences in the future, but they are
also brought to court on average 1.39 times more. The two outcomes differ in magnitude
because an offender can go to court once and be sentenced for more than one offence at the
same court appearance.
We then investigate on the seriousness of the crimes committed in the nine
subsequent years. Using the number of future sentences to prison as a proxy for severe
crimes, we find that offenders who experience the tougher regime are more likely to be
sentenced to prison in the future, but not significantly so. In Table 7, we examine the types of
crimes committed, and we show that the overall effects we find are not driven by minor
offences, but mainly by violent offences, thefts, burglaries and robberies. These differences
between the two groups of young offenders are significant even when we restrict the
17
By this, we mean that we include in our sample young offenders who appear in court from the date
of their 20th
birthday up to young offenders who are sentenced the in their 22nd
birthday, i.e. +/- 1 year
from the threshold of 21.

20
bandwidth as previously detailed18
. We find no significant differences in the number of future
violent crimes (such as sexual offences), or in the number of various other crimes (drug
offences, minor offences, motoring offences, frauds). There seems to be an effect on criminal
damage too, but it vanishes when we restrict the bandwidth around the threshold.
In summary, on the one side there are overcrowded prisons where offenders are
exposed to older peers; on the other side there is a tougher than usual regime, with the main
purpose to punish and shock offenders. The overall effects of the latter are more detrimental:
offenders who are sentenced to youth custody/detention centres are more likely to re-offend
in the future, to commit a greater number of offences and to commit offences that are more
dangerous for society. Through this analysis we are not able yet to disentangle the
mechanisms that are driving the results.
5.2.2 Prison vs. softer youth punishment
We now analyse the future offences of the 1968 cohort, comparing the young individuals
who were sent to the usual adults’ prisons to the ones assigned to YOIs. As we previously
explained, we examine this cohort over a shorter period: 2.5 years after release. We will then
re-conduct our analysis for the 1963 cohort limiting the time window to 2.5 years, and
limiting the sample to offenders sentenced for one year or less. This way we can compare the
results we obtain by analysing the 1963 and 1968 cohorts.
In Table 8, Panel B we can see a higher incidence of the number of future felonies,
the number of subsequent court appearances, and the likelihood of reoffending among those
sentenced to prison compared to those sent to other institutions. In each instance, the
magnitude is greater, but not significant. The number of times that former prisoners are
sentenced again to custody is positive and significantly different from zero, suggesting that
the future offences they commit represent a greater danger for society. If we then consider the
types of offences that they commit, we see that young offenders who experienced prison are
more likely to commit burglaries and robberies. Let us keep in mind that these results are the
18
While in the first column we report the estimated treatment effect when the bandwidth is one year on
both sides, in column (2) we present the estimates with the bandwidth suggested by Ludwig and Miller
(2007), in column (3) we restrict the bandwidth to ¾ of a year and in column (4) to half a year.

21
opposite of what we found when the treatment for younger offenders was harsher, i.e. for the
1963 cohort, where it is the young offenders kept in youth custody and detention centres who
become more dangerous instead. In order to make the comparison more adequate, we now
repeat the analysis for the 1963 cohort restricting the sample to offenders sentenced for one
year or less and limiting the time window in which we observe their offences to 2.5 years
after release. Now that the time window is shorter, the number of future offences considered
will necessarily be smaller, but we find that results go in the same direction as over the nine-
year period. As shown in Table 8, Panel A, young offenders born in 1963 who were
sentenced to prison rather than youth custody/detention centres, are 31 percent less likely to
reoffend in the 2.5 years following release, they commit on average 1.03 fewer offences, and
they appear in court 0.57 times fewer. Hence, it seems that even in the short term, young
offenders who experience the harsher treatment become more dangerous for society. All
these estimates are significantly different from zero and, as we highlighted before, they go in
the opposite direction of what we find once the harsh treatment for young offenders is
abolished.
Moreover, similarly to what we found over the nine-year time window, this shorter
time window still shows that violent offences and thefts constitute the types of crimes more
often committed more often by offenders who experienced youth custody and detention
centres (Table 9).
In summary, being exposed to (harsher) youth custody/detention centres makes
offenders more dangerous than being exposed to prisons; while being exposed to (less harsh)
YOIs makes offenders less dangerous than being exposed to prisons. Given that prisons did
not experience major changes over the ‘80s, and given that the differences in the age of peers
and in overcrowding rates between prisons and establishments for youth did not change
significantly over time, our findings seem to suggest that it is wise to keep young offenders
away from prisons, but only if they are kept in institutions with a rehabilitative purpose. If
instead, young offenders are kept separate from their older peers and far from an

22
overcrowded environment, but with the aim of punishing them, their likelihood of
reoffending in the future is exacerbated.
6. Robustness Checks
We now verify whether our local treatment effects are robust to a series of checks.
First, we consider whether results are stable across alternative estimation methods: we
find that they hold also when the analysis is carried out through a parametric approach up to a
second-order polynomial (Table 10). Second, in the even columns of Table 10 we also add
control variables as a further check: gender, sentence length, ethnicity, plea, proceedings,
month of birth, type of offence and age at which the offender committed the first offence.
Estimated coefficients tend to appear slightly smaller in size when control variables are
included, but they are not significantly different from the coefficients estimated without
control variables. In Table 11 we show the different treatment effects by offence type,
estimated through a parametric approach: effects go in the same direction as through the non-
parametric.
One could worry if there were a discontinuity in the distribution of the forcing
variable (the age at which offenders go to court) at the threshold (21 years). This would
suggest that people (judges, police, the offenders themselves) can manipulate the forcing
variable around the threshold. For example, young offenders, knowing ex-ante the harsh
conditions of youth custody and detention centres, could wait to commit their crimes until
they turn 21 years old. Reassuringly, the McCrary test shows no manipulation of the
assignment variable for either cohort (Figure 2).
Let us remember that in the analysis of the 1963 cohort we excluded offenders who
committed their first offence when younger than 14. We proceeded this way because the age
at which offenders committed their first offence was the only unbalanced covariate between
treatment and control groups: young offenders who went to youth custody/detention centres
were more likely to have committed their first offence when they were younger than their
counterparts. Because this difference may bias the results, we re-conduct the analysis for the

23
1963 cohort with the full sample of offenders, including those who committed their first
crime before turning 14 years old. The full sample includes 708 offenders in total. As we
might have expected, the magnitude of the treatment effects in the full sample is slightly
greater than in our main analysis (Table 13-Table 14): young offenders who experienced a
tougher punishment commit on average 3.46 offences more (2.84 in our original sample);
they are brought to court 1.65 times more (1.39 in our original sample); they are sentenced to
prison 1.52 times more (0.92 in our original sample); and they are 18.8 percent more likely to
re-offend in the future (20.7 percent in our original sample). All of the treatment effects
found are significantly different from zero and remain so even when the bandwidth around
the threshold is reduced. Even when we analyse the type of offence committed (Table 14), we
realize that young offenders who went to youth custody/detention centres are significantly
more likely to commit thefts, violent offences, burglaries and robberies, as we found in our
original sample.
In Section 5 we analysed the future felonies of the 1963 cohort over the next nine
years, even though over this time some offenders are not free from confinement, but kept in
custody. If the sentence length for offenders in youth custody/detention centres and offenders
in prisons were different, the main results we presented would be biased, as the number of
free people facing the choice of committing (or not) new offences would be disproportionate.
However, we have already seen that the sentence length is balanced, meaning that the time
spent in custody by offenders from the two groups is not significantly different, and
consequently, will not affect the estimates. As a robustness check we re-conduct the analysis
by looking at the offences committed only in a time window where we can observe all the
offenders outside of custody. The time window that enables us to conduct this analysis is four
years19
. As we can see in Table 15, results are perfectly in line with what is found over the
19
The time window is four years because once we exclude two offenders who have been given a
sentence of 60 months, the longest sentence we have in the sample is 48 months, i.e. four years. This
means that offenders born at the latest in our sample (i.e. in December 1963) and who are sentenced to
prison until they are still 21 (i.e. at the latest December 1985, some days before their 22nd
birthday) for
the maximum time (i.e. four years from December 1985) will be out of custody in December 1989. As
we can observe offenders until December 1993, our time window is four years maximum.

24
nine-year and 2.5-year periods: offenders who have been exposed to prisons rather than to
youth custody/detention centres on average commit 1.8 fewer offences in the five years
following release (-1.03 in 2.5 years following release, -2.84 in nine years); they are 35.7
percent less likely to commit offences (-31.1 percent in 2.5 years, -20.7 percent in nine
years); and they appear in court almost once less (-0. 57 time in 2.5 years, -1.39 in nine
years). If we then dig into the type of offences committed, we can see that they are mostly
violent offences, thefts and, in this case, also criminal damage.
We also need to bear in mind that the number of offences captured in the analysis
underestimates the true level of re-offending because crimes are only partially detected,
sanctioned and recorded. Our estimated effects would be biased if there were a difference in
how easy it is to detect, sanction and record the offences of the two groups. However, we do
not have any reason to believe there was.
Our first stage is very strong, but as a placebo test we also check if there are other
jumps in the forcing variable. Following Imbens and Lemieux (2008) we only look at one
side of the discontinuity, take the median of the forcing variable in that side and test for
discontinuity. Reassuringly, we find none.
Because our identifying assumption is that offenders at 20 are comparable to
offenders at 21, we need to consider the relationship between engaging in criminal activities
and age, as crime commission seems to peak in the mid to late teens and then decline
(Quetelet 1831; Hansen 1993; Bell et al., 2015). A decrease in the propensity to offend after a
specific age threshold implies that individuals who decide to commit a crime when older are
different from younger offenders (e.g. offenders who commit a crime when older may be
pushed by other factors such as lower self-control, more difficult labour market conditions,
etc.). If so, comparing offenders who engaged in illegal activities at different stages of their
lives could give biased results.
To reduce this potential bias we restricted the sample to offenders who are no more
than one year older/younger than 21 throughout the entire analysis. Moreover, in the first
cohort of offenders the harsher treatment affects the younger, while in the second cohort it is

25
the softer treatment that affects the younger. Hence, if the difference in the propensity to
commit a crime between the older and younger offenders does not change across time, it will
bias the estimates for the two cohorts in the same way, and the direction of our treatment
effects would be reliable. On the contrary, if the age-crime curve changes over time the
estimates for the two cohorts might be biased in a different way, affecting our conclusions.
While Hirschi and Gottfredson (1983) claimed that the age-crime curve is invariant
over different times, places, crime types, sexes, and so on (Farrington, 1983), subsequent
research argued instead that crime-age profiles change in time (Hansen 2003; Ulmer and
Steffensmeier 2014). Even though changes in the age-crime profiles can occur, it takes time
for them to happen. For example, “in the United States, total arrests for all offenses in 1980
peaked at age 18; in 1933, at 19. Seemingly, there was little change in half a century. […] A
comparison of the age distribution of criminality in contemporary England with that in the
1840s shows a major shift in modal age: in 1842-44 (before summary jurisdiction acts began
to divert juvenile offenders from the regular criminal courts), the rate of involvement peaked
at ages 20-25; in 1968, at 14-17” (Greenberg, 1985). For such a major shift to take place in
England, it took 125 years. The second cohort analysed in the paper was born 5 years after
the first: even if the modal age of the second distribution of offenders was lower, it is
reasonable to think that it would be lower by a small degree. Indeed, when we examine the
number of court appearances by age for the types of crimes where we find a significant effect
(Fig. 4), we observe a similar trend for both cohorts: when offenders turn 21, they are less
likely to commit a crime. Only the number of court appearances by age for criminal damage
is not very smoothly distributed, and its trend temporarily reverses when offenders from the
second cohort turn 21.
7. Conclusion
We use a fuzzy regression discontinuity design to analyse two quasi-natural experiments in
criminal sentence of 20- and 21-year-old offenders to compare the effects of incarceration
practices that are harsher or more rehabilitative in nature. The work contributes to the

26
literature and current public debate on the most effective type of punishment to reduce crime
among young offenders and to protect the citizens’ wellbeing.
We find evidence that keeping young offenders separate from their older fellows is
efficient when we aim to reduce their future criminal activity. However, this is true only if the
young offenders are housed in institutions that provide for their rehabilitation. Keeping young
offenders in institutions with a sole punitive purpose proves to be counterproductive instead.
During the ‘80s, prisons in England and Wales do not experience major changes,
while institutions where offenders younger than 21 are held separately from their older peers
do: initially these institutions are meant to punish young offenders severely, but in 1988, they
adopted a more rehabilitative orientation. We find that young offenders exposed to the
temporarily tougher regime are 20.7 percent more likely to re-offend in the subsequent nine
years; they commit on average 2.84 offences more; and they are brought to court 1.39 times
more often than their counterpart in prison. The crimes that young offenders exposed to a
harsher regime commit also appear to be more serious, as suggested by the fact that in the
future they are sentenced more often to prison, even though the effect is not significantly
different from zero. Moreover, their felonies are not minor, but major crimes, such as violent
offences, thefts, burglaries and robberies. By the end of the decade punitive institutions for
young offenders are abolished and substituted with more rehabilitative ones, which enables
us to compare young offenders sentenced to the usual prison with young offenders sentenced
to the separate educational institutions. In the 2.5 years after release, offenders held in the
new educational facilities are sentenced to custody 1.28 times less than offenders kept in
ordinary prisons; they are also significantly less likely to commit burglaries and robberies,
suggesting that they become less of a threat for their society. They are also less likely to re-
offend and they commit fewer crimes in the future, but the estimates of these effects are not
significant.
Adults’ prisons do not experience major changes over the decade. Moreover, the
different exposure to overcrowding and to peers between prisons and establishments for
younger offenders stay the same. The only difference between the two types of custody that
27
varies over time is the change of target in institutions for young offenders, from a punitive
one to a rehabilitative one. Hence, our results imply that being kept separately from more
adult criminals is positive only if the purpose of the offender’s custody is rehabilitative. If it
is punitive, the lawbreaker becomes even more likely to reoffend in the future.
Our estimates hold to different robustness checks.
These results suggest that the experience of being held in punitive incarceration
facilities can have negative long-term consequences on young offenders, and therefore on the
entire society. The evidence is significant, with the caveat that it relates to a specific group of
offenders: law breakers who are sentenced to custody when 20/21 years old. While being an
interesting result per se, it cannot be generalized to juvenile or adult offenders, even though
our results are in line with the literature that does not find evidence in favour of a specific
deterrence effect for juveniles (Aizer and Doyle, 2015) and adult offenders (Chen and
Shapiro 2007; Drago and Galbiati 2011; Mastrobuoni and Terlizzese 2014).
Other two caveats need to be kept in mind for policy implications. First, we cannot
infer anything about unreported crimes, which we know exist, but which we cannot measure
by definition. If the number of unreported crimes was different between the groups we
compare, our results would be biased, but we do not have any reason to believe so. Moreover,
the aim of our paper is to test for the presence of a specific deterrence effect, but we cannot
draw any conclusion on the general deterrence effect: we do not know how other individuals
who did not experience youth custody, detention centres, young offender institutions or
adults’ prisons when 20/21 respond to the existence of these institutions.
Finally, more research on the mechanisms behind these effects would be beneficial
for a better understanding of what are the drivers of the offenders’ behaviour and tailor
appropriate policy responses.

28
8. References
Aizer, Anna, and Joseph J., Doyle, “Juvenile Incarceration, Human Capital, and Future
Crime: Evidence from Randomly Assigned Judges,” The Quarterly Journal of Economics
130, 2015, 759-803.
Ballantyne, Aileen, “Punching inquiry at sharp shock centre,” The Guardian, 26 Apr. 1985.
Ballantyne, Aileen, “Youth centre report criticises discipline,” The Guardian, 25 Nov. 1985.
Ballantyne, Aileen, “Prison officers punched youth, Hurd told: The practice—and…;” The
Guardian, 24 Nov. 1986.
Beccaria, Cesare. On Crimes and Punishments, trans H. Paolucci. 1764. New York: Bobbs-
Merill, 1963.
Becker, Gary, “Crime and Punishment: an Economic Analysis,” Journal of Political
Economy 78.2, 1968, 169-217.
Bell, Brian, Anna, Blinder, and Stephen Machin, “Crime Scars: Recessions and the Making
of Career Criminals,” CEPR Discussion Papers 10415, C.E.P.R. Discussion Papers, 2015.
Bentham, Jeremy. An Introduction to the Principles of Morals and Legislation. Oxford:
Clarendon Press. 1798.
Bromley Briefings, “Prison: the facts, summer 2016”. London, Prison Reform Trust, 2016.
Chen, M. Keith, and Jesse M. Shapiro, “Do harsher prison conditions reduce recidivism? A
discontinuity-based approach,” American Law and Economics Review 9.1, 2007, 1-29.
Coleman, John C., and Chris Warren-Adamson, eds. Youth Policy in the 1990s: The way
forward. Routledge, 1992.

29
Coyle, Andrew. Understanding prisons: Key issues in policy and practice. McGraw-Hill
Education (UK), 2005.
Criminal Justice Act 1982 (c.48), available at: http://www.legislation.gov.uk/ukpga/1982/48
Criminal Justice Act 1988 (c.33), available at: http://www.legislation.gov.uk/ukpga/1988/33
Drago, Francesco, Roberto Galbiati, and Pietro Vertova, “Prison conditions and recidivism,”
American Law and Economics Review 13.1, 2011, 103-130.
Fan, Jianqing, and Irene Gijbels. Local polynomial modelling and its applications:
monographs on statistics and applied probability 66. CRC Press, 1996.
Farrington, David P. and Allison M. Morris, “Sex, sentencing and reconviction”, British
Journal of Criminology 23.3, 1983, 229-248.
Galbiati, Roberto and Francesco Drago, “Deterrent effect of imprisonment,” Encyclopedia of
Criminology and Criminal Justice, Springer New York, 2014, 1023-1030.
Gelman, Andrew, and Guido Imbens, “Why high-order polynomials should not be used in
regression discontinuity designs,” National Bureau of Economic Research Working Papers
20405, 2014.
Greenberg, David F., “Age, crime, and social explanation”, American of Journal Sociology,
1985, 1-21.
“Youth centres' reaching crisis point,” The Guardian, 25 May, 1985.
Hansen, Kirstine, “Education and the crime‐age profile”, British Journal of Criminology
43.1, 2003, 141-168.

30
HC Deb 06 June 1989 vol 154 c44W, available at:
http://hansard.millbanksystems.com/written_answers/1989/jun/06/youth-
custody#S6CV0154P0_19890606_CWA_346
HC Deb 07 November 1991 vol 198 cc555-7, available at:
http://hansard.millbanksystems.com/commons/1991/nov/07/work-
camps#S6CV0198P0_19911107_HOC_8
HC Deb 30 November 1989 vol 162 cc384-5W, available at:
http://hansard.millbanksystems.com/written_answers/1989/nov/30/young-
offenders#S6CV0162P0_19891130_CWA_333
Her Majesty’s Chief Inspector of Prisons for England and Wales. Doing Time or Using Time,
Report of a Review of Regimes in Prison Service Establishments in England and Wales, Rep.
London HMSO, 1993.
Hirschi, Travis, and Gottfredson Michael, “Age and the Explanation of Crime”, American
Journal of Sociology 89.3, 1983, 552-84.
Hjalmarsson, Randi, “Juvenile Jails: A Path to the Straight and Narrow or to Hardened
Criminality?,” Journal of Law and Economics 52.4, 2009, 779-809.
Home Office. Research, Development and Statistics Directorate, Offenders Index Cohort
Data, 1953-1997 [computer file]. Colchester, Essex: UK Data Archive [distributor], February
1999. SN: 3935, available at: http://dx.doi.org/10.5255/UKDA-SN-3935-1
Imbens, Guido, and Thomas Lemieux. “Regression discontinuity designs: A guide to
practice,” Journal of Econometrics 142.2, 2008, 615-635.
Imbens, Guido, and Karthik Kalyanaraman, “Optimal Bandwidth Choice for the Regression
Discontinuity Estimator,” Review of Economic Studies 79.3, 2012, 933-959.
Katz, Lawrence, Steven D., Levitt and Ellen Shustorovich, “Prison Conditions, Capital
Punishment, and Deterrence,” American Law and Economics Review 5.2, 2003, 318-343.

31
Lee, David S., and Thomas Lemieux, “Regression Discontinuity Designs in Economics,”
Journal of Economic Literature, American Economic Association 48:2, 2010, 281-355.
Lee, David S., and Justin McCrary, “The deterrence effect of prison: Dynamic theory and
evidence,” Princeton University, Department of Economics, Unpublished Manuscript, 2009.
Ludwig, Jens, and Douglas L. Miller, “Does Head Start Improve Children's Life Chances?
Evidence from a Regression Discontinuity Design,” Quarterly Journal of Economics 122:1,
2007, 159-208.
Mastrobuoni, Giovanni, and Daniele Terlizzese, “Rehabilitating Rehabilitation - Prison
Conditions and Recidivism,” Einaudi Institute for Economics and Finance EIEF Working
Papers Series 1413, 2014.
McCrary, Justin, “Manipulation of the running variable in the regression discontinuity
design: A density test,” Journal of Econometrics 142.2, 2008, 698-714.
Muncie, John. The Trouble with Kids Today: Youth and Crime in Post-war Britain. Dover,
NH, 1984.
Muncie, John, “Failure never matters: detention centres and the politics of deterrence,”
Critical Social Policy 10.28, 1990, 53-66.
Muncie, John, “The globalization of crime control—the case of youth and juvenile justice
Neo-liberalism, policy convergence and international conventions,” Theoretical Criminology
9.1, 2005, 35-64.
Newburn, Tim, “Power, Conflict and Criminalisation–By Phil Scraton,” The British Journal
of Sociology 60.4, 2009, 846-848.
Pilcher, Jane, and Stephen Wagg. Thatcher's Children?: Politics, Childhood and Society in
the 1980s and 1990s. Routledge, 2005, p.68.

32
Pyle, David J., and Derek F. Deadman, “Crime and the business cycle in post-war Britain,”
British Journal of Criminology 34.3, 1994, 339-357.
Prison: the facts. “Bromley Briefings Summer 2015”, available at:
http://www.prisonreformtrust.org.uk/Portals/0/Documents/Prison%20the%20facts%20May%
202015.pdf
Quetelet, Adolphe. Research on the Propensity for Crime at Different Ages (1831), translated
and introduced by Sawyer F. Sylvester. Cincinnati: Anderson, 1984.
Scanlan, Gary and Emmins, Christopher J. A guide to the Criminal Justice Act 1988.
Blackstone Press, 1988.
Smith, Adam. The Wealth of Nations (1776). New York: Modern Library, 740, 1937.
Smith, Richard, “Schools for Criminals,” British Medical Journal, 1984.
Smith, Roger Shipley. Youth justice: Ideas, policy, practice. Taylor & Francis, 2007.
Taylor, Laurie, Ron Lacey, and Denis Bracken. In Whose Best Interests? The unjust
treatment of children in courts and institutions. Cobden Trust, 1979.
Ulmer, Jeffery T. and Darrell Steffensmeier, “The Age and Crime Relationship: Social
Variation, Social Explanations”, in The Nurture versus Biosocial Debate in Criminology,
edited by K. Beaver, B. Boutwell, and J.C. Barnes. Newbury Park, CA: Sage. 2014.
Walker, Nigel. Crime and punishment in Great Britain. University Press, 1965.
Warder, John, and Reg Wilson, “The British Borstal Training System,” The Journal of
Criminal Law and Criminology 64.1, 1973, 118-127.

33
Figure 1. First Stage (20 bins)
Notes: The figure above reports the first stages, i.e. how much of being sentenced to an adults’ prison depends
on actually being 21. The left (right) hand side refers to the 1963 (1968) cohort of the Offenders Index Cohort
Data (Home Office Research, Development and Statistics Directorate). The 1963 sample includes all the
offenders who were sentenced to either youth custody/detention centres or adults’ prisons when being age
20/21 at the date of court appearance. The 1968 sample includes all the offenders who were sentenced to young
offender institutions or adults’ prisons when being age 20/21 at the date of court appearance. On the x axis lies
our running variable, age at court appearance, centred at 0 when age at court appearance is 21. Age at court
appearance is positive (negative) when young offenders are older (younger) than 21. On the y axis the
treatment dummy (equal to 1 when the offender is sentenced to prison) is plotted. The coloured areas represent
the 90% confidence intervals around the separate lines of quadratic best fit plotted on the left and right hand
side of the cut-off.
Figure 2. McCrary Test
Notes: The figure above refers to the 1963 (Panel A) and 1968 (Panel B) cohorts of the Offenders Index Cohort
Data (Home Office Research, Development and Statistics Directorate). The 1963 sample includes all the
offenders who were sentenced to either youth custody/detention centres or adults’ prisons when 20/21. The
1968 sample includes all the offenders who were sentenced to young offender institutions or adults’ prisons
when being age 20/21 at the date of court appearance. The McCrary test is “a test of manipulation related to the
continuity of the running variable density function” (McCrary, 2008). On the x axis lies our running variable,
age at court appearance, centred at 0 when the age at court appearance is 21. Age at court appearance is positive
(negative) when young offenders are older (younger) than 21. On the y axis the density function of the running
variable is plotted.
0
.00
1.0
02
.00
3
-500 0 500
0
.00
1.0
02
.00
3.0
04
-500 0 500

34
Figure 3. Second Stage (20 bins)
Notes: The figure above refers to the two samples from the 1963 (Panel A) and 1968 (Panel B) cohorts of the Offenders
Index Cohort Data (Home Office Research, Development and Statistics Directorate). The 1963 sample includes offenders
who were sentenced to either youth custody/detention centres or adults’ prisons when being age 20/21 at the date of court
appearance and who committed their first offence when older than 14. The 1968 sample includes offenders who were
sentenced to young offender institutions or adults’ prisons when being age 20/21 at the date of court appearance, whose
sentence was equal or shorter than one year and who committed an offence before June 1990. On the x axis lies the variable
age at court appearance, centred at 0 when age at court appearance is 21. Age at court appearance is positive (negative) when
young offenders are older (younger) than 21. On the y axis the outcomes measured after release are represented: the number
of future offences, the likelihood to reoffend, the number of sentences to prison and the times the offenders go to court again.
The coloured areas represent the 90% confidence intervals around the quadratic of best fit. The time span over which
outcomes are observed is nine (2.5) years after release for offenders born in 1963 (1968).
Panel A – 1963 Cohort
Panel B –1968 Cohort

35
Figure 4. Crime-Age Curve by Offence Type in 1963 and 1968 Cohorts
Notes: The figures above refer to the full 1963 (Panel A) and 1968 (Panel B) cohorts of the Offenders Index Cohort Data (Home Office Research,
Development and Statistics Directorate). On the y axis there is the number of court appearances by type of offence. On the x axis lies the variable age at
court appearance.
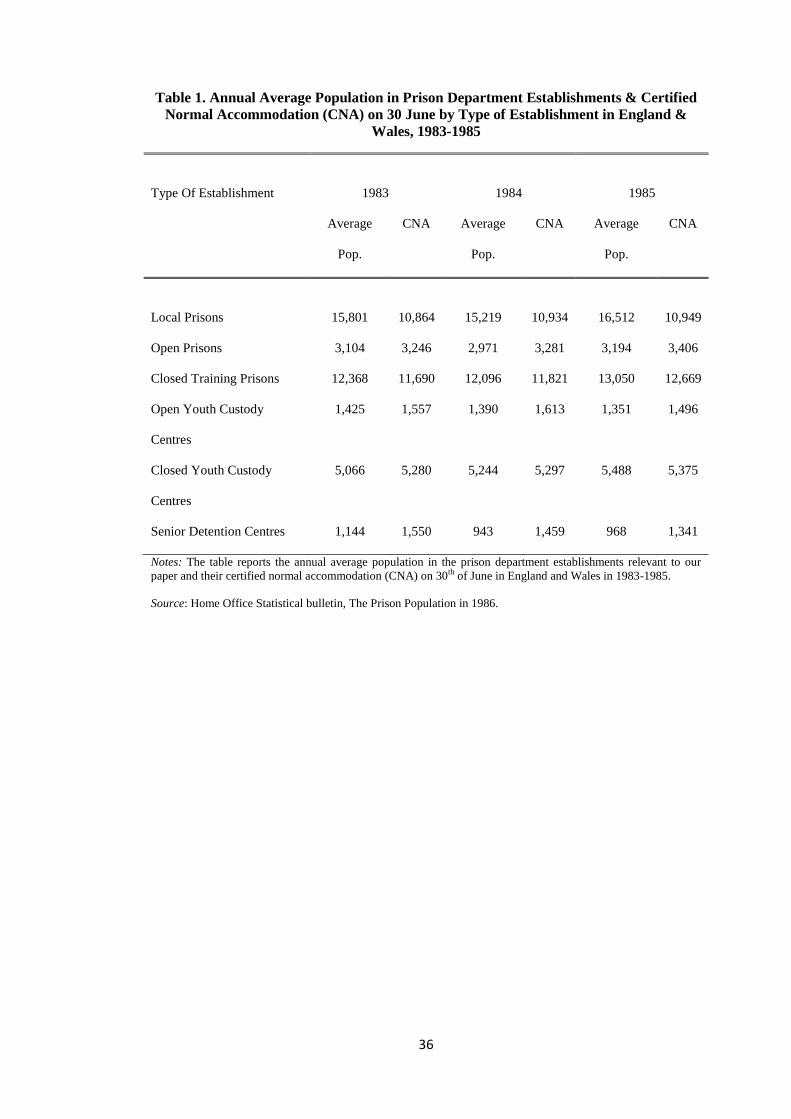
36
Table 1. Annual Average Population in Prison Department Establishments & Certified
Normal Accommodation (CNA) on 30 June by Type of Establishment in England &
Wales, 1983-1985
Type Of Establishment
1983
1984
1985
Average
Pop.
CNA Average
Pop.
CNA Average
Pop.
CNA
Local Prisons 15,801 10,864 15,219 10,934 16,512 10,949
Open Prisons 3,104 3,246 2,971 3,281 3,194 3,406
Closed Training Prisons 12,368 11,690 12,096 11,821 13,050 12,669
Open Youth Custody
Centres
1,425 1,557 1,390 1,613 1,351 1,496
Closed Youth Custody
Centres
5,066 5,280 5,244 5,297 5,488 5,375
Senior Detention Centres 1,144 1,550 943 1,459 968 1,341
Notes: The table reports the annual average population in the prison department establishments relevant to our
paper and their certified normal accommodation (CNA) on 30th of June in England and Wales in 1983-1985.
Source: Home Office Statistical bulletin, The Prison Population in 1986.
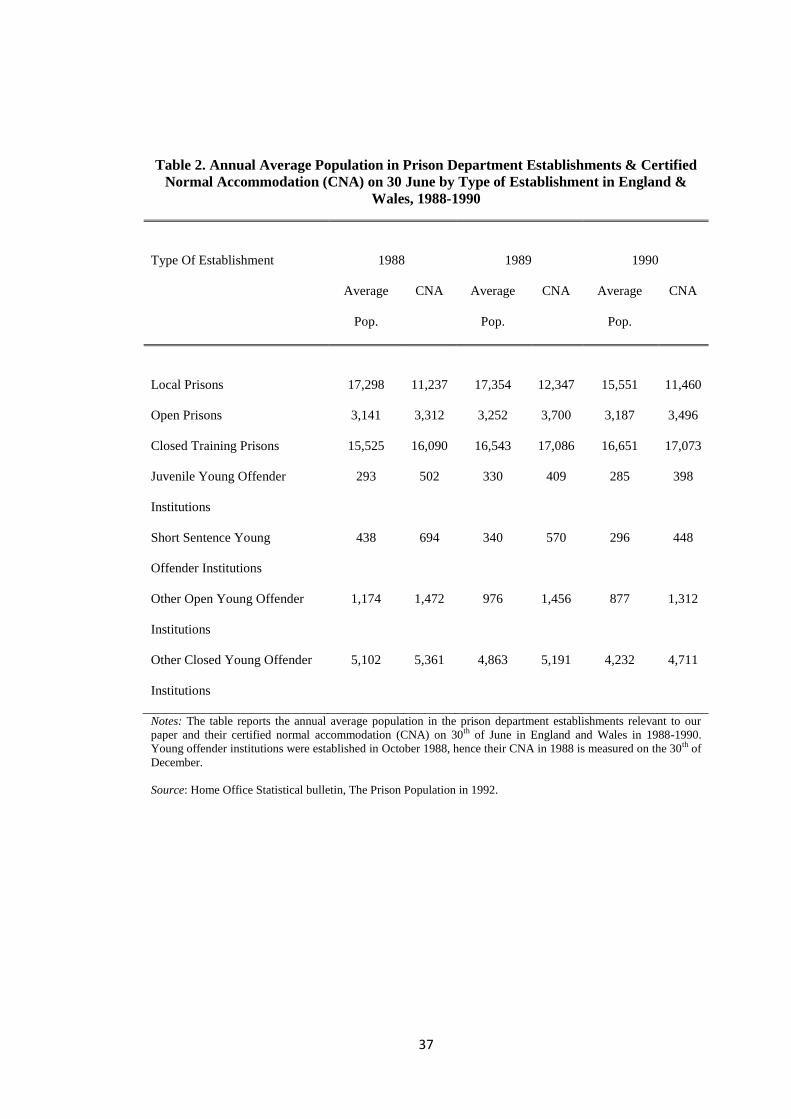
37
Table 2. Annual Average Population in Prison Department Establishments & Certified
Normal Accommodation (CNA) on 30 June by Type of Establishment in England &
Wales, 1988-1990
Type Of Establishment
1988
1989
1990
Average
Pop.
CNA Average
Pop.
CNA Average
Pop.
CNA
Local Prisons 17,298 11,237 17,354 12,347 15,551 11,460
Open Prisons 3,141 3,312 3,252 3,700 3,187 3,496
Closed Training Prisons 15,525 16,090 16,543 17,086 16,651 17,073
Juvenile Young Offender
Institutions
293 502 330 409 285 398
Short Sentence Young
Offender Institutions
438 694 340 570 296 448
Other Open Young Offender
Institutions
1,174 1,472 976 1,456 877 1,312
Other Closed Young Offender
Institutions
5,102 5,361 4,863 5,191 4,232 4,711
Notes: The table reports the annual average population in the prison department establishments relevant to our
paper and their certified normal accommodation (CNA) on 30th of June in England and Wales in 1988-1990.
Young offender institutions were established in October 1988, hence their CNA in 1988 is measured on the 30th of
December.
Source: Home Office Statistical bulletin, The Prison Population in 1992.
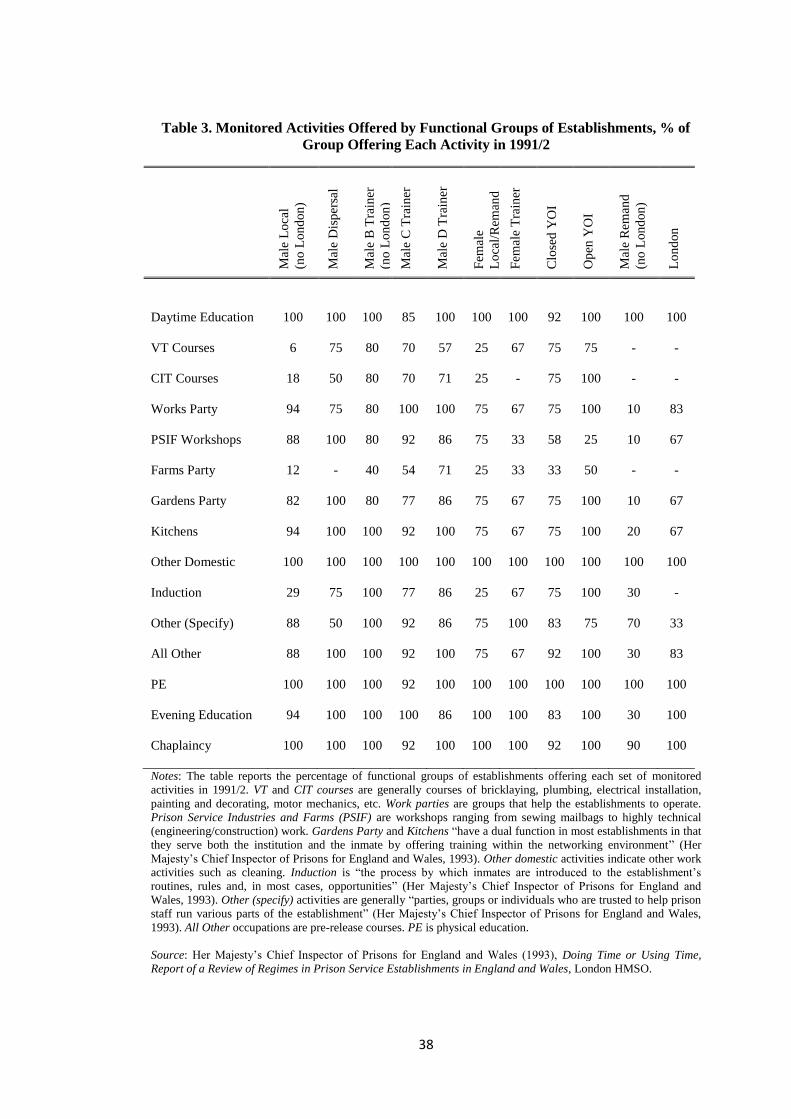
38
Table 3. Monitored Activities Offered by Functional Groups of Establishments, % of
Group Offering Each Activity in 1991/2
Mal
e L
oca
l
(no
Lon
don
)
Mal
e D
isp
ersa
l
Mal
e B
Tra
iner
(no
Lon
don
)
Mal
e C
Tra
iner
Mal
e D
Tra
iner
Fem
ale
Lo
cal/
Rem
and
Fem
ale
Tra
iner
Clo
sed
YO
I
Op
en Y
OI
Mal
e R
eman
d
(no
Lon
don
)
Lo
nd
on
Daytime Education 100 100 100 85 100 100 100 92 100 100 100
VT Courses 6 75 80 70 57 25 67 75 75 - -
CIT Courses 18 50 80 70 71 25 - 75 100 - -
Works Party 94 75 80 100 100 75 67 75 100 10 83
PSIF Workshops 88 100 80 92 86 75 33 58 25 10 67
Farms Party 12 - 40 54 71 25 33 33 50 - -
Gardens Party 82 100 80 77 86 75 67 75 100 10 67
Kitchens 94 100 100 92 100 75 67 75 100 20 67
Other Domestic 100 100 100 100 100 100 100 100 100 100 100
Induction 29 75 100 77 86 25 67 75 100 30 -
Other (Specify) 88 50 100 92 86 75 100 83 75 70 33
All Other 88 100 100 92 100 75 67 92 100 30 83
PE 100 100 100 92 100 100 100 100 100 100 100
Evening Education 94 100 100 100 86 100 100 83 100 30 100
Chaplaincy 100 100 100 92 100 100 100 92 100 90 100
Notes: The table reports the percentage of functional groups of establishments offering each set of monitored
activities in 1991/2. VT and CIT courses are generally courses of bricklaying, plumbing, electrical installation,
painting and decorating, motor mechanics, etc. Work parties are groups that help the establishments to operate.
Prison Service Industries and Farms (PSIF) are workshops ranging from sewing mailbags to highly technical
(engineering/construction) work. Gardens Party and Kitchens “have a dual function in most establishments in that
they serve both the institution and the inmate by offering training within the networking environment” (Her
Majesty’s Chief Inspector of Prisons for England and Wales, 1993). Other domestic activities indicate other work
activities such as cleaning. Induction is “the process by which inmates are introduced to the establishment’s
routines, rules and, in most cases, opportunities” (Her Majesty’s Chief Inspector of Prisons for England and
Wales, 1993). Other (specify) activities are generally “parties, groups or individuals who are trusted to help prison
staff run various parts of the establishment” (Her Majesty’s Chief Inspector of Prisons for England and Wales,
1993). All Other occupations are pre-release courses. PE is physical education.
Source: Her Majesty’s Chief Inspector of Prisons for England and Wales (1993), Doing Time or Using Time,
Report of a Review of Regimes in Prison Service Establishments in England and Wales, London HMSO.

39
Table 4. Summary Statistics
Mean Sd Min Max
(1) (2) (3) (4)
Panel A. 1963 Cohort
i. Offenders Characteristics
Male 0.932 0.252 0 1
White European 0.237 0.425 0 1
Afro-Caribbean 0.027 0.162 0 1
Oriental 0.002 0.042 0 1
Arab 0.002 0.042 0 1
Born in March 0.513 0.500 0 1
Born in Sept/Oct 0.247 0.432 0 1
Born in December 0.240 0.428 0 1
Age at first court appearance 16.783 2.274 14 21
ii. Offence Characteristics
Sentence length
Sentence length (months) 9.528 9.793 0.467 60
Plea
Plea: guilty 0.896 0.305 0 1
Proceedings
Apprehension 0.294 0.456 0 1
Committed to High/Crown Court for trial 0.572 0.495 0 1
Offence
Burglaries/Robberies 0.367 0.483 0 1
Thefts 0.305 0.461 0 1
Frauds 0.048 0.215 0 1
Violent Offences 0.170 0.376 0 1
Sexual Offences 0.011 0.103 0 1
Criminal Damage 0.011 0.103 0 1
Drug Offences 0.018 0.133 0 1
Motoring Offences 0.014 0.119 0 1
Minor Offences 0.029 0.167 0 1
Observations 558

40
Table 4 (continued): Summary statistics
Mean Sd Min Max
(1) (2) (3) (4)
Panel B. 1968 Cohort
i. Offenders Characteristics
Male 0.973 0.162 0 1
White European 0.582 0.494 0 1
Dark European 0.000 0.000 0 0
Afro-Caribbean 0.024 0.152 0 1
Asian 0.010 0.100 0 1
Born in March 0.209 0.407 0 1
Born in June 0.263 0.441 0 1
Born in Sept/Oct 0.242 0.429 0 1
Born in December 0.286 0.453 0 1
Age at first court appearance 15.391 2.983 10 21
ii. Offence Characteristics
Sentence length
Sentence length (months) 5.932 3.579 0 12
Plea
Plea: guilty 0.778 0.416 0 1
Proceedings
Apprehension 0.286 0.453 0 1
Committed to High/Crown Court for trial 0.535 0.500 0 1
Offence
Burglaries/Robberies 0.306 0.462 0 1
Thefts 0.259 0.439 0 1
Frauds 0.030 0.172 0 1
Violent Offences 0.229 0.421 0 1
Sexual Offences 0.007 0.082 0 1
Criminal Damage 0.007 0.082 0 1
Drug Offences 0.020 0.141 0 1
Motoring Offences 0.020 0.141 0 1
Minor Offences 0.067 0.251 0 1
Observations 297
Notes: This table reports the summary statistics of the two samples from the 1963 and 1968 cohorts of the
Offenders Index Cohort Data (Home Office Research, Development and Statistics Directorate). The 1963 sample
includes offenders who were sentenced to either youth custody/detention centres or adults’ prisons when being age
20/21 at the date of court appearance and who committed their first offence when older than 14. The 1968 sample
includes offenders who were sentenced to young offender institutions or adults’ prisons when being age 20/21 at
the date of court appearance, whose sentence was equal or shorter than one year and who committed an offence
before June 1990. In Panel A (B) the means, standard deviations, minima and maxima of the 1963 (1968) cohort
of offenders’ observable characteristics are reported, measured at the time the offenders were sentenced to either
youth custody/detention centres (young offender institutions) or adults’ prisons. If the offender was sentenced for
multiple offences at the court appearance, the characteristics of the offence for which the sentence was longer are
reported.

41
Table 5. First Stage - Parametric Approach
Notes: The table reports the first stages, i.e. how much of being sentenced to an adults’ prison depends on actually
being 21. Columns (1)-(2) refer to the sample from the 1963 cohort, which includes offenders who were sentenced
to either youth custody/detention centres or adults’ prisons when being age 20/21 at the date of court appearance
and who committed their first offence when older than 14; Columns (3)-(4) refer to the sample form the 1968
cohort, which includes offenders who were sentenced to young offender institutions or adults’ prisons when being
age 20/21 at the date of court appearance, whose sentence was equal or shorter than one year and who committed
an offence before June 1990. Robust standard errors are reported in parentheses: * p < 0.1, ** p < 0.05, *** p <
0.01. In Columns (2)-(4) control variables are included: gender, sentence length and other controls (ethnicity, plea,
proceedings, month of birth, type of offence and age at which the offender committed the first offence).
Independent Variable: Dummy=1 if Offender is 21 at Court Appearance
1963 cohort
1968 cohort
(1) (2) (3) (4)
Sentence to Adults’ Prison 0.761***
0.748***
0.891***
0.862***
(0.039) (0.039) (0.021) (0.043)
Age at Court 0.000***
0.000***
0.000**
0.000*
(0.000) (0.000) (0.000) (0.000)
Male -0.038 -0.051
(0.053) (0.074)
Sentence Length 0.002
(0.002)
0.003
(0.004)
Other Controls X
X
Centered R2
0.793 0.806 0.882 0.893
Uncentered R2 0.910
0.916 0.935 0.941
Observations 558 297

42
Table 6. Effects of Adults’ Prison vs. Youth Custody/Detention Centres (in the Next
Nine Years)
Independent Variable: Adults’ Prison
365 days Ludwig and
Miller
(2007)
274 days 183 days
(1) (2) (3) (5)
Likelihood to reoffend -0.207**
-0.208**
-0.196* -0.126
(0.095) (0.096) (0.109) (0.148)
Mean in Control Group 0.737
Offences -2.838***
-2.856***
-2.713**
-2.273*
(1.021) (1.028) (1.081) (1.339)
Mean in Control Group 5.243
Times to court -1.385***
-1.404***
-1.426**
-1.320*
(0.521) (0.527) (0.573) (0.739)
Mean in Control Group 2.749
Sentences to prison -0.920 -0.947 -0.962 -0.691
(0.613) (0.618) (0.648) (0.729)
Mean in Control Group 1.848
Observations 558 542 457 288
Notes: The table reports the effects of experiencing prison rather than youth custody/detention centres for the 1963
cohort of the Offenders Index Cohort Data (Home Office Research, Development and Statistics Directorate). The
1963 sample includes offenders who were sentenced to either youth custody/detention centres or adults’ prisons
when being age 20/21 at the date of court appearance and who committed their first offence when older than 14.
The time window over which the outcome variables are observed is nine years. Each set of rows corresponds to a
different outcome variable: the likelihood to reoffend (a dummy equal to 1 if the offender commits at least 1
offence in the future time window), the number of offences the offender commits, the times he/she is brought to
court and the times he/she is sentenced to prison again. The estimation is conducted through a local linear
regression constructed with a triangular kernel regression. Each Column corresponds to a different bandwidth
selection: in Column (1) the bandwidth is 365 days; in Column (2) the bandwidth is the one suggested by Ludwig
and Miller (2007); in Column (3) it is 274 days; in Column (4) it is 183 days. Standard errors are reported in
parentheses: * p < 0.1, ** p < 0.05, *** p < 0.01.

43
Table 7. Effects of Adults’ Prison vs. Youth Custody/Detention Centres by Type of
Offence (in the Next Nine Years)
Independent Variable: Adults’ Prison
365 days Ludwig and
Miller (2007)
274 days 183 days
(1) (2) (3) (5)
Thefts -0.906** -0.803 -0.967** -0.805
(0.456) (0.502) (0.445) (0.501)
Mean in Control Group
1.835
Violent offences -0.695** -0.698** -0.707** -0.843*
(0.299) (0.305) (0.348) (0.464)
Mean in Control Group
0.613
Sexual offences -0.021 -0.022 -0.016 -0.008
(0.037) (0.036) (0.032) (0.009)
Mean in Control Group
0.041
Burglaries/robberies -0.431* -0.442* -0.430 -0.234
(0.248) (0.250) (0.264) (0.332)
Mean in Control Group
0.716
Minor offences -0.318 -0.314 -0.267 -0.265
(0.292) (0.298) (0.338) (0.460)
Mean in Control Group
0.663
Frauds -0.146 -0.015 0.001 0.220
(0.207) (0.212) (0.213) (0.214)
Mean in Control Group
0.514
Criminal Damage -0.166** -0.161** -0.119 -0.075
(0.074) (0.075) (0.081) (0.100)
Mean in Control Group
0.144
Drug offences 0.127 0.125 0.119 0.128
(0.095) (0.096) (0.103) (0.121)
Mean in Control Group
0.165
Motoring Offences -0.039 -0.041 -0.073 -0.119**
(0.085) (0.085) (0.076) (0.051)
Mean in Control Group
0.082
Other offences† † -0.323** -0.320** -0.329** -0.334*
(0.156) (0.156) (0.157) (0.178)
Mean in Control Group
0.453
Observations 558 542 457 288 Notes: The table reports the effects of experiencing prison rather than youth custody/detention centres for the 1963 cohort of the Offenders
Index Cohort Data (Home Office Research, Development and Statistics Directorate). The 1963 sample includes offenders who were sentenced
to either youth custody/detention centres or adults’ prisons when being age 20/21 at the date of court appearance and who committed their
first offence when older than 14. The time window over which the outcome variables are observed is nine years. Each set of rows corresponds
to a different type of offence. The estimation is conducted through a local linear regression constructed with a triangular kernel regression.
Each Column corresponds to a different bandwidth selection: in Column (1) the bandwidth is 365 days; in Column (2) the bandwidth is the
one suggested by Ludwig and Miller (2007); in Column (3) it is 274 days; in Column (4) it is 183 days. Standard errors are reported in
parentheses: * p < 0.1, ** p < 0.05, *** p < 0.01. † Other offences include mainly: failing to surrender to bail (65.63%), going equipped for
stealing (20.79%) and other offences against the state or public order (6.55%).

44
Table 8. Effects of Adults’ Prison vs. Youth Custody/Detention Centres & vs. Young
Offender Institutions (in the 2.5 Years Following Release)
Independent Variable: Adults’ Prison
365 days Ludwig and
Miller (2007)
274 days 183 days
(1) (2) (3) (5)
Panel A. 1963 Cohort
Likelihood to reoffend -0.311*** -0.314*** -0.317** -0.238
(0.110) (0.112) (0.125) (0.163)
Mean in Control Group 0.573
Offences -1.029* -1.020* -0.893 -0.602
(0.603) (0.612) (0.679) (0.869)
Mean in Control Group 2.097
Times to court -0.567* -0.567* -0.541 -0.358
(0.292) (0.297) (0.336) (0.445)
Mean in Control Group 1.165
Sentences to prison -0.388 -0.393 -0.377 -0.284
(0.367) (0.372) (0.413) (0.528)
Mean in Control Group
0.694
Observations 445 435 364 228
Panel B. 1968 Cohort
Likelihood to reoffend 0.115 0.114 0.113 0.130
(0.124) (0.126) (0.140) (0.169)
Mean in Control Group 0.606
Offences 1.050 1.009 0.841 0.139
(0.992) (1.007) (1.104) (1.360)
Mean in Control Group 2.855
Times to court 0.351 0.340 0.365 0.253
(0.366) (0.372) (0.409) (0.485)
Mean in Control Group 1.303
Sentences to prison 1.281** 1.286** 1.311* 1.171
(0.618) (0.625) (0.670) (0.846)
Mean in Control Group
0.879
Observations 297 291 254 182
Notes: The table reports the effects of experiencing prison rather than youth custody/detention centres for the 1963
cohort (Panel A) and the effects of experiencing prison rather than young offender institutions for the 1968 cohort
(Panel B) of the Offenders Index Cohort Data (Home Office Research, Development and Statistics Directorate).
The 1963 sample includes offenders who were sentenced to either youth custody/detention centres or adults’
prisons when being age 20/21 at the date of court appearance and who committed their first offence when older
than 14. The 1968 sample includes offenders who were sentenced to young offender institutions or adults’ prisons
when being age 20/21 at the date of court appearance, whose sentence was equal or shorter than one year and who
committed an offence before June 1990. The time window over which the outcome variables are observed is 2.5
years following release from custody. Each set of rows corresponds to a different outcome variable: the likelihood
to reoffend (a dummy equal to 1 if the offender commits at least 1 offence in the future time window), the number
of offences the offender commits, the times he/she is brought to court and the times he/she is sentenced to prison
again. The estimation is conducted through a local linear regression constructed with a triangular kernel
regression. Each Column corresponds to a different bandwidth selection: in Column (1) the bandwidth is 365
days; in Column (2) the bandwidth is the one suggested by Ludwig and Miller (2007); in Column (3) it is 274
days; in Column (4) it is 183 days. Standard errors are reported in parentheses: * p < 0.1, ** p < 0.05, *** p <
0.01.
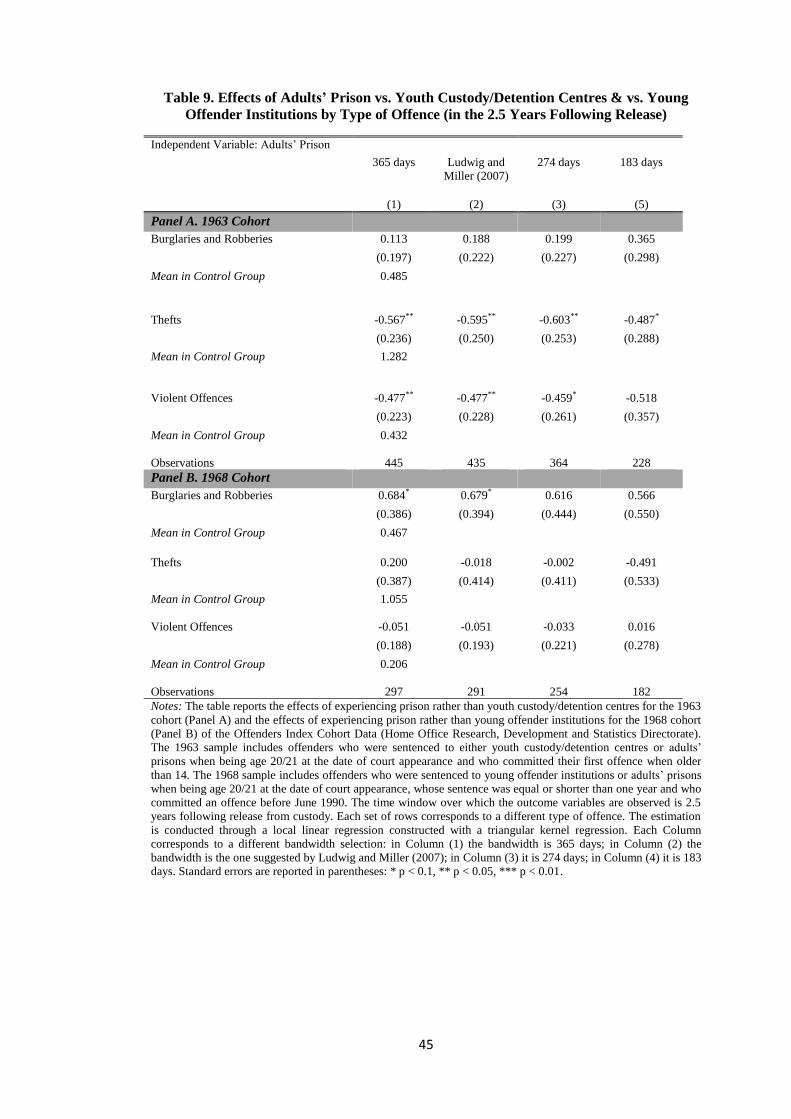
45
Table 9. Effects of Adults’ Prison vs. Youth Custody/Detention Centres & vs. Young
Offender Institutions by Type of Offence (in the 2.5 Years Following Release)
Notes: The table reports the effects of experiencing prison rather than youth custody/detention centres for the 1963
cohort (Panel A) and the effects of experiencing prison rather than young offender institutions for the 1968 cohort
(Panel B) of the Offenders Index Cohort Data (Home Office Research, Development and Statistics Directorate).
The 1963 sample includes offenders who were sentenced to either youth custody/detention centres or adults’
prisons when being age 20/21 at the date of court appearance and who committed their first offence when older
than 14. The 1968 sample includes offenders who were sentenced to young offender institutions or adults’ prisons
when being age 20/21 at the date of court appearance, whose sentence was equal or shorter than one year and who
committed an offence before June 1990. The time window over which the outcome variables are observed is 2.5
years following release from custody. Each set of rows corresponds to a different type of offence. The estimation
is conducted through a local linear regression constructed with a triangular kernel regression. Each Column
corresponds to a different bandwidth selection: in Column (1) the bandwidth is 365 days; in Column (2) the
bandwidth is the one suggested by Ludwig and Miller (2007); in Column (3) it is 274 days; in Column (4) it is 183
days. Standard errors are reported in parentheses: * p < 0.1, ** p < 0.05, *** p < 0.01.
Independent Variable: Adults’ Prison
365 days Ludwig and
Miller (2007)
274 days 183 days
(1) (2) (3) (5)
Panel A. 1963 Cohort
Burglaries and Robberies 0.113 0.188 0.199 0.365
(0.197) (0.222) (0.227) (0.298)
Mean in Control Group
0.485
Thefts -0.567** -0.595** -0.603** -0.487*
(0.236) (0.250) (0.253) (0.288)
Mean in Control Group
1.282
Violent Offences -0.477** -0.477** -0.459* -0.518
(0.223) (0.228) (0.261) (0.357)
Mean in Control Group
Observations
0.432
445
435
364
228
Panel B. 1968 Cohort
Burglaries and Robberies 0.684* 0.679* 0.616 0.566
(0.386) (0.394) (0.444) (0.550)
Mean in Control Group 0.467
Thefts 0.200 -0.018 -0.002 -0.491
(0.387) (0.414) (0.411) (0.533)
Mean in Control Group 1.055
Violent Offences -0.051 -0.051 -0.033 0.016
(0.188) (0.193) (0.221) (0.278)
Mean in Control Group
Observations
0.206
297
291
254
182
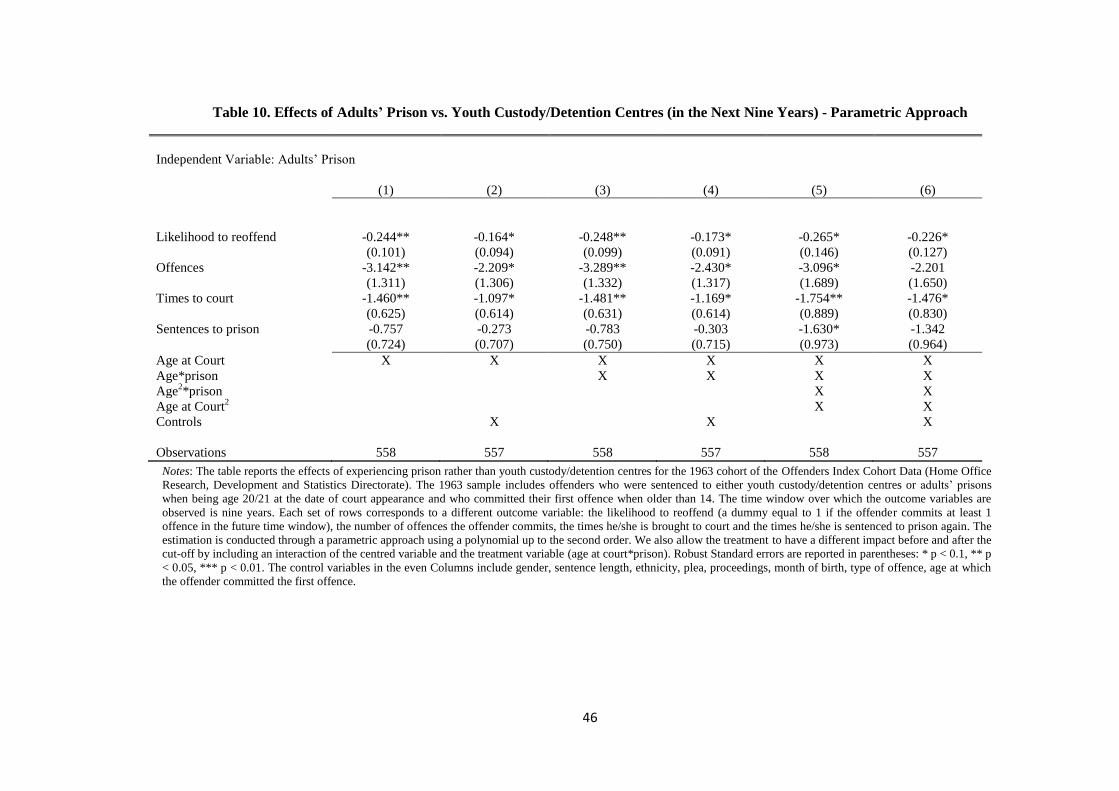
46
Table 10. Effects of Adults’ Prison vs. Youth Custody/Detention Centres (in the Next Nine Years) - Parametric Approach
Notes: The table reports the effects of experiencing prison rather than youth custody/detention centres for the 1963 cohort of the Offenders Index Cohort Data (Home Office
Research, Development and Statistics Directorate). The 1963 sample includes offenders who were sentenced to either youth custody/detention centres or adults’ prisons
when being age 20/21 at the date of court appearance and who committed their first offence when older than 14. The time window over which the outcome variables are
observed is nine years. Each set of rows corresponds to a different outcome variable: the likelihood to reoffend (a dummy equal to 1 if the offender commits at least 1
offence in the future time window), the number of offences the offender commits, the times he/she is brought to court and the times he/she is sentenced to prison again. The
estimation is conducted through a parametric approach using a polynomial up to the second order. We also allow the treatment to have a different impact before and after the
cut-off by including an interaction of the centred variable and the treatment variable (age at court*prison). Robust Standard errors are reported in parentheses: * p < 0.1, ** p
< 0.05, *** p < 0.01. The control variables in the even Columns include gender, sentence length, ethnicity, plea, proceedings, month of birth, type of offence, age at which
the offender committed the first offence.
Independent Variable: Adults’ Prison
(1) (2) (3) (4) (5) (6)
Likelihood to reoffend -0.244** -0.164* -0.248** -0.173* -0.265* -0.226*
(0.101) (0.094) (0.099) (0.091) (0.146) (0.127)
Offences -3.142** -2.209* -3.289** -2.430* -3.096* -2.201
(1.311) (1.306) (1.332) (1.317) (1.689) (1.650)
Times to court -1.460** -1.097* -1.481** -1.169* -1.754** -1.476*
(0.625) (0.614) (0.631) (0.614) (0.889) (0.830)
Sentences to prison -0.757 -0.273 -0.783 -0.303 -1.630* -1.342
(0.724) (0.707) (0.750) (0.715) (0.973) (0.964)
Age at Court X X X X X X
Age*prison X X X X
Age2*prison X X
Age at Court2 X X
Controls X X X
Observations 558 557 558 557 558 557
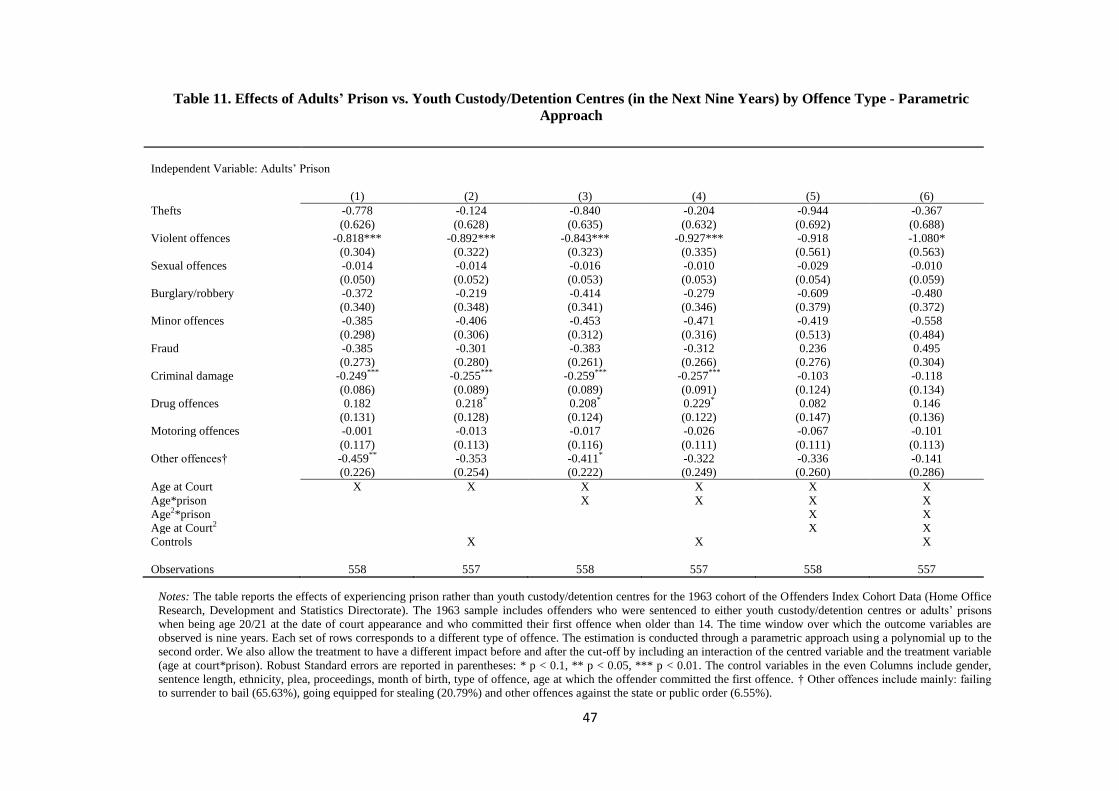
47
Table 11. Effects of Adults’ Prison vs. Youth Custody/Detention Centres (in the Next Nine Years) by Offence Type - Parametric
Approach
Notes: The table reports the effects of experiencing prison rather than youth custody/detention centres for the 1963 cohort of the Offenders Index Cohort Data (Home Office
Research, Development and Statistics Directorate). The 1963 sample includes offenders who were sentenced to either youth custody/detention centres or adults’ prisons
when being age 20/21 at the date of court appearance and who committed their first offence when older than 14. The time window over which the outcome variables are
observed is nine years. Each set of rows corresponds to a different type of offence. The estimation is conducted through a parametric approach using a polynomial up to the
second order. We also allow the treatment to have a different impact before and after the cut-off by including an interaction of the centred variable and the treatment variable
(age at court*prison). Robust Standard errors are reported in parentheses: * p < 0.1, ** p < 0.05, *** p < 0.01. The control variables in the even Columns include gender,
sentence length, ethnicity, plea, proceedings, month of birth, type of offence, age at which the offender committed the first offence. † Other offences include mainly: failing
to surrender to bail (65.63%), going equipped for stealing (20.79%) and other offences against the state or public order (6.55%).
Independent Variable: Adults’ Prison
(1) (2) (3) (4) (5) (6)
Thefts -0.778 -0.124 -0.840 -0.204 -0.944 -0.367
(0.626) (0.628) (0.635) (0.632) (0.692) (0.688)
Violent offences -0.818*** -0.892*** -0.843*** -0.927*** -0.918 -1.080*
(0.304) (0.322) (0.323) (0.335) (0.561) (0.563)
Sexual offences -0.014 -0.014 -0.016 -0.010 -0.029 -0.010
(0.050) (0.052) (0.053) (0.053) (0.054) (0.059)
Burglary/robbery -0.372 -0.219 -0.414 -0.279 -0.609 -0.480
(0.340) (0.348) (0.341) (0.346) (0.379) (0.372)
Minor offences -0.385 -0.406 -0.453 -0.471 -0.419 -0.558
(0.298) (0.306) (0.312) (0.316) (0.513) (0.484)
Fraud -0.385 -0.301 -0.383 -0.312 0.236 0.495
(0.273) (0.280) (0.261) (0.266) (0.276) (0.304)
Criminal damage -0.249*** -0.255*** -0.259*** -0.257*** -0.103 -0.118
(0.086) (0.089) (0.089) (0.091) (0.124) (0.134)
Drug offences 0.182 0.218* 0.208* 0.229* 0.082 0.146
(0.131) (0.128) (0.124) (0.122) (0.147) (0.136)
Motoring offences -0.001 -0.013 -0.017 -0.026 -0.067 -0.101
(0.117) (0.113) (0.116) (0.111) (0.111) (0.113)
Other offences† -0.459** -0.353 -0.411* -0.322 -0.336 -0.141
(0.226) (0.254) (0.222) (0.249) (0.260) (0.286)
Age at Court X X X X X X
Age*prison X X X X
Age2*prison X X
Age at Court2 X X
Controls X X X
Observations 558 557 558 557 558 557

48
Table 12. Effects of Adults’ Prison vs. Youth Custody/Detention Centres & vs. Young
Offender Institutions by Type of Offence (in the 2.5 Years Following Release) -
Parametric Approach
Notes: The table reports the effects of experiencing prison rather than youth custody/detention centres for the 1963 cohort
(Panel A) and the effects of experiencing prison rather than young offender institutions for the 1968 (Panel B) cohort of the
Offenders Index Cohort Data (Home Office Research, Development and Statistics Directorate). The 1963 sample includes
offenders who were sentenced to either youth custody/detention centres or adults’ prisons when being age 20/21 at the date
of court appearance and who committed their first offence when older than 14. The 1968 sample includes offenders who
were sentenced to young offender institutions or adults’ prisons when being age 20/21 at the date of court appearance, whose
sentence was equal or shorter than one year and who committed an offence before June 1990. The time window over which
the outcome variables are observed is 2.5 years following release from custody. Each set of rows corresponds to a different
outcome variable: the likelihood to reoffend (a dummy equal to 1 if the offender commits at least 1 offence in the future time
window), the number of offences the offender commits, the times he/she is brought to court and the times he/she is sentenced
to prison again. The estimation is conducted through a parametric approach using a polynomial up to the second order. We
also allow the treatment to have a different impact before and after the cut-off by including an interaction of the centred
variable and the treatment variable (age at court*prison). Each Column corresponds to a different bandwidth selection: in
Column (1) the bandwidth is 365 days; in Column (2) the bandwidth is the one suggested by Ludwig and Miller (2007); in
Column (3) it is 274 days; in Column (4) it is 183 days. Robust Standard errors are reported in parentheses: * p < 0.1, ** p <
0.05, *** p < 0.01. The control variables in the even Columns include gender, sentence length, ethnicity, plea, proceedings,
month of birth, type of offence, age at which the offender committed the first offence.
Independent Variable: Adults’ Prison
(1) (2) (3) (4) (5) (6)
Panel A: 1963 cohort
Likelihood to reoffend -0.346*** -0.354*** -0.356*** -0.363*** -0.521** -0.522***
(0.127) (0.126) (0.126) (0.124) (0.214) (0.198)
Offences -1.272* -1.224* -1.302** -1.250* -1.334 -1.113
(0.676) (0.708) (0.658) (0.699) (1.004) (1.011)
Times to court -0.663** -0.664** -0.672** -0.671** -0.817 -0.824*
(0.316) (0.318) (0.313) (0.317) (0.519) (0.492)
Sentences to prison -0.298 -0.404 -0.363 -0.457 -0.809 -0.697
(0.427) (0.457) (0.415) (0.448) (0.623) (0.642)
Age at Court X X X X X X
Age*prison X X X X
Age2*prison X X
Age at Court2 X X
Controls X X X
Observations 445 445 445 445 445 445
Panel B: 1968 cohort
Likelihood to reoffend 0.147 0.169 0.154 0.157 0.130 0.207
(0.118) (0.115) (0.120) (0.116) (0.205) (0.205)
Offences 1.596 0.698 1.722 0.699 0.835 0.838
(1.072) (1.077) (1.107) (1.093) (1.726) (1.927)
Times to court 0.537 0.481 0.540 0.455 0.288 0.423
(0.358) (0.362) (0.366) (0.369) (0.602) (0.648)
Sentences to prison 1.399** 0.990 1.463** 1.080* 1.894* 1.998*
(0.630) (0.607) (0.683) (0.645) (1.026) (1.164)
Age at Court X X X X X X
Age*prison X X X X
Age2*prison X X
Age at Court2 X X
Controls X X X
Observations 297 297 297 297 297 297
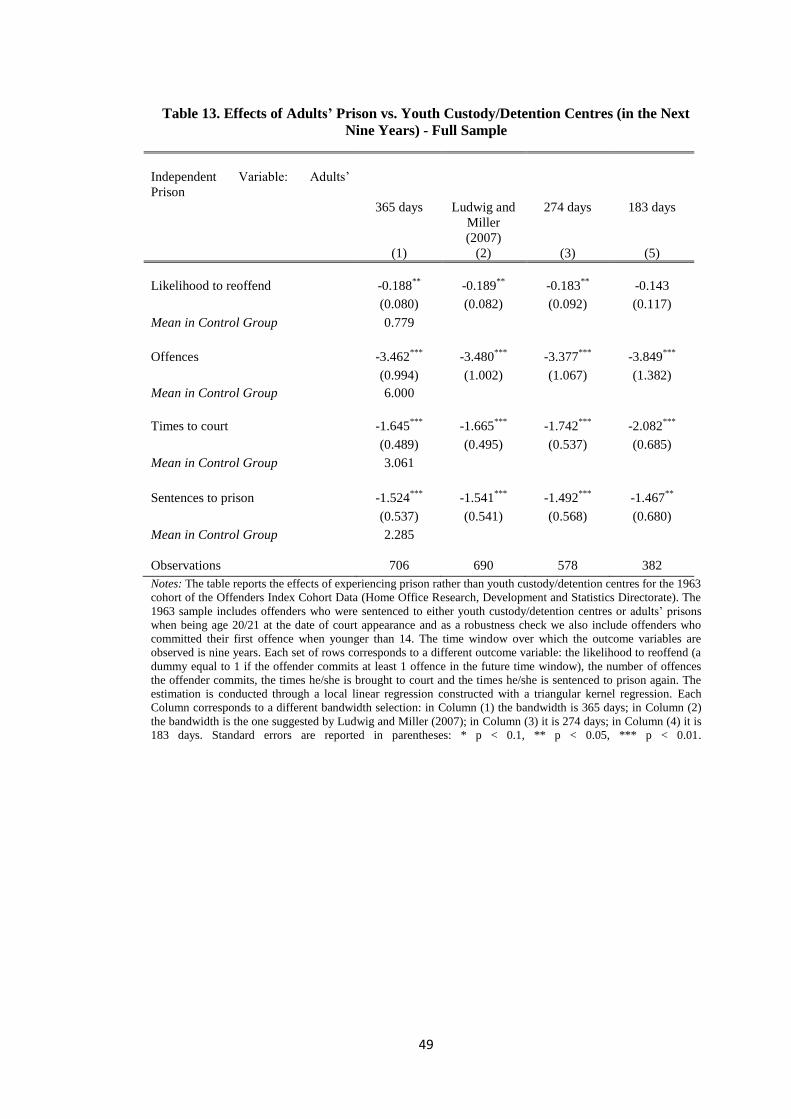
49
Table 13. Effects of Adults’ Prison vs. Youth Custody/Detention Centres (in the Next
Nine Years) - Full Sample
Independent Variable: Adults’
Prison
365 days Ludwig and
Miller
(2007)
274 days 183 days
(1) (2) (3) (5)
Likelihood to reoffend -0.188**
-0.189**
-0.183**
-0.143
(0.080) (0.082) (0.092) (0.117)
Mean in Control Group 0.779
Offences -3.462***
-3.480***
-3.377***
-3.849***
(0.994) (1.002) (1.067) (1.382)
Mean in Control Group 6.000
Times to court -1.645***
-1.665***
-1.742***
-2.082***
(0.489) (0.495) (0.537) (0.685)
Mean in Control Group 3.061
Sentences to prison -1.524***
-1.541***
-1.492***
-1.467**
(0.537) (0.541) (0.568) (0.680)
Mean in Control Group 2.285
Observations 706 690 578 382
Notes: The table reports the effects of experiencing prison rather than youth custody/detention centres for the 1963
cohort of the Offenders Index Cohort Data (Home Office Research, Development and Statistics Directorate). The
1963 sample includes offenders who were sentenced to either youth custody/detention centres or adults’ prisons
when being age 20/21 at the date of court appearance and as a robustness check we also include offenders who
committed their first offence when younger than 14. The time window over which the outcome variables are
observed is nine years. Each set of rows corresponds to a different outcome variable: the likelihood to reoffend (a
dummy equal to 1 if the offender commits at least 1 offence in the future time window), the number of offences
the offender commits, the times he/she is brought to court and the times he/she is sentenced to prison again. The
estimation is conducted through a local linear regression constructed with a triangular kernel regression. Each
Column corresponds to a different bandwidth selection: in Column (1) the bandwidth is 365 days; in Column (2)
the bandwidth is the one suggested by Ludwig and Miller (2007); in Column (3) it is 274 days; in Column (4) it is
183 days. Standard errors are reported in parentheses: * p < 0.1, ** p < 0.05, *** p < 0.01.

50
Table 14. Effects of Adults’ Prison vs. Youth Custody/Detention Centres (in the Next
Nine Years) by Offence Type - Full Sample
Independent Variable: Adults’ Prison
365 days Ludwig and
Miller (2007)
274 days 183 days
(1) (2) (3) (5)
Thefts -0.867* -1.459
** -1.042
** -1.375
**
(0.461) (0.678) (0.484) (0.617)
2.043
Violent offences -0.883***
-0.874***
-0.795***
-0.872**
(0.247) (0.251) (0.281) (0.365)
0.745
Sexual offences -0.017 -0.019 -0.027 -0.041*
(0.030) (0.029) (0.026) (0.023)
0.034
Burglaries/robberies -0.754***
-0.760***
-0.740**
-0.664*
(0.277) (0.279) (0.297) (0.358)
0.862
Minor offences -0.338 -0.328 -0.229 -0.253
(0.226) (0.229) (0.251) (0.317)
0.779
Frauds -0.232 -0.224 -0.154 -0.103
(0.197) (0.199) (0.213) (0.259)
0.607
Criminal Damage -0.120**
-0.115* -0.057 -0.034
(0.060) (0.060) (0.063) (0.072)
0.169
Drug offences 0.127 0.124 0.104 0.086
(0.080) (0.080) (0.087) (0.107)
0.175
Motoring Offences -0.046 -0.048 -0.084 -0.177**
(0.077) (0.077) (0.074) (0.078)
0.092
Other offences † -0.384***
-0.386***
-0.407***
-0.452***
(0.122) (0.122) (0.122) (0.146)
0.463
Observations 706 690 578 382 Notes: The table reports the effects of experiencing prison rather than youth custody/detention centres for the 1963
cohort of the Offenders Index Cohort Data (Home Office Research, Development and Statistics Directorate). The
1963 sample includes offenders who were sentenced to either youth custody/detention centres or adults’ prisons
when being age 20/21 at the date of court appearance and as a robustness check we also include offenders who
committed their first offence when younger than 14. The time window over which the outcome variables are
observed is nine years. Each set of rows corresponds to a different type of offence. The estimation is conducted
through a local linear regression constructed with a triangular kernel regression. Each Column corresponds to a
different bandwidth selection: in Column (1) the bandwidth is 365 days; in Column (2) the bandwidth is the one
suggested by Ludwig and Miller (2007); in Column (3) it is 274 days; in Column (4) it is 183 days. Standard
errors are reported in parentheses: * p < 0.1, ** p < 0.05, *** p < 0.01. † Other offences include mainly: failing to
surrender to bail (65.63%), going equipped for stealing (20.79%) and other offences against the state or public
order (6.55%).

51
Table 15. Effects of Adults’ Prison vs. Youth Custody/Detention Centres (in the Four
Years Following Release)
Independent Variable: Adults’ Prison
365 days Ludwig and
Miller
(2007)
274 days 183 days
(1) (2) (3) (5)
Likelihood to reoffend -0.357***
-0.362***
-0.391***
-0.387***
(0.093) (0.094) (0.106) (0.140)
Mean in Control Group 0.672
Offences -1.804**
-1.807**
-1.785**
-1.529
(0.749) (0.758) (0.820) (1.038)
Mean in Control Group 3.021
Times to court -0.961***
-0.966***
-0.981***
-0.841*
(0.331) (0.336) (0.375) (0.501)
Mean in Control Group 1.656
Sentences to prison -0.506 -0.514 -0.489 -0.217
(0.496) (0.501) (0.530) (0.620)
Mean in Control Group
1.104
Observations 555 539 454 286
Notes: The table reports the effects of experiencing prison rather than youth custody/detention centres for the 1963
cohort of the Offenders Index Cohort Data (Home Office Research, Development and Statistics Directorate). The
1963 sample includes offenders who were sentenced to either youth custody/detention centres or adults’ prisons
when being age 20/21 at the date of court appearance and who committed their first offence when older than 14.
The time window over which the outcome variables are observed is four years after release. Each set of rows
corresponds to a different outcome variable: the likelihood to reoffend (a dummy equal to 1 if the offender
commits at least 1 offence in the future time window), the number of offences the offender commits, the times
he/she is brought to court and the times he/she is sentenced to prison again. The estimation is conducted through a
local linear regression constructed with a triangular kernel regression. Each Column corresponds to a different
bandwidth selection: in Column (1) the bandwidth is 365 days; in Column (2) the bandwidth is the one suggested
by Ludwig and Miller (2007); in Column (3) it is 274 days; in Column (4) it is 183 days. Standard errors are
reported in parentheses: * p < 0.1, ** p < 0.05, *** p < 0.01.

52
SUPPLEMENTAL ONLINE
APPENDIX

53
Appendix Figure A 1. Pre-Treatment Variables (20 bins)
Panel A – 1963 cohort

54
Panel B – 1968 cohort

55

56
Notes: The figures above refer to the two samples from the 1963 (Panel A) and 1968 (Panel B) cohorts of the Offenders Index Cohort Data (Home
Office Research, Development and Statistics Directorate). The 1963 sample includes offenders who were sentenced to either youth
custody/detention centres or adults’ prisons when being age 20/21 at the date of court appearance and who committed their first offence when older
than 14. The 1968 sample includes offenders who were sentenced to young offender institutions or adults’ prisons when being age 20/21 at the date
of court appearance, whose sentence was equal or shorter than one year and who committed an offence before June 1990. On the x axis lies the
variable age at court appearance, centred at 0 when age at court appearance is 21. Age at court appearance is positive (negative) when young
offenders are older (younger) than 21. On the y axis there are the shares of pre-treatment characteristics: gender, month of birth, ethnicity, age at
first court appearance, sentence length, proceedings type, plea and type of offence committed when 20/21 years old. The coloured areas represent
the 90% confidence intervals around the separate lines of quadratic best fit plotted on the left and right hand side of the cut-off.

57
Appendix Table A 1. Proceedings Characteristics in More Detail
Mean Sd Min Max
(1) (2) (3) (4)
Panel A. 1963 cohort
Proceedings
Apprehension 0.292 0.455 0 1
Summons by police 0.016 0.126 0 1
Committed for sentence - young offenders institution (over 6 months) 0.002 0.042 0 1
Committed for sentence for offences triable either way 0.032 0.177 0 1
Committed to High/Crown Court for trial on indictment 0.573 0.495 0 1
Committed to High/Crown Court for sentence for offences tried summarily 0.002 0.042 0 1
Appearance for sentence after deferment without further conviction 0.004 0.060 0 1
Notice of Transfer 0.004 0.060 0 1
Breach of an order for conditional discharge 0.002 0.042 0 1
Breach of requirements of probation order 0.002 0.042 0 1
Breach of requirements of probation order over 1 year and up to 2 years (dealt
with for original offence)
0.007 0.084 0 1
Breach of requirements of probation order over 2 years (dealt with for original
offence)
0.004 0.060 0 1
Breach of probation order for 6 months following the commission of a fresh
offence
0.002 0.042 0 1
Breach of probation order with a term of over 1 year and up to 2 years following
the commission of a fresh offence
0.007 0.084 0 1
Breach of requirements of community service order 0.002 0.042 0 1
Breach of requirements of community service order; order revoked (dealt with for
original offence)
0.016 0.126 0 1
Breach of sentence of imprisonment suspended for 1 year, no supervision order
ever in force Breach of fully suspended sentence of imprisonment
0.007 0.084 0 1
Breach of sentence of imprisonment suspended for over 1 year and up to 2 years,
no supervision order ever in force
0.027 0.162 0 1
Observations 558
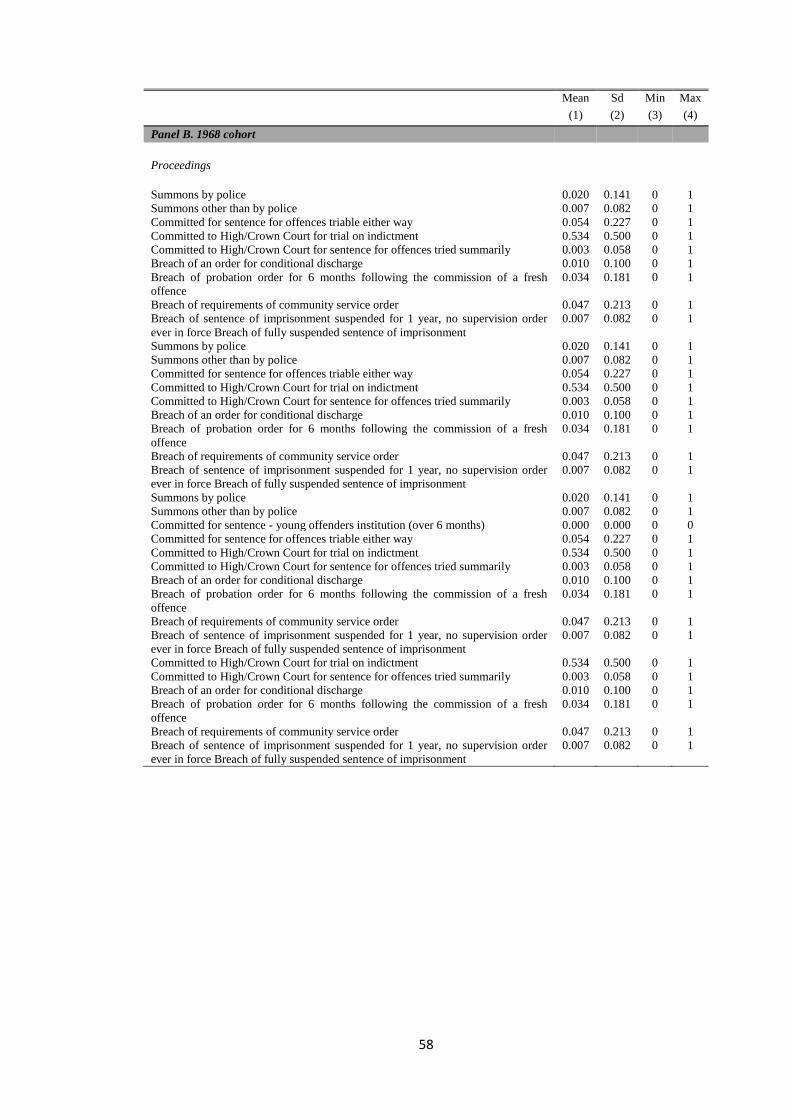
58
Mean Sd Min Max
(1) (2) (3) (4)
Panel B. 1968 cohort
Proceedings
Summons by police 0.020 0.141 0 1
Summons other than by police 0.007 0.082 0 1
Committed for sentence for offences triable either way 0.054 0.227 0 1
Committed to High/Crown Court for trial on indictment 0.534 0.500 0 1
Committed to High/Crown Court for sentence for offences tried summarily 0.003 0.058 0 1
Breach of an order for conditional discharge 0.010 0.100 0 1
Breach of probation order for 6 months following the commission of a fresh
offence
0.034 0.181 0 1
Breach of requirements of community service order 0.047 0.213 0 1
Breach of sentence of imprisonment suspended for 1 year, no supervision order
ever in force Breach of fully suspended sentence of imprisonment
0.007 0.082 0 1
Summons by police 0.020 0.141 0 1
Summons other than by police 0.007 0.082 0 1
Committed for sentence - young offenders institution (over 6 months) 0.000 0.000 0 0
Committed for sentence for offences triable either way 0.054 0.227 0 1
Committed to High/Crown Court for trial on indictment 0.534 0.500 0 1
Committed to High/Crown Court for sentence for offences tried summarily 0.003 0.058 0 1
Breach of an order for conditional discharge 0.010 0.100 0 1
Breach of probation order for 6 months following the commission of a fresh
offence
0.034 0.181 0 1
Breach of requirements of community service order 0.047 0.213 0 1
Breach of sentence of imprisonment suspended for 1 year, no supervision order
ever in force Breach of fully suspended sentence of imprisonment
0.007 0.082 0 1

59
Mean Sd Min Max
(1) (2) (3) (4)
Panel B. 1968 cohort – continuation
Proceedings
Committed to High/Crown Court for trial on indictment 0.534 0.500 0 1
Committed to High/Crown Court for sentence for offences tried summarily 0.003 0.058 0 1
Breach of an order for conditional discharge 0.010 0.100 0 1
Breach of probation order for 6 months following the commission of a fresh
offence
0.034 0.181 0 1
Breach of requirements of community service order 0.047 0.213 0 1
Breach of sentence of imprisonment suspended for 1 year, no supervision order
ever in force Breach of fully suspended sentence of imprisonment
0.007 0.082 0 1
Observations 296
Notes: This table reports the means, standard deviations, minima and maxima of the detailed proceedings of the two samples from the 1963 (Panel A) and 1968 (Panel B) cohorts of the Offenders Index Cohort Data (Home Office Research, Development
and Statistics Directorate) at the time the offenders were sentenced to either youth custody/detention centres/young offender
institutions or adults’ prisons. The 1963 sample includes offenders who were sentenced to either youth custody/detention centres
or adults’ prisons when being age 20/21 at the date of court appearance and who committed their first offence when older than
14. The 1968 sample includes offenders who were sentenced to young offender institutions or adults’ prisons when being age 20/21 at the date of court appearance, whose sentence was equal or shorter than one year and who committed an offence before
June 1990. If the offender was sentenced for multiple offences at the court appearance, the proceedings of the offence for which
the sentence was longer are reported.

60
Appendix Table A 2. Offence Characteristics in More Detail
Mean Sd Min Max
(1) (2) (3) (4)
Panel A. 1963 cohort
Offence
Manslaughter 0.002 0.042 0 1
Wounding and other acts endangering life (felonies) 0.014 0.119 0 1
Malicious wounding and other like offences
(misdemeanours)
0.131 0.338 0 1
Assault 0.009 0.094 0 1
Rape 0.005 0.073 0 1
Indecent assault on a female 0.004 0.060 0 1
Unlawful sexual intercourse with girl under 16 0.002 0.042 0 1
Burglary in a dwelling (1979- ) 0.158 0.365 0 1
Burglary, other than a dwelling 0.156 0.363 0 1
Going equipped for stealing 0.005 0.073 0 1
Robbery and assaults with intent to rob 0.054 0.226 0 1
Stealing in a dwelling other than from automatic machines
and meters
0.002 0.042 0 1
Stealing by an employee (1976- ) 0.004 0.060 0 1
Theft from vehicle 0.018 0.133 0 1
Stealing from shops and stalls (shoplifting) (1976- ) 0.043 0.203 0 1
Stealing from automatic machines and meters (1976- ) 0.009 0.094 0 1
Other stealings and unauthorised takings 0.115 0.319 0 1
Other frauds 0.038 0.190 0 1
Receiving/handling stolen goods 0.052 0.222 0 1
Arson 0.005 0.073 0 1
Other criminal Damage 0.005 0.073 0 1
Uttering or possessing counterfeit coin 0.011 0.103 0 1
Other offences (against the State and Public Order) 0.023 0.151 0 1
Perjury and false statements 0.002 0.042 0 1
Misuse of Drugs 0.020 0.139 0 1
Possession of firearms by persons previously convicted of
crime
0.002 0.042 0 1
Bail Act 1976 0.005 0.073 0 1
Assault 0.014 0.119 0 1
Interference with a motor vehicle 0.004 0.060 0 1
Criminal and malicious damage 0.013 0.111 0 1
Non-patrial having only limited leave remains in United
Kingdom beyond the time limit
0.002 0.042 0 1
Theft or unauthorised taking of motor vehicle 0.059 0.236 0 1
Dangerous driving 0.002 0.042 0 1
Driving licence offences 0.014 0.119 0 1
Observations 558

61
Mean Sd Min Max
(1) (2) (3) (4)
Panel B. 1968 cohort
Offence
Manslaughter 0.010 0.100 0 1
Wounding and other acts endangering life (felonies) 0.003 0.058 0 1
Malicious wounding and other like offences (misdemeanours) 0.186 0.390 0 1
Assault 0.003 0.058 0 1
Indecent assault on a female 0.003 0.058 0 1
Burglary in a dwelling (1979- ) 0.145 0.353 0 1
Aggravated burglary in a dwelling 0.007 0.082 0 1
Burglary, other than a dwelling 0.145 0.353 0 1
Going equipped for stealing, etc. 0.007 0.082 0 1
Robbery and assaults with intent to rob 0.010 0.100 0 1
Blackmail 0.007 0.082 0 1
Kidnapping 0.003 0.058 0 1
Stealing in a dwelling other than from automatic machines and meters 0.007 0.082 0 1
Theft from vehicle 0.041 0.198 0 1
Stealing from shops and stalls (shoplifting) (1976- ) 0.041 0.198 0 1
Stealing from automatic machines and meters (1976- ) 0.003 0.058 0 1
Theft or unauthorised taking of motor vehicle 0.054 0.227 0 1
Other stealing and unauthorised takings 0.101 0.302 0 1
Other frauds 0.024 0.152 0 1
Receiving/handling stolen goods 0.017 0.129 0 1
Other criminal Damage 0.007 0.082 0 1
Uttering or possessing counterfeit coin 0.007 0.082 0 1
Violent disorder 0.014 0.116 0 1
Other offences (against the State and Public Order) 0.027 0.162 0 1
Perjury 0.003 0.058 0 1
Gross indecency with a child 0.003 0.058 0 1
Misuse of Drugs 0.020 0.141 0 1
Absconding from lawful custody 0.003 0.058 0 1
Bail Act 1976 0.010 0.100 0 1
Assault 0.027 0.162 0 1
Interference with a motor vehicle 0.007 0.082 0 1
Stealing and unauthorised taking 0.020 0.141 0 1
Criminal and malicious damage 0.003 0.058 0 1
Dangerous driving 0.020 0.141 0 1
Driving licence related offences 0.010 0.100 0 1
Observations 296 Notes: This table reports the means, standard deviations, minima and maxima of the detailed offences of the two samples from
the 1963 (Panel A) and 1968 (Panel B) cohorts of the Offenders Index Cohort Data (Home Office Research, Development and
Statistics Directorate) at the time the offenders were sentenced to either youth custody/detention centres/young offender
institutions or adults’ prisons. The 1963 sample includes offenders who were sentenced either to youth custody/detention centres
or to adults’ prisons when being age 20/21 at the date of court appearance and who committed their first offence when older than
14. The 1968 sample includes offenders who were sentenced to young offender institutions or adults’ prisons when being age 20/21 at the date of court appearance, whose sentence was equal or shorter than one year and who committed an offence before
June 1990. If the offender was sentenced for multiple offences at the court appearance, the offence for which the sentence was
longer is reported.