Embed Size (px)
Citation preview

28
China
Total Factor Productivity Change and Poverty
Reduction in China:
Experiences from Three Counties
Can Liu
China National Forestry Economics and Development Research Center
Beijing, China
Abstract
A two-stage model of stochastic frontier approach has been used to study the
productivity of 414 households in Jinzhai County, Muchaun County and Suichuan
County in the Center and West of China. This study shows that total factor
productivity (TFP) of these sample households are stable during the period of
1991 to 2001 and there is direct linkage between TFP of households and poverty
reduction, illustrating that improving economic performance helps to reduce the
poverty trap. Rural institutional arrangements and changes, such as a household
responsibility system and timber market control have affected the TFP of sample
households. Different characteristics of sample households have directly influenced
their economic performance. If farmers generate incomes from forestry and farming
activities, it will not guarantee escape from the poverty trap. Increased use of
inputs and improving economic performances are important means whereby
income-generation can help to reduce poverty.
1. Introduction
China has achieved spectacular economic growth since 1978 with real per
capita gross domestic product and real per capita income more than
quadrupling. By 2000, China’s gross national product (GNP) ranked number seven
in the world in nominal terms and number two in purchasing power parity (PPP). Its
GNP measured in PPP was $4966 billion, which was 48% greater than Japan’s (World
Bank 2002). However, despite the great success, economic development in China has
not been without serious problems, particularly in poverty stricken rural regions. In
2003, even under China’s low standard of income poverty (China’s narrow standard
of income is that farmer’s annual income is 664 Yuan RMB per capita), 29 million
people were considered absolutely poor (National Statistics Bureau 2004). Remoteness
and isolation are correlated with poverty, 496 of the 592 officially designated poverty-
29
China
stricken counties are in forested, mountainous regions. At the same time, forestry
often represents the main and sometimes the only income-generating activity in many
poor regions. Statistical data suggest a significant overlap between counties officially
classified as having abundant forest resources with counties classified as having severe
poverty. Researchers have not yet conducted any analysis of the relationships between
forest availability and farmer income. The linkage between the poor and forestry
development is still under discussion.
Forest resources management and forestry development also play important
roles in the southern collective forestry region of China, which includes the provinces
of Zhejiang, Anhui, Fujian, Jiangxi, Hubei, Hunan, Guangdong, Hainan and Guizhou,
parts of Sichuan Province and Guangxi Autonomous Region. The percent of forest
area and forest stock volume of the southern collective forest region accounted for
38.40% and 17.79% of China respectively, with regard to forest plantation, the weight
is 54.4% and 52.02% respectively (State Forestry Administration of China 2000).
Since the early 1980s, the Government of China has introduced the household
responsibility system (HRS) and other institutional changes that have had immense
impacts on the lives and livelihoods of individuals, local communities and even the
national economy (Lin 1992, Zhang et al. 2000). There remain, however, many
unanswered questions about these changes which I seek to address a few of in this
paper. Have these measures affected total factor productivity changes or not? If so,
what and how large have the changes been? What has been the economic performance
of the southern collective forestry region after 1990? What is the relationship between
total factor productivity and poverty reduction, especially for abundant forest areas?
Numerous studies have analyzed these institutional arrangements and changes
in rural China (Myers 1970, Lin 1988, Schultz 1990). Some studies used provincial
level data for all or most of China (Lin 1992, Kim 1990), others use township level
data (Lin 1986) and some have used team-level data (Kim 1990). A few studies have
used household level data, but the use of household level data for evaluating rural
development after 1978 has been limited. Most researchers have used the Cobb-
Douglas production function to estimate economic performance in rural China but
this function does not account for inefficiency. A few researchers (Yin 1995, Liu et al..
2001) have begun to look at these questions. To the best of my knowledge, the
stochastic frontier production approach, especially in terms of the multi-input and
multi-output trans-log production function, has seldom been used for forest abundant
areas or to evaluate rural economic performance and poverty reduction in China.
This paper considers the estimation of a stochastic frontier production function
as introduced by Aigner et al. (1977) and Meeusen and van Broeck (1977). Such a
production frontier model consists of a production function of the usual regression
type but with an error term equal to the sum of two parts. The first part is typically
assumed to be normally distributed and represents the usual statistical noise. The
second part is non-positive and represents technical inefficiency, such as the failure
to produce maximal output with a given set of inputs. Realized output is bounded
from above by a frontier that includes the deterministic part of the regression, plus

30
China
the part of the error representing error, so the frontier is stochastic. F rsund et al..
(1980) provide a good survey of such production functions and their relationship to
the measurement of production efficiency. There are great potential advantages to
modifying existing frontier models to allow the use of panel data (Schmidt and Sickles
1984). In this paper, I exploit these advantages using a unique panel dataset of three
case study counties in the southern forest area of China to identify household-specific
Malmquist total factor productivity (TFP). I also examine the independent factors for
efficiency in the southern forest area of China, to find a solution for increasing
efficiency and reducing poverty (i.e. the two-stage estimation procedure is adopted in
this study).
Pitt and Lee (1981) estimated stochastic frontiers to predict firm-level efficiencies.
They then regressed the predicted efficiencies upon a firm specific variable. However,
the two-stage estimation procedure adopted by Pitt and Lee was unlikely to provide
estimates as efficient as those obtained through a one-stage estimation procedure.
Kumbhakar et al. (1991) noticed the drawbacks in the two-stage estimation procedure.
They proposed that inefficiency effects be expressed as a function of a vector of
firm-specific variables and a random error. Battese and Coelli (1995) specified a
stochastic frontier production function model with technical inefficiency effects to
identify some of the reasons for differences in predicted efficiencies among firms.
The model was equivalent to that specified by Kumbhakar et al.. (1991), with the
exception that allocation efficiency was assumed and panel data permitted. Chen and
Brown (2001) adopted the two-stage model to empirically analyze shortcomings in
the household responsibility system (HRS) in Shandong Province, China. In this study,
I use the FRONTIER 4.1 program to estimate the stochastic frontier model of Battese
and Coelli (1995).
This paper uses a unique panel dataset from 414 households in Jinzhai County,
Anhui Province; Muchuan County, Sichuan Province; and Suichuan County, Jiangxi
Province from 1990 to 2001. The panel dataset includes forestry production values,
farming (including animal husbandry) production values, forestland area, and farmland
area and investment and labor inputs for forestry and farming sectors.
The paper is organized into the following sections: In section 2, I discuss the
model specification of two-stage model of stochastic frontier production analysis. In
section 3, I describe the panel dataset from the three case study counties. In section 4,
I present empirical results of the stochastic frontier production analysis estimations
and factor analysis for TFP. In section 5, I explore the poverty reduction and TFP
link. Finally, in section 6, I discuss my results and present my conclusions.
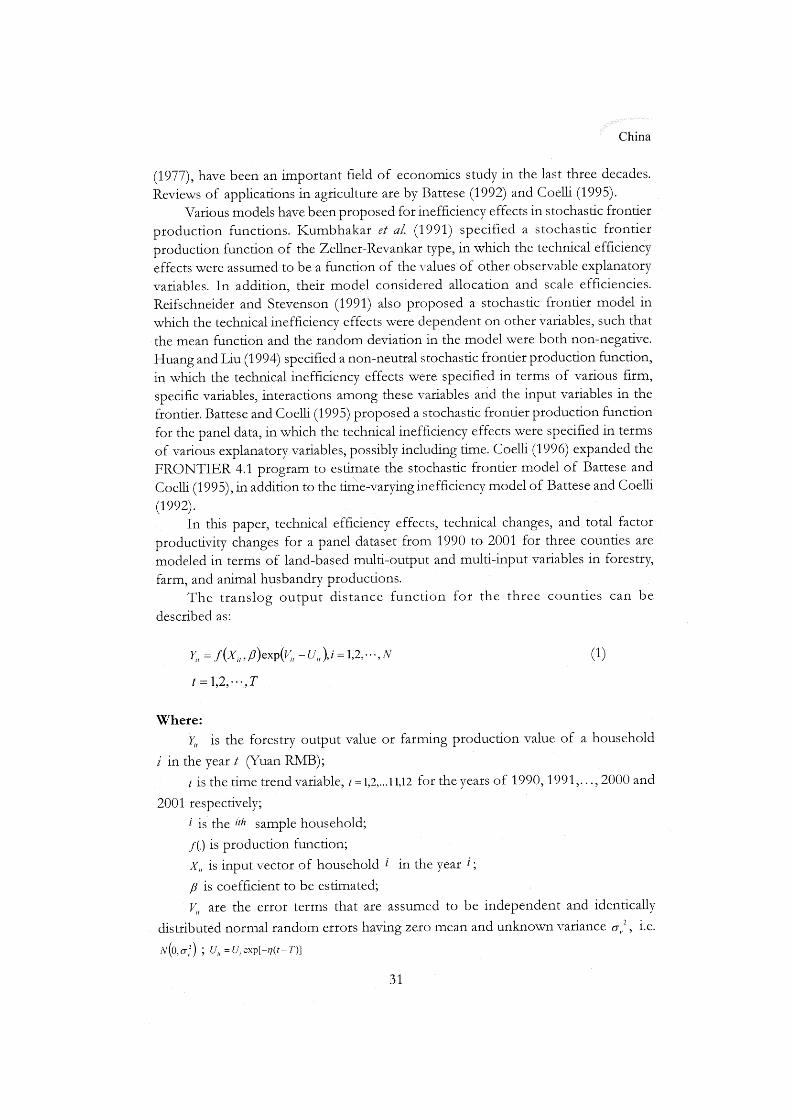
2. Model Specification
The modeling and estimation of stochastic frontier production functions,
originally proposed by Aigner et al.. (1977) and Meeusen and van den Broeck


35
China
3. Data
Jinzhai County, located in West Anhui Province, Central China, lies at 31o6'-
31o48' N, 115o22'-116o11' E. With 28 townships and 437 villages, it has a
population of 637,310, more than 90% of which lived in rural areas in 2001. This
county occupied a total area of 3814 km2. Suichuan County lies in the southwest of
Jiangxi Province, Central China, or 26o- 26o45' N and 113o40'-114o40' E, it had
a population of 506,620 in 2001. Muchuan County is located in the southwest of
Sichuan Province, West of China, and occupied 1387.55 km2 with a population of
254,910 in 2001. These three case study counties are well known in China for their
high level of poverty and abundant forest resources. In 2001, forest cover in Jinzhai,
Suichuan, and Muchuan counties was 70.30%, 75.80% and 70.30% respectively.
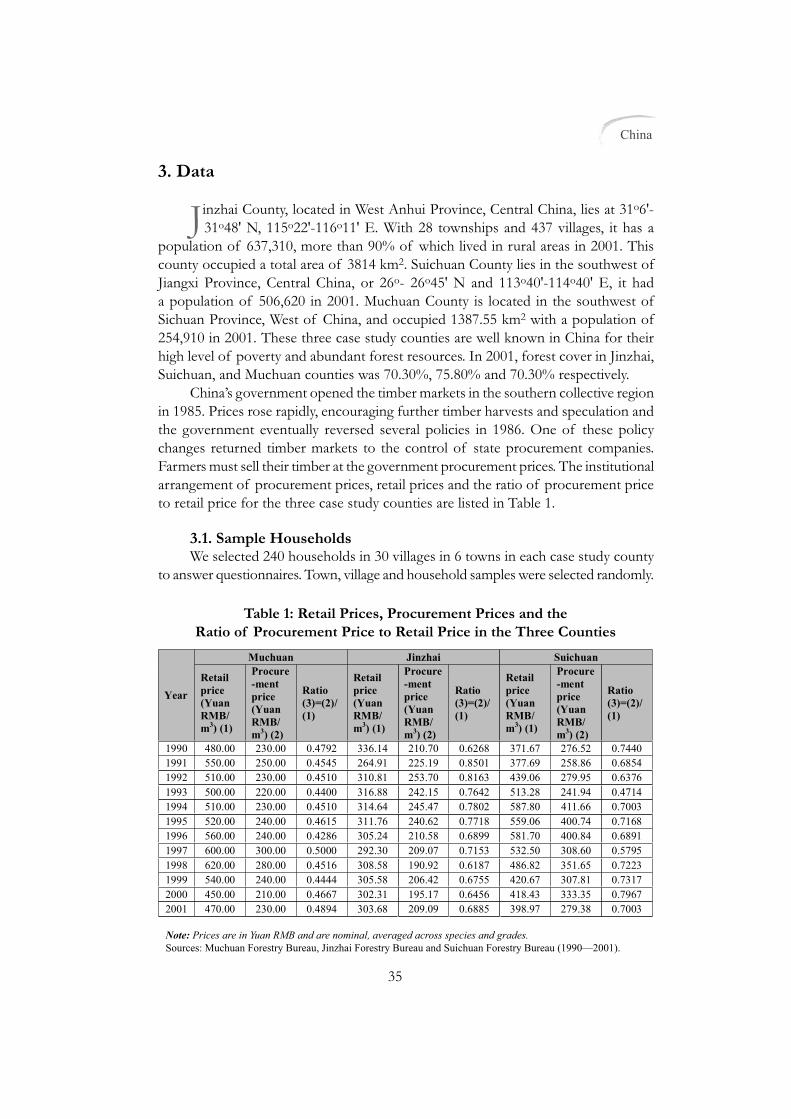
China’s government opened the timber markets in the southern collective region
in 1985. Prices rose rapidly, encouraging further timber harvests and speculation and
the government eventually reversed several policies in 1986. One of these policy
changes returned timber markets to the control of state procurement companies.
Farmers must sell their timber at the government procurement prices. The institutional
arrangement of procurement prices, retail prices and the ratio of procurement price
to retail price for the three case study counties are listed in Table 1.
3.1. Sample HouseholdsWe selected 240 households in 30 villages in 6 towns in each case study county
to answer questionnaires. Town, village and household samples were selected randomly.
Table 1: Retail Prices, Procurement Prices and the
Ratio of Procurement Price to Retail Price in the Three Counties
Note: Prices are in Yuan RMB and are nominal, averaged across species and grades.
Sources: Muchuan Forestry Bureau, Jinzhai Forestry Bureau and Suichuan Forestry Bureau (1990—2001).
Muchuan Jinzhai Suichuan
Year
Retail
price
(Yuan
RMB/
m3) (1)
Procure
-ment
price
(Yuan
RMB/
m3) (2)
Ratio
(3)=(2)/
(1)
Retail
price
(Yuan
RMB/
m3) (1)
Procure
-ment
price
(Yuan
RMB/
m3) (2)
Ratio
(3)=(2)/
(1)
Retail
price
(Yuan
RMB/
m3) (1)
Procure
-ment
price
(Yuan
RMB/
m3) (2)
Ratio
(3)=(2)/
(1)
1990 480.00 230.00 0.4792 336.14 210.70 0.6268 371.67 276.52 0.7440
1991 550.00 250.00 0.4545 264.91 225.19 0.8501 377.69 258.86 0.6854
1992 510.00 230.00 0.4510 310.81 253.70 0.8163 439.06 279.95 0.6376
1993 500.00 220.00 0.4400 316.88 242.15 0.7642 513.28 241.94 0.4714
1994 510.00 230.00 0.4510 314.64 245.47 0.7802 587.80 411.66 0.7003
1995 520.00 240.00 0.4615 311.76 240.62 0.7718 559.06 400.74 0.7168
1996 560.00 240.00 0.4286 305.24 210.58 0.6899 581.70 400.84 0.6891
1997 600.00 300.00 0.5000 292.30 209.07 0.7153 532.50 308.60 0.5795
1998 620.00 280.00 0.4516 308.58 190.92 0.6187 486.82 351.65 0.7223
1999 540.00 240.00 0.4444 305.58 206.42 0.6755 420.67 307.81 0.7317
2000 450.00 210.00 0.4667 302.31 195.17 0.6456 418.43 333.35 0.7967
2001 470.00 230.00 0.4894 303.68 209.09 0.6885 398.97 279.38 0.7003

36
China
We received responses from 628 households covering the 12-year time span from
1990 to 2001. This paper analyzes efficiency and poverty reduction in accordance
with the data and information collected from these households and secondary data
from the three counties. For various reasons including failure to completely fill out
the questionnaire or other inconsistencies in the data, the analysis is conducted on
data from only 414 households. All production investments were deflated by the
general rural retail price index of industrial produce to the real price of 1990. Forestry
production values and farming production values were transformed by using the
general purchasing price index of farm products to the real price of 1990 (National
Statistic Bureau 2003).
Table 2 presents summary statistics of the variables of interest in the analysis.
They include the sample mean value and the minimum and maximum values for each
of the variables. Generally speaking, the data for the study covered small-scale, family-
managed farm and forestry units, which are predominant in the three counties.
Characteristics of sample households are presented in Table 3. They include the
sample mean value, minimum and maximum values for each of the variables.
Table 2: Summery Statistics for Variables
Note: These production values are in term of Yuan RMB of 1990 real price and Mu.
Item
Forestry
production
value (Yuan
RMB)
Farming
production
value (Yuan
RMB)
Invest-
ment
(Yuan
RMB)
Labor
input for
forestry
activities
(person-
days)
Labor
input
for
farming
activities
(person-
days)
Area of
forest-
Land
(mu)
Area of
farmland
(mu)
Max 24935.06 28577.89 4442.75 620.00 1140.00 134.50 134.00
Min 4.95 63.91 5.22 1.00 20.00 1.00 0.30
Mean 1078.33 2497.81 415.24 52.78 253.41 17.72 3.85
SD 1428.67 1775.31 295.45 71.68 144.86 19.45 3.46
Item
Number of
forestlands
(plots)
Number of
farmlands
(plots)
The
number
people of
sample
household
(# of
people)
the age of
the head
of sample
household
(years)
Number of
years the head
of household
has been
engaged in
farming and
forestry
activities
(years)
Number
of years
of
education
that the
head of
household
received
(years)
Max 47.00 40.00 10.00 75.00 62.00 19.00
Min 1.00 1.00 1.00 18.00 0.01 0.01
Mean 6.00 6.84 4.22 40.17 22.28 5.36
SD 6.23 6.17 1.33 11.55 11.59 2.78
Table 3: Characteristics of the Sample Households’ Variables

38
China
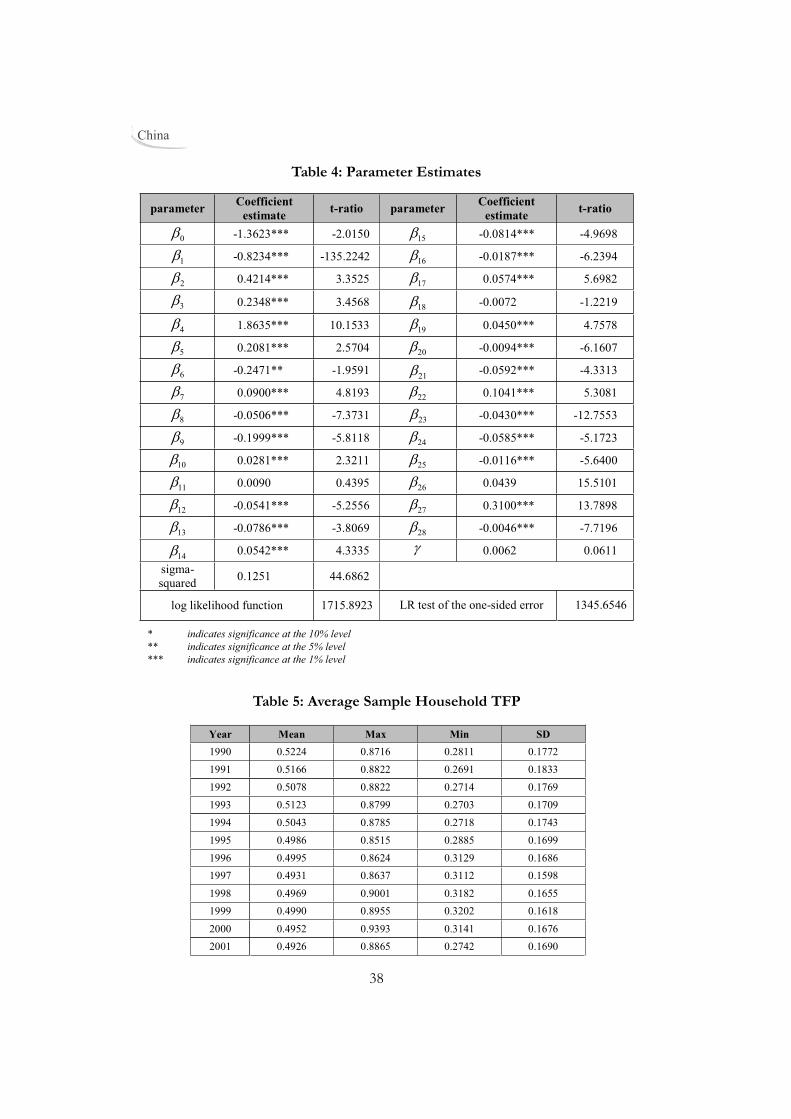
Table 5: Average Sample Household TFP
Table 4: Parameter Estimates
* indicates significance at the 10% level
** indicates significance at the 5% level
*** indicates significance at the 1% level
parameter Coefficient
estimate t-ratio parameter
Coefficient
estimate t-ratio
0-1.3623*** -2.0150
15-0.0814*** -4.9698
1-0.8234*** -135.2242
16-0.0187*** -6.2394
20.4214*** 3.3525
170.0574*** 5.6982
3 0.2348*** 3.4568 18
-0.0072 -1.2219
41.8635*** 10.1533
190.0450*** 4.7578
50.2081*** 2.5704
20-0.0094*** -6.1607
6-0.2471** -1.9591
21-0.0592*** -4.3313
70.0900*** 4.8193
220.1041*** 5.3081
8-0.0506*** -7.3731
23-0.0430*** -12.7553
9-0.1999*** -5.8118
24-0.0585*** -5.1723
100.0281*** 2.3211
25-0.0116*** -5.6400
110.0090 0.4395
260.0439 15.5101
12-0.0541*** -5.2556
270.3100*** 13.7898
13-0.0786*** -3.8069
28-0.0046*** -7.7196
140.0542*** 4.3335 0.0062 0.0611
sigma-
squared 0.1251 44.6862
log likelihood function 1715.8923 LR test of the one-sided error 1345.6546
Year Mean Max Min SD
1990 0.5224 0.8716 0.2811 0.1772
1991 0.5166 0.8822 0.2691 0.1833
1992 0.5078 0.8822 0.2714 0.1769
1993 0.5123 0.8799 0.2703 0.1709
1994 0.5043 0.8785 0.2718 0.1743
1995 0.4986 0.8515 0.2885 0.1699
1996 0.4995 0.8624 0.3129 0.1686
1997 0.4931 0.8637 0.3112 0.1598
1998 0.4969 0.9001 0.3182 0.1655
1999 0.4990 0.8955 0.3202 0.1618
2000 0.4952 0.9393 0.3141 0.1676
2001 0.4926 0.8865 0.2742 0.1690


41
China
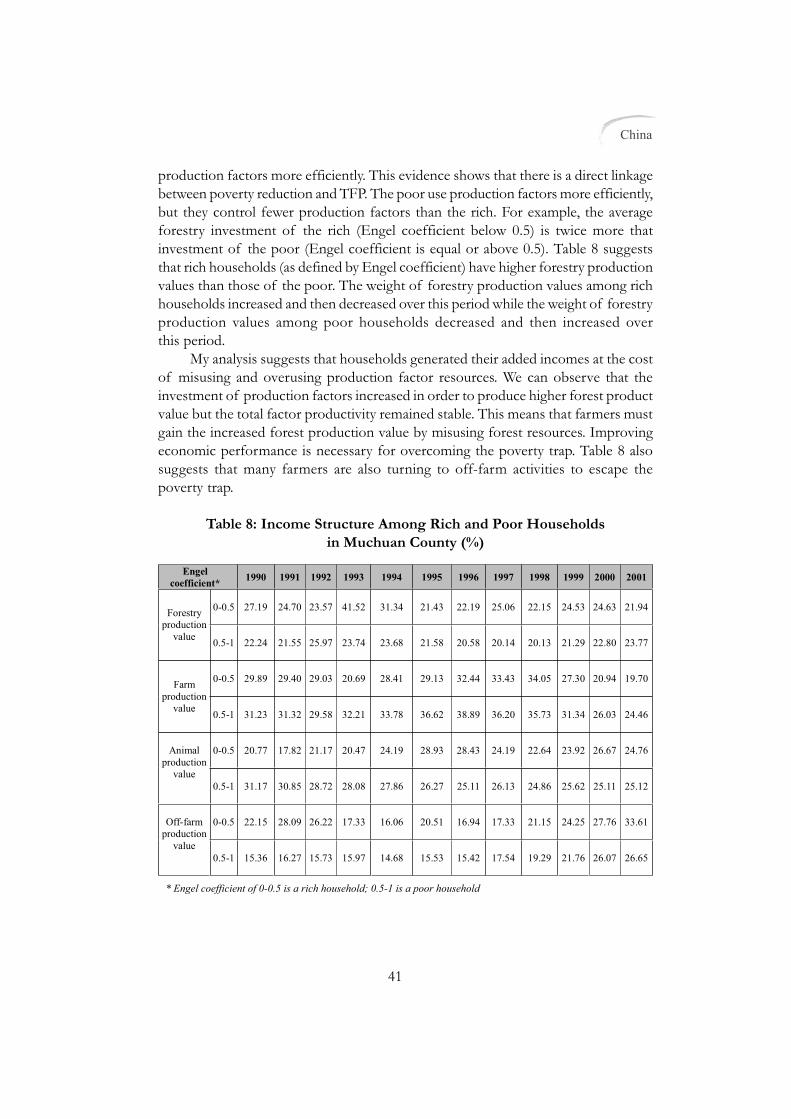
production factors more efficiently. This evidence shows that there is a direct linkage
between poverty reduction and TFP. The poor use production factors more efficiently,
but they control fewer production factors than the rich. For example, the average
forestry investment of the rich (Engel coefficient below 0.5) is twice more that
investment of the poor (Engel coefficient is equal or above 0.5). Table 8 suggests
that rich households (as defined by Engel coefficient) have higher forestry production
values than those of the poor. The weight of forestry production values among rich
households increased and then decreased over this period while the weight of forestry
production values among poor households decreased and then increased over
this period.
My analysis suggests that households generated their added incomes at the cost
of misusing and overusing production factor resources. We can observe that the
investment of production factors increased in order to produce higher forest product
value but the total factor productivity remained stable. This means that farmers must
gain the increased forest production value by misusing forest resources. Improving
economic performance is necessary for overcoming the poverty trap. Table 8 also
suggests that many farmers are also turning to off-farm activities to escape the
poverty trap.
Table 8: Income Structure Among Rich and Poor Households
in Muchuan County (%)
* Engel coefficient of 0-0.5 is a rich household; 0.5-1 is a poor household
Engel
coefficient* 1990 1991 1992 1993 1994 1995 1996 1997 1998 1999 2000 2001
0-0.5 27.19 24.70 23.57 41.52 31.34 21.43 22.19 25.06 22.15 24.53 24.63 21.94 Forestry
production
value 0.5-1 22.24 21.55 25.97 23.74 23.68 21.58 20.58 20.14 20.13 21.29 22.80 23.77
0-0.5 29.89 29.40 29.03 20.69 28.41 29.13 32.44 33.43 34.05 27.30 20.94 19.70 Farm
production
value 0.5-1 31.23 31.32 29.58 32.21 33.78 36.62 38.89 36.20 35.73 31.34 26.03 24.46
0-0.5 20.77 17.82 21.17 20.47 24.19 28.93 28.43 24.19 22.64 23.92 26.67 24.76 Animal
production
value
0.5-1 31.17 30.85 28.72 28.08 27.86 26.27 25.11 26.13 24.86 25.62 25.11 25.12
0-0.5 22.15 28.09 26.22 17.33 16.06 20.51 16.94 17.33 21.15 24.25 27.76 33.61 Off-farm
production
value
0.5-1 15.36 16.27 15.73 15.97 14.68 15.53 15.42 17.54 19.29 21.76 26.07 26.65
42
China
6. Discussion and Conclusions
This paper has developed an analytical framework to calculate total factor
productivity efficiency in rural farm households and it has showed how
this efficiency measure can be estimated within a stochastic translog production frontier
context. This paper also demonstrated the workability of this framework by estimating
household efficiencies in a unique panel dataset of 414 households during the period
between 1991and 2001.
The heterogeneous performance of the estimated efficiency results suggests
we need to be cautious working with disaggregated household level data. It may be
worthwhile to clump the sample units into different sub-groups for further
examination. This may include measurements of both the performance of these
sub-groups and analyses of variations in the physical and economic conditions facing
different households. I will consider this possibility in my future research, as this
analysis will require the availability of additional data.
The economic performance of households in these three counties has been
stable and has not increased significantly during the 1991 to 2001 period. This suggests
a number of things. First, many of the young male laborers may have moved out of
farming and forestry activities to off-farming sectors, such as working in urban areas.
Laborers remaining in the rural areas are female and the older generations with lower
labor input intensities than that of young male laborers. Second, the prices of farm
and forestry products have declined during this period. For example, timber prices in
Jinzhai, Muchuan, and Suichuan counties have declined 9.66%, 2.08% and 7.34%
respectively. Lower timber prices are directly related to lower household revenues,
and thus TFP declines.
Additionally, market controls on timber and other forest products counteract
the positive incentive that increased forest tenure provided for investment in forestry
(Liu et al. 2001). Consequently, the overall incentive structure has failed to become
attractive to forestry enterprises. This has caused efficiency to decline and technical
changes to remain stagnant. For example, if the ratio of timber price to retail price is
up 30%, TFP is only up 7.1070%. In any case, substantive changes in the incentives
structure are necessary for improving long-term producer performance. Therefore,
the timber market should be opened. All stakeholders should be involved in decision-
making and governmental agencies should be responsible for making institutional
arrangements for a free market in timber.
TFPs in the three counties are different. The average TFP in Muchuan is the
highest, and the average TFP in Jinzhai County is the lowest. Bamboo culms and
bamboo shoots are the main forest products in Muchuan County where a larger
paper mill has been built, and farmers can sell their bamboo culms to the mill. In
addition, since the launching of the Natural Forest Protective Program in 1998, and
the implementation of a logging ban, the demand for timber substitutes such as
bamboo has risen significantly (especially in Munchuan where timber import is not

43
China
possible). Bamboo culm prices increased annually at a 5-10% rate during the 1998 to
2001 period.
In Jinzhai County the key forest product is Chinese peanut. The price of peanuts
has declined since 1997 because of over supply. In 1997 the price was Yuan RMB 10-
12 per kilogram. By 2001, it had fallen to 2-4 Yuan RMB per kilogram. In the meantime,
forestry extension in Muchuan (with the aid of the paper mill) is better than that in
Jinzhai and Suichuan counties. Suichuan’s main forest product is timber and the price
of timber has been down in spite of the logging ban because of foreign imports. The
price changes of key forest products in these three counties had caused the fluctuation
of forestry production values in this study. This is reflected in the fact that TFP
values have both declined and increased.
As land fragmentation has increased, traveling time between fields, transport
costs and other factors have also increased. Negative externalities have also increased;
such as greater potential for disputes between neighbors. Under the household
responsibility system policy, forest and farm lands were allocated to households quickly
without adequately mapping boundaries. This has caused numerous conflicts over
property rights. Because smaller plots of forest and farm land have a negative effect
on economic performance, increasing the size of average forest and farm land plots
would increase economies of scale. The household responsibility system policy should
be adjusted to encourage economies of scale through some re-collectivization. Other
institutional arrangements for addressing this issue have appeared in these counties
such as township-, village- and sub-village-level forest farms, and joint stock
partnerships.
There is direct linkage between the TFP of households and poverty reduction,
therefore improving economic performance is helpful for overcoming, or at least
reducing, the poverty trap. In addition to the characteristics of sample households,
rural institutional arrangements and changes, such as the household responsibility
system and timber market controls, have a direct affect on the TFPs of sample
households. Therefore, suitable institutional changes in rural China are required with
regard to land tenure and market-opening, and the structures of sample households
should be adjusted in the future. As stated above, the timber market should be opened,
all stakeholders should be involved in decision-making, and governmental agencies
should be responsible for making institutional arrangements for a free market in
timber.
If farmers generate incomes from forestry and farming activities, it will improve
their livelihood but it does not guarantee they will escape poverty (as defined by the
Chinese government). Off-farm employment provides farmers with another way to
escape the poverty trap. Indeed, increasingly, off-farm activities have been important
sources for farmers' income-generation.
Production can be expanded by increased use of inputs or by improving
economic performances. Increased use of inputs and improving economic
performances are important means whereby income-generation can help to reduce

45
China
Kumbhakar, S., Ghosh, S. C.and McGuckin, J. T. 1991. “A Generalised Production Frontier
Approach for Estimating Determinants of Inefficiency in US Dairy Farms.” Journal of
Business and Economic Statistics. 9: 279-286.
Lin, J. Y. 1986. The Impacts of the Household Responsibility System on China’s Agricultural
Production. Department of Economics, University of Chicago.
Lin, J. Y. 1988. “The Household Responsibility System in China’s Agricultural Reform:
a Theoretical and Empirical Study.” Economic Development and Cultural Change. 36:
353-372.
Lin, J. Y. 1992. “Rural Reforms and Agricultural growth in China.” American Economic Review.
82: 34-51.
Liu et al. 2001. The Institutional Arrangement and Case Study on Community Forestry
Development and Poverty Alleviation. Chinese Agricultural Science and Technology
Publishing Housing (in Chinese).
Lovell, C. A. K., S. Richardson, P. Tavers and L. L. Wood. 1990. “Resources and Functionings:
a New View of Inequality in Australia.” Working Paper series, no. 90-8. Department of
Economics, University of North Carolina.
Meeusen, W. and van Broeck, J. 1977. “Efficiency Estimation from Cobb-Douglas Production
Functions with Composed Error.” International Economic Review. 18: 435-444.
Myers, R. H. 1970. The Chinese Peasant Economy. Harvard University Press.
National Statistics Bureau of China. 2003. Statistic Yearbook 2002. China Statistics Press
(in Chinese).
National Statistics Bureau of China. 2004. Statistic Yearbook 2003. China Statistics Press
(in Chinese).
Nguyen, T., E. Cheng and C. Findlay. 1996. “Land Fragmentation and farm productivity in
China in the 1990s.” China Economic Review. 7(2): 169-180.
Pitt, M. M. and Lee, L. F. 1981. “The Measurement and Sources of Technical Inefficiency in
the Indonesian Weaving Industry.” Journal of Development Economics. 9: 43-64.
Reifschneider, D. and R. Stevenson. 1991. Systematic Departures from the Frontier: A
Framework for the Analysis of Firm Inefficiency. International Economic Review. 32 (3):
715-723.
Schmidt, C. and Sickles, R. C. 1984. “Production Frontiers and Panel Data.” Journal of Business
& Economic Statistics. 2(4): 367-374.
Schultz, T. W. 1964. Transforming Traditional Agriculture. Yale University Press.
46
China
Schultz, T. W. 1990. “The Economics of Agricultural Research”. In Eicher, C. K. and Staatz,
J. M. Agricultural Development in the Third World. John Hopkins University Press.
World Bank. 2002. The World Development Report 2002. Oxford University Press.
Yin, R. S. 1995. “An Empirical Analysis of Rural Forestry in China, 1978-1990.” Ph D
Dissertation, the University of Georgia; Athens, Georgia.
Yin, R.S. 1999. “Production Efficiency and Cost Competitiveness of Pulp Production in the
Pacific Rim.” Forest Products Journal. 49(7/8): 43-49.
Zhang, Y., Uusivuori, J., and Kuuluvainen, J. 2000. “Impacts of Economic Reforms on Rural
Forestry in China.” Forest Policy and Economics. 1: 27-40.