Embed Size (px)
Citation preview

Agricultural Growth and Poverty Reductionin Malawi: Past Performance and
Recent Trends
ReSAKSS Working Paper No.8
October, 2008
Ephraim W. Chirwa, Ian Kumwenda, Charles Jumbe, Pius Chilonda and Isaac Minde

Regional Strategic Analysis and Knowledge SupportSystem for Southern Africa (ReSAKSS-SA)
ReSAKSS Working Paper No.8
October, 2008
Agricultural Growth and Poverty Reductionin Malawi: Past Performance and
Recent Trends
Ephraim W. Chirwa, Ian Kumwenda, Charles Jumbe,Pius Chilonda and Isaac Minde

ii
About ReSAKSS
The Regional Strategic Analysis and Knowledge Support System (ReSAKSS) is an Africa-widenetwork that provides analysis, data, and tools to promote evidence-based decision making, improveawareness of the role of agriculture for development in Africa, fill knowledge gaps, promote dialogueand facilitate the benchmarking and review processes associated with the AU/NEPAD’sComprehensive Africa Agriculture Development Programme (CAADP) and other regionalagricultural development initiatives in Africa.
About the Working Paper series
The goal of the ReSAKSS Working Paper series is to provide timely access to preliminary researchand data analysis results that relate directly to strengthening ongoing discussions and criticalcommentaries on the future direction of African agriculture and rural development. The seriesundergoes a standard peer review process involving at least one reviewer from within the ReSAKSSnetwork of partners and at least one external reviewer. It is expected that most of the working paperswill eventually be published in some other form and that their content may be revised further.
For more information, contact:CoordinatorRegional Strategic Analysis and Knowledge Support System in Southern Africa (ReSAKSS-SA)International Water Management Institute (IWMI)Private Bag X813Silverton 0127Pretoria, South AfricaTelephone: +27 (0)12 845 9100Facsimile: +27 (0)12 845 9110E-mail: [email protected]: www.sa.resakss.org

iii
The authors
Ephraim W. Chirwa is Associate Professor at the University of Malawi and Managing Consultantfor Wadonda Consult, Malawi; Ian Kumwenda is Coordinator for the Malawi Agriculture SectorInvestment Programme (MASIP), Malawi Government; Charles Jumbe is a Research Fellow at theCentre for Agricultural Research and Development, Bunda College of Agriculture, Malawi; PiusChilonda is Regional SAKSS Coordinator for Southern Africa based in Pretoria, South Africa;and Isaac Minde is Principal Scientist (Economics), International Crops Research Institute for theSemi-Arid Tropics (ICRISAT), Bulawayo, Zimbabwe.
Chirwa, E.W.; I. Kumwenda; C. Jumbe; P. Chilonda; I. Minde, 2008. Agricultural growth andpoverty reduction in Malawi: Past performance and recent trends. ReSAKSS Working Paper No.8. International Crops Research Institute for the Semi-Arid Tropics (ICRISAT), International Foodpolicy Research Institute (IFPRI) and International Water Management Institute (IWMI).
Except where otherwise noted, this work is licensed under a CreativeCommons Attribution 3.0 License.


v
CONTENTS
Tables and Figures ..................................................................................................................... vi
Acronyms and Abbreviations .................................................................................................... vii
Abstract ........................................................................................................................... viii
Introduction .............................................................................................................................. 1
Agricultural Development Policies in Malawi: Historical Overview ......................................... 2
The Pre-Reform Period (1964-1980) .................................................................................... 4
The Reform Period (1981-1994) .......................................................................................... 5
The Post-Reform Period (1995-2007) .................................................................................. 8
Agricultural Performance and Trends in Poverty ....................................................................... 9
The Structure of the Agricultural Sector .............................................................................. 9
The Role of the Agricultural Sector ................................................................................... 11
Trends in Agricultural Performance ................................................................................... 11
Agricultural Output and Per Capita Output ............................................................. 11
Food Production and Food Security ......................................................................... 13
Livestock Production and Trends ............................................................................. 14
Agricultural Trade Performance ............................................................................... 15
Agricultural Growth and Poverty Outcomes ............................................................ 17
Malnutrition Rates .............................................................................................. 17
Poverty Levels .................................................................................................... 18
Explaining Agricultural Performance in Malawi ...................................................................... 19
Productivity ......................................................................................................................... 19
Weather Conditions and Agricultural Performance ............................................................ 20
Landholding Sizes and Fragmentation ................................................................................ 22
Markets and Value Addition ............................................................................................... 23
Policy Environment and Supply Responses ....................................................................... 24
Trends in Public Investments in Agriculture ...................................................................... 24
Conclusions ............................................................................................................................ 27
References ............................................................................................................................ 29

vi
TABLES AND FIGURES
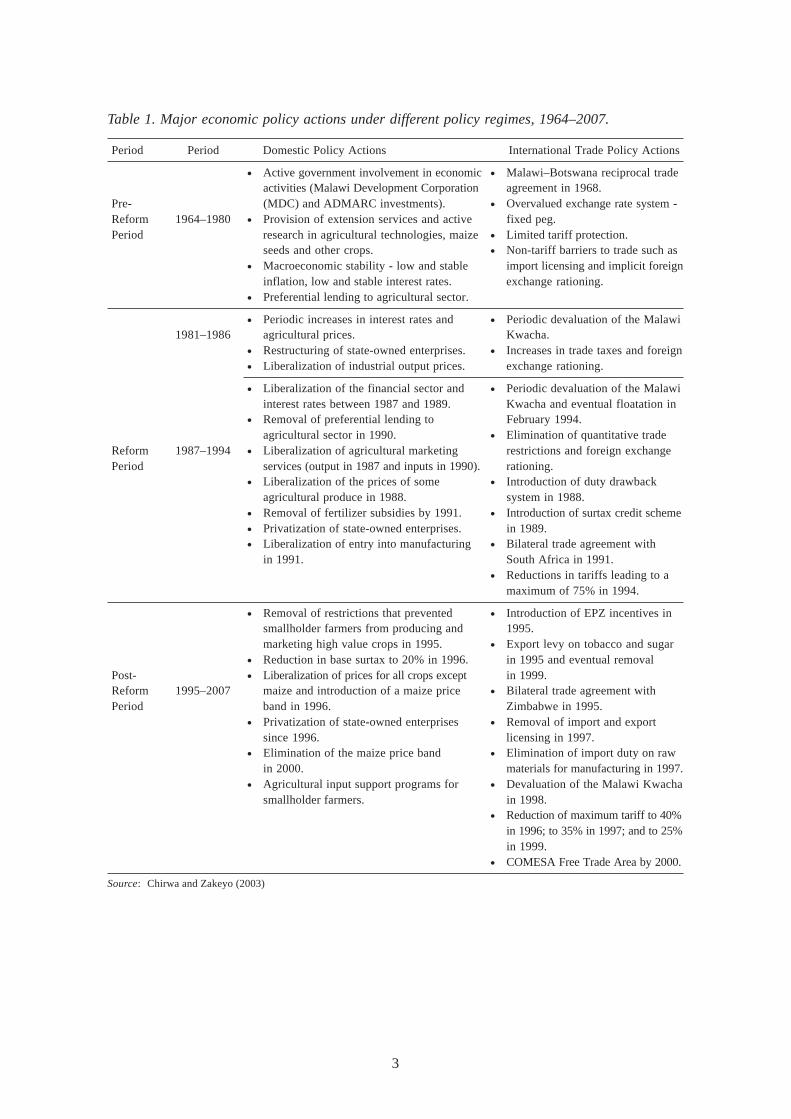
Table 1. Major economic policy actions under different policy regimes,1964-2007. ................................................................................................................ 3
Table 2. Malawi: Share of the agriculture sector, 1970-2005. ............................................ 11
Table 3. Malawi: Trends in agriculture sector output, 1970-2005. ..................................... 12
Table 4. Malawi: Composition of export earnings bymain commodity (%), 1970-2005. .......................................................................... 15
Table 5. Malawi: Trends in the malnutrition and growth ofchildren under-five, 1992-2005. ............................................................................. 18
Table 6. Malawi: Poverty and agricultural growth, 1998-2005. ......................................... 18
Table 7. Malawi: Productivity growth by main commodity (%), 1970-2005. .................... 20
Table 8. Weather conditions affecting agricultural production, 1980-2005. ....................... 21
Table 9. Malawi: Trends in agriculture sector government spending, 1970-2005. ............. 25
Figure 1. Malawi: Structure of agricultural output, 1973-2005. .......................................... 10
Figure 2. Malawi: Trends in agricultural output per capita growth rates, 1974-2005. ........ 12
Figure 3. Malawi: Trends in main food staples per capita, 1974-2005. ............................... 13
Figure 4. Malawi: Livestock production trends, 1970-2005. ................................................ 15
Figure 5. Malawi: Growth in agricultural exports, 1971-2005. ............................................ 16
Figure 6. Malawi: Productivity trends in main agricultural crops, 1970-2005. ................... 20
Figure 7. Malawi: Rainfall and maize production, 1970-2005. ............................................ 21
Figure 8. Malawi: Trends in per capita cultivatable land, 1970-2005. ................................. 22
Figure 9. Malawi: Trends in agricultural sector expenditure, 1970-2005. ........................... 25

vii
ACRONYMS AND ABBREVIATIONS
ADMARC Agricultural Development and Marketing CorporationAU African UnionCAADP Comprehensive Africa Agriculture Development ProgrammeCOMESA Common Market for Eastern and Southern AfricaEPZ Export Processing ZonesGDP Gross Domestic ProductIMF International Monetary FundMEGS Malawi Economic Growth StrategyMGDS Malawi Growth and Development StrategyMDG Millennium Development GoalsMPRS Malawi Poverty Reduction StrategyNEPAD New Partnership for Africa’s DevelopmentPAP Poverty Alleviation ProgrammeSSA Sub-Saharan Africa

viii
ABSTRACT
This paper reviews the link between agricultural growth and poverty reduction in Malawi. Thecontribution of the agriculture sector in Malawi has been fairly stable over time, accounting formore than one-third of gross domestic product. However, the performance has been mixed in termsof growth rates, with more growth witnessed in the 1960s and 1970s and erratic growth rates insubsequent periods. The analysis also shows no significant link between the growth in the agriculturalsector and indicators of poverty such as malnutrition rates and poverty head count ratio. Thedisappointing performance of the agriculture sector can be attributed to many factors includingdeclining farm productivity, rain-fed nature of cultivation and associated exogenous shocks, thinagricultural markets, policy reversals and associated uncertainties, and declining public investmentsin the agricultural sector. In order to revive the agricultural sector, the study recommends policiestowards greater commercialization, revitalization of extension services and increased investmentsin marketing systems, rural infrastructure and irrigation development.

1
AGRICULTURAL GROWTH AND POVERTY REDUCTION IN MALAWI:PAST PERFORMANCE AND RECENT TRENDS
INTRODUCTION
The agricultural sector continues to be the most important sector in the Malawian economy. Itaccounts for 39% of gross domestic product (GDP), 85% of the labor force and generates about83% of foreign exchange earnings. National surveys estimate that crop production accounts for74% of all rural incomes. The agricultural sector has two main sub-sectors - the smallholder sub-sector that contributes more than 70% and the estate sub-sector that contributes less than 30% togross domestic product - originating from the agricultural sector. The smallholder agricultural sectorin Malawi cultivates mainly maize, the main staple grain, to meet subsistence requirements. Thelandholding sizes among smallholder farmers are generally small. It is noted that owing to populationpressure, resulting in the fragmentation of land, the national mean landholding size has fallen from1.53 hectares per household in 1968 to 0.80 hectares per household in 2000 (GoM 2001). Theprincipal crops grown in Malawi are maize, tea, sugarcane, groundnuts, cotton, wheat, coffee, riceand pulses. The major exports include tobacco, tea and sugar. Except for tobacco, tea and sugarare mainly grown on commercial estates by multinational companies, with the smallholder sectorproducing less that 15% of total tea and sugar production.
The performance of the economy has been highly driven by the agricultural sector. Sinceindependence in 1964, substantial resources have been devoted to the agricultural sector for thedevelopment of estate and smallholder agriculture. These investments in the agricultural sectorhave included the establishment of state-owned enterprises directly engaged in agriculturalproduction and marketing of smallholder agricultural produce, state provision of extension services,and provision of subsidized credit and inputs. The agricultural sector-led development strategypaid dividends in the early years of independence and Malawi was self-sufficient in food productionparticularly in the 1970s. The economy grew at an average rate of 6% per annum. Malawi was,however, in an economic crisis between 1979 and 1981. The crisis was triggered by a combinationof factors including the oil-shock of 1979, the international transport bottleneck due to theintensification of the Mozambican War and other structural rigidities of the economy. The realgrowth rate of GDP fell from 8.3% in 1978 to 3.9% in 1979 and for the first time, negativegrowth rates of -1.1% in 1980 and -4.7% in 1981 were registered. The burst between 1979 and1980 drove Malawi into the adoption of World Bank structural adjustment programmes and IMFstabilization measures (Harrigan 1991).
Since 1982, the Government of Malawi has introduced several policies in a phased and sometimesindecisive manner, some of which were directly targeted at reforming the agricultural sector. However,the growth of the agricultural sector and the economy has been erratic and poverty remains high.Recent estimates of poverty show that about 52.4% of the population lives below the poverty line(MK44 per person per day) with 22.4% barely surviving (NSO 2005). Most of the socioeconomicindicators illustrate the depth and intractability of poverty. For example, the levels of malnutritionremain high, with 43.2% of children under-five being stunted and 22% being underweight in 2004(NSO 2005). The infant mortality rate and morbidity rate remain high. According to NSO and ORCMacro (2001), the infant mortality rate declined from 153 deaths per 1,000 live births in 1987 to

2
104 deaths per 1,000 live births in 2004/2005. The maternal mortality rate has increased from 250deaths per 100,000 births in 1987 to 984 deaths per 100,000 births in 2004 (NSO 2006). There isalso a high prevalence of HIV and AIDS, estimated at 14%.
The main objective of this paper is to analyze the trends in agricultural growth and food securityand to establish the linkages between agricultural growth, investment and poverty reduction. Thepaper aims to achieve this objective in four ways. First, it establishes baseline statistics formonitoring agricultural growth and poverty levels and gives a consistent picture on how wellMalawi is performing in meeting the MDG target of halving poverty by 2015. Second, it assessesand diagnoses trends in agricultural growth and poverty alleviation in order to understand whyagricultural growth (or decline) is occurring in Malawi. Third, it tracks commitment to increasedpublic spending by the Malawi Government and determines whether the levels of current fundingin the agricultural sector meet the AU/NEPAD and MDG targets. Finally, the paper examinesthe sources of growth and whether the growth occurring is pro-poor. The rest of the paper isorganized as follows. The next section, Agricultural Development Policies in Malawi: HistoricalOverview, provides a review of agricultural sector policies in Malawi, providing the context inwhich agricultural growth has occurred. Section 3, Agricultural Performance and Trends inPoverty, analyzes the changing role and the performance of the agricultural sector using variousperformance measures. Section 4, Explaining Agricultural Performance in Malawi, analyzes thesources of agricultural growth and assesses the link between agricultural growth and poverty inMalawi. Section 5, Conclusions, reports the results and discusses the factors that have affectedagricultural growth in Malawi.
AGRICULTURAL DEVELOPMENT POLICIES IN MALAWI:HISTORICAL OVERVIEW
With more than 80% of the population in Malawi being rural and agricultural activities formingthe bulk of the livelihood strategies of households, agricultural development policies have dominatedthe policy arena since independence in 1964. The potential for agricultural development to increasewelfare in low-income countries, like Malawi, derives from the fact that large proportions of thepopulation engage in farming for subsistence needs and to generate cash incomes (Mellor 1966).Therefore, it is not surprising that economic policies in Malawi have been dominated by agriculturalpolicy. Agricultural development in Malawi has been based on a dual strategy. First, the promotionof estate agriculture on leasehold land from unused customary land has expanded rapidly sinceindependence. Lele (1989) argues that the rapid expansion of estate agriculture, particularly forthe production of tobacco, has resulted in a more unequal distribution of land in rural Malawi.Most estates grow high value cash crops, and it is not surprising that estate-led agriculturaldevelopment was the main economic strategy in Malawi. Second, the promotion of smallholderagriculture on customary land, on which rights to cultivate and transfer land are conferred bytraditional chiefs. In 1997/1998 it was estimated that one-third of smallholder households werecultivating between 0.5 and 1 hectares of land (GOM 2001). The economic and agricultural policyregimes in Malawi can be divided into three phases as represented in Table 1: pre-reform, reformand post-reform periods.
3
Table 1. Major economic policy actions under different policy regimes, 1964–2007.
Period Period Domestic Policy Actions International Trade Policy Actions
• Active government involvement in economic • Malawi–Botswana reciprocal tradeactivities (Malawi Development Corporation agreement in 1968.
Pre- (MDC) and ADMARC investments). • Overvalued exchange rate system -Reform 1964–1980 • Provision of extension services and active fixed peg.Period research in agricultural technologies, maize • Limited tariff protection.
seeds and other crops. • Non-tariff barriers to trade such as• Macroeconomic stability - low and stable import licensing and implicit foreign
inflation, low and stable interest rates. exchange rationing.• Preferential lending to agricultural sector.
• Periodic increases in interest rates and • Periodic devaluation of the Malawi1981–1986 agricultural prices. Kwacha.
• Restructuring of state-owned enterprises. • Increases in trade taxes and foreign• Liberalization of industrial output prices. exchange rationing.
• Liberalization of the financial sector and • Periodic devaluation of the Malawiinterest rates between 1987 and 1989. Kwacha and eventual floatation in
• Removal of preferential lending to February 1994.agricultural sector in 1990. • Elimination of quantitative trade
Reform 1987–1994 • Liberalization of agricultural marketing restrictions and foreign exchangePeriod services (output in 1987 and inputs in 1990). rationing.
• Liberalization of the prices of some • Introduction of duty drawbackagricultural produce in 1988. system in 1988.
• Removal of fertilizer subsidies by 1991. • Introduction of surtax credit scheme• Privatization of state-owned enterprises. in 1989.• Liberalization of entry into manufacturing • Bilateral trade agreement with
in 1991. South Africa in 1991.• Reductions in tariffs leading to a
maximum of 75% in 1994.
• Removal of restrictions that prevented • Introduction of EPZ incentives insmallholder farmers from producing and 1995.marketing high value crops in 1995. • Export levy on tobacco and sugar
• Reduction in base surtax to 20% in 1996. in 1995 and eventual removalPost- • Liberalization of prices for all crops except in 1999.Reform 1995–2007 maize and introduction of a maize price • Bilateral trade agreement withPeriod band in 1996. Zimbabwe in 1995.
• Privatization of state-owned enterprises • Removal of import and exportsince 1996. licensing in 1997.
• Elimination of the maize price band • Elimination of import duty on rawin 2000. materials for manufacturing in 1997.
• Agricultural input support programs for • Devaluation of the Malawi Kwachasmallholder farmers. in 1998.
• Reduction of maximum tariff to 40%in 1996; to 35% in 1997; and to 25%in 1999.
• COMESA Free Trade Area by 2000.
Source: Chirwa and Zakeyo (2003)

4
The Pre-Reform Period (1964–1980)
This phase spans the first 15 years after independence and was characterized by active governmentinvolvement in the economy and agricultural sector. The main objective of policies during this periodwas to diversify the economy away from the agricultural sector through increased import-substitutionand industrialization, thereby generating sustainable employment opportunities (GOM 1971).Agricultural development policies in this phase were guided by three development strategies: theFirst Development Plans (1961–1964), the Second Development Plans (1965–1969) and the firstStatement of Development Policies (1971–1979). At independence it was recognized that the economyhad an abundant labor force and fertile agricultural soils. It became apparent that the nature of thenatural resource was the basis for economic policy. As is stipulated in the first statement ofdevelopment policies:
The choice of strategy which gives top priority to raising agricultural activity isdictated not only by the present pattern of economic activities among thepopulation but also by the nature and distribution of Malawi’s economic resources(GOM 1971: 1).
The government identified capital and skilled labor as factors of production in scarce supply.Land and unskilled labor were factors of production in which Malawi was endowed. Thepolicymakers capitalized on these two factor endowments by emphasizing on agriculturalinnovation and the export of unskilled labor to mineral-rich countries such as Zambia, SouthAfrica and Zimbabwe. Agriculture was the mainstay of the economy and about 60% of grossdomestic product in 1964 originated from the agriculture sector. At the time of independence in1964, the non-agricultural sector of the economy was almost entirely controlled by foreign firmsor individuals with the manufacturing and transport sectors dominated by the Europeans (British)and commerce dominated by Asians. The dominance of the colonial masters in farm and non-farm activities was reduced by emphasizing on the role of the peasants in agricultural productionas a vehicle for the development of the domestic bourgeoisie. This was achieved by purchasing anumber of private estates in the central region for resettlement by Malawians in the first six yearsof independence (GOM 1971). The priority accorded to agriculture reflected the large role playedby the sector in creating employment and income for about 85% of the population, but it alsomade maximum use of the abundant labor resource.
Direct government involvement in economic activities also manifested through investments in state-owned enterprises and state-holding corporations that in turn invested in various sectors of theeconomy including agriculture, manufacturing and financial sectors. The Agricultural Developmentand Marketing Corporation (ADMARC), a state marketing agency, played a major role in theagricultural development strategy as a monopsony buyer of smallholder produce and a supplierof agricultural inputs, besides investments in estate agriculture and other commercial investments.The government’s strategy in the smallholder agricultural sector aimed at increasing output andproductivity to meet the food security needs and the cash requirements of the population. As suchthe smallholder agricultural development strategy focused mainly on increasing the productivityof maize. Several policies were implemented to support the strategy including the promotion oftechnology adoption among smallholder farmers particularly hybrid maize and application offertilizers supported by a government administered credit scheme, provision of extension servicesthrough a network of extension offices across the country, subsidies on inputs and a system ofguaranteed pan-territorial and pan-seasonal prices for agricultural produce through ADMARC.

5
However, Kydd and Christiansen (1982) argue that government policy facilitated the rapid expansionof estate agriculture at the expense of smallholder agriculture through easy acquisition of customaryland;1 implicit taxation of smallholder agriculture through the smallholder produce pricing policyimplemented by the state marketing agency whose proceeds were used to develop estates by thestate marketing agency; and control of the commercial banks by the state marketing agency,ADMARC. As a result there was remarkable growth in estate agriculture particularly in burleytobacco production, with the ratio of the value of estate production to the value of officially marketedsmallholder production increasing from 0.79 in 1964 to 1.93 in 1979 based on three-year movingaverages (Kydd and Christiansen 1982). Most of this estate-led agricultural development has notbenefited the majority of the smallholder population, whose return to labor was significantly squeezedby the produce pricing policy.
The Reform Period (1981–1994)
The country experienced an economic crisis in 1979 and 1980 that led the government to adoptstructural adjustment programmes under the auspices of the International Monetary Fund (IMF)and the World Bank in 1981. The diagnostic analysis for the first structural adjustment loan revealedseveral structural weaknesses in the economy including slow growth of smallholder exports, narrowexport base and increasing reliance on tobacco exports, deteriorating financial position of stateenterprises including ADMARC and inflexibility in prices and wages due to government control(Harrigan 1991). A series of structural adjustment and sectoral loans and standby facilities havebeen obtained by the government to support structural adjustment reforms. Several of these reformswere targeted at the agricultural sector and aimed at improving the performance of the smallholderagricultural sector. Some of the objectives of structural adjustment policies in agriculture includeddiversification of the export base, ensuring appropriate price and incomes policy to offer adequateincentives to smallholder farmers, expanding the role of the private sector in the marketing ofagricultural produce, and increasing the efficiency and incomes of smallholder farmers.
These developments led to the formulation of the second Statement of Development Policies (1987-1996), whose focus articulated the various reforms embodied in structural adjustment programmes(GOM 1987). The adoption of structural adjustment programs in 1981 initiated reforms in agriculturalproduction, marketing and produce pricing policy. Within the economic reform programme thegovernment liberalized agricultural produce pricing and marketing in various major ways.
• There were periodic adjustments to the pan-territorial and pan-seasonal prices for agriculturalproducts that were introduced between 1982 and 1986, particularly for maize. In 1982,the government adopted the parity pricing approach and the producer price of maize wasconsequently increased by 68%. The pricing approach led to annual adjustments in the priceof maize in the 1980s. As Harrigan (1988) notes, considerable price increases for a majorityof smallholder export crops were announced in 1983/4 and 1984/5 growing seasons suchthat by 1985/6 prices were close to parity levels. By 1988, the prices of most crops wereliberalized with the state marketing agency acting as a buyer of last resort at minimumguaranteed pan-territorial and pan-seasonal prices. Private traders were, therefore, free to
1 Most estate owners informally bought customary land from chiefs and converted it into leasehold estate land. This was particularly thecase in the central region, although the practice also existed in the southern and northern regions of Malawi. This, combined with thegrowing population pressure, has resulted in unequal distribution of land and chiefs no longer have customary land at their disposal fordistribution to new families.
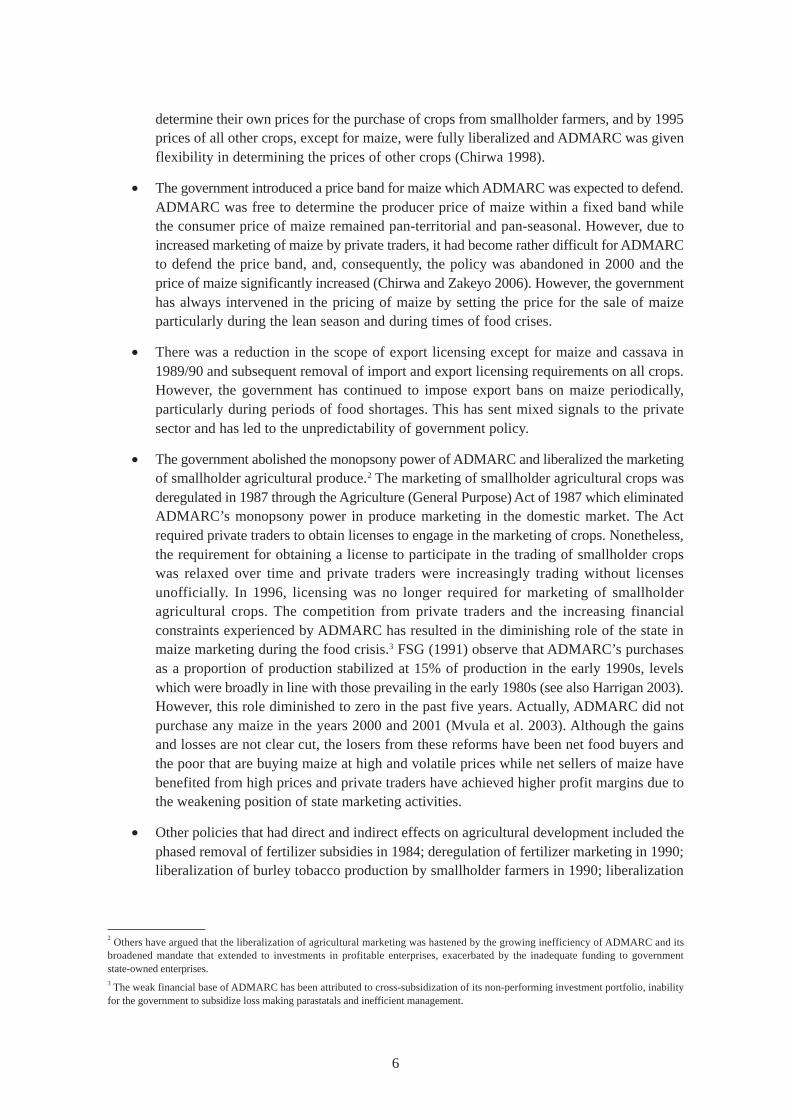
6
determine their own prices for the purchase of crops from smallholder farmers, and by 1995prices of all other crops, except for maize, were fully liberalized and ADMARC was givenflexibility in determining the prices of other crops (Chirwa 1998).
• The government introduced a price band for maize which ADMARC was expected to defend.ADMARC was free to determine the producer price of maize within a fixed band whilethe consumer price of maize remained pan-territorial and pan-seasonal. However, due toincreased marketing of maize by private traders, it had become rather difficult for ADMARCto defend the price band, and, consequently, the policy was abandoned in 2000 and theprice of maize significantly increased (Chirwa and Zakeyo 2006). However, the governmenthas always intervened in the pricing of maize by setting the price for the sale of maizeparticularly during the lean season and during times of food crises.
• There was a reduction in the scope of export licensing except for maize and cassava in1989/90 and subsequent removal of import and export licensing requirements on all crops.However, the government has continued to impose export bans on maize periodically,particularly during periods of food shortages. This has sent mixed signals to the privatesector and has led to the unpredictability of government policy.
• The government abolished the monopsony power of ADMARC and liberalized the marketingof smallholder agricultural produce.2 The marketing of smallholder agricultural crops wasderegulated in 1987 through the Agriculture (General Purpose) Act of 1987 which eliminatedADMARC’s monopsony power in produce marketing in the domestic market. The Actrequired private traders to obtain licenses to engage in the marketing of crops. Nonetheless,the requirement for obtaining a license to participate in the trading of smallholder cropswas relaxed over time and private traders were increasingly trading without licensesunofficially. In 1996, licensing was no longer required for marketing of smallholderagricultural crops. The competition from private traders and the increasing financialconstraints experienced by ADMARC has resulted in the diminishing role of the state inmaize marketing during the food crisis.3 FSG (1991) observe that ADMARC’s purchasesas a proportion of production stabilized at 15% of production in the early 1990s, levelswhich were broadly in line with those prevailing in the early 1980s (see also Harrigan 2003).However, this role diminished to zero in the past five years. Actually, ADMARC did notpurchase any maize in the years 2000 and 2001 (Mvula et al. 2003). Although the gainsand losses are not clear cut, the losers from these reforms have been net food buyers andthe poor that are buying maize at high and volatile prices while net sellers of maize havebenefited from high prices and private traders have achieved higher profit margins due tothe weakening position of state marketing activities.
• Other policies that had direct and indirect effects on agricultural development included thephased removal of fertilizer subsidies in 1984; deregulation of fertilizer marketing in 1990;liberalization of burley tobacco production by smallholder farmers in 1990; liberalization
2 Others have argued that the liberalization of agricultural marketing was hastened by the growing inefficiency of ADMARC and itsbroadened mandate that extended to investments in profitable enterprises, exacerbated by the inadequate funding to governmentstate-owned enterprises.3 The weak financial base of ADMARC has been attributed to cross-subsidization of its non-performing investment portfolio, inabilityfor the government to subsidize loss making parastatals and inefficient management.

7
of financial markets; liberalization of international trade; and devaluation of currency andeventual floatation in 1994 (Chirwa and Zakeyo 2006). The liberalization of burley tobaccohas led to an increase in the number of smallholder farmers growing burley tobacco andsmallholder farmers have rapidly become the main producers of burley tobacco accountingfor about 70% of national production (World Bank 2003).4
The expectation from the market reforms was that private traders would take up the role of statemarketing agencies even in remote areas. However, the empirical results on the effect of foodmarketing liberalization are mixed. Jayne et al. (2002) argue that these mixed results have beendue to the variations in the implementation of reforms, with reforms largely remainingunimplemented particularly in sensitive products such as maize. In Tanzania, one of the countriesthat have been decisive in food marketing liberalization, Baulch (2001) notes that increasedcompetition in the marketing of food produce led to declining profit margins among private traders.Fairhead and Leach (2005) note that marketing liberalization ignored the way that markets arecontrolled, and socially and politically embedded. Studies in Malawi have cast doubt on thecapacity of private traders to reach the very remote areas that are deemed unprofitable by a statemarketing agency. In earlier studies on the performance of private traders in Malawi,Mkwezalamba (1989) and Kaluwa (1992) reveal that most private traders are small-scaleentrepreneurs with rural-based enterprises and usually face such constraints as transport facilities,storage facilities, processing facilities, financing and credit facilities. Fafchamps andGabre-Madhin (2001), using case studies from Benin and Malawi, also find evidence that theefficiency of private traders is constrained by the high transaction costs in the form of searchand transport costs. Other studies have shown that while private traders have expanded theiractivities in agricultural produce since 1987, they are heavily concentrated in the southern regionand, to some extent, in the central region while the northern region is generally un-served due tothe problem of inaccessibility (Mthindi et al. 1999).
Although ADMARC market power has been weakened over the years, there may still be concernsabout the effect of its continued involvement in the marketing of food crops. For example, Abbottand Poulin (1996) argue that the continued existence of ADMARC as a state marketing agencyis hindering the development of the private marketing system. Nonetheless, others identifyADMARC as a very important institution during crisis situations and that the closure ofADMARC markets has the potential to affect the livelihood systems of the poor (Khaila et al.1999). Dorward et al. (2004) note that those that argue for complete withdrawal of the state,fear the policy reversals and price controls and the competitive advantages of the state marketingagencies that depress returns and increase risks to private sector investments. There has been noevidence in Malawi, however, to suggest that ADMARC with its financial constraints is animpediment to private sector trade.5 Mvula et al. (2003) and Nthara (2002) find that ADMARCplays an important role in crop marketing where it has resources, particularly in the sale of maizeto maize deficit households.
4 Prior to liberalization, burley tobacco was only grown on estates and exported directly by estate owners.5 In other countries, where state marketing agencies continue to play a role in the post-liberalization era, such as Kenya, the evidencesuggests that private traders do not perceive state marketing agencies as stifling private trade (Karugia et al. 2004).

8
The Post-Reform Period (1995–2007)
The period from 1995 is regarded as the period after major structural reforms under the structuraladjustment period were completed in most sectors of the economy. Nonetheless, there have beenseveral policy changes during this period with some of the abandoned policies in the previous phasebeing re-introduced particularly in the agricultural sector. The post-reform phase has also witnessedthe highest number of policy documents that have been produced by the government to guide thedevelopment path of the economy.
• In 1995, the government published the Policy Framework for the Poverty AlleviationProgramme (PAP) which identified the poverty groups and outlined the broad policies forfighting poverty in Malawi.
• In 1998, the government engaged in a consultative process which resulted in the publicationof the Malawi Vision 2020 document which captured the long-term aspirations ofMalawians. With respect to agriculture, the main objectives in Vision 2020 were to increasefood crop production particularly maize, promoting livestock development, reducing post-harvest losses in food crops and improving efficiency of markets (NEC 2000).
• In 2002, the government published the Malawi Poverty Reduction Strategy (MPRS) whosestrategies were expected to be implemented over three years. The agricultural sector isidentified as the main sector for achieving pro-poor growth. The main agricultural objectivein the MPRS is to increase agricultural incomes through access to inputs; technology andextension services; access to domestic and international markets; promotion of irrigation;promoting crop diversification; and livestock development.
• In 2003, the government started developing another strategy which culminated into theMalawi Economic Growth Strategy (MEGS) published in 2004. In the latter half of 2004,the MEGS was receiving more public attention than the MPRS, a development that createduncertainty about the development strategy the country is pursuing. While the MPRS focuseson both economic and social sectors, the MEGS only focuses on the economic sectors andprivate sector driven growth with very little articulation of distribution.
• By mid-2005 the government started the process of developing another strategy intendedto address issues raised in both the MPRS and MEGS so as to come up with a coherentdevelopment strategy. This led to the publication of the Malawi Growth and DevelopmentStrategy (MGDS) in 2006. The emphasis on agriculture is to increase the contribution ofthe agricultural sector to economic growth through production of food crops and valueaddition for domestic and export markets. The focus of the agricultural sector is increasingproductivity, value addition, market facilitation and irrigation development (GOM 2006).
The emphasis in these documents has shifted from poverty alleviation to growth with povertyreduction. In addition, agricultural development has been at the center of recent developmentstrategies – driven by the belief that pro-poor growth can be achieved by growth in the sectorswhere a large proportion of the poor participate. There have been several safety net activities designedto protect the poor from the perils of market reforms, particularly smallholder agriculture inputsupport programs. The government with the support of bilateral donors introduced a series of safetynet programmes for resource poor smallholder farmers to minimize the cost of adjustment in thelate 1990s. These agriculture-based safety net programmes include a ‘starter pack’ program which

9
provided free inputs to resource poor farmers from 1998/1999–1999/2000; the AgriculturalProductivity Improvement Programme (APIP) which provides inputs on credit to resource poorfarmers in 1998; and the Targeted Input Programme in 2000 which provides free inputs to resourcepoor farmers including cereal seeds, legume seeds and fertilizer. In the 2001/2002 season, the numberof beneficiaries of the APIP was reduced to 41,800 from 160,000 in the 2000/2001 season due tothe high default rate among smallholder farmers (NEC 2002). In the targeted input program,community-based targeting was used through village task forces using administrative criteria –widows/widowers with no source of income, the aged without any support and families keepingorphans without support. Chinsinga (2005) finds that this sort of targeting failed to reach intendedbeneficiaries efficiently due to the spirit of egalitarianism given the high levels of poverty and limitedquantities of inputs allocated to each area.
In 1996, under the Malawi Social Action Fund (MASAF) project the government startedimplementing the public works programme (cash-for-work) in areas that were food insecurethroughout the country as a safety net. More recently, since the 2005/2006 agricultural season,the government has been implementing a nationwide Agricultural Input Subsidy Programmetargeting 2.8 million smallholder farmers. Under this programme, the government is providingmore than 67% subsidy on the purchase of fertilizers and seeds for smallholder farmers withsubsidy coupons (ICL et al. 2007). The initial evaluations reveal that the policy has contributedsignificantly to the increase in maize production, reducing the need for expensive maize imports.In the 2005/2006 season, the private sector was largely excluded from the subsidy program andthis negatively affected the sales volume of the private sector especially small-scale agro-dealers.However, the inclusion of the private sector in the 2006/2007 subsidy program has increasedprivate sector sales of fertilizers although they still remain below the levels between 2000 and2005 (ICL et al. 2007).
AGRICULTURAL PERFORMANCE AND TRENDS IN POVERTY
The Structure of the Agricultural Sector
The agricultural-led development strategy has resulted in a dual agricultural system comprising estate(large-scale) production mainly for cash (export) crops and smallholder agricultural productionmainly to support the food security needs of the population. This has emerged from the pursuanceof four agricultural development objectives: to raise agricultural productivity and accelerate growthand export performance; to diversify the export base from the dominance of tea exports; indigenizeestate (large-scale) agriculture; and to encourage production by smallholder farmers (Kaluwa et al.1992). It has been noted that there was remarkable growth in estate agriculture particularly in burleytobacco production, with the ratio of the value of estate production to the value of officially marketedsmallholder production increasing from 0.79 in 1964 to 1.93 in 1979 based on three-year movingaverages (Kydd and Christiansen 1982).
Smallholder agriculture remains an important source of livelihoods for a majority of the ruralpopulation and approximately 84% of agriculture value-added comes from 1.8 to 2 millionsmallholder farmers who, on average, cultivate on less than 1 hectare of land (World Bank 2003).Others such as Alwang and Siegel (1999) estimate that 70% of Malawian smallholder farmerscultivate 1.0 hectare with the median area cultivated being 0.6 hectares, and devote 70% of the

10
land to maize, the main staple food.6 Maize is the dominant crop, grown mainly to meet subsistencefood needs, among smallholder farmers. Other studies have estimated that about 15% of the totalmaize production is marketed by smallholder farmers (Jayne et al. 2006). Other crops cultivatedby smallholder farmers include cotton, groundnuts, beans, sorghum, burley tobacco, paprika, riceand cassava. World Bank (2003) notes that food crops account for 70% of agricultural value added.Figure 1 shows the dominance of smallholder output in total agricultural output between 1973 and2005. The dual agricultural strategy of the 1960s and 1970s, which emphasized more on estateagriculture, led to increases in the share accounted for estates in 1975 and 1977. The share of estateagriculture fell in 1978, but there is an increasing trend thereafter until 2005, reaching the levelwitnessed in the mid-1970s.
6 Kydd and Christiansen (1982) and Lele (1989) note that per capita maize output from smallholder farmers stagnated and the output ofother crops either declined or showed no trend and small farms were getting smaller.
Source Computed from the Reserve Bank of Malawi (various) Financial and Economic Review
Figure 1. Malawi: Structure of agricultural output, 1973–2005.
The estate sector on average accounts for about 30% of agricultural GDP and is dominated bymajor export crops – tea, sugar, tobacco and coffee. The estate sector generates most of the outputin tea and sugar, with the smallholder sector contributing less than 20% of the output. Until theearly 1990s, the estate sector was also a major producer of tobacco. The liberalization of burleytobacco production by the smallholder sector in the early 1990s has led to a structural shift inburley production. There has been a large shift into smallholder burley tobacco production withsmallholder farmers accounting for more than 70% of production (MTPSD 2004). Others havenoted that since the liberalization of burley tobacco growing by smallholder farmers, estatecultivation has become less profitable (World Bank 2003). Nonetheless, there has been a generaldecline in the share of smallholder agricultural output particularly since the late 1980s. This periodalso coincided with the period of structural adjustment reforms, revealing poor response of

11
smallholder farmers to market-oriented policies. Some of the policies implemented imposedconstraints on smallholder agricultural production, including the removal of fertilizer subsidies,removal of government administered credit system and the reduction in state marketing activities(particularly for cotton farmers). In addition, the period has also been characterized by adverseweather conditions, negatively affecting smallholder production.
The Role of the Agricultural Sector
Table 2 presents the trends in the contribution of the agricultural sector to the Malawian economy.It is evident that the structure of the economy has remained largely unchanged since the 1970s,in terms of the contribution of the agricultural sector towards total output, total employment andtotal earnings. The average share of the agricultural sector in the 1970s is similar to the share ofagriculture in GDP in the post-reform period, during which agriculture accounts for 39% ofnational output. The sectoral shift in national output marginally occurred during the reform periodwhen the share of agriculture fell to 33% in the early 1990s. Similarly, the agricultural sectoraccounts for nearly 40% of total formal sector employment and it remains an important sourceof formal employment.
Table 2. Malawi: Share of the agriculture sector, 1970–2005.
Indicator Pre-Reform Reform Period Post-Reform
1970-79 1980-84 1985-89 1990-94 1995-99 2000-05
Share of agricultural GDP 39.63 37.23 35.88 33.36 38.60 38.49Share of total employment 39.84 48.79 45.88 49.96 69.17 39.50Share of total earnings 14.57 19.42 17.28 18.51 18.53 -
Source Computed by author from Reserve Bank of Malawi (various) Financial and Economic Review, GOM (various)Economic Report
Trends in Agricultural Performance
The performance of the agricultural sector can be measured in various ways including the growthrate of agricultural output; growth in agricultural value added per capita; the growth rate ofagricultural GDP accounted for by smallholder farmers; trends in food production of adequate foodcrops (food security); and export earnings.
Agricultural Output and Per Capita Output
Table 3 presents the trends in the levels and growth in per capita output. GDP per capita showsa declining trend from MK122 per capita in the 1970s to MK113 per capita in the 2000s. Thetrend in agricultural GDP per capita is similar to that of GDP per capita, only that in the formerthe declining trend is reversed in the period after major policy reforms were completed. Thesmallholder sector which mainly produce food crops, also show a declining performance up tothe early 1990s but production per capita increases in the late 1990s to reach levels recorded inthe 1970s in the 2000s.

12
The growth rates in GDP per capita and agricultural GDP per capita were generally negative duringthe period of economic reform, with some improvements in the period after reforms particularly inthe late 1990s. The late 1990s actually registered higher growth rates in GDP per capita andagricultural GDP per capita than the positive growth rates witnessed in the 1970s. The performanceof the agricultural sector is also depicted in Figure 2, with respect to the growth rates in agriculturalGDP and the smallholder agricultural GDP. The figure shows that the growth rates in agriculturalGDP have been erratic and inconsistent over time; with similar trends in total agricultural GDPand smallholder agricultural GDP per capita. The first episode of a decline of agricultural GDPwas witnessed in the late 1970s following an economic crisis that led to the adoption of structuraladjustment programs. The longest episode of agricultural GDP per capita decline occurred duringthe period of economic reforms, with sustained declines from 1984 to 1989. Thereafter, theperformance has been erratic, with the major declines in 1992 and 1994 of -27% and -32%,respectively. The recent trends show a disappointing performance of the agricultural sector. Forexample, the data show some stagnation of agricultural output recently, particularly since 2000.
Table 3. Malawi: Trends in agriculture sector output, 1970–2005.
Indicator Pre-Reform Reform Period Post-Reform
1970-79 1980-84 1985-89 1990-94 1995-99 2000-05
Levels (MK 1978 prices)GDP per capita 122.12 118.44 116.89 113.87 113.20 113.31Agricultural GDP per capita 48.41 44.10 41.94 38.16 46.94 56.17Smallholder agriculture GDP/capita 34.97 35.59 32.41 26.97 29.50 34.03
Growth Rates (%)GDP per capita 2.40 -2.08 -0.20 -2.66 3.17 -0.28Agricultural GDP per capita 1.90 -2.70 -1.89 -1.19 11.55 0.36Smallholder agriculture GDP/capita 5.80 -4.07 -2.88 1.52 10.57 -1.78
Source Computed by author from Reserve Bank of Malawi (various) Financial and Economic Review, GOM (various)Economic Report
Figure 2. Malawi: Trends in agricultural output per capita growth rates, 1974–2005.
Source Computed from the Reserve Bank of Malawi (various) Financial and Economic Review

13
Generally, the performance of the agricultural sector, as was the performance of many sectors inthe economy, was impressive in the 1960s and early 1970s, but stagnated in the late 1970s andearly 1980s through to the early 1990s with marginal improvements since 1995.
Food Production and Food Security
Achieving national food security has been one of the objectives of agricultural strategies sinceindependence. In Malawi, national food security is mainly defined by the government in terms ofpeople’s access to maize, the main staple food. Thus, even if the total food production is above theminimum food requirement but maize supply is below the minimum food requirement, the nation isdeemed to be food insecure (Chirwa and Zakeyo 2003). The nation, therefore, faces a food crisis ifthe production and supply of maize falls below the minimum required levels. Other food crops suchas rice and cassava are alternatives to maize in some parts of the country. Maize has remained themain staple food for Malawians, in spite of government policy to promote other crops such as cassavaand rice as alternatives to maize. In a study of recipients of the free inputs in the 1999/2000 season,96.4% reported that maize was the staple food for the household, while cassava is a staple foodonly for 2.8% and rice for 0.5% of the sampled households (NSO 2000).
Measured against the minimum maize requirement of 185 kilograms per capita, Malawi had beenself-sufficient in maize production in the 1960s and 1970s during which domestic production hasbeen above the minimum requirement (Figure 3). During these periods, records in Malawi indicatethat no maize imports were required to augment domestic supply. Msukwa (1994) notes that withan increase in the population since the mid-1980s, Malawi moved from a situation of national self-sufficiency in food production to recurring food deficits. The period of economic reforms has beencharacterized by increased imports of maize to satisfy domestic demand, partly due to the poorweather conditions, low maize productivity and high population growth. In some cases, other food
Figure 3. Malawi: Trends in main food staples per capita, 1974–2005.
Source Computed from FAOSTAT data

14
crops such as rice, cassava, sorghum and potatoes are bridging the national shortages in maizeproduction and supply. Cassava production has substantial increases in the late 1990s, but only afew households produce cassava.7
According to World Bank (2003), per capita maize production since the early 1990s has fluctuatedbetween 170 and 220 kilograms, with sharp declines in 1992 (67 kilograms) and 1994 (105kilograms). At household level, recent surveys indicate that the average months of food securityfor rural households from own production in a normal year is between 6 and 7 months. For instance,World Bank (2003) notes that food supplies in Malawi fluctuated between 1.6 and 1.7 kilocalories(kcal) per capita per day during the 1996-1999 period compared to the minimum requirement of2.2 kcal per capita per day. The increase in food production in 1999 and 2000 has been largelyattributed to good weather and the implementation of the agricultural safety net programmes includingthe free ‘starter pack’ and targeted input program. In addition, it has been observed that there wasan increase in input credit facilities under the agricultural productivity and improvement programmeand from the Malawi Rural Finance Company (World Bank 2003).
The decline in maize production began in the late 1970s and the first national maize deficit waswitnessed in 1987 and the worst situation occurred in 1992. Nonetheless, it is evident from Figure3 that maize production in the past two decades has fallen below the minimum national foodrequirement for a staple. Recent trends in maize production show declining production. These maizeshortages have led to surges in the importation of maize to meet the maize demand (Chirwa andNgalawa 2006). According to ADE (2000) imports of maize have typically been between 100,000and 150,000 metric tonnes during the years of shortages since 1987. The situation is worst athousehold level, with a significant number of households experiencing food shortages, and relyingon food relief. NSO (2005) finds that about 57% of households reported having inadequate foodconsumption in 2004/2005. GOM (2006) notes that Malawi continues to suffer from chronic foodinsecurity with many of the problems being structural and economic in nature, and the aggregatefood production failing to keep pace with population growth. Most households, particularly in therural areas, experienced agricultural related shocks between 2000 and 2005; the most significantshocks being lower crop yield and large increases in the price of food affecting 69 and 79% ofrural households, respectively (NSO 2005).
Livestock Production and Trends
The performance of the livestock sector has not been encouraging. Figure 4 presents the trends inlevels and growth of livestock per capita. The per capita number of chickens and cattle has beendeclining, with the average in the past five years being lower than that recorded in the early 1970s.The per capita number of goats, however, has increased marginally. The growth rates in the stock oflivestock, however, show unstable trends, with gains in the one year being almost wiped out thefollowing year. The poor performance of the livestock sector is partially a reflection of the lack ofemphasis in the agricultural strategies and policies towards the sector. For instance, the dairy farmingsector in Malawi is just being developed. Chirwa and Ngalawa (2006) note several capacity constraintsexperienced by the dairy farming sector including lack of financial resources to purchase cows, poorfarm management, inadequate local capacity to champion dairy business development, outdatedmachinery in some dairy processing plants and lack of competition in the dairy processing sector.
7 World Bank (2003) notes the estimates for root crops (cassava and sweet potatoes) tend to be overstated and understate the potentialfood shortages.

15
Agricultural Trade Performance
The agricultural sector contributes more than 90% of foreign exchange earnings but the export basketis dominated by the traditional exports of tobacco, tea and sugar (Table 4). Tobacco is the majorexport crop in Malawi accounting for about 71% of total exports in the 1995-1999 period from 47.7%in the 1970s, although its share in exports dropped to approximately 55% more recently due to decliningprices. Tea has traditionally been the second foreign exchange earner but its significance has beendeclining from 21.2% in the 1970s to 8.8% in the late 2000s. The recent trends show that sugar hastraditionally been the third most important export commodity and is becoming the second from tobaccoaccounting for 11.4% of export earnings in the 2000-2005 period. With the liberalization of burleytobacco production and marketing, smallholder farmers account for about 70% of the total nationaloutput. Tea and sugar remain export crops that are largely grown by estates, and domestic andmultinational corporations, while groundnuts are solely grown by smallholder farmers.
Table 4. Malawi: Composition of export earnings by main commodity (%), 1970–2005.
Commodity Pre-Reform Reform Period Post-Reform
1970-79 1980-84 1985-89 1990-94 1995-99 2000-05
Tobacco 47.7 50.4 57.7 69.9 70.5 54.6Tea 21.2 18.2 14.4 9.7 9.0 8.8Sugar 7.1 13.3 10.0 6.7 7.0 11.4Nuts 7.7 3.0 2.0 - - 1.9Cotton 2.9 0.7 1.2 1.1 1.7 2.1Rice - 0.4 0.3 0.2 0.5 0.2Coffee - 0.7 3.4 2.3 2.7 0.8Pulses - 1.6 2.0 0.5 1.7 0.8Maize - - - 0.1 0.3 -Other (non-agric) 13.4 11.6 8.9 9.5 6.6 19.4
Source Computed based on NSO (various) Statistical Yearbook and Reserve Bank of Malawi (various) Financial andEconomic Review
The trends in export composition also show that the post-reform period is associated with the emergenceof new export crops such as coffee, pulses and rice and the re-emergence of the nuts (ground, cashewand macadamia) market, and the increase in the share of non-agricultural exports. The traditionalexports of tobacco, tea and sugar remain the dominant exports for Malawi. Apart from tobacco,production of tea and sugar is dominated by estate agriculture; the participation of smallholder farmers
Figure 4. Malawi: Livestock production trends, 1970–2005.
Source Computed from FAOSTAT data
16
in production is marginal. Paprika is another emerging crop that is substituting tobacco in the centralregion, but contributes insignificantly to export earnings. Groundnuts, traditionally one of thesmallholder cash crops, used to be one of the major export crops until the late 1980s when the exportmarket collapsed between 1990 and 1999. One likely reason for the collapse of the export market isthat prior to liberalization of agricultural marketing services, groundnuts bought from smallholderfarmers were being exported by ADMARC, but after liberalization ADMARC’s role in the marketingof groundnuts has diminished substantially. Domestic trade in groundnuts is dominated by small privatetraders who eventually sell to Malawian manufacturers. More recently, the cultivation of groundnutshas been promoted by the National Smallholder Farmers’ Association of Malawi (NASFAM), resultingin its re-emergence in export earnings.
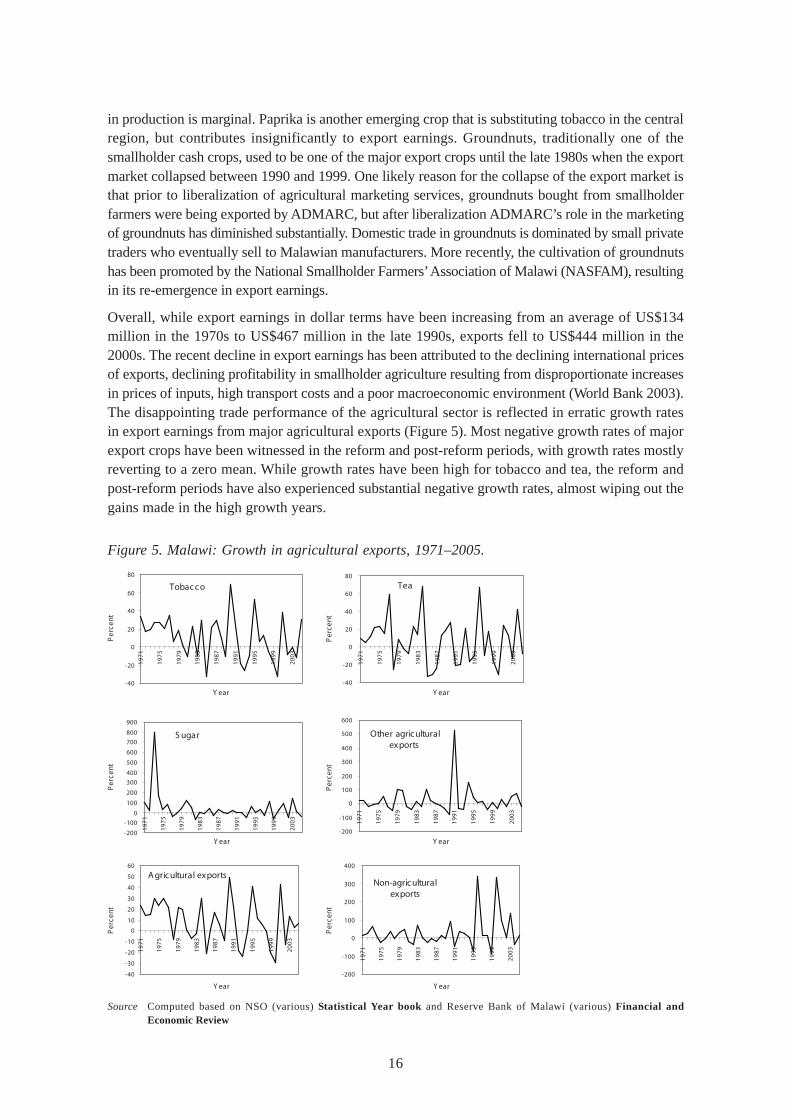
Overall, while export earnings in dollar terms have been increasing from an average of US$134million in the 1970s to US$467 million in the late 1990s, exports fell to US$444 million in the2000s. The recent decline in export earnings has been attributed to the declining international pricesof exports, declining profitability in smallholder agriculture resulting from disproportionate increasesin prices of inputs, high transport costs and a poor macroeconomic environment (World Bank 2003).The disappointing trade performance of the agricultural sector is reflected in erratic growth ratesin export earnings from major agricultural exports (Figure 5). Most negative growth rates of majorexport crops have been witnessed in the reform and post-reform periods, with growth rates mostlyreverting to a zero mean. While growth rates have been high for tobacco and tea, the reform andpost-reform periods have also experienced substantial negative growth rates, almost wiping out thegains made in the high growth years.
Figure 5. Malawi: Growth in agricultural exports, 1971–2005.
Source Computed based on NSO (various) Statistical Year book and Reserve Bank of Malawi (various) Financial andEconomic Review

17
A similar picture emerges with respect to total agricultural exports, but less so for non-agriculturalexports. Malawi witnessed high, positive and consistent positive growth rates in total agriculturalexports in the 1970s. These positive outcomes were due to policy consistencies and the active stateintervention in agricultural production and marketing systems. For instance, ADMARC marketingactivities facilitated the coordination of smallholder agricultural exports through its national purchaseof small quantities from smallholder farmers, grading and processing for exports. The situationchanged to swings in the growth rate since the adoption of structural adjustment programs, withthe average annual growth of agricultural exports declining from 19% per annum in the 1970s to5% per annum between 1980 and 2005. On the other hand, the performance of non-agriculturalexports, though not consistent, has generally improved over the past decade.
Agricultural Growth and Poverty Outcomes
The difficulties that arise in linking growth to poverty reduction are well-known in the literature.World Bank (2001), for instance, notes that the patterns of growth, the changes in the distributionof income and resulting opportunities and the rates of poverty distribution are a result of a complexinteraction among the policies, institutions, history and geography of countries. Hence, the extentto which a given rate of growth that translates into poverty reduction will depend on how distributionof income changes with growth and on initial inequalities in incomes, assets and access toopportunities that allow poor people to participate in generating growth.
Recent debates in the growth-poverty nexus point to the fact that the poor are likely to benefit fromgrowth if such growth occurs in sectors in which a large proportion of the poor actively participateand derive their livelihoods (Hoekman et al. 2001), such as the agricultural sector in Malawi. Thereare several ways through which agricultural growth and development will affect the welfare of thepopulation, particularly the poor. First, the landless or near landless may benefit from agriculturaldevelopment through paid employment opportunities in off-farm activities created by technologicalchange. Second, those who have land may benefit from higher productivity brought about bytechnological changes. The extent to which agricultural development can have greater impact onpoverty also depends on the availability of land. However, Bigsten and Shimeles (2003) assert thatthe direction of causality of the growth-income distribution-poverty relationship is still very unclearin theory as well as in empirical studies.
The link between agricultural growth and poverty can be assessed through malnutrition levels andthe extent of poverty. However, it is difficult to empirically link agricultural growth to poverty andfood security (such as malnutrition rates) indicators. Although time-series data exists on agriculturalperformance indicators, there is a lack of comparable data on poverty and malnutrition. Apart fromthe problem of limited available data, there are differences in the methodologies used in collectingdata for the same indicator over time. The limited available data is used in assessing the link betweenagricultural growth and poverty indicators but the analysis should be interpreted with some caution.
Malnutrition Rates
The agricultural strategy in Malawi focuses on food production and food security with the ultimateobjective of uplifting the nutritional status of her population. Several studies have been conductedsince the early 1990s to determine the trend in the nutritional status of the population. Oneindicator of the food and agricultural policy and nutrition education programmes that thegovernment has pursued over the years is the nutritional status of children under five years ofage. Table 5 presents the trends in the nutritional status of the under-fives and growth in

18
Table 5. Malawi: Trends in the malnutrition and growth of children under-five, 1992–2005.
Malnutrition (%) 1992 (DHS) 1998 (IHS) 2000 (DHS) 2004/05 (IHS)
Stunting 48.7 59.1 49.0 43.2Wasting 5.4 9.3 5.5 4.6Underweight 27.2 29.6 25.4 22.0
Agricultural growth (%) 1990-94 1995-99 2000-2005
Agricultural value-added per capita growth -1.19 11.35 0.36
Notes DHS = Demographic and Health Survey, IHS = Integrated Household SurveySources NSO (2002); NSO and ORC Macro (1994, 2001); GOM et al. (2005)
agricultural value added per capita between 1992 and 2005. Three protein-energy malnutritionindicators have been used in Malawi: stunting (low height-for-age) representing chronicmalnutrition, wasting (low weight-for-height) representing acute malnutrition and underweight(low weight-for-age) describing the overall measure of malnutrition. The baseline malnutritionindicator for monitoring the Millennium Development Goals is the proportion of childrenunderweight, recorded at 30% in 2000 (GOM 2006).
The progress in the three indicators of nutritional status has been mixed. Comparing the Demographicand Health Survey (DHS) data, stunting increased marginally from 48.7% in 1992 to 49% in 2000.It is also apparent that stunting has remained relatively stable despite the many economic reformsimplemented by the authorities that might have uplifted the status of the population. Similarly, theindicator of acute malnutrition (wasting) shows a similar trend increasing marginally between 1992and 2000. The overall measure of malnutrition improved marginally from 27.2% in 1992 to 25.4%in 2000. Using the Integrated Household Survey (IHS) methodology, the proportion of underweightchildren decreased from 29.6% in 1998 to 22% in 2004/05. Similarly, there are substantial decreasesin stunting and wasting between 1998 and 2004/05. The data suggests a weak link between indicatorsof malnutrition and agricultural growth. For instance, while underweight improved using the IHSmethodology, the average annual growth rate of agricultural value added per capita substantiallyfell from approximately 11% to less than 1%. Similarly, using the DHS methodology, the malnutritionindicators increased marginally, yet the growth rate in agricultural value added per capita increasedfrom approximately -1.2% to 0.4% per annum.
Poverty Levels
There is also weak evidence to suggest a positive link between poverty and agricultural growth inMalawi (Table 6). Within a seven-year period between 1998 and 2005, there has been very little orstatistically no change in the poverty levels. Using comparable methodologies, the proportion of
Table 6. Malawi: Poverty and agricultural growth, 1998–2005.
Poverty head count (%) 1998 2004/05
Poor 54.1 52.4Ultra-poor 23.6 22.4
Agricultural growth (%) 1995-99 2000-05
Agricultural value-added per capita growth 11.35 0.36
Sources GOM (2006)

19
the poor fell from 54.1% in 1998 to 52.4% in 2005. During the same period, growth in agriculturalvalue-added per capita fell from approximately 11.4% to 0.4% per annum.
Although Malawi had almost completed economic policy reforms towards a market economy andmarginal growth in agricultural output, the qualitative poverty monitoring study conducted in 2000revealed that the poverty situation was worsening (GOM 2002). With the policy of agriculturalinput subsidization, leading to increase in maize production and sustained low consumer prices formaize, it is likely that poverty will fall. Since most of the households have adequate food, more arelikely to engage in productive activities and lower maize prices will increase the real incomes ofthe poor and will facilitate diversification into cash cropping by some farmers – if the relative pricesof maize remain low.
EXPLAINING AGRICULTURAL PERFORMANCE IN MALAWI
Generally, the performance of the agricultural sector in Malawi has been disappointing, in spite ofthe many policy reforms that have been implemented in the sector. GOM (2006) notes that agriculturein Malawi is characterized by low and stagnant yields, over-dependence on rain-fed farming whichincreases vulnerability to weather related shocks, low level of irrigation development, and low uptakeof improved farm inputs. In addition, there is low profitability of smallholder agriculture whichhas been influenced by weak links to markets, high transport costs, few farmer organizations, poorquality control and lack of market information. The interplay of these various factors has negativelyaffected agricultural development and growth, with implications on the contribution of agriculturetowards poverty reduction.
Productivity
The poor performance of the agricultural sector in Malawi is partly attributed to the low levels andgrowth rates in productivity. Figure 6 presents trends in productivity of main agricultural crops inMalawi between 1970 and 2005. Productivity is measured as output per area of land cultivated inhectares, but has been indexed to base 1970. The red line is the trend line. The figure shows thatproductivity in most of the agricultural crops has not substantially improved beyond the levelswitnessed in the 1970s, except for a few crops.
With respect to the main food crops, the trend lines show marginal increases in maize and riceproductivity, a substantial increase in cassava productivity and a decline in sorghum productivity.For instance, in maize production, the trend line shows that productivity has increased marginallyover time, although with several swings in the period after 1990. Within the period 1990 to 2005,maize productivity slumped by 53 units in 1991 below the 1970 level but was above the 1970 levelby 78 units in 1999. The gains in productivity have been substantial in cassava productionparticularly since 1999, although just a small proportion of smallholder farmers cultivate cassava.Until the early 1990s, when burley tobacco production was liberalized, tobacco farming registeredsteady improvements in productivity with a modest positive trend line, although there has been areversal more recently. Tea is the only crop that has witnessed steady improvements in productivitysince 1970. There has, however, been a declining productivity in the past six years in both maizeand rice production. In fact, most of the crops show negative rates of productivity growth in the2000-2005 period, with the exception of beans and tea (Table 7).

20
Table 7. Malawi: Productivity growth by main commodity (%), 1970–2005
Commodity Pre-Reform Reform Period Post-Reform
1970-79 1980-84 1985-89 1990-94 1995-99 2000-05
Maize 2.74 -0.06 0.27 23.94 18.48 -5.67Rice 3.43 14.67 2.97 -0.08 6.47 -7.79Cassava 0.37 -7.32 -6.97 11.92 10.19 32.21Sorghum 0.08 13.47 3.06 24.80 29.17 -0.93Groundnuts -0.82 1.02 -5.69 18.18 19.46 -4.53Beans 0.01 0.09 0.43 -0.49 -6.08 1.54Pulses -0.05 -0.38 -0.65 -0.92 -0.99 -0.49Cereals 2.57 0.16 0.32 22.15 18.14 -5.99Tobacco 7.86 5.51 3.64 5.88 -8.84 -1.41Tea 5.45 3.32 1.35 -0.24 0.70 4.50
Average 2.16 3.05 -0.13 10.51 8.67 1.14
Source Computed based on FAOSTAT data.
Weather Conditions and Agricultural Performance
The agricultural sector is heavily dependent on rain-fed cultivation. Although the potential for irrigationfarming exists, there has been a marginal increase in the area under irrigation cultivation (Figure 7a).In 1970, only 0.06% of agricultural cultivatable land was under irrigation, but this has increased
Figure 6. Malawi: Productivity trends in main agricultural crops, 1970–2005.
Source Computed based on FAOSTAT data

21
marginally to 0.47% in 2005. More recently, the government and non-governmental organizations havebeen promoting winter cropping using low cost irrigation equipment such as treadle pumps.
Of the 3 million hectares of agricultural cultivatable land, more than 99% of agricultural land remainsunder rain-fed cultivation. This makes agricultural production highly prone to adverse weatherconditions such as droughts and floods. It is, therefore, not surprising that agricultural productionis highly correlated with good rainfall. Most of the bumper harvest in maize, the main crop producedby smallholder farmers, has been witnessed in years that Malawi has had good rainfall. ICL et al.(2007) notes that the relationship between agricultural production and rainfall is a complex one, astoo little rainfall or too much rainfall both have adverse effects. This complex relationship is alsodemonstrated in Figure 7(b), which shows no clear relationship between rainfall and maizeproduction. Malawi, like many Southern African countries, has recently experienced adverse weatherconditions that have affected production of both food and cash crops. Table 8 shows the years thathave been affected by adverse weather conditions and the resulting agricultural performance between1980 and 2005. It is evident that in years of poor weather conditions agricultural growth and growthin maize output has been largely negative.
Table 8. Weather conditions affecting agricultural production, 1980–2005.
Year Adverse weather conditions Growth in Growth inagricultural maize
value added (%) production (%)
1980 1979/1980 season: drought affecting many districts particularly in the -9.5 -14.9southern region
1981 Variable rainfall in some parts of the country -10.8 5.0
1992 1991/1992 season: drought -27.4 -58.7
1993 1993/1994 drought conditions, low uptake of hybrid seeds -32.2 -48.9
1998 1997/1998 drought in Karonga Agricultural Development Division and -6.2 44.5floods in Shire Valley in the 1997/1998 season
2001 2001 dry spells and floods in some areas, low input uptake 0.3 -36.5
2002 2001/2002 season: early rains, late rains, dry spell in February and floods in 6.3 -2.0the escarpment and lakeshore exacerbated by low input use – scaling downof Starter Pack program and lack of credit (14% decrease in maize production)
2005 2004/2005 season: poor rains -9.7 -27.7
Source Chirwa and Ngalawa (2006)
Figure 7. Malawi: Rainfall and maize production, 1970–2005.
(a) (b)
Source Computed based on NSO data

22
Landholding Sizes and Fragmentation
The promotion of smallholder agriculture has been on customary land, land in which rights tocultivate and transfer land are conferred by traditional chiefs. With the growing population,customary land has become more fragmented and the landholding sizes have declined over time.GOM and World Bank (2006) find that the average landholding size per household in Malawi is1.2 hectares while the average land per capita is 0.33 hectares. In addition, per capita landholdingsare highly skewed, with the poor holding only 0.23 hectares per capita compared to the non-poorthat hold 0.42 hectares per capita. The small landholding sizes are reflected in Figure 8, whichshows the trends in per capita cultivatable land in Malawi. The trend line shows that per capitalandholdings have been declining since the 1970s, partly due to the increasing population that hasbeen growing at an average rate of 3% per annum. The peak between 1998 and 2005 is due todeclining estimated population growth and increases in cultivatable land. The increase in cultivatableland may be due to the cultivation of marginal and less productive land.
Figure 8. Malawi: Trends in per capita cultivatable land, 1970–2005.
Source Computed based on FAOSTAT data
The methods of cultivation on these small landholdings among smallholder farmers remain traditionaland non-mechanized. The diminishing land sizes have implications for technology adoption and farmmechanization. There have been several government efforts promoting the adoption of fertilizers,hybrid seeds and modern methods of farming, and the provision of price incentives throughprogressive market reforms, but due to diminishing landholdings the supply response has remainedweak. National survey data show that less than 50% of smallholder farmers use hybrid or improvedmaize seeds and less than 35% of farming households use fertilizers. Without the input supportsystem the uptake of fertilizers among smallholder farmers is quite low. Several studies show evidencethat adoption of agricultural productivity-enhancing technologies in Malawi is positively associatedwith the size of cultivatable land (Green and Ng’ong’ola 1993; Zeller et al. 1998; Chirwa 2005).Dorward (1999) finds a significant positive relationship between output per capita and farm size

23
while Chirwa (2002) finds farmers with small landholdings to be technically inefficient in maizeproduction. Other studies, however, find an inverse relationship between maize productivity andland while there is a positive relationship between land and tobacco productivity.
Markets and Value Addition
Since the adoption of structural adjustment programs, there has been a progressive liberalizationof markets, with the state withdrawing its direct interventions in various markets including inputmarkets, output markets and financial/capital markets. However, the liberalization of markets hashad little impact on agricultural development in Malawi. The period during which Malawi wasimplementing structural adjustment reforms, which mainly focused on the agricultural sector, hasalso registered lower average growth in the economy and the agricultural sector, while the povertysituation has worsened. The failure of economic liberalization in agriculture has been attributed tomany factors (Dorward et al. 2005). Those that advocate economic liberalization attribute the failureof liberalization to partial liberalization and the many policy reversals and policy uncertaintieswitnessed during the period. For instance, the withdrawal of fertilizer subsidies that started in 1987was reversed in 1992 after a significant drop in the uptake of fertilizers by smallholder farmers,although eventually subsidies were finally removed in 1996. Another cited example of liberalizationis the liberalization of agricultural markets which has not been fully implemented, with the statemarketing agency continuing to play a significant role in the marketing of smallholder agriculturalproduce (Chirwa 1998). These uncertainties have created disincentives for the development of theprivate sector. Others such as Dorward et al. (2005) note that liberalization ignored the importanceof market coordination and the positive role the state plays in ‘kick starting’ agricultural developmentin economies with thin markets. For instance, the collapse of the government administered creditscheme in Malawi in 1992 adversely affected fertilizer use among smallholder farmers leading todeclining productivity.
Product markets and input markets for agricultural growth are functioning imperfectly. Manysmallholder farmers are not integrated into the market system. Most smallholder farmers are poorlyorganized and, therefore, lack bargaining power over pricing of agricultural produce. Transactioncosts remain high due to low economic activities, low traded volumes of agricultural produce, inputsand agricultural finance (Dorward and Kydd 2004). There is variable access to input markets andoutput markets are less favorable to smallholder farmers. Access to agricultural finance is also limitedamong smallholder farmers, particularly since the collapse of the smallholder credit scheme withinthe coordinated structure of ADMARC. Commercial banks and microfinance institutions considerlending to the agricultural sector as a risky investment due to the seasonality of the income streamand the unpredictability of the natural environment particularly for rain-fed agriculture that ispracticed in Malawi. Thus, most financial institutions are willing to lend to non-farm activities.The major challenges are how to coordinate the complementary services for the promotion ofagricultural growth in a liberalized market in which most markets are still thin and workingimperfectly; how to develop the private sector and ensure that it operates efficiently; how to achievescale in the product markets for export crops; and the role of the state in the market. The otherchallenge is how to restore agricultural credit given the past repayment problems.
Associated with the problem of market liberalization is the lack of value addition in agriculturalproducts. There is very little agro-processing that is taking place and most smallholder farmers sellraw agricultural produce without adding value. This has implied that the returns to agriculture havebeen lower than otherwise. For the main cash crops, such as tobacco and cotton, which is mainly

24
grown by smallholder farmers, there is no value addition by smallholder farmers. This has, in mostcases, affected the prices at which smallholder farmers sell these commodities to the large-scaleprocessors. However, there are efforts to promote value addition in agriculture. According to GOM(2006) one of the key areas of agricultural development policy is to promote value addition toagricultural products by smallholder farmers. There are several initiatives that are promoting valueaddition, including the One Village One Product (OVOP) project in which rural farmers are assistedwith in procuring milling and processing facilities.
Policy Environment and Supply Responses
Since 1980 there have been policy reforms that have mainly targeted the agricultural sector. However,such policy reforms have not been effective in changing the structure and the performance of theagricultural sector in Malawi. Although structural adjustment programs have resulted in removingpolicy linked distortions in the agricultural sector to a large extent (Chirwa and Zakeyo 2006), theagricultural sector still experiences problems of physical access to domestic markets, access to ruralcredit facilities, low productivity and inequitable distribution of land. Kaluwa et al. (1992) alsonotes that although the reforms were necessary to halt the further deterioration in the economy,they were not sufficient for increasing the incomes and growth potential for a majority of theMalawian population. Smallholder production, especially in maize yields, and expansion of acreagehas been devoted to food production rather than diversification into high value or export crops.The disappointing performance of the agricultural sector is at variance with intentions of the manyeconomic reforms and policies aimed at enhancing the productivity of smallholder agriculture thathave been implemented by the government.
One characteristic feature of development planning in the past two decades has been policyincoherence and policy overlaps. Since 1994, Malawi has developed at least five policy documentswith focus on the agricultural sector to guide economic development. However, there have beentoo many overlaps of these documents more recently, partly due to bilateral and multilateral donorsthat tend to influence economic reforms and development agenda. For instance, the Malawi PovertyReduction Strategy (MPRS) launched in 2002 was expected to run up to 2005, but was supersededby the Malawi Economic Growth Strategy (MEGS) in 2004, which was superseded by the MalawiGrowth and Development Strategy (MGDS) in 2006. While smallholder agriculture took centerstage in driving pro-poor growth in the MPRS, large farmers and private businesses take centerstage in the MEGS and MGDS. In contrast, in the 1970s, policy coherence and consistence wasachieved through the development of well-thought strategies that existed within their planning horizon,with no overlaps between the strategies.
Trends in Public Investments in Agriculture
There has been a general concern that funding, including donor funding, towards the agriculturalsector in sub-Saharan African (SSA) countries has been declining (Eicher 2003). Some haveattributed this declining support towards agriculture as one cause of underperformance of SSAagriculture. Africa has not devoted adequate resources to the agricultural sector, and funding towardsagricultural research and development has been declining (AU and NEPAD 2003). The share ofthe agricultural budget in SSA has fallen to around 5% of national budgets. In 2003, the AfricanUnion Assembly committed to implement the Comprehensive Africa Agriculture DevelopmentProgramme (CAADP) jointly formulated with the New Partnership for Africa’s Development

25
(NEPAD) and declared their commitment to increase spending in agriculture to 10% of the nationalbudget. Table 9 shows budget allocation trends in Malawi between 1970 and 2005. It is evidentthat government expenditure on the agricultural sector has been declining, particularly since the1980s when Malawi started implementing structural adjustment programs.
Table 9. Malawi: Trends in agriculture sector government spending, 1970–2005.
Commodity Pre-Reform Reform Period Post-Reform
1970-79 1980-84 1985-89 1990-94 1995-99 2000-05
Agriculture share in budget (%) 32.15 24.83 10.08 11.17 8.98 6.13Agriculture budget ($m) 21.30 43.98 29.05 41.90 36.12 37.48
Recurrent budget ($m) 8.39 21.69 18.52 30.56 26.66 22.17Development budget ($m) 12.91 22.29 10.54 11.34 9.46 15.31
Agriculture spending/capita ($) 4.03 6.88 3.85 4.77 3.51 3.21
Source Computed based on NSO data
Government budget allocation to the agricultural sector declined from approximately 32.2% of thefiscal budget in the 1970s to 6.1% in the past six years. This is also reflected in Figure 9(a), inwhich the share of agriculture in the national budget increased from 16% in 1970 to the highestever recorded level of 53% in 1978, but fell in 1979 due to the economic crisis that was triggeredby the oil shock in 1979. However, agricultural expenditure rose to 51% in 1981 before falling to12% in 1982, and the declining trend has continued thereafter. The share of agriculture in the fiscalbudget had been above the 10% that has been declared by the AU as necessary to achieve sustainableagricultural development. This is also the period during which Malawi witnessed high agriculturalgrowth rates and high growth rates in GDP. In the past decade, budget allocation to the agriculturalsector has fallen well below the AU/NEPAD target of 10%. The reduction in the share of agriculturalbudget is a direct reflection of the government’s withdrawal of services in the sector under structuraladjustment programs. Since 1981, the government has been reducing its direct intervention in theagricultural sector including reduction in extension staff through a policy of non-replacement ofvacant positions, reduced funding to extension training institutions, withdrawal of input subsidies,withdrawal of credit provision and reduction in funding agricultural research and development.
In terms of the allocation of agricultural spending, Figure 9(b) shows that both recurrent anddevelopment expenditure had been increasing in the 1970s, but a substantial decline in development
Figure 9. Malawi: Trends in agricultural sector expenditure, 1970–2005.
Source Computed based on NSO data.

26
expenditure is noticeable in the late 1990s. This is the period in which under structural adjustmentprograms, the government was withdrawing its active participation in the agricultural sector throughthe liberalization of agricultural marketing activities, agriculture research and development,withdrawal of the government administered credit system and removal of input (fertilizer) subsidies.Development expenditure in agriculture reached its lowest level between 1993 and 1995. Most ofthe resources in the development budget in Malawi are financed by donors, and the dramatic fallbetween 1993 and 1995 is a result of the freeze in donor funding pending democratic political reformsfrom a one-party state to multi-party democracy. Similarly, in 2001 and 2004, the withdrawal ofdonor aid adversely affected the agriculture budget, particularly the development budget. Thedeclining share of agriculture in the government budget has led to the erosion of core services tosmallholder farmers such as extension services. Only 13% of agricultural households got advicefrom an agricultural adviser on crop and input management (NSO 2005). There has also been adecline in funding for research and development in agriculture. Most state institutions that developedcapabilities in agricultural research and development have either been closed or remain underfundedand are being asked to commercialize.
However, with the introduction of the agricultural input subsidy programme since the 2005/2006agricultural season, the share of agriculture in the total budget is bound to increase in the shortand medium term. The agricultural input subsidy is about 43% of the agricultural sector budgetand donors are increasing their support to agriculture through the subsidy (ICL et al. 2007). In the2006/2007 fiscal budget, the allocation to the agricultural sector was US$121 million, almost doublethe level in the 2005/2006 budget, of which US$44.8 million was the development budget. Theshare of the agricultural sector rose to 12% of the total 2006/2007 budget and the developmentexpenditure allocation increased by more than double and constituted 13% of the development budget(GOM 2006). One activity that was singled out as a major contributor to the increase in the recurrentexpenditure in agriculture was the rebuilding of extension services that had virtually collapsedfollowing structural adjustment programs. Nonetheless, very little has been done so far to rebuildextension services. Most of the rural areas remain uncovered by agricultural extension services.
For the first time since 1995 and following the AU Maputo Declaration in 2003, Malawi achievedmore than the target of 10% in both its recurrent and development budget for the agricultural sectorin the 2006/2007 budget. The impact of the agricultural input subsidy has been positive. Maizeproduction is projected to have reached the highest level in the 2006/2007 season, following anothergood year in 2005/2006 that was also supported by the input subsidy (ICL et al. 2007). The surplusin maize production has resulted in sharp reductions in maize prices, making it easier for the poornet buyers of maize to purchase maize. The expectation is that continued subsidization of agriculturalinputs will have a positive impact on household welfare. The cost of the subsidy program, giventhe participation of the private sector, are outweighed by the benefits that result in increased realincomes for the poor due to falling and stable prices for maize.

27
CONCLUSIONS
The agricultural sector remains the most important sector in the economy and the dominant sourceof livelihood among rural households in Malawi. The paper set out to review the performance ofthe agricultural sector over time and the recent trends in agricultural growth and food security. Inthe past two and half decades, the economy has been undergoing economic reforms that have mainlyaffected the agricultural sector. However, despite these reforms, the agricultural sector has poorlyperformed, and a large proportion of the population that depend on the agricultural sector remainin poverty. Thus, while some positive agricultural growth has occurred this has somehow been wipedout by subsequent negative agricultural growth.
The study finds that the contribution of agriculture to national output has remained fairly stableover time. However, the performance of the agricultural sector has been mixed. The analysis showsthat the performance of the agricultural sector was much better in the 1970s compared withsubsequent periods, with agricultural value-added per capita growing at an average rate of around2% per annum in the 1970s compared with 0.4% per annum in the last six years. This poorperformance has also been reflected in the inability of the economy to produce adequate food tofeed its population. While in the 1970s maize production was always above the minimum requiredfor a staple, this has not been the case since the mid-1980s in which for a number of years maizeproduction has been below the minimum required for a staple. Livestock production has notperformed well, in per capita terms – with recent trends showing a decline in per capita chickenand cattle production. In terms of agricultural trade, a similar picture of mixed performance emerges.The export composition of agricultural products has remained stable, and agricultural exports remaindominated by tobacco which accounts for 55% of total export (agricultural and non-agricultural)earnings.
Using the limited data series on outcome indicators of poverty and malnutrition, the analysis showsno significant links between agricultural sector performance and poverty indicators. During the periodthat agricultural value-added per capita grew at 11.5%, poverty was 54.1%. In the period in whichgrowth of agricultural value added per capita was 0.4%, the poverty rate was 52.4%. Similarly,there is no clear link between growth in value added per capita and the malnutrition rates.
There are many factors that can be attributed to the disappointing performance of the agriculturalsector. First, productivity in major food and cash crops has been declining, coupled with landfragmentation. The poor productivity is also associated with poor fertilizer uptake and low adoptionof improved farming techniques. Second, due to the rain-fed nature of cultivation, the exogenousweather shocks have led to poor production, resulting in surges in imports of maize. In years ofbad weather, growth rates in agriculture value added per capita and growth in maize productionhave been low or negative. Third, there have been market failures and agricultural markets remainthin. With structural adjustment programs, the state withdrew from agricultural services which haveled to coordination failures. Value addition has been limited in the agricultural sector, particularlyamong smallholder farmers. Fourth, the policy environment has not provided the necessary incentives.It has been characterized by policy reversals, policy uncertainties and policy incoherencies. Finally,government support towards the agricultural sector has been declining and below the level that isexpected to lead to substantial agricultural development. For instance, the share of the agriculturalsector in the fiscal budget has been below the 10% target set by the AU/NEPAD since 1996 exceptin the 2006/2007 budget when it rose to 12%. The decline in funding to the agricultural sector haseroded vital services including research and development, extension services and other coordinatingservices by the state. The introduction of the agricultural input subsidy programme since the 2005/

28
2006 season has led to greater allocation of government resources to the agricultural sector. In theshort and medium term, Malawi will be on course in achieving the AU target of at least 10% of thebudget resources going to the agricultural sector.
The analysis of past and current trends in agricultural performance in Malawi shows that the policyregime that was characterized by heavy state interventions in the 1970s was more conducive toagricultural development. This suggests that the market oriented approach in the agricultural systems,in which agricultural production largely remains subsistent, may not be appropriate for Malawi.The drastic changes from interventionist policies to the market mechanism that involved withdrawalof vital state services in the agricultural sector have not yielded positive results. As Poulton et al.(2006) conclude there is need for proactive state intervention that goes beyond provision of publicgoods in order to ‘kick start’ agricultural markets that are pro-poor in sub-Saharan Africa. Theanalysis of agricultural performance in Malawi leads to the following recommendations:
• There is a need for state intervention in the agricultural sector in order to change thesubsistent nature of production to commercial production. This will require a long periodof stable low prices for maize, the main staple crop; hence, lower maize price/cash cropprice ratios. The stability in maize prices will encourage subsistence farmers to switch tocash crops. The current agricultural input subsidy, if continued in the medium term, willlead to an excess supply of maize and lower prices, providing incentives for smallholderfarmers to switch from subsistence farming to commercial farming.
• There is a need for revitalization of extension services to go hand in hand with theagricultural input subsidy programme. This will require renewed investments in training ofextension officers and their deployment in the rural areas.
• There is also a need for market support towards the smallholder sector, particularly in remoterural areas in which the private marketing system is not fully developed particularly due topoor infrastructure. This requires withdrawal of state marketing activities in more accessibleareas and maintaining state marketing activities in remote areas.
• There is a need for continued investments in irrigation technologies or irrigation farmingthrough utilization of available water resources or investing in rainwater harvestingstructures.

29
REFERENCES
Abbott, R. D.; Poulin, R. J. 1996. The Future of ADMARC: A Policy Analysis, Agricultural Policy Analysis Project(APAP) Research Report No. 1012 (USAID).
ADE (Aide a la Decision Economique). 2000. Malawi: Inception Technical Assistance to the National Food ReserveAgency. Report submitted to the National Food Reserve Agency, Lilongwe.
Alwang, J.; Siegel, P. B. 1999. Labour Shortages on Small Land Holdings in Malawi: Implications for Policy Reforms.World Development 27: 1461-1475.
AU (African Union) and NEPAD (New Partnership for Africa’s Development). 2003. Comprehensive Africa AgricultureDevelopment Programme, Pretoria: NEPAD.
Baulch, B. 2001. Food Marketing. In: Devereux, S.; Maxwell, S. (eds.), Food Security in Sub-Saharan Africa. Londonand Pietermaritzburg: ITDG Publishing and University of Natal Press.
Bigsten, A.; Shimeles, A. 2003. Prospects for ‘Pro-poor’ Growth in Africa. Paper presented at the WIDER Conferenceon “Inequality, Poverty and Human Well-Being”, Helsinki, Finland, May 30-31, 2003.
Chinsinga, B. 2005. Practical and Policy Dilemmas of Targeting Free Inputs, in Levy, S. (ed.) Starter Packs: A Strategyto Fight Hunger in Developing Countries? Oxfordshire: CABI Publishing.
Chirwa, E. W. 1998. Fostering Private Food Marketing and Food Policies after Liberalisation – The Case of Malawi,in Seppala, P. (ed.) Liberalized and Neglected? Food Marketing Policies in Eastern Africa, Helsinki: UnitedNations University/WIDER.
Chirwa, E. W. 2002. Sources of Technical Efficiency among Smallholder Maize Farmers in Southern Malawi. Workin Progress Report presented at the Biannual Research Workshop organized by the African Economic ResearchConsortium, Durban, South Africa, December.
Chirwa, E. W. 2005. Adoption of Fertilizer and Hybrid Seeds by Smallholder Maize Farmers in Southern Malawi.Development Southern Africa 22(1): 1-12.
Chirwa, E. W.; Ngalawa, H. 2006. The Extent and Impact of Import Surges in Malawi: The Case of Maize, Sugar andMilk. Paper prepared for Food and Agricultural Organisation, Rome.
Chirwa, E. W.; Zakeyo, C. 2003. Impact of Economic and Trade Policy Reforms on Food Security in Malawi. Reportsubmitted to the Food and Agriculture Organization of the United Nations (FAO) and the African EconomicResearch Consortium (AERC).
Chirwa, E. W.; Zakeyo, C. 2006. Malawi. In: Thomas, H. (ed.), Trade Reforms and Food Security: Country CaseStudies and Synthesis. Rome: Food and Agriculture Organization of the United Nations.
Dorward, A. 1999. Farm Size and Productivity in Malawian Smallholder Agriculture. Journal of Development Studies35(5): 141-161.
Dorward, A.; Kydd, J. 2004. The Malawi 2002 Food Crisis: the Rural Development Challenge. Journal of ModernAfrican Studies 42(3): 343-361.
Dorward, A.; Kydd, J.; Morrison, J.; Urey, I. 2004. A Policy Agenda for Pro-Poor Agricultural Growth. WorldDevelopment 32(1): 73-89.
Dorward, A.; Kydd, J.; Poulton, C. 2005. Beyond Liberalisation “Developmental Coordination” Policies for AfricanSmallholder Agriculture. IDS Bulletin 36(2): 80-85.
Eicher, C. 2003. Fifty Years of Donor Aid to African Agriculture. Paper presented at the InWEnt, IFPRI, NEPAD,CTA Conference on Successes in African Agriculture, Pretoria, December 1-3.
Fafchamps, M.; Gabre-Madhin, E. 2001. Agricultural Markets in Benin and Malawi: Operation and Performance ofTraders. World Bank Working Paper Series No. 2734 (Washington, DC).
Fairhead, J.; Leach, M. 2005. The Centrality of the Social in African Farming. IDS Bulletin 36(2): 86-90.
FSG (Food Studies Group). 1991. The Impact of Pricing and Marketing Policies on the Development of Private SectorTrading. A Report on the Study of the Impact of the Liberalization of Smallholder Agricultural Produce Trade inMalawi, International Development Centre, University of Oxford.
GOM (Government of Malawi). 1971. Statement of Development Policies, 1971-1979. Zomba: Government Printer.
GOM. 1987. Statement of Development Policies, 1987-1996. Zomba: Government Printer.

30
GOM. 2001. State of Environment Report for Malawi 2001. Lilongwe: Ministry of Natural Resources andEnvironmental Affairs.
GOM. 2002. Qualitative Impact Monitoring (QIM) of Poverty Alleviation Policies and Programmes: Survey Findings.Lilongwe: National Economic Council.
GOM. 2006. 2006/07 Budget Statement, Lilongwe: Ministry of Finance.
GOM, NSO (National Statistical Office) and World Bank. 2005. Poverty in Malawi from the Second IntegratedHousehold Survey 2005: An Extract of Findings. Lilongwe: Ministry of Economic Planning and Development.
GOM and World Bank. 2006. Malawi Poverty and Vulnerability Assessment: Investing in Our Future. Lilongwe:Ministry of Economic Planning and Development.
Green, D. A. G.; Ng’ong’ola, D. H. 1993. Factors Affecting Fertilizer Adoption in Less Developed Countries:An Application of Multivariate Logistic Analysis in Malawi. Journal of Agricultural Economics 44(1): 99-109.
Harrigan, J. 1988. Malawi: the Impact of Pricing Policy on Smallholder Agriculture, 1971-1988. Development PolicyReview 6: 415-433.
Harrigan, J. 1991. Malawi. In: Mosley, P.; Harrigan, J.; Toye, J. (eds), Aid and Power: The World Bank and Policy-based Lending, Case Studies Volume 2. London: Routledge.
Harrigan, J. 2003. U-Turn and Full Circles: Two Decades of Agricultural Reform in Malawi 1981-2000. WorldDevelopment 31(5): 847-863.
Hoekman, B.; Michalopoulos, C.; Schiff, M.; Tarr, D. 2001. Trade Policy and Poverty Alleviation. World Bank WorkingPaper No. 2733. Washington DC: World Bank.
ICL (Imperial College London), Wadonda Consult, Michigan State University and Overseas Development Institute.2007. Evaluation of the 2006/07 Agricultural Input Supply Programme, Malawi. Report prepared for theDepartment for International Development and Ministry of Agriculture and Food Security.
Jayne, T. S.; Govereh, T.; Mwanaumo, A.; Nyoro, J. K.; Chapoto, A. 2002. False Promise or False Premise? TheExperience of Food and Input Market Reforms in Eastern and Southern Africa. World Development 30(11):1967–1985.
Jayne, T. S.; Mather, D.; Mghenyi, E.; Zulu, B.; Chirwa, E.; Tschirley, D. 2006. Maize Marketing and Trade Policy in aPro-Poor Agricultural Growth Strategy: Insights from Household Surveys in Eastern and Southern Africa, InternationalDevelopment Working Paper (draft),.Department of Agricultural Economics, Michigan State University.
Kaluwa, B. M. 1992. ‘Malawi Food Marketing: Private Trader Operation and State Intervention’, in Wyckoff, J. B.;Rukuni, M. (eds.) Food Security Research in Southern Africa: Policy Implications. Proceedings of the SixthAnnual Conference on Food Security Research in Southern Africa. University of Zimbabwe/Michigan StateUniversity Food Security Research Project.
Kaluwa, B. M.; Silumbu, E.; Ngalande Banda, E.; Chilowa, W. 1992. The Structural Adjustment Programme in Malawi:A Case for Successful Adjustment? Monograph Series No. 3. Harare: SAPES Books.
Karugia, J. T.; Wambugu, S. K.; Oluach-Kosura, W. 2004. The Role of Infrastructure and Government Policies inDetermining the Efficiency of Kenya’s Maize Marketing System in the Post-Liberalisation Era. IFPRI EasternAfrica Food Policy Network. Network Paper 6. Kampala: International Food Policy Research Institute (IFPRI).
Khaila, S.; Mvula, P.; Kadzandira, J. 1999. ‘Consultations with the Poor – Country Report for Malawi’. A qualitativestudy done on behalf of the World Bank, Poverty Reduction Group, Washington DC.
Kydd, J.; Christiansen, R. 1982. Structural Change in Malawi since Independence: Consequences of a DevelopmentStrategy Based on Large-Scale Agriculture. World Development 10: 355-375.
Lele, U. 1989. Sources of Growth in East African Agriculture. World Bank Economic Review 3: 119-144.
Mellor, J. W. 1966. The Economics of Agricultural Development. Ithaca and London: Cornell University Press.
Mkwezalamba, M. 1989. The Impact of Liberalisation of Smallholder Agricultural Produce Pricing and Marketing inMalawi. Report submitted to Ministry of Agriculture, Lilongwe.
Msukwa, L. A. H. 1994. Food Policy and Production: Towards Increased Household Food Security. Zomba: Centrefor Social Research.
Mthindi, G. B.; Chilowa, W. R.; Milner, J. A. G.; Ntata, P. 1999. Social Policy in the Context of Economic Reforms inMalawi: The Survival and Adaptive Strategy of Vulnerable Groups, First, Second and Third Monitoring SurveyReports. Southern African Regional Institute for Policy Studies.

31
MTPSD (Ministry of Trade and Private Sector Development). 2004. Malawi Integrated Framework: Diagnostic TradeIntegration Study. Lilongwe: Ministry of Commerce and Industry.
Mvula, P. M.; Chirwa, E. W.; Kadzandira, J. 2003. Poverty and Social Impact Assessment in Malawi: Closure ofADMARC Markets. Report submitted to World Bank and Deutsche Gesellschaft für Technische Zusammenarbeit(GTZ) GmbH (GTZ).
NEC (National Economic Council). 2000. Malawi Vision 2020. Lilongwe: National Economic Council.
NEC. 2002. Economic Report 2002. Zomba: Government Printer.
NSO (National Statistical Office). 2000. Starter Park 1999/00 Agro-Economic Survey. Zomba: National Statistical Office.
NSO. 2002. Malawi: Statistical Yearbook. Zomba: National Statistical Office.
NSO. 2005. Integrated Household Survey 2004–2005. Zomba: National Statistical Office.
NSO. 2006. Statistical Yearbook 2006. Zomba: National Statistical Office.
NSO and ORC Macro. 1994. Malawi: Demographic and Health Survey 1992. Zomba, Malawi and Calverton, Maryland,USA: National Statistical Office and ORC Macro.
NSO and ORC Macro. 2001. Malawi: Demographic and Health Survey 2000. Zomba, Malawi and Calverton, Maryland,USA: National Statistical Office and ORC Macro.
Nthara, K. 2002. What Needs to be Done to Improve the Impact of ADMARC on the Poor, Phase II Final Reportprepared for the Joint Oxfam Programme in Malawi, Blantyre.
Poulton, C.; Kydd, J.; Doward, A. 2006. Overcoming Market Constraints on Pro-Poor Agricultural Growth in Sub-Saharan Africa. Development Policy Review 24(3): 243-277.
World Bank. 2001. World Development Report 2000/2001: Attacking Poverty. New York: Oxford University Press.
World Bank. 2003. Malawi Country Economic Memorandum: Policies for Accelerating Growth. Washington:World Bank.
Zeller, M.; Diagne, A.; Mataya, C. 1998. Market Access by Smallholder Farmers in Malawi: Implications forTechnology Adoption, Agricultural Productivity and Crop Income. Agricultural Economics 19: 219-229.

The Regional Strategic Analysis and Knowledge Support System (ReSAKSS) is an Africa-wide network that provides analysis, data, and tools to promote evidence-based decision making, improve awareness of the role of agriculture for development in Africa, fill knowledge gaps, promote dialogue and facilitate the benchmarking and review processes associated with the AU/NEPAD’s Comprehensive Africa Agriculture Development Programme (CAADP) and other regional agricultural development initiatives in Africa.
For more information, contact
Subregional CoordinatorRegional Strategic Analysis and Knowledge Support System in Southern Africa (ReSAKSS-SA)
Private Bag X813Silverton 0127
Pretoria, South AfricaTelephone: +27 (0)12 845 9100Facsimile: +27 (0)12 845 9110
E-mail: [email protected]: www.sa.resakss.org
WWW.RESAKSS.ORG


![Malawi - Poverty Reduction Support Grant I (PRSG I ... · IMF International Monetary Fund ICP Investment Climate Profile JF Joint Framework MCB Malawi Congress Party ... [2006/07-2010/11]](https://img.dokumen.tips/doc/110x75/5fc29eca313ae7152f78c681/malawi-poverty-reduction-support-grant-i-prsg-i-imf-international-monetary.jpg)