Embed Size (px)
Citation preview

November 8, 2018 Toshiba Corporation
FOR IMMEDIATE RELEASE
Toshiba Announces Consolidated Results for the First Six Months and the Second Quarter for Fiscal Year 2018, Ending March 2019
TOKYO--Toshiba Corporation (TOKYO: 6502) (the “Company”) today announced its consolidated results for the first six months (April-September) and the second quarter (July-September) of fiscal year (FY) 2018, ending March 31, 2019. All comparisons in the following schedules are based on the same period a year earlier, unless otherwise stated.
1. Overview of Consolidated Results for the First Six Months of FY2018(April-September 2018)
(Yen in billions) First six months of
FY2018 Change from first six months of FY2017
Net sales 1,778.0 (95.8) Operating income (loss) 7.0 (29.2) Income (loss) from continuing operations, before income taxes and noncontrolling interests
70.6 (3.0)
Net income (loss) attributable to shareholders of the Company
1,082.1 1,131.9
During the fiscal half year, growth was solid in the US economy and moderate in the Eurozone economy. Growth slowed in the UK on concerns about the impact of Brexit. The Chinese economy continued to decelerate slightly, due to reduced domestic demand and investments in fixed assets, and as the influence of US tariff rises started to become apparent. Oil prices rose on reductions in supply, in part due to reductions from some oil producing countries and from US sanctions against Iran. In Japan, the overall economy moved towards a slower recovery, consumer spending patterns improved, and capital investment has trended up.
In these global conditions, Toshiba Group’s net sales decreased by 95.8 billion yen to 1,778.0 billion yen (US$15,596.1 million). Although Infrastructure Systems & Solutions and Storage & Devices Solutions recorded higher sales, Energy Systems & Solutions saw lower sales, primarily due to the deconsolidation of Landis+Gyr and lower sales in Thermal & Hydro Power Systems and Industrial ICT Solutions. Operating income was 7.0 billion yen (US$61.2 million), a decrease of 29.2 billion yen, 14.3 billion of which is attributable

2
to the scaling back of emergency measures that were in place in FY 2017, including bonus reductions. While Industrial ICT Solutions reported flat operating income, Energy Systems & Solutions, Infrastructure Systems & Solutions, Storage & Electronic Devices Solutions and Retail & Printing Solutions all saw decreases. Income (loss) from continuing operations, before income taxes and noncontrolling interests, decreased by 3.0 billion yen to 70.6 billion yen (US$618.9 million), due to lower operating income. The decrease in operating income was partially offset by equity in earnings of an affiliate, Toshiba Memory Corporation (TMC), and a gain on the sale of Toshiba General Hospital. Net income (loss) attributable to shareholders of the Company was 1,082.1 billion yen (US$9,492.4 million), an increase of 1,131.9 billion yen inclusive of profit from the sale of the Memory business. Consolidated Results for the First Six Months of FY2018, by Segment (April-September 2018) (Yen in billions)
Net Sales Operating Income
(Loss) Change* Change* Energy Systems & Solutions 303.1 (127.3) (30%) (3.9) (3.1) Infrastructure Systems & Solutions 568.0 15.9 3% 1.5 (1.2) Retail & Printing Solutions 241.0 (6.8) (3%) 8.0 (3.3) Storage & Electronic Devices Solutions
456.8 24.2 6% 10.6 (22.3)
Industrial ICT Solutions 117.6 (1.1) (1%) (1.3) 0.6 Others 248.5 5.2 2% (10.9) (2.5) Eliminations (157.0) (5.9) - 3.0 2.6 Total 1,778.0 (95.8) (5%) 7.0 (29.2)
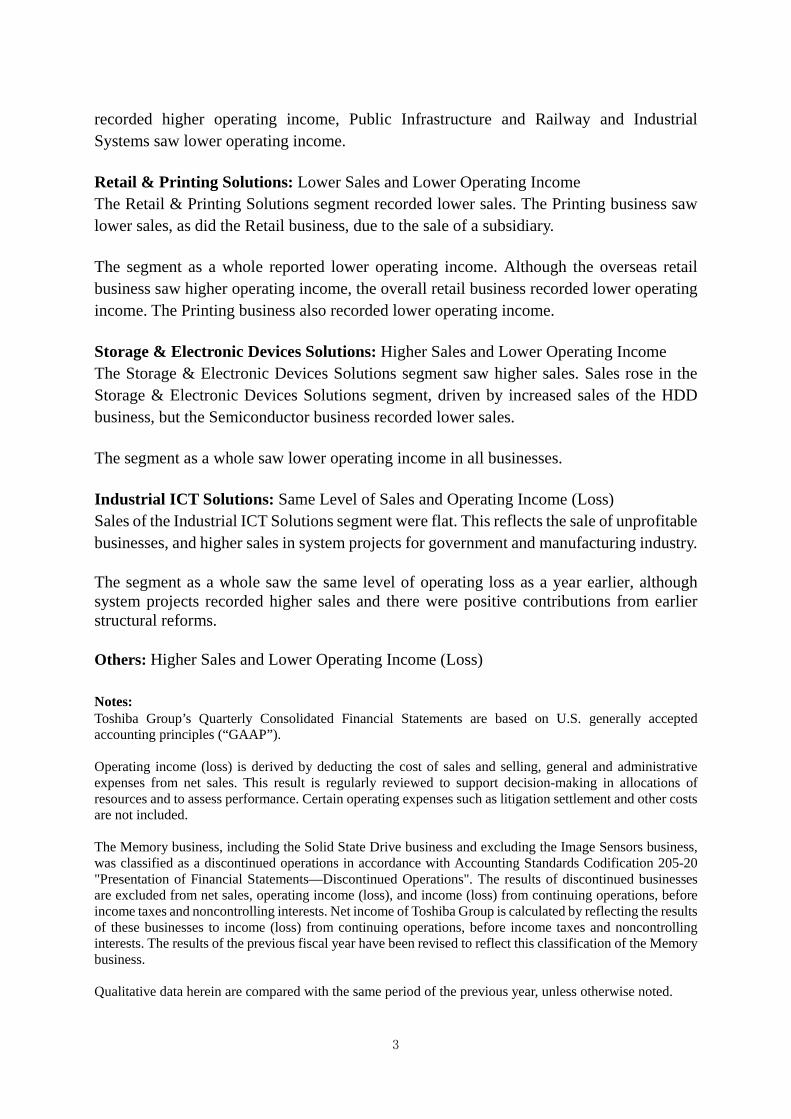
(* Change from the year-earlier period) Energy Systems & Solutions: Lower Sales and Greater Operating Loss The Energy Systems & Solutions segment saw lower sales, as Landis+Gyr was deconsolidated and the Nuclear Power Systems, Thermal & Hydro Power Systems and Transmission & Distribution Systems businesses all reported lower sales. The segment as a whole saw greater operating loss. Although operating income was higher in Nuclear Power Systems, Landis+Gyr was deconsolidated and Thermal & Hydro Power Systems and Transmission & Distribution Systems saw larger operating losses. Infrastructure Systems & Solutions: Higher Sales and Lower Operating Income The Infrastructure Systems & Solutions segment reported higher sales. Public Infrastructure and Railway and Industrial Systems recorded higher sales. The segment as a whole saw lower operating income. Although Building and Facilities
3
recorded higher operating income, Public Infrastructure and Railway and Industrial Systems saw lower operating income. Retail & Printing Solutions: Lower Sales and Lower Operating Income The Retail & Printing Solutions segment recorded lower sales. The Printing business saw lower sales, as did the Retail business, due to the sale of a subsidiary. The segment as a whole reported lower operating income. Although the overseas retail business saw higher operating income, the overall retail business recorded lower operating income. The Printing business also recorded lower operating income. Storage & Electronic Devices Solutions: Higher Sales and Lower Operating Income The Storage & Electronic Devices Solutions segment saw higher sales. Sales rose in the Storage & Electronic Devices Solutions segment, driven by increased sales of the HDD business, but the Semiconductor business recorded lower sales. The segment as a whole saw lower operating income in all businesses. Industrial ICT Solutions: Same Level of Sales and Operating Income (Loss) Sales of the Industrial ICT Solutions segment were flat. This reflects the sale of unprofitable businesses, and higher sales in system projects for government and manufacturing industry. The segment as a whole saw the same level of operating loss as a year earlier, although system projects recorded higher sales and there were positive contributions from earlier structural reforms. Others: Higher Sales and Lower Operating Income (Loss) Notes: Toshiba Group’s Quarterly Consolidated Financial Statements are based on U.S. generally accepted accounting principles (“GAAP”). Operating income (loss) is derived by deducting the cost of sales and selling, general and administrative expenses from net sales. This result is regularly reviewed to support decision-making in allocations of resources and to assess performance. Certain operating expenses such as litigation settlement and other costs are not included. The Memory business, including the Solid State Drive business and excluding the Image Sensors business, was classified as a discontinued operations in accordance with Accounting Standards Codification 205-20 "Presentation of Financial Statements—Discontinued Operations". The results of discontinued businesses are excluded from net sales, operating income (loss), and income (loss) from continuing operations, before income taxes and noncontrolling interests. Net income of Toshiba Group is calculated by reflecting the results of these businesses to income (loss) from continuing operations, before income taxes and noncontrolling interests. The results of the previous fiscal year have been revised to reflect this classification of the Memory business. Qualitative data herein are compared with the same period of the previous year, unless otherwise noted.
4
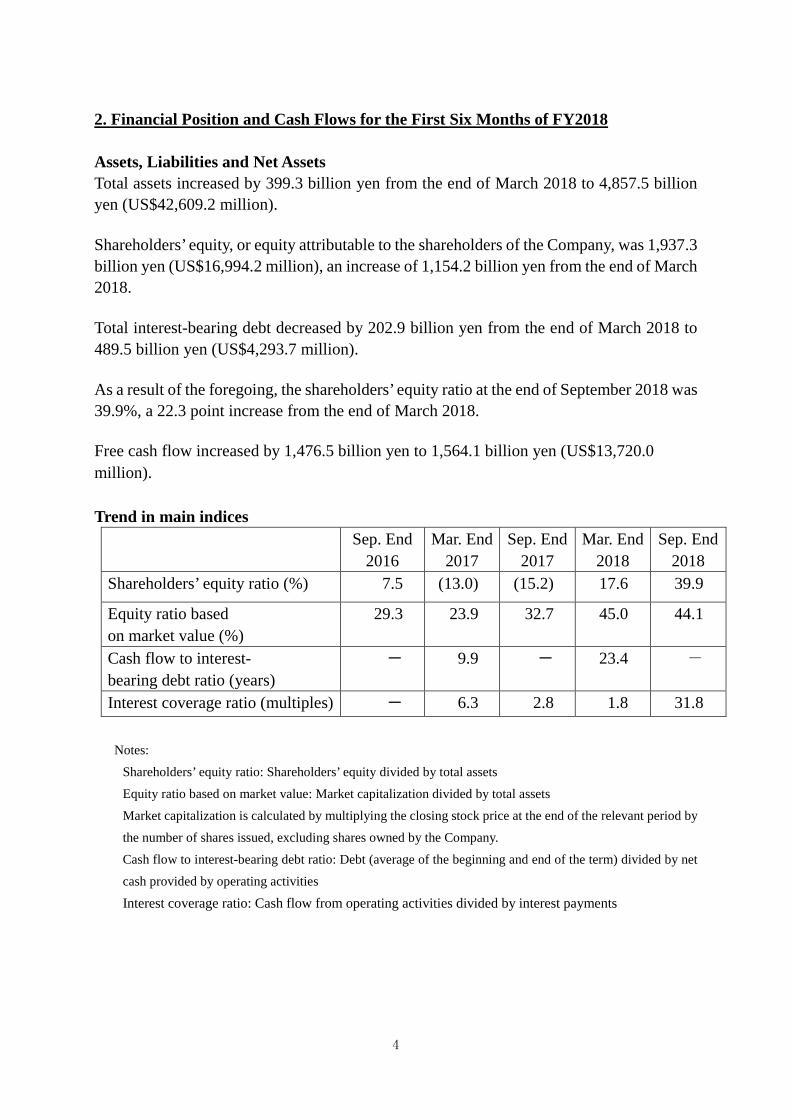
2. Financial Position and Cash Flows for the First Six Months of FY2018 Assets, Liabilities and Net Assets Total assets increased by 399.3 billion yen from the end of March 2018 to 4,857.5 billion yen (US$42,609.2 million). Shareholders’ equity, or equity attributable to the shareholders of the Company, was 1,937.3
billion yen (US$16,994.2 million), an increase of 1,154.2 billion yen from the end of March 2018. Total interest-bearing debt decreased by 202.9 billion yen from the end of March 2018 to 489.5 billion yen (US$4,293.7 million). As a result of the foregoing, the shareholders’ equity ratio at the end of September 2018 was 39.9%, a 22.3 point increase from the end of March 2018. Free cash flow increased by 1,476.5 billion yen to 1,564.1 billion yen (US$13,720.0 million). Trend in main indices
Sep. End 2016
Mar. End 2017
Sep. End 2017
Mar. End 2018
Sep. End 2018
Shareholders’ equity ratio (%) 7.5 (13.0) (15.2) 17.6 39.9
Equity ratio based on market value (%)
29.3 23.9 32.7 45.0 44.1
Cash flow to interest- bearing debt ratio (years)
- 9.9 - 23.4 -
Interest coverage ratio (multiples) - 6.3 2.8 1.8 31.8
Notes: Shareholders’ equity ratio: Shareholders’ equity divided by total assets Equity ratio based on market value: Market capitalization divided by total assets Market capitalization is calculated by multiplying the closing stock price at the end of the relevant period by the number of shares issued, excluding shares owned by the Company. Cash flow to interest-bearing debt ratio: Debt (average of the beginning and end of the term) divided by net cash provided by operating activities
Interest coverage ratio: Cash flow from operating activities divided by interest payments

5
Basic Policy on Profit Distribution and Dividends for Current and Subsequent periods (1) Basic Policy on Profit Distribution The Company, while giving full consideration to such factors as the strategic investments necessary to secure medium- to long-term growth, seeks to achieve continuous increases in its actual dividend payments, in line with a payout ratio in the region of 30%, on a consolidated basis. The Company's shareholder returns policy will continue to strengthen shareholder returns through share repurchases when its financial condition allows. (*)For the time being, equity earnings from Toshiba Memory shall not be subject to this policy. (2) Dividends for Current and Subsequent periods The Company decided not to pay a dividend to shareholders at the date of record of September 30, 2018. The Company confirmed that it had a sufficient distributable amount based on its non-consolidated balance sheet to implement shareholder returns after closing its accounts at the end of September, 2018 and accordingly prepared temporary financial statements. Based on the basic policy, and considering that it has not paid a dividend for a considerable time, the Company will pay a special dividend of 20 yen per share to shareholders recorded in the shareholder registry as of December 31, 2018, and will pay a year-end dividend of 10 yen per share to shareholders recorded in the shareholder registry as of March 31, 2019. The total full year dividend will be 30 yen per share. 3. Performance Forecast for FY2018 The Company announced today the following revision to its consolidated business forecast for FY2018. The revised forecast replaces the forecast announced on May 15, 2018, and reflect a loss of 93.0 billion yen related to withdrawal from the US liquefied natural gas sales business and a loss of 15.0 billion yen related to withdrawal from nuclear power plant construction in UK, and an increase in structural reform expenses. For more information, please refer to “Notice Regarding Revision of Toshiba Corporation’s Consolidated Business Results Forecast for FY2018 and the Differences between Toshiba Corporation’s Non-Consolidated Business Results Forecast for FY2018 and Actual Business Results” which was separately announced today.

6
(Yen in billions) (A)
Previous Forecast (B)
Revised Forecast (B-A) Change
(B)/(A) Net Sales 3,600.0 3,600.0 0.0 100.0%
Operating income 70.0 60.0 (10.0) 85.7%
Income from continuing operations, before income taxes
and noncontrolling interests
90.0 (40.0) (130.0) -
Net income attributable to shareholders of the Company
1,070.0 920.0 (150.0) 86.0%
Basic earnings per share attributable to shareholders of
the Company
¥1,642.00 ¥1,411.79 - -
4. Others (1) Changes in significant subsidiaries during the period (changes in Specified
Subsidiaries (“Tokutei Kogaisha”) involving changes in the scope of consolidation): In April 2018, the Company sold all the shares of Toshiba Nuclear Energy Holdings (US) Inc. (hereinafter TNEH (US)). As a result, TNEH (US) and its subsidiaries were deconsolidated from Toshiba Group.
In June 2017, the Company split off its Memory business, including the Solid State Drive business and excluding the Image Sensor business, into Toshiba Memory Corporation (TMC). Subsequently, in June 2018, the Company sold all the shares of TMC to K.K. Pangea (Pangea), a special purpose company formed and controlled by a consortium led by Bain Capital Private Equity. Along with the sale of TMC to Pangea, Toshiba Group reinvested in the common stock of Pangea, thereby retaining an equity interest in the Memory business. As a result of the sale, TMC was deconsolidated from Toshiba Group. As of August 2018, Pangea merged with TMC. And Pangea changed its name to “Toshiba Memory Corporation”. TMC is now treated as an affiliate accounted for by the equity method.
(2) Use of simplified accounting procedures, and particular accounting procedures in
preparation of quarterly consolidated financial statements: Income taxes Interim income tax expense (benefit) is computed by multiplying income (loss) before income taxes and noncontrolling interests for the six-months period ending September 30, 2018 by a reasonably estimated annual effective tax rate after applying the effect of deferred taxes for FY2018, ending March 31, 2019.

7
If a reliable estimate cannot be made as in the circumstances that the annual estimated ordinary pretax income(loss) approximates break-even or is forecasted negative, the Company utilizes the actual year-to-date effective tax rate.
(3) Change in accounting policies: In May 2014, Financial Accounting Standard Board (FASB) issued Accounting
Standard Update (ASU) No. 2014-09 “Revenue from Contracts with Customers.” ASU No. 2014-09 supersedes all previous revenue recognition requirements and affects any entity that either enters into contracts with customers for transfers of goods or services, or enters into contracts for transfers of nonfinancial assets, unless those contracts are within the scope of other standards. Under ASU No. 2014-09, an entity should apply the five-step approach to recognizing revenue. ASU No. 2014-09 also requires an entity to disclose its contracts with customers; the significant judgments, and changes in judgments, made in applying the new standard to those contracts; and the qualitative and quantitative information about assets recognized from the costs of obtaining or fulfilling a contract with a customer. The Company adopted ASU No. 2014-09 effective from the first quarter, beginning April 1, 2018, and applied the modified retrospective method to contracts that were not completed as of the date of adoption. As a result, the Company changed its revenue recognition for certain transactions from at the point of completion to a fixed term based on the transfer of control of goods or services. In addition, the Company modified the separation of performance obligations and the allocation of transaction prices for transactions whose revenue had been deferred due to the absence of vendor-specific objective evidence of the fair value of goods or services transferred for allocating transaction prices. While the adoption of ASU No. 2014-09 partially affected the Company’s revenue recognition, especially with regard to the transactions above, the Company assessed the impact on the consolidated financial statements as immaterial.
The Company adopted ASU No. 2016-01 “Financial Instruments Overall Recognition
and Measurement of Financial Assets and Financial Liabilities” effective from the first quarter, beginning April 1, 2018. ASU No. 2016-01 made revisions concerning the recognition, measurement, presentation and disclosure of financial instruments, and the amendments in this update require equity investments excluding investments in consolidated subsidiaries and affiliated companies to be measured at fair value, with changes in fair value recognized in net income (loss). As a result of adopting this standard, a cumulative-effect adjustment to retained earnings of 37,147 million yen was recognized as the after-tax unrealized gains of available-for-sale equity securities previously recognized in accumulated other comprehensive income at the beginning of the fiscal year.
The Company adopted ASU No. 2016-16 “Income Taxes Intra-Entity Transfers of
Assets Other Than Inventory” effective from the first quarter, beginning April 1, 2018.

8
This ASU requires recognition of the income tax consequences of an intra-entity transfer of assets other than inventory when the transfer occurs. Prior to the adoption of this ASU, US GAAP prohibited the recognition of income tax consequences for asset transfers, other than inventory, until the asset was sold to a third party. ASU No. 2016-16 requires an entity to recognize the cumulated adjustment amount to opening retained earnings at the beginning of the fiscal year on a modified retrospective basis, and the Company assessed the impact of the adoption on the consolidated financial statements as immaterial.
The Company adopted ASU No. 2016-18 “Statement of Cash Flows Restricted Cash
(a consensus of the FASB Emerging Issues Task Force)” effective from the first quarter, beginning April 1, 2018. This ASU requires an entity to report restricted cash and cash equivalents in cash and cash equivalents in the consolidated cash flow statement. As a result of adopting this standard, cash, cash equivalents and restricted cash amounts in the consolidated cash flow statements for the first six months of FY2017 and FY2018 have been disclosed in cash and cash equivalents including restricted cash balances. Additionally, 15,538 million yen of other cash flows from financing activities was reclassified to cash, cash equivalents and restricted cash in the consolidated cash flow statement in the first six months of FY2017.
The Company adopted ASU No. 2017-07 “Compensation Retirement Benefits
Improving the Presentation of Net Periodic Pension Cost and Net Periodic Postretirement Benefit Cost” effective from the first quarter, beginning April 1, 2018. This ASU requires an entity to separate the service component from other components of the net benefit cost, and to recognize it with other employee compensation costs in the income statement. Other components of the net benefit cost are recognized separately, such as in other income (expense). As a result of adopting this standard, 1,741 million yen from cost of sales and 2,177 million yen from selling, general and administrative cost were reclassified to other expenses in the cumulative second quarter of FY2017, and 893 million yen from cost of sales and 1,118 million yen from selling, general and administrative cost were reclassified to other expenses in the accounting second quarter of FY2017, and 1,329 million yen from cost of sales and 1,851 million yen from selling, general and administrative cost were reclassified to other expenses in the cumulative second quarter of FY2018, and 740 million yen from cost of sales and 1,031 million yen from selling, general and administrative cost were reclassified to other expenses in the accounting second quarter of FY2018.
The Company adopted ASU No. 2016-15 “Statement of Cash Flows Classification of Certain Cash Receipts and Cash Payments (a consensus of the FASB Emerging Issues Task Force)” effective from the first quarter, beginning April 1, 2018. This ASU adds or clarifies guidance on the classification of certain cash receipts and payments in the statement of cash flows. As a result of adopting this standard, there was no impact on

9
the consolidated statement of cash flows for the six-months ended September 30, 2017. Disclaimer: This report of business results contains forward-looking statements concerning future plans, strategies and forecasts of Toshiba Group business results. These statements are based on management’s assumptions and beliefs in light of the economic, financial and other data currently available. Since Toshiba Group is promoting business under various market environments in many countries and regions, they are subject to a number of their risks and uncertainties. Toshiba therefore wishes to caution readers that actual results might differ materially from our expectations. Major risk factors that may have a material influence on results are indicated below, although this list is not necessarily exhaustive. • Major disasters, including earthquakes and typhoons; • Disputes, including lawsuits, in Japan and other countries; • Success or failure of alliances or joint ventures promoted in collaboration with other
companies; • Success or failure of new businesses or R&D investment; • Changes in political and economic conditions in Japan and abroad; unexpected
regulatory changes; • Rapid changes in the supply and demand situation in major markets and intensified
price competition; • Significant capital expenditure for production facilities and rapid changes in the market; • Changes in financial markets, including fluctuations in interest rates and exchange rates.
Note: For convenience only, all dollar figures used in reporting the first six months of FY2018 are calculated at 114 yen to the dollar.
# # #

Consolidated
10
Toshiba Group
Consolidated Financial StatementsFor the First Six Months and the Second Quarter of Fiscal Year Ending March 2019
114
1. First Six Months Results 114(\ in billions, US$ in millions, except for earnings per share)
Six Months ended September 302018(A) 2017(B) (A)-(B) (A)/(B) 2018
Net sales ¥1,778.0 ¥1,873.8 ¥(95.8) 95% $15,596.1
Operating income 7.0 36.2 (29.2) 19% 61.2
Income from continuing operations, before income taxes and noncontrolling interests
70.6 73.6 (3.0) 96% 618.9
Net income (loss) attributable to shareholders of the Company 1,082.1 (49.8) 1,131.9 - 9,492.4
Basic earnings (losses) per share attributable to shareholders of the Company
¥1,660.61 ¥(117.60) ¥1,778.21 $14.57
2. Second Quarter Results(\ in billions, US$ in millions, except for earnings per share)
Three months ended September 302018(A) 2017(B) (A)-(B) (A)/(B) 2018
Net sales ¥935.7 ¥965.4 ¥(29.7) 97% $8,207.7
Operating income 6.3 22.9 (16.6) 27% 54.8
Income from continuing operations, before income taxes and noncontrolling interests
42.2 74.4 (32.2) 57% 369.7
Net income (loss) attributable to shareholders of the Company 65.4 (100.1) 165.5 - 573.8
Basic earnings (losses) per share attributable to shareholders of the Company
¥100.37 ¥(236.47) ¥336.84 $0.88
Notes: 1) Consolidated Financial Statements are based on generally accepted accounting principles in the U.S.2) The U.S. dollar is valued at ¥114 throughout this statement for convenience only.

Consolidated
11
Comparative Consolidated Balance Sheets
(\ in millions, US$ in thousands)
Sep. 30, 2018 Mar. 31, 2018(A) (B)
AssetsCurrent assets ¥3,557,482 ¥3,579,096 ¥(21,614) $31,205,982
Cash and cash equivalents 1,930,489 500,820 1,429,669 16,934,114
874,148 968,146 (93,998) 7,667,965
Inventories 507,529 469,767 37,762 4,452,009
Prepaid expenses and other current assets 245,316 343,882 (98,566) 2,151,894
- 1,296,481 (1,296,481) -
Long-term receivables 13,122 7,862 5,260 115,105
650,441 237,978 412,463 5,705,623
Property, plant and equipment 375,207 365,635 9,572 3,291,289
Other assets 261,199 267,640 (6,441) 2,291,220
Total assets ¥4,857,451 ¥4,458,211 ¥399,240 $42,609,219
Current liabilities ¥1,844,973 ¥2,430,940 ¥(585,967) $16,183,974
289,241 301,558 (12,317) 2,537,202
655,058 684,687 (29,629) 5,746,123
900,674 1,095,087 (194,413) 7,900,649
Liabilities of discontinued operations - current - 349,608 (349,608) -
Accrued pension and severance costs 429,847 443,092 (13,245) 3,770,588
Long-term debt and other liabilities 406,918 573,445 (166,527) 3,569,455
2,175,713 1,010,734 1,164,979 19,085,202
Equity attributable to shareholders of the Company 1,937,337 783,135 1,154,202 16,994,184
Common stock 200,044 499,999 (299,955) 1,754,772
Additional paid-in capital - 357,153 (357,153) -
Retained earnings 2,002,630 223,615 1,779,015 17,566,930
Accumulated other comprehensive loss (263,254) (295,572) 32,318 (2,309,246)
Treasury stock (2,083) (2,060) (23) (18,272)
Equity attributable to noncontrolling interests 238,376 227,599 10,777 2,091,018
¥4,857,451 ¥4,458,211 ¥399,240 $42,609,219
Breakdown of accumulated other comprehensive lossUnrealized gains on securities ¥(3) ¥37,147 ¥(37,150) $(26)Foreign currency translation adjustments (30,859) (82,514) 51,655 (270,694)Pension liability adjustments (231,274) (248,874) 17,600 (2,028,719)Unrealized losses on derivative instruments (1,118) (1,331) 213 (9,807)
Total interest-bearing debt ¥489,483 ¥692,418 ¥(202,935) $4,293,711
Notes and accounts payable, trade
Assets of discontinued operations - current
Other current liabilities
(A)-(B) Sep. 30, 2018
Total liabilities and equity
Equity
Short-term borrowings and current portion of long-term debt
Liabilities and equity
Investments
Notes and accounts receivable, trade

Consolidated
12
Comparative Consolidated Statements of Operations
1.First Six Months ended September 30 (\ in millions, US$ in thousands)
2018(A) 2017(B) (A)-(B) (A)/(B) 2018
Net sales ¥1,777,952 ¥1,873,754 ¥(95,802) 95% $15,596,070
Interest 3,138 3,433 (295) 91% 27,526
Dividends 991 673 318 147% 8,693
Equity in earnings of affiliates 50,323 4,428 45,895 - 441,430
Other income 45,816 90,469 (44,653) 51% 401,895
Cost of sales 1,351,367 1,395,324 (43,957) 97% 11,854,096
Selling, general and administrative 419,609 442,276 (22,667) 95% 3,680,781
Interest 6,515 13,344 (6,829) 49% 57,149
Other expense 30,171 48,172 (18,001) 63% 264,658
70,558 73,641 (3,083) 96% 618,930
20,337 22,755 (2,418) 89% 178,395
50,221 50,886 (665) 99% 440,535
1,044,352 (86,622) 1,130,974 - 9,160,983
1,094,573 (35,736) 1,130,309 - 9,601,518
12,437 14,049 (1,612) 89% 109,097
¥1,082,136 ¥(49,785) ¥1,131,921 - $9,492,421
Six months ended September 30
Sales and other income
Costs and expenses
Income from continuing operations, before income taxes and noncontrolling interests
Income taxes
Income from continuing operations, before noncontrolling interests
Income(loss) from discontinued operations, before noncontrolling interests
Net income(loss) before noncontrolling interests
Less:Net income attributable to noncontrolling interests
Net income(loss) attributable to shareholders of the Company

Consolidated
13
2.Second Quarter ended September 30 (\ in millions, US$ in thousands)
2018(A) 2017(B) (A)-(B) (A)/(B) 2018
Net sales ¥935,675 ¥965,350 ¥(29,675) 97% $8,207,675
Interest 1,518 1,226 292 124% 13,316
Dividends 13 41 (28) 32% 114
Equity in earnings of affiliates 36,672 3,024 33,648 - 321,684
Other income 17,043 85,779 (68,736) 20% 149,500
Cost of sales 712,191 723,766 (11,575) 98% 6,247,289
Selling, general and administrative 217,238 218,664 (1,426) 99% 1,905,597
Interest 2,359 7,618 (5,259) 31% 20,693
Other expense 16,982 31,013 (14,031) 55% 148,964
42,151 74,359 (32,208) 57% 369,746
7,195 22,977 (15,782) 31% 63,114
34,956 51,382 (16,426) 68% 306,632
36,607 (144,392) 180,999 - 321,114
71,563 (93,010) 164,573 - 627,746
6,155 7,101 (946) 87% 53,992
¥65,408 ¥(100,111) ¥165,519 - $573,754
Income(loss) from discontinued operations, before noncontrolling interests
Net income(loss) before noncontrolling interests
Less:Net income attributable to noncontrolling interests
Net income(loss) attributable to shareholders of the Company
Three months ended September 30
Sales and other income
Costs and expenses
Income from continuing operations, before income taxes and noncontrolling interests
Income taxes
Income from continuing operations, before noncontrolling interests
Consolidated
14
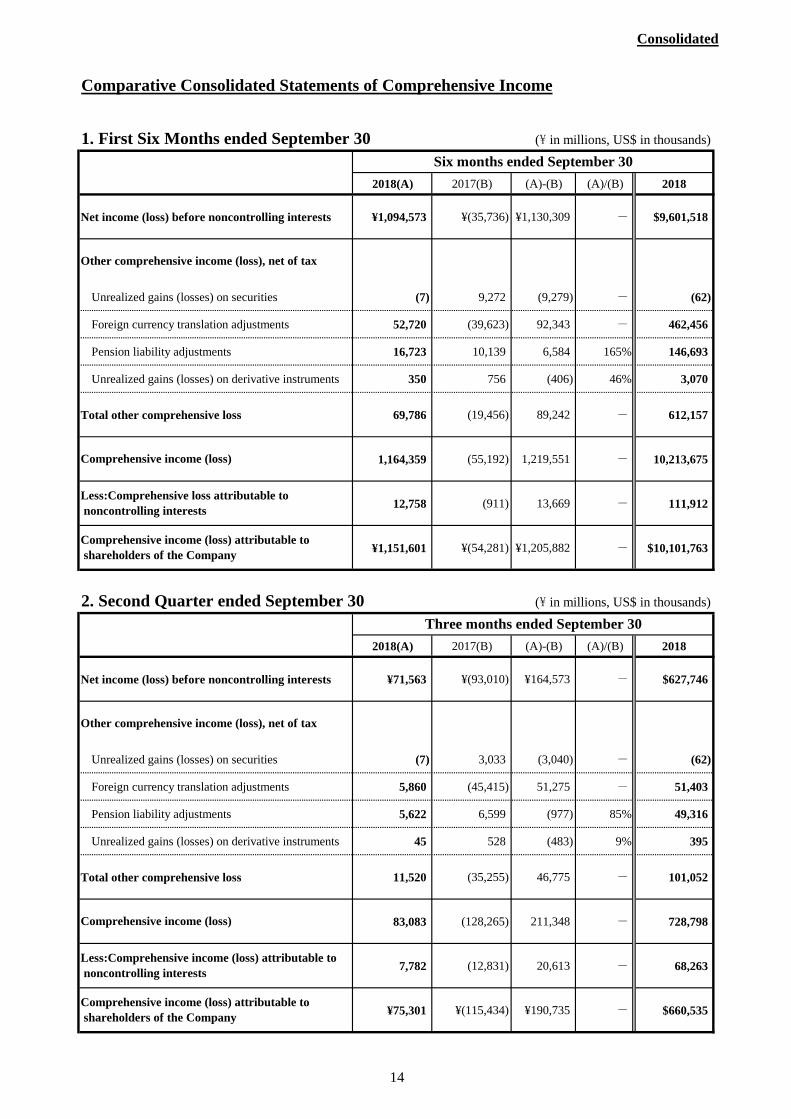
Comparative Consolidated Statements of Comprehensive Income
114
1. First Six Months ended September 30 (\ in millions, US$ in thousands)
2018(A) 2017(B) (A)-(B) (A)/(B) 2018
Net income (loss) before noncontrolling interests ¥1,094,573 ¥(35,736) ¥1,130,309 - $9,601,518
Unrealized gains (losses) on securities (7) 9,272 (9,279) - (62)
Foreign currency translation adjustments 52,720 (39,623) 92,343 - 462,456
Pension liability adjustments 16,723 10,139 6,584 165% 146,693
Unrealized gains (losses) on derivative instruments 350 756 (406) 46% 3,070
Total other comprehensive loss 69,786 (19,456) 89,242 - 612,157
1,164,359 (55,192) 1,219,551 - 10,213,675
12,758 (911) 13,669 - 111,912
¥1,151,601 ¥(54,281) ¥1,205,882 - $10,101,763
2. Second Quarter ended September 30 (\ in millions, US$ in thousands)
2018(A) 2017(B) (A)-(B) (A)/(B) 2018
Net income (loss) before noncontrolling interests ¥71,563 ¥(93,010) ¥164,573 - $627,746
Unrealized gains (losses) on securities (7) 3,033 (3,040) - (62)
Foreign currency translation adjustments 5,860 (45,415) 51,275 - 51,403
Pension liability adjustments 5,622 6,599 (977) 85% 49,316
Unrealized gains (losses) on derivative instruments 45 528 (483) 9% 395
Total other comprehensive loss 11,520 (35,255) 46,775 - 101,052
83,083 (128,265) 211,348 - 728,798
7,782 (12,831) 20,613 - 68,263
¥75,301 ¥(115,434) ¥190,735 - $660,535
Three months ended September 30
Other comprehensive income (loss), net of tax
Comprehensive income (loss)
Less:Comprehensive income (loss) attributable to noncontrolling interests
Comprehensive income (loss) attributable to shareholders of the Company
Six months ended September 30
Other comprehensive income (loss), net of tax
Comprehensive income (loss)
Less:Comprehensive loss attributable to noncontrolling interests
Comprehensive income (loss) attributable to shareholders of the Company

Consolidated
15
Comparative Consolidated Statements of Cash Flows
114First Six Months ended September 30 (\ in millions, US$ in thousands)
Cash flows from operating activities
¥1,094,573 ¥(35,736) ¥1,130,309 $9,601,518
Depreciation and amortization 37,938 66,936 (28,998) 332,789
Equity in earnings of affiliates, net of dividends (45,181) (2,459) (42,722) (396,325)
Gain from sales and impairment of securities, net (943,892) (66,950) (876,942) (8,279,754)
Decrease in notes and accounts receivable, trade 121,634 68,629 53,005 1,066,965
Increase in inventories (86,339) (60,910) (25,429) (757,360)
Decrease in notes and accounts payable, trade (38,856) (15,137) (23,719) (340,842)
Others 59,310 80,454 (21,144) 520,263
(895,386) 70,563 (965,949) (7,854,264)
199,187 34,827 164,360 1,747,254
Cash flows from investing activities
2,807 22,556 (19,749) 24,623
Acquisition of property, plant and equipment (82,496) (64,600) (17,896) (723,649)
Acquisition of intangible assets (8,200) (8,616) 416 (71,930)
Purchase of securities (826) (1,024) 198 (7,246)
Increase in investments in affiliates (31,257) (36,044) 4,787 (274,184)
Proceeds from sale of Toshiba Memory Corporation stock 1,458,289 - 1,458,289 12,792,009
Others 26,574 140,545 (113,971) 233,105
Net cash provided by investing activities 1,364,891 52,817 1,312,074 11,972,728
Cash flows from financing activities
Proceeds from long-term debt 2,000 2,048 (48) 17,544
Repayment of long-term debt (130,192) (71,880) (58,312) (1,142,035)
Decrease in short-term borrowings, net (72,474) (131,626) 59,152 (635,737)
Dividends paid (6,438) (5,955) (483) (56,474)
Others 18,619 (77,765) 96,384 163,325
Net cash used in financing activities (188,485) (285,178) 96,693 (1,653,377)
6,239 2,453 3,786 54,728
Net increase (decrease) in cash, cash equivalents and restricted cash 1,381,832 (195,081) 1,576,913 12,121,333
Cash, cash equivalents and restricted cash at beginning of the period 548,657 723,231 (174,574) 4,812,781
Cash, cash equivalents and restricted cash at end of the period 1,930,489 528,150 1,402,339 16,934,114
- 11,491 (11,491) -
Cash, cash equivalents and restricted cash of continuing operations at end of the period ¥1,930,489 ¥516,659 ¥1,413,830 $16,934,114
1,930,489 501,121 1,429,368 $16,934,114
- 15,538 (15,538) -
¥1,930,489 ¥516,659 ¥1,413,830 $16,934,114
Restricted cash included in other assets
Cash, cash equivalents and restricted cash of continuing operations at end of the period
Less: Cash, cash equivalents and restricted cash of discontinued operations at end of theperiod
Cash, cash equivalents and restricted cash of continuing operations at end of the period are included in the following accounts in the quarterlyconsolidated balance sheets.
Cash and cash equivalents
Net cash provided by operating activities
Effect of exchange rate changes on cash, cash equivalents and restricted cash
2018(A)
Six months ended September 3020182017(B) (A)-(B)
Adjustments to reconcile net income (loss) before noncontrolling interests to net cash provided by (used in) operating activities
Net income (loss) before noncontrolling interests
Proceeds from sale of property, plant and equipment, intangible assets and securities

Consolidated
16
Industry Segment Information114
1.First Six Months ended September 30 (\ in millions, US$ in thousands)
2018(A) 2017(B) (A)-(B) (A)/(B) 2018
¥303,105 ¥430,397 ¥(127,292) 70% $2,658,816 (16%) (21%) (-5%)
568,019 552,104 15,915 103% 4,982,623 (29%) (27%) (2%)
240,989 247,839 (6,850) 97% 2,113,939 (12%) (12%) (-)
456,779 432,566 24,213 106% 4,006,833 (24%) (21%) (3%)
117,626 118,718 (1,092) 99% 1,031,807 (6%) (6%) (-)
248,449 243,240 5,209 102% 2,179,377 (13%) (13%) (-)
1,934,967 2,024,864 (89,897) 96% 16,973,395 (100%) (100%)
Energy Systems & Solutions ¥(3,861) ¥(768) ¥(3,093) - $(33,868)
Infrastructure Systems & Solutions 1,451 2,733 (1,282) 53% 12,728
Retail & Printing Solutions 7,960 11,290 (3,330) 71% 69,825
Storage & Electronic DevicesSolutions 10,636 32,854 (22,218) 32% 93,298
Industrial ICT Solutions (1,310) (1,903) 593 - (11,491)
Others (10,871) (8,373) (2,498) - (95,360)
Total 4,005 35,833 (31,828) 11% 35,132
Eliminations 2,971 321 2,650 - 26,061
Consolidated ¥6,976 ¥36,154 ¥(29,178) 19% $61,193
Six months ended September 30
Net sales(Share of
total sales)
Energy Systems & Solutions
Infrastructure Systems & Solutions
Retail & Printing Solutions
Storage & Electronic DevicesSolutions
Industrial ICT Solutions
Others
Total
Eliminations
$15,596,070
(1,377,325)
Segmentoperatingincome(loss)
(157,015) (151,110) (5,905) -
Consolidated ¥1,777,952 ¥1,873,754 ¥(95,802) 95%

Consolidated
17
1142.Second Quarter ended September 30 (\ in millions, US$ in thousands)
2018(A) 2017(B) (A)-(B) (A)/(B) 2018
¥170,625 ¥212,980 ¥(42,355) 80% $1,496,711 (17%) (20%) (-3%)
297,836 294,578 3,258 101% 2,612,596 (29%) (28%) (1%)
124,016 129,953 (5,937) 95% 1,087,860 (12%) (12%) (-)
239,074 222,013 17,061 108% 2,097,140 (24%) (21%) (3%)
61,235 62,119 (884) 99% 537,149 (6%) (6%) (-)
123,073 122,537 536 100% 1,079,588 (12%) (13%) (-1%)
1,015,859 1,044,180 (28,321) 97% 8,911,044 (100%) (100%)
Energy Systems & Solutions ¥435 ¥(488) ¥923 - $3,816
Infrastructure Systems & Solutions 1,390 4,294 (2,904) 32% 12,193
Retail & Printing Solutions 3,425 7,473 (4,048) 46% 30,044
Storage & Electronic DevicesSolutions 6,474 14,377 (7,903) 45% 56,789
Industrial ICT Solutions 158 1,629 (1,471) 10% 1,386
Others (6,835) (4,377) (2,458) - (59,956)
Total 5,047 22,908 (17,861) 22% 44,272
Eliminations 1,199 12 1,187 - 10,517
Consolidated ¥6,246 ¥22,920 ¥(16,674) 27% $54,789
Notes:1) Segment sales total includes intersegment transactions.2) Segment operating income (loss) is derived by deducting the segment's cost of sales and selling, general and administrative expenses from net sales. This result is regularly reviewed to support decision-making in allocations of resources and to assess performance. Certain operating expenses such as legal settlement costs have been excluded from segment operating income (loss) presentation herein.3) Prior-period data relating to the discontinued operation has been deducted.4) Prior-period data relating to the consolidated segment information has been reclassified to conform with the current classification.
Three months ended September 30
Net sales(Share of
total sales)
Energy Systems & Solutions
Infrastructure Systems & Solutions
Retail & Printing Solutions
Storage & Electronic DevicesSolutions
Industrial ICT Solutions
Others
Total
Eliminations
$8,207,675
(703,369)
Segmentoperatingincome(loss)
(80,184) (78,830) (1,354) -
Consolidated ¥935,675 ¥965,350 ¥(29,675) 97%

Consolidated
18
Net Sales by Region
1.First Six months ended September 30 (\ in millions, US$ in thousands)
2018(A) 2017(B) (A)-(B) (A)/(B) 2018¥971,018 ¥982,307 ¥(11,289) 99% $8,517,702
(55%) (52%) (3%) 806,934 891,447 (84,513) 91% 7,078,368
(45%) (48%) (-3%) 480,778 455,860 24,918 105% 4,217,351
(27%) (24%) (3%) 160,241 209,531 (49,290) 76% 1,405,623
(9%) (11%) (-2%) 115,276 142,642 (27,366) 81% 1,011,193
(6%) (8%) (-2%) 50,639 83,414 (32,775) 61% 444,201
(3%) (5%) (-2%) ¥1,777,952 ¥1,873,754 ¥(95,802) 95% $15,596,070
(100%) (100%)
2.Second Quarter ended September 30 (\ in millions, US$ in thousands)
2018(A) 2017(B) (A)-(B) (A)/(B) 2018¥523,978 ¥537,603 ¥(13,625) 97% $4,596,298
(56%) (56%) (-) 411,697 427,747 (16,050) 96% 3,611,377
(44%) (44%) (-) 245,434 245,739 (305) 100% 2,152,930
(26%) (25%) (1%) 83,251 77,224 6,027 108% 730,272
(9%) (8%) (1%) 58,720 65,773 (7,053) 89% 515,088
(6%) (7%) (-1%) 24,292 39,011 (14,719) 62% 213,087
(3%) (4%) (-1%) ¥935,675 ¥965,350 ¥(29,675) 97% $8,207,675
(100%) (100%)
Notes: 1) Net sales by region is determined based upon the locations of the customers. 2) Prior-period data relating to the discontinued operation has been deducted.
Three months ended September 30
Japan
Overseas
Asia
Six months ended September 30
Japan
Overseas
Asia
North America
Europe
North America
Europe
Others
Net Sales
Others
Net Sales