Embed Size (px)
Citation preview
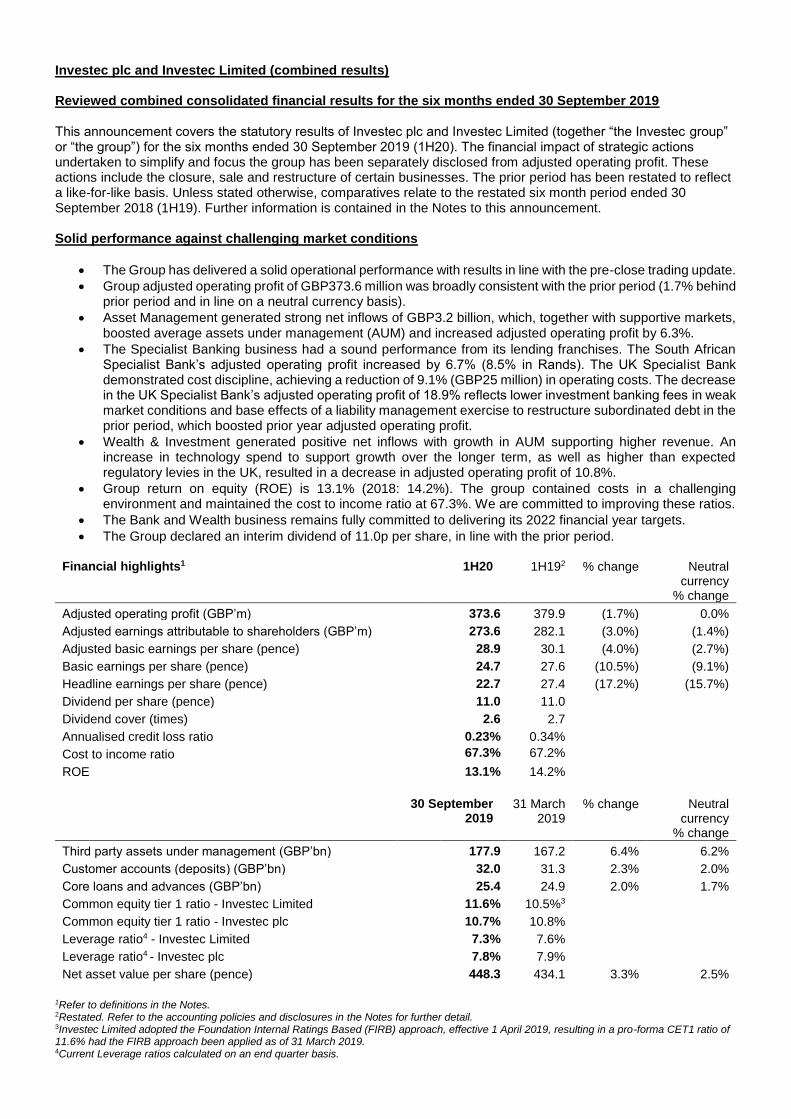
Investec plc and Investec Limited (combined results) Reviewed combined consolidated financial results for the six months ended 30 September 2019 This announcement covers the statutory results of Investec plc and Investec Limited (together “the Investec group” or “the group”) for the six months ended 30 September 2019 (1H20). The financial impact of strategic actions undertaken to simplify and focus the group has been separately disclosed from adjusted operating profit. These actions include the closure, sale and restructure of certain businesses. The prior period has been restated to reflect a like-for-like basis. Unless stated otherwise, comparatives relate to the restated six month period ended 30 September 2018 (1H19). Further information is contained in the Notes to this announcement. Solid performance against challenging market conditions
The Group has delivered a solid operational performance with results in line with the pre-close trading update.
Group adjusted operating profit of GBP373.6 million was broadly consistent with the prior period (1.7% behind prior period and in line on a neutral currency basis).
Asset Management generated strong net inflows of GBP3.2 billion, which, together with supportive markets, boosted average assets under management (AUM) and increased adjusted operating profit by 6.3%.
The Specialist Banking business had a sound performance from its lending franchises. The South African Specialist Bank’s adjusted operating profit increased by 6.7% (8.5% in Rands). The UK Specialist Bank demonstrated cost discipline, achieving a reduction of 9.1% (GBP25 million) in operating costs. The decrease in the UK Specialist Bank’s adjusted operating profit of 18.9% reflects lower investment banking fees in weak market conditions and base effects of a liability management exercise to restructure subordinated debt in the prior period, which boosted prior year adjusted operating profit.
Wealth & Investment generated positive net inflows with growth in AUM supporting higher revenue. An increase in technology spend to support growth over the longer term, as well as higher than expected regulatory levies in the UK, resulted in a decrease in adjusted operating profit of 10.8%.
Group return on equity (ROE) is 13.1% (2018: 14.2%). The group contained costs in a challenging environment and maintained the cost to income ratio at 67.3%. We are committed to improving these ratios.
The Bank and Wealth business remains fully committed to delivering its 2022 financial year targets.
The Group declared an interim dividend of 11.0p per share, in line with the prior period.
Financial highlights1 1H20 1H192 % change Neutral currency
% change
Adjusted operating profit (GBP’m) 373.6 379.9 (1.7%) 0.0%
Adjusted earnings attributable to shareholders (GBP’m) 273.6 282.1 (3.0%) (1.4%)
Adjusted basic earnings per share (pence) 28.9 30.1 (4.0%) (2.7%)
Basic earnings per share (pence) 24.7 27.6 (10.5%) (9.1%)
Headline earnings per share (pence) 22.7 27.4 (17.2%) (15.7%)
Dividend per share (pence) 11.0 11.0
Dividend cover (times) 2.6 2.7
Annualised credit loss ratio 0.23% 0.34%
Cost to income ratio 67.3% 67.2%
ROE 13.1% 14.2%
30 September 2019
31 March 2019
% change Neutral currency
% change
Third party assets under management (GBP’bn) 177.9 167.2 6.4% 6.2%
Customer accounts (deposits) (GBP’bn) 32.0 31.3 2.3% 2.0%
Core loans and advances (GBP’bn) 25.4 24.9 2.0% 1.7%
Common equity tier 1 ratio - Investec Limited 11.6% 10.5%3
Common equity tier 1 ratio - Investec plc 10.7% 10.8%
Leverage ratio4 - Investec Limited 7.3% 7.6%
Leverage ratio4 - Investec plc 7.8% 7.9%
Net asset value per share (pence) 448.3 434.1 3.3% 2.5%
1Refer to definitions in the Notes. 2Restated. Refer to the accounting policies and disclosures in the Notes for further detail. 3Investec Limited adopted the Foundation Internal Ratings Based (FIRB) approach, effective 1 April 2019, resulting in a pro-forma CET1 ratio of 11.6% had the FIRB approach been applied as of 31 March 2019. 4Current Leverage ratios calculated on an end quarter basis.
Strategic and operational highlights
We remain committed to our objective of simplifying and focusing the business in pursuit of growth over the long term.
The proposed demerger and separate listing of Investec Asset Management is on track, with key regulatory approvals received and publication of the related Shareholder Circular expected around the end of this month.
We are growing our client base across the businesses, evidenced by an increase in assets under
management, customer deposits and the loan book. We have continued to grow the client base in the
Private Banking business in both the UK and South Africa and have made good progress in implementing
our business banking offerings. Collaborative initiatives across the Bank and Wealth business, including our
digital private client investment management platform in South Africa and our newly launched intermediary
offerings in both geographies, should further extend the client base.
We have taken decisive action to further focus the Bank and Wealth business (closure of Click & Invest operations, closure and rundown of Hong Kong direct investments business, sale of Irish Wealth & Investment business, restructure of the Irish branch, sale of the UK Property Fund). This will continue where necessary.
The cost of these strategic actions, including the costs incurred in relation to the proposed demerger, of GBP45.3 million (2018: GBP20.7 million) have been disclosed separately from adjusted operating profit.
We remain focused on cost containment. The Bank and Wealth business has identified executable central Group cost savings of approximately GBP10 million and infrastructure rationalisation opportunities of approximately GBP7.5 million by the end of the 2021 financial year and will continue to review the cost base.
Strategies to reduce the equity investment portfolio over the medium term are progressing. We will aim for
optimal timing and intend to maximise value. Implementation of these strategies in South Africa is expected
to result in an approximate R2.5 billion reduction in required capital.
We have successfully converted to the Foundation Internal Ratings Based (FIRB) measurement of credit
capital in South Africa, resulting in a 1.1% uplift to the Investec Limited CET1 ratio, effective 1 April 2019.
Application has been made to adopt the Advanced Internal Ratings Based (AIRB) approach in South Africa,
with an estimated R3 billion to R4 billion reduction in required capital (circa 1% CET1 ratio uplift) expected
in the medium term.
Outlook In the second half we plan to conclude the demerger of the Asset Management business (subject to Investec shareholder and other customary approvals) and deliver the benefits of focus and simplicity. Despite the challenging economic environment, we remain committed to revenue growth, cost containment and improving long-term shareholder returns. Fani Titi and Hendrik du Toit, Joint Chief Executive Officers of Investec said: “The preparations for the demerger of Investec Asset Management (becoming Ninety One) are on schedule. In spite of the challenging economic environment in which we operate, we are pleased to report further growth in assets under management, customer deposits and the loan book. Profitable and sustainable growth with improved cost control remain priorities. We are committed to our stated objective to simplify, focus and grow for the long term, in the interest of all our stakeholders.” Enquiries Investec Investor Relations Results: Carly Newton: +44 (0) 20 7597 4493 General enquiries: +27 (0) 11 286 7070 or +44 (0) 20 7597 5546 Brunswick (SA PR advisers) Graeme Coetzee Tel: +27 11 502 7419 / +27 63 685 6053 (mobile) Lansons (UK PR advisers) Tom Baldock Tel: +44 (0) 20 7566 9716 / +44 (0) 78 6010 1715 (mobile)

Presentation/conference call details A presentation on the results will commence at 9:00 UK time/11:00 SA time on 21 November 2019. Viewing and telephone conference options as below:
A live and delayed video webcast at www.investec.com
Telephone conference: ‒ SA participants: 011 535 3600 ‒ UK participants: 0 333 300 1418 ‒ rest of Europe and other participants: +27 11 535 3500 ‒ Australian participants: 1 800 350 100 ‒ North American participants: 1 508 924 4326
About Investec Investec is an international specialist bank and asset manager that provides a diverse range of financial products and services to a select client base in three principal markets – the UK and Europe, South Africa and Asia/Australia as well as certain other countries. The group was established in 1974 and currently has approximately 10 500 employees. Investec focuses on delivering distinctive profitable solutions for its clients in three core areas of activity namely, Asset Management, Wealth & Investment and Specialist Banking.
Asset Management: A leading global asset manager with GBP121 billion in assets under management (as at 30
September 2019), well diversified by asset class and region.
Wealth & Investment Business: One of the leading UK and South African private client investment managers with
over GBP56 billion in assets under management as at 30 September 2019.
Specialist Banking Business: Market-leading specialist corporate and institutional banking, investment and private banking activities in South Africa and the UK with GBP25 billion in core loans and advances and GBP32 billion in customer deposits as at 30 September 2019.
In July 2002 the Investec group implemented a dual listed company structure with listings on the London and Johannesburg Stock Exchanges. In September 2018, the board of directors of the Investec group announced the proposed demerger and separate listing of the Investec Asset Management business which remains subject to Investec shareholder and other customary approvals. The combined group’s current market capitalisation is approximately GBP4.4 billion.
Investec plc and Investec Limited (combined results) Reviewed combined consolidated financial results for the six months ended 30 September 2019 Business unit review Asset Management
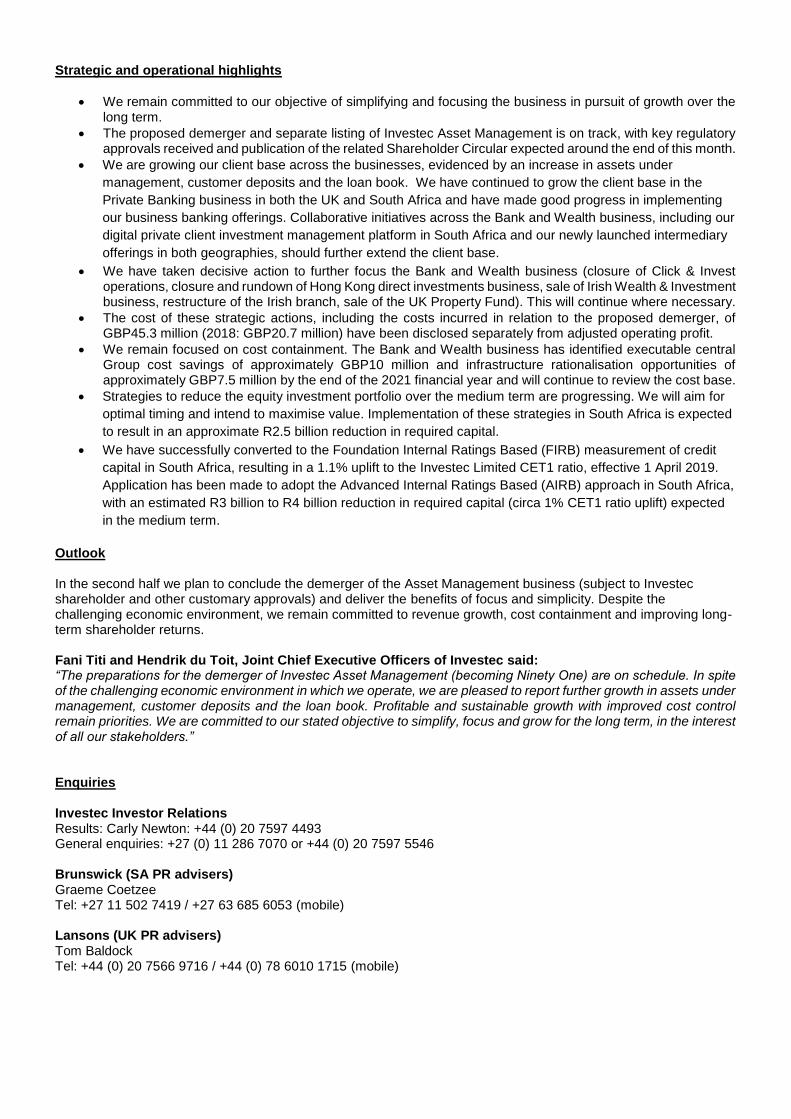
Asset Management Global
1H20 1H19 Variance
£'m £'m £'m %
Operating income 308.6 291.3 17.3 5.9%
Operating costs (211.3) (199.8) (11.5) 5.8%
Adjusted operating profit 97.3 91.5 5.8 6.3%
Totals and variance determined in £’000.
Asset Management adjusted operating profit increased by 6.3% to GBP97.3 million (2018: GBP91.5 million). Substantial net inflows of GBP3.2 billion, together with supportive markets, generated growth in total assets under management to GBP120.8 billion (31 March 2019: GBP111.4 billion). Flows were well spread across client regions and investment strategies. Net inflows and market and currency movements supported an increase in revenue. Operating costs increased above inflation primarily due to double rent costs relating to the move to the new London premises. This has resulted in the business maintaining its operating margin at 31.5% (2018: 31.4%). The business continues to generate competitive long-term investment performance. The business strategy is unchanged, with the focus being on scaling existing strategies, continuing to grow our Advisor and Institutional client base and continuing to invest in growth initiatives. Bank and Wealth – Specialist Banking
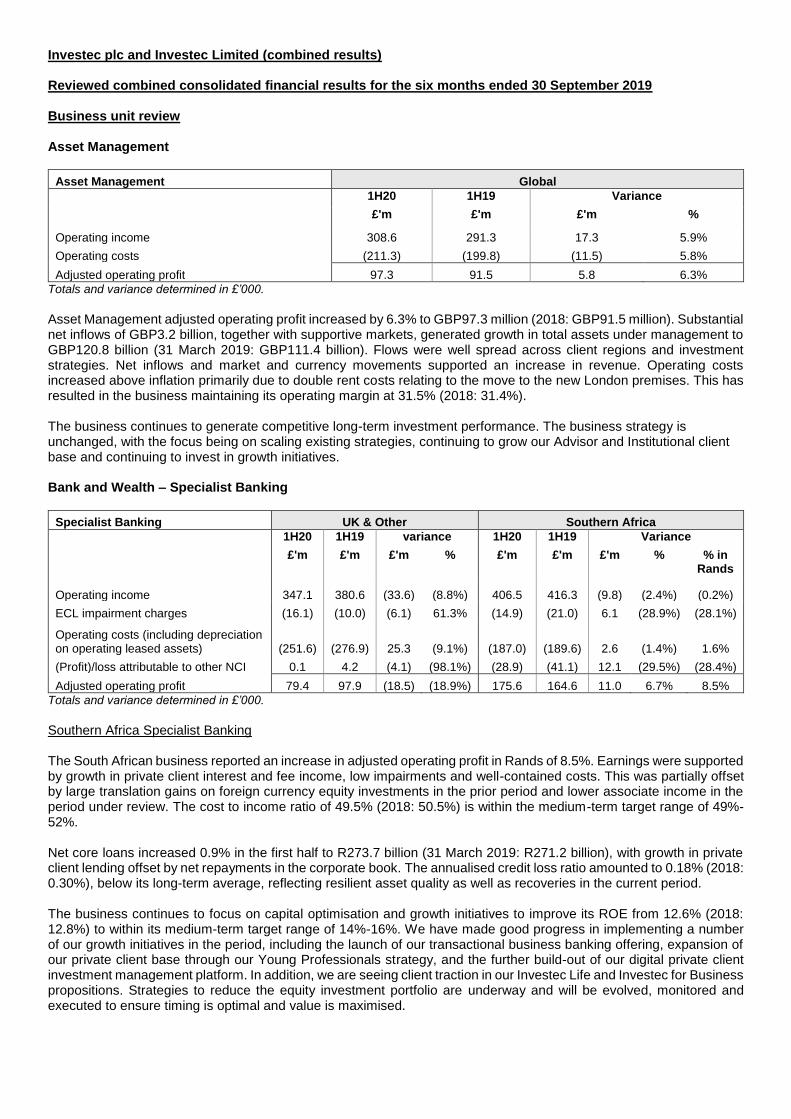
Specialist Banking UK & Other Southern Africa
1H20 1H19 variance 1H20 1H19 Variance
£'m £'m £'m % £'m £'m £'m % % in Rands
Operating income 347.1 380.6 (33.6) (8.8%) 406.5 416.3 (9.8) (2.4%) (0.2%)
ECL impairment charges (16.1) (10.0) (6.1) 61.3% (14.9) (21.0) 6.1 (28.9%) (28.1%)
Operating costs (including depreciation on operating leased assets) (251.6) (276.9) 25.3 (9.1%) (187.0) (189.6) 2.6 (1.4%) 1.6%
(Profit)/loss attributable to other NCI 0.1 4.2 (4.1) (98.1%) (28.9) (41.1) 12.1 (29.5%) (28.4%)
Adjusted operating profit 79.4 97.9 (18.5) (18.9%) 175.6 164.6 11.0 6.7% 8.5%
Totals and variance determined in £’000.
Southern Africa Specialist Banking The South African business reported an increase in adjusted operating profit in Rands of 8.5%. Earnings were supported by growth in private client interest and fee income, low impairments and well-contained costs. This was partially offset by large translation gains on foreign currency equity investments in the prior period and lower associate income in the period under review. The cost to income ratio of 49.5% (2018: 50.5%) is within the medium-term target range of 49%-52%. Net core loans increased 0.9% in the first half to R273.7 billion (31 March 2019: R271.2 billion), with growth in private client lending offset by net repayments in the corporate book. The annualised credit loss ratio amounted to 0.18% (2018: 0.30%), below its long-term average, reflecting resilient asset quality as well as recoveries in the current period. The business continues to focus on capital optimisation and growth initiatives to improve its ROE from 12.6% (2018: 12.8%) to within its medium-term target range of 14%-16%. We have made good progress in implementing a number of our growth initiatives in the period, including the launch of our transactional business banking offering, expansion of our private client base through our Young Professionals strategy, and the further build-out of our digital private client investment management platform. In addition, we are seeing client traction in our Investec Life and Investec for Business propositions. Strategies to reduce the equity investment portfolio are underway and will be evolved, monitored and executed to ensure timing is optimal and value is maximised.
UK & Other Specialist Banking The UK & Other business reported a decrease in adjusted operating profit of 18.9%. Earnings have been primarily impacted by lower trading income following gains in the prior period, mainly as a result of the restructure of subordinated debt. Net core loans grew 2.7% in the first half to GBP10.8 billion (31 March 2019: GBP10.5 billion). Our lending franchises have performed well, considering the prevailing macroeconomic environment. The Corporate Banking and Specialist International Lending franchises saw reasonable levels of origination and sell-down activity with good fee generation. This offset the slowdown in Investment Banking fees from persistent market uncertainty. The Private Banking business had good traction in target client acquisition, retail funding and mortgage book growth (up 12.1% since 31 March 2019). The annualised credit loss ratio amounted to 0.28% (2018: 0.41%), reflecting resilient credit performance across our diversified lending portfolios. Operating costs reduced by GBP25.3 million (a 9.1% decrease), reflecting normalised premises charges and an increased focus on cost discipline in line with our strategic objectives. The cost to income ratio of 72.4% (2018: 71.9%) was impacted by lower revenues. We remain committed to bringing it below 65% by the 2022 financial year. We expect the continued growth of the Private Banking business together with growth initiatives in the Corporate and Investment Bank and further cost efficiencies to improve the ROE from 8.1% (2018: 9.3%) to within its medium-term target of 10%-13%. Bank and Wealth - Wealth & Investment
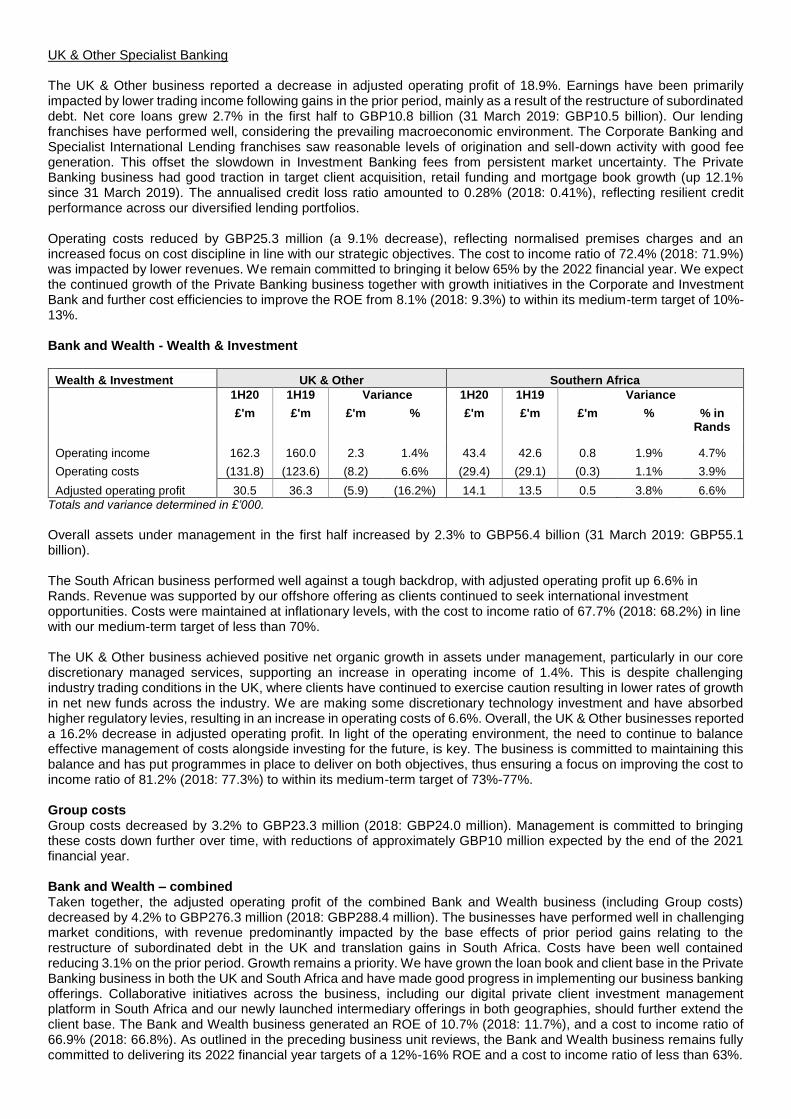
Wealth & Investment UK & Other Southern Africa
1H20 1H19 Variance 1H20 1H19 Variance
£'m £'m £'m % £'m £'m £'m % % in Rands
Operating income 162.3 160.0 2.3 1.4% 43.4 42.6 0.8 1.9% 4.7%
Operating costs (131.8) (123.6) (8.2) 6.6% (29.4) (29.1) (0.3) 1.1% 3.9%
Adjusted operating profit 30.5 36.3 (5.9) (16.2%) 14.1 13.5 0.5 3.8% 6.6%
Totals and variance determined in £’000.
Overall assets under management in the first half increased by 2.3% to GBP56.4 billion (31 March 2019: GBP55.1 billion). The South African business performed well against a tough backdrop, with adjusted operating profit up 6.6% in Rands. Revenue was supported by our offshore offering as clients continued to seek international investment opportunities. Costs were maintained at inflationary levels, with the cost to income ratio of 67.7% (2018: 68.2%) in line with our medium-term target of less than 70%. The UK & Other business achieved positive net organic growth in assets under management, particularly in our core discretionary managed services, supporting an increase in operating income of 1.4%. This is despite challenging industry trading conditions in the UK, where clients have continued to exercise caution resulting in lower rates of growth in net new funds across the industry. We are making some discretionary technology investment and have absorbed higher regulatory levies, resulting in an increase in operating costs of 6.6%. Overall, the UK & Other businesses reported a 16.2% decrease in adjusted operating profit. In light of the operating environment, the need to continue to balance effective management of costs alongside investing for the future, is key. The business is committed to maintaining this balance and has put programmes in place to deliver on both objectives, thus ensuring a focus on improving the cost to income ratio of 81.2% (2018: 77.3%) to within its medium-term target of 73%-77%. Group costs Group costs decreased by 3.2% to GBP23.3 million (2018: GBP24.0 million). Management is committed to bringing these costs down further over time, with reductions of approximately GBP10 million expected by the end of the 2021 financial year. Bank and Wealth – combined Taken together, the adjusted operating profit of the combined Bank and Wealth business (including Group costs) decreased by 4.2% to GBP276.3 million (2018: GBP288.4 million). The businesses have performed well in challenging market conditions, with revenue predominantly impacted by the base effects of prior period gains relating to the restructure of subordinated debt in the UK and translation gains in South Africa. Costs have been well contained reducing 3.1% on the prior period. Growth remains a priority. We have grown the loan book and client base in the Private Banking business in both the UK and South Africa and have made good progress in implementing our business banking offerings. Collaborative initiatives across the business, including our digital private client investment management platform in South Africa and our newly launched intermediary offerings in both geographies, should further extend the client base. The Bank and Wealth business generated an ROE of 10.7% (2018: 11.7%), and a cost to income ratio of 66.9% (2018: 66.8%). As outlined in the preceding business unit reviews, the Bank and Wealth business remains fully committed to delivering its 2022 financial year targets of a 12%-16% ROE and a cost to income ratio of less than 63%.
Further information on key developments within each of the business units is provided in the Group Interim Report
published on the group’s website: http://www.investec.com.
Financial statement analysis Total operating income Total operating income before expected credit loss impairment charges decreased by 1.8% to GBP1,267.9 million (2018: GBP1,290.8 million). Net interest income increased by 4.5% to GBP426.6 million (2018: GBP408.3 million), supported by private client activity and loan book growth. Net fee and commission income increased by 1.3% to GBP695.1 million (2018: GBP686.3 million). Growth in annuity fees from the Asset Management and Wealth Management businesses were partly offset by lower Specialist Banking fees impacted by a challenging macroeconomic environment in both South Africa and the UK. Investment income amounted to GBP56.9 million (2018: GBP64.7 million) reflecting lower gains from the investment portfolio. Share of post taxation profit of associates of GBP17.8 million (2018: GBP20.7 million) reflects earnings in relation to the group’s investment in the IEP Group. Trading income arising from customer flow amounted to GBP62.8 million (2018: GBP65.1 million) reflecting reasonable activity levels given the macroeconomic backdrop. Trading income from balance sheet management and other trading activities decreased significantly to GBP1.6 million (2018: GBP39.4 million). The decrease is largely as a result of translation gains on foreign currency equity investments in South Africa in the prior period as well as the prior period gain on the restructure of subordinated debt in the UK. Expected credit loss (ECL) impairment charges The total ECL impairment charges amounted to GBP31.0 million, in line with the prior period. The group’s annualised credit loss ratio was 0.23% (2018: 0.34%), below its long-term average range. Since 31 March 2019 gross core loan Stage 3 assets have reduced by GBP18 million to GBP503.0 million. Net Stage 3 exposures as a percentage of net core loans subject to ECL was 1.4% (31 March 2019: 1.3%). Operating costs Operating costs decreased 1.0% to GBP833.5 million (2018: GBP841.8 million) driven by cost containment across the business and normalised premises costs. The cost to income ratio (net of non-controlling interests) was in line with the prior period at 67.3% (2018: 67.2%). Taxation The tax charge on adjusted operating profit was GBP62.4 million (2018: GBP62.6 million), resulting in an effective tax rate of 16.2% (2018: 15.8%). Financial impact of group restructures and closure and rundown of the Hong Kong direct investments business In pursuit of the group’s objective to simplify, focus and grow the business, a number of strategic actions have been effected, namely; closure of the Click & Invest operations, sale of the Irish Wealth & Investment business, restructure of the Irish branch, sale of the UK Property Fund, and the closure and rundown of the Hong Kong direct investments business. These strategic actions, as well as costs incurred in relation to the proposed demerger of the Asset Management business, negatively impacted profit before taxation by GBP45.3 million (2018: GBP20.7 million). See Notes for detailed breakdown.
Profit attributable to non-controlling interests Profit attributable to non-controlling interests mainly comprises:
GBP15.2 million (2018: GBP12.8 million) profit attributable to non-controlling interests in the Asset Management business.
GBP28.9 million (2018: GBP36.4 million) profit attributable to non-controlling interests in the Investec Property Fund.
Balance sheet analysis Since 31 March 2019:
Shareholders equity increased by 2.4% to GBP4.4 billion mainly due to an increase in retained earnings.
Net asset value per share increased 3.3% to 448.3 pence and net tangible asset value per share (which excludes goodwill and intangible assets) increased 4.0% to 401.5 pence, primarily as a result of an increase in retained earnings.
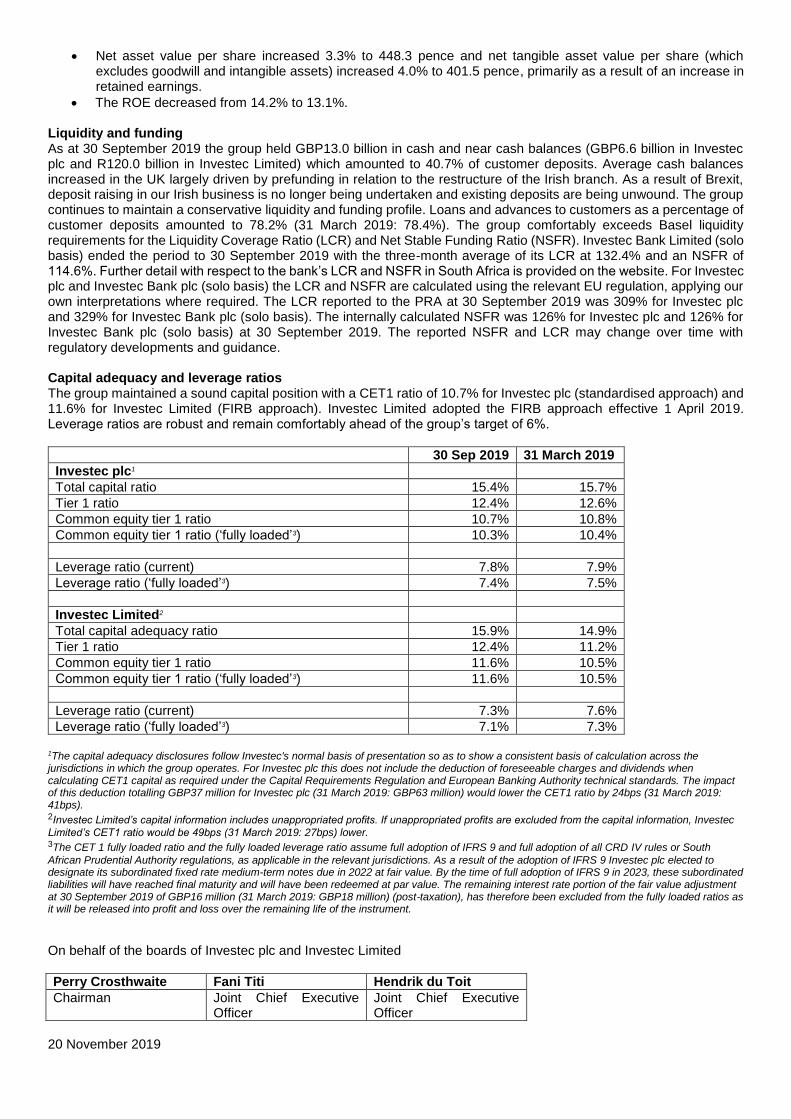
The ROE decreased from 14.2% to 13.1%. Liquidity and funding As at 30 September 2019 the group held GBP13.0 billion in cash and near cash balances (GBP6.6 billion in Investec plc and R120.0 billion in Investec Limited) which amounted to 40.7% of customer deposits. Average cash balances increased in the UK largely driven by prefunding in relation to the restructure of the Irish branch. As a result of Brexit, deposit raising in our Irish business is no longer being undertaken and existing deposits are being unwound. The group continues to maintain a conservative liquidity and funding profile. Loans and advances to customers as a percentage of customer deposits amounted to 78.2% (31 March 2019: 78.4%). The group comfortably exceeds Basel liquidity requirements for the Liquidity Coverage Ratio (LCR) and Net Stable Funding Ratio (NSFR). Investec Bank Limited (solo basis) ended the period to 30 September 2019 with the three-month average of its LCR at 132.4% and an NSFR of 114.6%. Further detail with respect to the bank’s LCR and NSFR in South Africa is provided on the website. For Investec plc and Investec Bank plc (solo basis) the LCR and NSFR are calculated using the relevant EU regulation, applying our own interpretations where required. The LCR reported to the PRA at 30 September 2019 was 309% for Investec plc and 329% for Investec Bank plc (solo basis). The internally calculated NSFR was 126% for Investec plc and 126% for Investec Bank plc (solo basis) at 30 September 2019. The reported NSFR and LCR may change over time with regulatory developments and guidance. Capital adequacy and leverage ratios The group maintained a sound capital position with a CET1 ratio of 10.7% for Investec plc (standardised approach) and 11.6% for Investec Limited (FIRB approach). Investec Limited adopted the FIRB approach effective 1 April 2019. Leverage ratios are robust and remain comfortably ahead of the group’s target of 6%.
30 Sep 2019 31 March 2019
Investec plc1
Total capital ratio 15.4% 15.7%
Tier 1 ratio 12.4% 12.6%
Common equity tier 1 ratio 10.7% 10.8%
Common equity tier 1 ratio (‘fully loaded’3) 10.3% 10.4%
Leverage ratio (current) 7.8% 7.9%
Leverage ratio (‘fully loaded’3) 7.4% 7.5%
Investec Limited2
Total capital adequacy ratio 15.9% 14.9%
Tier 1 ratio 12.4% 11.2%
Common equity tier 1 ratio 11.6% 10.5%
Common equity tier 1 ratio (‘fully loaded’3) 11.6% 10.5%
Leverage ratio (current) 7.3% 7.6%
Leverage ratio (‘fully loaded’3) 7.1% 7.3%
1The capital adequacy disclosures follow Investec's normal basis of presentation so as to show a consistent basis of calculation across the jurisdictions in which the group operates. For Investec plc this does not include the deduction of foreseeable charges and dividends when calculating CET1 capital as required under the Capital Requirements Regulation and European Banking Authority technical standards. The impact of this deduction totalling GBP37 million for Investec plc (31 March 2019: GBP63 million) would lower the CET1 ratio by 24bps (31 March 2019: 41bps). 2Investec Limited’s capital information includes unappropriated profits. If unappropriated profits are excluded from the capital information, Investec
Limited’s CET1 ratio would be 49bps (31 March 2019: 27bps) lower. 3The CET 1 fully loaded ratio and the fully loaded leverage ratio assume full adoption of IFRS 9 and full adoption of all CRD IV rules or South
African Prudential Authority regulations, as applicable in the relevant jurisdictions. As a result of the adoption of IFRS 9 Investec plc elected to designate its subordinated fixed rate medium-term notes due in 2022 at fair value. By the time of full adoption of IFRS 9 in 2023, these subordinated liabilities will have reached final maturity and will have been redeemed at par value. The remaining interest rate portion of the fair value adjustment at 30 September 2019 of GBP16 million (31 March 2019: GBP18 million) (post-taxation), has therefore been excluded from the fully loaded ratios as it will be released into profit and loss over the remaining life of the instrument.
On behalf of the boards of Investec plc and Investec Limited
Perry Crosthwaite Fani Titi Hendrik du Toit
Chairman Joint Chief Executive Officer
Joint Chief Executive Officer
20 November 2019
Notes to the commentary section above
Presentation of financial information Investec operates under a Dual Listed Companies (DLC) structure with primary listings of Investec plc on the London Stock Exchange and Investec Limited on the JSE Limited. In terms of the contracts constituting the DLC structure, Investec plc and Investec Limited effectively form a single economic enterprise in which the economic and voting rights of ordinary shareholders of the companies are maintained in equilibrium relative to each other. The directors of the two companies consider that for financial reporting purposes, the fairest presentation is achieved by combining the results and financial position of both companies. Accordingly, the year-end results for Investec plc and Investec Limited present the results and financial position of the combined DLC group under International Financial Reporting Standards (IFRS), denominated in Pounds Sterling. In the commentary above, all references to Investec or the group relate to the combined DLC group comprising Investec plc and Investec Limited. Unless the context indicates otherwise, all comparatives included in the commentary above relate to the six months ended 30 September 2018. Amounts represented on a neutral currency basis for income statement items assume that the relevant average exchange rates for the six months to 30 September 2019 remain the same as those in the prior period. Amounts represented on a neutral currency basis for balance sheet items assume that the relevant closing exchange rates at 30 September 2019 remain the same as those at 31 March 2019.
Foreign currency impact
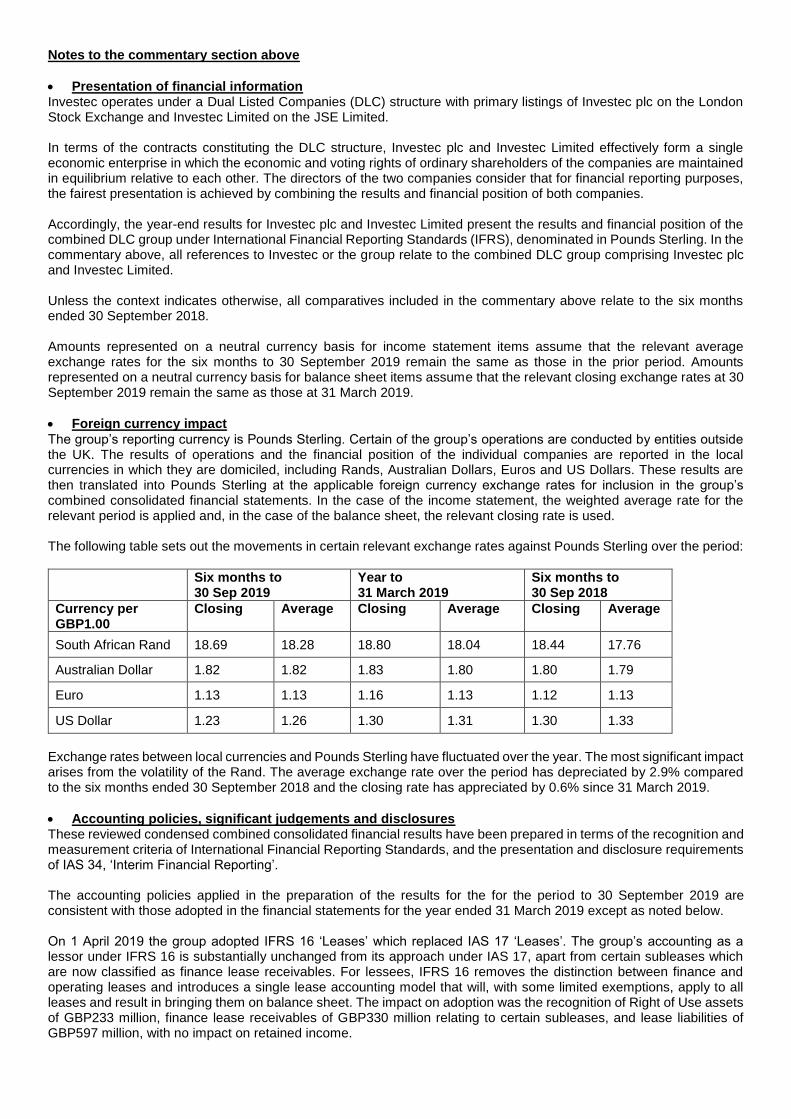
The group’s reporting currency is Pounds Sterling. Certain of the group’s operations are conducted by entities outside the UK. The results of operations and the financial position of the individual companies are reported in the local currencies in which they are domiciled, including Rands, Australian Dollars, Euros and US Dollars. These results are then translated into Pounds Sterling at the applicable foreign currency exchange rates for inclusion in the group’s combined consolidated financial statements. In the case of the income statement, the weighted average rate for the relevant period is applied and, in the case of the balance sheet, the relevant closing rate is used. The following table sets out the movements in certain relevant exchange rates against Pounds Sterling over the period:
Six months to 30 Sep 2019
Year to 31 March 2019
Six months to 30 Sep 2018
Currency per GBP1.00
Closing Average Closing Average Closing Average
South African Rand 18.69 18.28 18.80 18.04 18.44 17.76
Australian Dollar 1.82 1.82 1.83 1.80 1.80 1.79
Euro 1.13 1.13 1.16 1.13 1.12 1.13
US Dollar 1.23 1.26 1.30 1.31 1.30 1.33
Exchange rates between local currencies and Pounds Sterling have fluctuated over the year. The most significant impact arises from the volatility of the Rand. The average exchange rate over the period has depreciated by 2.9% compared to the six months ended 30 September 2018 and the closing rate has appreciated by 0.6% since 31 March 2019.
Accounting policies, significant judgements and disclosures These reviewed condensed combined consolidated financial results have been prepared in terms of the recognition and measurement criteria of International Financial Reporting Standards, and the presentation and disclosure requirements of IAS 34, ‘Interim Financial Reporting’. The accounting policies applied in the preparation of the results for the for the period to 30 September 2019 are consistent with those adopted in the financial statements for the year ended 31 March 2019 except as noted below. On 1 April 2019 the group adopted IFRS 16 ‘Leases’ which replaced IAS 17 ‘Leases’. The group’s accounting as a lessor under IFRS 16 is substantially unchanged from its approach under IAS 17, apart from certain subleases which are now classified as finance lease receivables. For lessees, IFRS 16 removes the distinction between finance and operating leases and introduces a single lease accounting model that will, with some limited exemptions, apply to all leases and result in bringing them on balance sheet. The impact on adoption was the recognition of Right of Use assets of GBP233 million, finance lease receivables of GBP330 million relating to certain subleases, and lease liabilities of GBP597 million, with no impact on retained income.
The group remains committed to its objective to simplify and focus the business in pursuit of disciplined growth over the long term. In this regard the following strategic actions have been effected: Proposed demerger of the asset management business, closure of the Click & Invest operations which formed part of the UK wealth management business, sale of the Irish Wealth & Investment business, restructure of the Irish branch, sale of the UK Property Fund, closure and rundown of the Hong Kong direct investments business. The group has elected to separately disclose the financial impact of these strategic actions as the financial impact from group restructures and the rundown of portfolios where operations have ceased. Due to the significant change in the nature of the entity’s operations, we consider it appropriate to present the information on a like-for-like basis, resulting in reclassifications for related items which were previously included in operating income and operating costs in the income statement. In addition, from 1 April 2019, as a result of amendments to IAS 12 Income Taxes, tax relief on payments in relation to Other Additional Tier 1 securities has been recognised as a reduction in taxation on operating profit before goodwill, acquired intangibles and strategic actions, whereas it was previously recorded directly in retained income. Prior period comparatives have been restated, increasing the profit after taxation for the six months to 30 September 2018 by £1.6 million and for the year to 31 March 2019 by £3.2 million. These reclassifications in the income statement for the prior reported periods and the consequential restated comparatives have been shown in the Restatements table in this announcement. The net effect on restated earnings attributable to shareholders relates solely to the tax previously included directly in equity which is now being reported in the income statement. The net effect on restated adjusted earnings per share relates to:
the inclusion of the tax relief previously recorded directly in equity which is now being recognised in the
income statement; and
the exclusion of the financial impact of the strategic actions, which were included in adjusted operating profit in
prior periods.
There has been no impact to Earnings per share or Headline earnings per share. The group’s planned demerger of Investec Asset Management from the Investec group leads to s ignificant judgement on the presentation and disclosure implications for the current period. The main consideration is whether the current progress on the demerger requires the Investec Asset Management business to be classified as a disposal group and discontinued operation. The group has considered the requirements of IFRS 5 ‘Non-current Assets Held For Sale and Discontinued Operations’, where the key tests for this classification are that a business must be available for immediate sale in its present condition and that the transaction should be highly probable. The group considers that the former test is met as the Investec Asset Management business functions in a relatively standalone way with only those shared services which would be normal in a demerger or similar transaction. However, given that the transaction is still subject to shareholder and other customary approvals, and that at the reporting date there was not sufficient certainty of the outcome of these approval processes, we were unable to conclude that this transaction is highly probable. The group’s conclusion is therefore that the demerger cannot be classified as a disposal group and discontinued operation at 30 September 2019. The financial results have been prepared under the supervision of Nishlan Samujh, the Group Finance Director. The financial statements for the six months to 30 September 2019 are available on the group’s website:
http://www.investec.com.
Proviso Please note that matters discussed in this announcement may contain forward looking statements which are
subject to various risks and uncertainties and other factors, including, but not limited to: – changes in the political and/or economic environment that would materially affect the Investec group – changes in legislation or regulation impacting the Investec group’s operations or its accounting policies – changes in business conditions that will have a significant impact on the Investec group’s operations – changes in exchange rates and/or tax rates from the prevailing rates outlined in this announcement – changes in the structure of the markets, client demand or the competitive environment.
A number of these factors are beyond the group’s control. These factors may cause the group’s actual future results, performance or achievements in the markets in which
it operates to differ from those expressed or implied. Any forward looking statements made are based on the knowledge of the group at 20 November 2019. The information in the announcement for the six months ended 30 September 2019, which was approved by
the board of directors on 20 November 2019, does not constitute statutory accounts as defined in Section 435 of the UK Companies Act 2006. The 31 March 2019 financial statements were filed with the registrar and were unqualified with the audit report containing no statements in respect of sections 498(2) or 498(3) of the UK Companies Act.
This announcement is available on the group’s website: http://www.investec.com.
Definitions Adjusted operating profit refers to operating profit before goodwill, acquired intangibles and strategic actions
and after adjusting for earnings attributable to other non-controlling interests. Trends within the divisional sections relate to adjusted operating profit before group costs. Adjusted operating profit is considered an important measure by Investec of the profit realised by the group in the ordinary course of operations. In addition, it forms the basis of the dividend pay-out policy. Non-IFRS measures such as adjusted operating profit are considered as pro forma financial information as per the JSE Listing Requirements. The pro forma financial information is the responsibility of the group’s Board of Directors.
Adjusted earnings attributable to shareholders is defined as earnings attributable to shareholders before goodwill, acquired intangibles and strategic actions and after the deduction of earnings attributable to perpetual preference shareholders and Other Additional Tier 1 security holders.
Adjusted basic earnings per share is calculated as adjusted earnings attributable to shareholders divided by the weighted average number of ordinary shares in issue during the year.
Dividend cover is calculated as adjusted earnings per share divided by the dividend per share. Annuity income is defined as net interest income plus net annuity fees and commissions expressed as a
percentage of total operating income. The annualised credit loss ratio is calculated as expected credit loss (ECL) impairment charges on gross core
loans and advances as a percentage of average gross core loans and advances subject to ECL. The cost to income ratio is calculated as: operating costs divided by operating income (net of depreciation on
operating leased assets and net of operating profits or losses attributable to other non-controlling interests). Annualised return on average ordinary shareholders’ equity (ROE) is calculated as annualised adjusted
earnings attributable to ordinary shareholders divided by average ordinary shareholders’ equity. Core loans and advances is defined as net loans and advances to customers plus net own originated securitised
assets. NCI is non-controlling interests.
Financial assistance Shareholders are referred to Special Resolution number 3, which was approved at the annual general meeting held on 8 August 2019, relating to the provision of direct or indirect financial assistance in terms of Section 45 of the South African Companies Act, No 71 of 2008 to related or inter-related companies. Shareholders are hereby notified that in terms of S45(5)(a) of the South African Companies Act, the boards of directors of Investec Limited and Investec Bank Limited provided such financial assistance during the period 1 April 2019 to 30 September 2019 to various group subsidiaries. Johannesburg and London Sponsor: Investec Bank Limited
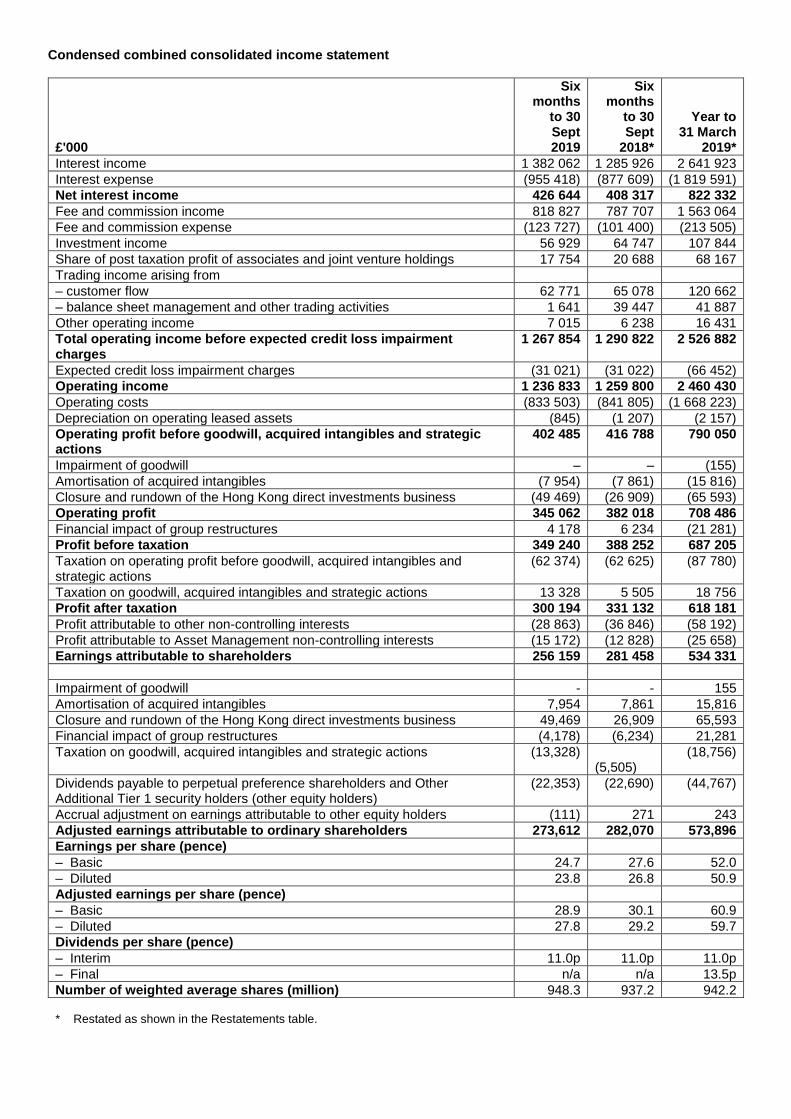
Condensed combined consolidated income statement
£'000
Six months
to 30 Sept 2019
Six months
to 30 Sept
2018*
Year to 31 March
2019*
Interest income 1 382 062 1 285 926 2 641 923
Interest expense (955 418) (877 609) (1 819 591)
Net interest income 426 644 408 317 822 332
Fee and commission income 818 827 787 707 1 563 064
Fee and commission expense (123 727) (101 400) (213 505)
Investment income 56 929 64 747 107 844
Share of post taxation profit of associates and joint venture holdings 17 754 20 688 68 167
Trading income arising from
– customer flow 62 771 65 078 120 662
– balance sheet management and other trading activities 1 641 39 447 41 887
Other operating income 7 015 6 238 16 431
Total operating income before expected credit loss impairment charges
1 267 854 1 290 822 2 526 882
Expected credit loss impairment charges (31 021) (31 022) (66 452)
Operating income 1 236 833 1 259 800 2 460 430
Operating costs (833 503) (841 805) (1 668 223)
Depreciation on operating leased assets (845) (1 207) (2 157)
Operating profit before goodwill, acquired intangibles and strategic actions
402 485 416 788 790 050
Impairment of goodwill – – (155)
Amortisation of acquired intangibles (7 954) (7 861) (15 816)
Closure and rundown of the Hong Kong direct investments business (49 469) (26 909) (65 593)
Operating profit 345 062 382 018 708 486
Financial impact of group restructures 4 178 6 234 (21 281)
Profit before taxation 349 240 388 252 687 205
Taxation on operating profit before goodwill, acquired intangibles and strategic actions
(62 374) (62 625) (87 780)
Taxation on goodwill, acquired intangibles and strategic actions 13 328 5 505 18 756
Profit after taxation 300 194 331 132 618 181
Profit attributable to other non-controlling interests (28 863) (36 846) (58 192)
Profit attributable to Asset Management non-controlling interests (15 172) (12 828) (25 658)
Earnings attributable to shareholders 256 159 281 458 534 331
Impairment of goodwill - - 155
Amortisation of acquired intangibles 7,954 7,861 15,816
Closure and rundown of the Hong Kong direct investments business 49,469 26,909 65,593
Financial impact of group restructures (4,178) (6,234) 21,281
Taxation on goodwill, acquired intangibles and strategic actions (13,328) (5,505)
(18,756)
Dividends payable to perpetual preference shareholders and Other Additional Tier 1 security holders (other equity holders)
(22,353) (22,690) (44,767)
Accrual adjustment on earnings attributable to other equity holders (111) 271 243
Adjusted earnings attributable to ordinary shareholders 273,612 282,070 573,896
Earnings per share (pence)
– Basic 24.7 27.6 52.0
– Diluted 23.8 26.8 50.9
Adjusted earnings per share (pence)
– Basic 28.9 30.1 60.9
– Diluted 27.8 29.2 59.7
Dividends per share (pence)
– Interim 11.0p 11.0p 11.0p
– Final n/a n/a 13.5p
Number of weighted average shares (million) 948.3 937.2 942.2 * Restated as shown in the Restatements table.
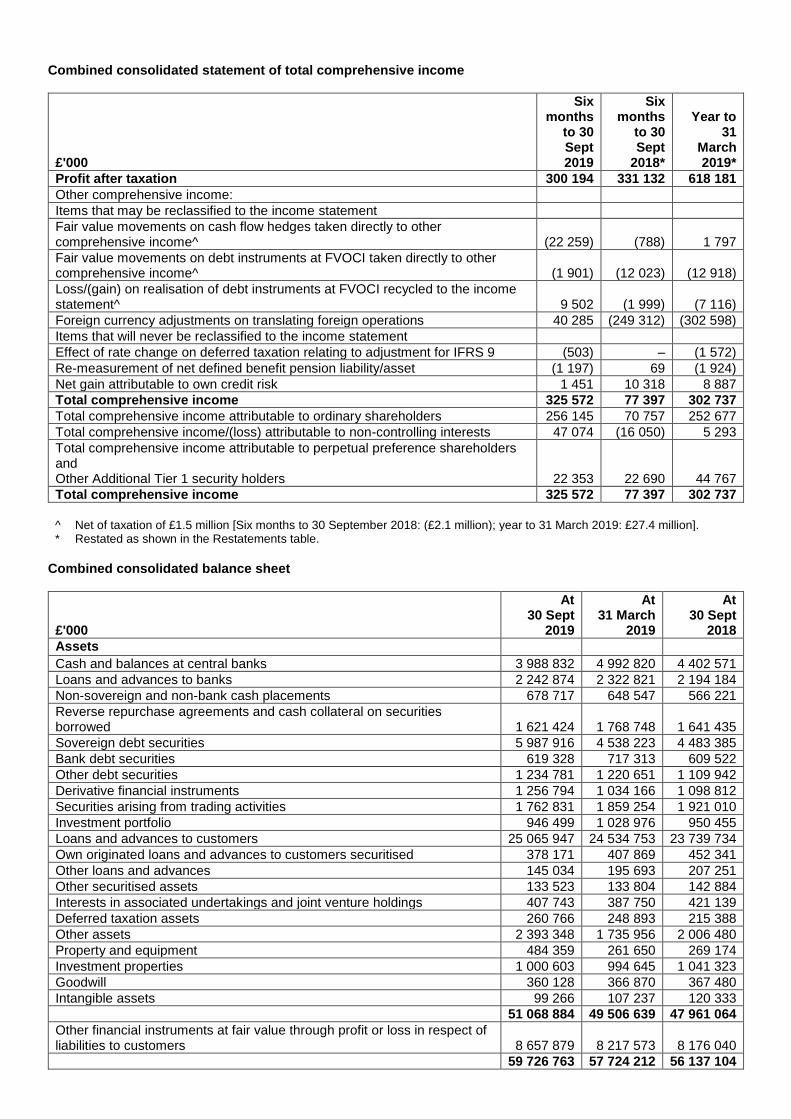
Combined consolidated statement of total comprehensive income
£'000
Six months
to 30 Sept 2019
Six months
to 30 Sept
2018*
Year to 31
March 2019*
Profit after taxation 300 194 331 132 618 181
Other comprehensive income:
Items that may be reclassified to the income statement
Fair value movements on cash flow hedges taken directly to other comprehensive income^ (22 259) (788) 1 797
Fair value movements on debt instruments at FVOCI taken directly to other comprehensive income^ (1 901) (12 023) (12 918)
Loss/(gain) on realisation of debt instruments at FVOCI recycled to the income statement^ 9 502 (1 999) (7 116)
Foreign currency adjustments on translating foreign operations 40 285 (249 312) (302 598)
Items that will never be reclassified to the income statement
Effect of rate change on deferred taxation relating to adjustment for IFRS 9 (503) – (1 572)
Re-measurement of net defined benefit pension liability/asset (1 197) 69 (1 924)
Net gain attributable to own credit risk 1 451 10 318 8 887
Total comprehensive income 325 572 77 397 302 737
Total comprehensive income attributable to ordinary shareholders 256 145 70 757 252 677
Total comprehensive income/(loss) attributable to non-controlling interests 47 074 (16 050) 5 293
Total comprehensive income attributable to perpetual preference shareholders and Other Additional Tier 1 security holders 22 353 22 690 44 767
Total comprehensive income 325 572 77 397 302 737
^ Net of taxation of £1.5 million [Six months to 30 September 2018: (£2.1 million); year to 31 March 2019: £27.4 million]. * Restated as shown in the Restatements table.
Combined consolidated balance sheet
£'000
At 30 Sept
2019
At 31 March
2019
At 30 Sept
2018
Assets
Cash and balances at central banks 3 988 832 4 992 820 4 402 571
Loans and advances to banks 2 242 874 2 322 821 2 194 184
Non-sovereign and non-bank cash placements 678 717 648 547 566 221
Reverse repurchase agreements and cash collateral on securities borrowed 1 621 424 1 768 748 1 641 435
Sovereign debt securities 5 987 916 4 538 223 4 483 385
Bank debt securities 619 328 717 313 609 522
Other debt securities 1 234 781 1 220 651 1 109 942
Derivative financial instruments 1 256 794 1 034 166 1 098 812
Securities arising from trading activities 1 762 831 1 859 254 1 921 010
Investment portfolio 946 499 1 028 976 950 455
Loans and advances to customers 25 065 947 24 534 753 23 739 734
Own originated loans and advances to customers securitised 378 171 407 869 452 341
Other loans and advances 145 034 195 693 207 251
Other securitised assets 133 523 133 804 142 884
Interests in associated undertakings and joint venture holdings 407 743 387 750 421 139
Deferred taxation assets 260 766 248 893 215 388
Other assets 2 393 348 1 735 956 2 006 480
Property and equipment 484 359 261 650 269 174
Investment properties 1 000 603 994 645 1 041 323
Goodwill 360 128 366 870 367 480
Intangible assets 99 266 107 237 120 333
51 068 884 49 506 639 47 961 064
Other financial instruments at fair value through profit or loss in respect of liabilities to customers 8 657 879 8 217 573 8 176 040
59 726 763 57 724 212 56 137 104
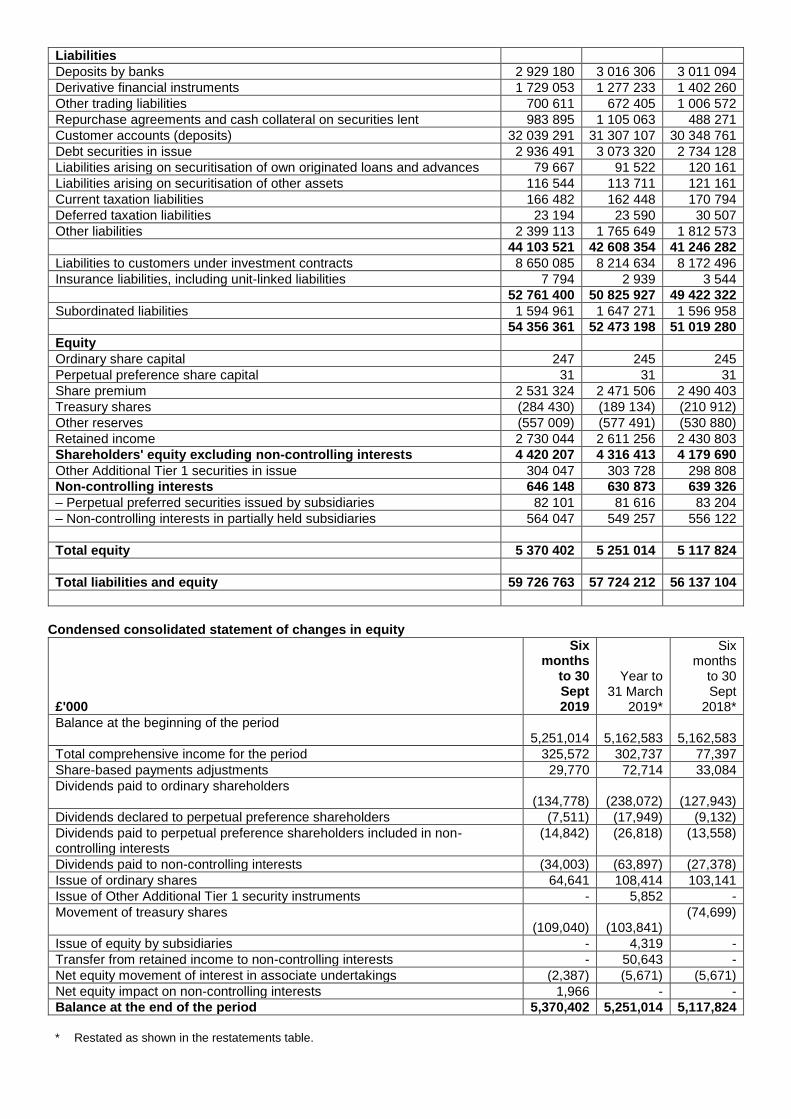
Liabilities
Deposits by banks 2 929 180 3 016 306 3 011 094
Derivative financial instruments 1 729 053 1 277 233 1 402 260
Other trading liabilities 700 611 672 405 1 006 572
Repurchase agreements and cash collateral on securities lent 983 895 1 105 063 488 271
Customer accounts (deposits) 32 039 291 31 307 107 30 348 761
Debt securities in issue 2 936 491 3 073 320 2 734 128
Liabilities arising on securitisation of own originated loans and advances 79 667 91 522 120 161
Liabilities arising on securitisation of other assets 116 544 113 711 121 161
Current taxation liabilities 166 482 162 448 170 794
Deferred taxation liabilities 23 194 23 590 30 507
Other liabilities 2 399 113 1 765 649 1 812 573
44 103 521 42 608 354 41 246 282
Liabilities to customers under investment contracts 8 650 085 8 214 634 8 172 496
Insurance liabilities, including unit-linked liabilities 7 794 2 939 3 544
52 761 400 50 825 927 49 422 322
Subordinated liabilities 1 594 961 1 647 271 1 596 958
54 356 361 52 473 198 51 019 280
Equity
Ordinary share capital 247 245 245
Perpetual preference share capital 31 31 31
Share premium 2 531 324 2 471 506 2 490 403
Treasury shares (284 430) (189 134) (210 912)
Other reserves (557 009) (577 491) (530 880)
Retained income 2 730 044 2 611 256 2 430 803
Shareholders' equity excluding non-controlling interests 4 420 207 4 316 413 4 179 690
Other Additional Tier 1 securities in issue 304 047 303 728 298 808
Non-controlling interests 646 148 630 873 639 326
– Perpetual preferred securities issued by subsidiaries 82 101 81 616 83 204
– Non-controlling interests in partially held subsidiaries 564 047 549 257 556 122
Total equity 5 370 402 5 251 014 5 117 824
Total liabilities and equity 59 726 763 57 724 212 56 137 104
Condensed consolidated statement of changes in equity
£'000
Six months
to 30 Sept 2019
Year to 31 March
2019*
Six months
to 30 Sept
2018*
Balance at the beginning of the period 5,251,014
5,162,583
5,162,583
Total comprehensive income for the period 325,572 302,737 77,397
Share-based payments adjustments 29,770 72,714 33,084
Dividends paid to ordinary shareholders (134,778)
(238,072)
(127,943)
Dividends declared to perpetual preference shareholders (7,511) (17,949) (9,132)
Dividends paid to perpetual preference shareholders included in non-controlling interests
(14,842) (26,818) (13,558)
Dividends paid to non-controlling interests (34,003) (63,897) (27,378)
Issue of ordinary shares 64,641 108,414 103,141
Issue of Other Additional Tier 1 security instruments - 5,852 -
Movement of treasury shares (109,040)
(103,841)
(74,699)
Issue of equity by subsidiaries - 4,319 -
Transfer from retained income to non-controlling interests - 50,643 -
Net equity movement of interest in associate undertakings (2,387) (5,671) (5,671)
Net equity impact on non-controlling interests 1,966 - -
Balance at the end of the period 5,370,402 5,251,014 5,117,824
* Restated as shown in the restatements table.
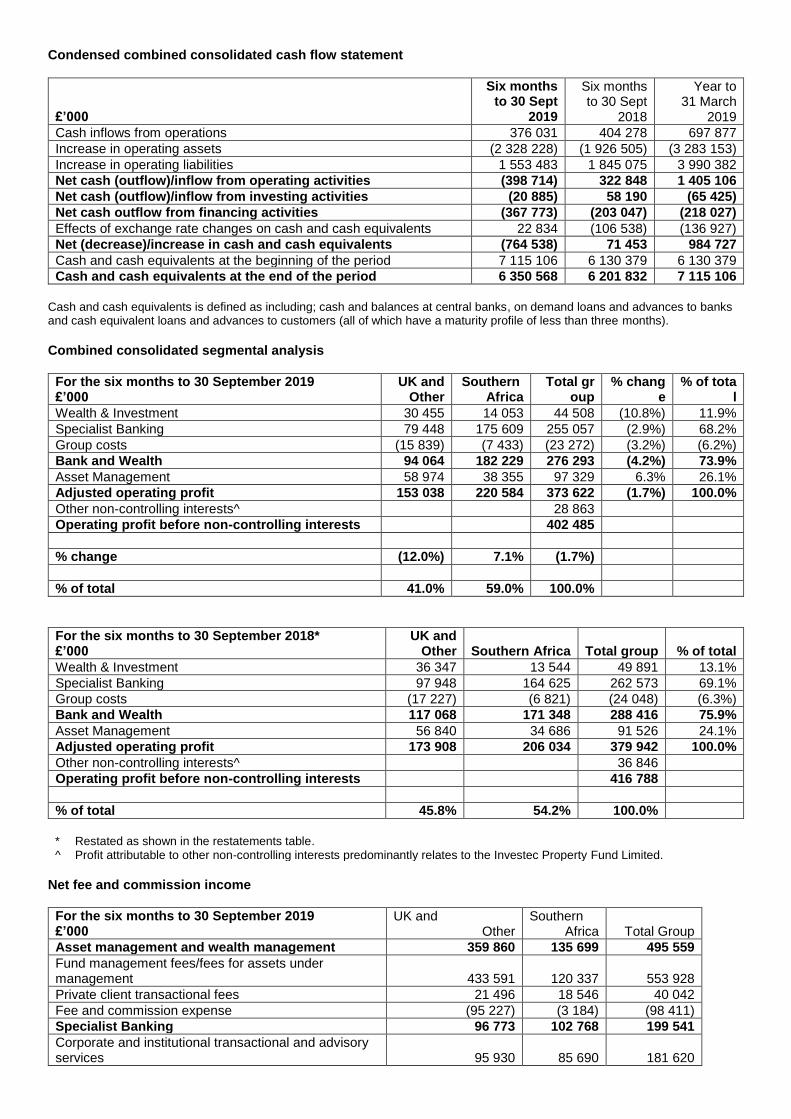
Condensed combined consolidated cash flow statement
£’000
Six months to 30 Sept
2019
Six months to 30 Sept
2018
Year to 31 March
2019
Cash inflows from operations 376 031 404 278 697 877
Increase in operating assets (2 328 228) (1 926 505) (3 283 153)
Increase in operating liabilities 1 553 483 1 845 075 3 990 382
Net cash (outflow)/inflow from operating activities (398 714) 322 848 1 405 106
Net cash (outflow)/inflow from investing activities (20 885) 58 190 (65 425)
Net cash outflow from financing activities (367 773) (203 047) (218 027)
Effects of exchange rate changes on cash and cash equivalents 22 834 (106 538) (136 927)
Net (decrease)/increase in cash and cash equivalents (764 538) 71 453 984 727
Cash and cash equivalents at the beginning of the period 7 115 106 6 130 379 6 130 379
Cash and cash equivalents at the end of the period 6 350 568 6 201 832 7 115 106
Cash and cash equivalents is defined as including; cash and balances at central banks, on demand loans and advances to banks and cash equivalent loans and advances to customers (all of which have a maturity profile of less than three months).
Combined consolidated segmental analysis
For the six months to 30 September 2019 £’000
UK and Other
Southern Africa
Total group
% change
% of total
Wealth & Investment 30 455 14 053 44 508 (10.8%) 11.9%
Specialist Banking 79 448 175 609 255 057 (2.9%) 68.2%
Group costs (15 839) (7 433) (23 272) (3.2%) (6.2%)
Bank and Wealth 94 064 182 229 276 293 (4.2%) 73.9%
Asset Management 58 974 38 355 97 329 6.3% 26.1%
Adjusted operating profit 153 038 220 584 373 622 (1.7%) 100.0%
Other non-controlling interests^ 28 863
Operating profit before non-controlling interests 402 485
% change (12.0%) 7.1% (1.7%)
% of total 41.0% 59.0% 100.0%
For the six months to 30 September 2018* £’000
UK and Other Southern Africa Total group % of total
Wealth & Investment 36 347 13 544 49 891 13.1%
Specialist Banking 97 948 164 625 262 573 69.1%
Group costs (17 227) (6 821) (24 048) (6.3%)
Bank and Wealth 117 068 171 348 288 416 75.9%
Asset Management 56 840 34 686 91 526 24.1%
Adjusted operating profit 173 908 206 034 379 942 100.0%
Other non-controlling interests^ 36 846
Operating profit before non-controlling interests 416 788
% of total 45.8% 54.2% 100.0%
* Restated as shown in the restatements table. ^ Profit attributable to other non-controlling interests predominantly relates to the Investec Property Fund Limited.
Net fee and commission income
For the six months to 30 September 2019 £’000
UK and Other
Southern Africa Total Group
Asset management and wealth management 359 860 135 699 495 559
Fund management fees/fees for assets under management 433 591 120 337 553 928
Private client transactional fees 21 496 18 546 40 042
Fee and commission expense (95 227) (3 184) (98 411)
Specialist Banking 96 773 102 768 199 541
Corporate and institutional transactional and advisory services 95 930 85 690 181 620

Private client transactional fees 5 671 37 566 43 237
Fee and commission expense (4 828) (20 488) (25 316)
Net fee and commission income 456 633 238 467 695 100
Annuity fees (net of fees payable) 347 776 209 569 557 345
Deal fees 108 857 28 898 137 755
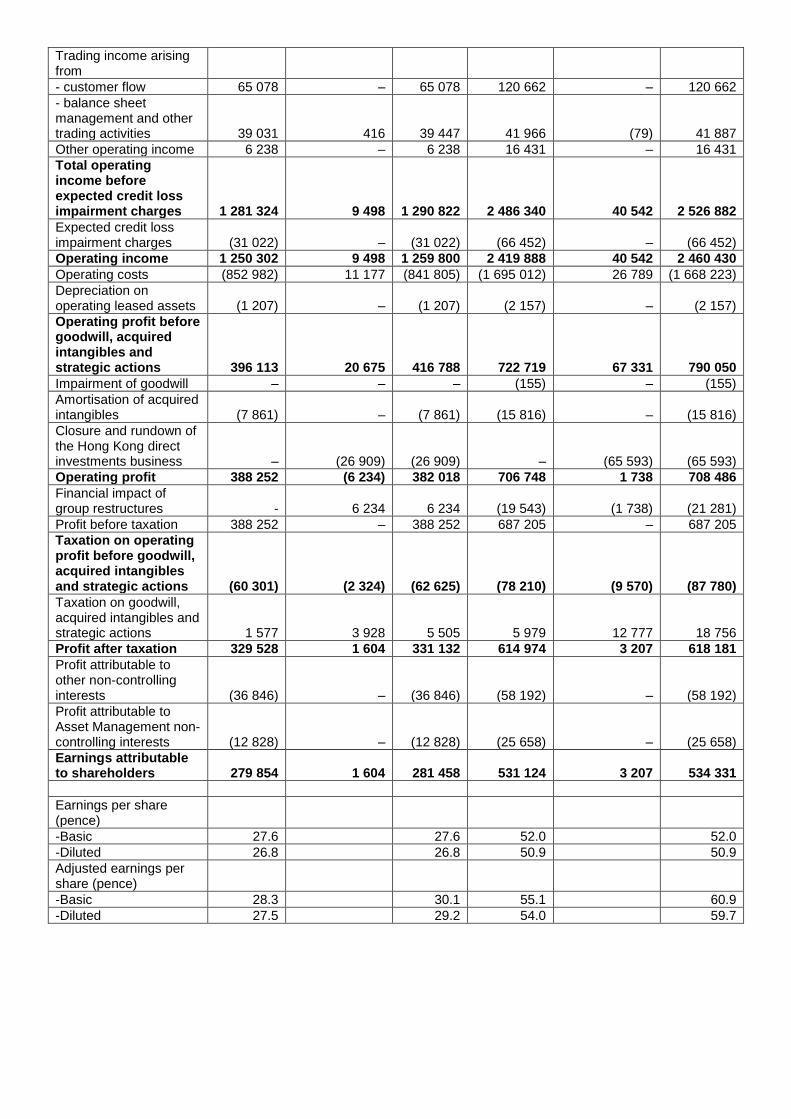
Included in Specialist Banking corporate and institutional and advisory services is net fee income of £36.2 million (2018: £37.5 million) for operating lease income which is out of the scope of IFRS 15 – Revenue from contracts with customers. RESTATEMENTS The group remains committed to its objective to simplify and focus the business in pursuit of disciplined growth over the long-term. In this regard the following strategic actions have been effected: - Proposed demerger of the asset management business - Closure of Click & Invest which formed part of the UK wealth management business - Sale of the Irish Wealth & Investment business - Restructure of the Irish branch - Sale of UK Property Fund - Closure and rundown of the Hong Kong direct investments business. We have elected to separately disclose the financial impact of these strategic actions as the financial impact from group restructures and the rundown of portfolios where operations have ceased. Due to the significant change in the nature of the entity’s operations, we consider it appropriate to present the information on a like-for-like basis, resulting in reclassifications for related items which were previously included in operating income and operating costs in the income statement. In addition, from 1 April 2019, as a result of amendments to IAS 12 Income Taxes, tax relief on payments in relation to Other Additional Tier 1 securities has been recognised as a reduction in taxation on operating profit before goodwill, acquired intangibles and strategic actions, whereas it was previously recorded directly in retained income. Prior period comparatives have been restated, increasing the profit after taxation for the six months to 30 September 2018 by £1.6 million and for the year to 31 March 2019 by £3.2 million. These reclassifications in the income statement for the prior reported periods and the consequential restated comparatives have been shown in the Restatements table. The net effect on restated earnings attributable to shareholders relates solely to the tax previously included directly in equity which is now being reported in the income statement. The net effect on restated adjusted earnings per share relates to: - the inclusion of the tax relief previously recorded directly in equity which is now being recognised in the income statement; and - the exclusion of the financial impact of the strategic actions which were included in adjusted operating profit in prior periods. There has been no impact to Earnings per share or Headline earnings per share. Restatements table
£'000
Six months to
30 Sept 2018
as previously
reported Reclassification
Six months
to 30 Sept
2018 restated
Year to 31 March
2019 as
previously reported Reclassification
Year to 31 March
2019 restated
Interest income 1 285 916 10 1 285 926 2 641 920 3 2 641 923
Interest expense (880 902) 3 293 (877 609) (1 826 493) 6 902 (1 819 591)
Net interest income 405 014 3 303 408 317 815 427 6 905 822 332
Fee and commission income 804 249 (16 542) 787 707 1 590 004 (26 940) 1 563 064
Fee and commission expense (100 540) (860) (101 400) (216 452) 2 947 (213 505)
Investment income 41 472 23 275 64 747 49 985 57 859 107 844
Share of post taxation profit of associates and joint venture holdings 20 782 (94) 20 688 68 317 (150) 68 167
Trading income arising from
- customer flow 65 078 – 65 078 120 662 – 120 662
- balance sheet management and other trading activities 39 031 416 39 447 41 966 (79) 41 887
Other operating income 6 238 – 6 238 16 431 – 16 431
Total operating income before expected credit loss impairment charges 1 281 324 9 498 1 290 822 2 486 340 40 542 2 526 882
Expected credit loss impairment charges (31 022) – (31 022) (66 452) – (66 452)
Operating income 1 250 302 9 498 1 259 800 2 419 888 40 542 2 460 430
Operating costs (852 982) 11 177 (841 805) (1 695 012) 26 789 (1 668 223)
Depreciation on operating leased assets (1 207) – (1 207) (2 157) – (2 157)
Operating profit before goodwill, acquired intangibles and strategic actions 396 113 20 675 416 788 722 719 67 331 790 050
Impairment of goodwill – – – (155) – (155)
Amortisation of acquired intangibles (7 861) – (7 861) (15 816) – (15 816)
Closure and rundown of the Hong Kong direct investments business – (26 909) (26 909) – (65 593) (65 593)
Operating profit 388 252 (6 234) 382 018 706 748 1 738 708 486
Financial impact of group restructures - 6 234 6 234 (19 543) (1 738) (21 281)
Profit before taxation 388 252 – 388 252 687 205 – 687 205
Taxation on operating profit before goodwill, acquired intangibles and strategic actions (60 301) (2 324) (62 625) (78 210) (9 570) (87 780)
Taxation on goodwill, acquired intangibles and strategic actions 1 577 3 928 5 505 5 979 12 777 18 756
Profit after taxation 329 528 1 604 331 132 614 974 3 207 618 181
Profit attributable to other non-controlling interests (36 846) – (36 846) (58 192) – (58 192)
Profit attributable to Asset Management non-controlling interests (12 828) – (12 828) (25 658) – (25 658)
Earnings attributable to shareholders 279 854 1 604 281 458 531 124 3 207 534 331
Earnings per share (pence)
-Basic 27.6 27.6 52.0 52.0
-Diluted 26.8 26.8 50.9 50.9
Adjusted earnings per share (pence)
-Basic 28.3 30.1 55.1 60.9
-Diluted 27.5 29.2 54.0 59.7
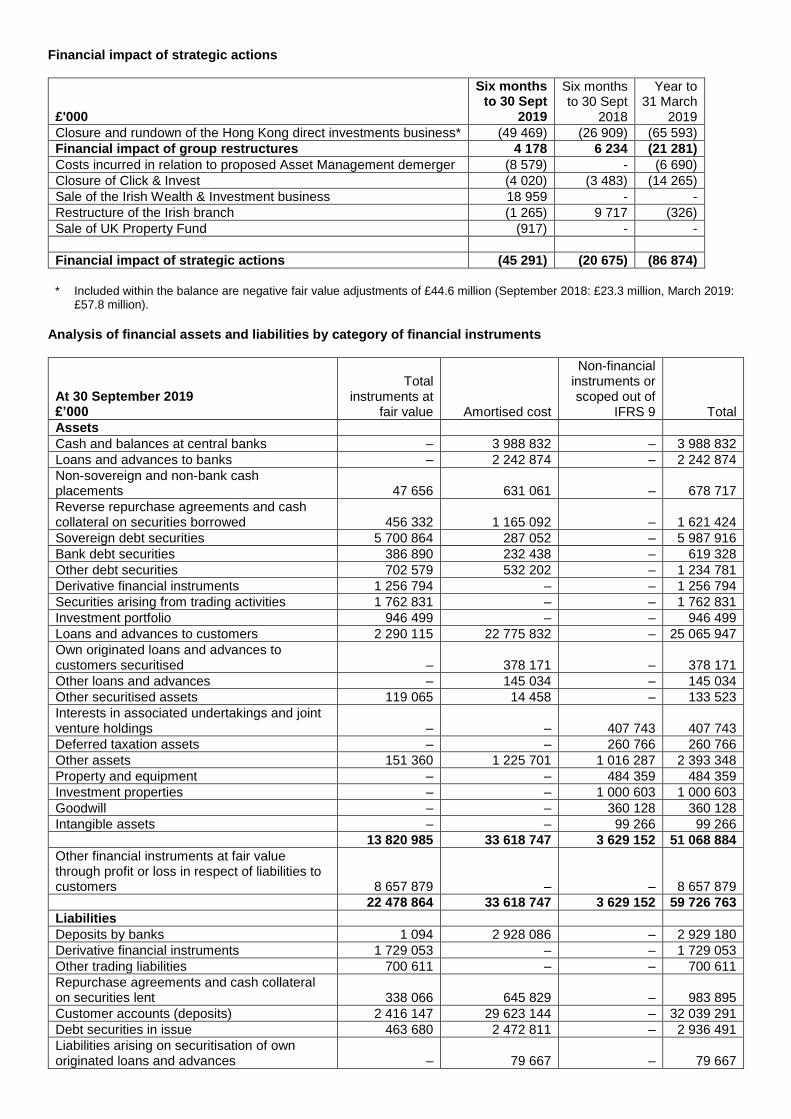
Financial impact of strategic actions
£'000
Six months to 30 Sept
2019
Six months to 30 Sept
2018
Year to 31 March
2019
Closure and rundown of the Hong Kong direct investments business* (49 469) (26 909) (65 593)
Financial impact of group restructures 4 178 6 234 (21 281)
Costs incurred in relation to proposed Asset Management demerger (8 579) - (6 690)
Closure of Click & Invest (4 020) (3 483) (14 265)
Sale of the Irish Wealth & Investment business 18 959 - -
Restructure of the Irish branch (1 265) 9 717 (326)
Sale of UK Property Fund (917) - -
Financial impact of strategic actions (45 291) (20 675) (86 874)
* Included within the balance are negative fair value adjustments of £44.6 million (September 2018: £23.3 million, March 2019:
£57.8 million).
Analysis of financial assets and liabilities by category of financial instruments
At 30 September 2019 £’000
Total instruments at
fair value Amortised cost
Non-financial instruments or scoped out of
IFRS 9 Total
Assets
Cash and balances at central banks – 3 988 832 – 3 988 832
Loans and advances to banks – 2 242 874 – 2 242 874
Non-sovereign and non-bank cash placements 47 656 631 061 – 678 717
Reverse repurchase agreements and cash collateral on securities borrowed 456 332 1 165 092 – 1 621 424
Sovereign debt securities 5 700 864 287 052 – 5 987 916
Bank debt securities 386 890 232 438 – 619 328
Other debt securities 702 579 532 202 – 1 234 781
Derivative financial instruments 1 256 794 – – 1 256 794
Securities arising from trading activities 1 762 831 – – 1 762 831
Investment portfolio 946 499 – – 946 499
Loans and advances to customers 2 290 115 22 775 832 – 25 065 947
Own originated loans and advances to customers securitised – 378 171 – 378 171
Other loans and advances – 145 034 – 145 034
Other securitised assets 119 065 14 458 – 133 523
Interests in associated undertakings and joint venture holdings – – 407 743 407 743
Deferred taxation assets – – 260 766 260 766
Other assets 151 360 1 225 701 1 016 287 2 393 348
Property and equipment – – 484 359 484 359
Investment properties – – 1 000 603 1 000 603
Goodwill – – 360 128 360 128
Intangible assets – – 99 266 99 266
13 820 985 33 618 747 3 629 152 51 068 884
Other financial instruments at fair value through profit or loss in respect of liabilities to customers 8 657 879 – – 8 657 879
22 478 864 33 618 747 3 629 152 59 726 763
Liabilities
Deposits by banks 1 094 2 928 086 – 2 929 180
Derivative financial instruments 1 729 053 – – 1 729 053
Other trading liabilities 700 611 – – 700 611
Repurchase agreements and cash collateral on securities lent 338 066 645 829 – 983 895
Customer accounts (deposits) 2 416 147 29 623 144 – 32 039 291
Debt securities in issue 463 680 2 472 811 – 2 936 491
Liabilities arising on securitisation of own originated loans and advances – 79 667 – 79 667
Liabilities arising on securitisation of other assets 116 544 – – 116 544
Current taxation liabilities – – 166 482 166 482
Deferred taxation liabilities – – 23 194 23 194
Other liabilities 44 542 1 166 586 1 187 985 2 399 113
5 809 737 36 916 123 1 377 661 44 103 521
Liabilities to customers under investment contracts 8 650 085 – – 8 650 085
Insurance liabilities, including unit-linked liabilities 7 794 – – 7 794
14 467 616 36 916 123 1 377 661 52 761 400
Subordinated liabilities 378 414 1 216 547 – 1 594 961
14 846 030 38 132 670 1 377 661 54 356 361
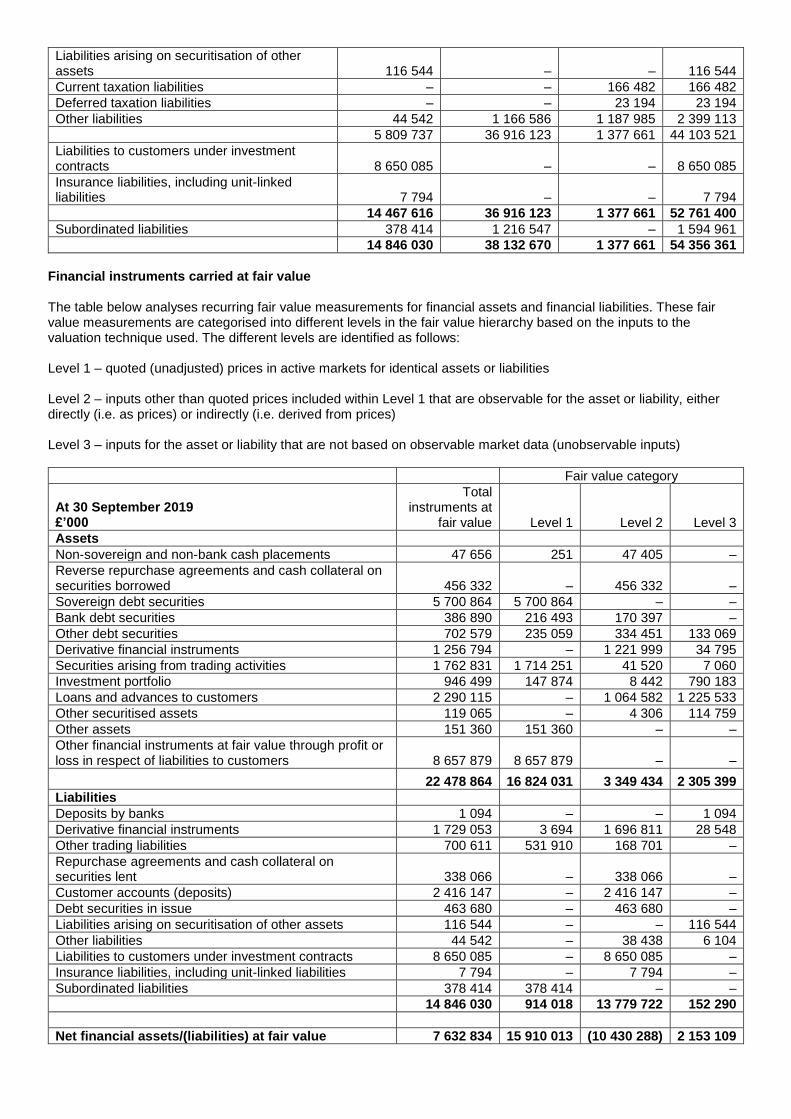
Financial instruments carried at fair value The table below analyses recurring fair value measurements for financial assets and financial liabilities. These fair value measurements are categorised into different levels in the fair value hierarchy based on the inputs to the valuation technique used. The different levels are identified as follows: Level 1 – quoted (unadjusted) prices in active markets for identical assets or liabilities Level 2 – inputs other than quoted prices included within Level 1 that are observable for the asset or liability, either directly (i.e. as prices) or indirectly (i.e. derived from prices) Level 3 – inputs for the asset or liability that are not based on observable market data (unobservable inputs)
Fair value category
At 30 September 2019 £’000
Total instruments at
fair value Level 1 Level 2 Level 3
Assets
Non-sovereign and non-bank cash placements 47 656 251 47 405 –
Reverse repurchase agreements and cash collateral on securities borrowed 456 332 – 456 332 –
Sovereign debt securities 5 700 864 5 700 864 – –
Bank debt securities 386 890 216 493 170 397 –
Other debt securities 702 579 235 059 334 451 133 069
Derivative financial instruments 1 256 794 – 1 221 999 34 795
Securities arising from trading activities 1 762 831 1 714 251 41 520 7 060
Investment portfolio 946 499 147 874 8 442 790 183
Loans and advances to customers 2 290 115 – 1 064 582 1 225 533
Other securitised assets 119 065 – 4 306 114 759
Other assets 151 360 151 360 – –
Other financial instruments at fair value through profit or loss in respect of liabilities to customers 8 657 879 8 657 879 – –
22 478 864 16 824 031 3 349 434 2 305 399
Liabilities
Deposits by banks 1 094 – – 1 094
Derivative financial instruments 1 729 053 3 694 1 696 811 28 548
Other trading liabilities 700 611 531 910 168 701 –
Repurchase agreements and cash collateral on securities lent 338 066 – 338 066 –
Customer accounts (deposits) 2 416 147 – 2 416 147 –
Debt securities in issue 463 680 – 463 680 –
Liabilities arising on securitisation of other assets 116 544 – – 116 544
Other liabilities 44 542 – 38 438 6 104
Liabilities to customers under investment contracts 8 650 085 – 8 650 085 –
Insurance liabilities, including unit-linked liabilities 7 794 – 7 794 –
Subordinated liabilities 378 414 378 414 – –
14 846 030 914 018 13 779 722 152 290
Net financial assets/(liabilities) at fair value 7 632 834 15 910 013 (10 430 288) 2 153 109
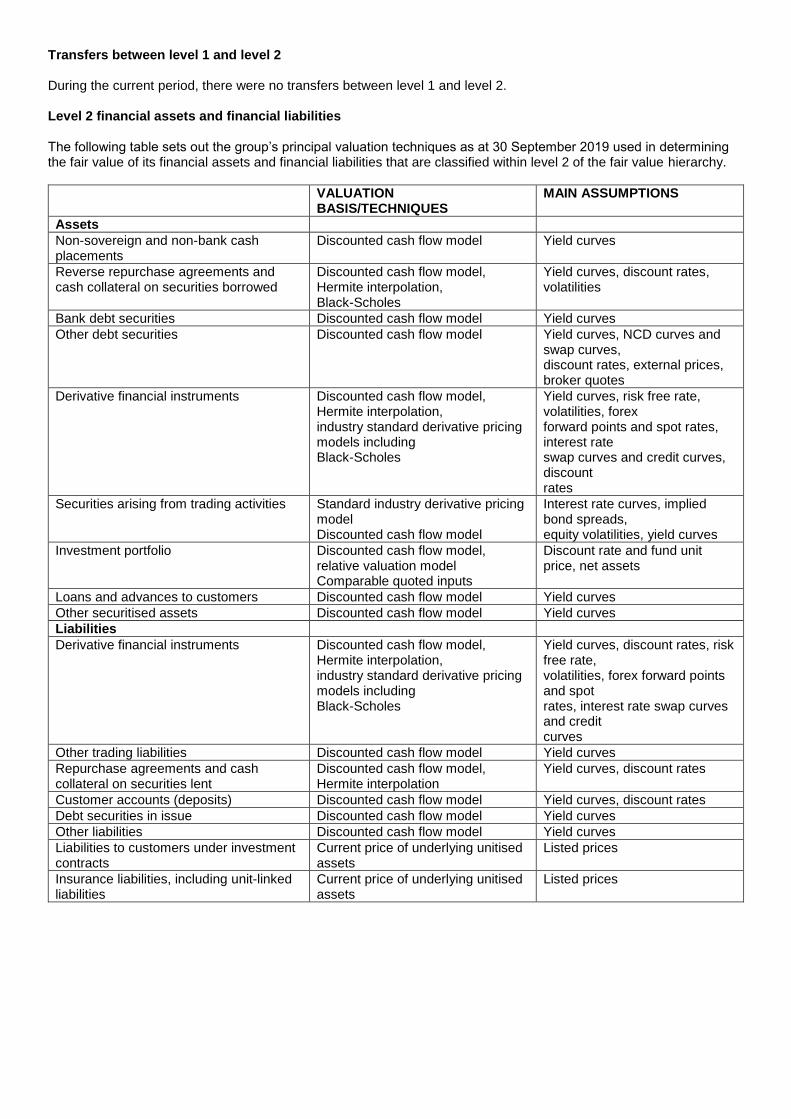
Transfers between level 1 and level 2 During the current period, there were no transfers between level 1 and level 2. Level 2 financial assets and financial liabilities The following table sets out the group’s principal valuation techniques as at 30 September 2019 used in determining the fair value of its financial assets and financial liabilities that are classified within level 2 of the fair value hierarchy.
VALUATION BASIS/TECHNIQUES
MAIN ASSUMPTIONS
Assets
Non-sovereign and non-bank cash placements
Discounted cash flow model Yield curves
Reverse repurchase agreements and cash collateral on securities borrowed
Discounted cash flow model, Hermite interpolation, Black-Scholes
Yield curves, discount rates, volatilities
Bank debt securities Discounted cash flow model Yield curves
Other debt securities Discounted cash flow model Yield curves, NCD curves and swap curves, discount rates, external prices, broker quotes
Derivative financial instruments Discounted cash flow model, Hermite interpolation, industry standard derivative pricing models including Black-Scholes
Yield curves, risk free rate, volatilities, forex forward points and spot rates, interest rate swap curves and credit curves, discount rates
Securities arising from trading activities Standard industry derivative pricing model Discounted cash flow model
Interest rate curves, implied bond spreads, equity volatilities, yield curves
Investment portfolio Discounted cash flow model, relative valuation model Comparable quoted inputs
Discount rate and fund unit price, net assets
Loans and advances to customers Discounted cash flow model Yield curves
Other securitised assets Discounted cash flow model Yield curves
Liabilities
Derivative financial instruments Discounted cash flow model, Hermite interpolation, industry standard derivative pricing models including Black-Scholes
Yield curves, discount rates, risk free rate, volatilities, forex forward points and spot rates, interest rate swap curves and credit curves
Other trading liabilities Discounted cash flow model Yield curves
Repurchase agreements and cash collateral on securities lent
Discounted cash flow model, Hermite interpolation
Yield curves, discount rates
Customer accounts (deposits) Discounted cash flow model Yield curves, discount rates
Debt securities in issue Discounted cash flow model Yield curves
Other liabilities Discounted cash flow model Yield curves
Liabilities to customers under investment contracts
Current price of underlying unitised assets
Listed prices
Insurance liabilities, including unit-linked liabilities
Current price of underlying unitised assets
Listed prices
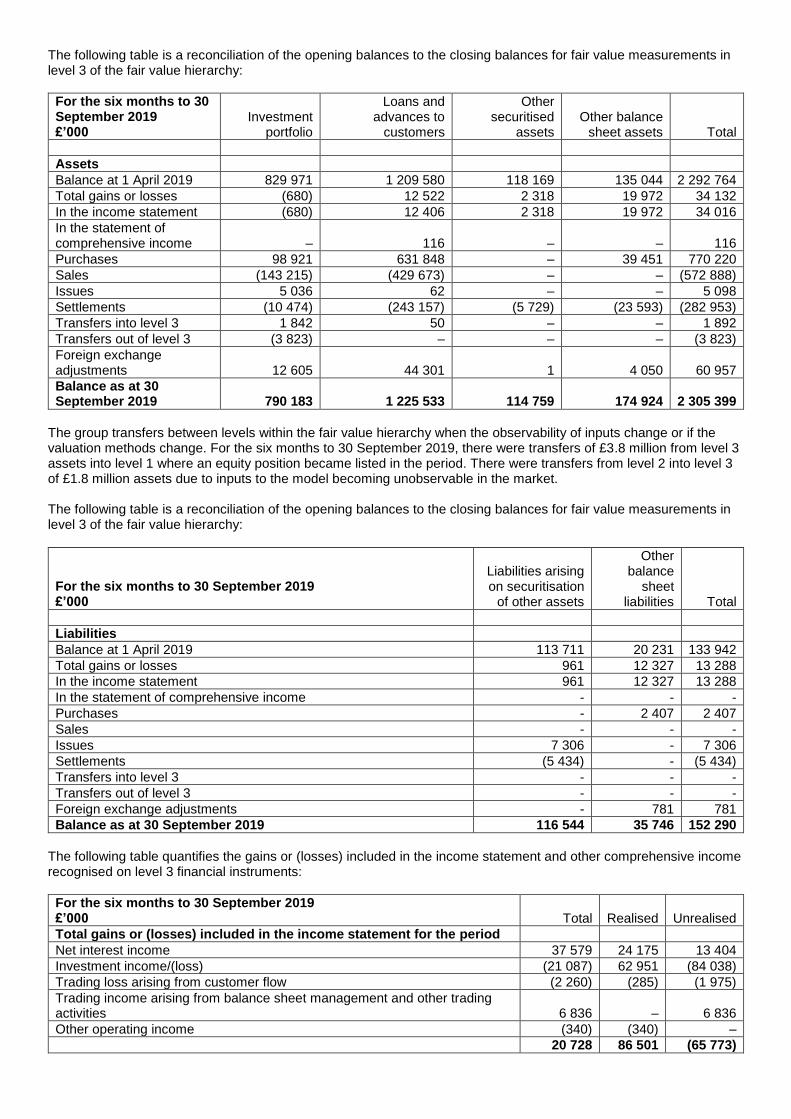
The following table is a reconciliation of the opening balances to the closing balances for fair value measurements in level 3 of the fair value hierarchy:
For the six months to 30 September 2019 £’000
Investment portfolio
Loans and advances to
customers
Other securitised
assets Other balance
sheet assets Total
Assets
Balance at 1 April 2019 829 971 1 209 580 118 169 135 044 2 292 764
Total gains or losses (680) 12 522 2 318 19 972 34 132
In the income statement (680) 12 406 2 318 19 972 34 016
In the statement of comprehensive income – 116 – – 116
Purchases 98 921 631 848 – 39 451 770 220
Sales (143 215) (429 673) – – (572 888)
Issues 5 036 62 – – 5 098
Settlements (10 474) (243 157) (5 729) (23 593) (282 953)
Transfers into level 3 1 842 50 – – 1 892
Transfers out of level 3 (3 823) – – – (3 823)
Foreign exchange adjustments 12 605 44 301 1 4 050 60 957
Balance as at 30 September 2019 790 183 1 225 533 114 759 174 924 2 305 399
The group transfers between levels within the fair value hierarchy when the observability of inputs change or if the valuation methods change. For the six months to 30 September 2019, there were transfers of £3.8 million from level 3 assets into level 1 where an equity position became listed in the period. There were transfers from level 2 into level 3 of £1.8 million assets due to inputs to the model becoming unobservable in the market. The following table is a reconciliation of the opening balances to the closing balances for fair value measurements in level 3 of the fair value hierarchy:
For the six months to 30 September 2019 £’000
Liabilities arising on securitisation
of other assets
Other balance
sheet liabilities Total
Liabilities
Balance at 1 April 2019 113 711 20 231 133 942
Total gains or losses 961 12 327 13 288
In the income statement 961 12 327 13 288
In the statement of comprehensive income - - -
Purchases - 2 407 2 407
Sales - - -
Issues 7 306 - 7 306
Settlements (5 434) - (5 434)
Transfers into level 3 - - -
Transfers out of level 3 - - -
Foreign exchange adjustments - 781 781
Balance as at 30 September 2019 116 544 35 746 152 290
The following table quantifies the gains or (losses) included in the income statement and other comprehensive income recognised on level 3 financial instruments:
For the six months to 30 September 2019 £’000 Total Realised Unrealised
Total gains or (losses) included in the income statement for the period
Net interest income 37 579 24 175 13 404
Investment income/(loss) (21 087) 62 951 (84 038)
Trading loss arising from customer flow (2 260) (285) (1 975)
Trading income arising from balance sheet management and other trading activities 6 836 – 6 836
Other operating income (340) (340) –
20 728 86 501 (65 773)
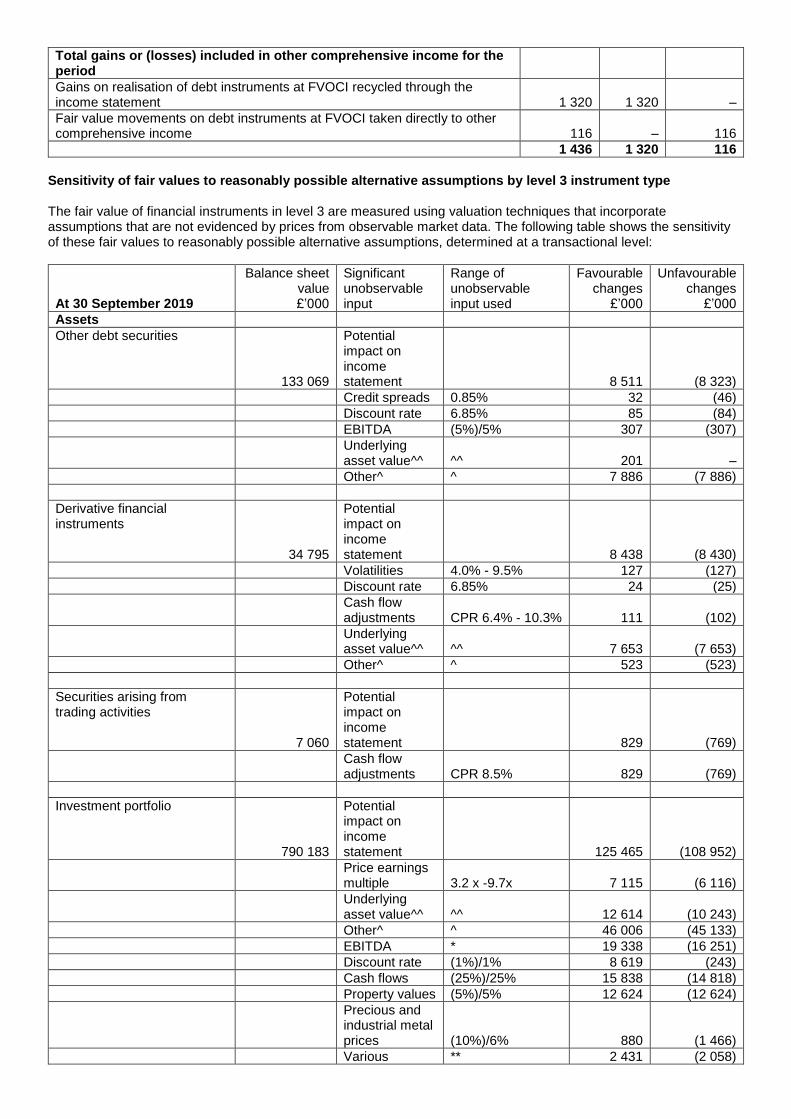
Total gains or (losses) included in other comprehensive income for the period
Gains on realisation of debt instruments at FVOCI recycled through the income statement 1 320 1 320 –
Fair value movements on debt instruments at FVOCI taken directly to other comprehensive income 116 – 116
1 436 1 320 116
Sensitivity of fair values to reasonably possible alternative assumptions by level 3 instrument type The fair value of financial instruments in level 3 are measured using valuation techniques that incorporate assumptions that are not evidenced by prices from observable market data. The following table shows the sensitivity of these fair values to reasonably possible alternative assumptions, determined at a transactional level:
At 30 September 2019
Balance sheet value £’000
Significant unobservable input
Range of unobservable input used
Favourable changes
£’000
Unfavourable changes
£’000
Assets
Other debt securities
133 069
Potential impact on income statement 8 511 (8 323)
Credit spreads 0.85% 32 (46)
Discount rate 6.85% 85 (84)
EBITDA (5%)/5% 307 (307)
Underlying asset value^^ ^^ 201 –
Other^ ^ 7 886 (7 886)
Derivative financial instruments
34 795
Potential impact on income statement 8 438 (8 430)
Volatilities 4.0% - 9.5% 127 (127)
Discount rate 6.85% 24 (25)
Cash flow adjustments CPR 6.4% - 10.3% 111 (102)
Underlying asset value^^ ^^ 7 653 (7 653)
Other^ ^ 523 (523)
Securities arising from trading activities
7 060
Potential impact on income statement 829 (769)
Cash flow adjustments CPR 8.5% 829 (769)
Investment portfolio
790 183
Potential impact on income statement 125 465 (108 952)
Price earnings multiple 3.2 x -9.7x 7 115 (6 116)
Underlying asset value^^ ^^ 12 614 (10 243)
Other^ ^ 46 006 (45 133)
EBITDA * 19 338 (16 251)
Discount rate (1%)/1% 8 619 (243)
Cash flows (25%)/25% 15 838 (14 818)
Property values (5%)/5% 12 624 (12 624)
Precious and industrial metal prices (10%)/6% 880 (1 466)
Various ** 2 431 (2 058)
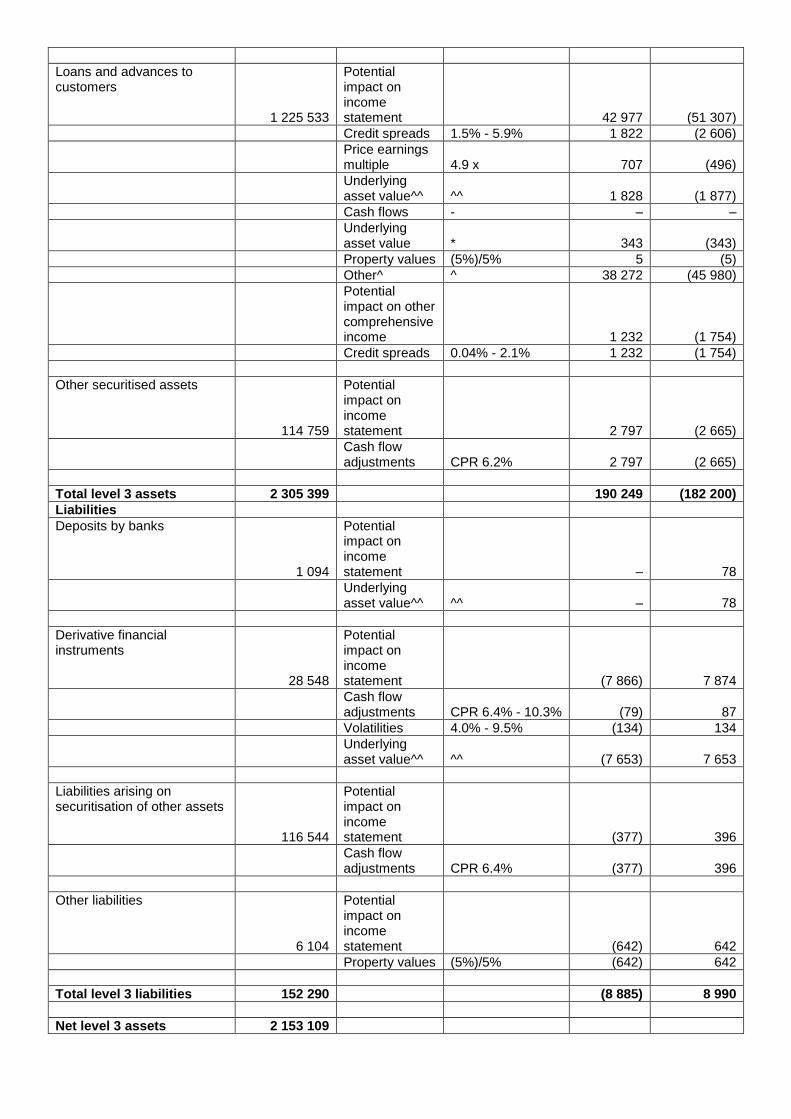
Loans and advances to customers
1 225 533
Potential impact on income statement 42 977 (51 307)
Credit spreads 1.5% - 5.9% 1 822 (2 606)
Price earnings multiple 4.9 x 707 (496)
Underlying asset value^^ ^^ 1 828 (1 877)
Cash flows - – –
Underlying asset value * 343 (343)
Property values (5%)/5% 5 (5)
Other^ ^ 38 272 (45 980)
Potential impact on other comprehensive income 1 232 (1 754)
Credit spreads 0.04% - 2.1% 1 232 (1 754)
Other securitised assets
114 759
Potential impact on income statement 2 797 (2 665)
Cash flow adjustments CPR 6.2% 2 797 (2 665)
Total level 3 assets 2 305 399 190 249 (182 200)
Liabilities
Deposits by banks
1 094
Potential impact on income statement – 78
Underlying asset value^^ ^^ – 78
Derivative financial instruments
28 548
Potential impact on income statement (7 866) 7 874
Cash flow adjustments CPR 6.4% - 10.3% (79) 87
Volatilities 4.0% - 9.5% (134) 134
Underlying asset value^^ ^^ (7 653) 7 653
Liabilities arising on securitisation of other assets
116 544
Potential impact on income statement (377) 396
Cash flow adjustments CPR 6.4% (377) 396
Other liabilities
6 104
Potential impact on income statement (642) 642
Property values (5%)/5% (642) 642
Total level 3 liabilities 152 290 (8 885) 8 990
Net level 3 assets 2 153 109
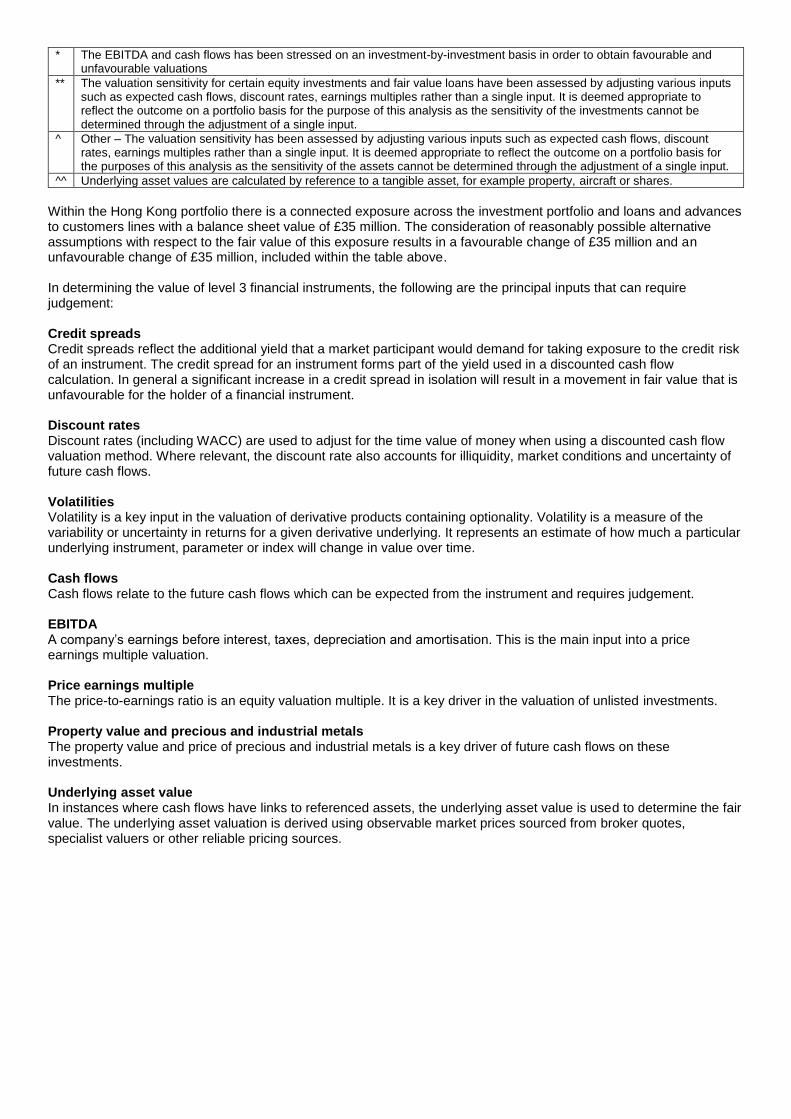
* The EBITDA and cash flows has been stressed on an investment-by-investment basis in order to obtain favourable and unfavourable valuations
** The valuation sensitivity for certain equity investments and fair value loans have been assessed by adjusting various inputs such as expected cash flows, discount rates, earnings multiples rather than a single input. It is deemed appropriate to reflect the outcome on a portfolio basis for the purpose of this analysis as the sensitivity of the investments cannot be determined through the adjustment of a single input.
^ Other – The valuation sensitivity has been assessed by adjusting various inputs such as expected cash flows, discount rates, earnings multiples rather than a single input. It is deemed appropriate to reflect the outcome on a portfolio basis for the purposes of this analysis as the sensitivity of the assets cannot be determined through the adjustment of a single input.
^^ Underlying asset values are calculated by reference to a tangible asset, for example property, aircraft or shares.
Within the Hong Kong portfolio there is a connected exposure across the investment portfolio and loans and advances to customers lines with a balance sheet value of £35 million. The consideration of reasonably possible alternative assumptions with respect to the fair value of this exposure results in a favourable change of £35 million and an unfavourable change of £35 million, included within the table above. In determining the value of level 3 financial instruments, the following are the principal inputs that can require judgement: Credit spreads Credit spreads reflect the additional yield that a market participant would demand for taking exposure to the credit risk of an instrument. The credit spread for an instrument forms part of the yield used in a discounted cash flow calculation. In general a significant increase in a credit spread in isolation will result in a movement in fair value that is unfavourable for the holder of a financial instrument. Discount rates Discount rates (including WACC) are used to adjust for the time value of money when using a discounted cash flow valuation method. Where relevant, the discount rate also accounts for illiquidity, market conditions and uncertainty of future cash flows. Volatilities Volatility is a key input in the valuation of derivative products containing optionality. Volatility is a measure of the variability or uncertainty in returns for a given derivative underlying. It represents an estimate of how much a particular underlying instrument, parameter or index will change in value over time. Cash flows Cash flows relate to the future cash flows which can be expected from the instrument and requires judgement. EBITDA A company’s earnings before interest, taxes, depreciation and amortisation. This is the main input into a price earnings multiple valuation. Price earnings multiple The price-to-earnings ratio is an equity valuation multiple. It is a key driver in the valuation of unlisted investments. Property value and precious and industrial metals The property value and price of precious and industrial metals is a key driver of future cash flows on these investments. Underlying asset value In instances where cash flows have links to referenced assets, the underlying asset value is used to determine the fair value. The underlying asset valuation is derived using observable market prices sourced from broker quotes, specialist valuers or other reliable pricing sources.
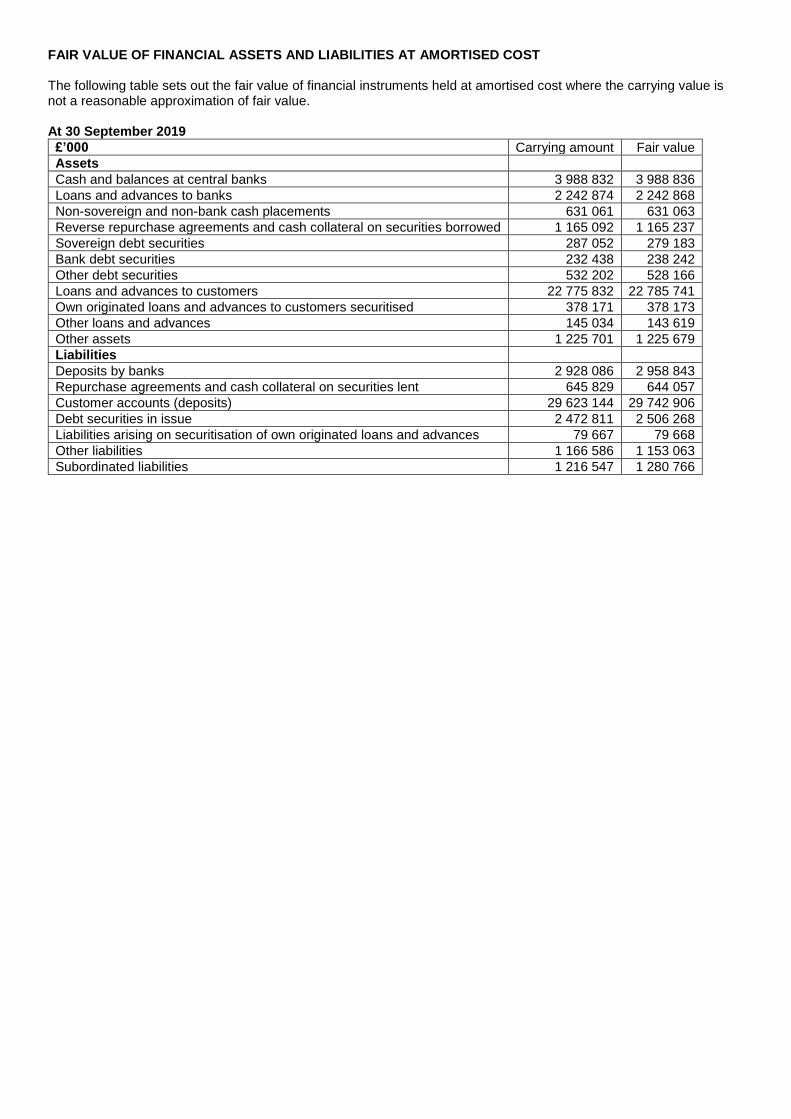
FAIR VALUE OF FINANCIAL ASSETS AND LIABILITIES AT AMORTISED COST The following table sets out the fair value of financial instruments held at amortised cost where the carrying value is not a reasonable approximation of fair value. At 30 September 2019
£’000 Carrying amount Fair value
Assets
Cash and balances at central banks 3 988 832 3 988 836
Loans and advances to banks 2 242 874 2 242 868
Non-sovereign and non-bank cash placements 631 061 631 063
Reverse repurchase agreements and cash collateral on securities borrowed 1 165 092 1 165 237
Sovereign debt securities 287 052 279 183
Bank debt securities 232 438 238 242
Other debt securities 532 202 528 166
Loans and advances to customers 22 775 832 22 785 741
Own originated loans and advances to customers securitised 378 171 378 173
Other loans and advances 145 034 143 619
Other assets 1 225 701 1 225 679
Liabilities
Deposits by banks 2 928 086 2 958 843
Repurchase agreements and cash collateral on securities lent 645 829 644 057
Customer accounts (deposits) 29 623 144 29 742 906
Debt securities in issue 2 472 811 2 506 268
Liabilities arising on securitisation of own originated loans and advances 79 667 79 668
Other liabilities 1 166 586 1 153 063
Subordinated liabilities 1 216 547 1 280 766

Investec plc Incorporated in England and Wales Registration number 3633621 LSE ordinary share code: INVP JSE ordinary share code: INP ISIN: GB00B17BBQ50 LEI: 2138007Z3U5GWDN3MY22 Ordinary share dividend announcement In terms of the DLC structure, Investec plc shareholders registered on the United Kingdom share register may receive all or part of their dividend entitlements through dividends declared and paid by Investec plc on their ordinary shares and/or through dividends declared and paid on the SA DAN share issued by Investec Limited. Investec plc shareholders registered on the South African branch register may receive all or part of their dividend entitlements through dividends declared and paid by Investec plc on their ordinary shares and/or through dividends declared and paid on the SA DAS share issued by Investec Limited. Declaration of dividend number 35 Notice is hereby given that an interim dividend number 35, being a gross dividend of 11 pence (2018: 11 pence) per ordinary share has been declared by the Board from income reserves in respect of the six months ended 30 September 2019 payable to shareholders recorded in the shareholders’ register of the company at the close of business on Friday, 06 December 2019.
for Investec plc shareholders, registered on the United Kingdom share register, through a dividend payment by Investec plc from income reserves of 11 pence per ordinary share
for Investec plc shareholders, registered on the South African branch register, through a dividend payment by Investec Limited, on the SA DAS share, payable from income reserves, equivalent to 11 pence per ordinary share.
The relevant dates for the payment of dividend number 35 are as follows: Last day to trade cum-dividend On the Johannesburg Stock Exchange (JSE) Tuesday, 03 December 2019 On the London Stock Exchange (LSE) Wednesday, 04 December 2019 Shares commence trading ex-dividend On the Johannesburg Stock Exchange (JSE) Wednesday, 04 December 2019 On the London Stock Exchange (LSE) Thursday, 05 December 2019 Record date (on the JSE and LSE) Friday, 06 December 2019 Payment date (on the JSE and LSE) Wednesday, 18 December 2019 Share certificates on the South African branch register may not be dematerialised or rematerialised between Wednesday, 04 December 2019 and Friday, 06 December 2019, both dates inclusive, nor may transfers between the United Kingdom share register and the South African branch register take place between Wednesday, 04 December 2019 and Friday, 06 December 2019, both dates inclusive. Additional information for South African resident shareholders of Investec plc
Shareholders registered on the South African branch register are advised that the distribution of 11 pence, equivalent to a gross dividend of 211 cents per share, has been arrived at using the Rand/Pound Sterling average buy/sell forward rate, as determined at 11h00 (SA time) on Wednesday, 20 November 2019
Investec plc United Kingdom tax reference number: 2683967322360
The issued ordinary share capital of Investec plc is 696 082 618 ordinary shares
The dividend paid by Investec plc to South African resident shareholders registered on the South African branch register and the dividend paid by Investec Limited to Investec plc shareholders on the SA DAS share are subject to South African Dividend Tax (Dividend Tax) of 20% (subject to any available exemptions as legislated)
Shareholders registered on the South African branch register who are exempt from paying the Dividend Tax will receive a net dividend of 211.00000 cents per share paid by Investec Limited on the SA DAS share
Shareholders registered on the South African branch register who are not exempt from paying the Dividend Tax will receive a net dividend of 168.80000 cents per share (gross dividend of 211.00000 cents per share less Dividend Tax of 42.20000 cents per share) paid by Investec Limited on the SA DAS share.
By order of the board
D Miller Company Secretary 20 November 2019
Investec plc Incorporated in England and Wales Registration number: 3633621 Share code: INPP ISIN: GB00B19RX541 LEI: 2138007Z3U5GWDN3MY22 Preference share dividend announcement Non-redeemable non-cumulative non-participating preference shares (“preference shares”) Declaration of dividend number 27 Notice is hereby given that preference dividend number 27 has been declared by the Board from income reserves for the period 01 April 2019 to 30 September 2019 amounting to a gross preference dividend of 8.77397 pence per preference share payable to holders of the non-redeemable non-cumulative non-participating preference shares as recorded in the books of the company at the close of business on Friday, 06 December 2019. For shares trading on the Johannesburg Stock Exchange (JSE), the dividend of 8.77397 pence per preference share is equivalent to a gross dividend of 168.39530 cents per share, which has been determined using the Rand/Pound Sterling average buy/sell forward rate as at 11h00 (SA time) on Wednesday, 20 November 2019. The relevant dates relating to the payment of dividend number 27 are as follows: Last day to trade cum-dividend On the Johannesburg Stock Exchange (JSE) Tuesday, 03 December 2019 On the International Stock Exchange (TISE) Wednesday, 04 December 2019 Shares commence trading ex-dividend On the Johannesburg Stock Exchange (JSE) Wednesday, 04 December 2019 On the International Stock Exchange (TISE) Thursday, 05 December 2019 Record date (on the JSE and TISE) Friday, 06 December 2019 Payment date (on the JSE and TISE) Tuesday, 17 December 2019 Share certificates may not be dematerialised or rematerialised between Wednesday, 04 December 2019 and Friday, 06 December 2019, both dates inclusive, nor may transfers between the United Kingdom share register and the South African branch register take place between Wednesday, 04 December 2019 and Friday, 06 December 2019, both dates inclusive. Additional information for South African resident shareholders of Investec plc
Investec plc United Kingdom tax reference number: 2683967322360
The issued preference share capital of Investec plc is 2 754 587 preference shares
The dividend paid by Investec plc to shareholders recorded on the South African branch register is subject to South African Dividend Tax (Dividend Tax) of 20% (subject to any available exemptions as legislated)
The net dividend amounts to 134.71624 cents per preference share for preference shareholders liable to pay the Dividend Tax and 168.39530 cents per preference share for preference shareholders exempt from paying the Dividend Tax.
By order of the board D Miller Company Secretary 20 November 2019

Investec plc Incorporated in England and Wales Registration number: 3633621 JSE share code: INPPR ISIN: GB00B4B0Q974 LEI: 2138007Z3U5GWDN3MY22 Rand-denominated preference share dividend announcement Rand-denominated non-redeemable non-cumulative non-participating perpetual preference shares (“preference shares”) Declaration of dividend number 17 Notice is hereby given that preference dividend number 17 has been declared by the Board from income reserves for the period 01 April 2019 to 30 September 2019 amounting to a gross preference dividend of 488.20890 cents per preference share payable to holders of the Rand-denominated non-redeemable non-cumulative non-participating perpetual preference shares as recorded in the books of the company at the close of business on Friday, 06 December 2019. The relevant dates relating to the payment of dividend number 17 are as follows: Last day to trade cum-dividend Tuesday, 03 December 2019 Shares commence trading ex-dividend Wednesday, 04 December 2019 Record date Friday, 06 December 2019 Payment date Tuesday, 17 December 2019 Share certificates may not be dematerialised or rematerialised between Wednesday, 04 December 2019 and Friday, 06 December 2019, both dates inclusive. Additional information for South African resident shareholders of Investec plc
Investec plc United Kingdom tax reference number: 2683967322360
The issued Rand-denominated preference share capital of Investec plc is 131 447 preference shares
The dividend paid by Investec plc to shareholders recorded on the South African branch register is subject to South African Dividend Tax (Dividend Tax) of 20% (subject to any available exemptions as legislated)
The net dividend amounts to 390.56712 cents per preference share for preference shareholders liable to pay the Dividend Tax and 488.20890 cents per preference share for preference shareholders exempt from paying the Dividend Tax.
By order of the board D Miller Company Secretary 20 November 2019