Embed Size (px)
Citation preview
An introduction to Investec
The information in this presentation relates to the year ending 31 Mar 2017, unless otherwise indicated.
An overview of the Investec Group
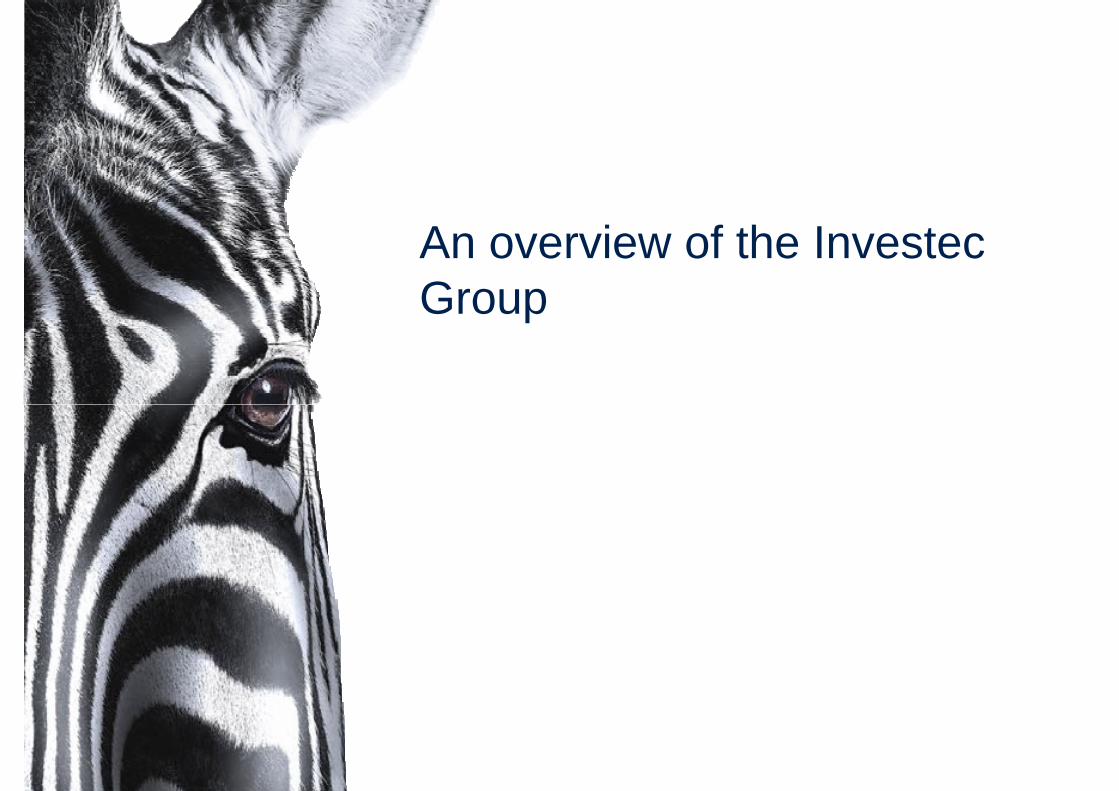
Investec: a distinctive specialist bank and asset manager
3
• Established in 1974• Today, efficient integrated international business platform employing approximately 9 700 people• Listed on the JSE and LSE (a FTSE 250 company)• Total assets of £53.5bn^; total equity*^ £4.8bn; total FUM £150.7bn^
*Including preference shares and non-controlling interests. ^At 31 March 2017.
Facilitating the creation of wealth and management of wealth
Since 1974
Since1992
Assets: £18.7bn
Assets: £38.8bn
Core infrastructureDistribution channels Origination channels
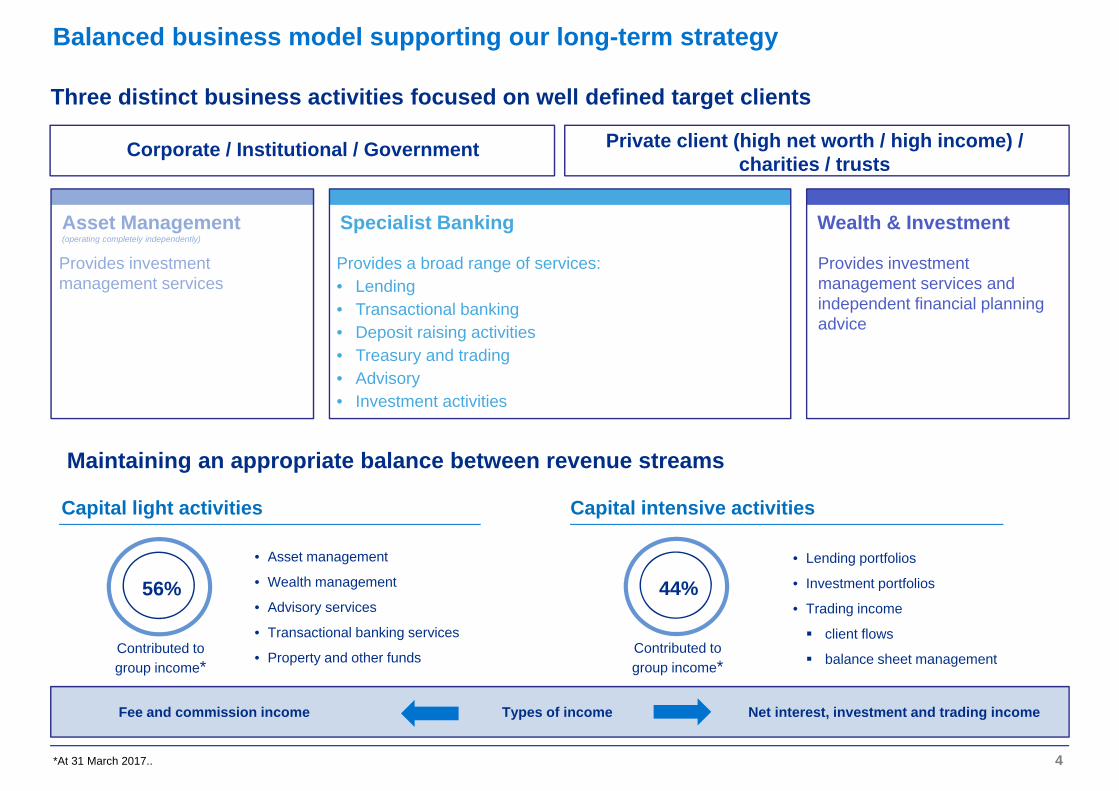
Balanced business model supporting our long-term strategy
4
Corporate / Institutional / Government
Specialist Banking
Provides investment management services
Provides investment management services and independent financial planning advice
Wealth & InvestmentAsset Management(operating completely independently)
Private client (high net worth / high income) / charities / trusts
Three distinct business activities focused on well defined target clients
Provides a broad range of services:
• Lending
• Transactional banking
• Treasury and trading
• Advisory
• Investment activities
56%
Capital light activities
• Asset management
• Wealth management
• Advisory services
• Transactional banking services
• Property and other funds
Capital intensive activities
• Lending portfolios
• Investment portfolios
• Trading income
client flows
balance sheet management
Types of incomeFee and commission income Net interest, investment and trading income
Contributed to group income*
*At 31 March 2017..
Provides a broad range of services:• Lending • Transactional banking• Deposit raising activities• Treasury and trading• Advisory• Investment activities
Specialist Banking
Provides investment management services and independent financial planning advice
Wealth & Investment
Maintaining an appropriate balance between revenue streams
44%
Contributed to group income*

0%
10%
20%
30%
40%
50%
60%
70%
80%
90%
100%
2008 2009 2010 2011 2012 2013 2014 2015 2016 2017
SpecialistBanking
Wealth &Investment
AssetManagement
5*Before goodwill, acquired intangibles, non-operating items, group costs and after other non-controlling interests.
Overall contribution from Asset Management and W&I2017: 40% 2016: 40% 2015: 43% 2014: 46% 2013: 45% 2012: 48%
% contribution to operating profit before tax*
0%
10%
20%
30%
40%
50%
60%
70%
80%
90%
100%
2008 2009 2010 2011 2012 2013 2014 2015 2016 2017
UK and Other
SouthernAfrica
% contribution to operating profit before tax*
Solid recurring income base supported by a diversified portfolio
Across businesses
Across geographies
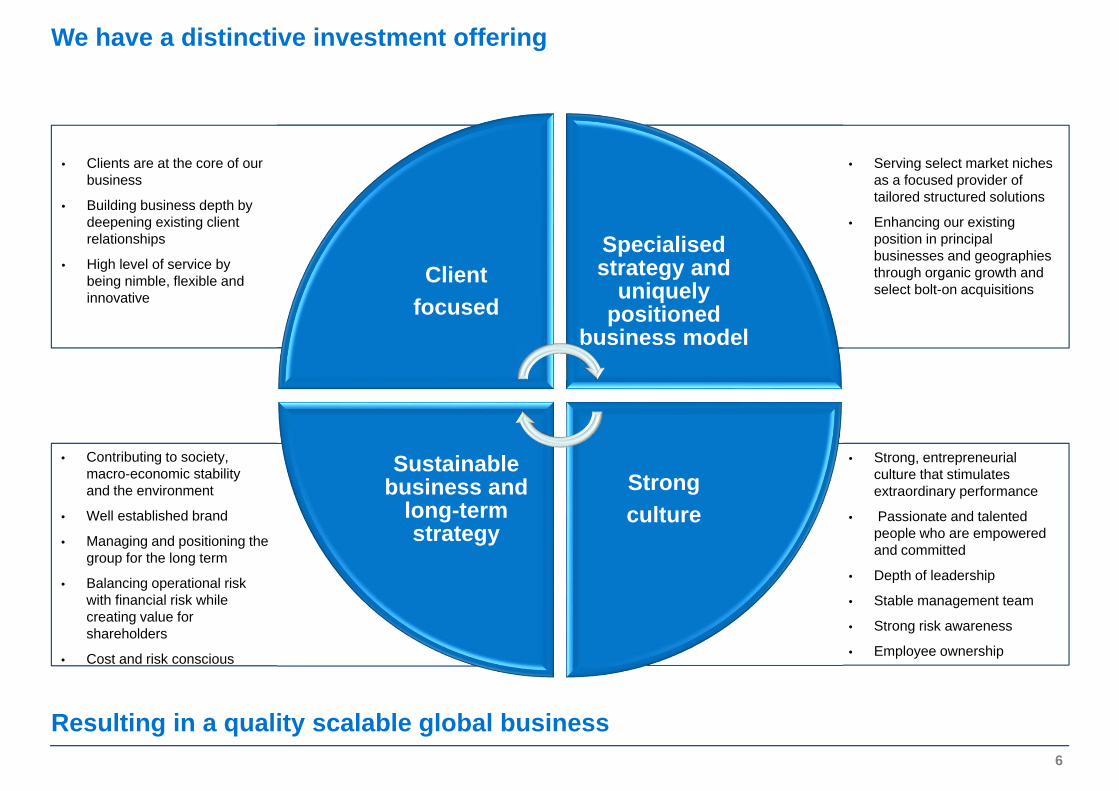
We have a distinctive investment offering
… a quality scalable global business
Client focused
Specialisedstrategy and
uniquely positioned
business model
Strong culture
Sustainable business and
long-term strategy
6
• Clients are at the core of our business
• Building business depth by deepening existing client relationships
• High level of service by being nimble, flexible and innovative
• Serving select market niches as a focused provider of tailored structured solutions
• Enhancing our existing position in principal businesses and geographies through organic growth and select bolt-on acquisitions
• Contributing to society, macro-economic stability and the environment
• Well established brand
• Managing and positioning the group for the long term
• Balancing operational risk with financial risk while creating value for shareholders
• Cost and risk conscious
• Strong, entrepreneurial culture that stimulates extraordinary performance
• Passionate and talented people who are empowered and committed
• Depth of leadership
• Stable management team
• Strong risk awareness
• Employee ownership
Resulting in a quality scalable global business
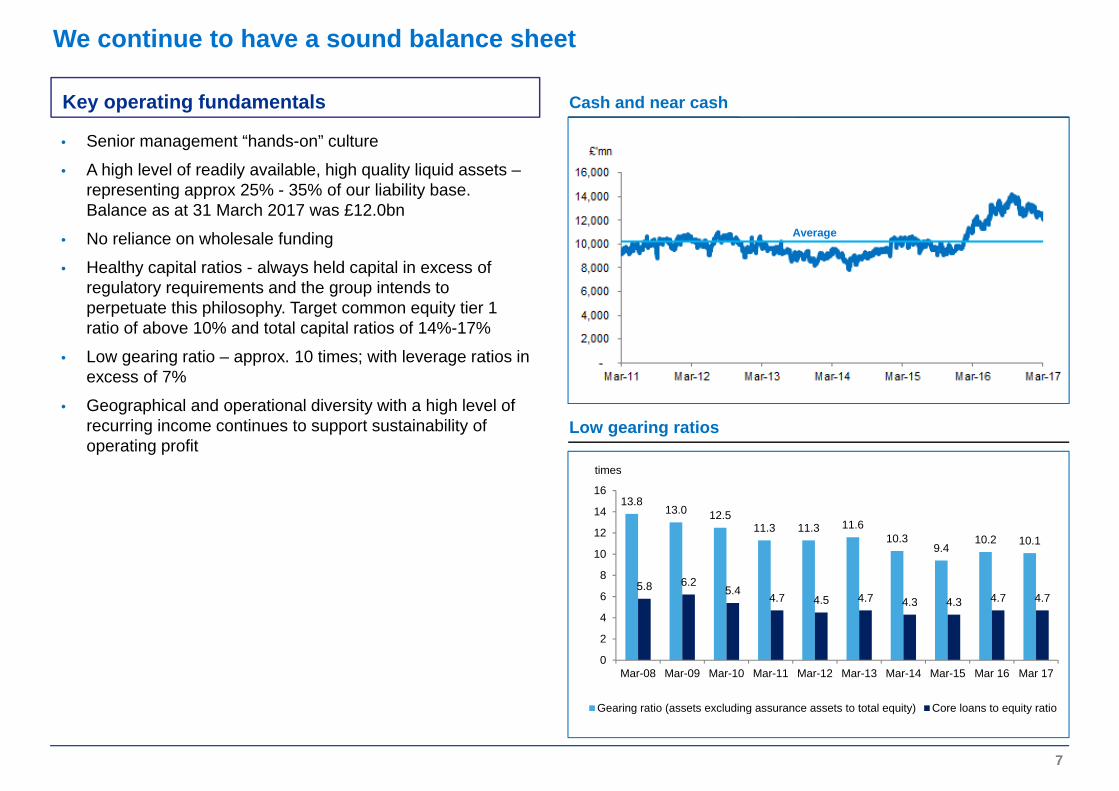
We continue to have a sound balance sheet
13.813.0 12.5
11.3 11.3 11.610.3
9.410.2 10.1
5.8 6.25.4 4.7 4.5 4.7 4.3 4.3 4.7 4.7
0
2
4
6
8
10
12
14
16
Mar-08 Mar-09 Mar-10 Mar-11 Mar-12 Mar-13 Mar-14 Mar-15 Mar 16 Mar 17
times
Gearing ratio (assets excluding assurance assets to total equity) Core loans to equity ratio
7
Average
• Senior management “hands-on” culture
• A high level of readily available, high quality liquid assets –representing approx 25% - 35% of our liability base. Balance as at 31 March 2017 was £12.0bn
• No reliance on wholesale funding
• Healthy capital ratios - always held capital in excess of regulatory requirements and the group intends to perpetuate this philosophy. Target common equity tier 1 ratio of above 10% and total capital ratios of 14%-17%
• Low gearing ratio – approx. 10 times; with leverage ratios in excess of 7%
• Geographical and operational diversity with a high level of recurring income continues to support sustainability of operating profit
Key operating fundamentals Cash and near cash
Low gearing ratios
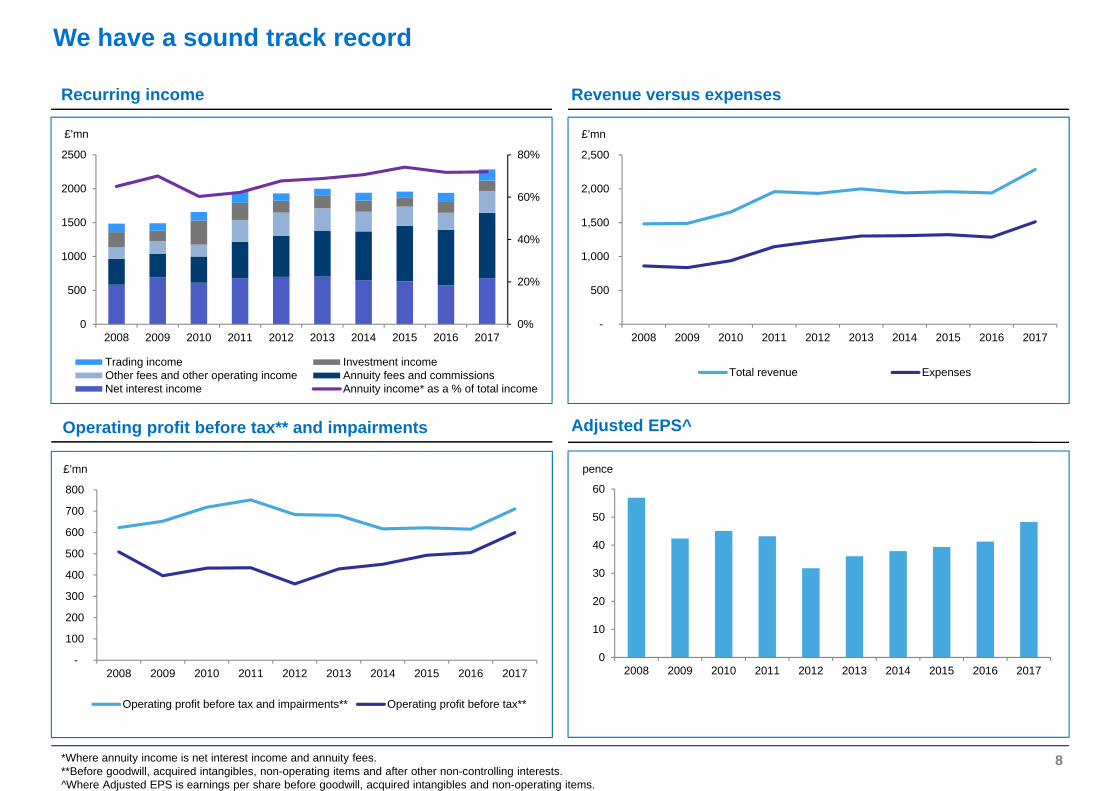
Recurring income
*Where annuity income is net interest income and annuity fees. **Before goodwill, acquired intangibles, non-operating items and after other non-controlling interests.^Where Adjusted EPS is earnings per share before goodwill, acquired intangibles and non-operating items.
We have a sound track record
-
100
200
300
400
500
600
700
800
2008 2009 2010 2011 2012 2013 2014 2015 2016 2017
£’mn
Operating profit before tax and impairments** Operating profit before tax**
-
500
1,000
1,500
2,000
2,500
2008 2009 2010 2011 2012 2013 2014 2015 2016 2017
£’mn
Total revenue Expenses
0%
20%
40%
60%
80%
0
500
1000
1500
2000
2500
2008 2009 2010 2011 2012 2013 2014 2015 2016 2017
£’mn
Trading income Investment incomeOther fees and other operating income Annuity fees and commissionsNet interest income Annuity income* as a % of total income
0
10
20
30
40
50
60
2008 2009 2010 2011 2012 2013 2014 2015 2016 2017
pence
8
Revenue versus expenses
Operating profit before tax** and impairments Adjusted EPS^
Results are shown for the year-ended 31 March, unless otherwise indicated.Currency neutral basis: calculation assumes that the closing exchange rates of the group’s relevant exchange rates remain the same as at 31 March 2017 when compared to 31 March 2016.
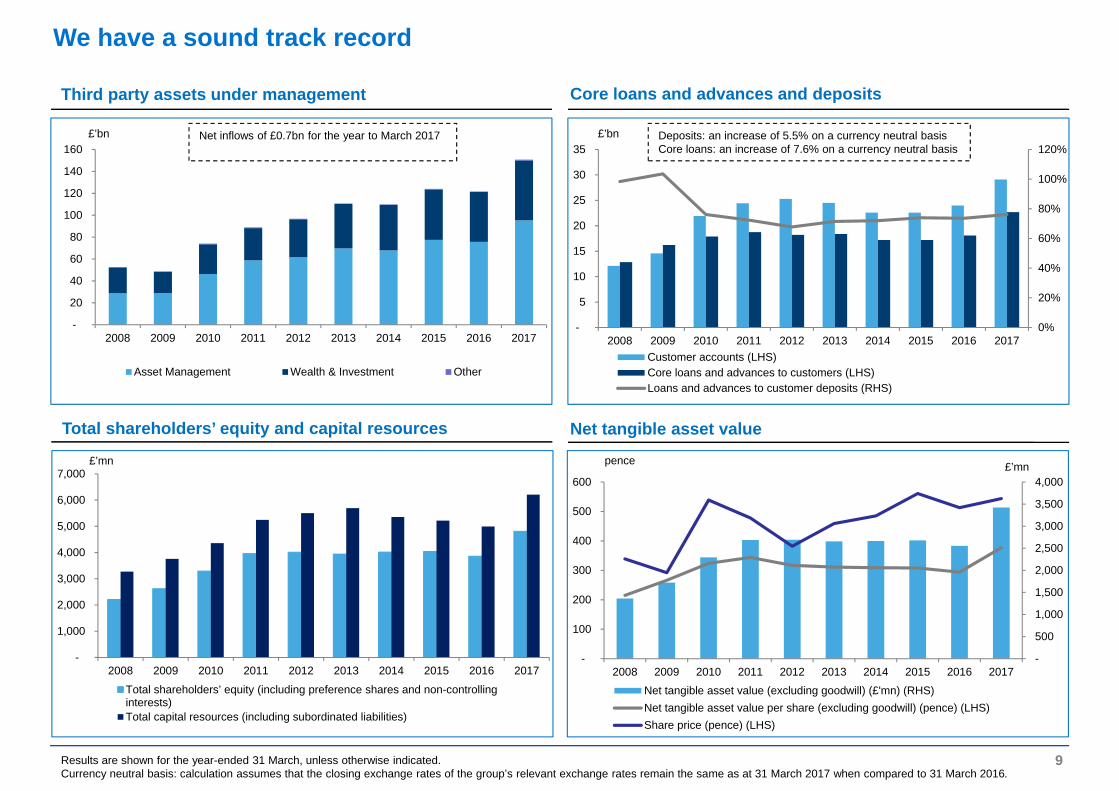
We have a sound track record
Total shareholders’ equity and capital resources
-
1,000
2,000
3,000
4,000
5,000
6,000
7,000
2008 2009 2010 2011 2012 2013 2014 2015 2016 2017
£’mn
Total shareholders’ equity (including preference shares and non-controlling interests) Total capital resources (including subordinated liabilities)
Third party assets under management Core loans and advances and deposits
-
20
40
60
80
100
120
140
160
2008 2009 2010 2011 2012 2013 2014 2015 2016 2017
£’bn
Asset Management Wealth & Investment Other
0%
20%
40%
60%
80%
100%
120%
-
5
10
15
20
25
30
35
2008 2009 2010 2011 2012 2013 2014 2015 2016 2017
£’bn
Customer accounts (LHS)Core loans and advances to customers (LHS)Loans and advances to customer deposits (RHS)
Net tangible asset value
-
500
1,000
1,500
2,000
2,500
3,000
3,500
4,000
-
100
200
300
400
500
600
2008 2009 2010 2011 2012 2013 2014 2015 2016 2017
£’mnpence
Net tangible asset value (excluding goodwill) (£'mn) (RHS)Net tangible asset value per share (excluding goodwill) (pence) (LHS)Share price (pence) (LHS)
9
Net inflows of £0.7bn for the year to March 2017 Deposits: an increase of 5.5% on a currency neutral basisCore loans: an increase of 7.6% on a currency neutral basis

10
We have invested in our Brand
…our Communities
… and the Planet
…our People
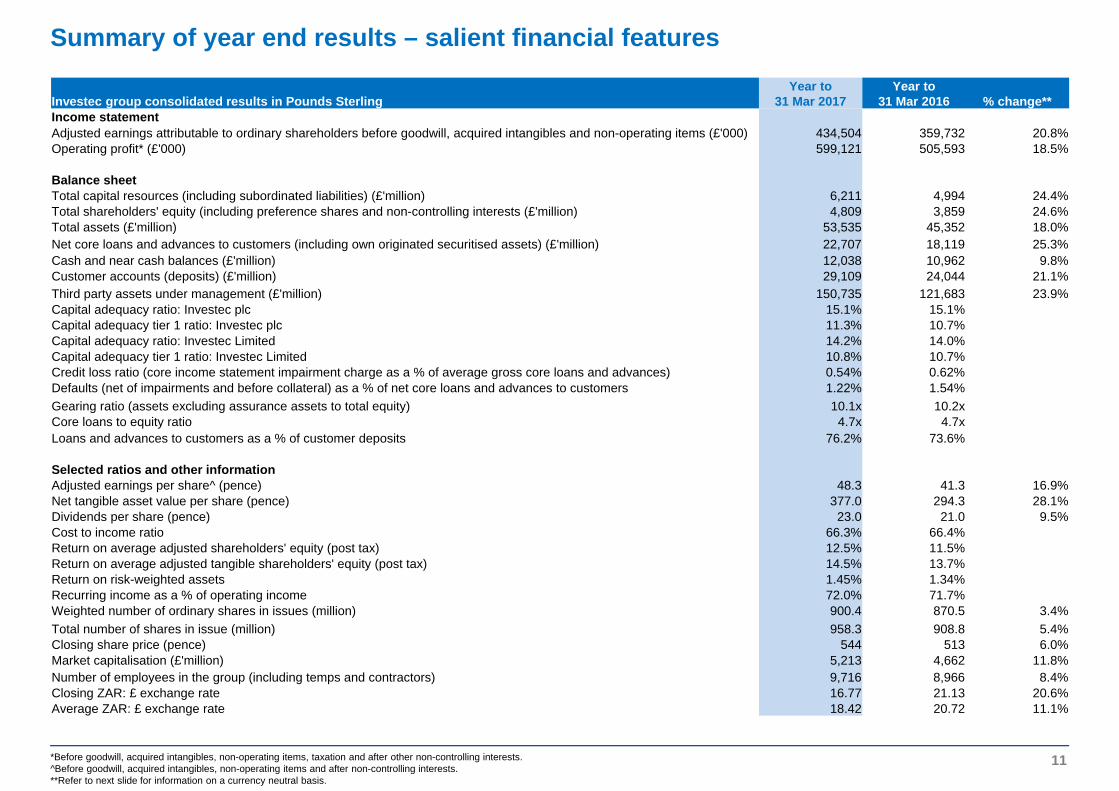
Summary of year end results – salient financial features
*Before goodwill, acquired intangibles, non-operating items, taxation and after other non-controlling interests.^Before goodwill, acquired intangibles, non-operating items and after non-controlling interests.**Refer to next slide for information on a currency neutral basis.
11
Investec group consolidated results in Pounds SterlingYear to
31 Mar 2017Year to
31 Mar 2016 % change**Income statementAdjusted earnings attributable to ordinary shareholders before goodwill, acquired intangibles and non-operating items (£'000) 434,504 359,732 20.8%Operating profit* (£'000) 599,121 505,593 18.5%
Balance sheetTotal capital resources (including subordinated liabilities) (£'million) 6,211 4,994 24.4%Total shareholders' equity (including preference shares and non-controlling interests (£'million) 4,809 3,859 24.6%Total assets (£'million) 53,535 45,352 18.0%Net core loans and advances to customers (including own originated securitised assets) (£'million) 22,707 18,119 25.3%Cash and near cash balances (£'million) 12,038 10,962 9.8%Customer accounts (deposits) (£'million) 29,109 24,044 21.1%Third party assets under management (£'million) 150,735 121,683 23.9%Capital adequacy ratio: Investec plc 15.1% 15.1%Capital adequacy tier 1 ratio: Investec plc 11.3% 10.7%Capital adequacy ratio: Investec Limited 14.2% 14.0%Capital adequacy tier 1 ratio: Investec Limited 10.8% 10.7%Credit loss ratio (core income statement impairment charge as a % of average gross core loans and advances) 0.54% 0.62%Defaults (net of impairments and before collateral) as a % of net core loans and advances to customers 1.22% 1.54%Gearing ratio (assets excluding assurance assets to total equity) 10.1x 10.2xCore loans to equity ratio 4.7x 4.7xLoans and advances to customers as a % of customer deposits 76.2% 73.6%
Selected ratios and other informationAdjusted earnings per share^ (pence) 48.3 41.3 16.9%Net tangible asset value per share (pence) 377.0 294.3 28.1%Dividends per share (pence) 23.0 21.0 9.5%Cost to income ratio 66.3% 66.4%Return on average adjusted shareholders' equity (post tax) 12.5% 11.5%Return on average adjusted tangible shareholders' equity (post tax) 14.5% 13.7%Return on risk-weighted assets 1.45% 1.34%Recurring income as a % of operating income 72.0% 71.7%Weighted number of ordinary shares in issues (million) 900.4 870.5 3.4%Total number of shares in issue (million) 958.3 908.8 5.4%Closing share price (pence) 544 513 6.0%Market capitalisation (£'million) 5,213 4,662 11.8%Number of employees in the group (including temps and contractors) 9,716 8,966 8.4%Closing ZAR: £ exchange rate 16.77 21.13 20.6%Average ZAR: £ exchange rate 18.42 20.72 11.1%
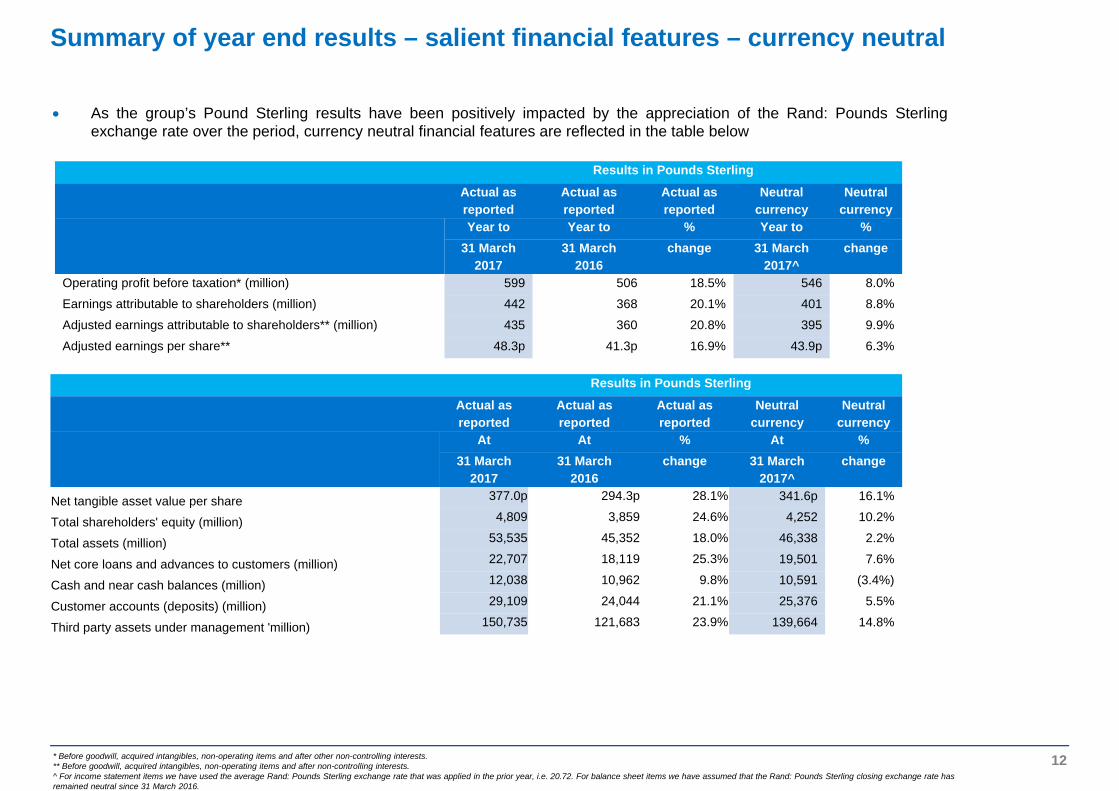
Summary of year end results – salient financial features – currency neutral
12
Results in Pounds Sterling
Actual as reported
Actual as reported
Actual as reported
Neutral currency
Neutral currency
Year to Year to % Year to %31 March
201731 March
2016change 31 March
2017^change
Operating profit before taxation* (million) 599 506 18.5% 546 8.0%
Earnings attributable to shareholders (million) 442 368 20.1% 401 8.8%
Adjusted earnings attributable to shareholders** (million) 435 360 20.8% 395 9.9%
Adjusted earnings per share** 48.3p 41.3p 16.9% 43.9p 6.3%
As the group’s Pound Sterling results have been positively impacted by the appreciation of the Rand: Pounds Sterlingexchange rate over the period, currency neutral financial features are reflected in the table below
Results in Pounds Sterling
Actual as reported
Actual as reported
Actual as reported
Neutral currency
Neutral currency
At At % At %31 March
201731 March
2016change 31 March
2017^change
Net tangible asset value per share 377.0p 294.3p 28.1% 341.6p 16.1%
Total shareholders' equity (million) 4,809 3,859 24.6% 4,252 10.2%
Total assets (million) 53,535 45,352 18.0% 46,338 2.2%
Net core loans and advances to customers (million) 22,707 18,119 25.3% 19,501 7.6%
Cash and near cash balances (million) 12,038 10,962 9.8% 10,591 (3.4%)
Customer accounts (deposits) (million) 29,109 24,044 21.1% 25,376 5.5%
Third party assets under management 'million) 150,735 121,683 23.9% 139,664 14.8%
* Before goodwill, acquired intangibles, non-operating items and after other non-controlling interests.** Before goodwill, acquired intangibles, non-operating items and after non-controlling interests.^ For income statement items we have used the average Rand: Pounds Sterling exchange rate that was applied in the prior year, i.e. 20.72. For balance sheet items we have assumed that the Rand: Pounds Sterling closing exchange rate has remained neutral since 31 March 2016.
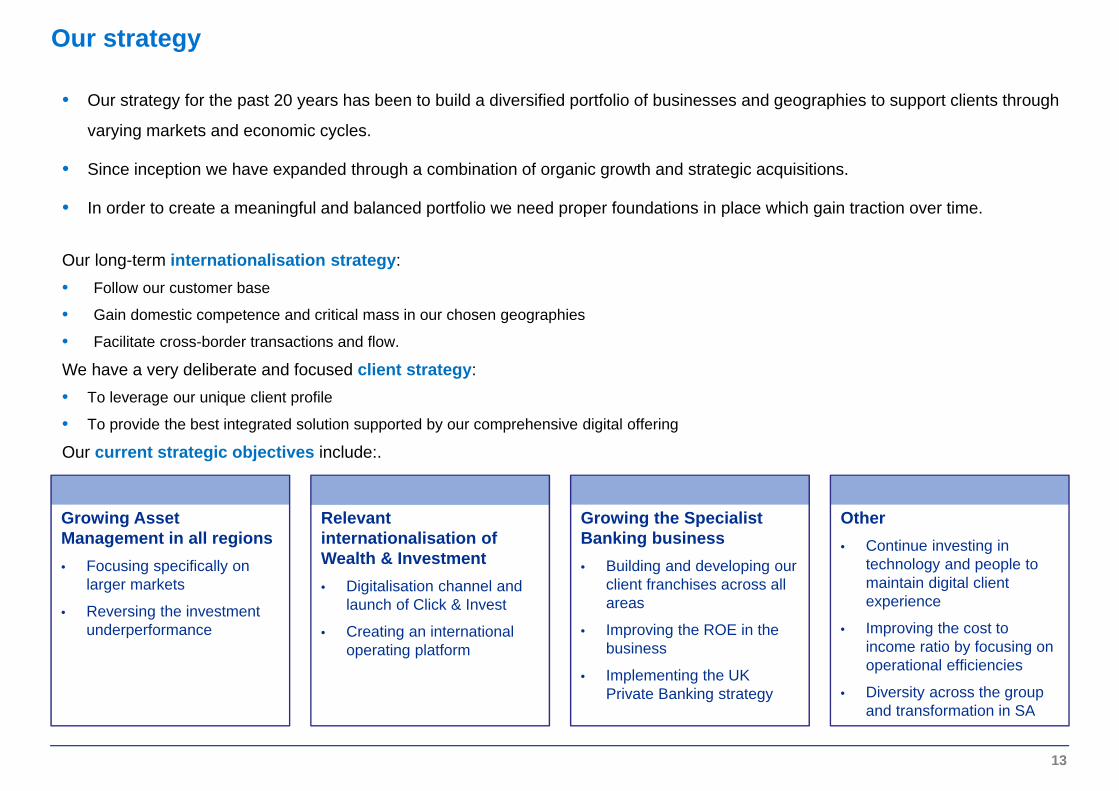
Our strategy
13
• Our strategy for the past 20 years has been to build a diversified portfolio of businesses and geographies to support clients through
varying markets and economic cycles.
• Since inception we have expanded through a combination of organic growth and strategic acquisitions.
• In order to create a meaningful and balanced portfolio we need proper foundations in place which gain traction over time.
Our long-term internationalisation strategy:• Follow our customer base
• Gain domestic competence and critical mass in our chosen geographies
• Facilitate cross-border transactions and flow.
We have a very deliberate and focused client strategy:• To leverage our unique client profile
• To provide the best integrated solution supported by our comprehensive digital offering
Our current strategic objectives include:.
Growing Asset Management in all regions • Focusing specifically on
larger markets
• Reversing the investment underperformance
Growing the Specialist Banking business • Building and developing our
client franchises across all areas
• Improving the ROE in the business
• Implementing the UK Private Banking strategy
Relevant internationalisation of Wealth & Investment • Digitalisation channel and
launch of Click & Invest
• Creating an international operating platform
Other• Continue investing in
technology and people to maintain digital client experience
• Improving the cost to income ratio by focusing on operational efficiencies
• Diversity across the group and transformation in SA
An overview of Investec Bank plc (IBP)
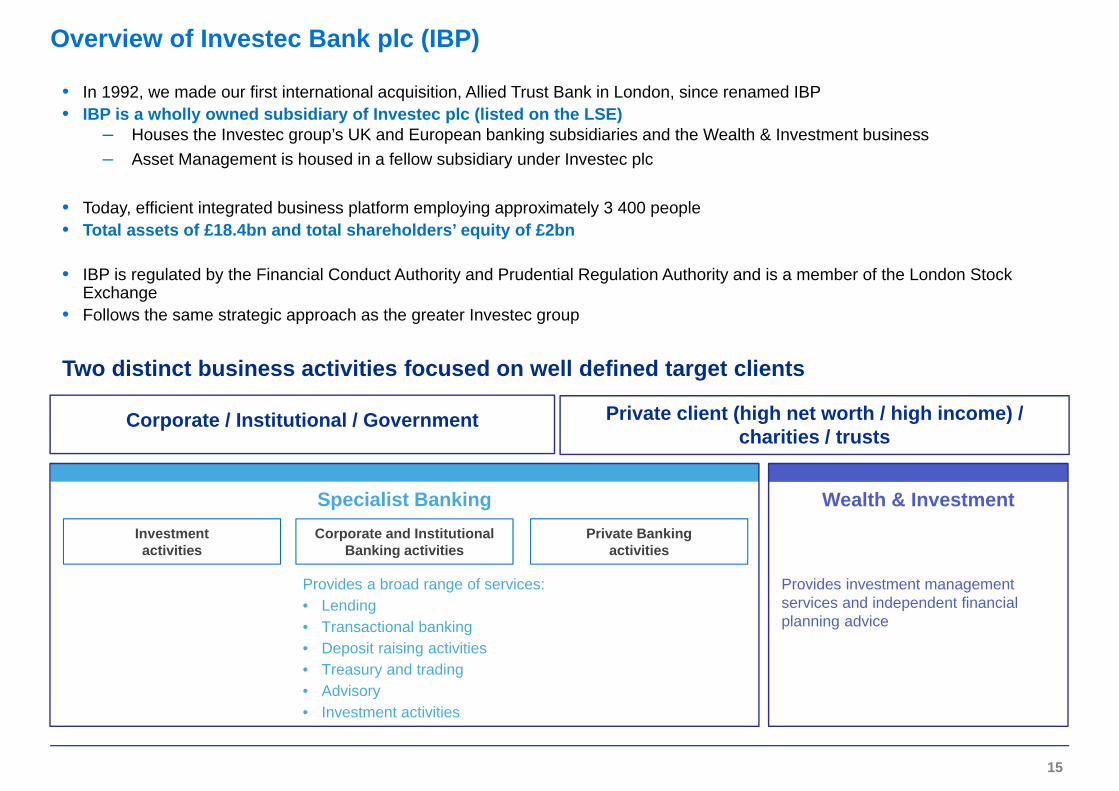
• In 1992, we made our first international acquisition, Allied Trust Bank in London, since renamed IBP• IBP is a wholly owned subsidiary of Investec plc (listed on the LSE)
– Houses the Investec group’s UK and European banking subsidiaries and the Wealth & Investment business– Asset Management is housed in a fellow subsidiary under Investec plc
• Today, efficient integrated business platform employing approximately 3 400 people• Total assets of £18.4bn and total shareholders’ equity of £2bn
• IBP is regulated by the Financial Conduct Authority and Prudential Regulation Authority and is a member of the London Stock Exchange
• Follows the same strategic approach as the greater Investec group
Overview of Investec Bank plc (IBP)
Investment activities
Corporate and Institutional Banking activities
Two distinct business activities focused on well defined target clients
15
Private Bankingactivities
Provides investment management services and independent financial planning advice
Wealth & Investment
Private client (high net worth / high income) / charities / trusts
Corporate / Institutional / Government
Provides a broad range of services:• Lending • Transactional banking• Deposit raising activities• Treasury and trading• Advisory• Investment activities
Specialist Banking

Salient features of Investec’s DLC structure• Investec plc and Investec Limited are separate legal entities and
listings, but are bound together by contractual agreements and mechanisms
• Investec operates as if it is a single unified economic enterprise• The companies have the same Boards of Directors and
management• Shareholders have common economic and voting interests as if
Investec Limited and Investec plc were a single company:– Equivalent dividends on a per share basis– Joint electorate and class right voting
• Creditors are however ring-fenced to either Investec Limited or Investec plc as there are no cross guarantees between the companies
• Regulation of the DLC structure:– The South African Reserve Bank (SARB) is the lead
regulator of the group– The UK Financial Conduct Authority and Prudential
Regulation Authority are the regulators of Investec plc while the SARB is the regulator of Investec Limited
– The Memorandum of Understanding between the two regulators sets out that the role of the lead regulator would change if 70% or more of the on and off balance sheet assets are held by Investec plc
IBP: organisational structure as at 31 March 2017
Investec LimitedListed on JSE SA operations
DLC arrangements
Non-SA and SA resident shareholders
Investec plcListed on LSE
Non-SA operations
Investec Asset Management
Ltd
Various holding companies
Investec Holdings
(Australia)Limited
Investec Irish branch
Investec Bank
(Channel Islands) Ltd
Investec Bank
(Switzerland) AG
Investec Wealth &
Investment Limited
Note: All shareholdings are 100% unless otherwise stated. Only main operating subsidiaries are indicated.*16% is held by senior management in the company.** Before goodwill, acquired intangibles, non-operating items, taxation and after other non-controlling interests.
16
Operating activities key:
Wealth & Investment
Asset Management
Specialist Banking
84%*
Investec Bank plc
% of Total Group:Profit**: 38%Tangible NAV: 45%Assets: 35%Shares in issue: 69%
% of Total Group:Profit**: 62%Tangible NAV: 55%Assets: 65%Shares in issue: 31%
Investec Bank plc: sound balance sheet and operating fundamentals
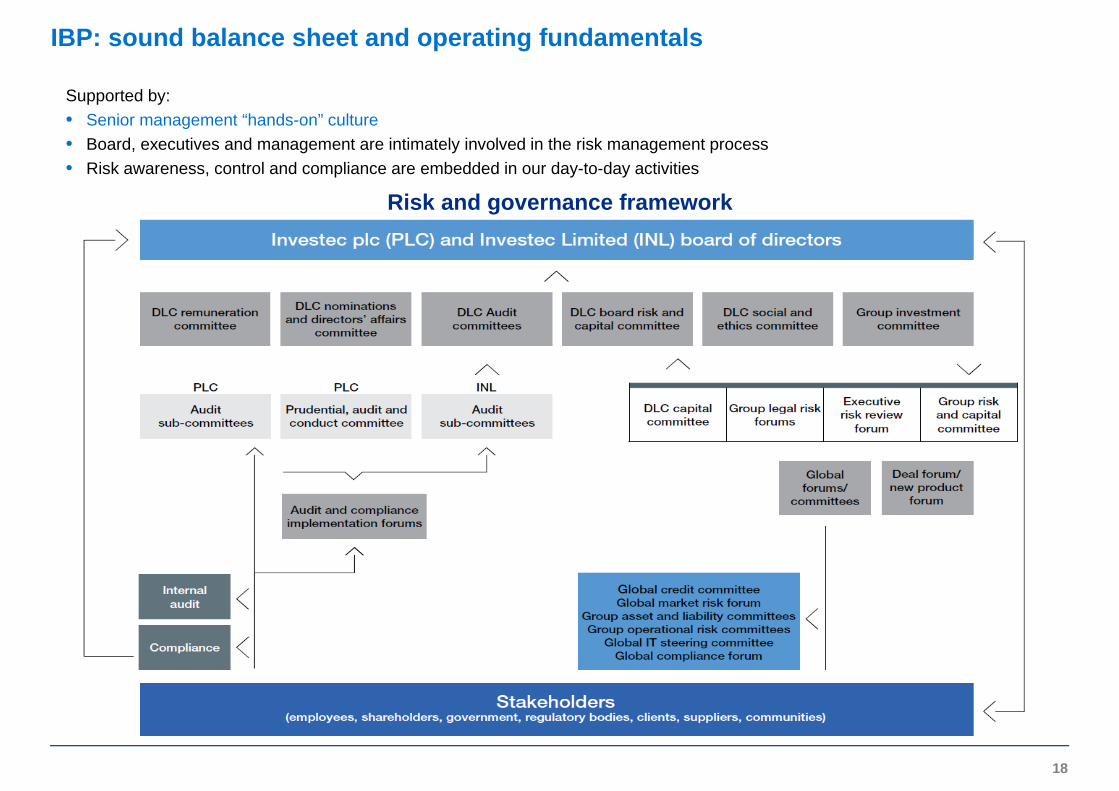
Supported by:• Senior management “hands-on” culture• Board, executives and management are intimately involved in the risk management process• Risk awareness, control and compliance are embedded in our day-to-day activities
IBP: sound balance sheet and operating fundamentals
18
Risk and governance framework
71%64%
53%59%
56% 59% 63% 61% 64%69%
0%
10%
20%
30%
40%
50%
60%
70%
80%
-
5,000
10,000
15,000
20,000
25,000
2008 2009 2010 2011 2012 2013 2014 2015 2016 2017
£’mn
Total assets (LHS)Total risk-weighted assets (LHS)RWA as a percentage of total assets (RHS)
IBP: sound capital base and capital ratios
Basel capital ratios*
14.6%15.9%
16.9% 16.1% 16.8% 16.1% 15.8%17.5% 17.0% 16.6%
6.5% 6.6% 6.5% 6.7% 6.5% 6.6%7.2% 7.5% 7.5% 8.0%
9.1% 10.3%
12.3%11.3% 11.5%
11.1% 10.7%12.1%
11.9%12.2%
0%2%4%6%8%
10%12%14%16%18%20%
2008 2009 2010 2011 2012 2013 2014 2015 2016 2017
%
Capital adequacy ratio Leverage ratio Common equity Tier 1
19
*Since 2014 capital information is based on Basel lll capital requirements as applicable in the UK. Comparative information is disclosed on a Basel ll basis. Since 2014 ratios incorporate the deduction of foreseeable dividends as required in terms of the regulations. The leverage ratio prior to 2014 has been estimated.
Total capital Total risk-weighted assets
-
500
1,000
1,500
2,000
2,500
3,000
2008 2009 2010 2011 2012 2013 2014 2015 2016 2017
£’mn
Total shareholders' equity
Total capital resources (including subordinated liabilities)
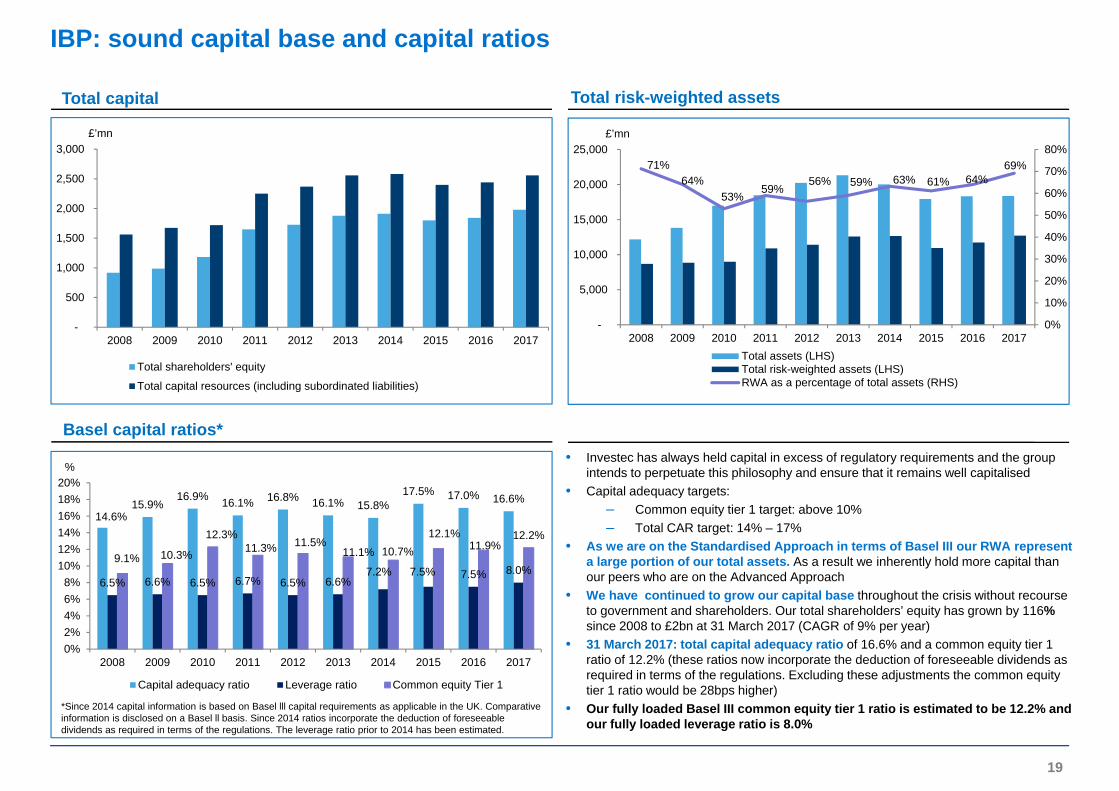
• Investec has always held capital in excess of regulatory requirements and the group intends to perpetuate this philosophy and ensure that it remains well capitalised
• Capital adequacy targets:– Common equity tier 1 target: above 10% – Total CAR target: 14% – 17%
• As we are on the Standardised Approach in terms of Basel III our RWA represent a large portion of our total assets. As a result we inherently hold more capital than our peers who are on the Advanced Approach
• We have continued to grow our capital base throughout the crisis without recourse to government and shareholders. Our total shareholders’ equity has grown by 116%since 2008 to £2bn at 31 March 2017 (CAGR of 9% per year)
• 31 March 2017: total capital adequacy ratio of 16.6% and a common equity tier 1 ratio of 12.2% (these ratios now incorporate the deduction of foreseeable dividends as required in terms of the regulations. Excluding these adjustments the common equity tier 1 ratio would be 28bps higher)
• Our fully loaded Basel III common equity tier 1 ratio is estimated to be 12.2% and our fully loaded leverage ratio is 8.0%
IBP: low gearing ratios
Regulatory leverage ratios - peer group comparisons
Total assets Gearing
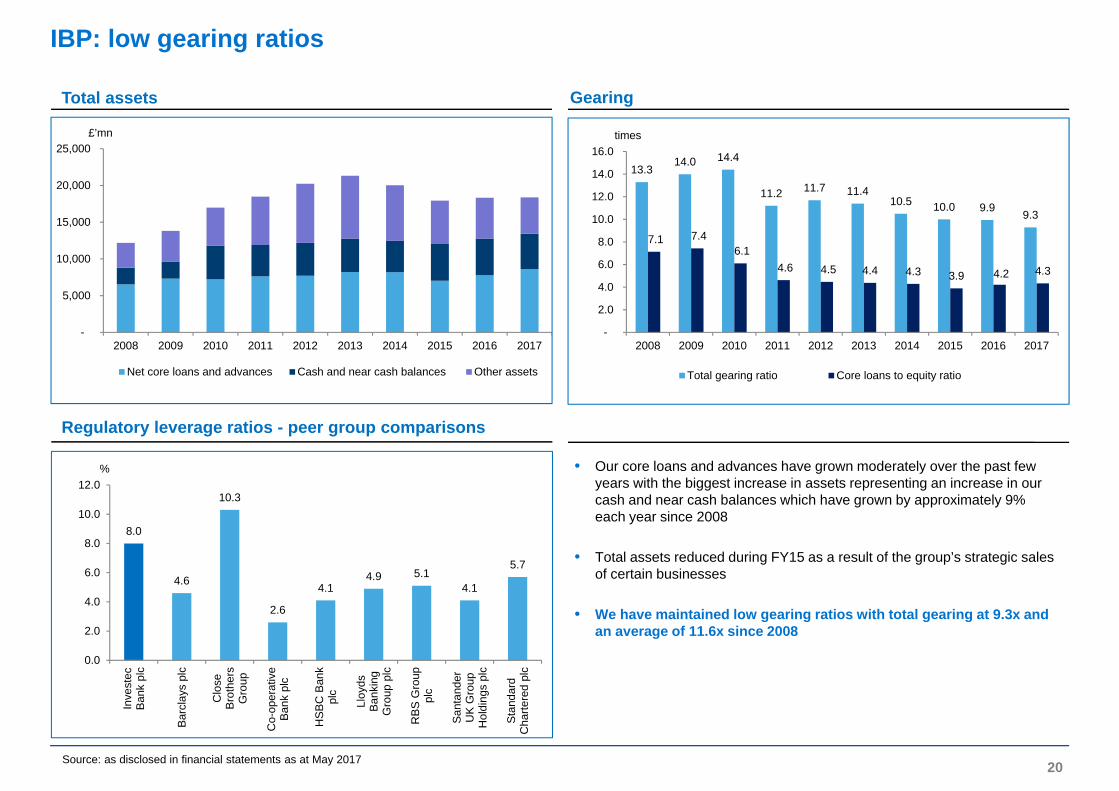
• Our core loans and advances have grown moderately over the past few years with the biggest increase in assets representing an increase in our cash and near cash balances which have grown by approximately 9% each year since 2008
• Total assets reduced during FY15 as a result of the group’s strategic sales of certain businesses
• We have maintained low gearing ratios with total gearing at 9.3x and an average of 11.6x since 2008
-
5,000
10,000
15,000
20,000
25,000
2008 2009 2010 2011 2012 2013 2014 2015 2016 2017
£’mn
Net core loans and advances Cash and near cash balances Other assets
13.314.0 14.4
11.2 11.7 11.410.5 10.0 9.9 9.3
7.1 7.4 6.1
4.6 4.5 4.4 4.3 3.9 4.2 4.3
-
2.0
4.0
6.0
8.0
10.0
12.0
14.0
16.0
2008 2009 2010 2011 2012 2013 2014 2015 2016 2017
times
Total gearing ratio Core loans to equity ratio
20Source: as disclosed in financial statements as at May 2017
8.0
4.6
10.3
2.6
4.14.9 5.1
4.1
5.7
0.0
2.0
4.0
6.0
8.0
10.0
12.0
Inve
stec
Bank
plc
Bar
clay
s pl
c
Clo
seB
roth
ers
Gro
up
Co-
oper
ativ
eBa
nk p
lc
HSB
C B
ank
plc
Lloy
dsBa
nkin
gG
roup
plc
RBS
Gro
uppl
c
Sant
ande
rU
K G
roup
Hol
ding
s pl
c
Stan
dard
Cha
rtere
d pl
c
%
IBP: surplus liquidity
Cash and near cash balances
Total loans and deposits Total deposits – increase in retail deposits
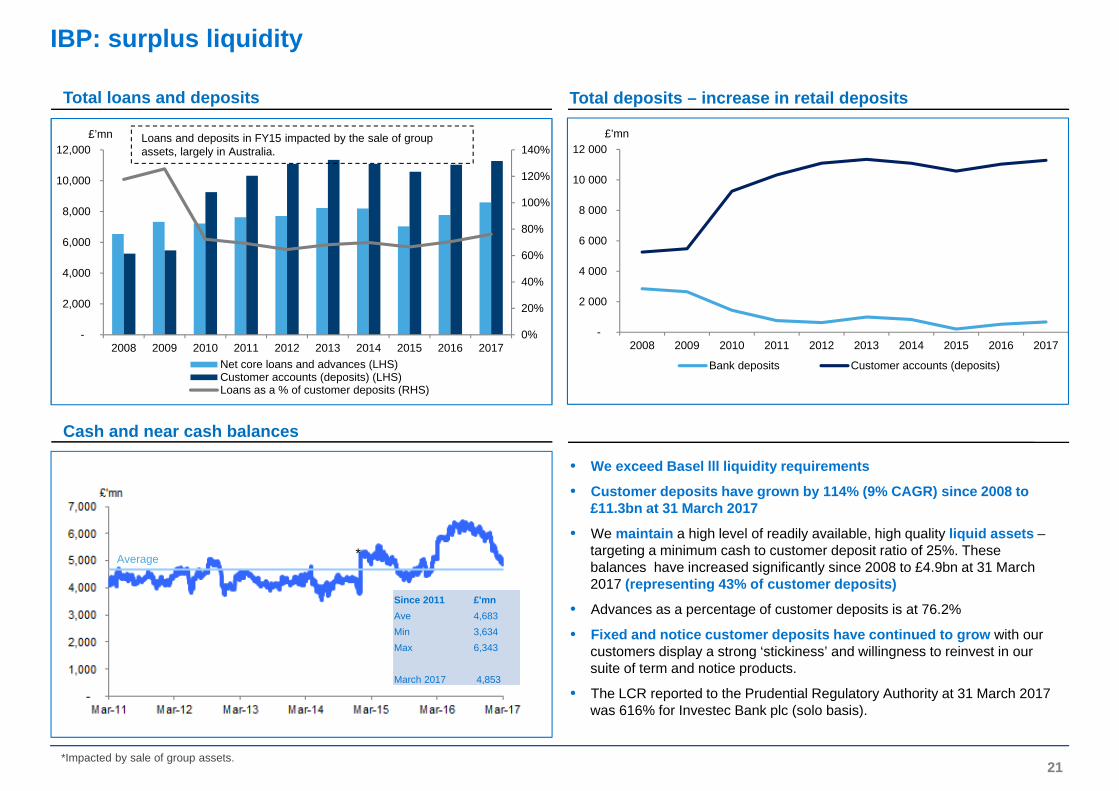
• We exceed Basel lll liquidity requirements
• Customer deposits have grown by 114% (9% CAGR) since 2008 to £11.3bn at 31 March 2017
• We maintain a high level of readily available, high quality liquid assets –targeting a minimum cash to customer deposit ratio of 25%. These balances have increased significantly since 2008 to £4.9bn at 31 March 2017 (representing 43% of customer deposits)
• Advances as a percentage of customer deposits is at 76.2%
• Fixed and notice customer deposits have continued to grow with our customers display a strong ‘stickiness’ and willingness to reinvest in our suite of term and notice products.
• The LCR reported to the Prudential Regulatory Authority at 31 March 2017 was 616% for Investec Bank plc (solo basis).
0%
20%
40%
60%
80%
100%
120%
140%
-
2,000
4,000
6,000
8,000
10,000
12,000
2008 2009 2010 2011 2012 2013 2014 2015 2016 2017
£’mn
Net core loans and advances (LHS)Customer accounts (deposits) (LHS)Loans as a % of customer deposits (RHS)
-
2 000
4 000
6 000
8 000
10 000
12 000
2008 2009 2010 2011 2012 2013 2014 2015 2016 2017
£’mn
Bank deposits Customer accounts (deposits)
21
Since 2011 £'mnAve 4,683Min 3,634Max 6,343
March 2017 4,853
Average
Loans and deposits in FY15 impacted by the sale of group assets, largely in Australia.
*Impacted by sale of group assets.
*
IBP: analysis of our core loan portfolio and counterparty exposures
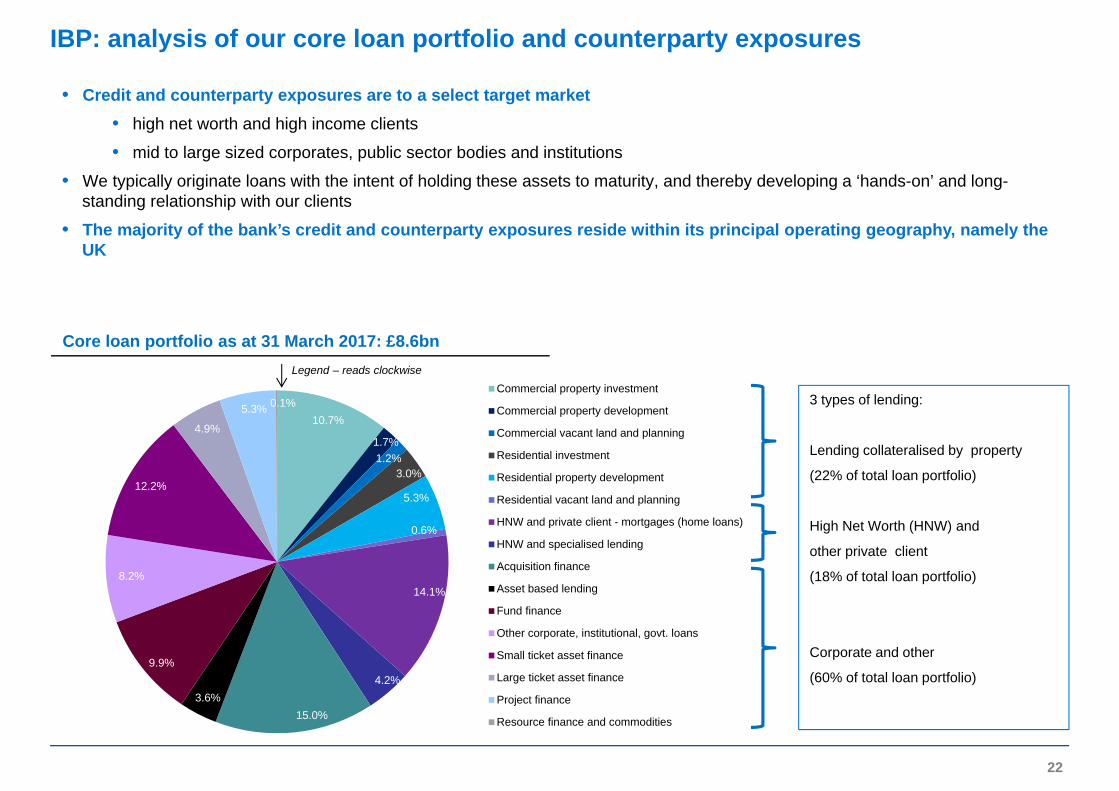
• Credit and counterparty exposures are to a select target market• high net worth and high income clients
• mid to large sized corporates, public sector bodies and institutions
• We typically originate loans with the intent of holding these assets to maturity, and thereby developing a ‘hands-on’ and long-standing relationship with our clients
• The majority of the bank’s credit and counterparty exposures reside within its principal operating geography, namely the UK
Core loan portfolio as at 31 March 2017: £8.6bn
10.7%
1.7%1.2%
3.0%
5.3%
0.6%
14.1%
4.2%
15.0%3.6%
9.9%
8.2%
12.2%
4.9%
5.3% 0.1%Commercial property investment
Commercial property development
Commercial vacant land and planning
Residential investment
Residential property development
Residential vacant land and planning
HNW and private client - mortgages (home loans)
HNW and specialised lending
Acquisition finance
Asset based lending
Fund finance
Other corporate, institutional, govt. loans
Small ticket asset finance
Large ticket asset finance
Project finance
Resource finance and commodities
Legend – reads clockwise
3 types of lending:
Lending collateralised by property
(22% of total loan portfolio)
High Net Worth (HNW) and
other private client
(18% of total loan portfolio)
Corporate and other
(60% of total loan portfolio)
22
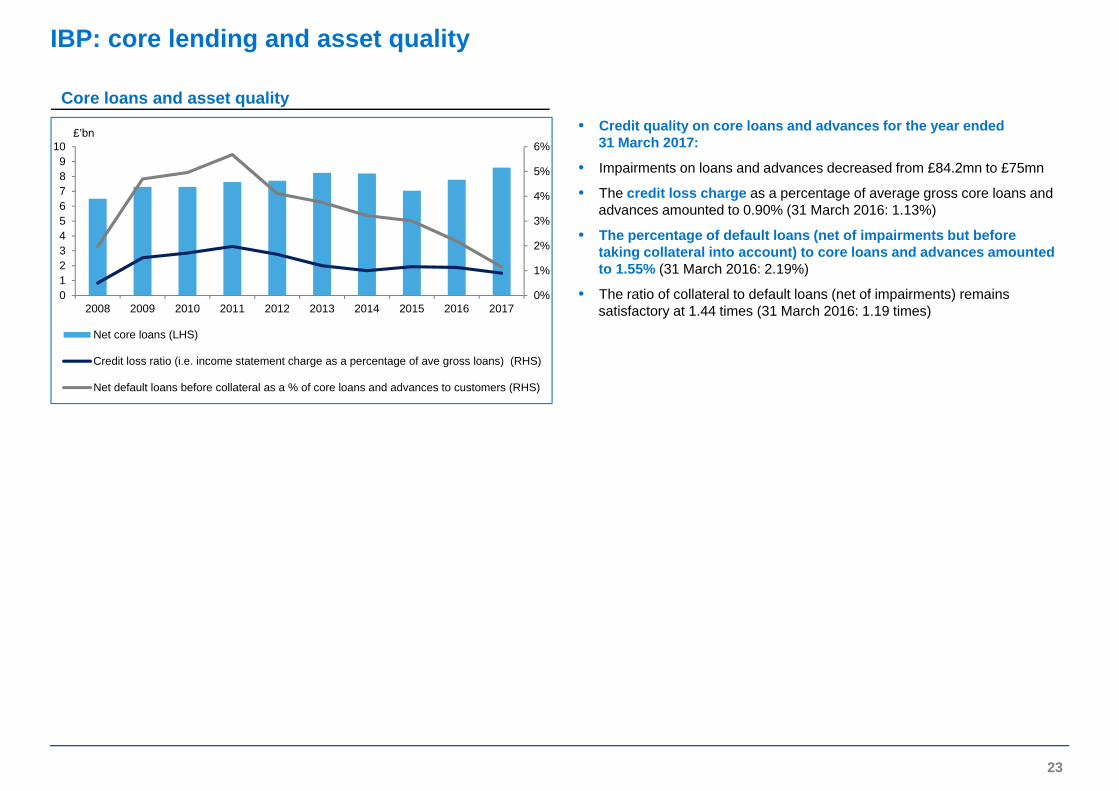
IBP: core lending and asset quality
Core loans and asset quality• Credit quality on core loans and advances for the year ended
31 March 2017:
• Impairments on loans and advances decreased from £84.2mn to £75mn
• The credit loss charge as a percentage of average gross core loans and advances amounted to 0.90% (31 March 2016: 1.13%)
• The percentage of default loans (net of impairments but before taking collateral into account) to core loans and advances amounted to 1.55% (31 March 2016: 2.19%)
• The ratio of collateral to default loans (net of impairments) remains satisfactory at 1.44 times (31 March 2016: 1.19 times)
0%
1%
2%
3%
4%
5%
6%
0123456789
10
2008 2009 2010 2011 2012 2013 2014 2015 2016 2017
£’bn
Net core loans (LHS)
Credit loss ratio (i.e. income statement charge as a percentage of ave gross loans) (RHS)
Net default loans before collateral as a % of core loans and advances to customers (RHS)
23
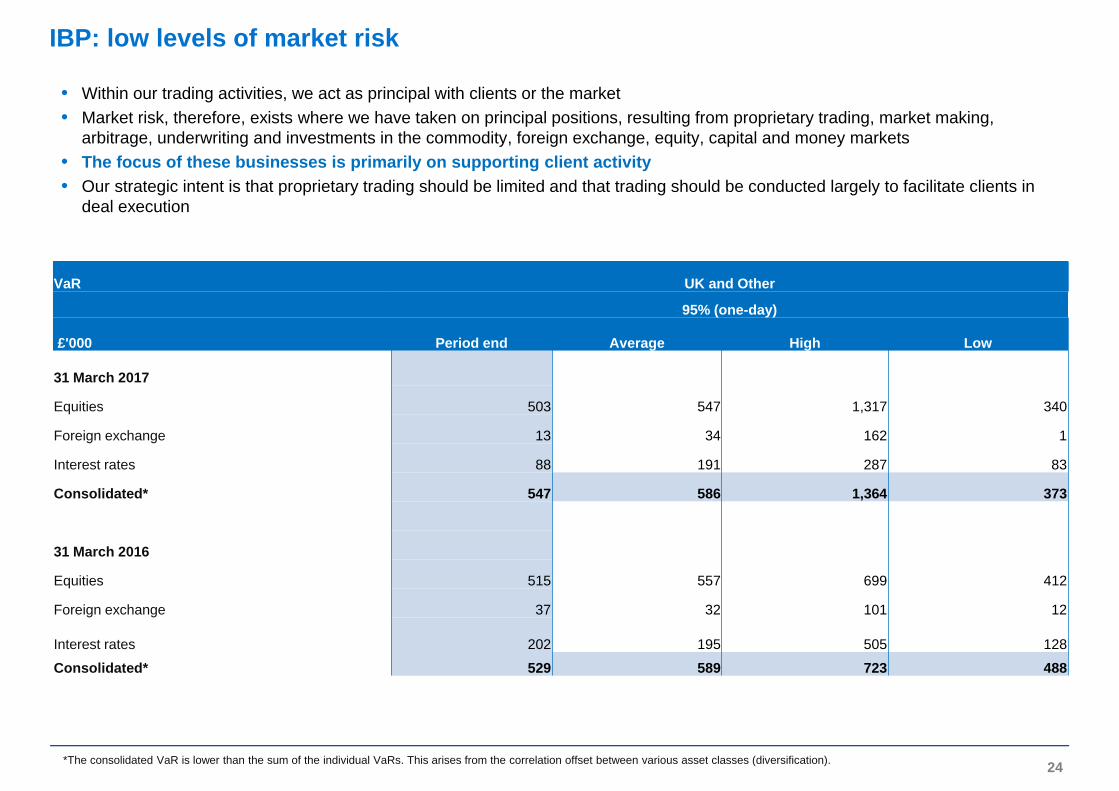
IBP: low levels of market risk
• Within our trading activities, we act as principal with clients or the market• Market risk, therefore, exists where we have taken on principal positions, resulting from proprietary trading, market making,
arbitrage, underwriting and investments in the commodity, foreign exchange, equity, capital and money markets• The focus of these businesses is primarily on supporting client activity• Our strategic intent is that proprietary trading should be limited and that trading should be conducted largely to facilitate clients in
deal execution
*The consolidated VaR is lower than the sum of the individual VaRs. This arises from the correlation offset between various asset classes (diversification).
VaR UK and Other
95% (one-day)
£'000 Period end Average High Low
31 March 2017
Equities 503 547 1,317 340
Foreign exchange 13 34 162 1
Interest rates 88 191 287 83
Consolidated* 547 586 1,364 373
31 March 2016
Equities 515 557 699 412
Foreign exchange 37 32 101 12
Interest rates 202 195 505 128
Consolidated* 529 589 723 488
24
*Where annuity income is net interest income and annuity fees.
**Before goodwill, acquired intangibles, non-operating items and after non-controlling interests.
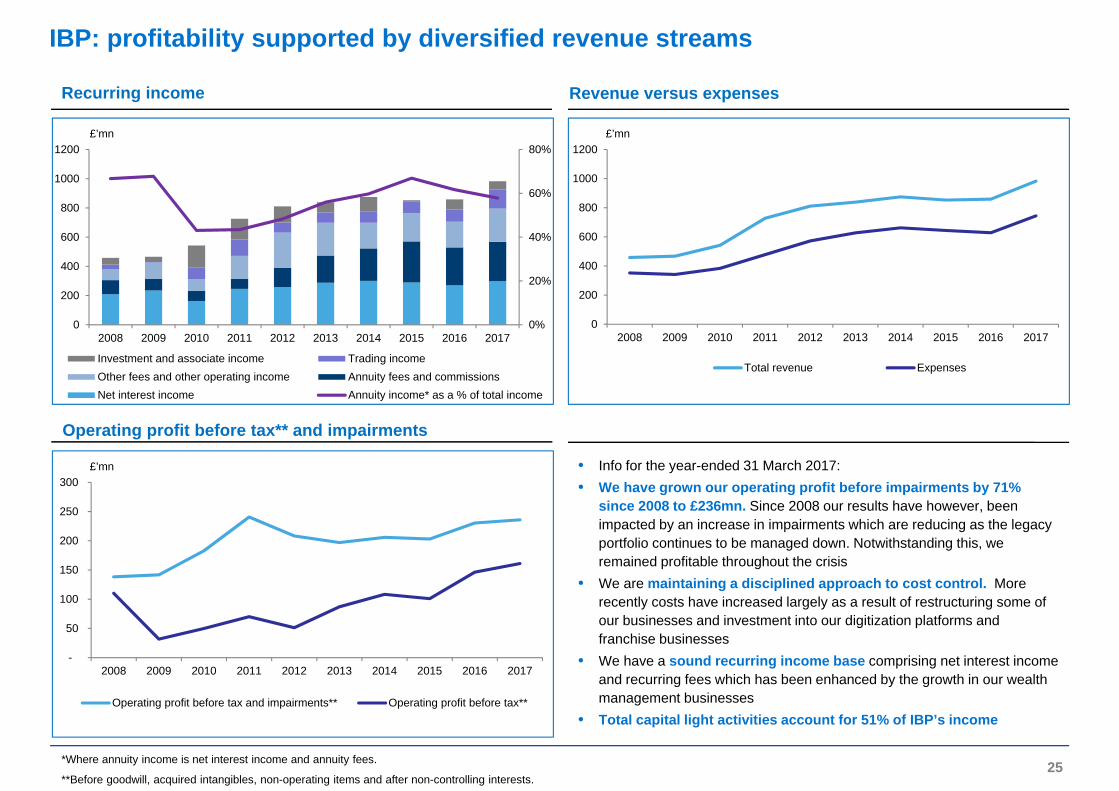
IBP: profitability supported by diversified revenue streams
Recurring income
Operating profit before tax** and impairments
-
50
100
150
200
250
300
2008 2009 2010 2011 2012 2013 2014 2015 2016 2017
£’mn
Operating profit before tax and impairments** Operating profit before tax**
Revenue versus expenses
0
200
400
600
800
1000
1200
2008 2009 2010 2011 2012 2013 2014 2015 2016 2017
£’mn
Total revenue Expenses
25
• Info for the year-ended 31 March 2017:• We have grown our operating profit before impairments by 71%
since 2008 to £236mn. Since 2008 our results have however, been impacted by an increase in impairments which are reducing as the legacy portfolio continues to be managed down. Notwithstanding this, we remained profitable throughout the crisis
• We are maintaining a disciplined approach to cost control. Morerecently costs have increased largely as a result of restructuring some of our businesses and investment into our digitization platforms and franchise businesses
• We have a sound recurring income base comprising net interest income and recurring fees which has been enhanced by the growth in our wealth management businesses
• Total capital light activities account for 51% of IBP’s income
0%
20%
40%
60%
80%
0
200
400
600
800
1000
1200
2008 2009 2010 2011 2012 2013 2014 2015 2016 2017
£’mn
Investment and associate income Trading incomeOther fees and other operating income Annuity fees and commissionsNet interest income Annuity income* as a % of total income
*Before goodwill, acquired intangibles, non-operating items, taxation and after non-controlling interests
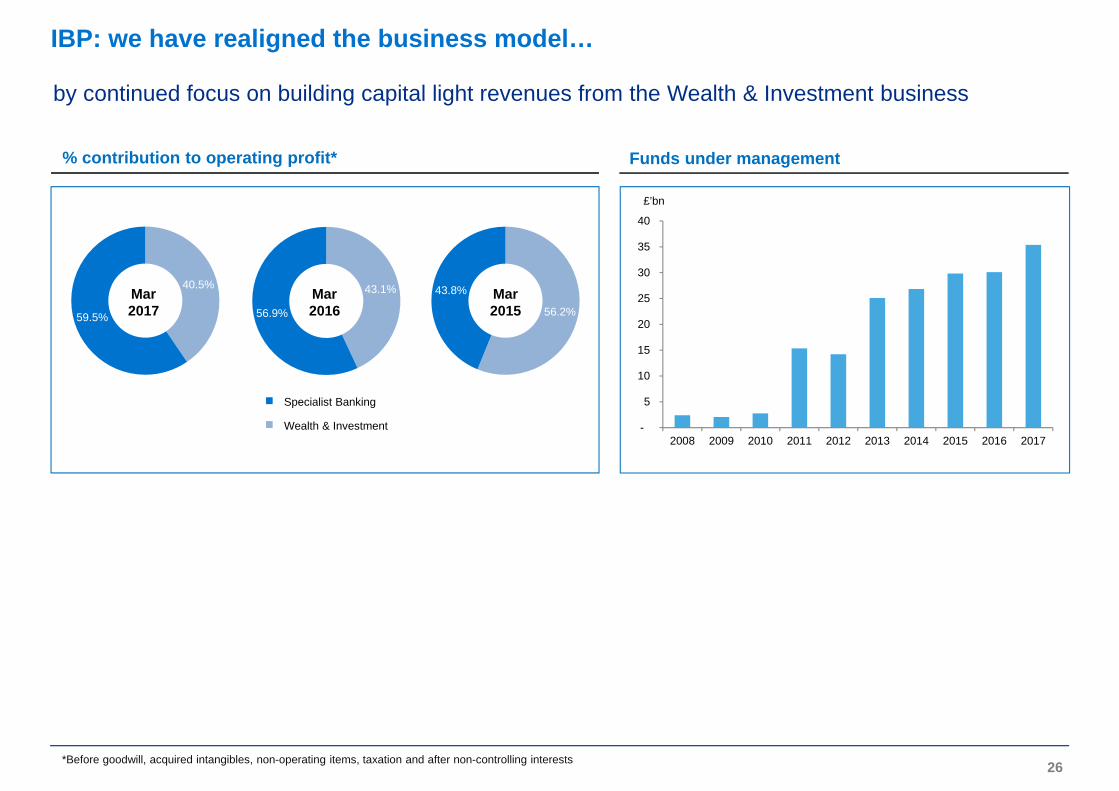
IBP: we have realigned the business model…
% contribution to operating profit* Funds under management
26
-
5
10
15
20
25
30
35
40
2008 2009 2010 2011 2012 2013 2014 2015 2016 2017
£’bn
43.1%
56.9% 56.2%
43.8% Mar 2015
Specialist Banking
Wealth & Investment
Mar 2016
40.5%
59.5%
Mar2017
by continued focus on building capital light revenues from the Wealth & Investment business
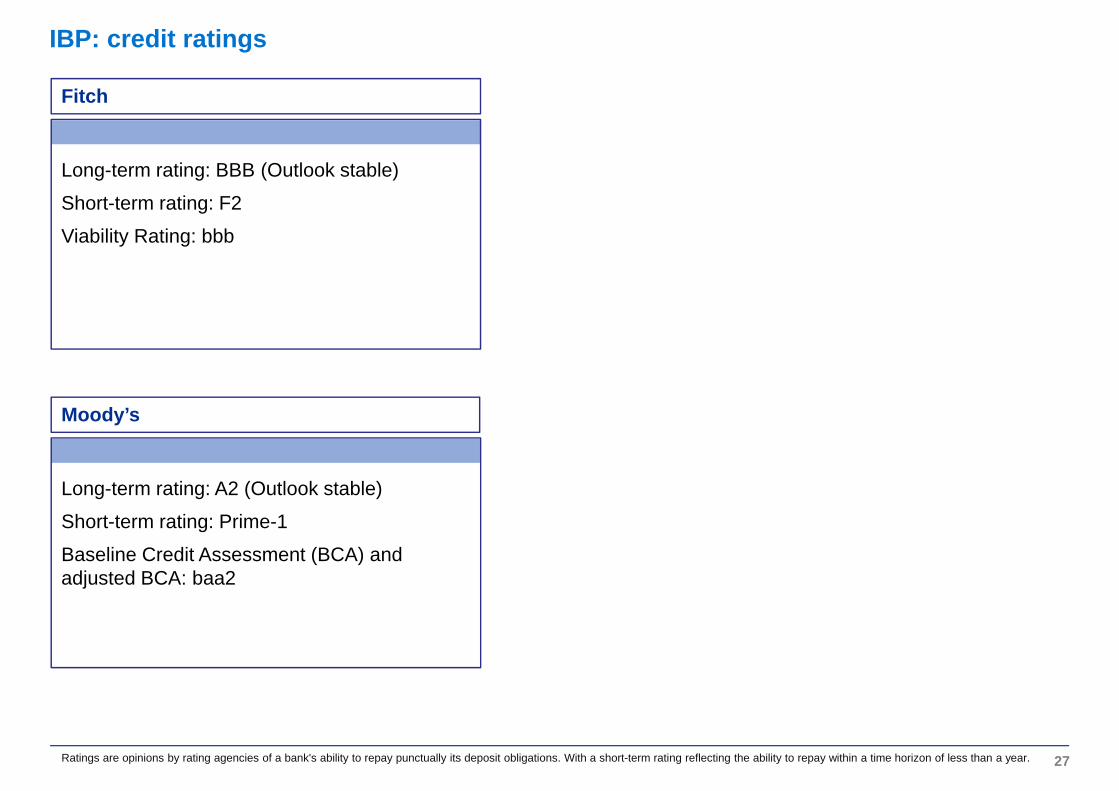
Long-term rating: BBB (Outlook stable)
Short-term rating: F2
Viability Rating: bbb
Long-term rating: A2 (Outlook stable)
Short-term rating: Prime-1
Baseline Credit Assessment (BCA) and adjusted BCA: baa2
IBP: credit ratings
Ratings are opinions by rating agencies of a bank's ability to repay punctually its deposit obligations. With a short-term rating reflecting the ability to repay within a time horizon of less than a year. 27
Moody’s
Fitch
Investec Bank plc: peer analysis
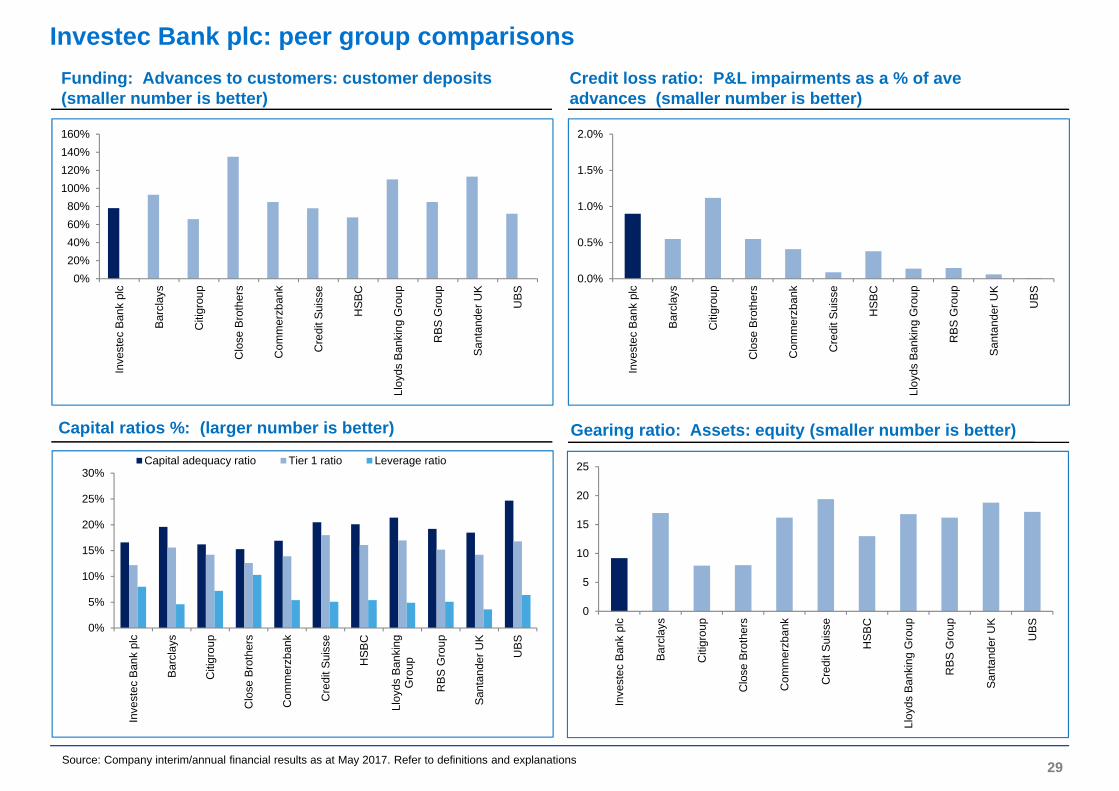
Investec Bank plc: peer group comparisons
Source: Company interim/annual financial results as at May 2017. Refer to definitions and explanations
Funding: Advances to customers: customer deposits (smaller number is better)
Gearing ratio: Assets: equity (smaller number is better)Capital ratios %: (larger number is better)
Credit loss ratio: P&L impairments as a % of aveadvances (smaller number is better)
0%20%40%60%80%
100%120%140%160%
Inve
stec
Ban
k pl
c
Barc
lays
Citi
grou
p
Clo
se B
roth
ers
Com
mer
zban
k
Cre
dit S
uiss
e
HSB
C
Lloy
ds B
anki
ng G
roup
RBS
Gro
up
San
tand
er U
K
UBS
0%
5%
10%
15%
20%
25%
30%
Inve
stec
Ban
k pl
c
Barc
lays
Citi
grou
p
Clo
se B
roth
ers
Com
mer
zban
k
Cre
dit S
uiss
e
HSB
C
Lloy
ds B
anki
ngG
roup
RBS
Gro
up
San
tand
er U
K
UBS
Capital adequacy ratio Tier 1 ratio Leverage ratio
0
5
10
15
20
25
Inve
stec
Ban
k pl
c
Barc
lays
Citi
grou
p
Clo
se B
roth
ers
Com
mer
zban
k
Cre
dit S
uiss
e
HSB
C
Lloy
ds B
anki
ng G
roup
RBS
Gro
up
San
tand
er U
K
UBS
29
0.0%
0.5%
1.0%
1.5%
2.0%
Inve
stec
Ban
k pl
c
Barc
lays
Citi
grou
p
Clo
se B
roth
ers
Com
mer
zban
k
Cre
dit S
uiss
e
HSB
C
Lloy
ds B
anki
ng G
roup
RBS
Gro
up
San
tand
er U
K
UBS
IBP: peer group comparisons
Definitions and/or explanations of certain ratios:• Customer deposits do not include deposits from banks.• The customer advances to customer deposits ratio reflects how much of a bank’s advances to customers are funded from the
“retail and corporate” market as opposed to the “wholesale funding and banking market”. A ratio higher than one indicates that advances to customers are not fully funded from the retail and corporate market, with the balance being funded from the wholesale market.
• A capital adequacy ratio is a regulatory ratio which determines the capacity of the bank in terms of meeting the time liabilities and other risks such as credit risk, operational risk, etc. It is based on regulatory qualifying capital (including tier 1 and 2 capital) as a percentage of risk-weighted assets. Assets are risk-weighted either according to the Standardised Approach in terms of Basel or the Advanced Approach.
• The gearing ratio is calculated as total assets divided by total equity (according to accounting definitions).• The leverage ratio is calculated as tier one capital (according to regulatory definitions) divided by total assets (exposure measure).
This ratio effectively assures all assets are 100% risk-weighted and is a more conservative measure than the capital adequacy ratio. Regulators are expecting that this ratio should exceed 5%.
• The credit loss ratio is calculated as the income statement impairment/charge on advances as a percentage of average gross advances to customers.
• Default loans largely comprise loans that are impaired and/or over 90 days in arrears.
30
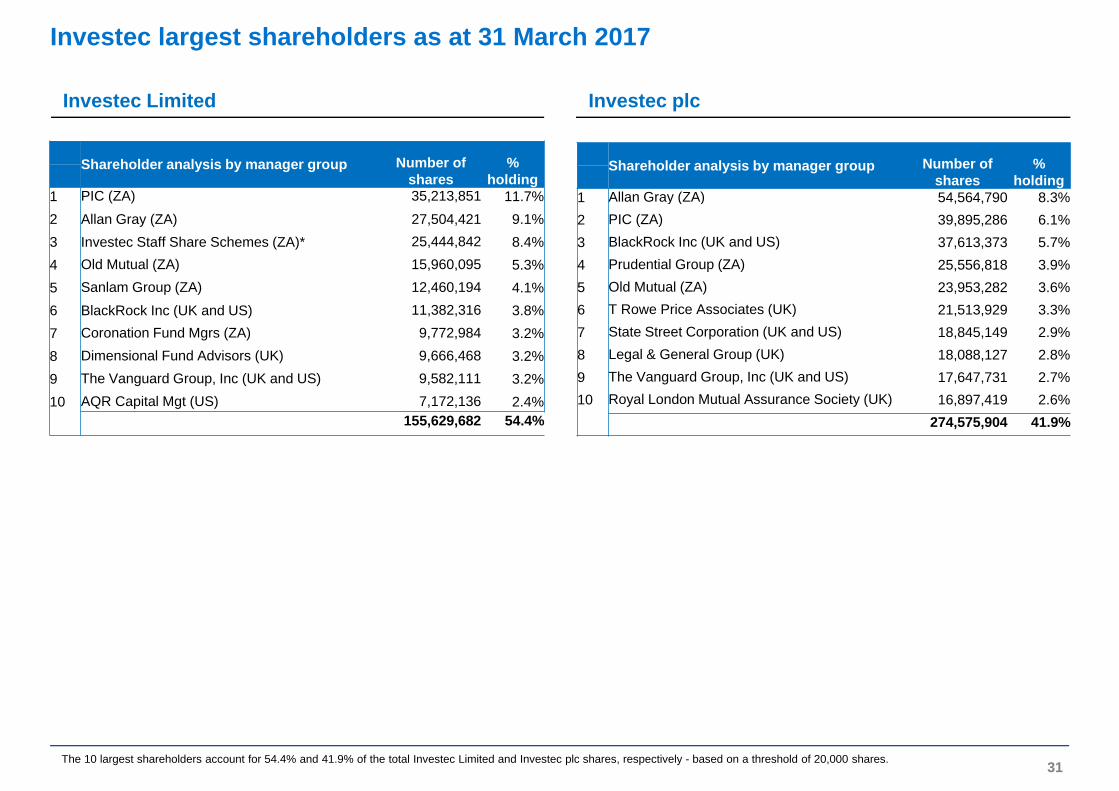
Investec largest shareholders as at 31 March 2017
Investec Limited Investec plc
31The 10 largest shareholders account for 54.4% and 41.9% of the total Investec Limited and Investec plc shares, respectively - based on a threshold of 20,000 shares.
Shareholder analysis by manager group Number of shares
% holding
1 Allan Gray (ZA) 54,564,790 8.3%2 PIC (ZA) 39,895,286 6.1%3 BlackRock Inc (UK and US) 37,613,373 5.7%4 Prudential Group (ZA) 25,556,818 3.9%5 Old Mutual (ZA) 23,953,282 3.6%6 T Rowe Price Associates (UK) 21,513,929 3.3%7 State Street Corporation (UK and US) 18,845,149 2.9%8 Legal & General Group (UK) 18,088,127 2.8%9 The Vanguard Group, Inc (UK and US) 17,647,731 2.7%10 Royal London Mutual Assurance Society (UK) 16,897,419 2.6%
274,575,904 41.9%
Shareholder analysis by manager group Number of shares
% holding
1 PIC (ZA) 35,213,851 11.7%2 Allan Gray (ZA) 27,504,421 9.1%3 Investec Staff Share Schemes (ZA)* 25,444,842 8.4%4 Old Mutual (ZA) 15,960,095 5.3%5 Sanlam Group (ZA) 12,460,194 4.1%6 BlackRock Inc (UK and US) 11,382,316 3.8%7 Coronation Fund Mgrs (ZA) 9,772,984 3.2%8 Dimensional Fund Advisors (UK) 9,666,468 3.2%9 The Vanguard Group, Inc (UK and US) 9,582,111 3.2%10 AQR Capital Mgt (US) 7,172,136 2.4%
155,629,682 54.4%
• For further information please refer to the investor relations website: www.investec.com/en_za/#home/investor_relations.html
• Or contact the investor relations team:– Telephone
• UK: +44 (0) 207 597 5546 / +44 (0) 207 597 4493• SA: +27 (0)11 286 7070
– Fax: +27 11 (0) 291 1597– E-mail: [email protected]
Contact details
32
Investec group - appendices
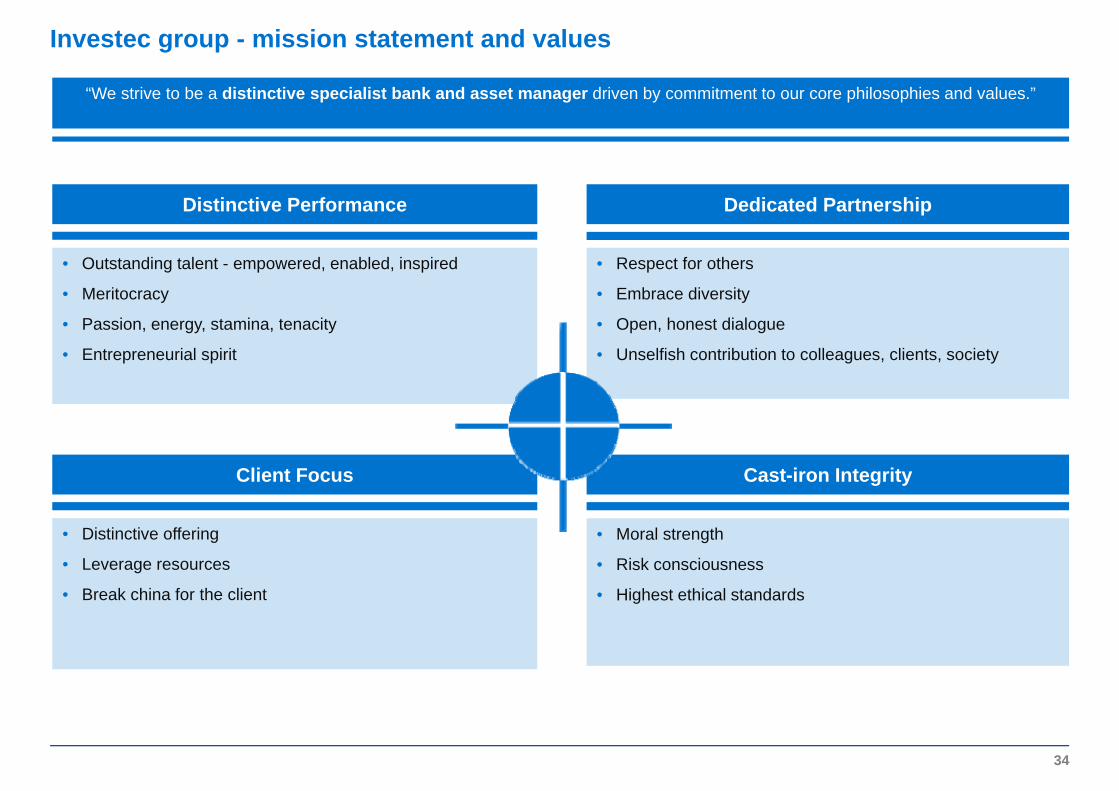
Investec group - mission statement and values
• Distinctive offering
• Leverage resources
• Break china for the client
• Outstanding talent - empowered, enabled, inspired
• Meritocracy
• Passion, energy, stamina, tenacity
• Entrepreneurial spirit
“We strive to be a distinctive specialist bank and asset manager driven by commitment to our core philosophies and values.”
• Moral strength
• Risk consciousness
• Highest ethical standards
• Respect for others
• Embrace diversity
• Open, honest dialogue
• Unselfish contribution to colleagues, clients, society
Distinctive Performance Dedicated Partnership
Cast-iron IntegrityClient Focus
34

• Investec’s strategic goals and objectives are motivated by the desire to develop an efficient and integrated business on an international scale through the active pursuit of clearly established core competencies in the group’s principal business areas
Investec – group operating structure
35
WEALTH & INVESTMENT
• Portfolio management
• Stockbroking
• Alternative investments
• Investment advisory services
• Electronic trading services
• Retirement portfolios
• Southern Africa
• Hong Kong
• UK and Europe
INVESTMENT ACTIVITIES
• Principal investments
• Property investment fund management
• Australia
• Hong Kong
• Southern Africa
• UK and Europe
GROUP SERVICES AND OTHER ACTIVITIES- Central Services - Central Funding
• Transactional banking and foreign exchange
• Lending
• Deposits
• Investments
• Southern Africa
• UK and Europe
PRIVATE BANKING
ACTIVITIES
CORPORATE ANDINSTITUTIONAL
BANKINGACTIVITIES
• Treasury and trading services
• Specialised lending, funds and debt capital markets
• Institutional research, sales and trading
• Advisory
• Australia
• Hong Kong
• India
• Southern Africa
• UK and Europe
• USA
ASSET MANAGEMENT
• Equities
• Fixed income
• Multi Asset
• Alternatives
• Africa
• Americas
• Asia Pacific
• Europe
• UK
Asset management and wealth management Specialist banking

Investec Bank plc -appendices

IBP: salient financial features
37
Year to 31 March 2017
Year to31 March 2016 % change
Total operating income before impairment losses on loans and advances (£'000) 982,690 859,189 14.4%
Operating costs (£'000) 744,716 628,515 18.5%Operating profit before goodwill, acquired intangibles, non-operating items, taxation and after non-controlling interests (£'000) 161,057 146,347 10.1%
Earnings attributable to ordinary shareholder (£'000) 117,793 96,635 21.9%
Cost to income ratio 75.9% 73.3%
Total capital resources (including subordinated liabilities) (£'000) 2,559,287 2,440,165 4.9%
Total shareholder's equity (£'000) 1,979,931 1,842,856 7.4%
Total assets (£'000) 18,381,414 18,334,568 0.3%
Net core loans and advances (£'000) 8,598,639 7,781,386 10.5%
Customer accounts (deposits) (£'000) 11,289,177 11,038,164 2.3%
Cash and near cash balances (£'000) 4,852,710 5,014,171 -3.8%
Funds under management (£'mn) * 35,941 30,104 19.4%
Capital adequacy ratio 16.6% 17.0%
Tier 1 ratio 12.2% 11.9%
Common equity tier 1 ratio 12.2% 11.9%Leverage ratio - current 8.0% 7.5%
Leverage ratio - "fully loaded" 8.0% 7.5%Defaults (net of impairments) as a % of net core loans and advances 1.55% 2.19%
Net defaults (after collateral and impairments) as a % of net core loans and advances - -Credit loss ratio (i.e. income statement impairment charge as a % of average core loans and advances) 0.90% 1.13%Total gearing ratio (i.e. total assets to total equity) 9.3x 9.9XLoans and advances to customers: customer deposits 76.2% 70.5%
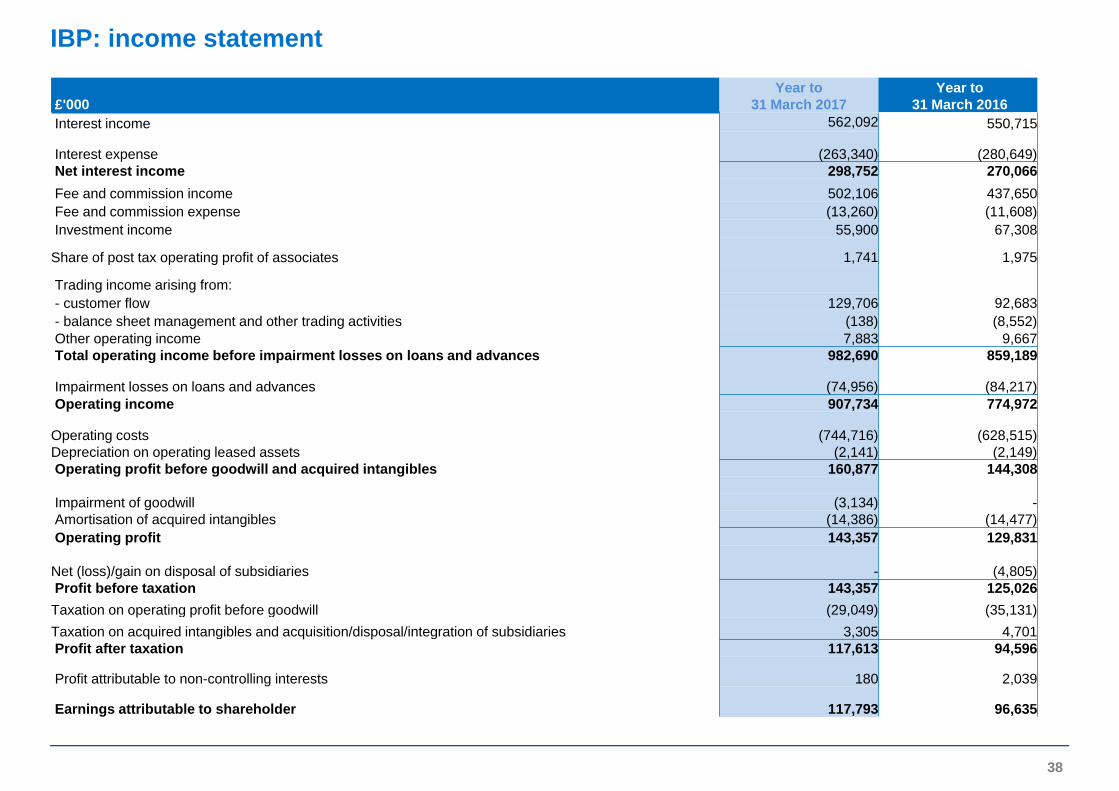
IBP: income statement
38
£'000Year to
31 March 2017Year to
31 March 2016 Interest income 562,092 550,715
Interest expense (263,340) (280,649)Net interest income 298,752 270,066Fee and commission income 502,106 437,650 Fee and commission expense (13,260) (11,608)Investment income 55,900 67,308
Share of post tax operating profit of associates 1,741 1,975
Trading income arising from: - customer flow 129,706 92,683 - balance sheet management and other trading activities (138) (8,552)Other operating income 7,883 9,667Total operating income before impairment losses on loans and advances 982,690 859,189
Impairment losses on loans and advances (74,956) (84,217)Operating income 907,734 774,972
Operating costs (744,716) (628,515)Depreciation on operating leased assets (2,141) (2,149)Operating profit before goodwill and acquired intangibles 160,877 144,308
Impairment of goodwill (3,134) -Amortisation of acquired intangibles (14,386) (14,477)Operating profit 143,357 129,831
Net (loss)/gain on disposal of subsidiaries - (4,805) Profit before taxation 143,357 125,026 Taxation on operating profit before goodwill (29,049) (35,131)Taxation on acquired intangibles and acquisition/disposal/integration of subsidiaries 3,305 4,701Profit after taxation 117,613 94,596
Profit attributable to non-controlling interests 180 2,039
Earnings attributable to shareholder 117,793 96,635
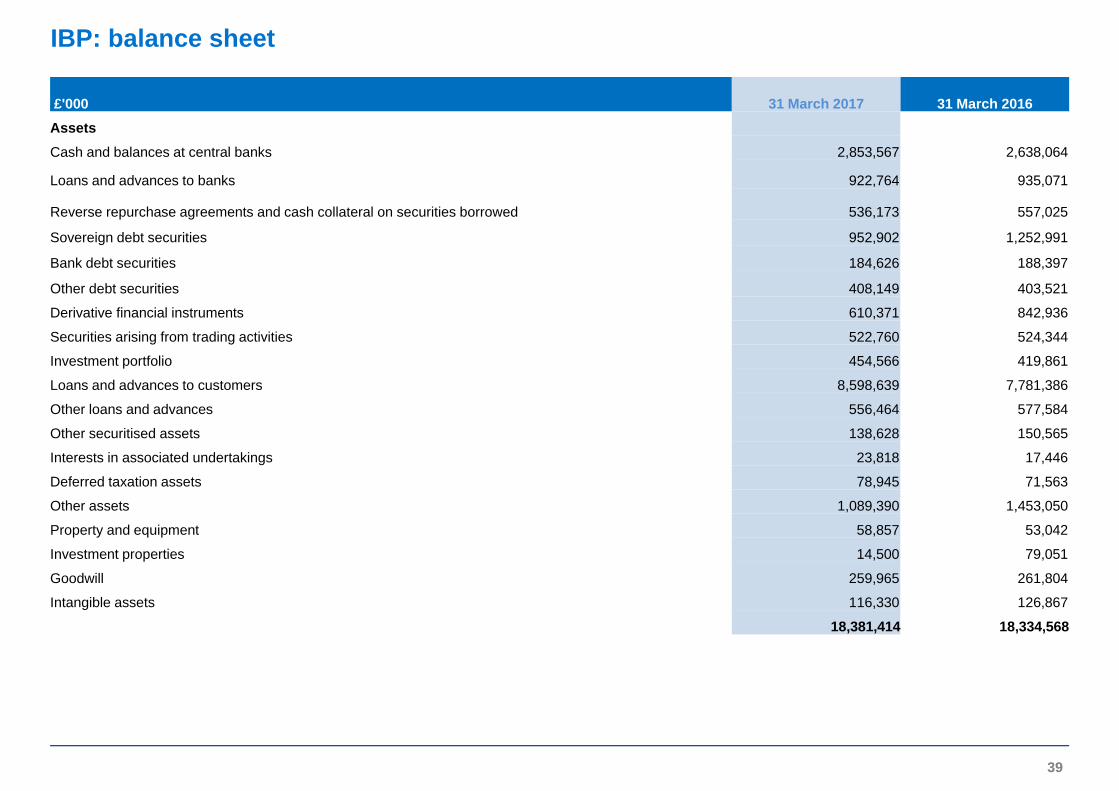
IBP: balance sheet
39
£'000 31 March 2017 31 March 2016 AssetsCash and balances at central banks 2,853,567 2,638,064
Loans and advances to banks 922,764 935,071
Reverse repurchase agreements and cash collateral on securities borrowed 536,173 557,025
Sovereign debt securities 952,902 1,252,991
Bank debt securities 184,626 188,397
Other debt securities 408,149 403,521
Derivative financial instruments 610,371 842,936
Securities arising from trading activities 522,760 524,344
Investment portfolio 454,566 419,861
Loans and advances to customers 8,598,639 7,781,386
Other loans and advances 556,464 577,584
Other securitised assets 138,628 150,565
Interests in associated undertakings 23,818 17,446
Deferred taxation assets 78,945 71,563
Other assets 1,089,390 1,453,050
Property and equipment 58,857 53,042
Investment properties 14,500 79,051
Goodwill 259,965 261,804
Intangible assets 116,330 126,867
18,381,414 18,334,568
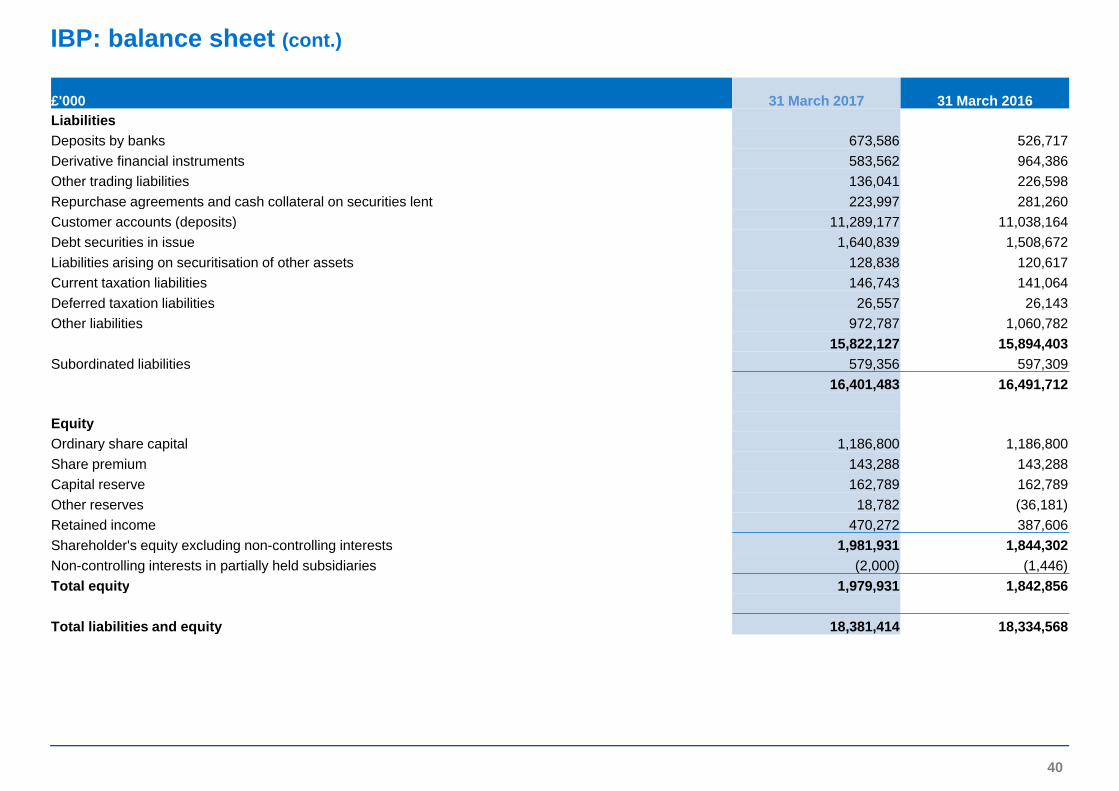
IBP: balance sheet (cont.)
40
£'000 31 March 2017 31 March 2016 LiabilitiesDeposits by banks 673,586 526,717 Derivative financial instruments 583,562 964,386 Other trading liabilities 136,041 226,598 Repurchase agreements and cash collateral on securities lent 223,997 281,260 Customer accounts (deposits) 11,289,177 11,038,164 Debt securities in issue 1,640,839 1,508,672 Liabilities arising on securitisation of other assets 128,838 120,617 Current taxation liabilities 146,743 141,064 Deferred taxation liabilities 26,557 26,143 Other liabilities 972,787 1,060,782
15,822,127 15,894,403 Subordinated liabilities 579,356 597,309
16,401,483 16,491,712
EquityOrdinary share capital 1,186,800 1,186,800 Share premium 143,288 143,288 Capital reserve 162,789 162,789 Other reserves 18,782 (36,181)Retained income 470,272 387,606 Shareholder's equity excluding non-controlling interests 1,981,931 1,844,302 Non-controlling interests in partially held subsidiaries (2,000) (1,446)Total equity 1,979,931 1,842,856
Total liabilities and equity 18,381,414 18,334,568
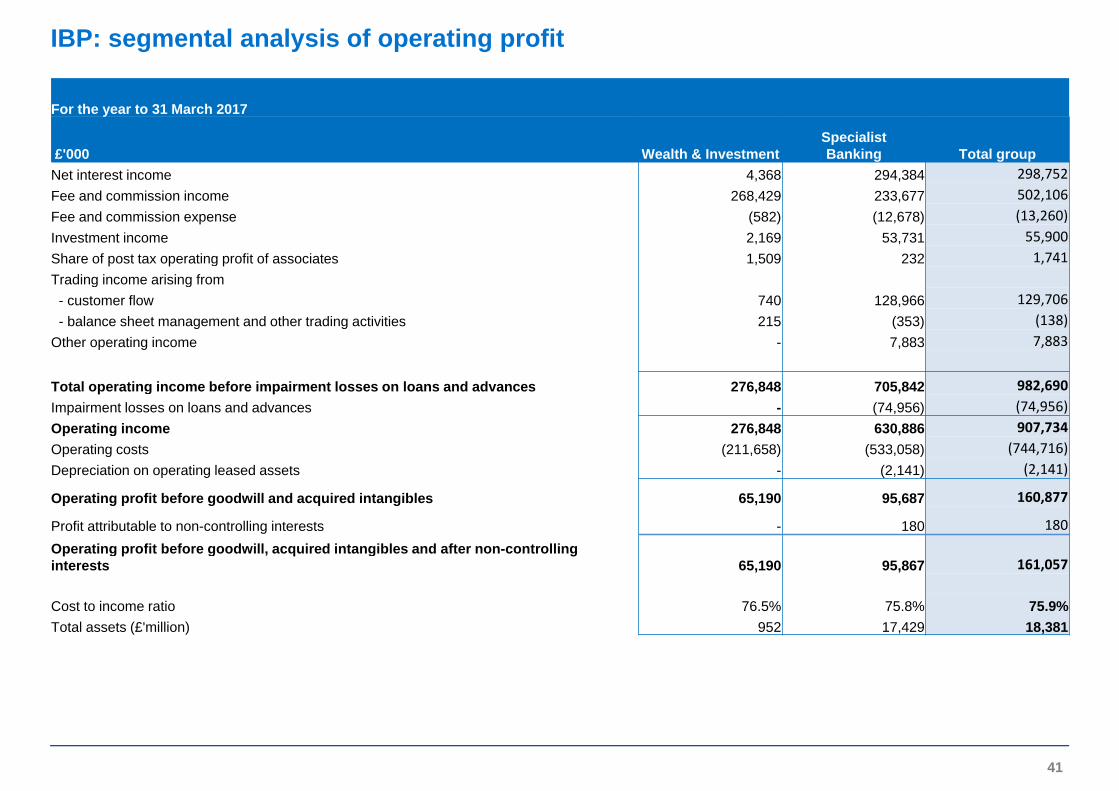
IBP: segmental analysis of operating profit
41
For the year to 31 March 2017
£'000 Wealth & InvestmentSpecialistBanking Total group
Net interest income 4,368 294,384 298,752Fee and commission income 268,429 233,677 502,106Fee and commission expense (582) (12,678) (13,260)Investment income 2,169 53,731 55,900Share of post tax operating profit of associates 1,509 232 1,741Trading income arising from- customer flow 740 128,966 129,706- balance sheet management and other trading activities 215 (353) (138)
Other operating income - 7,883 7,883
Total operating income before impairment losses on loans and advances 276,848 705,842 982,690Impairment losses on loans and advances - (74,956) (74,956)Operating income 276,848 630,886 907,734Operating costs (211,658) (533,058) (744,716)Depreciation on operating leased assets - (2,141) (2,141)
Operating profit before goodwill and acquired intangibles 65,190 95,687 160,877
Profit attributable to non-controlling interests - 180 180Operating profit before goodwill, acquired intangibles and after non-controlling interests 65,190 95,867 161,057
Cost to income ratio 76.5% 75.8% 75.9%Total assets (£'million) 952 17,429 18,381
IBP: segmental analysis of operating profit
42
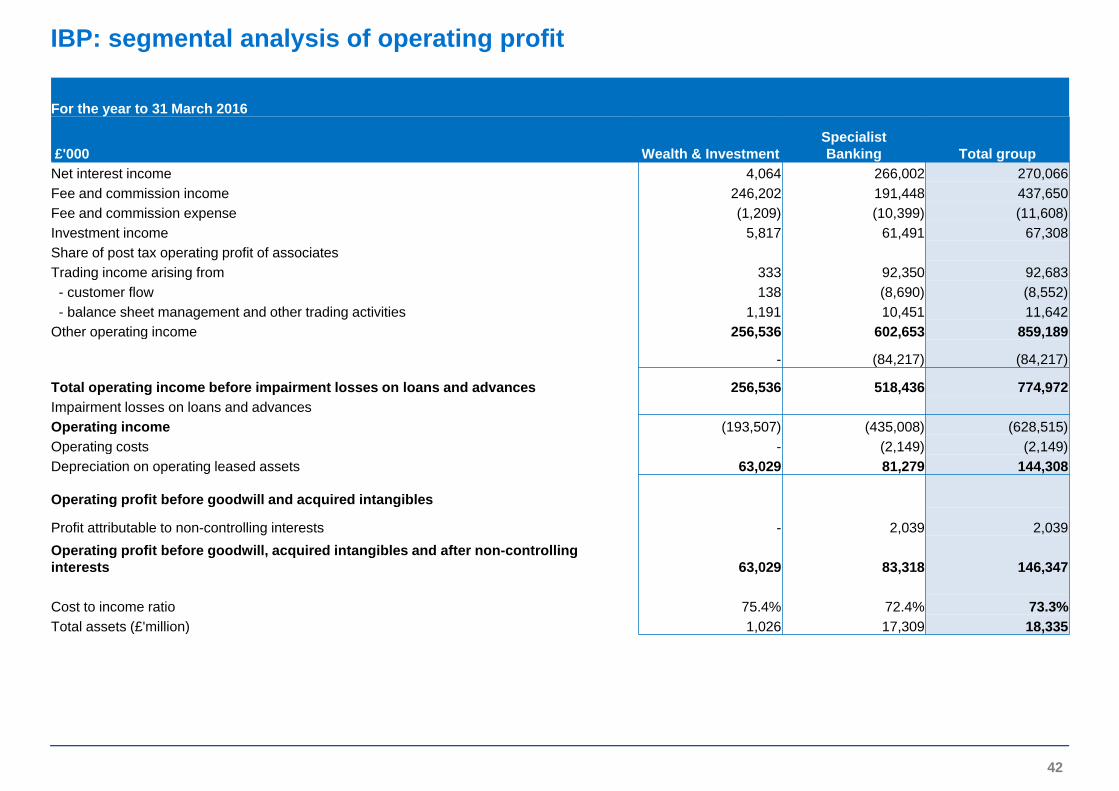
For the year to 31 March 2016
£'000 Wealth & InvestmentSpecialistBanking Total group
Net interest income 4,064 266,002 270,066 Fee and commission income 246,202 191,448 437,650 Fee and commission expense (1,209) (10,399) (11,608)Investment income 5,817 61,491 67,308 Share of post tax operating profit of associates Trading income arising from 333 92,350 92,683 - customer flow 138 (8,690) (8,552)- balance sheet management and other trading activities 1,191 10,451 11,642
Other operating income 256,536 602,653 859,189
- (84,217) (84,217)
Total operating income before impairment losses on loans and advances 256,536 518,436 774,972 Impairment losses on loans and advances Operating income (193,507) (435,008) (628,515)Operating costs - (2,149) (2,149)Depreciation on operating leased assets 63,029 81,279 144,308
Operating profit before goodwill and acquired intangibles
Profit attributable to non-controlling interests - 2,039 2,039 Operating profit before goodwill, acquired intangibles and after non-controlling interests 63,029 83,318 146,347
Cost to income ratio 75.4% 72.4% 73.3%Total assets (£'million) 1,026 17,309 18,335
IBP: asset quality
43
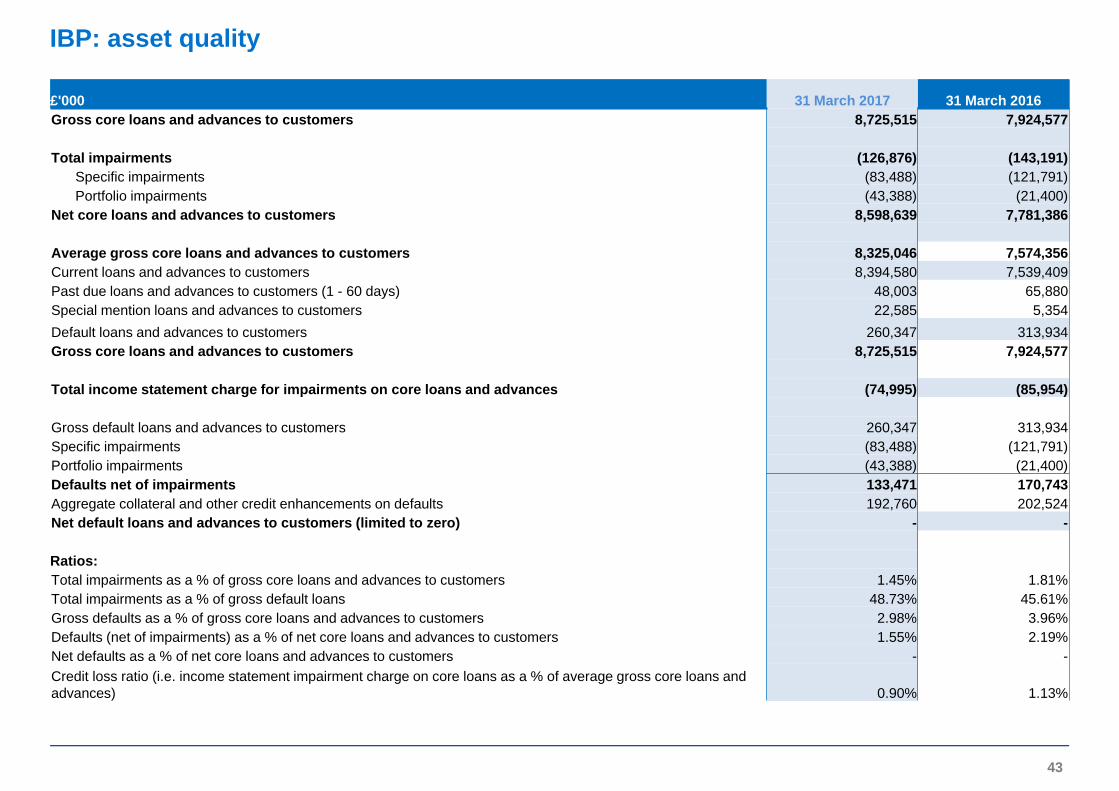
£'000 31 March 2017 31 March 2016 Gross core loans and advances to customers 8,725,515 7,924,577
Total impairments (126,876) (143,191)Specific impairments (83,488) (121,791)Portfolio impairments (43,388) (21,400)
Net core loans and advances to customers 8,598,639 7,781,386
Average gross core loans and advances to customers 8,325,046 7,574,356Current loans and advances to customers 8,394,580 7,539,409Past due loans and advances to customers (1 - 60 days) 48,003 65,880Special mention loans and advances to customers 22,585 5,354Default loans and advances to customers 260,347 313,934Gross core loans and advances to customers 8,725,515 7,924,577
Total income statement charge for impairments on core loans and advances (74,995) (85,954)
Gross default loans and advances to customers 260,347 313,934Specific impairments (83,488) (121,791)Portfolio impairments (43,388) (21,400)Defaults net of impairments 133,471 170,743Aggregate collateral and other credit enhancements on defaults 192,760 202,524Net default loans and advances to customers (limited to zero) - -
Ratios:Total impairments as a % of gross core loans and advances to customers 1.45% 1.81%Total impairments as a % of gross default loans 48.73% 45.61%Gross defaults as a % of gross core loans and advances to customers 2.98% 3.96%Defaults (net of impairments) as a % of net core loans and advances to customers 1.55% 2.19%Net defaults as a % of net core loans and advances to customers - -Credit loss ratio (i.e. income statement impairment charge on core loans as a % of average gross core loans and advances) 0.90% 1.13%
IBP: capital adequacy
44
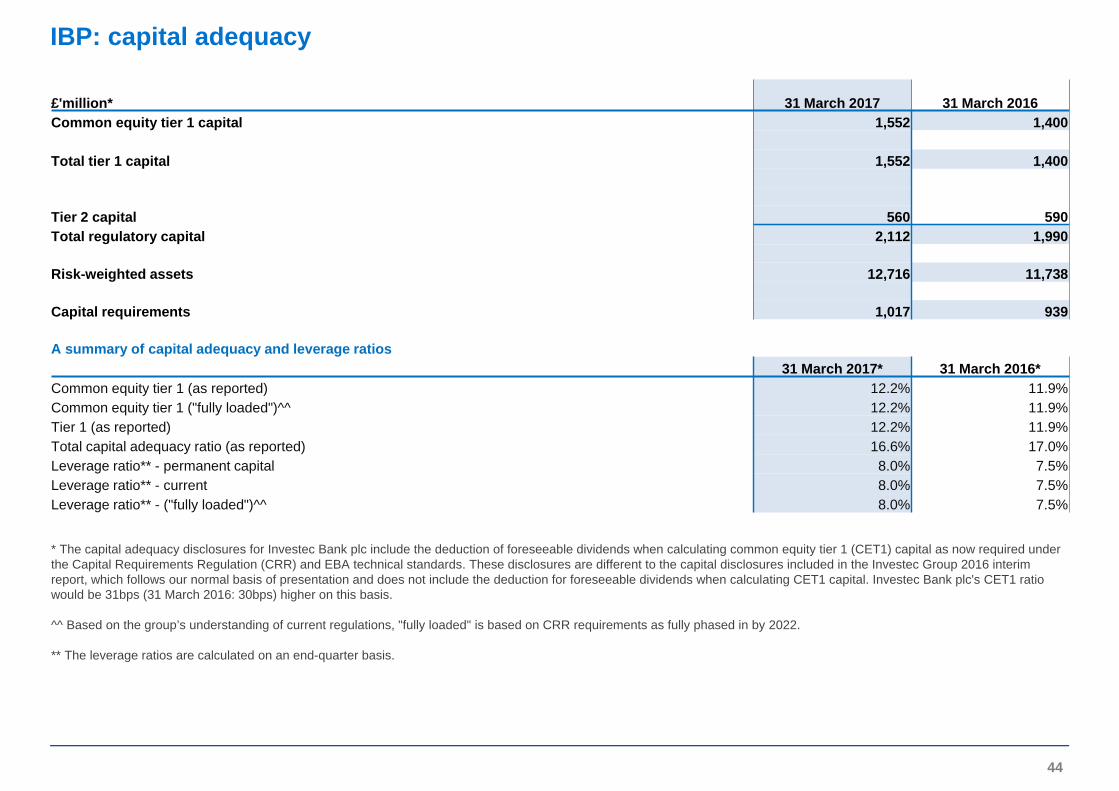
£'million* 31 March 2017 31 March 2016 Common equity tier 1 capital 1,552 1,400
Total tier 1 capital 1,552 1,400
Tier 2 capital 560 590Total regulatory capital 2,112 1,990
Risk-weighted assets 12,716 11,738
Capital requirements 1,017 939
A summary of capital adequacy and leverage ratios31 March 2017* 31 March 2016*
Common equity tier 1 (as reported) 12.2% 11.9%Common equity tier 1 ("fully loaded")^^ 12.2% 11.9%Tier 1 (as reported) 12.2% 11.9%Total capital adequacy ratio (as reported) 16.6% 17.0%Leverage ratio** - permanent capital 8.0% 7.5%Leverage ratio** - current 8.0% 7.5%Leverage ratio** - ("fully loaded")^^ 8.0% 7.5%
* The capital adequacy disclosures for Investec Bank plc include the deduction of foreseeable dividends when calculating common equity tier 1 (CET1) capital as now required under the Capital Requirements Regulation (CRR) and EBA technical standards. These disclosures are different to the capital disclosures included in the Investec Group 2016 interimreport, which follows our normal basis of presentation and does not include the deduction for foreseeable dividends when calculating CET1 capital. Investec Bank plc's CET1 ratio would be 31bps (31 March 2016: 30bps) higher on this basis.
^^ Based on the group’s understanding of current regulations, "fully loaded" is based on CRR requirements as fully phased in by 2022.
** The leverage ratios are calculated on an end-quarter basis.