Embed Size (px)
Citation preview

INTEGRATING BIOMASS TORREFACTION PRETREATMENT WITH GASIFICATION: EFFECT ON
SYNGAS YIELD AND TAR COMPOSITION
by
BRIAN PAUL BIBENS
(Under the direction of Sudhagar Mani)
ABSTRACT
The effect of torrefaction of pine chips prior to its gasification was studied by measuring
changes in yields, efficiency, and tar production during gasification. Feed rates decreased with
increased torrefaction treatment compared to dried pine (from around 9 to 5kg hr‐1) with an
exception of torrefaction at 250°C for 30 minutes (10.12kg hr‐1). Syngas yield averaged 2.8Nm3
kg‐1 with an exception of 300°C for 60 minutes (5.15Nm3 kg‐1). Increased torrefaction
treatment impacted syngas composition yield by reducing carbon dioxide (around 10 to 4mol‐
%) and carbon monoxide (around 25 to 10mol‐ %) concentrations. Observed cold gas efficiency
ranged between 40 and 90%. Tar concentration in syngas reduced with increased torrefaction
treatment (around 0.8 to 0.1g Nm‐3) satisfying Dunn’s method of statistical significance
(P<0.05). Increased gasification temperature decreased tar concentration in dried pine chips
from 0.916±0.139 (749.51°C), to 0.826±0.038 (786.41°C), and 0.295±0.018 g Nm‐3(793.07°C).
INDEX WORDS: Torrefaction, Gasification, Syngas, Tar
INTEGRATING BIOMASS TORREFACTION PRETREATMENT WITH GASIFICATION: EFFECT ON
SYNGAS YIELD AND TAR COMPOSITION
by
BRIAN PAUL BIBENS
B.S., The University of Georgia, 2005
A Thesis submitted to the Graduate Faculty of The University of Georgia in Partial Fulfillment of
the Requirements for the Degree
MASTERS OF SCIENCE
ATHENS, GEORGIA
2010

© 2010
Brian Paul Bibens
All Rights Reserved.
INTEGRATING BIOMASS TORREFACTION PRETREATMENT WITH GASIFICATION: EFFECT ON
SYNGAS YIELD AND TAR COMPOSITION
by
BRIAN PAUL BIBENS
Major Professor: Sudhagar Mani
Committee: Keshav Das James Kastner
Electronic Version Approved:
Maureen Grasso Dean of the Graduate School The University of Georgia July 2010

iv
DEDICATION
To Francis W. and Karan K. Bibens, my dear if not doting parents, without whom my butt
never would have seen the light of day.

v
ACKNOWLEDGEMENTS
I would like to first acknowledge Dr. K.C. Das, for having the privilege and opportunity to
work with the last four years at the University of Georgia. It was truly an invaluable experience
to have collaborated with him, a splendid team of researchers, and the program that he helped
envision. My gratitude could not be expressed words.
I would also like thank Dr. Mani and Dr. Kastner for their support and guidance in this
project. A great deal of credit is owed to their vision in developing this technical report.
This project would not have been completed without the efforts of a few key
individuals, which whom I cannot express enough gratitude. Without them, I don’t believe this
work would have seen the light of day. I would like to thank the dedicated assistance of Joby
Miller. She was tremendous and highly supportive throughout a large portion of this work. I
would also like to give a big shout out to the legend himself, Andrew Smola. His impeccable
work ethic, godliness of cleanliness, tales of feminine exploits, iPhone obsession, and great
companionship will surely be remembered. I would also like to thank Richard Speir, Eric
Gobert, Donald Lakly, and Nathan Melear for their helping hands.
Last but not least, I could not go without acknowledging my colleague and great friend,
Roger Hilten. He was an integral part to the research, tremendously helpful, pragmatic,
supportive, and always tolerant of me being a pain in the butt. I wouldn’t trade him for
nobody!!
vi
TABLE OF CONTENTS
Page
ACKNOWLEDGEMENTS .................................................................................................................... v
LIST OF TABLES .............................................................................................................................. viii
LIST OF FIGURES .............................................................................................................................. ix
CHAPTER
1 INTRODUCTION .................................................................................................................. 1
1.1 Background ................................................................................................................ 1
1.2 Objectives ................................................................................................................... 3
1.2 Expected Results ........................................................................................................ 4
2 LITERATURE REVIEW .......................................................................................................... 5
2.1 Background ................................................................................................................ 5
2.2 Torrefaction ............................................................................................................... 7
2.3 Downdraft Gasification .............................................................................................. 9
2.4 Tar Analysis .............................................................................................................. 13
2.5 Torrefaction coupled with Gasification ................................................................... 14
3 EXPERIMENTAL PLAN ....................................................................................................... 16
3.1 Feedstock Preparation ............................................................................................. 16
3.2 Torrefaction in Rotary Kiln ....................................................................................... 17
3.3 Feedstock and Torrefied Material Chemical Analyses ............................................. 19

vii
3.4 Gasification .............................................................................................................. 20
3.5 Isokinetic Tar Sampling ............................................................................................ 23
3.6 Micro‐GC Analysis .................................................................................................... 24
3.7 GC/MS Analysis ........................................................................................................ 25
3.8 GC‐FID Analysis ........................................................................................................ 25
3.9 ANOVA Statistical Analysis ....................................................................................... 26
4 RESULTS AND DISCUSSION ............................................................................................... 27
4.1 Torrefaction ............................................................................................................. 27
4.2 Solids Yields .............................................................................................................. 28
4.3 Torrefied Material Properties .................................................................................. 29
4.4 Downdraft Gasification ............................................................................................ 33
4.5 Syngas Concentrations ............................................................................................. 39
4.6 Energy Outputs ........................................................................................................ 43
4.7 Tar Production ......................................................................................................... 44
4.8 Particulates in Syngas .............................................................................................. 48
5 CONCLUSIONS .................................................................................................................. 49
REFERENCES .................................................................................................................................. 55
APPENDIX ...................................................................................................................................... 59
viii
LIST OF TABLES
Page
Table 1: Loblolly Pine Properties .................................................................................................. 16
Table 2: Torrefaction experimental plan with temperatures and hold times .............................. 19
Table 3: Properties of Torrefied Loblolly Pine .............................................................................. 31
Table 4: Torrefaction yields and energy consumption ................................................................. 60
Table5: Gasification full run data .................................................................................................. 61
Table 6: Gasification input and output rates ............................................................................... 62
Table 7: Gasification sampling averages and rates ....................................................................... 63
Table 8: Gasification micro‐GC sampling averages ....................................................................... 64
Table 9: Gasification energy yields and cold gas efficiency averages during sampling ................ 65
Table 10: Tar species quantified from second rep of gasification sampling ................................ 66

ix
LIST OF FIGURES
Page
Figure 1: Equivalence Ratio (ER) versus reaction temperature .................................................... 11
Figure 2: Rotary Kiln used for torrefaction and drying ................................................................. 18
Figure 3: Two stage downdraft wood gasifier schematic ............................................................. 21
Figure 4: Tar Impinger Train .......................................................................................................... 24
Figure 5: Torrefaction temperature profile in batch rotary kiln ................................................... 28
Figure 6: Yield of torrefied loblolly pine ....................................................................................... 29
Figure 7: Van Krevelen diagram of torrefied material .................................................................. 33
Figure 8: Temperature profile of downdraft gasifier during Control run Rep 1 ........................... 35
Figure 9: Carbon monoxide yield as expressed in molar‐% of syngas .......................................... 40
Figure 10: Hydrogen yield as expressed in molar‐% of syngas ..................................................... 41
Figure 11: Methane yield as expressed in molar‐% of syngas ...................................................... 42
Figure 12: Carbon dioxide yield as expressed in molar‐% of syngas ............................................ 43
Figure 13: GC‐MS chromatogram for syngas tars from torrefied pine at 300ºC for 30 minutes . 45
Figure 14: Total tar concentration of syngas from sample interval 2 .......................................... 46
Figure 15: GC‐FID Syngas tar concentration of Control Rep 1 ...................................................... 48
Figure 16: GC‐FID Standard Curve Toluene .................................................................................. 67
Figure 17: GC‐FID Standard Curve Indene .................................................................................... 67
Figure 18: GC‐FID Standard Curve Naphthalene .......................................................................... 68

x
Figure 19: GC‐FID Standard Curve p‐Xylene ................................................................................. 68
Figure 20: GC‐FID Standard Curve Styrene ................................................................................... 69

1
CHAPTER 1
INTRODUCTION
1.1 Background
In recent decades the interest in alternative energy sources has grown in response to
the expanding demand for foreign fossil fuels as well as the concerns for the environmental
impact related to global climate change. Biomass is a useful source and is being explored in
variety of ways for energy production and to produce value‐added chemicals or byproducts. It
is readily available through agricultural and forest waste streams locally and is carbon neutral
due to the advantage of the photosynthesis cycle. There is approximately 420 million tons of
available biomass per year, total across the United States for potential utilization with nearly 57
million tons in the form of wood waste [1].
Although biomass is abundant, there are several difficulties associated with the
material. Logistically it is uneconomical to transport long distances due to its low bulk density.
Additionally, biomass degrades over time and is not suitable for long‐term storage. Untreated
biomass has variable and high moisture content, low heating value, poor combustion
characteristics, high volatile content causing tar formation, hygroscopic nature, smoking during
combustion, etc. This makes thermochemical conversion processing of untreated biomass,
such as wood, into energy and other fuels or chemicals very difficult. One of the major
problems found in these processes is the formation of complex products, or tars, generated
2
from the complex molecular structures in the wood. These generally cause difficulties in
downstream processing and usually require additional filtration and other removal methods.
One process that has recently been explored to address the issues stated previously
with untreated biomass is torrefaction. Torrefaction is a thermochemical process typically
ranging from 200 to 300°C under inert conditions. The use of torrefaction lends itself as a
suitable means of stabilizing and upgrading the physiochemical composition and may mitigate
or eliminate several of the disadvantages of un‐treated biomass utilization. It is known to
increase the energy density of the material by removing water and other oxygenated
compounds, and remove the hemicellulose component of biomass which is a precursor to tar
forming compounds and other thermochemical conversion technologies such as pyrolysis,
gasification, and combustion [2]. Torrefaction temperature and residence times are known to
significantly change molecular composition of biomass especially the O/C and H/C ratios [3].
Such physiochemical changes such as this make it more suitable for other thermochemical
conversion technologies such as gasification.
Gasification is a key technology for the production of fossil‐fuel alternatives such as
fuels, chemicals, and other value added products. Coal gasification is a well developed industry
worldwide and several chemicals are presently being produced by this approach. Gasification is
a high temperature (600‐800°C) partial oxidation of hydrocarbons to produce, predominantly, a
gas composing of CO and H2 and commonly referred to as synthesis gas or syngas. The interest
of gasification is driven by the fact that it is a very scalable process and once a syngas has been
produced, its components can be reconstituted to most desirable chemicals, i.e. diesel,
methanol, etc.
3
Most research and commercial demonstrations of biomass gasification are typically
conducted with dried material, such as wood. It is typically reported that tar formation is a
major problem in cases. Some researchers have suggested that torrefaction of wood prior to
gasification may cause a significant reduction in tar formation compared to dried wood.
1.2 Objectives
In this study, we evaluated the integration of torrefaction and gasification to take
biomass to a synthesis gas with higher quality than what would be obtained by direct
gasification alone. This project was comprised of three parts. In the first part of this project, we
experimentally investigated the impact of torrefaction temperature (T= 250, 275, and 300°C)
and residence times (30 and 60 minutes) on the composition and yield of the resulting solid
torrefied product. This was conducted in a 750kg batch pilot rotary kiln. Operating parameters
such as temperature and residence time were evaluated for their impact on characteristics of
the solid byproducts and compared to un‐torrefied wood as a control.
In the second part of this project, we evaluated the impact of using torrefied biomass on
gasification performance as tested in a downdraft gasifier. Properties measured include
temperature profiles, feed rate, syngas production, syngas composition, heating values of
syngas, and cold gas efficiency.
The final part of the study involved the identification and quantification of tars
generated from gasification. We took isokinetic sampling of the syngas to quench the tars as
described in the method designed by a European energy commission in 2007. Tars were
analyzed by GC‐MS for specific species and then quantified based on external standard
4
methods in a GC‐FID. Effects of torrefaction temperature and residence time were assessed
compared to non torrefied woody biomass.
1.3 Expected Outcomes
Based on conclusions from previous published works and recommended comments
regarding the requirement of thermal pretreatment of woody biomass to abate tar formation,
increased torrefaction temperature and residence time should reduce tar formation in syngas.
The level of tar reduction, species generated, and how tar reduction correlates will be further
investigated in this study. It can be assumed that by pre‐treating the material using
torrefaction and by increasing the exergy of the feedstock by decreasing the O/C and H/C
ratios, a major increase in the HHV of the syngas can be observed. This could be a result of
utilizing less energy to drive off the water and hemicellulose compounds during gasification
thereby increasing the cold gas efficiency and overall efficiency of the gasification process.
With regards to torrefaction pretreatment variables of time and temperature, each should in
their own respect have an effect with temperature having dominating effects.
5
CHAPTER 2
LITERATURE REVIEW
2.1 Background
In recent decades, research and investment on renewable energy has increased in
rejection to our growing dependency on foreign fossil fuels and concerns of greenhouse gas
build up. Thermochemical processing of biomass provides opportunities and solutions for
renewable energy and value‐added products. Unlike other renewable energy processes, such
as current biodiesel or ethanol production methods, thermochemical processes such as
pyrolysis and gasification can generate energy and value‐added byproducts from a variety of
biomass feedstocks.
Gasification is a process that converts biomass into a combustible gas called ‘syngas’
that ideally contains all or most of its original energy content. In practice, gasification can
convert approximately 60‐90% of the energy in biomass into the gas. Gasification can be
achieved either by direct (using air or oxygen to generate heat through exothermic reactions)
or indirect (transferring of heat from outside of reactor to inside). The syngas produced can be
burned to generate heat for a boiler, engine, run a turbine to produce electricity, or converted
into synthetic fuels and chemicals.
The process was discovered in 1798 independently in France in England. It was
developed by 1850 to the point that much of the light in London was syngas from coal called

6
“town gas”. By 1920, many American towns and cities supplied gas to the residents for cooking
and lighting through local “gas works”. During WWII in Europe nearly one million downdraft
gasifiers were in full operation powering vehicles, boats, trains, and electrical generators. Being
depleted in petroleum but bountiful in coal, Germany licensed the Fischer‐Tropsch technology
to generate diesel. After the war, gasification lost interest and was replaced by cheaper
petroleum products [1].
Currently, interest in the technology has been revitalized globally utilizing coal as a
primary feedstock. Based on efficiency, the process is capable of recouping more energy than
direct combustion and has fewer emissions. Developments are also underway to supplement
the coal feedstock with woody biomass. One of the challenges of biomass gasification however
is the formation of tars which leads to fouling of downstream processes and poor emissions.
Tars are typically formed by complex reactions and are largely assumed to be oxygenated
aromatics and other organic compounds. Several studies have been conducted on tar
abatement including thermal, catalytic, or physical methods but tar removal still remains a
challenge.
One area that has not been reported however is the use of torrefaction as a
pretreatment for biomass prior to gasification. Torrefaction is a thermal process between 250
and 300°C under inert environments that thermally decomposes oxygenated fractions such as
hemicellulose. This study aims to investigate the effects of utilizing torrefied wood as a
feedstock for gasification. In particular, the study seeks to effects on the quality and yield of
syngas and tar.

7
2.2 Torrefaction
Torrefaction has recently gained interest as a possible means to upgrade biomass prior
to storage, transporting, and downstream thermochemical conversion. The process is a
thermal treatment of biomass between 200 and 300˚C in an inert atmosphere that is known to
increase the energy density by decomposing the reactive hemicellulose component. Reported
yields range 3‐25% condensables, 1‐15% non‐condensable gases, and 50‐95% solids depending
on reaction conditions and feedstock composition [3‐11].
Woody biomass, a highly studied material for torrefaction, is mainly composed of
hemicellulose, cellulose, lignin and small amounts of ash. The structure is a complex
arrangement of microfibrils, or bundles of cellulose covered with hemicellulose. Lignin fills the
void between these structures and is sometimes embedded within the amorphous portions of
the microfibrils. These major components have their own thermal stability with hemicellulose
decomposing between 225‐325˚C; cellulose at 305‐375˚C; and lignin 250‐500˚C [3]. During
torrefaction, the hemicellulose component is the largest fraction removed beginning with a
rapid decomposition rate followed by a more‐lengthy secondary charring of the hemicellulose
with increased holding time [3,4,5]. Portions of lignin have been observed to decompose or
transform while cellulose maintains its crystalline structure [6]. Yields of solids are generally
higher in the first step than in the second with higher temperatures degrading faster.
The removal of hemicellulose results in a physiochemical transformation of the solid
material. Elemental analysis has shown that the fractional makeup of carbon is increased up to
15‐20% while oxygen is reduced by up to 50% [3‐11]. By consequence, atomic ratios of H/C and
O/C are reduced from approximately 1.64 to 1.11 and from 0.82 to 0.49 respectively. Due to
8
the loss of oxygen, energy density have shown to increase up to 15% with an energy recovery
efficiency of over 90% from the starting biomass [7,8]. Extractable and volatile components
show reductions and moisture content tends to stabilize at 3% [6]. Physically, the torrefied
material becomes hydrophobic [7]. Temperature and residence time are the major variables
that influence solid composition, but some research has shown that temperature is most
dominant [8]. In general, the mass of solid residue decreases while gas, tar, and water increase
with temperature and residence times.
Hemicellulose is the most sensitive to the heat and may promote lignin degradation.
This phenomenon is believed to be due to the release of water and methanol with the
formation of a conjugated ethylenic bond. Acetic acid likely derived by thermolysis of acetyl
radical links to the xylose units of hemicellulose forming formic acid from the carboxylic group
of the pentosan‐glucoronic chain [6]. Molecules susceptible to hemolytic breaking of bonds on
heating existed in the extractables: colorants, tannins, resins. These extractables are also
known as initiators of torrefaction. DSC tests have verified that the initiators of decomposition
were found in the neutral solvent extractable compounds. These initiators were shown to
decrease during torrefaction. Reaction stages are classified by initiation (extractables),
propagation (hemicellulose, lignin), and termination (lignin) [8].
Similar to the before mentioned reactions, it has been shown that dehydration and
decarboxylation reactions cause a mass loss of the wood, although the lower heating value
remains stable. Hardwoods were found to produce more volatiles than coniferous wood (larch)
yielding more methanol and acetic acid in the condensable vapors. These volatiles that result in
tars upon condensation originate from the acetoxy‐ and methoxy‐groups present as side chains

9
in xylose units present in the xylan‐containing hemicellulose fraction. Energy density was
shown to improve from 17.7MJ/kg to 20.7 MJ/kg for untreated wood (90% retention of
energy). Condensable gases demonstrated large amounts of water formation along with acetic
acid, formic acid, methanol, lactic acid, furfural, hydroxyl acetone, and traces of phenol. Most
non‐condensable volatiles showed a predominance of carbon dioxide with some carbon
monoxide [9].
Torrefaction of biomass has been confirmed to improve the combustion properties. For
example, due to the reduction of hemicellulose in eucalyptus after torrefaction, reaction
kinetics and combustibility curves showed two well‐defined mass loss events that correspond
to the combustion of cellulose and lignin [4]. Torrefaction studies on reed canary grass, short
rotation willow coppice, and wheat straw showed an increase in combustion rate and
decreases in ignition time of volatiles and char when observed by differential thermal analysis
[5]. Qualitative assessments have shown that torrefied wood briquettes reduce sooting and
increase combustion rate [10].
2.3 Downdraft Gasification
The utilization of biomass for gasification has recently been an area of interest for clean
renewable energy development. The process is a thermochemical reaction of solid
carbonaceous fuel into combustible gas by partial oxidation. The resulting gas, known as
syngas, is a mixture of carbon monoxide, hydrogen, carbon dioxide, methane, nitrogen, and
small amounts of hydrocarbons. Syngas itself is highly versatile and can be utilized in a variety
of ways. For example, syngas can be catalytically upgraded to chemicals or fuels or combusted
directly to produce heat for generating electricity or operate an engine.
10
Two forms of gasifier reactors exist; fixed‐bed and fluidized bed. Fluidized bed reactors
involve a tubular reactor positioned vertically in which the gasifying reagent is blown from the
bottom causing fluidization of a bed of sand. Biomass is injected into the reaction zone where
it is converted into syngas and processed downstream. Fixed‐bed reactors have two
orientations either cocurrent or countercurrent. In a countercurrent reactor (or updraft), air is
fed from the bottom and fuel is fed from the top. Syngas exits the top. Cocurrent (or
downdraft) gasifiers have fuel enter the top and the air enter the sides while the syngas leaves
the bottom. The advantage of the downdraft gasifier is that there are smaller amounts of tar
produced [12].
Downdraft gasifiers have been proven reliable as they are fairly simple and robust for
conversion of biomass to syngas [12]. They have higher thermal efficiency, require low specific
oxygen consumption and can gasify feedstock with relatively high ash contents. Syngas
produced in a downdraft gasifier is suitable for firing and has low ash carryover, dust, and tar
and phenol content. Unlike fluidized‐bed reactors, downdraft gasifiers are not suitable for
scale‐up due to heat transfer and limited gas flow rates. However, downdraft gasifiers are seen
as an economically viable alternative for power generation in developing areas in remote
locations [13].
The amount of oxygen used in a thermochemical process ultimately determines the
products and temperatures of the reaction [1]. The amount of oxygen used relative to that
required for complete combustion is known as the equivalence ratio, ER (Φ). The ER
determines equilibrium temperatures and compositions for optimum biomass thermal
11
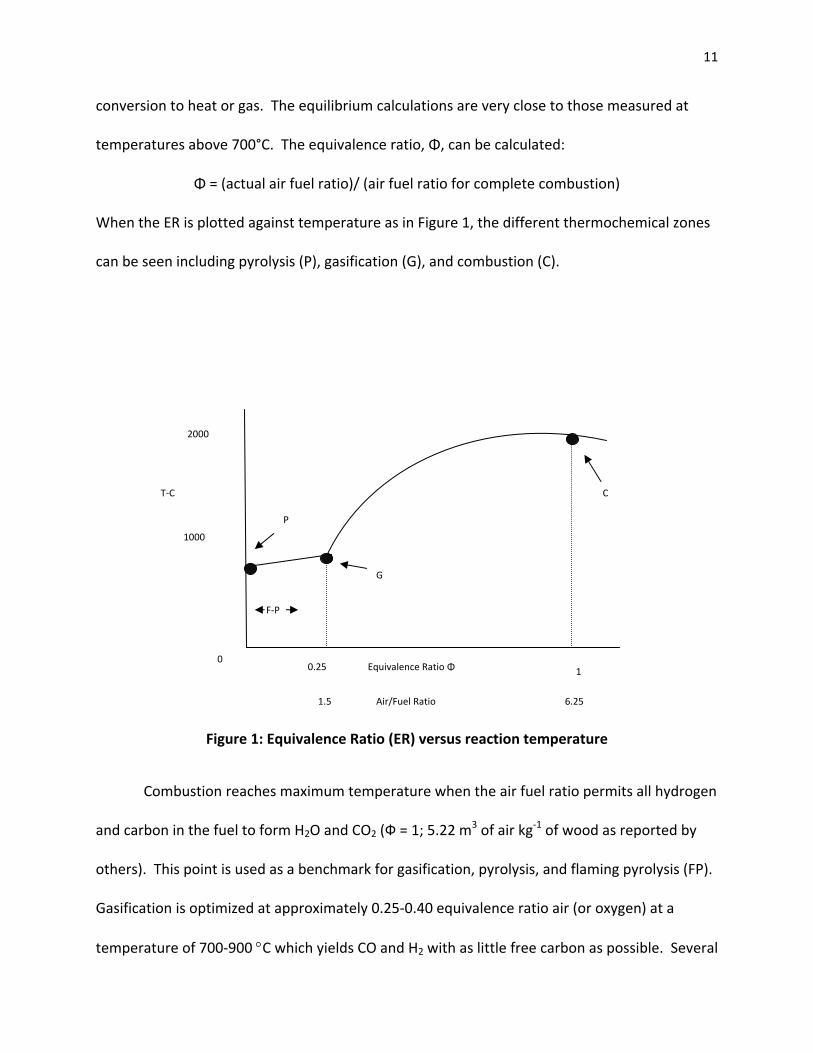
conversion to heat or gas. The equilibrium calculations are very close to those measured at
temperatures above 700°C. The equivalence ratio, Φ, can be calculated:
Φ = (actual air fuel ratio)/ (air fuel ratio for complete combustion)
When the ER is plotted against temperature as in Figure 1, the different thermochemical zones
can be seen including pyrolysis (P), gasification (G), and combustion (C).
2000
P
G
F‐P
T‐C C
1000
0 0.25 Equivalence Ratio Φ 1
Air/Fuel Ratio1.5 6.25
Figure 1: Equivalence Ratio (ER) versus reaction temperature
Combustion reaches maximum temperature when the air fuel ratio permits all hydrogen
and carbon in the fuel to form H2O and CO2 (Ф = 1; 5.22 m3 of air kg‐1 of wood as reported by
others). This point is used as a benchmark for gasification, pyrolysis, and flaming pyrolysis (FP).
Gasification is optimized at approximately 0.25‐0.40 equivalence ratio air (or oxygen) at a
temperature of 700‐900 °C which yields CO and H2 with as little free carbon as possible. Several
12
studies have analyzed the effects of equivalence ratio on syngas composition, calorific value,
and production rate in down draft gasifiers [14‐18]. Results are shown to vary although there is
consensus that ER for optimum syngas production typically occurs from 0.25‐0.45. Total
calorific value and carbon monoxide contents are optimized in this range while oxygen,
nitrogen, and carbon dioxide are minimized. Equivalence ratios below 0.25 that occur at
temperatures from 450‐600°C are known as pyrolytic gasification and produce a flammable gas
along with heavy tars. An increase in air flow rate during gasification will increase the ER and
has been shown to manipulate composition of syngas, pressure drop across gasifier bed, and
calorific value of syngas [19]. Changes in reaction temperature by result of changes in ER have
also been shown to affect the gas yield, and energy content [19].
Downdraft gasifiers are highly robust and can convert a variety of feedstocks such as
bagasse [21], rice husks [22], and olive husks [19] into usable syngas. Additionally, it is even
possible to co‐gasify biomass with coal [23,24]. Co‐gasification has been found to improve the
O/C and H/C ratios relative to biomass‐only gasification. As a result, this manipulation has been
shown to improve the low exergy content (maximum work that can be obtained) of biomass.
Attempts have also been made to model the kinetic rates of gasification based on
material balances and thermodynamic behavior [25, 26]. Thermodynamic analyses of gasifiers
have also been performed based on the empirical stoichiometric equations. Studies coupled
equilibrium relations or kinetic rate parameters in order to predict the yield of un‐converted
char in addition to predicting gas composition, calorific value, conversion efficiency, exit gas
temperature, endothermic heat adsorption rate, and gasifier power output. Modeling
predictions were then compared to experimental data.

13
2.4 Tar Analysis
One of the challenges of woody biomass gasification is the formation of tars in the
syngas that may lead to problems downstream. In 2005, a European renewable energy
committee developed a standard protocol for analyzing tars isokinetically and shared their
research [27]. Tars are usually formed by complex reactions that generate high molecular
weight hydrocarbons and are difficult to remove by conventional means including thermal and
catalytic cracking or physical methods [28]. Tar species can be classified into primary,
secondary, and tertiary tars. Primary tars are formed by decomposition of the building blocks
of biomass and contain oxygen in significant amounts. Secondary and tertiary tars are formed
by destruction of the primary compounds and recombination of fragments. In these processes,
oxygen and some hydrogen are removed. Updraft gasifiers produce largely primary tar;
downdraft gasifiers produce tertiary tar. Typically, downdraft gasifiers produced 1g tar per Nm3
of syngas [29].
Tar products have been identified from cellulose‐derived products (levoglucosan,
hydroxyacetaldehyde, and furfurals); phenolics and olefins; alkyl tertiary products (methyl
acenaphthylene, methylnaphthalene and toluene); and PAH’s, (benzene, indene, naphthalene,
acenaphthylene, anthracene, phenanthrene, pyrene) [30]. Tar yields and concentration of
these species have been shown to be dependent on the operation parameters of gasifiers such
as ER and reaction temperature as well as feedstock composition [31, 32]. Typically, lower
temperature and ER values will generate an increase in tar yields and species. Approximately
70‐90% of the mass of tar compounds include single ring and five ring hydrocarbons such as

14
benzene and perylene respectively. Benzene formation has been shown to increase with
temperature [33].
Abating tar production in syngas can be achieved by a variety of ways. Two‐stage
gasifiers have been shown to decrease tar concentration by having two reaction regions that
can elevate the operational temperature [34, 35]. Higher temperatures allow for additional
cracking thereby forming secondary and tertiary tar compounds. Addition of steam to
gasification has been shown to reform tars as well as increase syngas yield. Steam addition has
been shown to reduce the tar formation but not the molecular weight distribution of tars [36,
37]. Tar reduction of syngas from biomass can also be achieved by manipulating the feedstock
by co‐firing with coal to reduce the overall O/C and H/C ratios [38]. Addition of catalysts in situ
or downstream such as dolomite, olivine, and Ni‐based and alkali have been shown to reduce
tars marginally by 15% [39, 40].
2.5 Torrefaction Coupled with Gasification
Torrefaction has been analyzed as a pretreatment process for improving gasification
performance and economic viability [41]. Although biomass gasification at elevated
temperatures has been shown to decrease tar formation above operating temperatures of
950°C, torrefaction improves the calorific value and removes moisture for more suitable
gasification conditions even at lower operating temperatures [42]. It has been shown that
gasification of torrefied material may reduce the thermodynamic losses caused by over‐
oxidation of wood. The chemical exergy preserved in the product gas has been shown to
increase as it is not devoted to driving the torrefaction reaction (72.6% exergy versus 68.5%)
but showed no change in overall efficiency of the gasifier [43]. Syngas quantity has also been
15
shown to increase as a result of torrefaction due mainly to lower O/C ratios. It has also been
shown that CO2 production is not influenced by torrefaction while H2 and CO increased by 7%
and 20%, respectively, relative to un‐torrefied parent wood [44]. Torrefied materials have also
shown an increase in higher heating values [45] and an increase in grindability [46] which
improved its gasification and flow properties. Conversion of torrefied wood to synthetic
natural gas (SNG) has also been achieved [47].
16
CHAPTER 3
EXPERIMENTAL PLAN
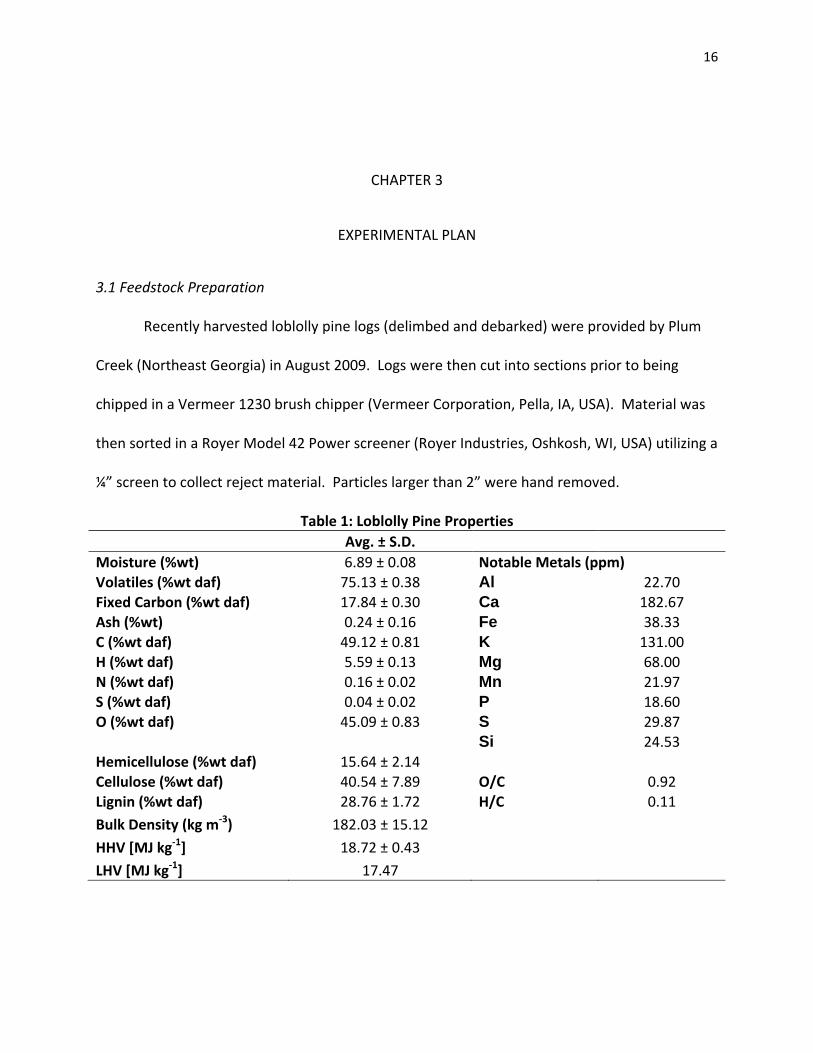
3.1 Feedstock Preparation
Recently harvested loblolly pine logs (delimbed and debarked) were provided by Plum
Creek (Northeast Georgia) in August 2009. Logs were then cut into sections prior to being
chipped in a Vermeer 1230 brush chipper (Vermeer Corporation, Pella, IA, USA). Material was
then sorted in a Royer Model 42 Power screener (Royer Industries, Oshkosh, WI, USA) utilizing a
¼” screen to collect reject material. Particles larger than 2” were hand removed.
Table 1: Loblolly Pine Properties Avg. ± S.D. Moisture (%wt) 6.89 ± 0.08 Notable Metals (ppm) Volatiles (%wt daf) 75.13 ± 0.38 Al 22.70 Fixed Carbon (%wt daf) 17.84 ± 0.30 Ca 182.67 Ash (%wt) 0.24 ± 0.16 Fe 38.33 C (%wt daf) 49.12 ± 0.81 K 131.00 H (%wt daf) 5.59 ± 0.13 Mg 68.00 N (%wt daf) 0.16 ± 0.02 Mn 21.97 S (%wt daf) 0.04 ± 0.02 P 18.60 O (%wt daf) 45.09 ± 0.83 S 29.87
Si 24.53 Hemicellulose (%wt daf) 15.64 ± 2.14 Cellulose (%wt daf) 40.54 ± 7.89 O/C 0.92 Lignin (%wt daf) 28.76 ± 1.72 H/C 0.11
Bulk Density (kg m‐3) 182.03 ± 15.12
HHV [MJ kg‐1] 18.72 ± 0.43
LHV [MJ kg‐1] 17.47

17
3.2 Torrefaction in Rotary Kiln
Approximately 100kg of wet pine was loaded in a rotary kiln for the torrefaction process
(Fig. 2). The kiln is a batch system with a 3m3 octagonal shaped mild steel reactor (1) externally
heated by a 1.3mmBtu hr‐1 natural gas burner (2). Volume of the pine chips comprised of less
than 1m3 of the reactor volume. The system rotates on its axis with ports allowing inert gas
through one end (3) and a 16” pipe to allow exhaust to escape (4). Nitrogen is supplied
concentric to the axis of rotation via a rotary union inlet from a liquid tank at 8‐17m3 h‐1 (3). An
external motor drives the reactor rotation from the gas inlet end (4). Rotation is set at 0.75rpm
by a TECO Speecon 7300CU controller (TECO Electric and Machinery Co., Taiwan) to minimize
size reduction of the material and fine dust formation. The system temperature is regulated by
a Honeywell UDC2500 controller (Fort Washington, PA) allowing a setpoint temperature to be
adjusted with a PID function relayed to the Maxon Model 400 natural gas burner (Honeywell,
Muncie, Indiana). The burner (2) is equipped with a Honeywell burner control UV flam
amplifier. Temperature is monitored at the wall of the reactor (5). Additional temperature
readings were recorded at 15, 30, and 45cm from the axis of rotation inside the reactor to
analyze the temperature distribution in the feedstock (1). An additional controller monitors the
kiln upper setpoint with a thermocouple at the opposite end. Vapors generated will be
incinerated with a Midco Incinomite 0.1‐0.8mmBtu hr‐1 burner (Midco International, Chicago,
IL) before exhausting (6).

18
Figure 2: Rotary Kiln used for torrefaction and drying. (1) Reactor, (2) Natural Gas Burner, (3) Nitrogen Inlet and Drive Motor, (4) Exhaust, (5) Reactor Wall and temperature reading, (6)
Exhaust and incineration
5 6
43 1
2
The material was torrefied at various temperatures and hold times (Table 2) in triplicate.
Mass balances and reactor temperature were analyzed for each experimental run. Mass
balance was evaluat dry the following calculation: ed on a basis using
% 100%
. . (1)
The moisture fraction, m.c., was determined by mass difference of drying six samples of the
loaded material at 50°C for 48 hours. Temperature was be monitored with a Campbell Scientific
CR21X data logger. A ramping procedure of 5 hours of drying at 120˚C followed by 30 minutes

19
at 200˚C (with nitrogen) was implemented, and then the target temperature for desired hold
time. A control sample of dried pine was generated at 120˚C for 5 hours. Nitrogen flow during
shutdown was be set at 8m3 hr‐1 with a closed flap on the exhaust during cooling to prevent air
intrusion and combustion.
Table 2: Torrefaction experimental plan with temperatures and hold times Run Torrefaction Temperature
(˚C) Hold Time (min)
1 250 30 2 275 30 3 300 30 4 250 60 5 275 60 6 300 60
7 (Control) 120 300
3.3 Feedstock and Torrefied Material Chemical Analysis
Bulk densities of feedstock (dried biomass, torrefied materials) were determined by
ASTM E873. Random sampling of material was then ground in a Tecator cyclone mill (FOSS,
MN) for further analysis. Elemental carbon, hydrogen, nitrogen, sulfur, and oxygen (ultimate
analysis) were measured using a LECO brand (Model CHNS‐932, Leco Co., MI) with optional
pyrolysis furnace (Model VTF‐900) following protocols outlined in ASTM D5291 and D3176.
Analysis of moisture, volatiles, and ash were analyzed thermogravimetrically using a LECO
brand TGA (Model TGA701, Leco Co., MI) following ASTM D5142 and E1131.
Samples were analyzed for carbohydrate structure including cellulose, hemicellulose,
and lignin content using ANKOM200 fiber analyzer (ANKOM Technology, NY). Operational
methods outlined by manufacturer included neutral detergent fiber in feeds filter bag
technique (ANKOM Technology Method 6) and acid detergent fiber in feeds filter bag technique

20
(ANKOM Technology Method 5). Metals analysis was conducted with an Elmer (Model ‐ Elan
6000, PerkinElmer, Canada) inductively coupled plasma (argon) spectrometer (ICP) equipped
with a mass spectrometer (MS) detector system. Samples were first digested as described by
EPA Method 3051.
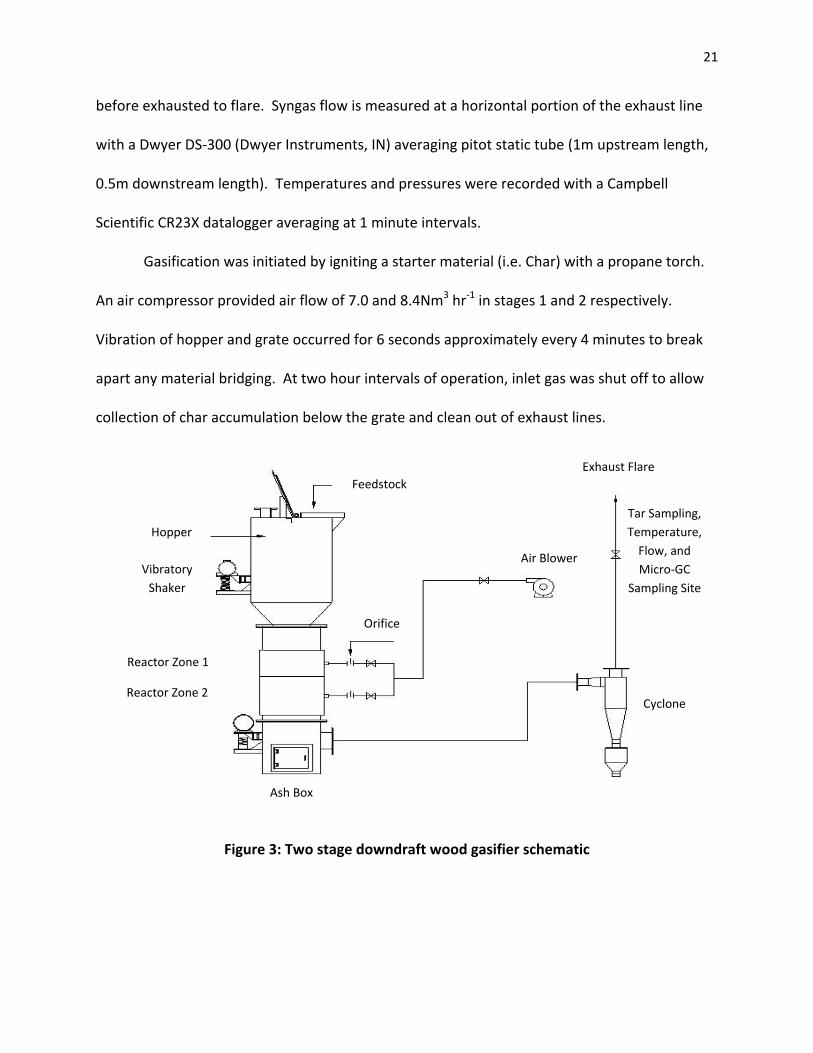
3.4 Gasification
Material was gasified in a 10kg hr‐1 45kW fixed bed down draft wood gasifier shown in
Fig. 3 manufactured by Termoquip (Campinas, Brazil). The system is a two‐stage gasifier fitted
with a cyclone and exhaust flare. The hopper can hold approximately 0.4 m3 (~70kg dry wood)
allowing over 6 hours of operation time. Hopper dimensions are 0.9m in height and 0.7m in
diameter. I programmable vibratory shaker is attached to the hopper with prongs protruding
into the material to break it up during operation. Below the hopper a tapered section (0.25m
height) funneling into the two stage reactor zone (0.8m in height, 0.3m in diameter) that is
internally insulated with refractory brick. The first stage has six tuyeres positioned at 90° and
the second stage has six tuyeres positioned at 45° downward at 45° counter‐clockwise angle.
Air is injected using a blower and measured prior entering the reactor by measuring the
pressure drop across orifice plates. At the bottom of the reactor zone is a grate allowing the
material to rest upon with ¼” holes to allow gas to pass through. The grate is attached to a
programmable vibratory shaker to prevent bridging. Below is a catch chamber for ash and char
to collect and a separate line (2”I.D.) to exhausting cyclone. Thermocouples are positioned in
the middle of reaction zones, below the grate, along the exhaust line leading into the cyclone.
Pressure transducers recorded the pressure drop across the material bed to monitor any
backpressure build up. After the cyclone, syngas flows down a 2”I.D. externally insulated pipe
21
before exhausted to flare. Syngas flow is measured at a horizontal portion of the exhaust line
with a Dwyer DS‐300 (Dwyer Instruments, IN) averaging pitot static tube (1m upstream length,
0.5m downstream length). Temperatures and pressures were recorded with a Campbell
Scientific CR23X datalogger averaging at 1 minute intervals.
Gasification was initiated by igniting a starter material (i.e. Char) with a propane torch.
An air compressor provided air flow of 7.0 and 8.4Nm3 hr‐1 in stages 1 and 2 respectively.
Vibration of hopper and grate occurred for 6 seconds approximately every 4 minutes to break
apart any material bridging. At two hour intervals of operation, inlet gas was shut off to allow
collection of char accumulation below the grate and clean out of exhaust lines.
Ash Box
Vibratory Shaker
Reactor Zone 2
Orifice
Reactor Zone 1
Feedstock
Hopper Tar Sampling, Temperature, Flow, and Micro‐GC
Sampling Site
Cyclone
Exhaust Flare
Air Blower
Figure 3: Two stage downdraft wood gasifier schematic

22
Gasifier performance was evaluated for affects of the material on the following:
1. The air to fuel ratio is calculated on the entirety of the run by summing up the total air
input and total feed consumed.
:
(2)
Where O2 feed rate is the rate of oxygen provided to the system assuming 21% concentration in
air. Total fuel feed rate is the rate of feed consumed throughout the duration of the run based
on a function of volumetric displacement and bulk density depending and elemental carbon
concentration of the feedstock.
2. The conversion of gas on a carbon basis indicates the efficiency to utilize the feedstock’s
potential energy.
%,
100% (3)
Where produced carbonaceous gas (i.e. methane, carbon monoxide, carbon dioxide) are
measured using a Micro‐GC as explained in section 3.6. Total feed of carbon is the total carbon
consumed in the feed as determined by the amount volume displaced after the run, bulk
density of the material, and elemental carbon concentration of the feedstock.
3. Cold gas efficiency is a metric to determine the effective energy transfer of the
feedstock to combustibl syngas. e
% . .
100% (4)
Where produced gas is the syngas species of hydrogen, carbon monoxide, and methane
multiplied by their respective HHV or higher heating values. Feedstock is the amount of
feedstock consumed multiplied by its HHV as determined in section 3.3.
23
Other metrics evaluated during the gasification runs include dry chip feed rate (kg h‐1),
chip moisture content (%,wet basis), dry gas HHV (MJ m‐3), gas yield (m3 kg‐1, db), char yield (%),
tar yield (g m‐3), dry air in (kg kg‐1, db feed), energy yield (MJ kg‐1, db feed), total energy out
rate (MJ h‐1), and mass conversion efficiency (%).
3.5 Isokinetic Tar Sampling
Tar sampling of the syngas followed the technical report standard, “Sampling and
analysis of tar and particles in biomass producer gas,” as prepared under CEN BT/TF 143 WI CSC
03002.4TC [27]. Figure 4 shows the probe and tar sampling apparatus. Module 1 is an inline
probe (¼” I.D.) was inserted directly into the middle gas stream pipe (2”I.D.) to draw the syngas
and tar samples. The probe was positioned approximately 0.2m downstream from averaging
pitot static site. The line (40cm length) was kept at 500°C by heat tape (Omega Engineering, CT)
and feedback controller to prevent condensation of the tars. Gases passed through to module
2 which has an quartz filter (90mm L; 2mm thick; 99.9% collection efficiency at 0.3μm DOP) to
collect particulates (Advantec MFS Inc., CA). These particulates were measured gravimetrically
at the end of the run. Gases then flowed into module 3, a train of six glass impinger bottles
with the first five filled with 100mL of isopropanol. Bottles 1, 2, and 4 were submerged in
ambient water at 20˚C and the rest were submerged into an ice and salt bath at ‐4˚C. In
module 4, a diaphragm pump maintained flow at 2L min‐1. In that same module, sub‐modules
such as flow meter, static pressure meter, and thermocouple were in place to record data for
isokinetic normalization. A sampling port at the exhaust of tar sampler directed gases to an
Agilent GC for analysis. Collected tar samples were analyzed as per the CEN protocol via GC‐MS
and GC‐FID analysis. Three samples were drawn at steady state conditions for 1 hour each
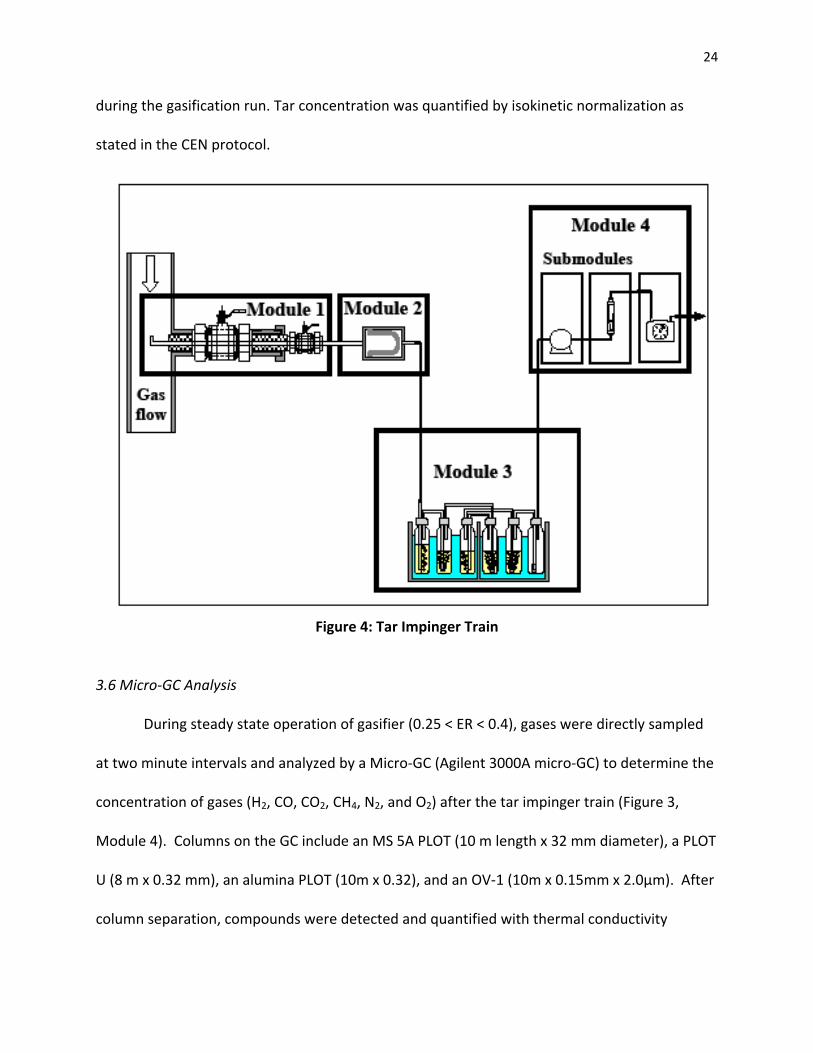
24
during the gasification run. Tar concentration was quantified by isokinetic normalization as
stated in the CEN protocol.
Figure 4: Tar Impinger Train
3.6 Micro‐GC Analysis
During steady state operation of gasifier (0.25 < ER < 0.4), gases were directly sampled
at two minute intervals and analyzed by a Micro‐GC (Agilent 3000A micro‐GC) to determine the
concentration of gases (H2, CO, CO2, CH4, N2, and O2) after the tar impinger train (Figure 3,
Module 4). Columns on the GC include an MS 5A PLOT (10 m length x 32 mm diameter), a PLOT
U (8 m x 0.32 mm), an alumina PLOT (10m x 0.32), and an OV‐1 (10m x 0.15mm x 2.0μm). After
column separation, compounds were detected and quantified with thermal conductivity
25
detectors that are calibrated using a refinery gas calibration mix (Agilent, part #5184‐3543) and
comparable syngas mixture (2.27% CH4, 1.925% O2, 13.93% CO2, 14.89% H2, 24.08% CO, and N2
by balance). Calibration was conducted using a one‐point calibration at six intervals to achieve
consistency at the start of every run. When not in operation, the Micro‐GC was left on bake‐
out settings to remove and residual deposits. Molar‐% concentrations of gases were averaged
over the course of the sampling interval for analysis.
3.7 GC/MS Analysis
Tar samples were analyzed with a Hewlett Packard 5973 Mass Selective Detector
HP5890 GC. The column was an HP5MS capillary column (30m x 0.25mm x 0.25μm film
thickness). Oven temperature was set at 40ºC with a 3 minute hold and ramped at 8ºC min‐1 to
240ºC and held for 1 minute. Inlet temperature was set at 230ºC with a flow rate of 1ml min‐1.
Scan parameters of the mass spectrometer was set at 20‐500 mass units. Injection volume was
1μl splitless. Compounds were identified from an internal library using statistical analysis to
establish species based on highest probability. All tar samples were tested to determine the
most frequent appearing compounds for further quantification in a GC‐FID.
3.8 GC‐FID Analysis
The second replication sample from each run was tested in an HP5890 Gas
Chromatograph Series II GC‐FID. Temperature program in the oven was set to 50ºC and held for
0.5 min before ramping 8ºC min‐1 to 180ºC. Inlet temperature was set at 200ºC, detector
temperature was set at 220ºC, and flow was set to 1.8ml min‐1. Injection volume of sample was
1μl splitless. Column was an HP5 capillary column with dimensions 30m x 0.25mm x 0.25μm.

26
Tar species were quantified using external standards and developing standard curves based on
the results from the GC/MS. Standard curves are located in the Appendix part B.
3.9 ANOVA Statistical Analysis
SigmaPlot software was utilized to conduct ANOVA (analysis of variance) statistical
methods on dependent variable outcomes from torrefaction and gasification. Initial tests were
used to determine if data failed or passed normal distribution or equal variance analysis.
Kruskal‐Wallis one way analysis of variance was utilized to observe the statistical significance of
each dependent outcome. Comparison methods determined if effects of temperature and
residence time of torrefaction was statistically relevant to determine outcome or if a difference
of means existed between different treatments. Outcomes analyzed included torrefaction
yield, normalized syngas product flow out, normalized syngas generated per unit mass, syngas
gas species yield, tar concentration in syngas, and energy dependent variable outputs.
27
CHAPTER 4
RESULTS AND DISCUSSION
4.1 Torrefaction
All torrefaction conditions outlined in the experimental plan were performed and
replicated in triplicate. Temperatures, yields, and energy consumption were recorded
throughout each process and can be reviewed in further detail in Table 4 of the Appendix.
Figure 5 shows an example of the internal reactor temperature of the biomass for torrefaction
at 300°C held for 60 minutes. The preliminary ramp conditions were held at 120°C for 5 hours
(Fig. 5: 20 minutes to 320 minutes) to dry the material as the moisture content average ranged
from 19.97% to 40.35% as received. Once the drying process was complete, the reactor was set
to 200°C. This step was performed to allow all material in the reactor to absorb sufficient heat
and reach obtain even temperature distribution throughout the reactor. This was held for 30
minutes before ramping up to target conditions. During the ramp phase to the target
temperature, settings were monitored manually to prevent overshooting in the system. The
residence time began when the average temperature of all thermocouples inside the reactor
were ±5°C of target temperature (Fig. 5: 380 minutes to 440 minutes). Temperatures were held
±5°C of target temperature for their respective durations as hysteresis was observed. Once the
residence time was achieved, the natural gas burner system was shutdown, exhaust valves
were closed off to prevent oxygen combusting the material, and doors to the reactor open to

28
cool the reactor. Rotation of the kiln continued for two hours after the operation to facilitate
cooling and prevent hotspots. Nitrogen continued to purge into the system at a flow rate of 3
m3 hr‐1. The subsequent day, the reactor was opened and the solid material was collected and
weighed.
Figure 5: Temperature profile in batch rotary kiln
0
50
100
150
200
250
300
0 60 120 180 240 300 360 420
Tempe
rature (ºC)
Time (minutes)
5 hours Drying ReactionTime
4.2 Solids Yields
Figure 6 shows the solid yields of torrefied pine as a function of residence time and
temperature. Percentage changes within replications of each treatment were consistent within
±5% standard deviations of the average value. Torrefaction at 250°C yielded 87.01% and
81.89% for 30 and 60 minute residence times respectively. Torrefaction at 275°C yielded

29
66.00% and 61.40% for the different times. Treatment at 300°C resulted in yields of 46.58%
and 42.70%. Higher temperature and longer residence times result in decreased solids yield.
Figure 6: Yield of torrefied loblolly pine
With respect to other studie tent with the predicted
ence
).
and chemical properties of the torrefied pine under different
treatments of temperature and residence time. Moisture content remained below 3% for
30
40
50
60
70
80
90
100
225 250 275 300 325
Mass retaine
d as so
lid(%
wt d
af)
Temperature (ºC)
30 minutes
60 minutes
s in the literature, these values are consis
outcomes. ANOVA statistical analysis demonstrates that the torrefaction yield outcomes
passed the normality test (P=0.600) and equal variance test (P=0.927) and that there is a
statistical difference between treatments. Temperature had a dominant effect over resid
time. Tukey test failed for on significance of difference of means between residence times
under fixed temperature conditions (i.e. torrefaction 250ºC at 60 minutes versus 30 minutes
4.3 Torrefied Material Properties
Table 3 shows the physical
30
250ºC a
ion
cellulose decreased and lignin
increas
nd
and
.15 kg m‐3. This
value d
nd 275ºC conditions and fell below 2% for 300ºC treatments. Volatile content declined
from 75.13% from dried wood to as low as 44.70% in 300°C for 60 minutes torrefied wood.
Total fixed carbon increased from 17.84% in the control to 53.20% in 300°C for 60 minute
torrefied wood. Total ash content increased with increased torrefaction temperatures and
residence times but remained below 1% for all treatments.
Composition of hemicellulose, cellulose, and lignin experienced changes in composit
between torrefaction treatments. In general, hemicellulose and
ed with increased temperature and residence time. The hemicellulose of the dried
loblolly pine was 15.64% and was reduced to 4.27% in torrefied wood at 250ºC for 30 minutes.
This continued to decline to 1.66% and 0.68% for 250ºC at 60 minutes and 275ºC for 30
minutes, respectively. An increase in hemicellulose was observed for torrefaction temperature
275ºC at 60 minutes, 300ºC for 30 minutes, and 300ºC for 60 minutes to 3.17%, 4.86%, a
3.07%, respectively. Cellulose declined consistently for 250ºC and 275ºC treatments but fell to
4.46% and 1.41% in the 300ºC temperatures. Lignin increased with extended torrefaction
conditions from 28.76% in the dried pine to 50.72% in 300ºC for 60 minutes.
Bulk density of the material consistently decreased with increased torrefaction time
temperature. Pine chips on a dry ash, moisture free basis had a density of 182
eclined with each treatment to as low as 139.03 kg m‐3 for torrefied pine at 300°C at 60
minutes.
31
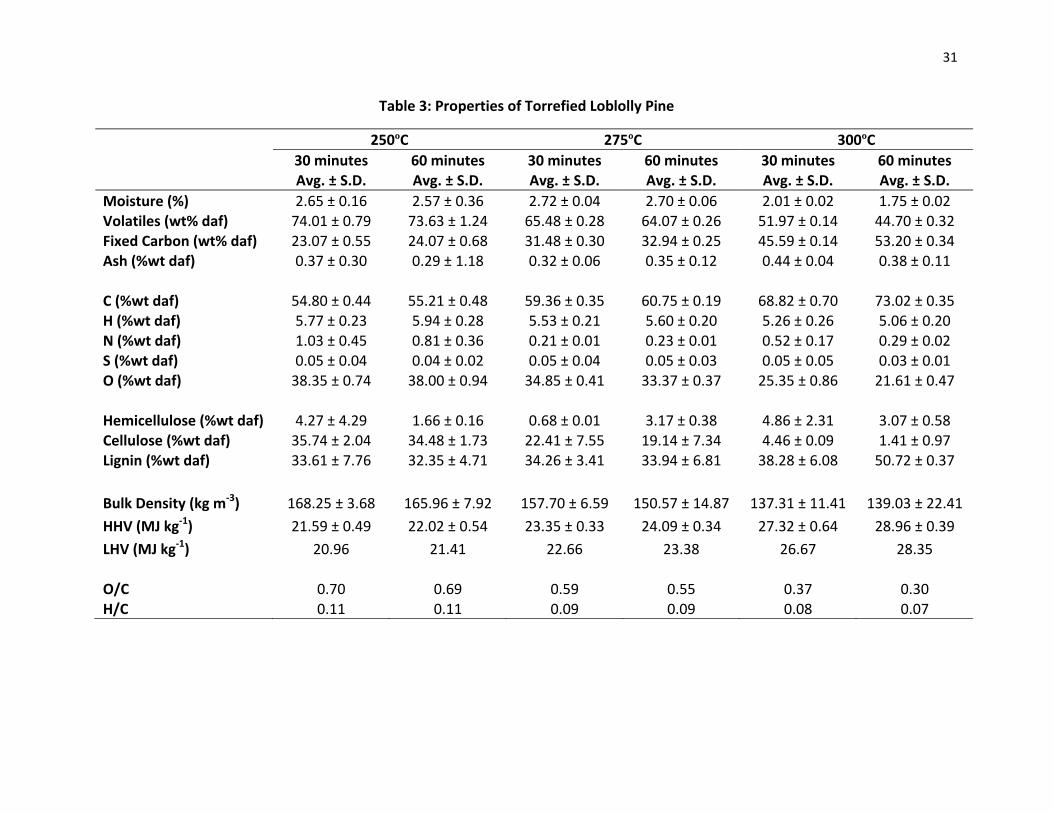
Table 3: Properties of Torrefied Loblolly Pine
250ºC 275ºC 300ºC 30 minutes 60 minutes 30 minutes 60 minutes 30 minutes 60 minutes Avg. ± S.D. Avg. ± S.D. Avg. ± S.D. Avg. ± S.D. Avg. ± S.D. Avg. ± S.D.
Moisture (%) 2.65 ± 0.16 2.57 ± 0.36 2.72 ± 0.04 2.70 ± 0.06 2.01 ± 0.02 1.75 ± 0.02 Volatiles (wt% daf) 74.01 ± 0.79 73.63 ± 1.24 65.48 ± 0.28 64.07 ± 0.26 51.97 ± 0.14 44.70 ± 0.32 Fixed Carbon (wt% daf) 23.07 ± 0.55 24.07 ± 0.68 31.48 ± 0.30 32.94 ± 0.25 45.59 ± 0.14 53.20 ± 0.34 Ash (%wt daf) 0.37 ± 0.30 0.29 ± 1.18 0.32 ± 0.06 0.35 ± 0.12 0.44 ± 0.04 0.38 ± 0.11
C (%wt daf) 54.80 ± 0.44 55.21 ± 0.48 59.36 ± 0.35 60.75 ± 0.19 68.82 ± 0.70 73.02 ± 0.35 H (%wt daf) 5.77 ± 0.23 5.94 ± 0.28 5.53 ± 0.21 5.60 ± 0.20 5.26 ± 0.26 5.06 ± 0.20 N (%wt daf) 1.03 ± 0.45 0.81 ± 0.36 0.21 ± 0.01 0.23 ± 0.01 0.52 ± 0.17 0.29 ± 0.02 S (%wt daf) 0.05 ± 0.04 0.04 ± 0.02 0.05 ± 0.04 0.05 ± 0.03 0.05 ± 0.05 0.03 ± 0.01 O (%wt daf) 38.35 ± 0.74 38.00 ± 0.94 34.85 ± 0.41 33.37 ± 0.37 25.35 ± 0.86 21.61 ± 0.47
Hemicellulose (%wt daf) 4.27 ± 4.29 1.66 ± 0.16 0.68 ± 0.01 3.17 ± 0.38 4.86 ± 2.31 3.07 ± 0.58 Cellulose (%wt daf) 35.74 ± 2.04 34.48 ± 1.73 22.41 ± 7.55 19.14 ± 7.34 4.46 ± 0.09 1.41 ± 0.97 Lignin (%wt daf) 33.61 ± 7.76 32.35 ± 4.71 34.26 ± 3.41 33.94 ± 6.81 38.28 ± 6.08 50.72 ± 0.37
Bulk Density (kg m‐3) 168.25 ± 3.68 165.96 ± 7.92 157.70 ± 6.59 150.57 ± 14.87 137.31 ± 11.41 139.03 ± 22.41
HHV (MJ kg‐1) 21.59 ± 0.49 22.02 ± 0.54 23.35 ± 0.33 24.09 ± 0.34 27.32 ± 0.64 28.96 ± 0.39
LHV (MJ kg‐1) 20.96 21.41 22.66 23.38 26.67 28.35
O/C 0.70 0.69 0.59 0.55 0.37 0.30 H/C 0.11 0.11 0.09 0.09 0.08 0.07
32
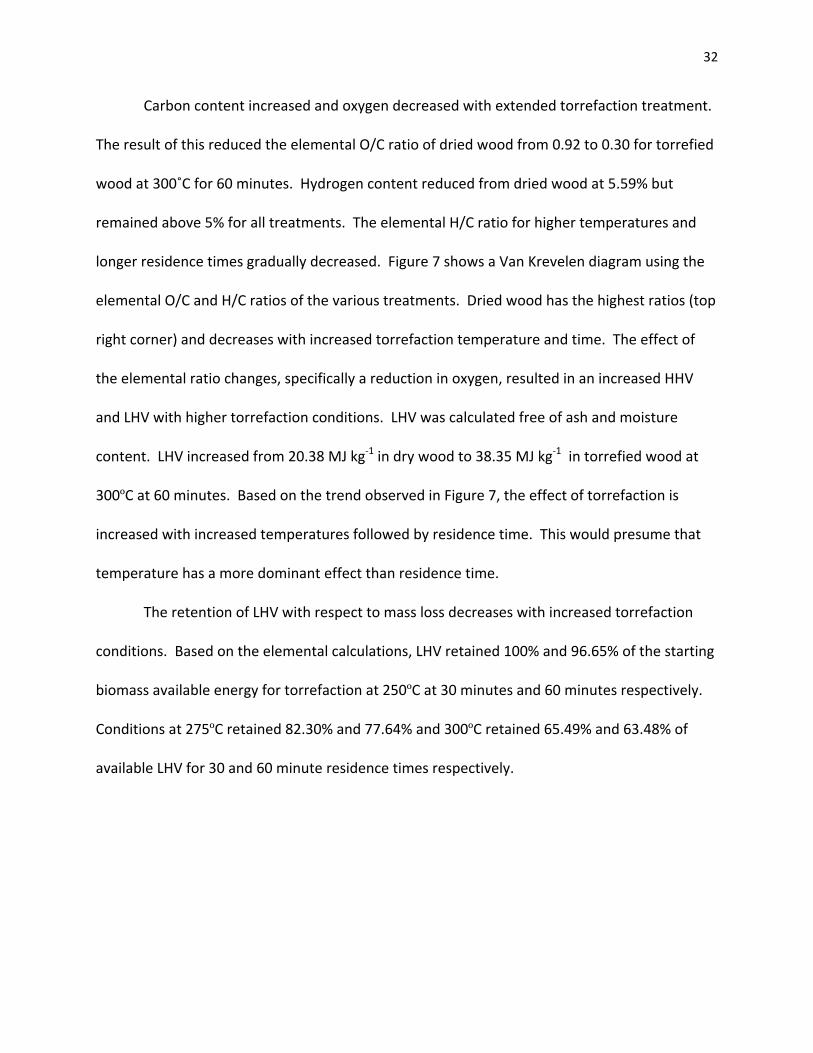
Carbon content increased and oxygen decreased with extended torrefaction treatment.
The result of this reduced the elemental O/C ratio of dried wood from 0.92 to 0.30 for torrefied
wood at 300˚C for 60 minutes. Hydrogen content reduced from dried wood at 5.59% but
remained above 5% for all treatments. The elemental H/C ratio for higher temperatures and
longer residence times gradually decreased. Figure 7 shows a Van Krevelen diagram using the
elemental O/C and H/C ratios of the various treatments. Dried wood has the highest ratios (top
right corner) and decreases with increased torrefaction temperature and time. The effect of
the elemental ratio changes, specifically a reduction in oxygen, resulted in an increased HHV
and LHV with higher torrefaction conditions. LHV was calculated free of ash and moisture
content. LHV increased from 20.38 MJ kg‐1 in dry wood to 38.35 MJ kg‐1 in torrefied wood at
300ºC at 60 minutes. Based on the trend observed in Figure 7, the effect of torrefaction is
increased with increased temperatures followed by residence time. This would presume that
temperature has a more dominant effect than residence time.
The retention of LHV with respect to mass loss decreases with increased torrefaction
conditions. Based on the elemental calculations, LHV retained 100% and 96.65% of the starting
biomass available energy for torrefaction at 250ºC at 30 minutes and 60 minutes respectively.
Conditions at 275ºC retained 82.30% and 77.64% and 300ºC retained 65.49% and 63.48% of
available LHV for 30 and 60 minute residence times respectively.
33
0.00
0.02
0.04
0.06
0.08
0.10
0.12
0.00 0.20 0.40 0.60 0.80 1.00
Elem
ental H
/C Ratio
Elemental O/C Ratio
Increased torrefaction temperature & time
Figure 7: Van Krevelen diagram of torrefied material
4.4 Downdraft Gasification
All torrefied material and dried wood (control) were gasified as outlined in the
experimental plan for a total of 22 runs. Temperature profiles, mass yields, and gas
composition were recorded throughout the duration of each experiment. Before loading
material into the hopper, remnants of the previous runs in the reactor zone and lower portion
of the hopper were measured for displaced volume and back calculated to find the remaining
mass based on bulk density. This value was then used to estimate the duration required to
consume the remaining material based on the previous runs’ air to fuel requirements.
Replications of the treatments (i.e. Torr250_30m) were done in three consecutive gasification
runs to mitigate overlapping of different materials in subsequent runs. Once loaded, the
34
gasifier was ignited for experiment and all subsequent calculations were based on the material
investigated.
Gasification runs were approached by controlling the input parameters such as
equivalence ration (ER) to approximately 0.25 and gasification zone temperature to
approximately 800ºC to maintain consistency. ER values were determined prior to each run
based on the compositional property values provided in the ultimate analysis data of the
feedstock. This calculation was then used to determine the required air input rates to maintain
an ER value of 0.25. Detailed results and calculations of all runs can be seen in the Appendix
Tables 5‐9. Although the intent of controlling the airflow to maintain consistency was there,
the gasifier system occasionally limited the operators’ ability to manipulate air flow due to
pressure drop across the reactor bed or increased pressure in the system adding resistance to
the air blower.
Figure 9 shows a temperature profile of a control run (Rep 2). Once the gasifier was
initiated (20 minutes) by an external flame the system was allowed to heat up until steady state
conditions were achieved. Thermocouples were placed in the reduction zone, gasification zone,
syngas zone (below grate), and at the sampling site of the impinger sampling port. Steady state
was considered to be achieved when the gasification zone maintained a consistent temperature
and syngas temperature reached 400°C. Once the remnant material was calculated to be
consumed, the tar sampling and micro‐GC sampling commenced. Each sampling interval was
done for 60 minutes three times during the course of the run (i.e. Figure 9: 120‐180 minutes;
225‐285 minutes; 310‐370 minutes). Prior to the first sampling and between each sampling

35
Figure 8: Temperature profile of downdraft gasifier during Control run Rep 1
0
100
200
300
400
500
600
700
800
900
1000
1100
0 20 40 60 80 100 120 140 160 180 200 220 240 260 280 300 320 340 360 380 400
Tempe
rature (ºC)
Time (minutes)
Reduction Zone Gasification Zone Syngas Zone Syngas at Sampling Site
Start
Temporary Shutdown End
SamplingRep 1
SamplingRep 2
SamplingRep 3

36
interval the gasifier was temporarily shutdown (i.e. 200 minutes) to collect char and clean any
exhaust pipe to prevent clogging.
Table 5 of the Appendix outlines the results of inputs and outputs for all gasification
runs. Durations of each run were initiated not at the time of igniting the gasifier but at the time
the remnant material was calculated to be consumed and the material of interest began to
reach the gasification zone. Durations were dependent on the remnants of the previous run
and how long the experiment was conducted for. On average runs operated approximately 180
minutes but were as low as 38 minutes and as high as 285 minutes. Material weight was
calculated as that which was consumed during the duration. Material properties such as
moisture and HHV were utilized for future calculations. Total air in was found by integrating
the flow rates entering the system during the course of the system. Syngas flow out was
calculated using the same method and it must be noted that temporary shutdown procedures
were compensated for in this calculation. Average gasification and average syngas temperature
were used for additional calculations and analysis. These values average at approximately
807°C±18.15 for the gasification zone and 278.31°C±12.31 for the syngas sample port site.
Table 6 in the Appendix outlines the calculated rates for all gasification runs. The dry
rate was calculated by the material that was consumed for the time it was consumed. These
values ranged as low as 2.83 kg hr‐1 to as high as 10.12 kg hr‐1. Average consumption rate was
6.81 kg hr‐1 for all material. In general, the consumption rate declined with increased
torrefaction temperature and residence time although this cannot be proven statistically
significant. Repetition 3 of torrefied material at 250°C for 30 minutes was higher to other
repetitions and was considered an outlier to other runs do to the problems of pressure drop
37
across the fixed bed and air in control related to that particular run. Repetition 2 of torrefied
pine at 300°C for 60 minutes was also considered an outlier due to problems with air flow in.
Char yield was calculated by measuring the total char produced during the duration of
the run of interest. Again, repetition 3 of torrefied biomass at 250°C for 30 minutes had high
char yield caused by operators adjustment of the vibratory shaker to decrease pressure drop
across the grate bed. On average, char yield was 1.42% and remained below 1% for most runs.
Rates of air in and syngas were calculated based on the total air in and total syngas out
monitored for the duration of the run. Average air in was 12.78 Nm3 hr‐1 or 2.45 kg kg‐1 of
material. Air required on a kg kg‐1 basis in general increased with increased torrefaction
temperature and residence time. Control values required as low as 1.63 kg air kg‐1 of material
opposed to torrefied material 3.18 kg kg‐1 for torrefied material at 300°C at 60 minutes in
repetition 1 (Torr_60m rep 2 and Torr250_30m rep 3 are considered outliers).
Total syngas out was normalized based on molar‐% of nitrogen entering the system to
that recorded by the micro‐GC (See Appendix Table 8). This normalized rate averaged 18.55
Nm3 hr‐1 for all the runs and fell as low as 13.10 Nm3 hr‐1 for torrefied material at 275°C for 60
minutes repetition 2 to as high as 24.44 Nm3 hr‐1 for torrefied pine at 250°C for 60 minutes
repetition 1. In general, syngas flow out decreased at higher torrefaction temperatures and
residence times. Conversely, when analyzing the volumetric syngas produced per mass of
material consumed, higher torrefaction temperature and residence times yielded more syngas.
On average 2.89 m3 syngas kg‐1 of material were observed for all runs with values being as low
as 2.18 m3 kg‐1 for the control and as high as 3.65 m3 kg‐1 for torrefied pine at 275°C for 30
minutes repetition 3. Dunn’s method pairwise multiple comparison methods demonstrated
38
that torrefaction conditions at 275ºC and 300ºC were statistically different from the control
(P<0.05).
Equivalence ratio (ER) for the duration of the run was calculated based on compositional
makeup of the material, air required for complete combustion, and the actual air that was
provided for gasification for the duration of the run. ER values averaged 0.34 and were as low
as 0.27 (Torr300_60m Rep 3) and as high as 0.41 (Torr300_30m Rep 1).
Table 7 of the Appendix provides the information of the average values provided with
standard deviations of inputs and outputs during sampling. Each sampling run was conducted
for 60 minutes and conducted 3 times during the course of the run. Sampling did not
commence until the remnant material of the previous run was determined to be consumed.
Air in values averaged 12.9±0.51 Nm3 for all runs with normalized syngas outputs at 18.5±1.14
Nm3. Some values Torr250_60m rep 1 were not able to be calculated due to insufficient data
from the micro‐GC to compensate for normalized output rates. Syngas generated values were
calculated on nitrogen free basis as well as unconsumed oxygen basis derived from values of
the micro‐GC. Values averaged 7.86±0.85 Nm3 and were as high as 10.73±0.89 Nm3 for Control
Rep 3 and low as 4.59±0.84 Nm3 for Torr300_60m rep 1. In summary total syngas generated
decreased with increased torrefaction temperature and time. Syngas generated on a per mass
basis averaged 1.23±0.14 m3 kg‐1 and showed no apparent trend with respect to treatment.
Values ranged from 0.96±0.13 m3 kg‐1 for Torr275_30m Rep 1 to as high as 2.33±0.07 m3 kg‐1 for
Torr275_60m Rep 2. Dunn’s method of all pairwise multiple comparison of procedures
demonstrated that the all torrefaction treatments at 300ºC and torrefied treatment of 275ºC at
39
60 minutes was statistically lower than the control (P<0.05). Torrefied treatments at 300ºC
were found to be statistically lower than torrefied material at 250ºC for 30 minutes (P<0.05).
4.5 Syngas Concentration
During the course of the sampling interval, the impinger bottle tar collection system and
micro‐GC were in continuous operation as outlined in the tar sampling protocol [27]. Input and
output rates were recorded on the gasifier and flow rates through the impinger bottles were
recorded at 15 minute intervals. Figures 10‐13 show the micro‐GC results of the average
molecular‐% of each species from the syngas plotted against the equivalence ratio.
Supplemental averages and standard deviations over the course of the sampling intervals can
be viewed in Table 8 of the Appendix.
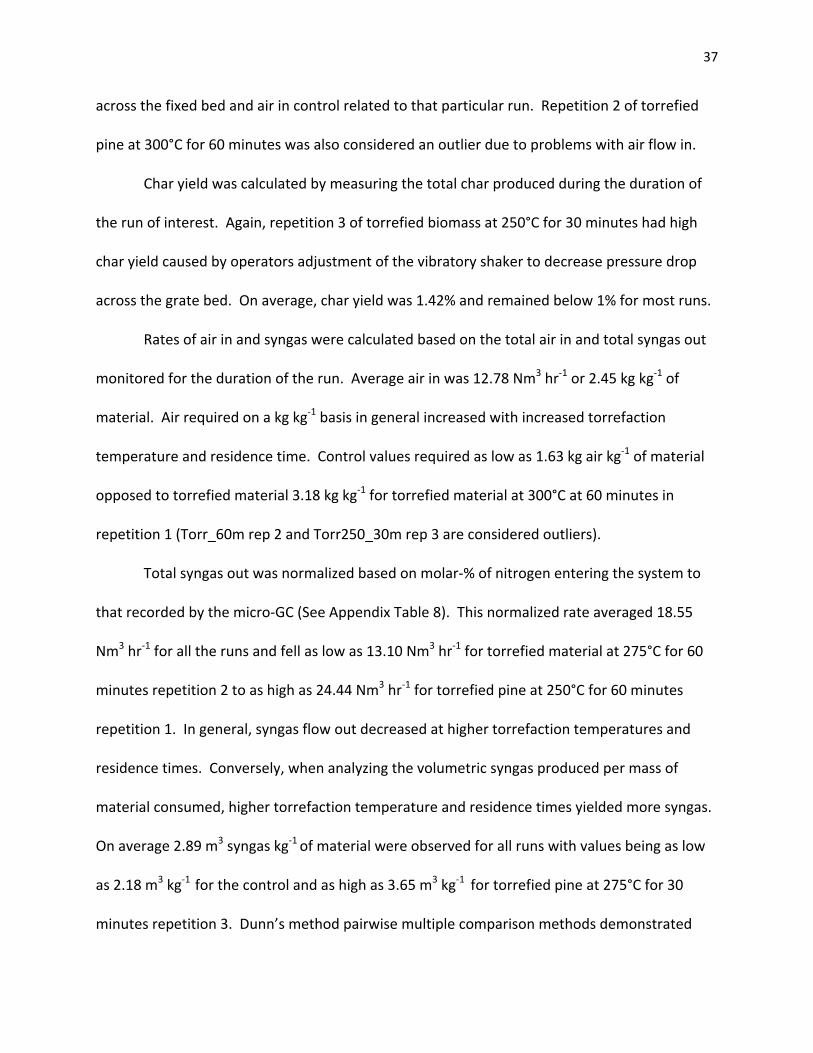
Figure 10 shows carbon monoxide molar‐% in the syngas of the different materials.
Values were scattered and on initial observation do not show any apparent trends. All
concentrations ranged between 5% and 30% with an average of 20.55±2.02%. Torrefied
material at 300°C had several values below 15%. Torrefied material at 275°C showed hydrogen
concentrations greater than 25%. The control and treatments at 250°C had values ranging
between 17% and 27. ANOVA analysis demonstrated that carbon monoxide levels passed
normality tests and that the differences in median values was statistically significantly different
(P=<0.001).
40
Figure 9: Carbon monoxide yield as expressed in molar‐% of syngas
Figure 11 shows the molar‐% of hydrogen in the syngas for the gasification runs.
Hydrogen concentration ranged from 12‐16% with a few points falling below 10% but had an
average of 13.95±0.78%. Overall, values were fairly consistent within this range as moisture
content and elemental hydrogen as a percentage of the feedstock remained consistent. Dunn’s
method pairwise multiple comparison procedure shows that hydrogen yield is significantly
different between treatments torrefied at 300ºC compared to the control (P<0.05).
41
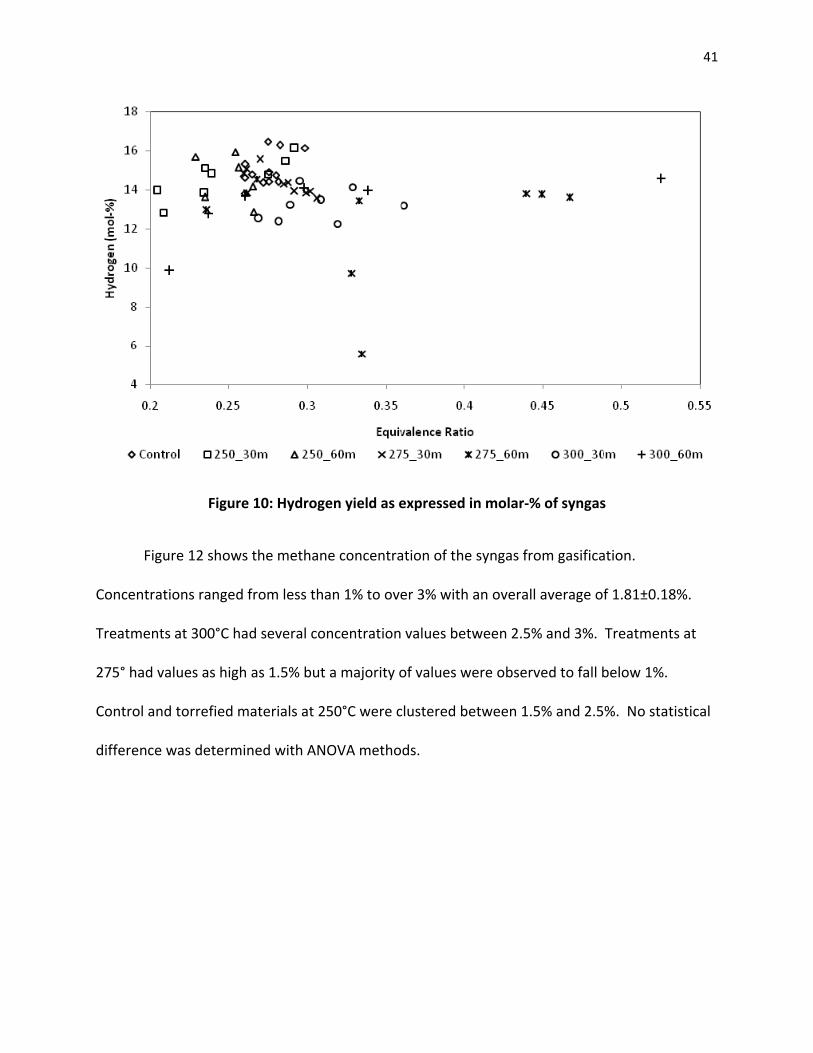
Figure 10: Hydrogen yield as expressed in molar‐% of syngas
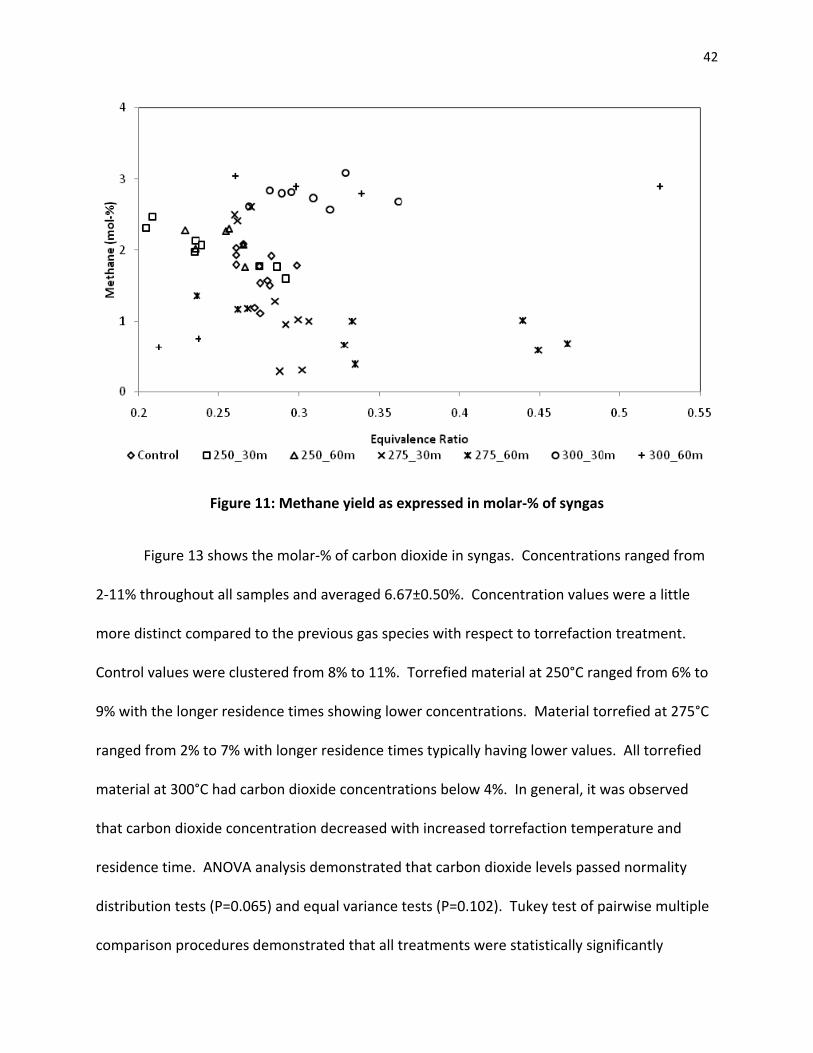
Figure 12 shows the methane concentration of the syngas from gasification.
Concentrations ranged from less than 1% to over 3% with an overall average of 1.81±0.18%.
Treatments at 300°C had several concentration values between 2.5% and 3%. Treatments at
275° had values as high as 1.5% but a majority of values were observed to fall below 1%.
Control and torrefied materials at 250°C were clustered between 1.5% and 2.5%. No statistical
difference was determined with ANOVA methods.
42
Figure 11: Methane yield as expressed in molar‐% of syngas
Figure 13 shows the molar‐% of carbon dioxide in syngas. Concentrations ranged from
2‐11% throughout all samples and averaged 6.67±0.50%. Concentration values were a little
more distinct compared to the previous gas species with respect to torrefaction treatment.
Control values were clustered from 8% to 11%. Torrefied material at 250°C ranged from 6% to
9% with the longer residence times showing lower concentrations. Material torrefied at 275°C
ranged from 2% to 7% with longer residence times typically having lower values. All torrefied
material at 300°C had carbon dioxide concentrations below 4%. In general, it was observed
that carbon dioxide concentration decreased with increased torrefaction temperature and
residence time. ANOVA analysis demonstrated that carbon dioxide levels passed normality
distribution tests (P=0.065) and equal variance tests (P=0.102). Tukey test of pairwise multiple
comparison procedures demonstrated that all treatments were statistically significantly

43
different (P<0.05). Carbon dioxide yield could be projected from a linear combination of
torrefaction temperature (P<0.001).
Figure 12: Carbon dioxide yield as expressed in molar‐% of syngas
4.6 Energy Outputs
Table 9 in the Appendix provides information on the energy outputs of the syngas based
on results from the micro‐GC in the previous pages. Total energy out was calculated based on
the total volume of hydrogen, carbon monoxide, and methane produced. Heating values of
these species were found from previous literature [1] with hydrogen = 13.2 MJ Nm‐3; carbon
monoxide = 13.1 MJ Nm‐3; and methane = 41.2 MJ Nm‐3. Total energy rate out averaged
97.61±12.78 MJ Nm‐3 hr‐1 with values as low as 65.72±10.15 MJ Nm‐3 hr‐1 for Torr300_60m Rep
1 and as high as 122.43±2.46 MJ Nm‐3 hr‐1 for Control rep 3. In general, total energy out

44
decreased with increased torrefaction temperature and time. Dunn’s method pairwise multiple
comparison procedures demonstrate that torrefaction treatments at 300ºC were statistically
significantly different from torrefied pine at 250ºC for 30 minutes (P<0.05).
Energy yield on a per mass basis averaged 14.95±1.67 MJ kg‐1 with values as high as
6.05±0.05 MJ kg‐1 for Torr275_30m Rep 2 and as low as 3.90±1.68 MJ kg‐1 for Torr275_60m Rep
1. No apparent trends were observed between treatments except for material torrefied at
300°C were all below the average. Cold gas efficiency, a calculation of energy in syngas per
energy in material, was evaluated. All values should fall below 100% and average 40‐90%
depending on the material and operational parameters of the gasifier [1]. The average cold gas
efficiency for all runs was 64.35±6.96% with values as high as 88.00±2.84% in Torr275_30m Rep
2 to as low as 42.50±6.56% in Torr300_60m Rep 1. One outlier was recorded in Torr275_60m
Rep 2 which may have been caused by an inaccuracy from the micro‐GC or other calculation.
ANOVA methods failed for normality tests and equal variance tests.
4.7 Tar Production
Tars were collected as outlined in the tar collection protocol [27]. The solvent used in
the impinger bottles was Isopropanol which was collected at the end of every sampling interval.
Attempts were made to measure the net gain in tars during the course of the sampling
intervals, however in many occasions there was a loss of mass due to the vaporization of
Isopropanol. After each sampling interval, bottles were washed and the rinse was collected and
added to the sample. The total mass of the sample was recorded and can be viewed in Table 9
of the Appendix. Total gas flow was recorded by integrating the flow rates through the
45
impinger bottles for the duration of the sampling interval which was recorded every 15
minutes.
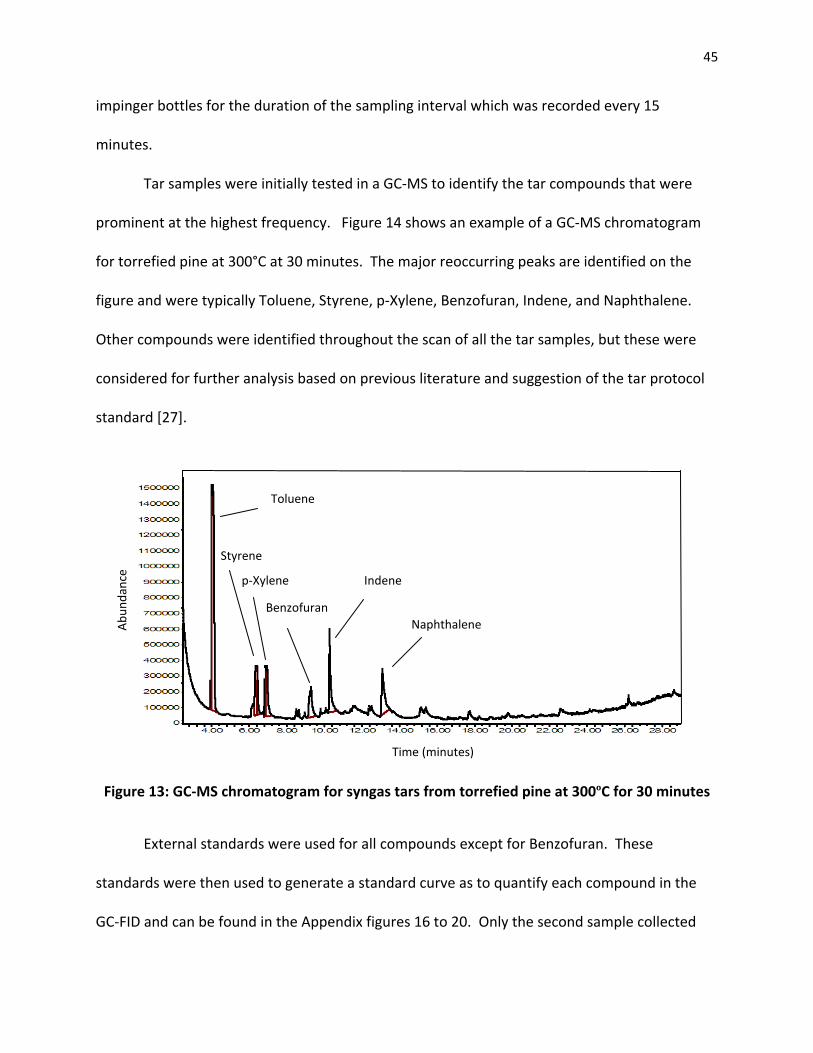
Tar samples were initially tested in a GC‐MS to identify the tar compounds that were
prominent at the highest frequency. Figure 14 shows an example of a GC‐MS chromatogram
for torrefied pine at 300°C at 30 minutes. The major reoccurring peaks are identified on the
figure and were typically Toluene, Styrene, p‐Xylene, Benzofuran, Indene, and Naphthalene.
Other compounds were identified throughout the scan of all the tar samples, but these were
considered for further analysis based on previous literature and suggestion of the tar protocol
standard [27].
Naphthalene
Indene
Toluene
p‐Xylene
Styrene
Time (minutes)
Abu
ndance
Benzofuran
Figure 13: GC‐MS chromatogram for syngas tars from torrefied pine at 300ºC for 30 minutes
External standards were used for all compounds except for Benzofuran. These
standards were then used to generate a standard curve as to quantify each compound in the
GC‐FID and can be found in the Appendix figures 16 to 20. Only the second sample collected
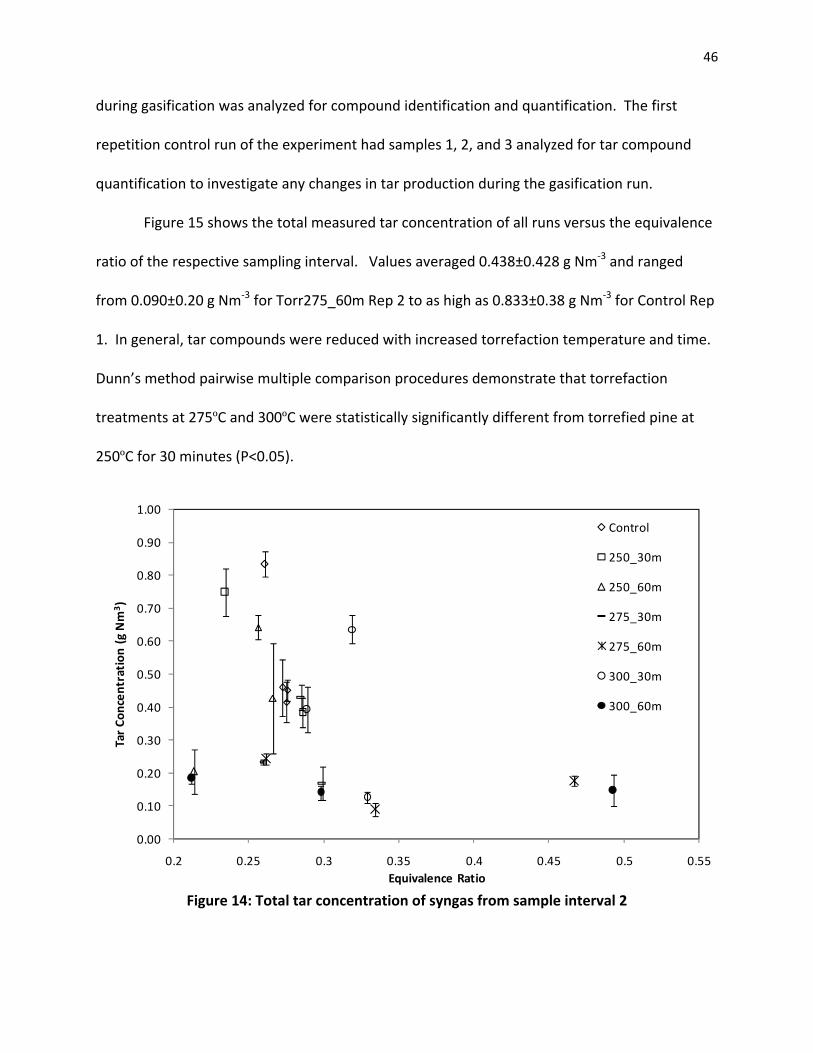
46
during gasification was analyzed for compound identification and quantification. The first
repetition control run of the experiment had samples 1, 2, and 3 analyzed for tar compound
quantification to investigate any changes in tar production during the gasification run.
Figure 15 shows the total measured tar concentration of all runs versus the equivalence
ratio of the respective sampling interval. Values averaged 0.438±0.428 g Nm‐3 and ranged
from 0.090±0.20 g Nm‐3 for Torr275_60m Rep 2 to as high as 0.833±0.38 g Nm‐3 for Control Rep
1. In general, tar compounds were reduced with increased torrefaction temperature and time.
Dunn’s method pairwise multiple comparison procedures demonstrate that torrefaction
treatments at 275ºC and 300ºC were statistically significantly different from torrefied pine at
250ºC for 30 minutes (P<0.05).
0.00
0.10
0.20
0.30
0.40
0.50
0.60
0.70
0.80
0.90
1.00
0.2 0.25 0.3 0.35 0.4 0.45 0.5 0.55
Tar Co
ncen
tration (g Nm
3 )
Equivalence Ratio
Control
250_30m
250_60m
275_30m
275_60m
300_30m
300_60m
Figure 14: Total tar concentration of syngas from sample interval 2
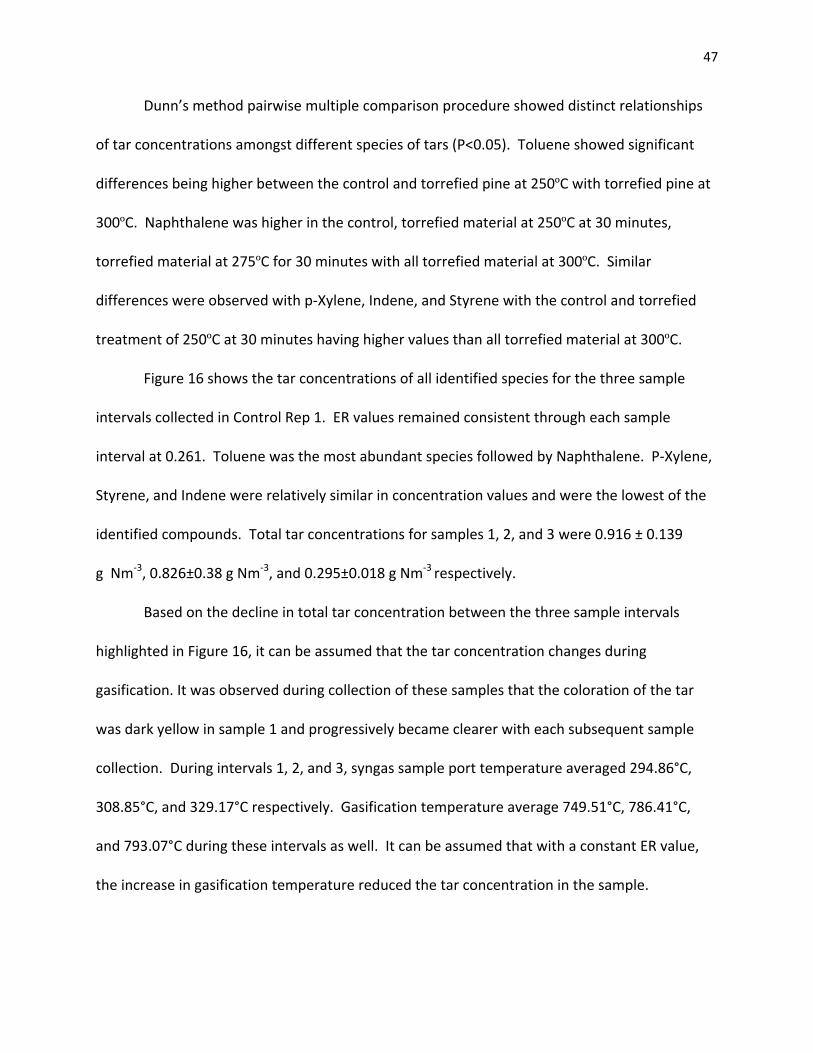
47
Dunn’s method pairwise multiple comparison procedure showed distinct relationships
of tar concentrations amongst different species of tars (P<0.05). Toluene showed significant
differences being higher between the control and torrefied pine at 250ºC with torrefied pine at
300ºC. Naphthalene was higher in the control, torrefied material at 250ºC at 30 minutes,
torrefied material at 275ºC for 30 minutes with all torrefied material at 300ºC. Similar
differences were observed with p‐Xylene, Indene, and Styrene with the control and torrefied
treatment of 250ºC at 30 minutes having higher values than all torrefied material at 300ºC.
Figure 16 shows the tar concentrations of all identified species for the three sample
intervals collected in Control Rep 1. ER values remained consistent through each sample
interval at 0.261. Toluene was the most abundant species followed by Naphthalene. P‐Xylene,
Styrene, and Indene were relatively similar in concentration values and were the lowest of the
identified compounds. Total tar concentrations for samples 1, 2, and 3 were 0.916 ± 0.139
g Nm‐3, 0.826±0.38 g Nm‐3, and 0.295±0.018 g Nm‐3 respectively.
Based on the decline in total tar concentration between the three sample intervals
highlighted in Figure 16, it can be assumed that the tar concentration changes during
gasification. It was observed during collection of these samples that the coloration of the tar
was dark yellow in sample 1 and progressively became clearer with each subsequent sample
collection. During intervals 1, 2, and 3, syngas sample port temperature averaged 294.86°C,
308.85°C, and 329.17°C respectively. Gasification temperature average 749.51°C, 786.41°C,
and 793.07°C during these intervals as well. It can be assumed that with a constant ER value,
the increase in gasification temperature reduced the tar concentration in the sample.
48
0.00
0.10
0.20
0.30
0.40
0.50
0.60
Sample 1 Sample 2 Sample 3
Tar Co
ncen
tration (g Nm
3 )Toluene
p‐Xylene
Styrene
Indene
Naphthalene
Figure 15: Syngas tar concentration of Control Rep 1
4.8 Particulates in Syngas
Particulates in syngas had an average concentration of 0.1881±0.09331 g m‐3 of syngas
with values ranging from 0.001836 to 0.3142 g m‐3. No correlation was found with respect to
torrefaction treatments on particulate concentration in syngas with ANOVA analysis.
49
CHAPTER 5
CONCLUSIONS
Effects of torrefaction residence time and temperature were analyzed on gasification
yields, energy efficiency, and tar production in this study. The study finds that torrefaction
treatments had marginal impacts compared to the control feedstock and were determined to
be statistically different with respect to the dependent outcomes.
Torrefaction solids yields generated in the rotary kiln were consistent with the before
mentioned literature [3]. Higher temperatures and residence times decreased the solids yield
with temperature having a more dominant effect. Elemental composition and physical
properties of the torrefied material were consistent with the literature as well and changed
with torrefaction treatment. Higher heating values of the torrefied material increased with
increased torrefaction temperature and residence time however at the expense of material
loss. Torrefied material at 250°C at 30 minutes retained nearly 100% of total energy content
compared to that of the starting material with torrefied material at 300°C at 60 minutes
retaining the least, or 63.48% of its total energy content.
Energy expenditure during torrefaction in the rotary kiln increased with each treatment
with the exception of torrefaction at 300°C for 30 minutes. Although the mean values of
energy expenditure on a per unit mass basis fitted a theoretical trend, variability was too high

50
to state with conviction that any trend existed. The rotary kiln is believed to have high heat
losses through the insulated walls and exhaust portion of the kiln. A large portion of heat was
likely spent on heating the system which had a relatively high mass in proportion to the
material being loaded into the system. Effects of material load weight and moisture content
may have been negligible with regards to the entire system efficiency. Manual operation of the
control panel during ramping stages may have contributed to some variability as each setting
may have been monitored differently. Exhaust from the reactor portion was not monitored
and may provide a better understanding of the reaction process. Overall, the system is too
robust, inefficient, and not ideal enough to develop a correlation between feedstock weight
and composition with respect to energy consumption. With regards to the capability of
producing torrefied material at pilot scale, this experiment was highly consistent.
Gasification of torrefied material demonstrated marginal trends with respect to
dependent outcomes but was subject to some variability. Feedstock consumption rate was
generally reduced with increased torrefaction temperatures and residence times. Although the
rates appeared to decline, total air in provided to facilitate the reaction decreased due
increased pressures generated in the gasification reaction zone. One possibility may have been
due to the composition of the material or the fine particle generated in higher torrefaction
conditions. Although it is possible this could have occurred, it was not believed to be a major
factor. Vibratory settings on the grate shaker may have not been set to a sufficient amount but
there was difficulty in monitoring the magnitude of shaking understanding what frequency and
duration to set it at for ideal operation. This had a major impact on the monitoring and
calculations through the course of the experiment. However, it must be noted that all settings
51
were kept constant except for the last experiment, torrefaction at 250°C for 30 minutes,
repetition 3, due to severe clogging and bridging. Another difficulty lied in the configuration of
the gasifier as it was not possible to start each run precisely the same amount of starting
material. The overlapping of experiments may have caused some residual errors on the
consumption rate. Ideally it would have been desirable to start each run with a minimally fixed
amount of starting material before filling the hopper. This would significantly reduce the
overall error of the experiment. It would be suggested in future runs to extend the total
duration of runs in a full hopper to over 7 hours of operation and increase the vibratory settings
fractionally higher.
Despite these difficulties, all experiments were subjected to the same conditions and
treated similarly. Char yields were fairly consistent except for the outliers of torrefied material
at 250°C at 30 minutes repetition 3 and torrefied pine at 300°C for 30 minutes repetition 2.
Most char yield values ranged at 1% or less as would be expected. Syngas rates generally
decreased with increased torrefaction temperature. It could be assumed that higher
torrefaction temperatures may have lower reaction rates as it requires higher amounts of
oxygen due to the higher carbon content in the material. When analyzing syngas yield on a per
unit mass basis, higher torrefaction temperatures generally yielded higher amounts. Control
values yielded less than 2.50 m3 kg‐1 whereas many torrefied materials yield equal to or greater
than 3.00 m3 kg‐1.
Rate of consumption, air inputs, and air required for combustion depending on material
composition were used to calculate equivalence ratio. Values for the entire duration ranged
from 0.25 to 0.59 but remained fairly consistent to the target range of 0.25 to 0.40.
52
Consumption rates may have had some residual error in this calculation as previously
mentioned but were fairly reliable.
Sampling intervals during the gasification runs provided very consistent trends and
provided better insight to the gasification performance as gas composition could be analyzed.
The settings were highly monitored and controlled and allowed further statistical analysis to be
conducted. Equivalence ratios could be more accurately calculated and controlled under these
conditions with standard deviations at 0.04 or less. The sampling intervals also allowed the
ability to calculated the syngas generated free of nitrogen. In general, no trend was observed
with respect to the control as most values produced approximately 1 m3 kg‐1. Any suggestion to
this operation would involve incorporating an apparatus or method to analyzing moisture
content in the syngas as this can be a considerable portion of the syngas.
Gas species yielded showed consistent trends depending on the material being gasified.
In general, hydrogen content remained constant amongst all treatments as the hydrogen
content in the material averaged 5‐6% on an elemental basis. Methane production generally
increased with increased torrefaction conditions whereas carbon monoxide and carbon dioxide
yields decreased. Efficiency of oxygen conversion remained constant as unconsumed oxygen
concentrations remained less than 3% with the exception of the outliers.
Energy outputs were subject to some trends depending on the torrefaction material.
Total energy out decreased with increased torrefaction treatments. This is notable however
the rates of air input during gasification did also decrease. Energy yielded on a per mass basis
generally increased with increased torrefaction temperature as would be expected due to the
higher energy content of the torrefied material. Higher heating value of syngas on a per
53
volume basis decreased with torrefaction temperatures most likely due to the decreased input
rates of air and feed consumption. Cold gas efficiency, a metric for comparing the treatments
more evenly, did not follow any trend and fell within the expected range of 40‐90% as reported
in previous literature [1]. It can be assumed that based on this outcome that torrefaction
conditions do not have any significant effect on cold gas efficiency.
Tar yields demonstrated marginal trends with respect to treatment during gasification.
Higher torrefaction treatments generally had lower tar yields with respect to the control
treatment. All tar concentration values remained below 1 g Nm‐3 with the exception of the
outliers. All gas species analyzed decreased with increased torrefaction treatment.
Torrefaction temperature had a more dominant effect than residence time. Any future
suggestions would involve developing methods to collect phenolics generated as were noticed
on the sampling port device. These heavy ‘tar’ like residues were noticed late in the
experiment and were not accounted for.
One of the difficulties with this analysis is that only the second sample interval of each
repetition was analyzed. There is the possibility that these samples may have been subjected
to variability during this portion gasification experiment. It would be highly recommended to
further analyze the samples from the first and third intervals to develop a more comprehensive
understanding and trend of tar production. As noted in the results and discussion, the trend of
total tar yield decreased with each sampling interval (Figure 16). This may have been caused by
increased temperatures of during the course of gasification. Essentially, the tars analyzed
between treatments and experiments may have been subjected to differences in temperatures
and conditions. Another suggestion would be to analyze the tar production on a nitrogen free

54
basis. By analyzing the total tar generated based on the syngas produced as opposed to total
syngas output, a more thorough understanding of the effects of torrefied material could be
understood.
55
REFERENCES
[1]Milbrandt, A. A geographic perspective on the current biomass resource availability in the United States. Technical Report. NREL/TP‐560‐39181. December 2005.
[2] Reed, Thomas. Das, Agua. Handbook of biomass downdraft gasifier engine systems. Washington D.C.: BEF Press
[3]Prins, M.J. Ptasinski, K.J. Janssen, F.J.J.G. Torrefaction of wood: Part 1. Weight loss kinetics. Journal of Analytical and Applied Pyrolysis. 2006. 77. 28‐34.
[4]Arias, B. Pevida, C. Fermoso, J. Plaza, M.G. Rubiera, F. Pis, J.J. Influence of torrefaction on the grindability and reactivity of woody biomass. Fuel Processing technology. 2008. 89. 169‐175.
[5]Bridgeman, T.G. Jones, J.M. Shield, I. Williams, P.T. Torrefaction of reed canary grass, wheat straw and willow to enhance solid fuel qualities and combustion properties. Fuel. 2008. 87. 844‐856.
[6] Bourgois, J. Guyonnet, R. Characterization of torrefied wood. Wood Sci. Technology. 22:143‐155. 1988.
[7]Felfi, F.F. Luengo, C.A. Suarez, J.A. Beaton, P.A. Wood briquette torrefaction. Energy for Sustainable Development. 2005. 9 (3). 19‐22.
[8]Bourgois, J. Bartholin, M.C. Guyonnet, R. Thermal treatment of wood: analysis of the obtained product. Wood Science Technology. 1989 (23). 303‐310.
[9] Prins, M.J. Ptasinski, K.J. Janssen, F.J.J.G. Torrefaction of wood: Part 2. Analysis of products. Journal of Analytical and Applied Pyrolysis. 2006. 77. 35‐40.
[10]Pentananunt, R. Mizanur Rahman, A.N.M. Bhattacharya, S.C. Upgrading of biomass by means of torrefaction. Energy. 1990. 15. 1175‐1179.
[11]Tito Ferro, D. Vigouroux, V. Grimm, A. Zanzi, R. Torrefaction of agricultural and forest residues. Conference Paper. Cubasolar 2004. April 12‐16, 2004, Guantanamo, Cuba.
[12] Warnecke, R. Gasification of biomass: comparison of fixed bed and fluidized bed gasifier. Biomass and Bioenergy. 2000. 18. 489‐497.
56
[13] Ghosh, D. Sagar, A.D. Kishore, V.V.N. Scaling up biomass gasifier use: an application‐specific approach. Energy Policy. 2006. 34. 1566‐1582.
[14] Zainal, Z.A. Rifau, A. Quadir, G.A. Seetharamu, K.N. Experimental investigation of a downdraft biomass gasifier. Biomass and Bioenergy. 2002. 23. 283‐289.
[15] Sheth, P.N. Babu, B.V. Experimental studies on producer gas generation from wood waste in a downdraft biomass gasifier. Bioresource Technology. 2009. 100. 3127‐3133.
[16] Lv, P. Yuan, Z. Ma, L, Wu, C. Chen, Y. Zhu, J. Hydrogen‐rich gas production from biomass air and oxygen/steam gasification in a downdraft gasifier. Renewable Energy. 2007. 32. 2173‐2185.
[17] Zhou, J. Chen, Q. Zhao, H. Cao, X. Mei, Q. Luo, Z. Cen, K. Biomass‐oxygen gasification in a high‐temperature entrained‐flow gasifier. Biotechnology Advances. 2009. 27. 606‐611.
[18] Mahishi, M.R. Goswami. Thermodynamic optimization of biomass gasifier for hydrogen production. International Journal of Hydrogen Engergy. 2007. 32. 3831‐3840.
[19] Sharma, A.K. Experimental study on 75 kWth downdraft (biomass) gasifier system. Renewable Energy. 2009. 34. 1726‐1733.
[20] Lucchesi, A. Stoppato, G. Production of syngas from biomass. Bioresource Technology. 1994. 48. 119‐126.
[21] Filippis, P.D. Borgianni, C. Paolucci, M. Pochetti, F. Gasification process of Cuban bagasse in a two‐stage reactor. Biomass and Bioenergy. 2004. 27. 247‐252.
[22] Lin, K.S. Wang, H.P. Lin, C.‐J. Juch, C.‐I. A process development for gasification of rice husk. Fuel processing technology. 1998. 55. 185‐192.
[23] Kumabe, K. Hanaoka, T. Fujimoto, S. Minowa, T. Sakanishi, K. Co‐gasification of woody biomass and coal with air and steam. Fuel. 2007. 86. 684‐689.
[24] Prins, M.J. Ptasinski, K.J. Janssen, F.J.J.G. From coal to biomass gasification: Comparison of thermodynamic efficiency. Energy. 2007. 32. 1248‐1259.
[25] Chern, S.M. Walawender, W.P. Fan, L.T. Mass and energy balance analyses of a downdraft gasifier. Biomass. 1989. 18. 127‐151.
[26] Sharma, A.K. Equilibrium and kinetic modeling of char reduction reactions in a downdraft biomass gasifier: A comparison. Solar Energy. 2008. 82. 918‐928.
[27] CEN BT/TF 143 “Organic contaminants (“tar”) in biomass producer gases”. Technical Report. Sampling and analysis of tar and particles in biomass producer gases. July 2005.
57
[28] Li, C. Suzuki, K. Tar property, analysis, reforming mechanism and model for biomass gasification‐ An overview. Renewable and Sustainable Energy Reviews. 2009. 13. 594‐604.
[29] Rabou, L.P.L.M. Zwart, R.W.R. Vreugdenhil, B.J. Bos, L. Tar in Biomass Producer Gas, the Energy research Centre of The Netherlands (ECN) Experience: An Enduring Challenge. Energy and Fuels. 2009. 23. 6189‐6198.
[30] Dufour, A. Girods, P. Masson, E. Normand, S. Rogaume, Y. Zoulalian, A. Comparison of two methods of measuring wood pyrolysis tar. Journal of Chromotography A. 2007. 1164. 240‐247.
[31] Corella, J. Toledo, J.M. Molina, G. Calculation of the conditions to get less than 2 g tar/mn3
in a fluidized bed biomass gasifier. Fuel processing technology. 2006. 87. 841‐846.
[32] Brage, C. Yu, Q. Chen, G. Sjostrom, K. Tar evolution profiles obtained from gasification of biomass and coal. Biomass and Bioenergy. 2000. 18. 87‐91.
[33] Kinoshita, C.M. Wang, Y. Zhou, J. Tar formation under different biomass gasification conditions. Journal of Analytical and Applied Pyrolysis. 1994. 29. 169‐181.
[34] Phuphuakrat, T. Namioka, T. Yoshikawa, K. Tar removal from biomass pyrolysis gas in two‐step function of decomposition and adsorption. Applied Energy. 2009. Article in Press.
[35] Cao, Y. Wang, Y. Riley, J.T. Pan, W. A novel biomass air gasification process for producing tar‐free higher heating value fuel gas. Fuel Processing Technology. 2006. 87. 343‐353.
[36] Qin, Y. Feng, Q. Li, W. Formation of tar and its characterization during air‐steam gasification of sawdust in a fluidized bed reactor. Fuel. 2009.
[37] Zhang, R. Cummer, K. Suby, A. Brown, R.C. Biomass‐derived hydrogen from an air‐blown gasifier. Fuel Processing Technology. 2005. 86. 861‐874.
[38] Pinto, F. Andre, R.N. Franco, C. Lopes, H. Gulyurtlu, I. Cabrita, I. Co‐gasification of coal and wastes in a pilot‐scale installation 1: Effect of catalysts in syngas treatment to achieve tar abatement. Fuel. 2009. 88. 2392‐2402.
[39] Pinto, F. Lopes, H. Andre, R.N. Gulyurtlu, I. Cabrita, I. Effect of catalysts in the quality of syngas and by‐products obtained by co‐gasification of coal and wastes. 1. Tars and nitrogen compounds abatement. Fuel. 2007. 86. 2052‐2063.
[40] Han, J. Kim, H. The reduction and control technology of tar during biomass gasification/pyrolysis: An overview. Renewable and Sustainable Energy Reviews. 2008. 12. 397‐416.

58
[41] Zwart, R.W.R. Boerrigter, H. Drift, A. The impact of biomass pretreatment on the feasibility of overseas biomass conversion to Fischer‐Tropsch Products. Energy and Fuels. 2006. 20. 2192‐2197.
[42]Prins, M.J. Thermodynamic analysis of biomass gasification and torrefaction. 2005.
[43] Prins, M.J. Ptasinski, K.J. Janssen, F.J.J.G. More efficient biomass gasification via torrefaction. Energy. 2006. 31. 3458‐3470.
[44] Couhert, C. Salvador, S. Commandre, J‐M. Impact of torrefaction on syngas production from wood. Fuel. 2009. 88. 2286‐2290.
[45] Deng, J. Wang, G. Kuang, J. Zhang, Y. Luo, Y. Pretreatment of agricultural residues for co‐gasification via torrefaction. Journal of Analytical and Applied Pyrolysis. 2009. 86. 331‐337.
[46] Svoboda, K. Pohorely, M. Hartman, M. Martinec, J. Pretreatment and feeding of biomass for pressurized entrained flow gasification. Fuel Processing Technology. 2009. 90. 629‐635.
[47] Meijden, C.M. Veringa, H.J. Rabou, L.P.L.M. The production of synthetic natural gas (SNG): A comparison of three wood gasification systems for energy balance and overall efficiency. Biomass and Bionergy. 2009. 1‐10. Article in Press.

59
APPENDIX
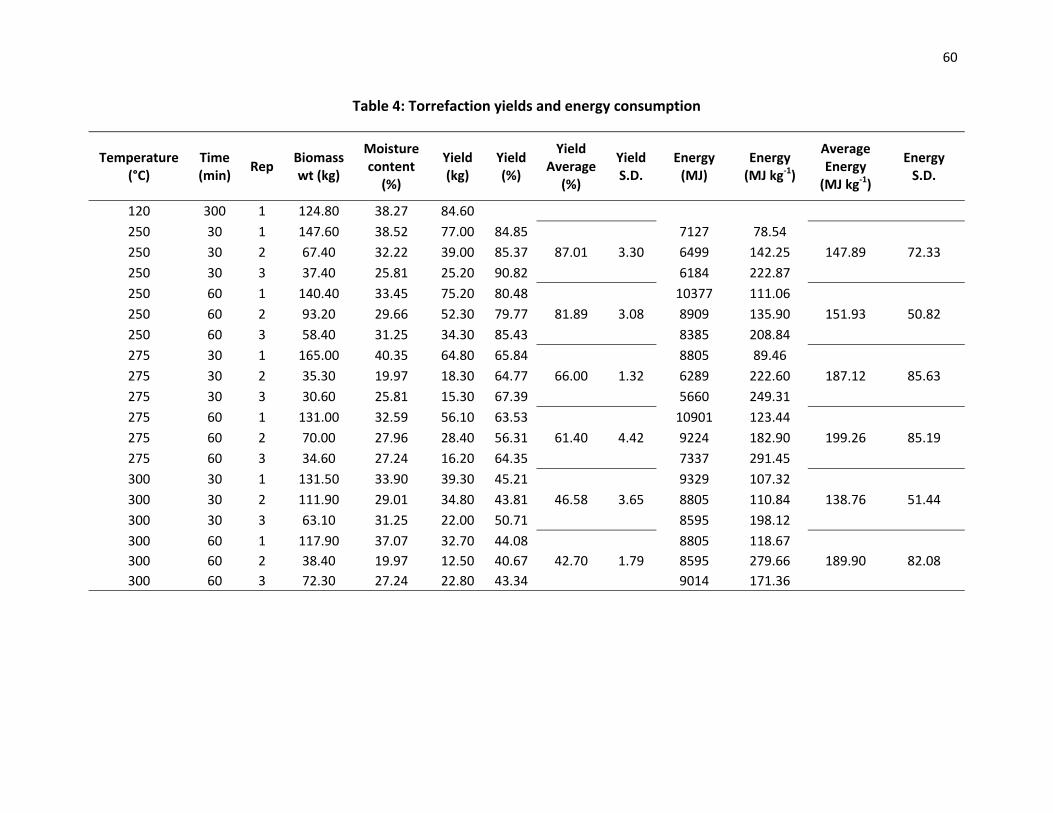
60
Table 4: Torrefaction yields and energy consumption
Temperature (°C)
Time (min)
Rep Biomass wt (kg)
Moisture content (%)
Yield (kg)
Yield (%)
Yield Average
(%)
Yield S.D.
Energy (MJ)
Energy (MJ kg‐1)
Average Energy (MJ kg‐1)
Energy S.D.
120 300 1 124.80 38.27 84.60 250 30 1 147.60 38.52 77.00 84.85
87.01 3.30 7127 78.54
147.89 72.33 250 30 2 67.40 32.22 39.00 85.37 6499 142.25 250 30 3 37.40 25.81 25.20 90.82 6184 222.87 250 60 1 140.40 33.45 75.20 80.48
81.89 3.08 10377 111.06
151.93 50.82 250 60 2 93.20 29.66 52.30 79.77 8909 135.90 250 60 3 58.40 31.25 34.30 85.43 8385 208.84 275 30 1 165.00 40.35 64.80 65.84
66.00 1.32 8805 89.46
187.12 85.63 275 30 2 35.30 19.97 18.30 64.77 6289 222.60 275 30 3 30.60 25.81 15.30 67.39 5660 249.31 275 60 1 131.00 32.59 56.10 63.53
61.40 4.42 10901 123.44
199.26 85.19 275 60 2 70.00 27.96 28.40 56.31 9224 182.90 275 60 3 34.60 27.24 16.20 64.35 7337 291.45 300 30 1 131.50 33.90 39.30 45.21
46.58 3.65 9329 107.32
138.76 51.44 300 30 2 111.90 29.01 34.80 43.81 8805 110.84 300 30 3 63.10 31.25 22.00 50.71 8595 198.12 300 60 1 117.90 37.07 32.70 44.08
42.70 1.79 8805 118.67
189.90 82.08 300 60 2 38.40 19.97 12.50 40.67 8595 279.66 300 60 3 72.30 27.24 22.80 43.34 9014 171.36

61
Table 5: Gasification full run data
Feedstock Rep Duration (min)
Weight (kg)
Moisture (%)
HHV Material
AirIN Total (Nm3)
SyngasOUT Total (m3)
Average Gasification Temperature
(°C)
S.D.
Average Syngas
Temperature (°C)
S.D.
Control 1 179 29.51 4.43 16.98 38.20 78.30 776.33 23.46 311.30 17.20 Control 2 188 30.26 9.35 20.46 40.23 80.17 774.74 6.19 272.01 20.79 Control 3 245 39.26 9.35 20.46 52.79 107.26 794.18 7.47 308.71 3.12 Control 4 216 33.56 9.35 20.46 46.51 92.94 792.48 8.72 292.64 9.55 250_30m 1 213 32.87 2.47 21.51 48.25 89.38 766.59 50.56 317.47 5.27 250_30m 2 238 25.40 1.83 21.69 44.57 80.88 823.15 8.58 259.55 13.18 250_30m 3 38 6.65 3.66 21.58 8.49 16.95 761.67 14.26 335.77 8.23 250_60m 1 199 31.17 4.56 21.92 44.44 85.41 807.21 10.47 285.91 9.50 250_60m 2 171 23.07 2.15 22.29 41.51 81.15 836.03 19.44 316.23 26.64 250_60m 3 185 27.57 1.01 21.85 42.43 81.42 780.57 8.59 295.79 12.40 275_30m 1 212 28.47 2.13 24.55 52.82 97.55 813.54 30.08 318.29 3.54 275_30m 2 125 11.15 3.33 22.95 23.21 41.51 813.39 18.67 242.51 5.99 275_30m 3 65 6.63 2.71 22.55 14.11 24.70 805.57 7.97 262.03 15.75 275_60m 1 285 21.92 1.18 23.79 47.87 88.06 813.68 9.63 224.80 21.20 275_60m 2 208 13.13 3.08 25.57 29.95 53.29 808.78 8.91 257.26 11.38 275_60m 3 184 18.38 3.83 22.90 33.46 60.81 819.65 10.35 246.29 9.42 300_30m 1 137 9.91 1.53 27.17 28.31 46.43 821.77 26.79 264.85 8.90 300_30m 2 182 19.02 2.01 27.17 47.00 86.25 865.37 26.11 323.64 13.11 300_30m 3 228 22.88 2.48 27.47 55.58 96.28 804.57 25.66 287.98 15.99 300_60m 1 212 18.97 1.18 29.15 49.75 84.82 865.58 45.37 283.41 6.82 300_60m 2 190 9.08 1.18 28.82 39.49 57.75 810.86 1.75 205.92 27.45 300_60m 3 53 5.24 2.90 28.92 10.41 18.17 818.69 30.37 210.52 5.34

62
Table 6: Gasification input and output rates
Feedstock Rep Dry Rate (kg hr‐1)
Char Yield (%)
AirIN Rate
(m3 hr‐1)
AirIN Rate
(kg kg‐1)
SyngasOUT Rate
(m3 hr‐1)
SyngasOUT Rate
Normalized (m3 hr‐1)
Normalized Syngas Yield
(m3 kg ‐1)
AirIN Req'd (kg kg‐1 hr‐1)
Total AirIN Req’d (kg kg‐1)
ER (Total Run)
Control 1 9.45 1.02 12.80 1.63 26.25 20.60 2.18 4.93 48.76 0.32 Control 2 8.76 0.66 12.84 1.76 25.59 19.74 2.25 4.93 47.61 0.32 Control 3 8.72 0.53 12.93 1.78 26.27 20.75 2.38 4.93 47.39 0.33 Control 4 8.45 0.59 12.92 1.83 25.82 20.32 2.40 4.93 45.95 0.34 250_30m 1 9.03 0.94 13.59 1.81 25.18 20.55 2.28 6.20 57.42 0.28 250_30m 2 6.29 0.30 11.24 2.14 20.39 18.13 2.88 6.20 39.72 0.34 250_30m 3 10.12 11.24 13.41 1.59 26.76 20.90 2.07 6.20 65.12 0.25 250_60m 1 8.97 0.90 13.40 1.79 25.75 24.44 2.72 6.39 60.08 0.27 250_60m 2 7.92 3.69 14.56 2.21 28.47 20.75 2.62 6.39 51.74 0.34 250_60m 3 8.85 0.68 13.76 1.87 26.41 20.23 2.29 6.39 57.16 0.29 275_30m 1 7.89 0.65 14.95 2.28 27.61 20.02 2.54 6.80 54.76 0.33 275_30m 2 5.17 0.30 11.14 2.58 19.92 17.70 3.42 6.80 36.38 0.37 275_30m 3 5.95 0.32 13.02 2.63 22.80 21.73 3.65 6.80 41.58 0.38 275_60m 1 4.56 0.78 10.08 2.65 18.54 13.17 2.89 7.04 32.51 0.37 275_60m 2 3.67 0.34 8.64 2.83 15.37 13.10 3.57 7.04 26.67 0.39 275_60m 3 5.76 0.31 10.91 2.27 19.83 17.36 3.01 7.04 42.22 0.31 300_30m 1 4.28 0.79 12.40 3.48 20.33 14.44 3.38 8.27 35.91 0.41 300_30m 2 6.14 3.71 15.49 3.03 28.43 18.95 3.08 8.27 51.84 0.36 300_30m 3 5.87 1.10 14.63 2.99 25.34 17.79 3.03 8.27 49.79 0.35 300_60m 1 5.31 0.82 14.08 3.18 24.01 16.11 3.04 8.90 47.79 0.35 300_60m 2 2.83 1.10 12.47 5.28 18.24 14.67 5.18 8.90 25.53 0.59 300_60m 3 5.76 0.47 11.79 2.45 20.57 16.68 2.89 8.90 52.84 0.27

63
Table 7: Gasification sampling averages and rates
Feedstock Rep
Average AirIN
Sample (Nm3 hr‐1)
S.D.
Average SyngasOUT Sample (m3 hr‐1)
S.D.
Average SyngasOUT Normalized (Nm3 hr‐1)
S.D. ER
Average S.D.
Syngas Generated (Nm3)
S.D. Syngas
Generated (Nm3 kg‐1)
S.D.
Control 1 12.72 0.00 26.42 0.32 20.48 0.69 0.26 0.00 10.10 0.89 1.07 0.09 Control 2 12.91 0.26 26.27 0.74 19.85 0.21 0.27 0.01 9.17 0.32 1.05 0.04 Control 3 13.54 0.57 28.24 1.47 21.72 0.70 0.29 0.01 10.73 0.17 1.23 0.02 Control 4 12.84 0.14 26.22 0.18 20.21 0.86 0.28 0.00 9.61 1.05 1.14 0.12 250_30m 1 13.57 0.14 26.34 0.45 20.57 1.25 0.24 0.00 9.40 1.53 1.04 0.17 250_30m 2 11.29 0.33 20.91 0.51 18.23 0.60 0.28 0.01 9.05 0.47 1.44 0.08 250_30m 3 13.44 0.18 27.03 0.58 20.96 0.42 0.21 0.00 10.03 0.30 0.99 0.03 250_60m 1 13.17 0.51 25.47 0.31 0.22 0.01 250_60m 2 13.56 0.34 26.71 1.23 19.36 0.72 0.26 0.01 8.18 1.19 1.03 0.15 250_60m 3 13.73 0.82 27.33 1.64 20.20 1.27 0.24 0.01 9.00 0.63 1.02 0.07 275_30m 1 14.45 0.30 27.62 0.57 19.37 1.05 0.26 0.01 7.59 1.01 0.96 0.13 275_30m 2 10.88 0.26 19.90 0.33 17.29 0.52 0.22 0.01 8.46 0.32 1.63 0.06 275_30m 3 12.12 0.37 21.02 0.58 20.30 1.61 0.29 0.01 9.03 0.23 1.52 0.04 275_60m 1 10.79 0.11 19.92 0.23 14.26 1.85 0.33 0.00 4.73 2.57 1.04 0.56 275_60m 2 12.05 0.38 21.73 0.98 18.26 0.52 0.45 0.01 8.57 0.26 2.33 0.07 275_60m 3 10.78 0.72 20.10 0.25 17.19 1.68 0.26 0.02 8.37 1.25 1.45 0.22 300_30m 1 12.44 0.59 20.51 1.00 14.45 1.17 0.35 0.02 4.35 0.39 1.02 0.09 300_30m 2 15.03 1.35 27.48 3.09 18.39 1.75 0.36 0.03 6.09 0.80 0.99 0.13 300_30m 3 14.82 0.50 26.39 0.77 18.05 1.09 0.27 0.01 5.84 0.77 0.99 0.13 300_60m 1 14.29 1.87 24.88 3.15 16.37 2.35 0.30 0.04 4.59 0.84 0.86 0.16 300_60m 2 12.99 0.58 20.71 0.43 15.77 0.51 0.02 5.00 1.77 300_60m 3 11.88 0.93 19.17 1.36 16.90 2.48 0.22 0.02 7.14 2.01 1.24 0.35
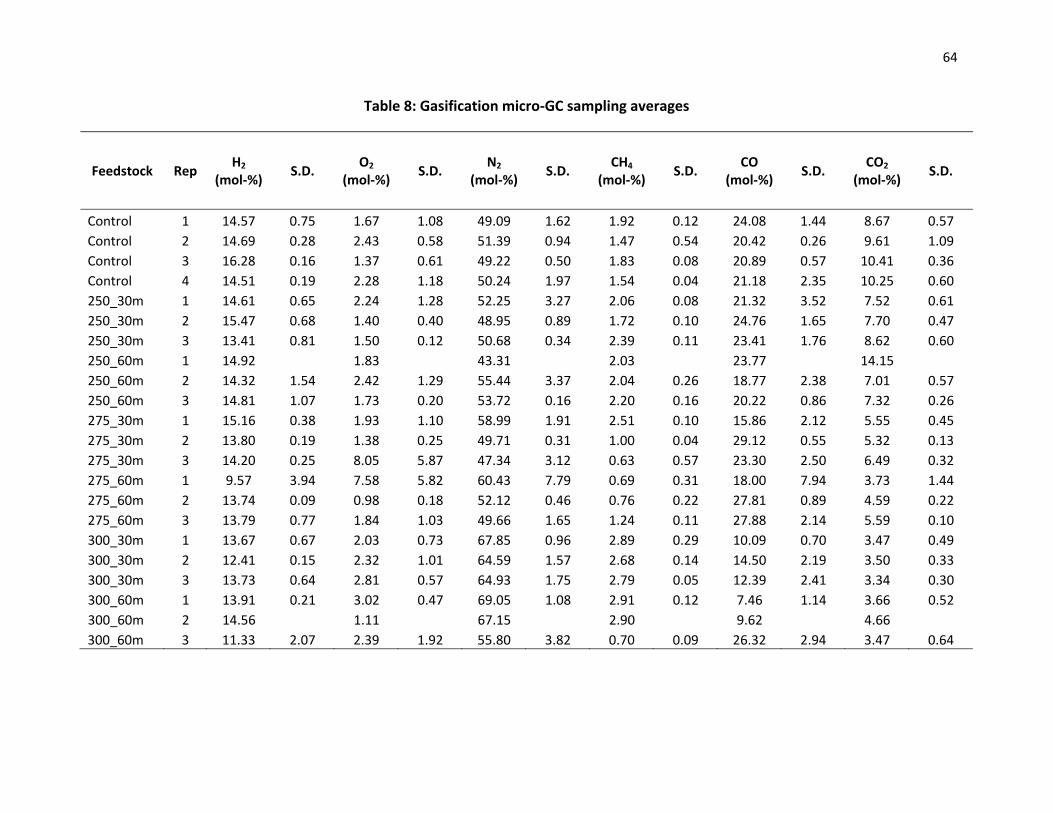
64
Table 8: Gasification micro‐GC sampling averages
Feedstock Rep H2
(mol‐%) S.D.
O2 (mol‐%)
S.D. N2
(mol‐%) S.D.
CH4 (mol‐%)
S.D. CO
(mol‐%) S.D.
CO2 (mol‐%)
S.D.
Control 1 14.57 0.75 1.67 1.08 49.09 1.62 1.92 0.12 24.08 1.44 8.67 0.57 Control 2 14.69 0.28 2.43 0.58 51.39 0.94 1.47 0.54 20.42 0.26 9.61 1.09 Control 3 16.28 0.16 1.37 0.61 49.22 0.50 1.83 0.08 20.89 0.57 10.41 0.36 Control 4 14.51 0.19 2.28 1.18 50.24 1.97 1.54 0.04 21.18 2.35 10.25 0.60 250_30m 1 14.61 0.65 2.24 1.28 52.25 3.27 2.06 0.08 21.32 3.52 7.52 0.61 250_30m 2 15.47 0.68 1.40 0.40 48.95 0.89 1.72 0.10 24.76 1.65 7.70 0.47 250_30m 3 13.41 0.81 1.50 0.12 50.68 0.34 2.39 0.11 23.41 1.76 8.62 0.60 250_60m 1 14.92 1.83 43.31 2.03 23.77 14.15 250_60m 2 14.32 1.54 2.42 1.29 55.44 3.37 2.04 0.26 18.77 2.38 7.01 0.57 250_60m 3 14.81 1.07 1.73 0.20 53.72 0.16 2.20 0.16 20.22 0.86 7.32 0.26 275_30m 1 15.16 0.38 1.93 1.10 58.99 1.91 2.51 0.10 15.86 2.12 5.55 0.45 275_30m 2 13.80 0.19 1.38 0.25 49.71 0.31 1.00 0.04 29.12 0.55 5.32 0.13 275_30m 3 14.20 0.25 8.05 5.87 47.34 3.12 0.63 0.57 23.30 2.50 6.49 0.32 275_60m 1 9.57 3.94 7.58 5.82 60.43 7.79 0.69 0.31 18.00 7.94 3.73 1.44 275_60m 2 13.74 0.09 0.98 0.18 52.12 0.46 0.76 0.22 27.81 0.89 4.59 0.22 275_60m 3 13.79 0.77 1.84 1.03 49.66 1.65 1.24 0.11 27.88 2.14 5.59 0.10 300_30m 1 13.67 0.67 2.03 0.73 67.85 0.96 2.89 0.29 10.09 0.70 3.47 0.49 300_30m 2 12.41 0.15 2.32 1.01 64.59 1.57 2.68 0.14 14.50 2.19 3.50 0.33 300_30m 3 13.73 0.64 2.81 0.57 64.93 1.75 2.79 0.05 12.39 2.41 3.34 0.30 300_60m 1 13.91 0.21 3.02 0.47 69.05 1.08 2.91 0.12 7.46 1.14 3.66 0.52 300_60m 2 14.56 1.11 67.15 2.90 9.62 4.66 300_60m 3 11.33 2.07 2.39 1.92 55.80 3.82 0.70 0.09 26.32 2.94 3.47 0.64

65
Table 9: Gasification energy yields and cold gas efficiency averages during sampling
Feedstock Rep
Total Energy Out
(MJ hr‐1)
S.D. Energy Yield
(MJ kg‐1)S.D.
Dry gas HHV
(MJ m‐3) S.D.
Cold Gas Efficiency
(%) S.D.
Control 1 120.33 10.35 12.73 1.09 5.87 0.30 74.95 6.44 Control 2 103.60 4.43 11.83 0.51 5.22 0.21 57.84 2.47 Control 3 122.43 2.46 14.05 0.28 5.64 0.11 68.66 1.38 Control 4 107.78 11.65 12.75 1.38 5.32 0.35 62.34 6.74 250_30m 1 115.05 18.29 12.74 2.03 5.57 0.53 59.22 9.41 250_30m 2 109.28 6.19 17.38 0.99 5.99 0.21 80.15 4.54 250_30m 3 122.07 6.01 12.07 0.59 5.82 0.17 55.93 2.75 250_60m 1 250_60m 2 100.69 15.19 12.71 1.92 5.19 0.58 57.03 8.61 250_60m 3 111.36 8.76 12.58 0.99 5.51 0.12 57.58 4.53 275_30m 1 99.30 12.53 12.59 1.59 5.11 0.36 51.29 6.47 275_30m 2 104.52 3.38 20.20 0.65 6.05 0.05 88.00 2.84 275_30m 3 104.64 3.19 17.58 0.54 5.18 0.56 77.99 2.37 275_60m 1 57.75 31.80 12.66 6.97 3.90 1.68 53.21 29.30 275_60m 2 105.37 2.67 28.72 0.73 5.77 0.06 112.29 2.85 275_60m 3 103.19 15.40 17.90 2.67 5.98 0.33 78.18 11.67 300_30m 1 41.52 36.04 14.57 0.79 4.32 0.12 53.62 2.92 300_30m 2 85.44 10.89 13.91 1.77 4.64 0.33 51.19 6.53 300_30m 3 82.93 9.53 14.12 1.62 4.58 0.25 51.42 5.91 300_60m 1 65.72 10.15 12.39 1.91 4.01 0.13 42.50 6.56 300_60m 2 69.00 24.34 4.38 84.47 300_60m 3 89.24 24.71 15.48 4.29 5.23 0.70 53.54 14.82
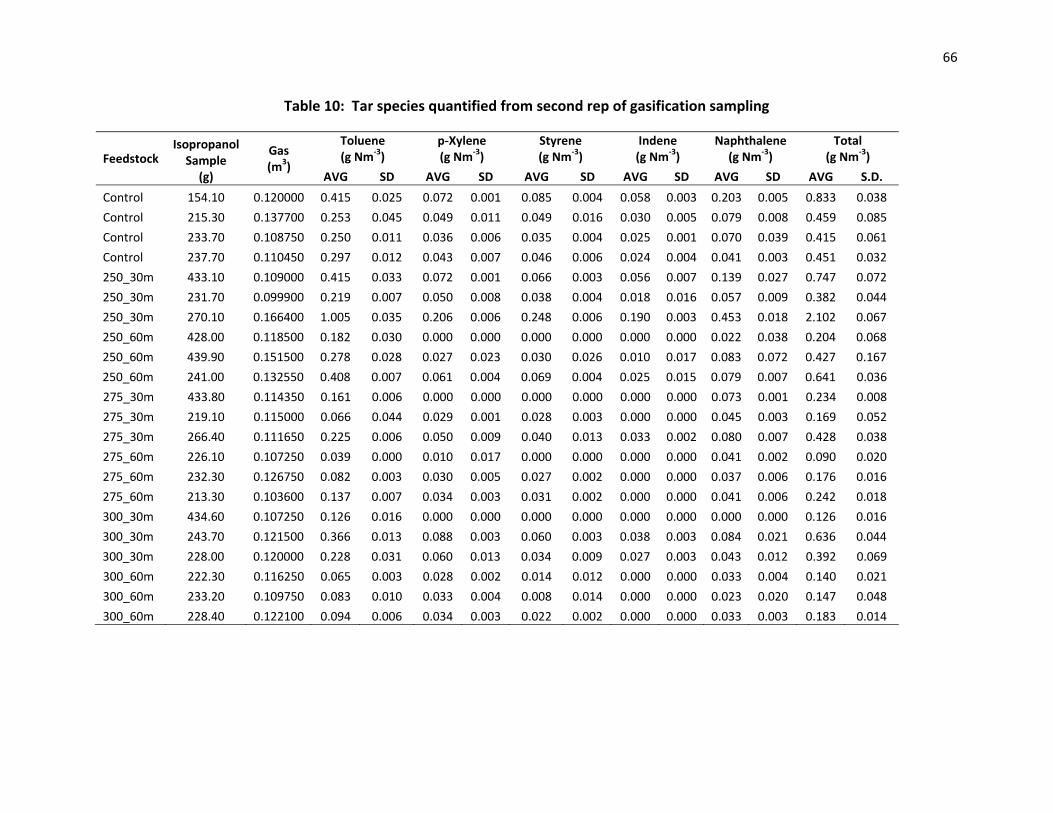
66
Table 10: Tar species quantified from second rep of gasification sampling
Feedstock Isopropanol Sample (g)
Gas (m3)
Toluene (g Nm‐3)
p‐Xylene (g Nm‐3)
Styrene (g Nm‐3)
Indene (g Nm‐3)
Naphthalene (g Nm‐3)
Total (g Nm‐3)
AVG SD AVG SD AVG SD AVG SD AVG SD AVG S.D.
Control 154.10 0.120000 0.415 0.025 0.072 0.001 0.085 0.004 0.058 0.003 0.203 0.005 0.833 0.038
Control 215.30 0.137700 0.253 0.045 0.049 0.011 0.049 0.016 0.030 0.005 0.079 0.008 0.459 0.085
Control 233.70 0.108750 0.250 0.011 0.036 0.006 0.035 0.004 0.025 0.001 0.070 0.039 0.415 0.061
Control 237.70 0.110450 0.297 0.012 0.043 0.007 0.046 0.006 0.024 0.004 0.041 0.003 0.451 0.032
250_30m 433.10 0.109000 0.415 0.033 0.072 0.001 0.066 0.003 0.056 0.007 0.139 0.027 0.747 0.072
250_30m 231.70 0.099900 0.219 0.007 0.050 0.008 0.038 0.004 0.018 0.016 0.057 0.009 0.382 0.044
250_30m 270.10 0.166400 1.005 0.035 0.206 0.006 0.248 0.006 0.190 0.003 0.453 0.018 2.102 0.067
250_60m 428.00 0.118500 0.182 0.030 0.000 0.000 0.000 0.000 0.000 0.000 0.022 0.038 0.204 0.068
250_60m 439.90 0.151500 0.278 0.028 0.027 0.023 0.030 0.026 0.010 0.017 0.083 0.072 0.427 0.167
250_60m 241.00 0.132550 0.408 0.007 0.061 0.004 0.069 0.004 0.025 0.015 0.079 0.007 0.641 0.036
275_30m 433.80 0.114350 0.161 0.006 0.000 0.000 0.000 0.000 0.000 0.000 0.073 0.001 0.234 0.008
275_30m 219.10 0.115000 0.066 0.044 0.029 0.001 0.028 0.003 0.000 0.000 0.045 0.003 0.169 0.052
275_30m 266.40 0.111650 0.225 0.006 0.050 0.009 0.040 0.013 0.033 0.002 0.080 0.007 0.428 0.038
275_60m 226.10 0.107250 0.039 0.000 0.010 0.017 0.000 0.000 0.000 0.000 0.041 0.002 0.090 0.020
275_60m 232.30 0.126750 0.082 0.003 0.030 0.005 0.027 0.002 0.000 0.000 0.037 0.006 0.176 0.016
275_60m 213.30 0.103600 0.137 0.007 0.034 0.003 0.031 0.002 0.000 0.000 0.041 0.006 0.242 0.018
300_30m 434.60 0.107250 0.126 0.016 0.000 0.000 0.000 0.000 0.000 0.000 0.000 0.000 0.126 0.016
300_30m 243.70 0.121500 0.366 0.013 0.088 0.003 0.060 0.003 0.038 0.003 0.084 0.021 0.636 0.044
300_30m 228.00 0.120000 0.228 0.031 0.060 0.013 0.034 0.009 0.027 0.003 0.043 0.012 0.392 0.069
300_60m 222.30 0.116250 0.065 0.003 0.028 0.002 0.014 0.012 0.000 0.000 0.033 0.004 0.140 0.021
300_60m 233.20 0.109750 0.083 0.010 0.033 0.004 0.008 0.014 0.000 0.000 0.023 0.020 0.147 0.048
300_60m 228.40 0.122100 0.094 0.006 0.034 0.003 0.022 0.002 0.000 0.000 0.033 0.003 0.183 0.014

67
y = 16.623xR² = 0.985
0
2000
4000
6000
8000
10000
12000
14000
16000
18000
20000
0 200 400 600 800 1000 1200
Area
Concentration (ppm)
Figure 16: GC‐FID Standard Curve Toluene
y = 15.674xR² = 0.997
0
2000
4000
6000
8000
10000
12000
14000
16000
18000
20000
0 200 400 600 800 1000 1200 1400
Area
Concentration (ppm)
Figure 17: GC‐FID Standard Curve Indene

68
y = 9.965xR² = 0.998
0
500
1000
1500
2000
2500
3000
3500
4000
4500
0 50 100 150 200 250 300 350 400 450
Area
Concentration (ppm)
Figure 18: GC‐FID Standard Curve Naphthalene
y = 14.71xR² = 0.997
0
2000
4000
6000
8000
10000
12000
14000
16000
0 200 400 600 800 1000 1200
Area
Concentration (ppm)
Figure 19: GC‐FID Standard Curve p‐Xylene

69
y = 14.71xR² = 0.997
0
2000
4000
6000
8000
10000
12000
14000
16000
0 200 400 600 800 1000 1200
Area
Concentration (ppm)
Figure 20: GC‐FID Standard Curve Styrene