Embed Size (px)
Citation preview
ORIG INAL PAPER
Too Much, Too Little, or Just Right? Recent Changesto State Child Support Guidelines for Low-IncomeNoncustodial Parents
Leslie Hodges1 & Lisa Klein Vogel2
Accepted: 5 October 2020/# Springer Nature Switzerland AG 2020
AbstractThere are growing concerns that current child support guidelines may result in “toohigh” orders likely to go unpaid and resulting in substantial debt. Recent federallegislation reflects these concerns by requiring states to consider the noncustodialparent’s ability to pay when setting child support orders [45 C.F.R. §302.56(c)(1)(ii)]. However, this legislation leaves states to determine how to balancethe economic needs of paying parents and their children. This paper explores how thisflexibility affects the extent of variation in order amounts for low-income parents acrossstates. To better understand how states interpret this new ruling and implications fororder amounts, we conducted a cross-state comparison of recent changes to state childsupport guidelines for low-income payors and calculated order amounts for severaltypes of cases. We find that states fall on a spectrum of how they conceive of parentalfinancial responsibility versus parental self-sufficiency in their policy. Some states viewnoncustodial parents’ responsibilities for their children’s financial needs as secondaryto parents’ abilities to meet their own basic needs; others view children’s needs ascoming first; and many fall somewhere in between. Our findings add to currentunderstanding of how child support agencies and lawmakers attempt to address thefinancial needs of low-income families through policy and statute. We find that havinggenerous self-support reserves and no minimum orders allows states to maximizenoncustodial parent income. However, if states seek to maximize financial contribu-tions to children, more graduated adjustments to order amounts may be preferable.
Keywords Child support policy . Child support guidelines . Child support order amounts .
Child support order burden . Noncustodial parents . Low-income children and families
Journal of Policy Practice and Researchhttps://doi.org/10.1007/s42972-020-00016-9
Supplementary Information The online version contains supplementary material available at https://doi.org/10.1007/s42972-020-00016-9.
* Lisa Klein [email protected]
Extended author information available on the last page of the article
Introduction
This study examines recent changes to state child support guidelines and childsupport order amounts for low-income noncustodial parents. It is increasinglycommon for children in the USA to live in single-parent households (U.S. CensusBureau 2019), and it is well recognized that living in a single-parent household is arisk factor for child poverty (National Academies of Sciences 2019). One in fourchildren lived apart from one of their parents in 2016 (U.S. Census Bureau 2017),and 30% of children in custodial parent families lived in poverty, compared with11% of other children in 2017 (Grall 2020). Child support paid by the parent livingapart from the child (the non-custodial parent) to the parent living with the child(the custodial parent) is often a significant source of income in single-parenthouseholds and can act as a buffer against the risk of poverty (Grall 2020; Haet al. 2018; Meyer and Hu 1999). Whereas informal cash support typically wanes inthe years following relationship dissolution (Berger et al. 2012; Nepomnyaschy andGarfinkel 2010), the formal child support system can help keep a steady stream ofincome flowing into the child’s home. Consistency of support helps custodialparents meet the regular costs associated with raising a child, such as rent, food,and clothing (Ha et al. 2010).
The federal child support program, established in 1975, was founded, in part, torecover costs for children receiving public assistance from parents living outside thehome (Committee on Ways and Means, U.S. House of Representatives 2018), and ithas an explicit goal of ensuring that parents living apart from their children contributeto their financial well-being. The child support system collected and distributed over$28 billion in child support in 2018 (OCSE 2019). However, non-payment of childsupport is a significant problem. More than half of custodial parents with ordersreceived less than the full amount of support due to them, and 30% did not receiveany support at all in 2017 (Grall 2020).
Although willingness to pay and characteristics of the child support enforcementsystem are important factors in nonpayment of support (Bartfeld and Meyer 2003),ability to pay support is increasingly recognized as critically important among re-searchers, with some researchers identifying ability to pay as the largest factor innon-payment (Mincy and Sorensen 1998; Vogel 2020a, 2020b). Salient for thisanalysis, previous research has identified ability to pay as especially important amongnoncustodial parents with limited economic resources, even in strong enforcementenvironments (Bartfeld and Meyer 2003; Goldberg 2015; Huang et al. 2005;Nepomnyaschy and Garfinkel 2010). In recognition that many parents behind in theirchild support payments have limited financial resources, nearly all states include specialconsiderations for low-income noncustodial parents in their child support guidelines(Venohr 2013), which are used to specify the amount of child support owed at variousincome levels.
Yet, how exactly states should respond to noncustodial parents with limitedabilities to pay remains a complex issue, especially given that accounting for thefinancial needs of the paying parent may be at direct odds with the goal ofensuring that parents living apart from their children contribute to their financialwell-being. The traditional perspective that accompanied the development of thechild support enforcement system through the 1990s centered on parental financial
Journal of Policy Practice and Research
responsibility and stressed the needs of the child as the most important componentin determining the child support order amount. More recent conversations on childsupport orders have leaned toward parental self-sufficiency and suggest that, insome circumstances, the needs of the noncustodial parent should precede theneeds of the child. These conversations were largely sparked by declines inearnings and increases in incarceration among less-educated younger men, manyof whom are noncustodial parents (Cancian et al. 2011). They have been furthermotivated by billions of dollars in child support arrearages, most of which areowed by low-income parents ($118 billion in 2018 (Office of Child SupportEnforcement 2019)); a number of high-profile accounts (e.g., Edin and Nelson2013) that have emphasized the potential negative consequences of high ordersand related enforcement for individual families; and several prominent childsupport demonstrations that have attempted alternative approaches to collectingchild support with limited or no improvement in payment or compliance outcomes(Cancian et al. 2019c; Miller and Knox 2001).
Partially in response to arguments in favor of setting child support orders in amanner better aligned with noncustodial parents’ abilities to pay and increasing theirodds of retaining enough money to achieve self-sufficiency, the federal governmentprovided states with additional direction regarding treatment of low-income noncusto-dial parents in December 2016. The Office of Child Support Enforcement’s issuance ofthe Flexibility, Efficiency, and Modernization in Child Support Programs Final Ruledirected states to set support orders based on a noncustodial parent’s ability to pay andconsidering his or her basic subsistence needs, while leaving it to the discretion of eachstate to decide whether to also take into consideration the earnings, income, and basicsubsistence needs of the custodial parent (42 C.F.R. § 302.56(c)(1)(i)). The developersexpected that the rule would yield orders that low-income obligors were more likely tobe able to pay and result in an increase in the consistency of child support paymentsmade to custodial parent families.
In this paper, we examine policy expectations about low-income noncustodialparents’ financial contributions to their children across the 50 states. We draw onstates’ child support guideline reviews conducted between January 2017 andMarch 2020 to identify policy changes salient to low-income obligors, and weuse online child support calculators to calculate order amounts for several types oflow-income cases. We find that states fall on a spectrum of how they conceive ofparental financial responsibility versus parental self-sufficiency in their childsupport policy and particularly when setting child support orders for low-incomenoncustodial parents. Consistent with more contemporary perspectives, somestates view the noncustodial parent’s responsibility for their child’s financial needsas secondary to the noncustodial parent’s ability to meet their own basic needs.Consistent with more traditional perspectives, other states view the child’s needsas coming first. For states in the former category, the most common strategy toaddress the limited financial resources of the non-custodial parent is to use a self-support reserve (SSR), which allows the parent to retain income up to a certainamount before an obligation is set. For states in the latter category, the mostcommon strategy is to make no adjustment to their standard child support guide-lines and leave any potential adjustment to the discretion of the courts. However,many states fall somewhere in between.
Journal of Policy Practice and Research
Policy Issue: Non-payment of Child Support
Non-payment of child support is a significant problem. The total amount of childsupport arrearages was more than $118 billion in 2018 (Office of Child SupportEnforcement 2019). There are many reasons why noncustodial parents pay (or do notpay) the formal child support that they owe. Bartfeld and Meyer (2003) present threeconceptual categories affecting child support compliance: ability to pay, incentives tocomply (or willingness to pay), and characteristics of the enforcement system.
For obligors with limited economic resources—who are the focus of the currentstudy—ability to pay plays a significant role in paying what is owed. The amount aparent earns is associated with the amount of formal support the parent pays (Bartfeldand Meyer 2003; Chen and Meyer 2017; Goldberg 2015; Huang et al. 2005; Mincy andSorensen 1998; Nepomnyaschy and Garfinkel 2010). So, too, is how much a parentowes relative to their earnings, often referred to as the economic burden of the childsupport order (Cancian and Meyer 2004; Hodges et al. 2020; Huang et al. 2005; Meyeret al. 2008). Having child support obligations for multiple families also affects manynoncustodial parents’ abilities to pay support, as it leads to higher amounts owed andmore burdensome orders (Cancian and Meyer 2004; Manning and Smock 2000;Sinkewicz and Garfinkel 2009).
Willingness to pay child support is also salient for obligors with limited economicresources, particularly those with informal earnings. Most (72%) noncustodial parentspay child support through automatic wage withholding, a process beyond their control(Tollestrup 2019). However, for “discretionary obligors,” or noncustodial parents whopay outside of automated systems, willingness to pay can affect compliance (Bartfeldand Meyer 2003). Factors associated with willingness to pay include quality of co-parenting and parent-child relationships and noncustodial parent access to and contactwith children (Goldberg 2015; Nepomnyaschy and Garfinkel 2010). While positiverelationships with custodial parents and children can increase a noncustodial parent’swillingness to pay, negative experiences with the child support system can decreasewillingness to pay (Edin and Nelson 2013; Vogel 2020a; Vogel 2020b; Waller andPlotnick 2001). These negative experiences can also push the paying parent to workoutside of the formal system to avoid having support collected through automatic wagewithholding (Cancian et al. 2013; Heinrich et al. 2011; Miller and Mincy 2012).
Finally, child support agencies use various tools to enforce payment of childsupport. These include data systems such as the Federal Parent Locator Service(FPLS) and the National Directory of New Hires (NDNH) that help agencies locatenoncustodial parents and access information about their employment, income with-holding (from wages, unemployment insurance benefits, and tax refunds), and admin-istrative consequences for nonpayment (such as driver’s license suspension). Generally,research indicates that a stronger enforcement system leads to increased payments—apotentially important motivator, in particular, for discretionary obligors who make achoice about whether to pay (Bartfeld and Meyer 2003; Freeman and Waldfogel 2001;Garfinkel et al. 1998). Recent evidence also suggests that the enforcement of formalchild support obligations plays an important role in the equity of noncustodial parents’contributions to children in multiple families (Berger et al. 2019) and to the stability ofcontributions over time as a child ages (Nepomnyaschy and Garfinkel 2010; Sariscsanyet al. 2019).
Journal of Policy Practice and Research
Child Support Program Background
Child Support Guidelines
Child support guidelines provide a consistent basis for calculating child supportobligations based on parents’ financial resources and the needs of children. The federalgovernment and states each play an important role in shaping child support guidelines.Federal legislation requires that states develop and use guidelines to calculate childsupport obligations for noncustodial parents; develop and implement criteria underwhich a child support obligation can deviate from the guidelines; and review theirguidelines every 4 years to consider whether or not they need to be updated to take intoaccount the costs of raising children (Child Support Enforcement Amendments of1984; Family Support Act of 1988; Venohr 2013).1 States are then responsible forthe development, implementation, and periodic assessment of guidelines. As a result,states have substantial flexibility to determine how guidelines are operationalized andapplied and there is a considerable amount of cross-state variation in child supportguidelines, criteria for guidelines deviations, and guidelines review processes.
For example, states have the flexibility to select a model to serve as the basis ofcalculating the state guidelines. The income shares model, used by 40 states and theDistrict of Columbia,2 takes into account the noncustodial and custodial parents’incomes and the number of children they have had together. The incomes of thenoncustodial parent and the custodial parent are combined to calculate the totalexpected contribution to the child. Each parent’s share of the expected contribution isbased on his or her share of total income, and the noncustodial parent’s share is thechild support order amount (Venohr 2016). The percentage of obligor income model,used by seven states, does not explicitly consider the custodial parent’s income, and isinstead set as a percentage of the noncustodial parent’s income, adjusted for the numberof children the noncustodial parent has. Some states apply an invariant percentageamount across income levels on the basis that parents spend roughly the same propor-tion of their income on child rearing across the income distribution (Cancian andCostanzo 2019); other states vary the percentage at different income levels. The Melsonformula, used by three states, uses an income-shares formula to account for the basicneeds of the child, then a percent of obligor income model to calculate additionalsupport for the child beyond the child’s basic needs and after accounting for thenoncustodial parent’s basic needs (Venohr 2013, 2016).
Even when states use the same mathematical model, order amounts for parents withthe same levels of income can vary for several reasons. First, states can draw ondifferent research studies to inform their calculations of the costs of raising a child(Venohr 2013). Second, states can differ in the income basis on which orders arecalculated, with some using gross income and others using net income. Third, states canvary in their treatment of noncustodial parents with very low and very high incomes.
1 Requiring the use of guidelines and establishing criteria for deviating from them limits judicial discretion inthe establishment of order amounts, in the interest of promoting fairness and consistency across cases (Brito2012; Pirog et al. 1998) and in the interest of making the process of setting order amounts simpler and makingthe amounts themselves more predictable (Brito 2012).2 The District of Columbia uses a hybrid model combining the percentage-of-income model with a mathe-matical reduction based on the custodial parent’s income (McCann 2019).
Journal of Policy Practice and Research
Fourth, they can take different approaches to adjustments made in calculating incomeand allowable deductions (Venohr 2013, 2016). For example, some states take localeconomic conditions such as housing expenses and relative income for the state intoaccount when setting guidelines, while other states do not. Some states use actualexpenditure amounts, such as childcare expenses, for calculating deductions, whileothers do not. Additionally, some states adjust order amounts for parents with sharedparenting arrangements, and the time thresholds and adjustment amounts vary acrossstates. Finally, states typically allow judges to deviate from the amounts established inguidelines within a set of parameters, considering a child’s needs and parents’ abilitiesto provide the needed support (Brito 2012).
Recent Federal Legislation
In 2016, the federal Office of Child Support Enforcement issued the Flexibility,Efficiency and Modernization in Child Support Enforcement Programs Final Rule.The final rule contains a number of provisions OCSE described as intended to helpimprove program operations, increase payments and remove barriers to payments, andimprove customer service (Office of Child Support Enforcement 2017a).3 Central tothis research, the final rule includes a number of provisions related specifically to low-income obligors, in recognition that “setting an accurate child support order based onthe noncustodial parent’s ability to pay improves the chances that the parent willcomply with the support order and continue to pay over time” (Flexibility, efficiency,and modernization of child support enforcement programs, 2016 p. 93516).
In relation to low-income obligors, the final rule directs states to ensure that therevised child support guidelines calculate orders based on “the noncustodial parent’searnings, income, and other evidence of ability to pay” (42 C.F.R. § 302.56(c)(1)), that“takes into consideration all earnings and income of the noncustodial parent (and at theState’s discretion, the custodial parent)” (42 C.F.R. § 302.56(c)(1)(i)); and facilitatetransparency and consistency of the guidelines by basing them on “specific descriptiveand numeric criteria [resulting] in the computation of the child support obligation” (42C.F.R. § 302.56(c)(4)). It also requires states to specifically address the basic subsis-tence needs of low-income noncustodial parents, by requiring that the revised guide-lines include “a low-income adjustment, such as a self-support reserve” for those withlimited ability to pay (42 C.F.R. § 302.56(c)(1)(ii)), which is the main focus of thecurrent study, and by requiring that states limit imputation practices that inappropriatelyinflate a noncustodial parent’s ability to pay (42 C.F.R. § 302.56(c)(1)(iii)).
The final rule also requires that each state review and revise their child supportguidelines to meet the requirements of the rule within a year of completing its nextquadrennial review (though states whose review was scheduled for within a year of thefinal rule’s issuance were allowed to postpone this requirement until after their nextscheduled quadrennial review), and every 4 years thereafter. Broadly, states arerequired to consider, in the course of these reviews: data on the cost of raising children;
3 The final rule also addresses the 2011 Supreme Court decision Turner v. Rodgers by implementing due-process requirements for contempt actions related to determination of an obligor’s ability to pay. It also barsstates from treating incarceration as a form of voluntary unemployment, precluding incarcerated obligors fromobtaining an order modification on the grounds of a substantial change in circumstances (OCSE 2017b).
Journal of Policy Practice and Research
labor market data by occupation and skill level within the state; and factors that affectcompliance rates with child support orders and employment rates among noncustodialparents.4
Guidelines Adjustments for Low-Income Payors
Nearly all (45) states provide a guidelines adjustment when a noncustodial parent’sincome is low. Some states use an alternate schedule for low-income obligors, in whicha lower percentage of income is required of the noncustodial parent (Brito 2012;Cancian et al. 2011). Other states employ an SSR, which compares a noncustodialparent’s income to an amount presumed necessary to meet his or her own basic needsand calculates child support order amounts based on the amount of income remaining(Brito 2012; Venohr 2013, 2016). SSRs are often, though not always, explicitly denotedin child support guidelines among the states that use them (Venohr 2013, 2016).
Additionally, some states have minimum order requirements for noncustodial parentswith very low incomes. Minimum order requirements are predicated on the principlethat all parents have an obligation to provide for their children financially, regardless ofincome (Brito 2012). Some states set nominimum and allow for judicial discretion in thedetermination of the order amount for low-income obligors; others set a presumptiveminimum for low-income obligors that can be rebutted with judicial discretion (Brito2012; McCann 2019). Other states, however, impose a mandatory minimum that cannotbe adjusted, regardless of the noncustodial parent’s income (Brito 2012; Venohr 2013,2016). Most commonly, states use a $50 order minimum, though some states employ ahigher minimum and others use a lower minimum (Venohr 2013, 2016).
Child support guidelines can help define and predict order amounts for low-incomeobligors. However, some child support practices may result in orders that do not alignwith the parent’ actual economic circumstances. For example, all state guidelines allowfor income imputation, or the use of assumptions about how much a noncustodialparent can earn in lieu of using actual earnings to set child support order amounts(McCann 2019). Recent research has found substantially lower payment amounts andrates of compliance (total amount paid as a proportion of the amount due) fornoncustodial parents with imputed income orders compared with those without(Cancian et al. 2019a; Demyan and Passarella 2018). Further, default judgments, ororders issued when an obligor does not appear in court, may be calculated absentinformation from the obligor about his or her income. Previous research has indicatedthat default orders can result in order amounts higher than low-income obligors are ableto pay (Cancian et al. 2019a; Sorensen and Oliver 2002; Sorensen 2004).
4 The rule also required that states examine the “impact of guidelines policies and amounts on custodial andnoncustodial parents who have family incomes below 200% of the Federal poverty level” (42 C.F.R. §302.56(h)(1)); conduct analyses of case data on “the application of and deviations from the child supportguidelines, as well as the rates of default and imputed child support orders and orders determined using thelow-income adjustment required” (42 C.F.R. § 302.56(h)(2)); compare payments by case characteristicsaffecting low-income obligors in particular, including whether or not the case was entered into by default,set using imputation, or determined using a low-income adjustment; and provide a “meaningful opportunityfor public input, including input from low-income custodial and noncustodial parents and their representa-tives,” as well as the child support agency (42 C.F.R. § 302.56(h)(3)).
Journal of Policy Practice and Research
Materials and Methods
Content Analysis of Recent Changes to Low-Income Guidelines
To contribute to current understanding of how child support agencies and lawmakersare attempting to address the financial needs of low-income noncustodial parentsthrough policy and statute following the 2016 ruling, we begin by presenting findingsfrom a content analysis of 21 state child support guidelines reviews focused on policychanges (considered or implemented) salient to low-income obligors. For this paper, wefocus specifically on two policy changes related to provisions in the final rule and thenumerical computation of child support orders: the basic subsistence needs of thepaying parent and minimum order requirements.5
We performed an online search to identify states that released documentation ontheir guidelines review processes following enactment of the final rule (i.e., betweenJanuary 2017 and March 2020).6 The documentation of states’ review processes variedin format and detail and included sources such as reviews undertaken by externalconsultants; recommendations from the state’s guidelines review committee; revisedstatute, policy, or judicial orders (sometimes with changes highlighted and rationalesfor changes provided); and meeting notes summarizing key issues considered by theguidelines review committee. We coded the available documentation using a conven-tional content analysis approach (Hsieh and Shannon 2005).
Basic Subsistence Needs of Low-Income Obligors
Following the 2016 ruling, the most central changes to the low-income guidelinesconsidered by states were mechanisms for taking into consideration the basic subsis-tence needs of noncustodial parents such as low-income adjustments or SSRs. Thesechanges were directly related to the final rule, which directed states to take the basicsubsistence needs of noncustodial parents with low incomes into account when settingorders through a low-income adjustment of each state’s choosing. Fourteen statesconsidered or implemented changes to their approaches towards adjusting the obliga-tions of low-income noncustodial parents; three had approaches in place that theirreviews indicated already met the federal requirement. Of the 14 states, 12 consideredsome sort of change related to an SSR. Six states considered or implemented new ormodified SSRs, by increasing them or tying them to updated federal poverty guidelines.One considered eliminating the reserve in favor of a low-income adjustment and oneconsidered newly adding a low-income adjustment. Three considered or implemented
5 The states included are Alabama, Arizona, Colorado, Delaware, Florida, Indiana, Iowa, Kansas, Massachu-setts, Missouri, Montana, Nebraska, Nevada, New Jersey, New Mexico, North Carolina, North Dakota, Ohio,Oregon, Rhode Island, and Utah. Links to the guidelines documentation for these states are provided inAppendix A. We also examined the extent to which states considered or implemented changes related to thefinal rule outside of the scope of this paper, including imputation practices, public health insurance, andincarcerated obligors.6 The final rule included a provision that states could postpone considerations related to the final rule untiltheir subsequent quadrennial review if their next scheduled quadrennial review fell within 1 year of the finalrule’s effective date. For the states whose reviews fell in 2017, we included the states that considered at leastsome changes pursuant to the final rule (even if the state postponed some decisions until its subsequentquadrennial review), and excluded states that did not.
Journal of Policy Practice and Research
changes to make the SSR more explicit and transparent; in these states, a reserveamount was implied by not showing the order amount for incomes below a particularthreshold in the guidelines tables. Five states considered or implemented changes toaddress obligors with incomes just above the SSR. These states sought to reduce oreliminate a “cliff effect,”where noncustodial parents just above the SSR saw a dramaticincrease in their order amounts, by phasing in incrementally higher orders as thenoncustodial parent’s income increased above the SSR amount.
Minimum Order Requirements
Another change to the low-income guidelines considered by states was making changesto minimum order requirements. States were not required to make changes to minimumorder requirements following the final ruling, but minimum order amounts affect ordersfor low-income noncustodial parents since they primarily apply to obligors with thelowest incomes. Of the seven states that considered or enacted changes to minimumorder requirements, four considered or enacted changes reducing or eliminating min-imums for low-earning obligors, two considered or enacted changes increasing mini-mums, and one considered or enacted changes changing the basis of the minimum froma fixed rate to a percentage.
Cross-State Comparison of Order Amounts for Low-Income Payors
Next, we compare expectations about child support contributions from low-incomenoncustodial parents across states based on our calculations of child support orders forseveral types of low-income cases. With this approach, often used in internationalcomparative policy research, several scenarios with hypothetical family types arepresented, varying on the income level of each parent and the number of children.This allows for straightforward comparisons across states while also allowing us toconsider whether states differ based on the characteristics selected. It also allows us toidentify patterns in how states prioritize the ability of noncustodial parents to meet theirown basic needs versus the goal of maximizing expected contributions for childrenliving outside of the home.
Study Population, Data, and Scenarios
Our study population was all 50 US states and the District of Columbia. We drew ourincome data for the noncustodial parent (father) and the custodial parent (mother) onour hypothetical cases from two public sources. We used estimates of median weeklyearnings by state and sex from the Bureau of Labor Statistics (Bureau of LaborStatistics 2019) and information about state minimum wage rates from the US Depart-ment of Labor (Department of Labor 2019).
We calculated the monthly order amount that would result from each state’s childsupport guidelines for four different scenarios where we changed the income of thenoncustodial parent while holding the income of the custodial parent constant (shownin Table 1). For most states, we were able to calculate order amounts using publiclyavailable child support calculators from child support agency websites. For ten statesthat did not have their own online calculators, we used a generic online child support
Journal of Policy Practice and Research
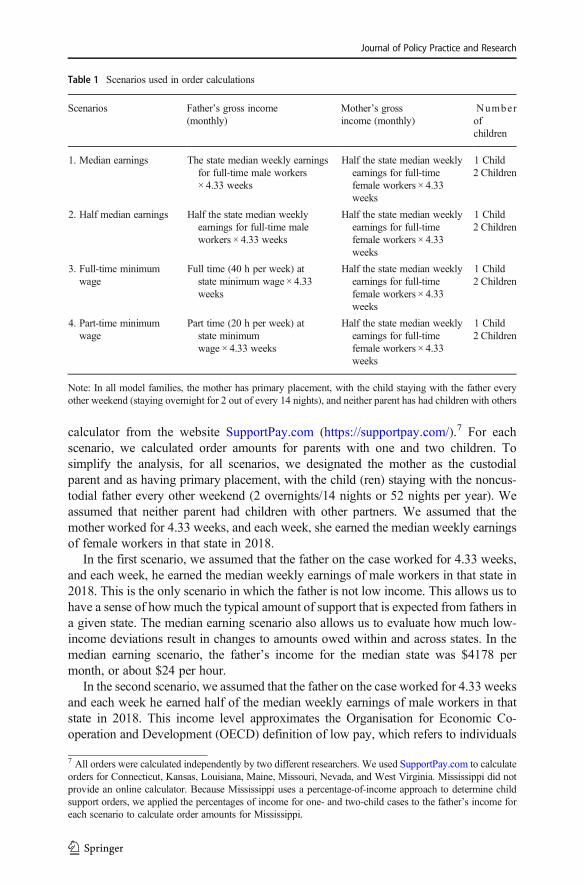
calculator from the website SupportPay.com (https://supportpay.com/).7 For eachscenario, we calculated order amounts for parents with one and two children. Tosimplify the analysis, for all scenarios, we designated the mother as the custodialparent and as having primary placement, with the child (ren) staying with the noncus-todial father every other weekend (2 overnights/14 nights or 52 nights per year). Weassumed that neither parent had children with other partners. We assumed that themother worked for 4.33 weeks, and each week, she earned the median weekly earningsof female workers in that state in 2018.
In the first scenario, we assumed that the father on the case worked for 4.33 weeks,and each week, he earned the median weekly earnings of male workers in that state in2018. This is the only scenario in which the father is not low income. This allows us tohave a sense of how much the typical amount of support that is expected from fathers ina given state. The median earning scenario also allows us to evaluate how much low-income deviations result in changes to amounts owed within and across states. In themedian earning scenario, the father’s income for the median state was $4178 permonth, or about $24 per hour.
In the second scenario, we assumed that the father on the case worked for 4.33 weeksand each week he earned half of the median weekly earnings of male workers in thatstate in 2018. This income level approximates the Organisation for Economic Co-operation and Development (OECD) definition of low pay, which refers to individuals
7 All orders were calculated independently by two different researchers. We used SupportPay.com to calculateorders for Connecticut, Kansas, Louisiana, Maine, Missouri, Nevada, and West Virginia. Mississippi did notprovide an online calculator. Because Mississippi uses a percentage-of-income approach to determine childsupport orders, we applied the percentages of income for one- and two-child cases to the father’s income foreach scenario to calculate order amounts for Mississippi.
Table 1 Scenarios used in order calculations
Scenarios Father’s gross income(monthly)
Mother’s grossincome (monthly)
Numberofchildren
1. Median earnings The state median weekly earningsfor full-time male workers× 4.33 weeks
Half the state median weeklyearnings for full-timefemale workers × 4.33weeks
1 Child2 Children
2. Half median earnings Half the state median weeklyearnings for full-time maleworkers × 4.33 weeks
Half the state median weeklyearnings for full-timefemale workers × 4.33weeks
1 Child2 Children
3. Full-time minimumwage
Full time (40 h per week) atstate minimum wage × 4.33weeks
Half the state median weeklyearnings for full-timefemale workers × 4.33weeks
1 Child2 Children
4. Part-time minimumwage
Part time (20 h per week) atstate minimumwage × 4.33 weeks
Half the state median weeklyearnings for full-timefemale workers × 4.33weeks
1 Child2 Children
Note: In all model families, the mother has primary placement, with the child staying with the father everyother weekend (staying overnight for 2 out of every 14 nights), and neither parent has had children with others
Journal of Policy Practice and Research
earning less than two-thirds of median earnings (Organisation for Economic Co-operation and Development 2019).8 This income level also allows us to examine orderamounts for fathers that are low-income but unlikely to qualify for a low-incomeadjustment, since adjustments are typically targeted toward those with incomes closerto 100% of the federal poverty level. In the half median earning scenario, the father’sincome for the median state was $2089 per month, or about $12 per hour.
In the third scenario, we assumed that the father on the case worked for 4.33weeks, andeach week, he worked full-time (40 h) at the state’s minimum hourly wage rate in 2018.Historically, full-time minimum wage has been the income amount that states use to setorders when the noncustodial parent’s income is unknown (Fleming 2017). For thisscenario, we expect some variation across states in whether the father qualifies for alow-income adjustment. While most low-income adjustments are targeted to fathers at orbelow the federal poverty level, some states make adjustments for fathers with incomes upto 150% of the federal poverty level. In the full-time minimumwage scenario, the father’sgross income for the median state was $1429 per month, or about $8 per hour and about137% of the federal poverty level for a single person household in 2019.
In the fourth and final scenario, we assumed that the father on the case worked for4.33 weeks, and each week, he worked part-time (20 h per week) at the state’s 2018minimum wage rate. We use this income level to approximate the earnings of eco-nomically disadvantaged fathers in the IV-D caseload who are least likely to make anychild support payments in a given year. In the part-time minimum wage scenario, thefather’s gross income for the median state was $714, or about 69% of the federalpoverty level for a single person household in 2019, and about $8568 annually. Thisincome level is consistent with Sorensen and Zibman (2001)’s estimation of theaverage annual income for low-income fathers who do not pay any child support(approximately $8980 in 2018 dollars).
Analytic Approach
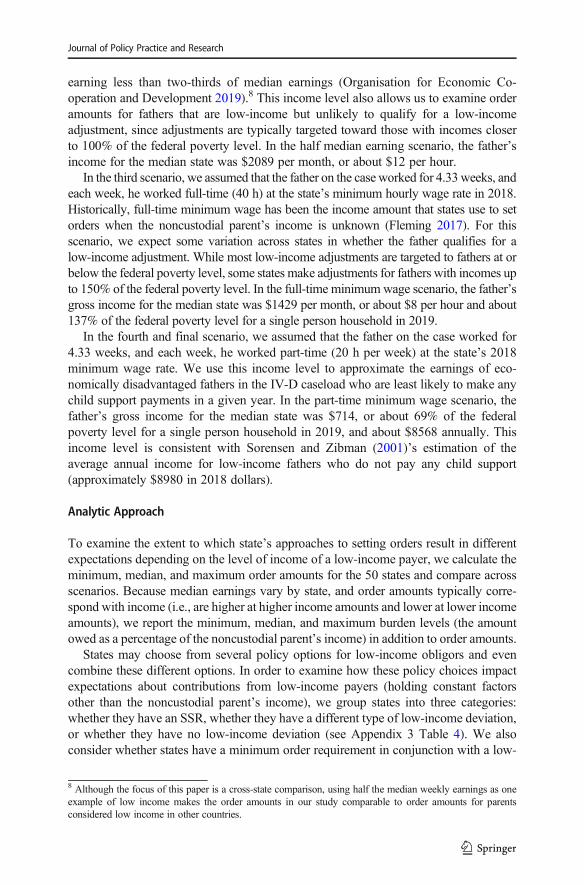
To examine the extent to which state’s approaches to setting orders result in differentexpectations depending on the level of income of a low-income payer, we calculate theminimum, median, and maximum order amounts for the 50 states and compare acrossscenarios. Because median earnings vary by state, and order amounts typically corre-spond with income (i.e., are higher at higher income amounts and lower at lower incomeamounts), we report the minimum, median, and maximum burden levels (the amountowed as a percentage of the noncustodial parent’s income) in addition to order amounts.
States may choose from several policy options for low-income obligors and evencombine these different options. In order to examine how these policy choices impactexpectations about contributions from low-income payers (holding constant factorsother than the noncustodial parent’s income), we group states into three categories:whether they have an SSR, whether they have a different type of low-income deviation,or whether they have no low-income deviation (see Appendix 3 Table 4). We alsoconsider whether states have a minimum order requirement in conjunction with a low-
8 Although the focus of this paper is a cross-state comparison, using half the median weekly earnings as oneexample of low income makes the order amounts in our study comparable to order amounts for parentsconsidered low income in other countries.
Journal of Policy Practice and Research
income deviation (also shown in Appendix 3 Table 4). We report min, max, andmedian order amounts by policy category and scenario.
Results
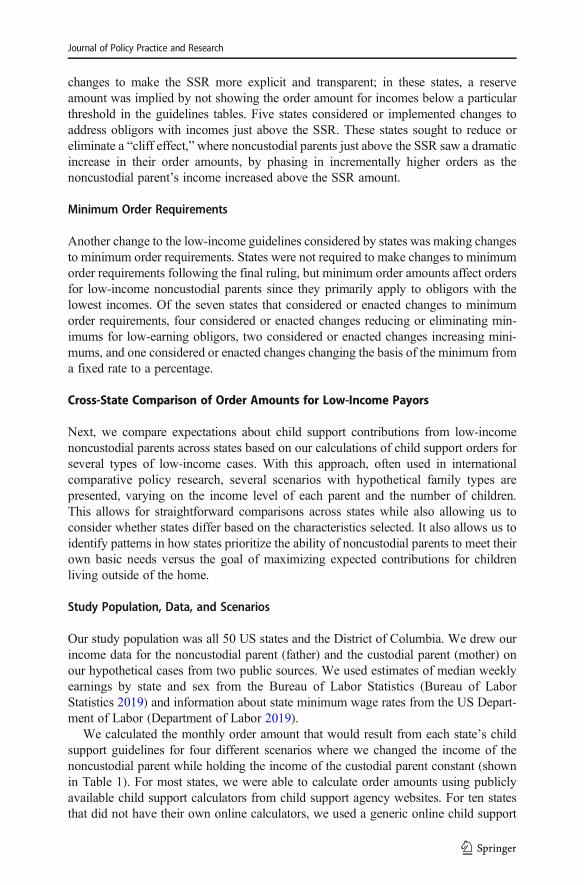
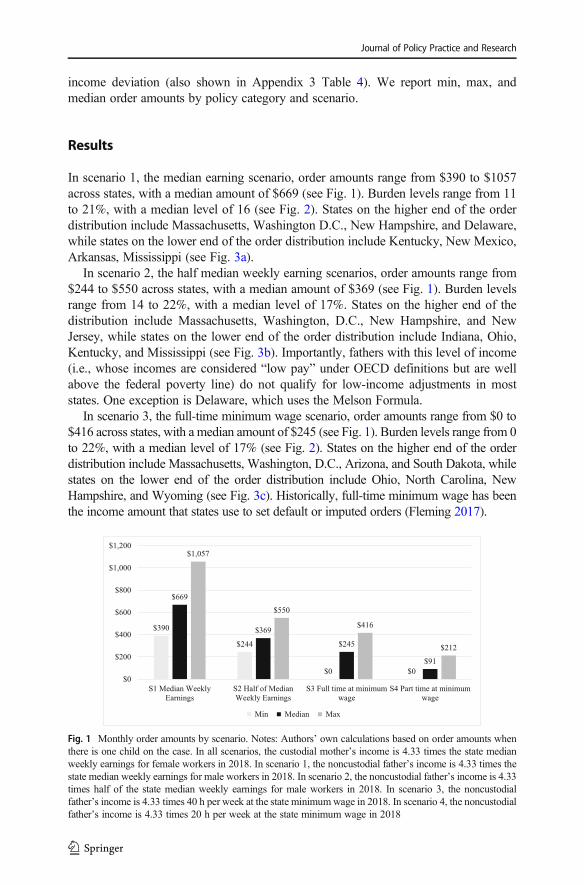
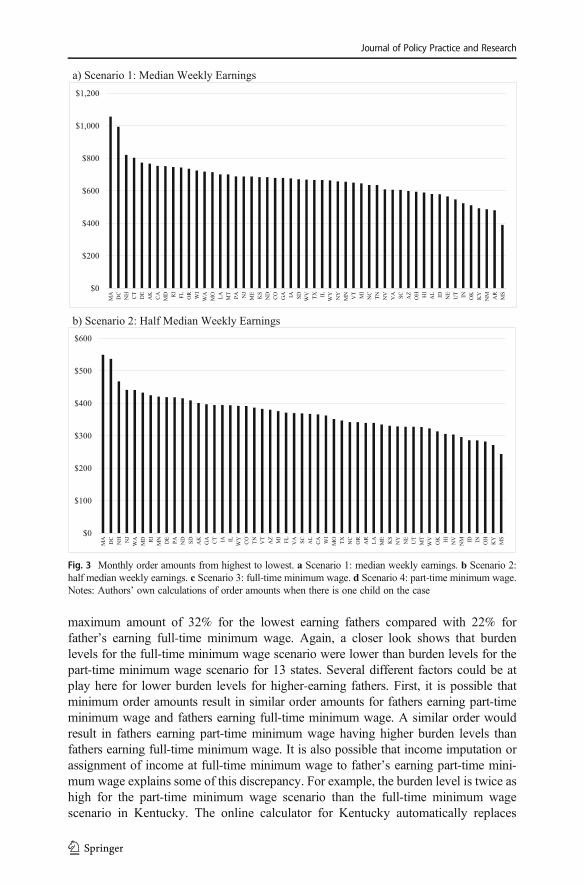
In scenario 1, the median earning scenario, order amounts range from $390 to $1057across states, with a median amount of $669 (see Fig. 1). Burden levels range from 11to 21%, with a median level of 16 (see Fig. 2). States on the higher end of the orderdistribution include Massachusetts, Washington D.C., New Hampshire, and Delaware,while states on the lower end of the order distribution include Kentucky, New Mexico,Arkansas, Mississippi (see Fig. 3a).
In scenario 2, the half median weekly earning scenarios, order amounts range from$244 to $550 across states, with a median amount of $369 (see Fig. 1). Burden levelsrange from 14 to 22%, with a median level of 17%. States on the higher end of thedistribution include Massachusetts, Washington, D.C., New Hampshire, and NewJersey, while states on the lower end of the order distribution include Indiana, Ohio,Kentucky, and Mississippi (see Fig. 3b). Importantly, fathers with this level of income(i.e., whose incomes are considered “low pay” under OECD definitions but are wellabove the federal poverty line) do not qualify for low-income adjustments in moststates. One exception is Delaware, which uses the Melson Formula.
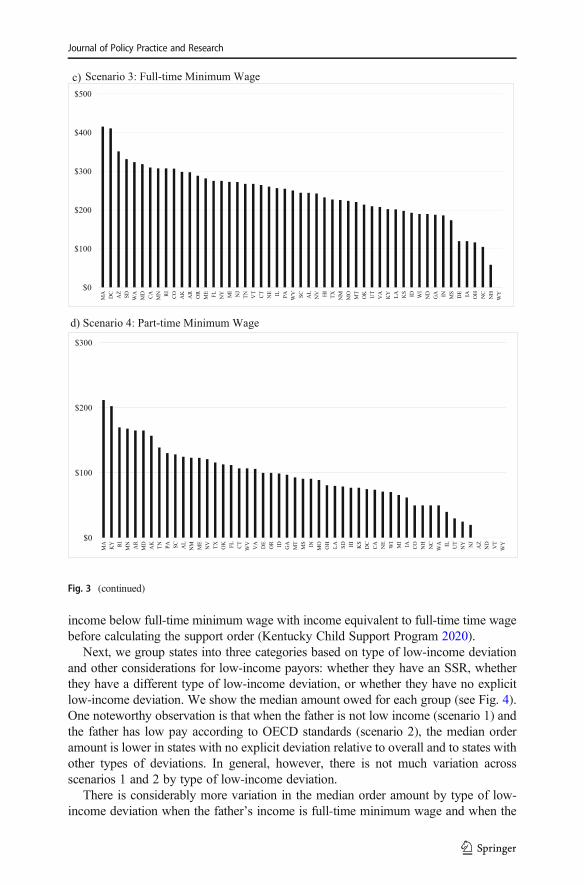
In scenario 3, the full-time minimum wage scenario, order amounts range from $0 to$416 across states, with a median amount of $245 (see Fig. 1). Burden levels range from 0to 22%, with a median level of 17% (see Fig. 2). States on the higher end of the orderdistribution include Massachusetts, Washington, D.C., Arizona, and South Dakota, whilestates on the lower end of the order distribution include Ohio, North Carolina, NewHampshire, and Wyoming (see Fig. 3c). Historically, full-time minimum wage has beenthe income amount that states use to set default or imputed orders (Fleming 2017).
$390
$244
$0 $0
$669
$369
$245
$91
$1,057
$550
$416
$212
$0
$200
$400
$600
$800
$1,000
$1,200
S1 Median WeeklyEarnings
S2 Half of MedianWeekly Earnings
S3 Full time at minimumwage
S4 Part time at minimumwage
Min Median Max
Fig. 1 Monthly order amounts by scenario. Notes: Authors’ own calculations based on order amounts whenthere is one child on the case. In all scenarios, the custodial mother’s income is 4.33 times the state medianweekly earnings for female workers in 2018. In scenario 1, the noncustodial father’s income is 4.33 times thestate median weekly earnings for male workers in 2018. In scenario 2, the noncustodial father’s income is 4.33times half of the state median weekly earnings for male workers in 2018. In scenario 3, the noncustodialfather’s income is 4.33 times 40 h per week at the state minimumwage in 2018. In scenario 4, the noncustodialfather’s income is 4.33 times 20 h per week at the state minimum wage in 2018
Journal of Policy Practice and Research
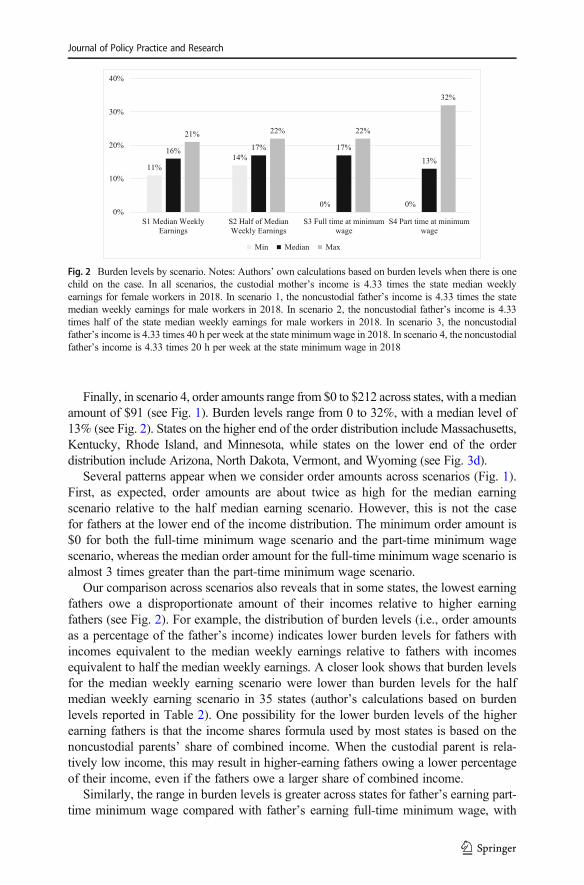
Finally, in scenario 4, order amounts range from $0 to $212 across states, with amedianamount of $91 (see Fig. 1). Burden levels range from 0 to 32%, with a median level of13% (see Fig. 2). States on the higher end of the order distribution include Massachusetts,Kentucky, Rhode Island, and Minnesota, while states on the lower end of the orderdistribution include Arizona, North Dakota, Vermont, and Wyoming (see Fig. 3d).
Several patterns appear when we consider order amounts across scenarios (Fig. 1).First, as expected, order amounts are about twice as high for the median earningscenario relative to the half median earning scenario. However, this is not the casefor fathers at the lower end of the income distribution. The minimum order amount is$0 for both the full-time minimum wage scenario and the part-time minimum wagescenario, whereas the median order amount for the full-time minimum wage scenario isalmost 3 times greater than the part-time minimum wage scenario.
Our comparison across scenarios also reveals that in some states, the lowest earningfathers owe a disproportionate amount of their incomes relative to higher earningfathers (see Fig. 2). For example, the distribution of burden levels (i.e., order amountsas a percentage of the father’s income) indicates lower burden levels for fathers withincomes equivalent to the median weekly earnings relative to fathers with incomesequivalent to half the median weekly earnings. A closer look shows that burden levelsfor the median weekly earning scenario were lower than burden levels for the halfmedian weekly earning scenario in 35 states (author’s calculations based on burdenlevels reported in Table 2). One possibility for the lower burden levels of the higherearning fathers is that the income shares formula used by most states is based on thenoncustodial parents’ share of combined income. When the custodial parent is rela-tively low income, this may result in higher-earning fathers owing a lower percentageof their income, even if the fathers owe a larger share of combined income.
Similarly, the range in burden levels is greater across states for father’s earning part-time minimum wage compared with father’s earning full-time minimum wage, with
11%
14%
0% 0%
16% 17% 17%
13%
21% 22% 22%
32%
0%
10%
20%
30%
40%
S1 Median WeeklyEarnings
S2 Half of MedianWeekly Earnings
S3 Full time at minimumwage
S4 Part time at minimumwage
Min Median Max
Fig. 2 Burden levels by scenario. Notes: Authors’ own calculations based on burden levels when there is onechild on the case. In all scenarios, the custodial mother’s income is 4.33 times the state median weeklyearnings for female workers in 2018. In scenario 1, the noncustodial father’s income is 4.33 times the statemedian weekly earnings for male workers in 2018. In scenario 2, the noncustodial father’s income is 4.33times half of the state median weekly earnings for male workers in 2018. In scenario 3, the noncustodialfather’s income is 4.33 times 40 h per week at the state minimumwage in 2018. In scenario 4, the noncustodialfather’s income is 4.33 times 20 h per week at the state minimum wage in 2018
Journal of Policy Practice and Research
maximum amount of 32% for the lowest earning fathers compared with 22% forfather’s earning full-time minimum wage. Again, a closer look shows that burdenlevels for the full-time minimum wage scenario were lower than burden levels for thepart-time minimum wage scenario for 13 states. Several different factors could be atplay here for lower burden levels for higher-earning fathers. First, it is possible thatminimum order amounts result in similar order amounts for fathers earning part-timeminimum wage and fathers earning full-time minimum wage. A similar order wouldresult in fathers earning part-time minimum wage having higher burden levels thanfathers earning full-time minimum wage. It is also possible that income imputation orassignment of income at full-time minimum wage to father’s earning part-time mini-mum wage explains some of this discrepancy. For example, the burden level is twice ashigh for the part-time minimum wage scenario than the full-time minimum wagescenario in Kentucky. The online calculator for Kentucky automatically replaces
a) Scenario 1: Median Weekly Earnings
$0
$200
$400
$600
$800
$1,000
$1,200
MA
DC
NH
CT
DE
AK
CA
MD RI
FL
OR
WI
WA
MO
LA
MT
PA NJ
ME
KS
ND
CO
GA IA SD
WV
TX IL
WY
NY
MN
VT
MI
NC
TN
NV
VA
SC
AZ
OH HI
AL ID NE
UT IN OK
KY
NM
AR
MS
b) Scenario 2: Half Median Weekly Earnings
$0
$100
$200
$300
$400
$500
$600
MA
DC
NH NJ
WA
MD RI
MN
DE
PA
ND
SD
AK
GA
CT IA IL
WY
CO
TN
VT
AZ
MI
FL
VA
SC
AL
CA
WI
MO
TX
NC
OR
AR
LA
ME
KS
NY
NE
UT
MT
WV
OK HI
NV
NM ID IN OH
KY
MS
Fig. 3 Monthly order amounts from highest to lowest. a Scenario 1: median weekly earnings. b Scenario 2:half median weekly earnings. c Scenario 3: full-time minimum wage. d Scenario 4: part-time minimum wage.Notes: Authors’ own calculations of order amounts when there is one child on the case
Journal of Policy Practice and Research
income below full-time minimum wage with income equivalent to full-time time wagebefore calculating the support order (Kentucky Child Support Program 2020).
Next, we group states into three categories based on type of low-income deviationand other considerations for low-income payors: whether they have an SSR, whetherthey have a different type of low-income deviation, or whether they have no explicitlow-income deviation. We show the median amount owed for each group (see Fig. 4).One noteworthy observation is that when the father is not low income (scenario 1) andthe father has low pay according to OECD standards (scenario 2), the median orderamount is lower in states with no explicit deviation relative to overall and to states withother types of deviations. In general, however, there is not much variation acrossscenarios 1 and 2 by type of low-income deviation.
There is considerably more variation in the median order amount by type of low-income deviation when the father’s income is full-time minimum wage and when the
d) Scenario 4: Part-time Minimum Wage
$0
$100
$200
$300
MA
KY RI
MN
AR
MD
AK
TN
PA
SC
AL
NM
ME
NV
TX
OK FL
CT
WV
VA
DE
OR ID GA
MT
MS
IN
MO
OH
LA
SD HI
KS
DC
CA
NE
WI
MI
IA CO
NH
NC
WA IL UT
NY NJ
AZ
ND
VT
WY
c) Scenario 3: Full-time Minimum Wage
$0
$100
$200
$300
$400
$500M
A
DC
AZ
SD
WA
MD
CA
MN RI
CO
AK
AR
OR
ME
FL
NY
MI
NJ
TN
VT
CT
NE IL PA
WV
SC
AL
NV HI
TX
NM
MO
MT
OK
UT
VA
KY
LA
KS
ID WI
ND
GA IN MS
DE IA OH
NC
NH
WY
Fig. 3 (continued)
Journal of Policy Practice and Research
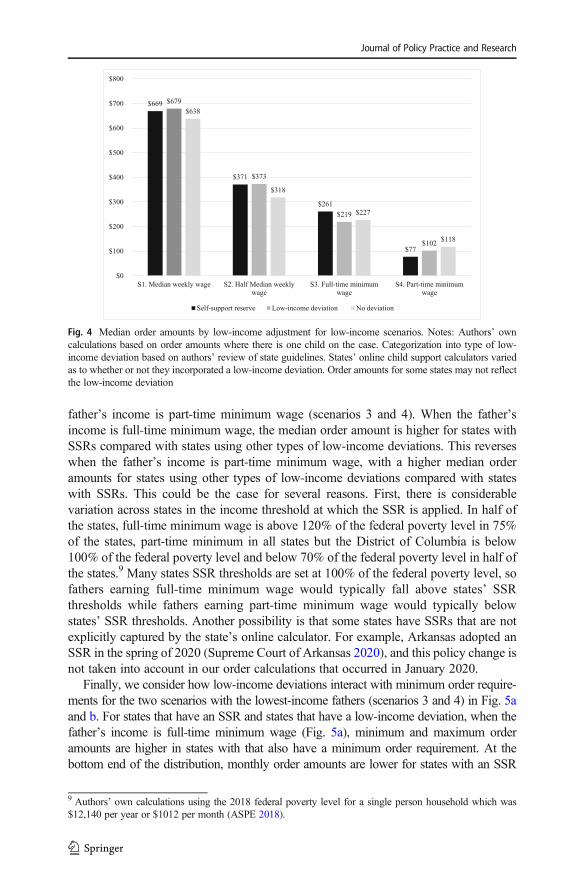
father’s income is part-time minimum wage (scenarios 3 and 4). When the father’sincome is full-time minimum wage, the median order amount is higher for states withSSRs compared with states using other types of low-income deviations. This reverseswhen the father’s income is part-time minimum wage, with a higher median orderamounts for states using other types of low-income deviations compared with stateswith SSRs. This could be the case for several reasons. First, there is considerablevariation across states in the income threshold at which the SSR is applied. In half ofthe states, full-time minimum wage is above 120% of the federal poverty level in 75%of the states, part-time minimum in all states but the District of Columbia is below100% of the federal poverty level and below 70% of the federal poverty level in half ofthe states.9 Many states SSR thresholds are set at 100% of the federal poverty level, sofathers earning full-time minimum wage would typically fall above states’ SSRthresholds while fathers earning part-time minimum wage would typically belowstates’ SSR thresholds. Another possibility is that some states have SSRs that are notexplicitly captured by the state’s online calculator. For example, Arkansas adopted anSSR in the spring of 2020 (Supreme Court of Arkansas 2020), and this policy change isnot taken into account in our order calculations that occurred in January 2020.
Finally, we consider how low-income deviations interact with minimum order require-ments for the two scenarios with the lowest-income fathers (scenarios 3 and 4) in Fig. 5aand b. For states that have an SSR and states that have a low-income deviation, when thefather’s income is full-time minimum wage (Fig. 5a), minimum and maximum orderamounts are higher in states with that also have a minimum order requirement. At thebottom end of the distribution, monthly order amounts are lower for states with an SSR
$669
$371
$261
$77
$679
$373
$219
$102
$638
$318
$227
$118
$0
$100
$200
$300
$400
$500
$600
$700
$800
S1. Median weekly wage S2. Half Median weeklywage
S3. Full-time minimumwage
S4. Part-time minimumwage
Self-support reserve Low-income deviation No deviation
Fig. 4 Median order amounts by low-income adjustment for low-income scenarios. Notes: Authors’ owncalculations based on order amounts where there is one child on the case. Categorization into type of low-income deviation based on authors’ review of state guidelines. States’ online child support calculators variedas to whether or not they incorporated a low-income deviation. Order amounts for some states may not reflectthe low-income deviation
9 Authors’ own calculations using the 2018 federal poverty level for a single person household which was$12,140 per year or $1012 per month (ASPE 2018).
Journal of Policy Practice and Research
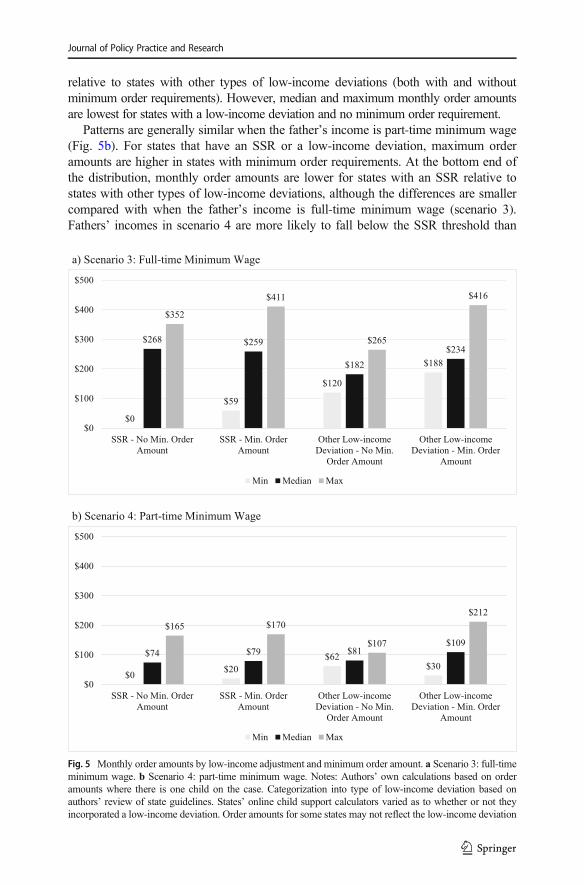
relative to states with other types of low-income deviations (both with and withoutminimum order requirements). However, median and maximum monthly order amountsare lowest for states with a low-income deviation and no minimum order requirement.
Patterns are generally similar when the father’s income is part-time minimum wage(Fig. 5b). For states that have an SSR or a low-income deviation, maximum orderamounts are higher in states with minimum order requirements. At the bottom end ofthe distribution, monthly order amounts are lower for states with an SSR relative tostates with other types of low-income deviations, although the differences are smallercompared with when the father’s income is full-time minimum wage (scenario 3).Fathers’ incomes in scenario 4 are more likely to fall below the SSR threshold than
a) Scenario 3: Full-time Minimum Wage
b) Scenario 4: Part-time Minimum Wage
$0
$59
$120
$188
$268 $259
$182
$234
$352
$411
$265
$416
$0
$100
$200
$300
$400
$500
SSR - No Min. OrderAmount
SSR - Min. OrderAmount
Other Low-incomeDeviation - No Min.
Order Amount
Other Low-incomeDeviation - Min. Order
Amount
Min Median Max
$0$20
$62$30
$74 $79 $81$109
$165 $170
$107
$212
$0
$100
$200
$300
$400
$500
SSR - No Min. OrderAmount
SSR - Min. OrderAmount
Other Low-incomeDeviation - No Min.
Order Amount
Other Low-incomeDeviation - Min. Order
Amount
Min Median Max
Fig. 5 Monthly order amounts by low-income adjustment and minimum order amount. a Scenario 3: full-timeminimum wage. b Scenario 4: part-time minimum wage. Notes: Authors’ own calculations based on orderamounts where there is one child on the case. Categorization into type of low-income deviation based onauthors’ review of state guidelines. States’ online child support calculators varied as to whether or not theyincorporated a low-income deviation. Order amounts for some states may not reflect the low-income deviation
Journal of Policy Practice and Research
fathers’ incomes in scenario 3, and minimum amounts are lowest for states with an SSRand no minimum order requirement.
Discussion
Recognizing that many states’ child support guidelines may lead to unreasonableexpectations about contributions from fathers with limited economic resources, thefederal government provided states with additional direction regarding right-sizingorders for low-income noncustodial parents through the issuance of the Flexibility,Efficiency, and Modernization in Child Support Programs Final Rule in December of2016 (Office of Child Support Enforcement 2016). As states were expected to revisetheir child support guidelines following the issuance of this rule, we undertook thisstudy to provide detailed information on policy expectations about low-income non-custodial parents’ financial contributions to their children across the 50 states.
We began by collecting information from 21 state child support guidelines reviews thatwere conducted between January 2017 and January 2020. From these reviews, we wereable to identify policy changes states that states were considering related to the 2016ruling, and we focused particularly on items salient to low-income obligors including thebasic subsistence needs of the paying parent (such as low-income adjustments or SSRs)and minimum order amounts. We then used online child support calculators to calculateorder amounts for several types of low-income cases for the 50 states and the District ofColumbia. From these order amounts, we identified substantial variation in what isconsidered an appropriate child support obligation for a low-income noncustodial parent,both across the 50 states and across levels of low income (full-time minimum wage, part-time minimum wage, etc.). Taken as a whole, the findings from our study add to currentunderstanding of how child support agencies and lawmakers attempt to address thefinancial needs of low-income children and families through policy and statute. Theyalso illuminate how the different policy tools used by states (such as low-incomedeviations and minimum orders) influence the allocation of resources across low-income households when children live apart from one of their parents.
Basic Subsistence Needs of Low-Income Obligors
The 2016 final rule directed states to take the basic subsistence needs of noncustodialparents with low incomes into account when setting orders. Most often in theirguidelines reviews, states considered implementing or updating an SSR in order toaddress this aspect of the ruling. In our cross-state comparison, SSRs generally resultedin lower order amounts and burden levels for fathers with incomes below the federalpoverty line compared with states without SSRs.
Having an SSR can be seen as consistent with the 2016 ruling, and also as prioritizingthe paying parent having income to meet their own needs. Take, for example, NewHampshire, where the SSR is set at net income of 115% of the federal poverty level (or$1197 per month in 2019).With an SSR, the expected contribution of a noncustodial fatherearning full-time minimum wage would be $59 per month when there are two children onthe case (see Appendix 2 Table 2). Without the SSR, the expected contribution would be$361 per month (calculations not shown). An order of this size would reduce the
Journal of Policy Practice and Research
noncustodial parent’s monthly gross income to about 86% of the federal poverty level for ahousehold size of one.
At the same time, SSRs result in order amounts that are well below the amount ofincome needed to support a child—both in terms of recent estimates of percentage ofincome spent on children (Robb 2019) and by more general accounts, such as thefederal poverty guidelines (Assistant Secretary for Planning and Evaluation 2018).Robb (2019) used USDA data to estimate the percentage of income spent on childrenfor households with up to five children in 2015. He estimated 17% of income for asingle-child household, which is more than the percentage of income expected offathers earning full-time minimum wage in 24 states (see Appendix 2 Table 2).
The 2019 poverty guidelines indicate that $360 per month of income is needed tosupport an additional household member (Assistant Secretary for Planning andEvaluation 2018). In our analysis, for fathers supporting one child and earning full-time minimum wage, only Massachusetts and Washington, D.C., exceeded thisamount. Arizona, a state with a lower SSR threshold, and South Dakota, a state withno explicit low-income deviation, come close (see Fig. 4c). On the other hand, NewHampshire and Wyoming, states with higher SSR thresholds, produced orders wellbelow this amount (see Fig. 4c).10
Having some other type of low-income deviation, such as a sliding scale that reducesthe percentage owed for lower-income fathers, or having no explicit low-incomedeviation, can be seen as prioritizing the financial needs of the child (and the custodialparent). Wisconsin, for example, uses a separate percentage of income guidelines tablefor low-income payers, which results in a more gradual decline in order amounts andburden levels across the different scenarios. The income of the father in scenario 4 ishalf the income of the father in scenario 3, but the percentage of income owed by thefather in scenario 4 is only three percentage point less than the percentage of incomeowed by the father in scenario 3 (see Table 2).
Minimum Order Requirements
Minimum order amounts represent another example of fixed amounts that may result intoo-high orders for some noncustodial parents (Cancian et al. 2011) and thereforepotentially exacerbate their already difficult financial circumstances (Brito 2012).Although states were not explicitly required to consider minimum orders in the finalrule, in our examination of states’ quadrennial reviews, we found that several statesconsidered changes to minimum orders, with some states considering increases tominimum order amounts and others considering decreases.
Our cross-state analysis showed that minimum orders could be regressive (i.e., theycould result in lower-earning fathers owing a higher proportion of their incomes forsupport than slightly higher-earning fathers). Of the states we examined, 37 hadminimum order amounts (see Appendix 2 Table 3), and in 12 of these seven states,
10 In a recent report, Cancian et al. (2019b) examine the potential impacts of adopting an SSR in Wisconsinand draw a similar conclusion that SSRs increase the financial resources of the noncustodial parent but reducethe financial resources available to custodial parents and children. Examining order amounts for noncustodialparents with incomes below 200% of the federal poverty level and assuming full payment of child supportorders, they find that an SSR threshold set at 100% of the federal poverty level would increase noncustodialparent income by $220 and decrease custodial parent and child income by $190.
Journal of Policy Practice and Research
burden levels were the same or higher for fathers earning part-time minimum wagecompared with fathers earning full-time minimum wage. Take, for example, NewHampshire, where monthly income of full-time minimum wage was just above theSSR of $115. Fathers earning full-time minimum wage (scenario 3) and those earningpart-time minimum wage (scenario 3) were both expected to pay about $50 per month(see Appendix 2 Table 2).
Limitations
There are several limitations to our analysis worth noting. First, our review of guide-lines may not include all states that have recently considered and/or implementedchanges to their guidelines in response to the 2016 rule. Our analysis focuses on 21recent reviews, as well as supporting documentation regarding current guidelines andlegislation, that we were able to obtain online. Additionally, states with quadrennialreviews in 2017 were allowed to postpone compliance with the final ruling until theirnext review cycle (i.e., 2021), limiting the number of states to date that have completedquadrennial reviews that consider the 2016 ruling. Finally, states continue to implementchanges to their state guidelines and related policies on an ongoing basis. It is possiblethat some state policies changed after we drafted this analysis.
There are several limitations to our cross-state comparison of low-income orderamounts as well. First and foremost, we only included four possible scenarios and theonly characteristic that varied across the scenarios was the income of the father on the case.We did not consider several aspects of child support policy that are likely to directly orindirectly affect order amounts for low-income noncustodial parents. This includes states’considerations for obligations to resident children, considerations for obligations to othernonresident children, considerations for contributions of medical support and childcare,and considerations for shared-parenting time. These considerations were often discussedin states guidelines reviews but were beyond the scope of the present analysis.
The analysis was also limited to aspects of states’ guidelines and guidelines deviationsincorporated into online calculators and/or available from guidelines reviews or otherguidelines-related information on states’websites. Order amounts may be lower than whatwe reported for some scenarios if a state has an SSR or another type of low-incomeadjustment not accounted for in the online calculator. Order amounts might also be higherthan what we reported if a state designates a minimum support order amount not reflectedin an online calculator or if assigning parents incomes at full-time minimum wage whenactual incomes are below full-time minimum wage is a common practice in a state.
Summary
The Flexibility, efficiency, and modernization of child support enforcement programs(2016) final rule directed states to set support orders based on a noncustodial parent’sability to pay and considering his or her basic subsistence needs, while leaving stateswith considerable discretion in how to implement this directive and with little guidanceon how to balance the needs of low-income non-custodial parents against the needs ofcustodial parents and their children when income is not enough to meet the needs oftwo households. Our review of states’ guidelines reviews and order amounts for low-income payors show a mixture of views on this balance. For example, some states
Journal of Policy Practice and Research
considered increasing SSR thresholds, while other states considered adopting a low-income schedule in place of an SSR; some states considered increasing minimum orderrequirements while other states considered eliminating them.
In states with more generous SSR thresholds, and particularly those withouta minimum order requirement, the balance shifts towards the needs of thenoncustodial parent rather than the needs of the child. In states that allowjudicial guidelines deviations for low-income parents but without deviationsexplicated in their guidelines, such as Georgia, the balance shifts towards theneeds of the child rather than the needs of the noncustodial parent. Other statesfall in the middle. In Wisconsin, for example, the graduated percentage-of-income scale places a larger burden on low-income noncustodial parents thanan SSR approach, but also has the potential for a substantial financial contri-bution to the child (if the order is paid in full).
Striking the right balance between the needs of the paying parent and theneeds of the child has become even more salient with the recent economicdownturn, which has highlighted systematic inequalities that particularly affectfamilies served by the child support program, including single mothers andfamilies living in poverty. Given unprecedented rates of unemployment amongless-educated and precariously employed workers, and the absence of guaran-teed child support payments for children (Cancian and Meyer 2018), it is moreimportant than ever that child support orders work for paying parents but alsomeet the needs of children. Our findings suggest that if a state is trying tomaximize noncustodial parent income, then generous SSRs and no minimumorder amount can help meet this goal. If a state is trying to maximize thefinancial contribution to the child, a more graduated adjustment in orderamounts for low-income noncustodial parents may be preferable.
Acknowledgments The authors wish to thank Peter Christenson for his data collection efforts and carefulattention to detail and Daniel Meyer and Emma Casper for their feedback and guidance in the development ofthis research.
Funding The research reported in this paper was supported by the Child Support Research Agreementbetween the Wisconsin Department of Children and Families and the Institute for Research on Poverty at theUniversity of Wisconsin–Madison.
Data Availability All data used in this paper draw from publicly available data. Content analysis of childsupport documentation draws from the publicly available sources listed in Appendix 1. We drew our incomedata on our hypothetical cases from the Bureau of Labor Statistics and we drew information about stateminimum wage rates from the U.S. Department of Labor (2019).
Compliance with Ethical Standards
Conflicts of Interest The authors declare that they have no conflict of interest.
Disclaimer The research reported in this article was supported by the Child Support Policy ResearchAgreement between the Wisconsin Department of Children and Families and the Institute for Research onPoverty at the University of Wisconsin-Madison. The findings and conclusions in this publication are those ofthe authors and should not be construed to represent any official USDA or US government determination orpolicy or views of the sponsoring institutions.
Journal of Policy Practice and Research
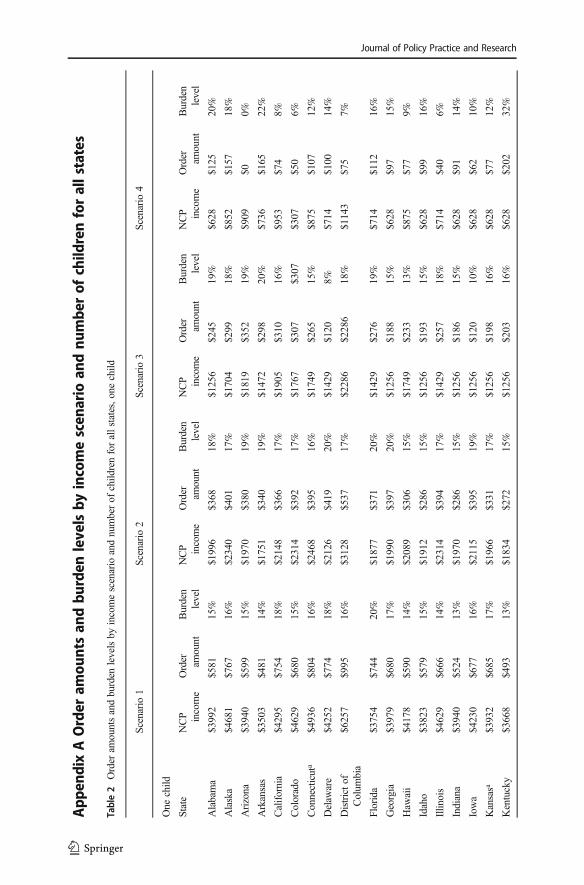
Table2
Order
amountsandburden
levelsby
incomescenario
andnumberof
child
renforallstates,o
nechild
Scenario1
Scenario
2Scenario3
Scenario
4
One
child
State
NCP income
Order amount
Burden
level
NCP income
Order amount
Burden
level
NCP income
Order amount
Burden
level
NCP income
Order amount
Burden
level
Alabama
$3992
$581
15%
$1996
$368
18%
$1256
$245
19%
$628
$125
20%
Alaska
$4681
$767
16%
$2340
$401
17%
$1704
$299
18%
$852
$157
18%
Arizona
$3940
$599
15%
$1970
$380
19%
$1819
$352
19%
$909
$00%
Arkansas
$3503
$481
14%
$1751
$340
19%
$1472
$298
20%
$736
$165
22%
California
$4295
$754
18%
$2148
$366
17%
$1905
$310
16%
$953
$74
8%
Colorado
$4629
$680
15%
$2314
$392
17%
$1767
$307
$307
$307
$50
6%
Connecticut
a$4936
$804
16%
$2468
$395
16%
$1749
$265
15%
$875
$107
12%
Delaw
are
$4252
$774
18%
$2126
$419
20%
$1429
$120
8%$714
$100
14%
Districtof
Colum
bia
$6257
$995
16%
$3128
$537
17%
$2286
$2286
18%
$1143
$75
7%
Florida
$3754
$744
20%
$1877
$371
20%
$1429
$276
19%
$714
$112
16%
Georgia
$3979
$680
17%
$1990
$397
20%
$1256
$188
15%
$628
$97
15%
Haw
aii
$4178
$590
14%
$2089
$306
15%
$1749
$233
13%
$875
$77
9%
Idaho
$3823
$579
15%
$1912
$286
15%
$1256
$193
15%
$628
$99
16%
Illin
ois
$4629
$666
14%
$2314
$394
17%
$1429
$257
18%
$714
$40
6%
Indiana
$3940
$524
13%
$1970
$286
15%
$1256
$186
15%
$628
$91
14%
Iowa
$4230
$677
16%
$2115
$395
19%
$1256
$120
10%
$628
$62
10%
Kansasa
$3932
$685
17%
$1966
$331
17%
$1256
$198
16%
$628
$77
12%
Kentucky
$3668
$493
13%
$1834
$272
15%
$1256
$203
16%
$628
$202
32%
App
endixAOrder
amou
ntsan
dbu
rden
levelsby
incomescen
ario
andnu
mbe
rof
child
renforallstates
Journal of Policy Practice and Research
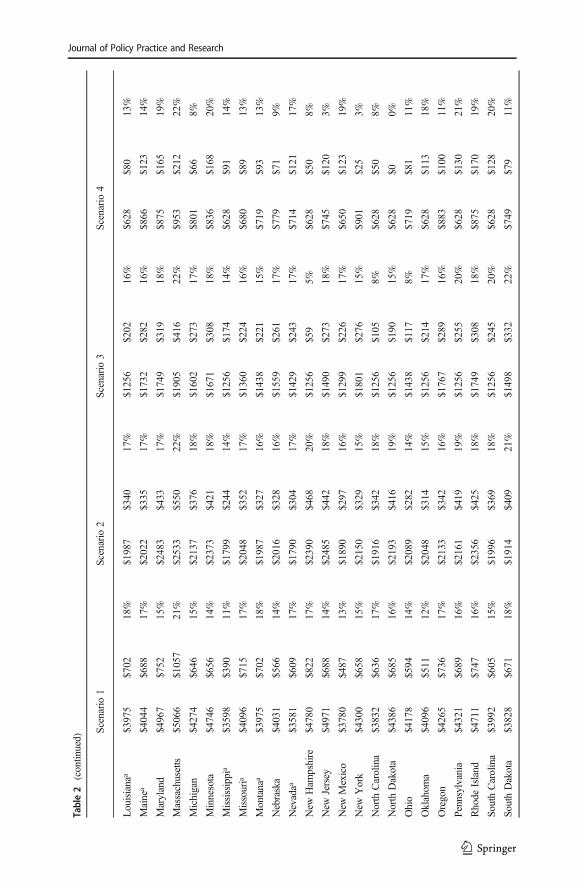
Table2
(contin
ued)
Scenario1
Scenario
2Scenario3
Scenario
4
Louisiana
a$3975
$702
18%
$1987
$340
17%
$1256
$202
16%
$628
$80
13%
Maine
a$4044
$688
17%
$2022
$335
17%
$1732
$282
16%
$866
$123
14%
Maryland
$4967
$752
15%
$2483
$433
17%
$1749
$319
18%
$875
$165
19%
Massachusetts
$5066
$1057
21%
$2533
$550
22%
$1905
$416
22%
$953
$212
22%
Michigan
$4274
$646
15%
$2137
$376
18%
$1602
$273
17%
$801
$66
8%
Minnesota
$4746
$656
14%
$2373
$421
18%
$1671
$308
18%
$836
$168
20%
Mississippi
a$3598
$390
11%
$1799
$244
14%
$1256
$174
14%
$628
$91
14%
Missouria
$4096
$715
17%
$2048
$352
17%
$1360
$224
16%
$680
$89
13%
Montana
a$3975
$702
18%
$1987
$327
16%
$1438
$221
15%
$719
$93
13%
Nebraska
$4031
$566
14%
$2016
$328
16%
$1559
$261
17%
$779
$71
9%
Nevadaa
$3581
$609
17%
$1790
$304
17%
$1429
$243
17%
$714
$121
17%
New
Ham
pshire
$4780
$822
17%
$2390
$468
20%
$1256
$59
5%$628
$50
8%
New
Jersey
$4971
$688
14%
$2485
$442
18%
$1490
$273
18%
$745
$120
3%
New
Mexico
$3780
$487
13%
$1890
$297
16%
$1299
$226
17%
$650
$123
19%
New
York
$4300
$658
15%
$2150
$329
15%
$1801
$276
15%
$901
$25
3%
North
Carolina
$3832
$636
17%
$1916
$342
18%
$1256
$105
8%$628
$50
8%
North
Dakota
$4386
$685
16%
$2193
$416
19%
$1256
$190
15%
$628
$00%
Ohio
$4178
$594
14%
$2089
$282
14%
$1438
$117
8%$719
$81
11%
Oklahom
a$4096
$511
12%
$2048
$314
15%
$1256
$214
17%
$628
$113
18%
Oregon
$4265
$736
17%
$2133
$342
16%
$1767
$289
16%
$883
$100
11%
Pennsylvania
$4321
$689
16%
$2161
$419
19%
$1256
$255
20%
$628
$130
21%
Rhode
Island
$4711
$747
16%
$2356
$425
18%
$1749
$308
18%
$875
$170
19%
SouthCarolina
$3992
$605
15%
$1996
$369
18%
$1256
$245
20%
$628
$128
20%
SouthDakota
$3828
$671
18%
$1914
$409
21%
$1498
$332
22%
$749
$79
11%
Journal of Policy Practice and Research
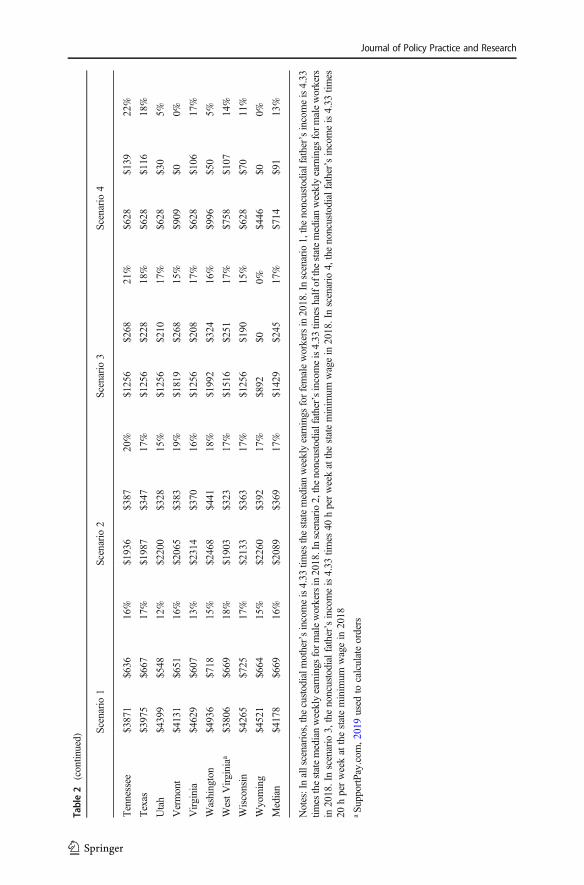
Table2
(contin
ued)
Scenario1
Scenario
2Scenario3
Scenario
4
Tennessee
$3871
$636
16%
$1936
$387
20%
$1256
$268
21%
$628
$139
22%
Texas
$3975
$667
17%
$1987
$347
17%
$1256
$228
18%
$628
$116
18%
Utah
$4399
$548
12%
$2200
$328
15%
$1256
$210
17%
$628
$30
5%
Vermont
$4131
$651
16%
$2065
$383
19%
$1819
$268
15%
$909
$00%
Virginia
$4629
$607
13%
$2314
$370
16%
$1256
$208
17%
$628
$106
17%
Washington
$4936
$718
15%
$2468
$441
18%
$1992
$324
16%
$996
$50
5%
WestVirginiaa
$3806
$669
18%
$1903
$323
17%
$1516
$251
17%
$758
$107
14%
Wisconsin
$4265
$725
17%
$2133
$363
17%
$1256
$190
15%
$628
$70
11%
Wyoming
$4521
$664
15%
$2260
$392
17%
$892
$00%
$446
$00%
Median
$4178
$669
16%
$2089
$369
17%
$1429
$245
17%
$714
$91
13%
Notes:Inallscenarios,the
custodialm
other’sincomeis4.33
times
thestatemedianweeklyearnings
forfemaleworkersin2018.Inscenario1,thenoncustodialfather’sincomeis4.33
times
thestatemedianweeklyearnings
form
aleworkersin2018.Inscenario2,thenoncustodialfather’sincomeis4.33
times
halfof
thestatemedianweeklyearnings
form
aleworkers
in2018.Inscenario
3,thenoncustodialfather’sincomeis4.33
times
40hperweekatthestateminim
umwagein
2018.Inscenario
4,thenoncustodialfather’sincomeis4.33
times
20hperweekatthestateminim
umwagein
2018
aSu
pportPay.com
,2019used
tocalculateorders
Journal of Policy Practice and Research
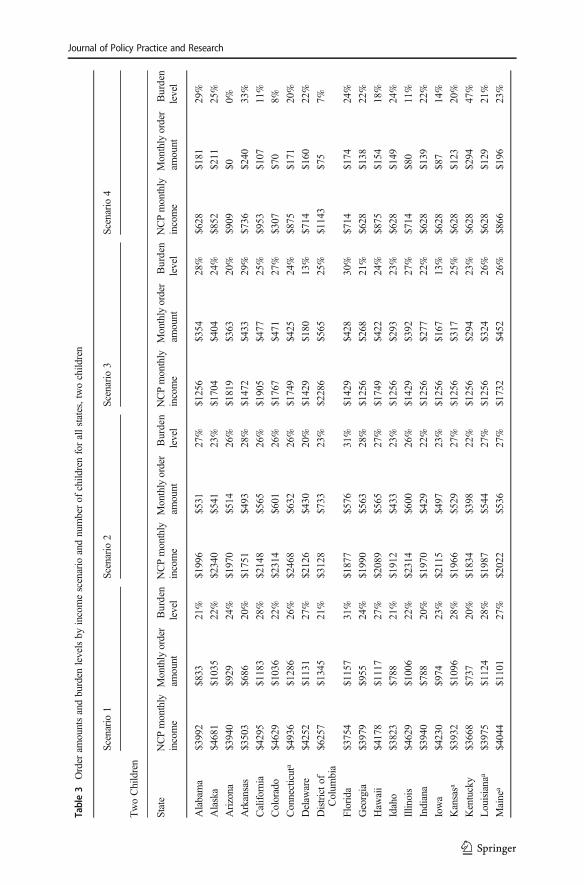
Table3
Order
amountsandburden
levelsby
incomescenario
andnumberof
child
renforallstates,twochildren
Scenario
1Scenario
2Scenario
3Scenario
4
TwoChildren
State
NCPmonthly
income
Monthlyorder
amount
Burden
level
NCPmonthly
income
Monthlyorder
amount
Burden
level
NCPmonthly
income
Monthlyorder
amount
Burden
level
NCPmonthly
income
Monthlyorder
amount
Burden
level
Alabama
$3992
$833
21%
$1996
$531
27%
$1256
$354
28%
$628
$181
29%
Alaska
$4681
$1035
22%
$2340
$541
23%
$1704
$404
24%
$852
$211
25%
Arizona
$3940
$929
24%
$1970
$514
26%
$1819
$363
20%
$909
$00%
Arkansas
$3503
$686
20%
$1751
$493
28%
$1472
$433
29%
$736
$240
33%
California
$4295
$1183
28%
$2148
$565
26%
$1905
$477
25%
$953
$107
11%
Colorado
$4629
$1036
22%
$2314
$601
26%
$1767
$471
27%
$307
$70
8%
Connecticut
a$4936
$1286
26%
$2468
$632
26%
$1749
$425
24%
$875
$171
20%
Delaw
are
$4252
$1131
27%
$2126
$430
20%
$1429
$180
13%
$714
$160
22%
Districtof
Colum
bia
$6257
$1345
21%
$3128
$733
23%
$2286
$565
25%
$1143
$75
7%
Florida
$3754
$1157
31%
$1877
$576
31%
$1429
$428
30%
$714
$174
24%
Georgia
$3979
$955
24%
$1990
$563
28%
$1256
$268
21%
$628
$138
22%
Haw
aii
$4178
$1117
27%
$2089
$565
27%
$1749
$422
24%
$875
$154
18%
Idaho
$3823
$788
21%
$1912
$433
23%
$1256
$293
23%
$628
$149
24%
Illin
ois
$4629
$1006
22%
$2314
$600
26%
$1429
$392
27%
$714
$80
11%
Indiana
$3940
$788
20%
$1970
$429
22%
$1256
$277
22%
$628
$139
22%
Iowa
$4230
$974
23%
$2115
$497
23%
$1256
$167
13%
$628
$87
14%
Kansasa
$3932
$1096
28%
$1966
$529
27%
$1256
$317
25%
$628
$123
20%
Kentucky
$3668
$737
20%
$1834
$398
22%
$1256
$294
23%
$628
$294
47%
Louisiana
a$3975
$1124
28%
$1987
$544
27%
$1256
$324
26%
$628
$129
21%
Maine
a$4044
$1101
27%
$2022
$536
27%
$1732
$452
26%
$866
$196
23%
Journal of Policy Practice and Research
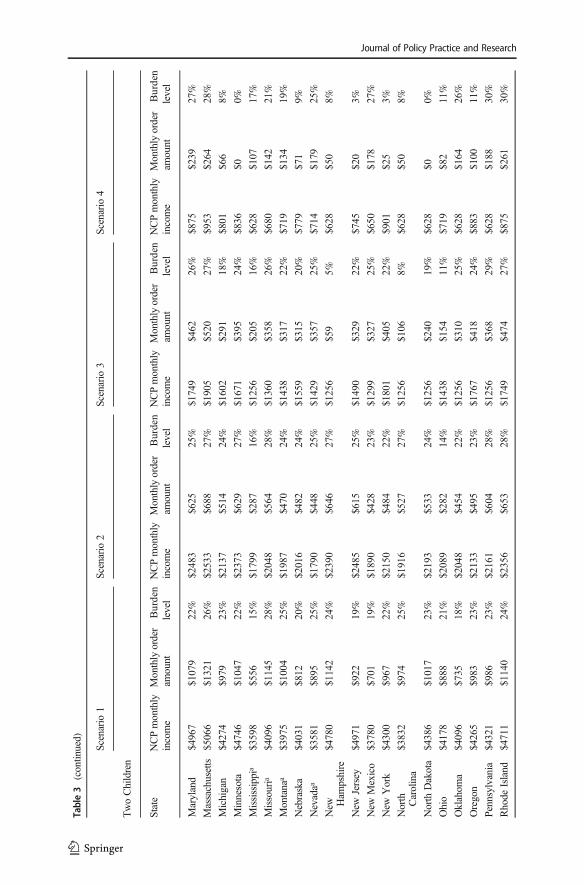
Table3
(contin
ued)
Scenario
1Scenario
2Scenario
3Scenario
4
TwoChildren
State
NCPmonthly
income
Monthlyorder
amount
Burden
level
NCPmonthly
income
Monthlyorder
amount
Burden
level
NCPmonthly
income
Monthlyorder
amount
Burden
level
NCPmonthly
income
Monthlyorder
amount
Burden
level
Maryland
$4967
$1079
22%
$2483
$625
25%
$1749
$462
26%
$875
$239
27%
Massachusetts
$5066
$1321
26%
$2533
$688
27%
$1905
$520
27%
$953
$264
28%
Michigan
$4274
$979
23%
$2137
$514
24%
$1602
$291
18%
$801
$66
8%
Minnesota
$4746
$1047
22%
$2373
$629
27%
$1671
$395
24%
$836
$00%
Mississippi
a$3598
$556
15%
$1799
$287
16%
$1256
$205
16%
$628
$107
17%
Missouria
$4096
$1145
28%
$2048
$564
28%
$1360
$358
26%
$680
$142
21%
Montana
a$3975
$1004
25%
$1987
$470
24%
$1438
$317
22%
$719
$134
19%
Nebraska
$4031
$812
20%
$2016
$482
24%
$1559
$315
20%
$779
$71
9%
Nevadaa
$3581
$895
25%
$1790
$448
25%
$1429
$357
25%
$714
$179
25%
New H
ampshire
$4780
$1142
24%
$2390
$646
27%
$1256
$59
5%$628
$50
8%
New
Jersey
$4971
$922
19%
$2485
$615
25%
$1490
$329
22%
$745
$20
3%
New
Mexico
$3780
$701
19%
$1890
$428
23%
$1299
$327
25%
$650
$178
27%
New
York
$4300
$967
22%
$2150
$484
22%
$1801
$405
22%
$901
$25
3%
North Carolina
$3832
$974
25%
$1916
$527
27%
$1256
$106
8%$628
$50
8%
North
Dakota
$4386
$1017
23%
$2193
$533
24%
$1256
$240
19%
$628
$00%
Ohio
$4178
$888
21%
$2089
$282
14%
$1438
$154
11%
$719
$82
11%
Oklahom
a$4096
$735
18%
$2048
$454
22%
$1256
$310
25%
$628
$164
26%
Oregon
$4265
$983
23%
$2133
$495
23%
$1767
$418
24%
$883
$100
11%
Pennsylvania
$4321
$986
23%
$2161
$604
28%
$1256
$368
29%
$628
$188
30%
Rhode
Island
$4711
$1140
24%
$2356
$653
28%
$1749
$474
27%
$875
$261
30%
Journal of Policy Practice and Research
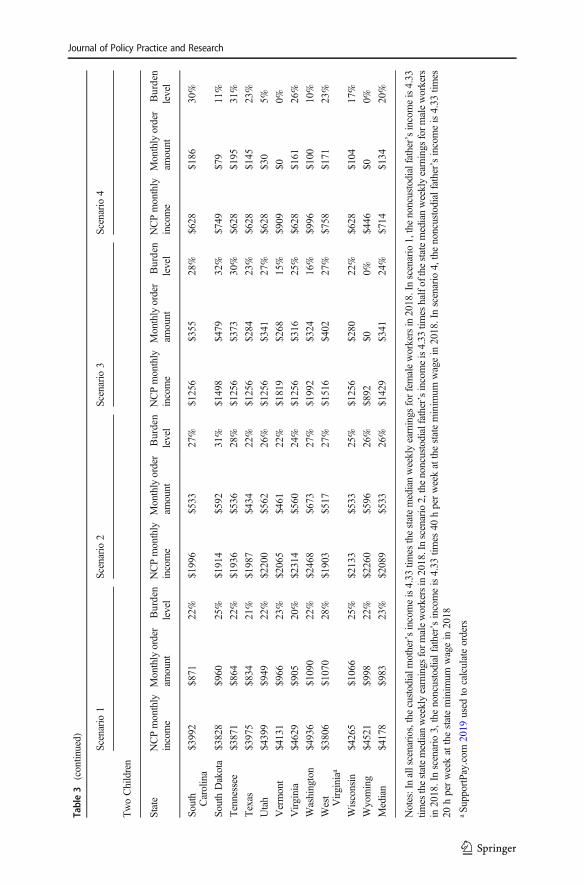
Table3
(contin
ued)
Scenario
1Scenario
2Scenario
3Scenario
4
TwoChildren
State
NCPmonthly
income
Monthlyorder
amount
Burden
level
NCPmonthly
income
Monthlyorder
amount
Burden
level
NCPmonthly
income
Monthlyorder
amount
Burden
level
NCPmonthly
income
Monthlyorder
amount
Burden
level
South
Carolina
$3992
$871
22%
$1996
$533
27%
$1256
$355
28%
$628
$186
30%
SouthDakota
$3828
$960
25%
$1914
$592
31%
$1498
$479
32%
$749
$79
11%
Tennessee
$3871
$864
22%
$1936
$536
28%
$1256
$373
30%
$628
$195
31%
Texas
$3975
$834
21%
$1987
$434
22%
$1256
$284
23%
$628
$145
23%
Utah
$4399
$949
22%
$2200
$562
26%
$1256
$341
27%
$628
$30
5%
Vermont
$4131
$966
23%
$2065
$461
22%
$1819
$268
15%
$909
$00%
Virginia
$4629
$905
20%
$2314
$560
24%
$1256
$316
25%
$628
$161
26%
Washington
$4936
$1090
22%
$2468
$673
27%
$1992
$324
16%
$996
$100
10%
West
Virginiaa
$3806
$1070
28%
$1903
$517
27%
$1516
$402
27%
$758
$171
23%
Wisconsin
$4265
$1066
25%
$2133
$533
25%
$1256
$280
22%
$628
$104
17%
Wyoming
$4521
$998
22%
$2260
$596
26%
$892
$00%
$446
$00%
Median
$4178
$983
23%
$2089
$533
26%
$1429
$341
24%
$714
$134
20%
Notes:Inallscenarios,the
custodialm
other’sincomeis4.33
times
thestatemedianweeklyearnings
forfemaleworkersin2018.Inscenario1,thenoncustodialfather’sincomeis4.33
times
thestatemedianweeklyearnings
form
aleworkersin2018.Inscenario2,thenoncustodialfather’sincomeis4.33
times
halfof
thestatemedianweeklyearnings
form
aleworkers
in2018.Inscenario
3,thenoncustodialfather’sincomeis4.33
times
40hperweekatthestateminim
umwagein
2018.Inscenario
4,thenoncustodialfather’sincomeis4.33
times
20hperweekatthestateminim
umwagein
2018
aSu
pportPay.com
2019
used
tocalculateorders
Journal of Policy Practice and Research
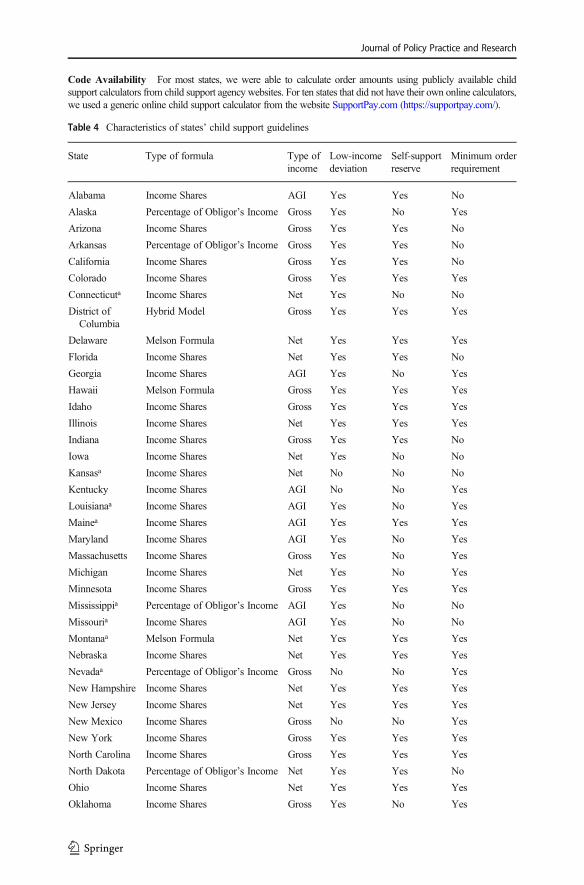
Code Availability For most states, we were able to calculate order amounts using publicly available childsupport calculators from child support agency websites. For ten states that did not have their own online calculators,we used a generic online child support calculator from the website SupportPay.com (https://supportpay.com/).
Table 4 Characteristics of states’ child support guidelines
State Type of formula Type ofincome
Low-incomedeviation
Self-supportreserve
Minimum orderrequirement
Alabama Income Shares AGI Yes Yes No
Alaska Percentage of Obligor’s Income Gross Yes No Yes
Arizona Income Shares Gross Yes Yes No
Arkansas Percentage of Obligor’s Income Gross Yes Yes No
California Income Shares Gross Yes Yes No
Colorado Income Shares Gross Yes Yes Yes
Connecticuta Income Shares Net Yes No No
District ofColumbia
Hybrid Model Gross Yes Yes Yes
Delaware Melson Formula Net Yes Yes Yes
Florida Income Shares Net Yes Yes No
Georgia Income Shares AGI Yes No Yes
Hawaii Melson Formula Gross Yes Yes Yes
Idaho Income Shares Gross Yes Yes Yes
Illinois Income Shares Net Yes Yes Yes
Indiana Income Shares Gross Yes Yes No
Iowa Income Shares Net Yes No No
Kansasa Income Shares Net No No No
Kentucky Income Shares AGI No No Yes
Louisianaa Income Shares AGI Yes No Yes
Mainea Income Shares AGI Yes Yes Yes
Maryland Income Shares AGI Yes No Yes
Massachusetts Income Shares Gross Yes No Yes
Michigan Income Shares Net Yes No Yes
Minnesota Income Shares Gross Yes Yes Yes
Mississippia Percentage of Obligor’s Income AGI Yes No No
Missouria Income Shares AGI Yes No No
Montanaa Melson Formula Net Yes Yes Yes
Nebraska Income Shares Net Yes Yes Yes
Nevadaa Percentage of Obligor’s Income Gross No No Yes
New Hampshire Income Shares Net Yes Yes Yes
New Jersey Income Shares Net Yes Yes Yes
New Mexico Income Shares Gross No No Yes
New York Income Shares Gross Yes Yes Yes
North Carolina Income Shares Gross Yes Yes Yes
North Dakota Percentage of Obligor’s Income Net Yes Yes No
Ohio Income Shares Net Yes Yes Yes
Oklahoma Income Shares Gross Yes No Yes
Journal of Policy Practice and Research
Appendix B Characteristics of states’ child support guidelines
References
Assistant Secretary for Planning and Evaluation. (2018). 2018 poverty guidelines. Washington: U.S.Department of Health and Human Services, Office of the Assistant Secretary for Planning andEvaluation Retrieved June 4, 2019 from https://aspe.hhs.gov/2018-poverty-guidelines.
Bartfeld, J., & Meyer, D. R. (2003). Child support compliance among discretionary and nondiscretionaryobligors. Social Service Review, 77(3), 347–372.
Berger, L. M., Cancian, M., & Meyer, D. R. (2012). Maternal re-partnering and new-partner fertility:associations with nonresident father investments in children. Children and Youth Services Review,34(2), 426–436.
Berger, L. M., Cancian, M., Guarin, A., & Meyer, D. R. (2019). Do low-income noncustodial fathers tradefamilies? Economic contributions to children in multiple families. Social Service Review, 93(2), 183–217.
Bureau of Labor Statistics. (2019). Median weekly earnings, full-time wage and salary workers. Series.LEU0252881801 -LEU0252881856 and LEU0252882701 - LEU0252882756. In: Weekly and hourlyearnings data from the Current Population Survey. Washington: U.S. Department of Labor, Bureau ofLabor Statistics. Retrieved from: https://data.bls.gov/cgibin/srgate.
Brito, T. L. (2012). Fathers behind bars: Rethinking child support policy toward low-income noncustodialfathers and their families. Journal of Gender, Race and Justice, 15, 617.
Cancian, M., & Costanzo, M. A. (2019). Comparing income-shares and percentage-of-income child supportguidelines. Children and Youth Services Review, 96, 451–462.
Table 4 (continued)
State Type of formula Type ofincome
Low-incomedeviation
Self-supportreserve
Minimum orderrequirement
Oregon Income Shares AGI Yes Yes Yes
Pennsylvania Income Shares Net Yes Yes Yes
Rhode Island Income Shares AGI Yes Yes Yes
South Carolina Income Shares Gross Yes No Yes
South Dakota Income Shares Net No No Yes
Tennessee Income Shares AGI Yes No Yes
Texas Percentage of Obligor’s Income Net No No Yes
Utah Income Shares AGI Yes No Yes
Vermont Income Shares Net Yes Yes No
Virginia Income Shares Gross Yes No Yes
Washington Income Shares Net Yes Yes Yes
West Virginiaa Income Shares AGI Yes Yes Yes
Wisconsin Percentage of Obligor’s Income Gross Yes No No
Wyoming Income Shares Net Yes Yes No
Notes: Authors’ own categorizations based on information provided on states’ child support websites, onlinecalculators, guidelines reviews, and child support statute. These categorizations are intended to broadly capturethe characteristics of a state’s child support system, but we note that these characteristics may well vary withspecific circumstances of cases
Journal of Policy Practice and Research
Cancian, M., & Meyer, D. R. (2004). Fathers of children receiving welfare: can they provide more childsupport? Social Service Review, 78(2), 179–206.
Cancian, M., & Meyer, D. R. (2018). Reforming policy for single-parent families to reduce child poverty.RSF: The Russell Sage Foundation Journal of the Social Sciences, 4(2), 91–112.
Cancian, M., Meyer, D. R., & Han, E. (2011). Child support: responsible fatherhood and the quid pro quo. TheAnnals of the American Academy of Political and Social Science, 635, 140–162.
Cancian, M., Heinrich, C. J., & Chung, Y. (2013). Discouraging disadvantaged fathers’ employment: anunintended consequence of policies designed to support families. Journal of Policy Analysis andManagement, 32(4), 758–784.
Cancian, M., Cook, S., & Meyer, D.R. (2019a). Child support payments, income imputation, and defaultorders. Report prepared for Wisconsin Department of Children and Families. Madison: Institute forResearch on Poverty.
Cancian, M., Costanzo, M., Guarin, A., Hodges, L., & Meyer, D. R. (2019b). Potential effects of a self-support reserve in Wisconsin. Report prepared for the Wisconsin Department of Children and Families.Madison: Institute for Research on Poverty.
Cancian, M., Meyer, D. R., & Wood, R. (2019c). Final impact findings from the Child Support NoncustodialParent Employment Demonstration (CSPED). Madison: Institute for Research on Poverty, University ofWisconsin–Madison.
Chen, Y., & Meyer, D. R. (2017). Does joint legal custody increase child support for nonmarital children?Children and Youth Services Review, 79, 547–557.
Child Support Enforcement Amendment of 1984, Pub. L. No. 98–378 (1984).Committee on Ways and Means, U.S. House of Representatives. (2018). 2018 green book: Background
material and data on the programs within the jurisdiction of the Committee on Ways and Means (24thed.). Washington: U.S. Government Printing Office.
Demyan, N. & Passarella, L. (2018). Actual earnings and payment outcomes among obligors with imputedincome. University of Maryland School of Social Work, Ruth Young Center for Families & Children,2018. Retrieved from September 9, 2019 from https://familywelfare.umaryland.edu/reports1/guidelines_imputedincome.pdf
Edin, K., & Nelson, T. (2013). Doing the best I can: fatherhood in the inner city. Berkeley: University ofCalifornia Press.
Family Support Act of 1988, (1988) Pub. L. No. 100–485, 102 Stat. 2343.Fleming, J.. (2017). Imputed income and default practices: the state directors' survey of state practices prior
to the 2016 final rule. Retrieved June 4, 2019 from http://www.ncsea.org/documents/Imputed-Income-and-Default-Practices_CSQ-April-2017.pdf.
Flexibility, efficiency, and modernization of child support enforcement programs, (2016) final rule, 45 C.F.R.§ 301–305, 307.
Freeman, R., & Waldfogel, J. (2001). Dunning delinquent dads: the effects of child support enforcementpolicy on child support receipt by never married women. The Journal of Human Resources, 36(2), 207–225.
Garfinkel, I., McLanahan, S., & Hanson, T. (1998). A patchwork portrait of non-resident fathers. In I.Garfinkel, S. McLanahan, D. Meyer, & J. Seltzer (Eds.), Fathers under fire: the revolution in childsupport enforcement (pp. 31–60). New York: Russell Sage.
Goldberg, J. S. (2015). Co-parenting and nonresident fathers' monetary contributions to their children. Journalof Marriage and Family, 77(3), 612–627.
Grall, T. (2020). Custodial mothers and fathers and their child support: 2017, Current population reports,P60–269. Washington: U.S. Census Bureau, U.S. Department of Commerce, Economic and StatisticsAdministration.
Ha, Y., Cancian, M., &Meyer, D. R. (2010). Unchanging child support orders in the face of unstable earnings.Journal of Policy Analysis and Management, 29(4), 799–820.
Ha, Y., Cancian, M., & Meyer, D. R. (2018). Child support and income inequality. Poverty & Public Policy,10(2), 147–158.
Heinrich, C., Burkhardt, B., & Shager, H. (2011). Reducing child support debt and its consequences: canforgiveness benefit all? Journal of Policy Analysis and Management, 30(4), 755–774.
Hodges, L., Meyer, D.R., Cancian, M. (2020). What happens when the amount of child support due is aburden? Revisiting the relationship between child support Orders and Child Support Payments.Forthcoming in Social Service Review.
Hsieh, H. F., & Shannon, S. E. (2005). Three approaches to qualitative content analysis. Qualitative HealthResearch, 15(9), 1277–1288.
Journal of Policy Practice and Research
Huang, C. C., Mincy, R. B., & Garfinkel, I. (2005). Child support obligations and low-income fathers. Journalof Marriage and Family, 67(5), 1213–1225.
Kentucky Child Support Program. (2020). Estimate Shild support. Kentucky Child Support Customer ServiceWebsite. Retrieved June 24, 2020 from https://csws.chfs.ky.gov/csws/General/Landing.aspx
Manning, W. D., & Smock, P. J. (2000). ‘Swapping’ families: serial parenting and economic support forchildren. Journal of Marriage and Family, 62(1), 111–122.
McCann, M. (2019). Child support guidelines models by state. National Council of State Legislatures.Retrieved June 4, 2019 from http://www.ncsl.org/research/human-services/guideline-models-by-state.aspx.
Meyer, D. R., & Hu, M. C. (1999). A note on the antipoverty effectiveness of child support among mother-only families. Journal of Human Resources, 34, 225–234.
Meyer, D. R., Ha, Y., & Hu, M. C. (2008). Do high child support orders discourage child support payments?Social Service Review, 82(1), 93–118.
Miller, C., & Knox, V. (2001). The challenge of helping low-income fathers support their children: finallessons from Parents' Fair Share. New York: MDRC.
Miller, D., & Mincy, R. (2012). Falling further behind? Child support arrears and fathers’ labor forceparticipation. Social Service Review, 86(4), 604–635.
Mincy, R. B., & Sorensen, E. J. (1998). Deadbeats and turnips in child support reform. Journal of PolicyAnalysis and Management: The Journal of the Association for Public Policy Analysis and Management,17(1), 44–51.
National Academies of Sciences, Engineering, and Medicine. (2019). A roadmap to reducing child poverty.National Academies Press.
Nepomnyaschy, L., & Garfinkel, I. (2010). Child support enforcement and fathers’ contributions to theirnonmarital children. Social Service Review, 84(3), 341–380.
Office of Child Support Enforcement. (2017a). Final rule summary fact sheet. Retrieved June 4, 2019 fromhttps://www.acf.hhs.gov/sites/default/files/programs/css/fem_final_rule_summary.pdf
Office of Child Support Enforcement. (2017b). Final rule overview, 2016 Flexibility, Efficiency, andModernization in Child Support Enforcement Programs. Retrieved June 4, 2019 from: https://www.acf.hhs.gov/sites/default/files/programs/css/overview_child_support_final_r ule.pdf.
Office of Child Support Enforcement. (2019). Preliminary report to Congress, FY 2018. Washington : U.S.,Office of Child Support Enforcement, U.S. Department of Health and Human Services Administration forChildren & Families. Retrieved May 2, 2020 from https://www.acf.hhs.gov/sites/default/files/programs/css/fy_2018_preliminary_data_report.pdf.
Organisation for Economic Co-operation and Development. (2019). Wage Levels. Organisation for EconomicCo-operation and Development. Retrieved from https://data.oecd.org/earnwage/wage-levels.htm.
Pirog, M. A., Klotz, M. E., & Byers, K. V. (1998). Interstate comparisons of child support orders using stateguidelines. Family Relations, 47, 289–295.
Robb, C. (2019). Cost of raising children and expenditures on children. Report prepared for the WisconsinDepartment of Children and Families. Madison: Institute for Research on Poverty.
Sariscsany, L., Garfinkel, I., & Nepomnyaschy, L. (2019). Describing and understanding child supporttrajectories. Social Service Review, 93(2), 143–182.
Sinkewicz, M., & Garfinkel, I. (2009). Unwed fathers’ ability to pay child support: new estimates accountingfor multiple-partner fertility. Demography, 46(2), 247–263.
Sorensen, E. (2004). Understanding how child-support arrears reached $18 billion in California. AmericanEconomic Review, 94(2), 312–316.
Sorensen, E., & Oliver, H. (2002). Policy reforms are needed to increase child support from poor fathers.Washington: Urban Institute.
Sorensen, E., & Zibman, C. (2001). Getting to know poor fathers who do not pay child support. Social ServiceReview, 75(3), 420–434.
SupportPay.com (2019). Child Support Calculator. Retrieved June 4, 2019 from https://supportpay.com/resources/child-support-calculator/
Supreme Court of Arkansas. (2020). RE: Implementation of the Revised Administrative Order No. 10.Arkansas Judiciary: Opinions, Court Rules and Administrative Orders/Supreme Court. RetrievedJune 12, 2020 from https://opinions.arcourts.gov/ark/supremecourt/en/item/468402/index.do
Tollestrup, J. (2019). Child support enforcement: program basics. Congressional research service, Library ofCongress. Washington.
U.S. Census Bureau. (2017). Table C3. Living arrangements of children under 18 years and marital status ofparents, by age, sex, race, and Hispanic origin and selected characteristics of the child for all children:
Journal of Policy Practice and Research
2016. America’s Families and Living Arrangements: 2016. Current Population Survey, Annual Socialand Economic Supplement. Washington: U.S. Census Bureau, U.S. Department of Commerce.
U.S. Census Bureau. (2019). Table FM-1. Families by presence of own children under 18: 1950 to present.Current Population Survey, March and Annual Social Economic Supplements, 2019 and earlier.Washington: U.S. Census Bureau, U.S. Department of Commerce.
U.S. Department of Labor (2019). Changes in basic minimum wages in non-farm employment under statelaw: selected years 1968 to 2018. Washington: U.S. Department of Labor, Wage and Hour Division.Retrieved from https://www.dol.gov/whd/state/stateMinWageHis.htm.
Venohr, J. C. (2013). Child support guidelines and guidelines reviews: state differences and common issues.Family Law Quarterly, 47(3), 327–352.
Venohr, J. C. (2016). Differences in state child support guidelines amounts: guidelines models, economicbasis, and other issues. Journal of the American Academy of Matrimonial Law, 29, 377.
Vogel, L. K. (2020a). Barriers to meeting formal child support obligations: noncustodial father perspectives.Children and Youth Services Review, 110, 104764. https://doi.org/10.1016/j.childyouth.2020.104764.
Vogel, L. K. (2020b). Help me help you: identifying and addressing barriers to child support compliance.Children and Youth Services Review, 110, 104763. https://doi.org/10.1016/j.childyouth.2020.104763.
Waller, M. R., & Plotnick, R. (2001). Effective child support policy for low‐income families: Evidence fromstreet level research. Journal of Policy Analysis and Management: The Journal of the Association forPublic Policy Analysis and Management, 20(1), 89–110.
Affiliations
Leslie Hodges1 & Lisa Klein Vogel2
1 Economic Research Service, U.S. Department of Agriculture, Kansas City, MO, USA
2 Institute for Research on Poverty, University of Wisconsin-Madison, Madison, WI, USA
Journal of Policy Practice and Research