Embed Size (px)
Citation preview

High Skills High Wages 2012 - Chapter 1—Tomorrow’s Economy
Page 1
TOMORROW’S ECONOMY
An overview of Washington’s economy for High Skills, High Wages strategic plan
Despite the Great Recession, the transition to an economy based more on information, knowledge and services is continuing. The consequent shift in both the skills generally required and the occupations in demand also have continued.
Technology and globalization driving change
Both the workplace and the outputs of industry have increasing technological components, most often involving information technology. On one hand, workers in a wide range of jobs find themselves required to use computers in the regular course of their work. On the other hand, the outputs increasingly are either products that embody or interact with technologically sophisticated devices, or they are services that are delivered over and/or must interact with information technology. From smart merchandise tags, to smart phones and appliances, to Internet banking and e-commerce, technology is permeating much of the workspace and the product and service markets. Even when a technological product is not overtly an information technology product, information technology is often intimately involved in its manufacture and use. For example, a composite wind turbine blade is probably manufactured using computer controlled machinery and non-destructive testing, and deployed in a device that is computer controlled.
Technology has made possible an extended virtual labor market for many types of services, through off-site or off-shore outsourcing, and virtual organizations and partnerships. This has raised levels of interstate and international competition in services that accompany the globalization of product and capital markets.
Even during the recent recession, employers reported some shortages of job applicants with the specific skills required for their hiring plans. Such shortages can be expected to be more prevalent as recovery strengthens labor markets. Planning and management of the skills, education and training of the labor force must anticipate the challenges that will result from growth in the economy, technology and globalization. Our willingness to invest in educating and training our people will be a major factor in the long-term rate of growth for Washington’s economy. It will also affect the degree of economic inequality among our citizens. Economists believe our economy will continue to generate good jobs. But to adapt to challenges and take advantage of new opportunities, Americans must achieve higher levels of education and training.
High Skills High Wages 2012 - Chapter 1—Tomorrow’s Economy
Page 2
The Slow Economic Recovery
The ‘Great Recession’ that started in December 2007 has been the longest and deepest recession since the Second World War, with the most prolonged recovery. Although the recession officially ended in June of 2009, recovery is still a work in progress. During the Great Recession the national unemployment rate more than doubled, and although it has fallen from a mid-recession high of 10.1 percent, it has only recently dropped below 8 percent.
Real GDP grew at an average rate of 3.3 percent during the first year of the recovery. This rate is slower than other post-war recoveries. However, it is enough growth to stem the tide of rising unemployment that hit a high of 10.1 percent in 2010. The second year of the recovery brought slower GDP growth, with an average rate of 1.6 percent – the unemployment rate was a bit lower as well, at 9.1 percent in mid-2011. Growth remained weak during the recovery’s third year, advancing at an annual average rate of 1.9 percent, and the unemployment rate slowly improved to 7.8 percent by September of 2012.
After a period of job growth between 2004 and 2007 when non-farm payroll employment increased by an average rate of 2.8 percent per year, non-farm employment reached its peak in Washington in February 2008, three months after the national peak in December 2007. Once the Great Recession started, Washington fared about average compared to other states. The only industry sector to expand during the Great Recession was education and health services. Construction fared the worst during this recession and manufacturing, utilities, information and other services fared better during this recession than in the recession in 2001.
Over 18 percent of Washington’s population under age 18 is living below the poverty level.1 The average duration of unemployment benefits rose from 13 weeks in 2009 to nearly 21 weeks in 2010 before falling to around 17 weeks in 2012. The rate of underemployment (part-time workers who desired full-time work) was 6.7 percent.2
Washington added 58,500 jobs during the 12 months ending in September 2012. Over that year, Education and Health Services added 1,500 jobs, Professional and Business Services added 11,100 jobs. The leisure and hospitality industries added 9,800 jobs. Manufacturing employment increased by 11,700 jobs, with 7,800 of those jobs in aerospace product parts and manufacturing. The retail and wholesale trade sectors added 4,500 and 3,600 jobs respectively, Construction added 4,700 jobs.
1 U.S. Census Bureau 2011 American Community Survey, Table S1701: Poverty Status In The Past 12 Months. 2 BLS Local Area Statistics Alternative Measures of Labor Underutilization for States 2011-2012. www.bls.gov/lau/stalt.htm

High Skills High Wages 2012 - Chapter 1—Tomorrow’s Economy
Page 3
Over-the-Year Non-Farm Employment Gains by Industry Sector: September 2011 to September 2012
Industry Sector Seasonally Adjusted Gains
Total Non-Farm 58,500 Manufacturing 11,700 - Aerospace Products and Parts Manufacturing 7,800 Professional and Business Services 11,100 Leisure and Hospitality 9,800 Construction 4,700 Government 4,600 Retail Trade 4,500 Wholesale Trade 3,600 Financial Activities 2,900 Other Services 2,800 Education and Health Services 1,500 Transportation, Warehousing, and Utilities 1,500 Natural Resources and Mining 0 Information -200
Source: Employment Security Department (ESD) LMEA, “Washington State Employment Situation Report for September 2012,” October 23, 2012.
Washington's unemployment rate declined from 9 percent in September 2011 to 8.5 percent in September 2012. The estimated number of unemployed workers, seasonally adjusted, decreased from 315,100 in September 2011 to 296,400 in September 2012. Washington's economy added 58,500 workers to the labor force during this period. The long-term state forecast projects an annual growth rate of 1.4 percent between 2009 and 2014, which translates to adding nearly 203,700 nonfarm jobs.3
Long-Run Trends Increase Skill Requirements
Two of the major economic trends that are expected to continue to affect our workforce needs are technological advances and globalization. These trends result in market demand for more highly-skilled and differently-skilled labor. Providing timely response to these changing demands will pose stiff challenges for both our economic competitiveness and social cohesion.
3 “Washington State Employment Situation Report for May” Employment Security Department (ESD) LMEA, June 19, 2012.

High Skills High Wages 2012 - Chapter 1—Tomorrow’s Economy
Page 4
Technology Embedded in More Tasks
Over the years, new technologies have generated new products and industries, as well as changed the way firms are organized and how workers are utilized.4 Future technological advances are expected to continue to do so. With new technologies, come changing job skill requirements. Although some technologies have created demand for unskilled workers, significant increases in demand for higher skilled workers have created a far more important result.
Workers in nearly every field have had to learn new skills as they have incorporated computers into their jobs. Machine tool operators make parts using computer-controlled machines. Forklift operators in factories use computerized inventory locating devices. Cars, traffic lights, heating and cooling systems, hospitals, machine shops—all have become computerized. Not only have employees needed to learn to use new, highly sophisticated machines, they also have had to learn, participate in, and sometimes design, whole new organizational processes associated with those machines, or with the information processes required for their efficient use.
Many U.S. manufacturers have reduced the number of supervisors in their factories and given workers greater responsibility for ensuring quality, redesigning manufacturing processes and improving products. Some companies are adopting participatory, “high-performance” work systems that place more authority and problem-solving responsibilities with front-line workers. Jobs are more often broadly defined, so that employees work in collaborative teams where success demands effective communication, and outcomes are focused on timeliness, quality, and customer service.5
Globalization
Global markets and competition pose many challenges to our economy as a whole, and specifically to workforce development. While consensus on many aspects of this problem is lacking, there is more agreement about the desirability of export promotion. Even if debate continues as to what promotional activities are effective, goals are being set and addressed in policy.
4 Lynn A. Karoly and Constantijn W.A. Panis, The 21st Century at Work: Forces Shaping the Future Workforce and Workplace in the United States (Santa Monica, CA: RAND Corporation, 2004). Paul Sommers, Drivers For A Successful Technology-based Economy: Benchmarking Washington’s Performance (Seattle, WA: Technology Alliance, May 2003). 5 Lynn A. Karoly and Constantijn W.A. Panis, The 21st Century at Work: Forces Shaping the Future Workforce and Workplace in the United States (Santa Monica, CA: RAND Corporation, 2004). Paul Sommers, Drivers For A Successful Technology-based Economy: Benchmarking Washington’s Performance (Seattle, WA: Technology Alliance, May 2003), page xxv.

High Skills High Wages 2012 - Chapter 1—Tomorrow’s Economy
Page 5
In January 2010, President Barack Obama announced the National Export Initiative:
Increase Exports: Double exports in the next five years.
Create Jobs: The creation of two million new jobs.
In June 22, 2010, Governor Christine Gregoire announced a new state export initiative:
Increase the number of Washington businesses exporting to 10,500 over the next five years.
Assist 5,000 Washington businesses to achieve $600 million in new export sales.
Washington, more than any other state, relies on foreign trade. Estimates indicate that in 2010, there were 19,514 jobs directly supported by exports in Washington.6 Washington’s industry leaders in aerospace, forest products, software, financial and legal services, and agriculture derive a significant portion of their revenues through foreign exports. In 2011, Washington was the fifth largest state exporter, exporting $64.6 billion of goods. In 2004, Washington’s exports were barely half that amount at $33.8 billion.7 Though export demand has been in decline recently8 , exports and trade will remain a major component of the Washington economy.
Many economists believe that globalization, at the aggregate level, has a favorable effect on income, prices, consumer choice, competition, and innovation in general and for the U.S in particular.9 But the effects of globalization accrue unevenly across industries, occupations, and individuals. Workers displaced by competition will generally be able to find jobs, but losses in earnings may be significant for some. Restructuring of the labor market to account for the changing composition of goods and services from the United States will mean that
6 U.S. Department of Commerce, International Trade Administration. International Trade Administration—Fostering Washington’s Competitiveness And Job Growth Through Trade. www.trade.gov/cs/states/WA.pdf 7 Choosewashington.com, accessed 8/30/2012. 8 Washington State Economic and Revenue Forecast: September, 2012, Washington State Economic and Revenue Forecast, p. 30 9 Martin N. Baily and Diana Farrell, “Exploding Myths About Offshoring,” (McKinsey Global Institute, April 2004), www.mckinsey.com/mgi/reports/pdf/exploding_myths/explodingoffshoringmyths.pdf (November 28, 2005). L. Josh Bivens, “Truth and Consequences of Offshoring,” Economic Policy Institute Briefing Paper, www.epi.org/content.cfm/bp155 (10/28/2005). Lael Brainard and Robert E. Litan, “‘Offshoring’ Service Jobs: Bane or Boon—and What to Do?,” The Brookings Institute Policy Brief #132, April 2004, www.brook.edu/comm/policybriefs/pd132.pdf (12/01/2005). Global Insight (USA), Inc., “Executive Summary: The Comprehensive Impact of Offshore Software and IT Services Outsourcing on the U.S. Economy and the IT Industry,” (Arlington, VA: Information Technology Association of America, October 2005), www.globalinsight.com/publicDownload/genericContent/103105execsum.pdf (11/09/2005). U.S. Government Accountability Office (GAO), “Offshoring of Services: An Overview of the Issues,” November 2005, http://gao.gov/cpi-bin/getrpt?GAO-06-05 (12/01/2005).

High Skills High Wages 2012 - Chapter 1—Tomorrow’s Economy
Page 6
workers displaced by offshoring may have to get new jobs in different fields, which could mean longer periods of unemployment.10
How will offshoring of jobs change?
Some portion of this displacement comes from offshore outsourcing. This has been a substantial movement over the last decade, and there are some signs of retrenchment due to changes in the economics, customer satisfaction issues, etc. However, while the rate of expansion of offshoring may never return to recent levels, it will remain as an influence on American labor markets. Internal out-sourcing to other states can also be expected to have similar, if less marked, effects on some industries and labor markets. Estimates suggest that up to 25 percent of all U.S. jobs could possibly be offshored.11
The question is not whether there will still be good jobs left in U.S.—the question is how many of them will there be? The most vulnerable jobs and occupations are ones with the following attributes or features:12
No face-to-face customer servicing requirements.
Primarily information content.
Work process is telecommutable and Internet enabled.
High wage differential with similar occupation in destination country.
Low setup barriers.
Low social networking requirement.
Cost differentials, the availability of highly educated graduates, the widespread acceptance of English as the language of business and communication, and other institutional and cultural compatibilities are factors that facilitate the offshoring of U.S. jobs to certain foreign countries. However, the economic and political trajectory of nations with offshoring potential will have a major effect on the extent to which use of this option is implemented. The three major emerging market economies with sizeable higher education sectors—China, India, and Russia— all have potential internal barriers that could constrain future growth. 13 India has not been able to provide basic school education on the wide-scale level that would ensure future 10 Linda Levine, “Offshoring and Job Loss Among U.S. Workers,” Congressional Research Service. January 21, 2011. 11 Alan S, Blinder, “How Many U.S. Jobs Might be Offshorable?,” World Economics, Vol. 10 no. 2 (April-June 2009), p. 69. 12 Ashok D. Bardhan and Cynthia Kroll, “The New Wave of Outsourcing,” (Berkeley, CA: Fisher Center for Real Estate and Urban Economics, University of California, Berkeley, Paper #1103, 2003), http://repositories.cdlib.org/iber/fcreue/reports/1103 (12/05/2005). 13 Ashok D. Bardhan and Cynthia Kroll, “The New Wave of Outsourcing,” (Berkeley, CA: Fisher Center for Real Estate and Urban Economics, University of California, Berkeley, Paper #1103, 2003), http://repositories.cdlib.org/iber/fcreue/reports/1103 (12/05/2005), page 5.

High Skills High Wages 2012 - Chapter 1—Tomorrow’s Economy
Page 7
growth in highly trained graduates; Russia is experiencing institutional underdevelopment, erratic reforms, and challenges in resourcing an advanced higher education system; and China still faces language, institutional, and cultural barriers. Rising salaries in these countries could decrease the cost gains for offshoring.14 Immigration policy options, such as the H-1B visa program provide an alternate model for skilled labor sourcing, with some of the same advantages, but with a very different set of impacts on the U.S. economy and political constraints.
Potential quality control problems and concerns over intellectual property theft also may limit overseas outsourcing for some activities. The total growth of high-tech jobs may outpace the increasing supply of knowledgeable workers in the emerging economy. As Robert Reich, a professor of public policy at UC Berkeley and former U.S. Department of Labor Secretary noted, “Even as the supply of workers around the world capable of high-tech innovation increases, the demand for innovative people is increasing at an even faster pace.”15
The most positive jobs scenario would see many of the highest skill and highest paid jobs created in the U.S., while jobs lower on the knowledge and value added scales are outsourced.16 Under this scenario, innovation would lead to a continuing stream of new service and manufacturing activities, and hence, new jobs and occupations, while competition and the need for lower-cost supply would drive more mature service operations overseas. Depending on their education and skills, individual workers might still find it difficult to find replacement employment at similar wages, but overall, the jobs lost to outsourcing would be replaced by higher-wage jobs in new subsectors brought about by innovation.”17 Reich has similarly argued that there will be plenty of good jobs in the future, but too few Americans are being prepared for them.
However, there are many examples of outsourcing where there is no visible connection between loss of low and middle wage jobs and increases in higher skill or knowledge jobs that produce new products or services.
The Bureau of Labor Statistics analyzed service providing occupations that were susceptible to offshoring. The bureau identified 160 occupations that have diverse functions, levels of education, and earnings. Nearly every computer and mathematical science occupation has
14 Peter Engardio, “The Future of Outsourcing, Business Week, January 30 2006, p. 58. 15 Robert Reich, “High-Tech Jobs Are Going Abroad! But That’s Okay,” Washington Post Company, 2003. 16 Ashok D. Bardhan and Cynthia Kroll, “The New Wave of Outsourcing,” (Berkeley, CA: Fisher Center for Real Estate and Urban Economics, University of California, Berkeley, Paper #1103, 2003), http://repositories.cdlib.org/iber/fcreue/reports/1103 (12/05/2005), page 12. 17 Ashok D. Bardhan and Cynthia Kroll, “The New Wave of Outsourcing,” (Berkeley, CA: Fisher Center for Real Estate and Urban Economics, University of California, Berkeley, Paper #1103, 2003), http://repositories.cdlib.org/iber/fcreue/reports/1103 (12/05/2005), page 12.

High Skills High Wages 2012 - Chapter 1—Tomorrow’s Economy
Page 8
some degree of susceptibility to offshoring. Over 80 percent of workers in these highly susceptible occupations had at least some college education, and over half had a bachelor’s degree. The most susceptible occupations are computer programmers and operators, data entry workers, typists, and pharmacy technicians who had 1) inputs and outputs that could be easily transmitted; 2) require little interaction with other types of workers; 3) little to no local cultural knowledge and 4) high degree of routine work.18
Washington’s Competitive Position
In addition to its status as an international trade hub, Washington has dominant global leaders in two sectors: software and aerospace. It also has an emerging national leader in e-commerce, though it is far from clear how the structure of this sector will evolve internationally or nationally.
At a national level, Washington’s natural resource base will support a long-term economic role in producing agricultural and forest products for both domestic and foreign markets. The state’s natural resource base also includes significant renewable energy resources, particularly in hydropower.
There are other fields in which Washington can be expected to remain a significant if not dominant player at the national level, such as biotechnology. There are also other successful sectors that provide important diversification to the economic base, some of which have developed to support the state’s global leaders, like composite manufacturing, and others having survived from the earlier industrial economy, like marine and truck manufacturing.
Education Related to Gap Between the Haves and the Have-Nots
Starting in the mid-1970s, income inequality in America has worsened, and studies suggest that pervasive technological change is a culprit. Globalization also has been linked to the decline in earnings particularly among less-skilled workers over the last few decades. The demand for highly skilled workers in all sectors of the economy has increased rapidly. Supply has not kept up with demand and the earning gap between more-educated and less-educated workers has widened.19
18 Roger J. Moncarz, Michael Wolf, and Benjamin Wright. “Service-providing occupations, offshoring, and the labor market.” Monthly Labor Review. December 2008. 19 Lynn A. Karoly and Constantijn W.A. Panis, The 21st Century at Work: Forces Shaping the Future Workforce and Workplace in the United States (Santa Monica, CA: RAND Corporation, 2004). Paul Sommers, Drivers For A Successful Technology-based Economy: Benchmarking Washington’s Performance (Seattle, WA: Technology Alliance, May 2003), page.xxiii.

High Skills High Wages 2012 - Chapter 1—Tomorrow’s Economy
Page 9
Data from the American Community Survey show a positive relationship between training levels and 2011 annual average wage estimates of workers ages 25 to 64 in Washington.20 Workers with an associate’s degree earn over $8,000 more than workers with only a high school diploma. Workers with a bachelor’s degree earn $13,000 more than those with an associate’s degree. Similarly, unemployment rates were lower for more educated workers, ranging in 2011 from under 4 percent for those with graduate degrees, to just over 16 percent for those without high school diplomas.
U.S. Census Bureau’s 2011 American Community Survey, Public Use Microsample (PUMS) data.
While the general relationship is for higher credential to be associated with higher earnings, the program of study also makes large difference. The Workforce Board’s analysis of recent college graduates by program of study shows that earnings in the year after graduation vary by as much as two to three-fold, depending on one’s field. Workers in higher paying fields with mid-level credentials have higher average earnings than baccalaureate holders in lower-paying fields.
Average Wages
The recession of 2001-02 curbed average wages for several years, and significant growth did not start until 2006.21 The average annual wage in Washington has increased every year since 2008. In 2010, there was a 2.1 rise in the average annual wage; in 2011 the annual average
20 U.S. Census Bureau’s 2011 American Community Survey, Public Use Microsample (PUMS) data. 21 Washington's average wage grew in 2011, ESD News Brief dated June 19, 2012. www.esd.wa.gov/newsandinformation/releases/average-wage-grew-in-2011-12-024.php
$20,280
$30,508 $35,528 $38,686
$52,050
$64,112
$-
$10,000
$20,000
$30,000
$40,000
$50,000
$60,000
$70,000
0.0%2.0%4.0%6.0%8.0%
10.0%12.0%14.0%16.0%18.0%
Less Than HighSchool Diploma
High School Diploma Some College, NoDegree
Associate's Degreeor Certificate
Bachelor's Degree Graduate Degree
Median Annual Earnings and Unemployment by Education Level
High Skills High Wages 2012 - Chapter 1—Tomorrow’s Economy
Page 10
wage grew by 3.6 percent. The 2011 average annual wage in Washington is $49,894, ranking 10th out of all states.
Multiple Job Holding
Workers can increase their incomes by holding more than one job. According to the Bureau of Labor Statistics, 4.9 percent of workers age 16 and over held more than one job in 2010 and 2011. The most recent Bureau of Labor Statistics data for individual states shows Washington’s rate of multiple job holding is 5.7 percent.22 Multiple job-holders are those who report that they hold two or more jobs during the same week in response to the Current Population Survey.
Self-Employment in Washington
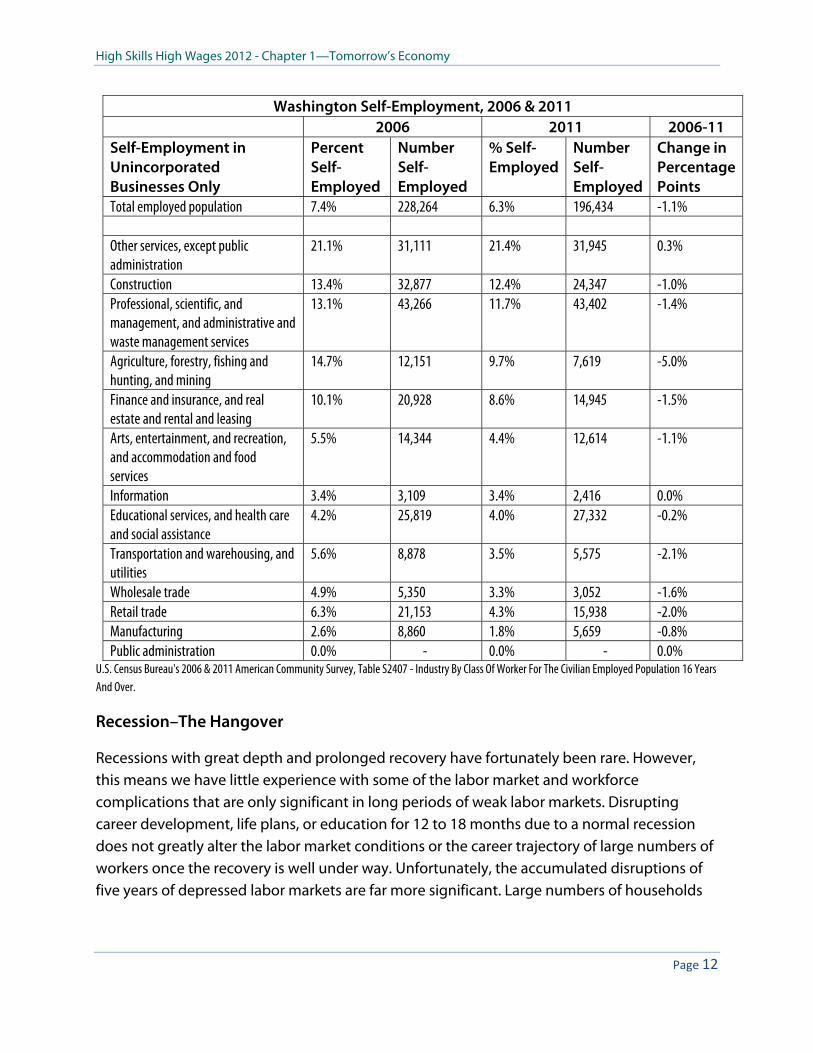
The most current data available from the 2011 American Community Survey, reports Washington’s self-employment23 in unincorporated businesses at 6.3 percent of the workforce ages 16 and over, or approximately 196,000 self-employed individuals in our state.24 In 2011, self-employment from incorporated businesses accounted for an additional 3.8 percent of Washington self-employment and 3.4 percent at the national level.
As the following table depicts, Washington’s 6.3 percent rate of self-employment is very close to the 2011 national average of 6.4 percent. Compared to 52 other states and territories, Washington is in the middle of the states, with a ranking of 27th in terms of the self-employed proportion of the workforce. Puerto Rico has the highest rate of self-employment at 10 percent, while the District of Columbia has the lowest at 4.1 percent. Other west coast states, such as California (seventh at 8.7 percent) and Oregon (ninth at 8.3 percent) have higher rates of self-employment than Washington.
Compared to 10 years earlier, self-employment in Washington and nationally has fallen. In 2000, Washington’s self-employment was at just short of 200,000, or 7.2 percent of the workforce.25 Nationally, the rate of self-employment in 2000 was 6.6 percent, and Washington ranked 22nd out of 52 states and territories, with Montana having the highest rate at 11.8
22 Jim Campbell, “Multiple Job Holding in States in 2011,” Monthly Labor Review, Bureau of Labor Statistics, www.bls.gov/opub/mlr/2012/05/art4full.pdf. 23 Self-employment is defined as those individuals employed in their own unincorporated business to make data comparable to earlier periods. 24 U.S. Census Bureau's 2010 American Community Survey, Table S2407 - Industry By Class Of Worker For The Civilian Employed Population 16 Years And Over, Accessed via American Factfinder. 252000 U.S. Census, Table QT-P25 - Class of Worker by Sex, Place of Work, and Veteran Status: 2000. Accessed via American Factfinder, Census 2000 Summary File 3 (SF 3).

High Skills High Wages 2012 - Chapter 1—Tomorrow’s Economy
Page 11
percent and Delaware the lowest at 4.9 percent. Earlier data, from the 1990 Census, found Washington’s self-employment rate to be 7.8 percent of the workforce.26
Self-Employment by State, 2011
State % Self-Employment
State Rank
State % Self-Employment
State Rank
United States 6.4% - Puerto Rico 10.0% 1 Washington 6.3% 27 Montana 9.8% 2 Missouri 6.2% 28 Vermont 9.8% 3 Florida 6.1% 29 Maine 9.4% 4 New York 6.1% 30 North Dakota 8.9% 5 North Carolina 6.0% 31 South Dakota 8.9% 6 Mississippi 5.9% 32 California 8.7% 7 Georgia 5.8% 33 Idaho 8.3% 8 South Carolina 5.8% 34 Oregon 8.3% 9 Wisconsin 5.7% 35 Nebraska 7.6% 10 Kentucky 5.6% 36 New Hampshire 7.5% 11 Louisiana 5.6% 37 Tennessee 7.4% 12 Alabama 5.5% 38 Alaska 7.1% 13 Michigan 5.4% 39 New Mexico 7.1% 14 Pennsylvania 5.4% 40 Iowa 7.0% 15 Ohio 5.3% 41 Oklahoma 7.0% 16 Maryland 5.2% 42 Connecticut 6.9% 17 Rhode Island 5.1% 43 Hawaii 6.9% 18 Illinois 5.0% 44 Kansas 6.9% 19 Indiana 5.0% 45 Texas 6.9% 20 Virginia 5.0% 46 Colorado 6.8% 21 New Jersey 4.8% 47 Wyoming 6.8% 22 Nevada 4.7% 48 Massachusetts 6.6% 23 Utah 4.7% 49 Arkansas 6.5% 24 West Virginia 4.7% 50 Arizona 6.3% 25 Delaware 4.2% 51 Minnesota 6.3% 26 District of Columbia 4.1% 52 Source: U.S. Census Bureau's 2011 American Community Survey, Table S2407 - Industry By Class Of Worker For The Civilian Employed Population 16 Years And Over
26 OFM 1990 U.S. Census Demographic Profiles of Counties, Labor Force Status and Employment Characteristics, www.ofm.wa.gov/pop/census1990/county/default.asp
High Skills High Wages 2012 - Chapter 1—Tomorrow’s Economy
Page 12
Washington Self-Employment, 2006 & 2011 2006 2011 2006-11 Self-Employment in Unincorporated Businesses Only
Percent Self-Employed
Number Self-Employed
% Self-Employed
Number Self-Employed
Change in Percentage Points
Total employed population 7.4% 228,264 6.3% 196,434 -1.1% Other services, except public administration
21.1% 31,111 21.4% 31,945 0.3%
Construction 13.4% 32,877 12.4% 24,347 -1.0%Professional, scientific, and management, and administrative and waste management services
13.1% 43,266 11.7% 43,402 -1.4%
Agriculture, forestry, fishing and hunting, and mining
14.7% 12,151 9.7% 7,619 -5.0%
Finance and insurance, and real estate and rental and leasing
10.1% 20,928 8.6% 14,945 -1.5%
Arts, entertainment, and recreation, and accommodation and food services
5.5% 14,344 4.4% 12,614 -1.1%
Information 3.4% 3,109 3.4% 2,416 0.0%Educational services, and health care and social assistance
4.2% 25,819 4.0% 27,332 -0.2%
Transportation and warehousing, and utilities
5.6% 8,878 3.5% 5,575 -2.1%
Wholesale trade 4.9% 5,350 3.3% 3,052 -1.6%Retail trade 6.3% 21,153 4.3% 15,938 -2.0%Manufacturing 2.6% 8,860 1.8% 5,659 -0.8%Public administration 0.0% - 0.0% - 0.0%
U.S. Census Bureau's 2006 & 2011 American Community Survey, Table S2407 - Industry By Class Of Worker For The Civilian Employed Population 16 Years And Over.
Recession–The Hangover
Recessions with great depth and prolonged recovery have fortunately been rare. However, this means we have little experience with some of the labor market and workforce complications that are only significant in long periods of weak labor markets. Disrupting career development, life plans, or education for 12 to 18 months due to a normal recession does not greatly alter the labor market conditions or the career trajectory of large numbers of workers once the recovery is well under way. Unfortunately, the accumulated disruptions of five years of depressed labor markets are far more significant. Large numbers of households

High Skills High Wages 2012 - Chapter 1—Tomorrow’s Economy
Page 13
have had major losses in net worth that influence their ability to invest in education (or to support demand for capital goods). Thousands of prime-age workers have become long-term unemployed, with those who were eligible having exhausted even extended Unemployment Insurance benefits. Thousands of young workers are years behind in acquiring initial work experience that normally enhances both their hire-ability and practical experience to inform their career planning.
On top of this, there is a significant flow of demobilizing veterans in need of employment in a relatively sparse labor market that has very different working conditions and limited automatic transferability of their established skills.
Labor statistics show that significant numbers who would prefer to work full time are currently under-employed in part-time jobs. This segment of Washington’s workforce has doubled from 3.3 percent in 2007 and has hovered at or near a recession maximum of 6.7 percent since 2010.27 The number of workers who have either left the labor market, or failed to enter it, is large enough that the labor force participation rate has declined significantly and has not yet begun to recover.28
In Washington, this effect has been strongest for young workers, for whom the labor force participation has fallen from 45.8 percent in 2006 to 36.1 percent in 2011. Finally, while the decline in household assets combined with uncertainty about both the general economy and the reliability of pension benefits have led many baby boomers to defer their retirement, this has had the paradoxical effect of reducing the number of younger workers trained on the job to replace them when they eventually do retire.
Washington’s Industry Outlook
For years, Washington’s economy provided substantial numbers of high-paying jobs with benefits to workers with modest education levels in natural resources and manufacturing industries. These traditional sources of high-wage work are either shrinking or have limited prospects for growth.29 Some sectors have been experiencing job gains since the recession ended while others are facing continued losses. The health services industry grew during the recession, and has continued to grow since the recession ended, adding nearly 40,000 jobs between June 2009 and August 2012. The information sector has grown 2.3 percent since the end of the recession, adding 2,500 jobs. Aerospace product and parts manufacturing has grown 15.6 percent since the end of the recession, adding nearly 13,000 jobs. However,
27BLS Local Area Statistics Alternative Measures of Labor Underutilization for States www.bls.gov/lau/stalt_archived.htm 28 Age 16-19, U.S. Census Bureau 2011 American Community Survey. 29 Dave Wallace, “Getting Paid to Make Paper,” Washington Labor Market Quarterly Review, Volume 29, Number 3, July-September 2005.
High Skills High Wages 2012 - Chapter 1—Tomorrow’s Economy
Page 14
employment in the construction industry has contracted, decreasing from 196,100 workers at the end of the recession to 142,200 in August 2012. Employment in wood product manufacturing, logging, and sawmills and wood preservation have been declining since before the recession and are not likely to return to be major sources of jobs.
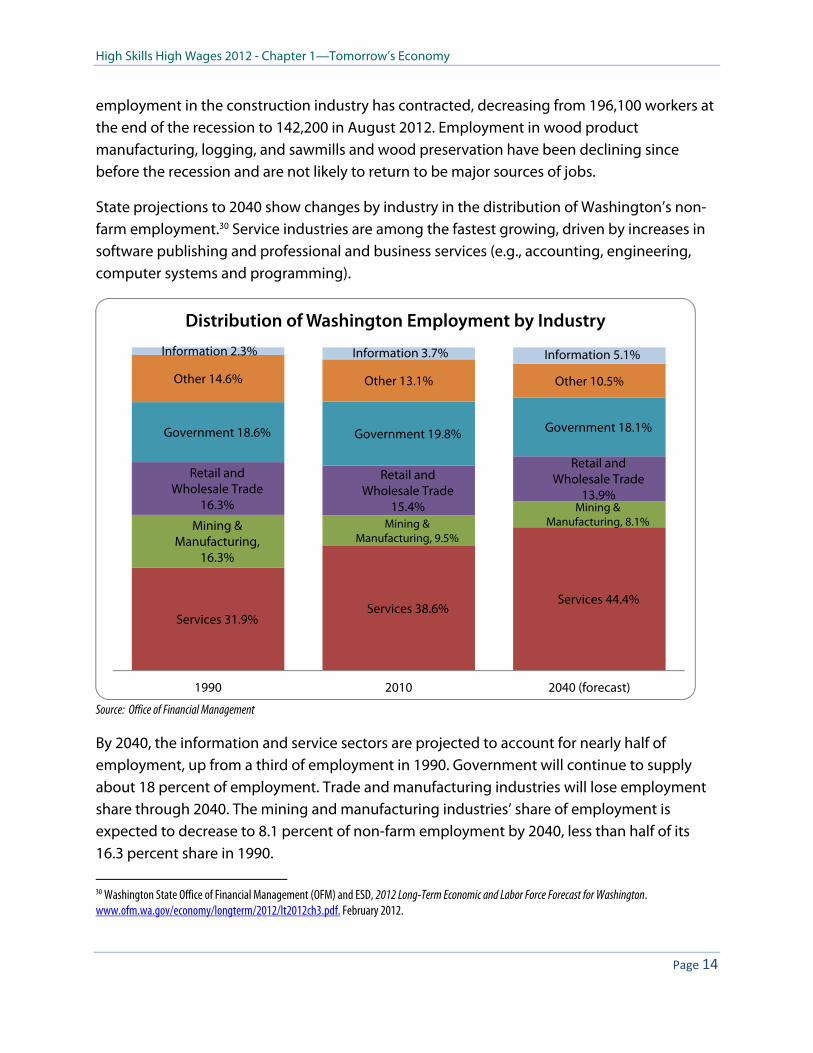
State projections to 2040 show changes by industry in the distribution of Washington’s non-farm employment.30 Service industries are among the fastest growing, driven by increases in software publishing and professional and business services (e.g., accounting, engineering, computer systems and programming).
Source: Office of Financial Management
By 2040, the information and service sectors are projected to account for nearly half of employment, up from a third of employment in 1990. Government will continue to supply about 18 percent of employment. Trade and manufacturing industries will lose employment share through 2040. The mining and manufacturing industries’ share of employment is expected to decrease to 8.1 percent of non-farm employment by 2040, less than half of its 16.3 percent share in 1990.
30 Washington State Office of Financial Management (OFM) and ESD, 2012 Long-Term Economic and Labor Force Forecast for Washington. www.ofm.wa.gov/economy/longterm/2012/lt2012ch3.pdf. February 2012.
Services 31.9%Services 38.6%
Services 44.4%
Mining & Manufacturing,
16.3%
Mining & Manufacturing, 9.5%
Mining & Manufacturing, 8.1%
Retail and Wholesale Trade
16.3%
Retail and Wholesale Trade
15.4%
Retail and Wholesale Trade
13.9%
Government 18.6% Government 19.8% Government 18.1%
Other 14.6% Other 13.1% Other 10.5%
Information 2.3% Information 3.7% Information 5.1%
1990 2010 2040 (forecast)
Distribution of Washington Employment by Industry

High Skills High Wages 2012 - Chapter 1—Tomorrow’s Economy
Page 15
Despite the overall decline in manufacturing employment as a percent of total employment, employment growth is expected in aerospace and advanced manufacturing. Because of record aircraft orders, the aerospace industry expects significant hiring in the near-term. Over a longer period, the prospects are good for substantial advanced manufacturing employment, including aerospace.
What Jobs Will be Available?
Nationally, as many as 30 percent of the new family-wage job opportunities will be in occupations that require postsecondary education but not necessarily a four-year degree, according to a Georgetown University study.31 The following chart includes occupations requiring more than one year and up to, but less than four years of postsecondary training that are expected to be in demand between 2010 and 2020.32
Annual Job Openings in Washington in Occupations Requiring More Than One Yearand up to, but less than, Four Years of Postsecondary Education (2004-2014)
Occupation Estimated
Employment 2010
Average Annual Openings 2010-2015
Average Annual Openings
2015-2020 Registered Nurses 55,401 2,051 2,588 Carpenters 35,332 1,171 1,088 Nursing Aides, Orderlies, and Attendants 24,911 775 940 Supervisors/Managers of Construction Trades and Extraction Workers
15,384 623 598
Electricians 14,682 696 627 Computer Support Specialists 16,481 854 961 Medical Secretaries 16,539 580 642 Licensed Practical and Licensed Vocational Nurses 9,741 398 448 Gaming Dealers 6,126 365 272 Aircraft Structure, Surfaces, Rigging and Systems Assemblers 11,594 701 437
Cost Estimators 5,290 236 236 Aircraft Mechanics and Service Technicians 5,232 254 199 Preschool Teachers, Except Special Education 6,713 262 267 Source: ESD, Long Term Occupational Projections. As of May 2012.
31 Anthony P. Carnevale, Tamara Jayasundera and Andrew R. Hanson, “Career and Technical Education: Five Ways that Pay, Along the Way to the B.A.” (Georgetown Public Policy Institute, Center on Education and the Workforce. September 2012) www.insidehighered.com/sites/default/server_files/files/CTE_FiveWays_FullReport_Embargoed.pdf 32 Washington Occupational Employment Projections, May 2012. ESD, LMEA.
High Skills High Wages 2012 - Chapter 1—Tomorrow’s Economy
Page 16
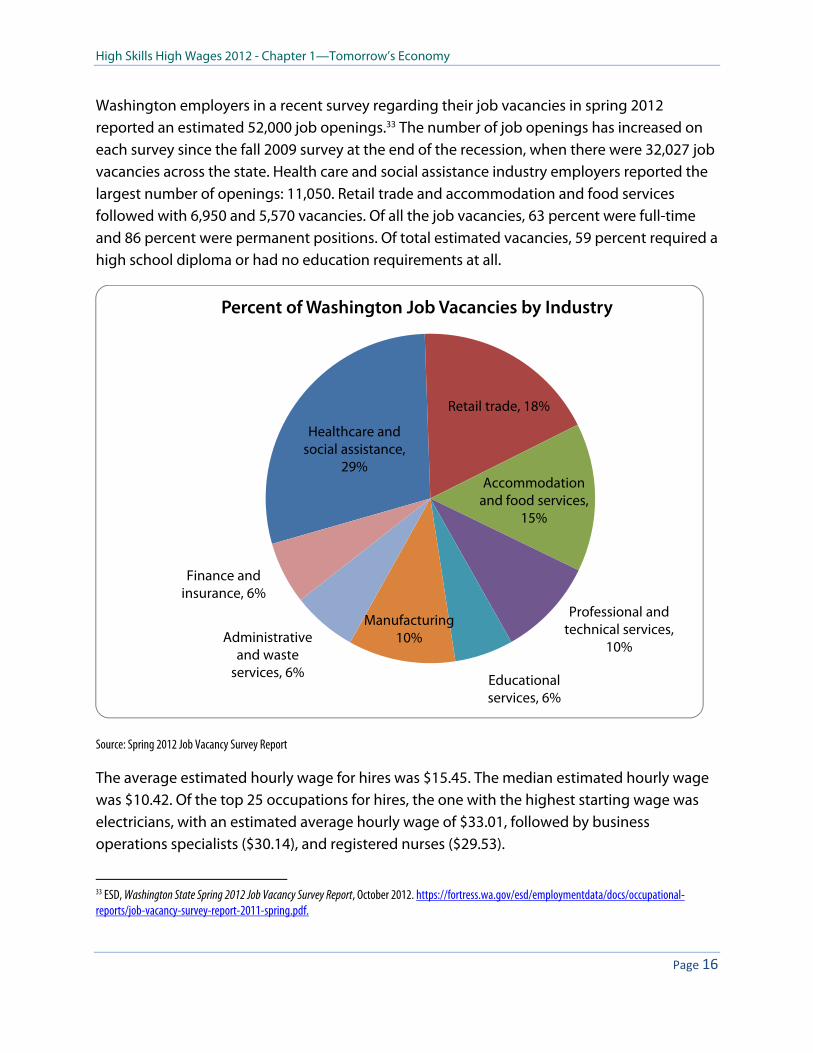
Washington employers in a recent survey regarding their job vacancies in spring 2012 reported an estimated 52,000 job openings.33 The number of job openings has increased on each survey since the fall 2009 survey at the end of the recession, when there were 32,027 job vacancies across the state. Health care and social assistance industry employers reported the largest number of openings: 11,050. Retail trade and accommodation and food services followed with 6,950 and 5,570 vacancies. Of all the job vacancies, 63 percent were full-time and 86 percent were permanent positions. Of total estimated vacancies, 59 percent required a high school diploma or had no education requirements at all.
Source: Spring 2012 Job Vacancy Survey Report
The average estimated hourly wage for hires was $15.45. The median estimated hourly wage was $10.42. Of the top 25 occupations for hires, the one with the highest starting wage was electricians, with an estimated average hourly wage of $33.01, followed by business operations specialists ($30.14), and registered nurses ($29.53).
33 ESD, Washington State Spring 2012 Job Vacancy Survey Report, October 2012. https://fortress.wa.gov/esd/employmentdata/docs/occupational-reports/job-vacancy-survey-report-2011-spring.pdf.
Healthcare and social assistance,
29%
Retail trade, 18%
Accommodation and food services,
15%
Professional and technical services,
10%
Educational services, 6%
Manufacturing10%Administrative
and waste services, 6%
Finance and insurance, 6%
Percent of Washington Job Vacancies by Industry

High Skills High Wages 2012 - Chapter 1—Tomorrow’s Economy
Page 17
Employers Report a Shortage of Skilled Workers
The transition to a more knowledge-based economy has called for some changes in the types of skills employers are requiring now, or will be requiring in the near future.34 Advanced technologies clearly require workers with the knowledge and skills to use them effectively, efficiently, and creatively. Rapid technological changes and increased global competition have led to a growing importance of strong non-routine cognitive skills, such as abstract reasoning, problem-solving, communication, and collaboration. Employers continue to report a shortage of workers with either basic workplace or job-specific skills, or both.
Roughly 3,000 firms responded to the Workforce Board’s Washington Employer Workforce Needs and Practices Survey, conducted during the spring and summer of 2010.35 Fewer firms reported hiring new employees as compared to previous surveys: 62 percent in 2010 compared with 80 percent in 2007. Due to the recession, skill shortages declined. Among firms attempting to hire, 26 percent reported difficulty finding qualified job applicants, compared with 60 percent in 2007. The difficulty in finding qualified job applicants was most severe in the manufacturing (29 percent) services (28 percent) and other industries (37 percent.)36 Extrapolating from the survey results, an estimated 28,100 Washington firms—about one-quarter—had difficulty finding qualified job applicants during the fall of 2010.
Employers had the most difficulty finding applicants with job-specific skills (85 percent). For example, they wanted to hire a registered nurse but had trouble finding one; however, large percentages also reported difficulty finding applicants with communication skills (76 percent), and ability to adapt to changes in duties and responsibilities (75 percent), problem-solving or critical thinking skills (69 percent), and positive work habits and attitudes (68 percent).
Employers attempting to hire were asked about the level of difficulty they encountered in finding qualified applicants with specific education levels. They reported the greatest shortage of applicants for jobs requiring postsecondary education, especially for vocationally trained workers from our community colleges, apprenticeship programs, and private career schools. Among employers attempting to hire workers with a postsecondary vocational certificate, 70 percent reported difficulty finding qualified applicants. In contrast, among
34 Lynn A. Karoly and Constantijn W.A. Panis, The 21st Century at Work: Forces Shaping the Future Workforce and Workplace in the United States (Santa Monica, CA: RAND Corporation, 2004). Paul Sommers, Drivers For A Successful Technology-based Economy: Benchmarking Washington’s Performance (Seattle, WA: Technology Alliance, May 2003). 35 Workforce Board, Washington State Employers’ Workforce Training Needs and Practices, 2010. 36 Other industries include transportation, utilities, insurance, banking, and real estate.

High Skills High Wages 2012 - Chapter 1—Tomorrow’s Economy
Page 18
employers attempting to hire workers with only a high school diploma, 32 percent reported difficulty.
Employer Difficulty Finding Applicants by Educational Level (Percentage and Estimated Number of Firms With Difficulty)
Educational Level Among EmployersAttempting to Hireat That Level 2008
Among Employers Attempting to Hire at That Level 2010
Estimated Number of Firms 2010
Neither a high school diploma or GED 33% 21% 3,349 High school diploma or GED 32% 32% 7,480Some college course work 67% 57% 11,005Vocational certificate 70% 69% 12,322Vocational associate’s degree 64% 63% 7,949Academic associate’s degree 48% 64% 7,475Baccalaureate degree 61% 59% 6,799Master’s degree 54% 75% 6,547PhD or Professional degree 66% 53% 2,408 Source: Workforce Board, Washington Employer Survey, 2008, 2010.
The problem will likely grow worse. Skills required in the workplace continue to increase, and, as a result, about one-fifth of all firms reported that their need for workers with postsecondary training would increase over the next five years.
Employers Expecting a Change in Demand (as a percentage of all employers)
Educational Level Increase Decrease
Neither a high school diploma or GED 7% 5% High school diploma or GED 12% 1% Some college course work 19% 1% Vocational certificate 19% 1% Vocational associate’s degree 15% 1% Academic associate’s degree 16% 1% Baccalaureate degree 17% 2% Master’s degree 6% 2% Source: Workforce Board Employer Needs Survey, 2010.
Sizing the Skilled Labor Supply Gap
Forecasting the exact numbers of skilled workers needed is a daunting task given the overall uncertainties about the patterns of recovery and the future course of technological and political changes. Forecasting techniques inherently rely on information and patterns from

High Skills High Wages 2012 - Chapter 1—Tomorrow’s Economy
Page 19
the past. Therefore, these forecasts inevitably miss new or unanticipated changes. Subject to those cautions, forecasts are made about future labor demand, assuming a reasonable level of similarity with pre-recession trajectories in the economy.
To meet the projected needs of employers, Washington will need an additional 9,000 completers at the mid-level; 10,000 at the bachelor’s level; and 9,000 at the graduate level annually by 2019.37
High employer demand programs of study are those fields where the in-state supply of graduates per year is less than the average annual number of net openings expected in Washington.
At the mid-level, high demand programs of study are identified as health professions; installation, maintenance and repair; manufacturing and production; accounting and bookkeeping; protective services; and science technology.
At the baccalaureate level, high demand programs of study are identified as computer science; engineering; health professions; life sciences and agriculture; and physical science occupations.
37 A Skilled and Educated Workforce, 2011. A Joint report prepared by the Workforce Board, SBCTC & HEC Board. http://www.wsac.wa.gov/sites/default/files/SkilledEducatedWorkforce2011.pdf

High Skills High Wages 2012 - Chapter 1—Tomorrow’s Economy
Page 20
At the graduate level, high demand programs of study are identified as: computer science; engineering; health professions; life science and agriculture; physical science; and human and protective service occupations.
Further analysis is required in education, and media and communications occupations at all levels; and social science occupations at the baccalaureate level.
The Workforce Board regularly analyzes supply and demand at the mid-level using labor market data and student records. The mid-level occupations that we expect to have the biggest gaps between supply and demand, if we do not increase supply, can be found at www.wtb.wa.gov/HighDemandFields.asp. This list of high employer demand programs of study at the mid-level will be updated annually.
Strategic Industry Clusters & Cluster Policy
The Workforce Board strategic cluster policy for workforce development relies partly on an industry cluster analysis using detailed industry data to define regional specialties, 38 develop maps of industry clusters and prioritize clusters for regional development purposes. This policy derives from a process begun with the Skills for the Next Washington initiative. 39
Strategic industry clusters shall be identified for the purpose of guiding and informing policy and investment decisions for workforce education and training, such as the awarding of discretionary funds for cluster-based workforce development initiatives.
Consensus rankings of strategic clusters shall be used to steer investments toward those clusters that are most strategic for workforce development.40 The Board will guide investments toward clusters that are at the higher rather than the lower end of the strategic rankings.
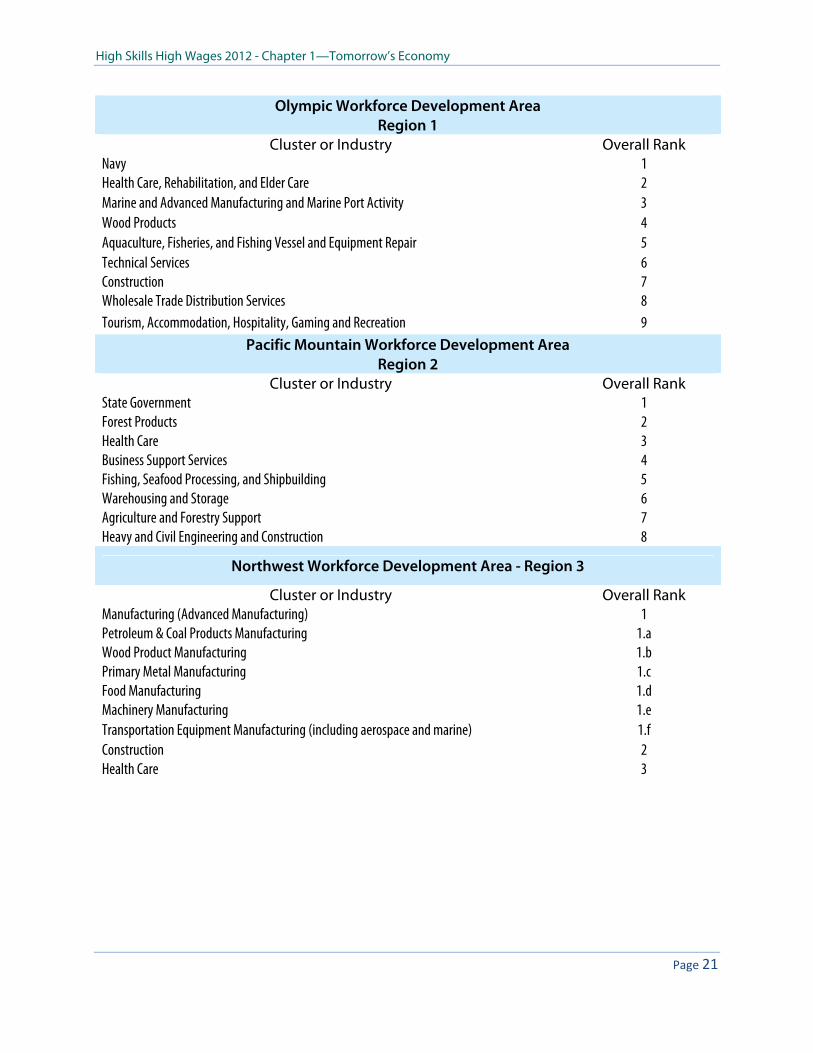
This ranking of industry clusters is intended to guide and inform policy and investment decisions for workforce education and training. The Workforce Board will guide investments toward clusters that are at the higher rather than the lower end of the strategic rankings. The Workforce Board adopted these clusters in November of 2011.
38 Washington State Cluster Development Analysis, http://www.wtb.wa.gov/ClusterAnalysis.asp 39 Skills for the Next Washington, http://www.wtb.wa.gov/SkillsfortheNextWashington.asp 40 Strategic Industry Clusters For Workforce Development, http://www.wtb.wa.gov/ClusterRankingsAllRegions.asp
High Skills High Wages 2012 - Chapter 1—Tomorrow’s Economy
Page 21
Olympic Workforce Development Area Region 1
Cluster or Industry Overall Rank Navy 1 Health Care, Rehabilitation, and Elder Care 2 Marine and Advanced Manufacturing and Marine Port Activity 3 Wood Products 4 Aquaculture, Fisheries, and Fishing Vessel and Equipment Repair 5 Technical Services 6 Construction 7 Wholesale Trade Distribution Services 8 Tourism, Accommodation, Hospitality, Gaming and Recreation 9
Pacific Mountain Workforce Development Area Region 2
Cluster or Industry Overall Rank State Government 1 Forest Products 2 Health Care 3 Business Support Services 4 Fishing, Seafood Processing, and Shipbuilding 5 Warehousing and Storage 6 Agriculture and Forestry Support 7 Heavy and Civil Engineering and Construction 8
Northwest Workforce Development Area - Region 3
Cluster or Industry Overall Rank Manufacturing (Advanced Manufacturing) 1 Petroleum & Coal Products Manufacturing 1.a Wood Product Manufacturing 1.b Primary Metal Manufacturing 1.c Food Manufacturing 1.d Machinery Manufacturing 1.e Transportation Equipment Manufacturing (including aerospace and marine) 1.f Construction 2 Health Care 3

High Skills High Wages 2012 - Chapter 1—Tomorrow’s Economy
Page 22
Snohomish County Workforce Development Area Region 4
Cluster or Industry Overall Rank Aerospace and Composites Manufacturing 1 Computer and Electronic Manufacturing (includes Medical Devices) 2 Ship and Boat Building and Composites Manufacturing 3 Architectural and Structural Metals Manufacturing 4 Wood Furniture and Cabinets Manufacturing 5 Heavy Construction (roads, bridges, utilities, infrastructure) 6 Research and Development in Biotechnology 7 Forest Products* 8 Navy* 9
*Indicates clusters the state lists as strategic, but local Workforce Development Council does not.
Seattle-King County Workforce Development Area Region 5
Cluster or Industry Overall Rank Health Care (including life sciences research and development) 1 Manufacturing 2 Aerospace & Transportation Equipment 2.a Overhead Cranes & Hoists 2.b Medical Devices 2.c Fisheries & Seafood Processing 2.d Construction 3 Trade, Transportation & Logistics 4 Information Technology 5
Tacoma-Pierce County Workforce Development Area Region 6
Cluster or Industry Overall Rank* National Security Information Technology/Computer Systems Design and Related Services Health Care Trade/Deep Sea Transportation and Warehousing Logistics Construction Food Manufacturing Aerospace Manufacturing Building Products Manufacturing
*Overall rank was not assigned to clusters by the Tacoma-Pierce County WDA.

High Skills High Wages 2012 - Chapter 1—Tomorrow’s Economy
Page 23
Southwest Washington Workforce Development Area * Region 7
Cluster or Industry Overall Rank Health Care 1 Manufacturing 2 Wood Products 2.a Paper Products 2.b Machinery 2.c Electronics 2.d Food Product Manufacturing 2.e High Tech/Information Technology 3 Electronics 3.a Telecommunications 3.b Professional & Technical Services 4 Utilities 5 Construction 6
North Central Workforce Development Area Region 8
Cluster or Industry Overall Rank Agriculture 1 Food & Beverage Processing 2 Health Care 3 Chemical, Mineral and Metal Manufacturing 4 Electrical Utilities - Power Generation 5 Telecommunications 6 Gambling & Recreation 7
South Central Workforce Development Area Region 9
Cluster or Industry Overall Rank Agriculture & Food Processing 1 Health Care 2 Manufacturing 3 Plastics and Wood Products Manufacturing 3.a Fabricated and Metal Product Manufacturing 3.b Clean Technology/Renewable Energy 4 Warehousing/Distribution 5 Support Activities for Transportation 5.a Truck Transportation 5.b Professional and Business Services 6 Construction 7

High Skills High Wages 2012 - Chapter 1—Tomorrow’s Economy
Page 24
Eastern Washington Partnership Workforce Development Area Region 10
Cluster or Industry Overall Rank Agriculture and Food Products/Transportation & Distribution Chain 1 Health Care 2 Renewable Energy 3 Depository Credit Organizations 4 Forest Products 5 Mining 6
Benton-Franklin Workforce Development Area Region 11
Cluster or Industry Overall Rank Waste Management and Remediation 1 Health Care Services 2 Physical Science Research and Development 3 Agriculture and Food Processing 4 Advanced Manufacturing (To be specified) 5 Business Support Services 6
Spokane Area Workforce Development Area Region 12
Cluster or Industry Overall Rank Health Services 1 Aerospace and Advanced Manufacturing, including: 2
Plastics and rubber products Metal and machinery Computers and electronic products
Professional and Technical Services 3 Business Support Services 4 Energy, Waste Management, and Remediation 5 Finance and Insurance 6
Summary and Implications
Like the national economy, Washington’s economy was contracted during the Great Recession. Unemployment reached a high in February 2010 and has been decreasing since. Construction was hit particularly hard by the recession, but is finally showing signs of a sustained recovery.
Major recessions and depressions never recover to exactly the same economy that preceded the recession. Economic dislocations not only adjust the distribution of capital and labor, they disrupt structural barriers to change, reformulate economic thinking, and include or

High Skills High Wages 2012 - Chapter 1—Tomorrow’s Economy
Page 25
cause political change. The combination of the magnitude of this recession and the “post-industrial” globalized economy in which it occurred, leave us with little relevant historical precedent on which to construct a definitive forecast of the specifics of the recovery. In addition, there are now abnormally large numbers of workers with long disruptions in their employment history and/or greatly diminished net worth. Similarly, we face an abnormally large deficit in the work experience of young workers trying to enter or establish themselves in the workforce during the last five years.
The rapid rate of technological change and the pressures of globalization, while perhaps somewhat slowed, have clearly not been eliminated, during either this recession or the milder one that preceded it.
The pace, shape, and distribution of the global recovery from this recession is unclear. Each nation’s policy choices on the economy, trade, technology, industry, immigration, environment and education will affect the trajectory of the global economy and the place of each nation and its trading partners in that economy. The choices each nation implements, between austerity and stimulus, between protectionism and market opening, have not yet been determined by their political processes, may change over time and will have a major influence on the future economy. The risks of a major Eurozone disruption and the Chinese response to recent deceleration in their economy are only the most recent of what is likely to be an evolving list of uncertain major economic influences.
On top of those concerns is layered the potential change resulting from possible climate change events (regardless of cause). The direct economic consequences can be significant, both through acute events like major storms and through more frequent chronic events like droughts. Beyond the direct effects, the global economy will be affected by demographic and political reactions to those events.
Washington’s significant national and international economic roles put it in a relatively strong position in comparison to many other states in terms of weathering negative economic developments. However, the same web of connections means that negative events elsewhere will definitely have consequences for Washington.
Some overall trends such as technological change, the increased importance of international trade, and the increasing premium on skills and flexibility in the labor force are almost certain to continue. However, which industries, labor markets and activities are likely to be most heavily impacted by those trends is much harder to forecast. As the past decades have demonstrated, these forces generate significant social stresses. This pattern is likely to continue. There will inevitably be responses through the political systems of states and

High Skills High Wages 2012 - Chapter 1—Tomorrow’s Economy
Page 26
nations to these stresses, responses that will have consequences for the economy.
Through this period, there will still be a need to pursue policies and practices that enable workers to acquire skills that are in demand in the market place, systems of improved communication between employers, training providers and workers about the evolving demands for skills in the workforce, and planning and policies that support flexibility in both the capacity and the content of the education and training system to enable Washington economy to respond effectively to circumstances that may change in relatively unpredictable ways.
This report is part of the High Skills, High Wages 2012 – 2022 – Washington’s strategic plan for workforce development. For other components of this report, please see: www.wtb.wa.gov/highskills2012.asp