Embed Size (px)
Citation preview
Asia Pan-Asia Strategy
2 August 2011
Asia Equities Daily Focus Today's research headlines Asian Edition
Deutsche Bank AG/Hong Kong
All prices are those current at the end of the previous trading session unless otherwise indicated. Prices are sourced from local exchanges via Reuters, Bloomberg and other vendors. Data is sourced from Deutsche Bank and subject companies. Deutsche Bank does and seeks to do business with companies covered in its research reports. Thus, investors should be aware that the firm may have a conflict of interest that could affect the objectivity of this report. Investors should consider this report as only a single factor in making their investment decision. DISCLOSURES AND ANALYST CERTIFICATIONS ARE LOCATED IN APPENDIX 1. MICA(P) 146/04/2011.
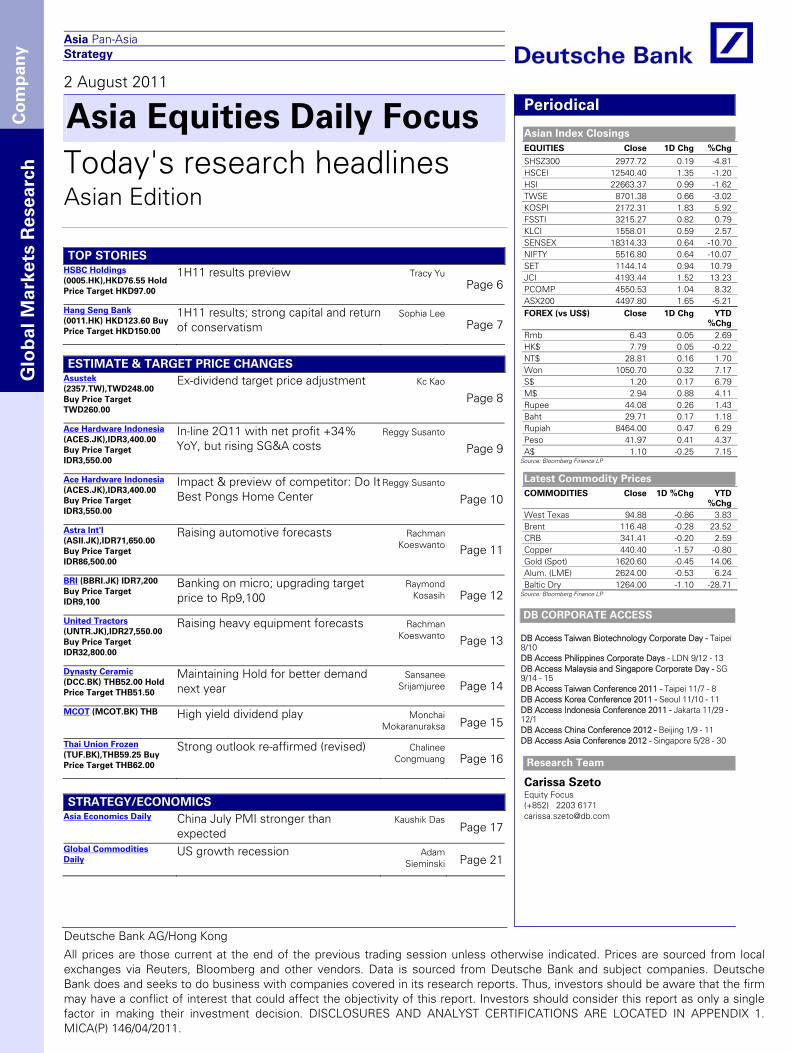
Periodical
Asian Index Closings EQUITIES Close 1D Chg %Chg
SHSZ300 2977.72 0.19 -4.81 HSCEI 12540.40 1.35 -1.20 HSI 22663.37 0.99 -1.62 TWSE 8701.38 0.66 -3.02 KOSPI 2172.31 1.83 5.92 FSSTI 3215.27 0.82 0.79 KLCI 1558.01 0.59 2.57 SENSEX 18314.33 0.64 -10.70 NIFTY 5516.80 0.64 -10.07 SET 1144.14 0.94 10.79 JCI 4193.44 1.52 13.23 PCOMP 4550.53 1.04 8.32 ASX200 4497.80 1.65 -5.21 FOREX (vs US$) Close 1D Chg YTD %Chg Rmb 6.43 0.05 2.69 HK$ 7.79 0.05 -0.22 NT$ 28.81 0.16 1.70 Won 1050.70 0.32 7.17 S$ 1.20 0.17 6.79 M$ 2.94 0.88 4.11 Rupee 44.08 0.26 1.43 Baht 29.71 0.17 1.18 Rupiah 8464.00 0.47 6.29 Peso 41.97 0.41 4.37 A$ 1.10 -0.25 7.15
Source: Bloomberg Finance LP
Latest Commodity Prices COMMODITIES Close 1D %Chg YTD %Chg West Texas 94.88 -0.86 3.83 Brent 116.48 -0.28 23.52 CRB 341.41 -0.20 2.59 Copper 440.40 -1.57 -0.80 Gold (Spot) 1620.60 -0.45 14.06 Alum. (LME) 2624.00 -0.53 6.24 Baltic Dry 1264.00 -1.10 -28.71
Source: Bloomberg Finance LP
DB CORPORATE ACCESS
DB Access Taiwan Biotechnology Corporate Day - Taipei 8/10 DB Access Philippines Corporate Days - LDN 9/12 - 13 DB Access Malaysia and Singapore Corporate Day - SG 9/14 - 15 DB Access Taiwan Conference 2011 - Taipei 11/7 - 8 DB Access Korea Conference 2011 - Seoul 11/10 - 11 DB Access Indonesia Conference 2011 - Jakarta 11/29 - 12/1 DB Access China Conference 2012 - Beijing 1/9 - 11 DB Access Asia Conference 2012 - Singapore 5/28 - 30
Research Team
Carissa Szeto Equity Focus (+852) 2203 6171 [email protected]
Co
mp
any
Glo
bal
Mar
kets
Res
earc
h
TOP STORIES HSBC Holdings (0005.HK),HKD76.55 Hold Price Target HKD97.00
1H11 results preview Tracy YuPage 6
Hang Seng Bank (0011.HK) HKD123.60 Buy Price Target HKD150.00
1H11 results; strong capital and return of conservatism
Sophia LeePage 7
ESTIMATE & TARGET PRICE CHANGES
Asustek (2357.TW),TWD248.00 Buy Price Target TWD260.00
Ex-dividend target price adjustment Kc Kao
Page 8
Ace Hardware Indonesia (ACES.JK),IDR3,400.00 Buy Price Target IDR3,550.00
In-line 2Q11 with net profit +34% YoY, but rising SG&A costs
Reggy Susanto
Page 9
Ace Hardware Indonesia (ACES.JK),IDR3,400.00 Buy Price Target IDR3,550.00
Impact & preview of competitor: Do It Best Pongs Home Center
Reggy Susanto
Page 10
Astra Int'l (ASII.JK),IDR71,650.00 Buy Price Target IDR86,500.00
Raising automotive forecasts Rachman Koeswanto Page 11
BRI (BBRI.JK) IDR7,200 Buy Price Target IDR9,100
Banking on micro; upgrading target price to Rp9,100
Raymond Kosasih Page 12
United Tractors (UNTR.JK),IDR27,550.00 Buy Price Target IDR32,800.00
Raising heavy equipment forecasts Rachman Koeswanto Page 13
Dynasty Ceramic (DCC.BK) THB52.00 Hold Price Target THB51.50
Maintaining Hold for better demand next year
Sansanee Srijamjuree Page 14
MCOT (MCOT.BK) THB High yield dividend play Monchai Mokaranuraksa Page 15
Thai Union Frozen (TUF.BK),THB59.25 Buy Price Target THB62.00
Strong outlook re-affirmed (revised) Chalinee Congmuang Page 16
STRATEGY/ECONOMICS
Asia Economics Daily China July PMI stronger than expected
Kaushik DasPage 17
Global Commodities Daily
US growth recession Adam Sieminski Page 21
2 August 2011 Strategy Asia Equities Daily Focus
Page 2 Deutsche Bank AG/Hong Kong
ADDITIONAL RESEARCH DB CONFERENCE/CORPORATE DAY
DB Access Taiwan Biotechnology Corporate Day - Taipei 8/10
China TMT Daily More app factoids; also, SINA, 0700.HK
Alan Hellawell III
Page 23DB Access Philippines Corporate Days - LDN 9/12 - 13
Alternative Energy China announced a national on-grid tariff for solar PV
Eric ChengPage 24
DB Access Malaysia and Singapore Corporate Day - SG 9/14 - 15 DB Access Taiwan Conference 2011 - Taipei 11/7 - 8
China Prop Weekly Monitor
Sales volume continue to rebound in Tier-1 cities
Tony TsangPage 25
DB Access Korea Conference 2011 - Seoul 11/10 - 11 DB Access Indonesia Conference 2011 - Jakarta 11/29 - 12/1 DB Access China Conference 2012 - Beijing 1/9 - 11 Mandarin Oriental
(MOIL.SI),USD2.10 Hold NA
Solid 1H11 results Karen TangPage 26 D B Access Asia Conference 2012 - Singapore 5/28 - 30
NDRs Sohu.com Inc (SOHU.OQ) USD90.10 Hold NA
2Q beat; 3Q margin weak Alex YaoPage 27
Singapore Exchange (SGX:SP) - SG 8/3 Indocement Tunggal Prakarsa (INTP IJ) - SG 8/3 Pacific Basin (2343 HK) - HK 8/4 - 5 SAP AG (SAPG DE) - HK 8/4, SG 8/5, KUL 8/8 WPG Holdings
(3702.TW),TWD51.50 Buy Price Target TWD62.00
Solid 2Q11 results and 3Q11 outlook Jessica ChangPage 28
Hutchison Whampoa (0013 HK) - HK 8/5 China Overseas Grand Oceans Group (0081 HK) - HK 8/5Hutchison Port Holdings Trust (HPHT SP) - HK 8/8 Lifestyle International Holdings (1212HK) - HK 8/9 -10 Dongbu Insurance
(005830.KS),KRW53,700.00 Buy Price Target KRW68,000.00
Strong fundamentals lead the industry Francis Yim
Page 29Pearson Plc (PSON LN) - SHA 8/10, PEK 8/11, HK 8/12 China Overseas Land Investment Ltd (688 HK) - HK 8/10 & 12 Lianhua Supermarket (980HK) - Conf. call 8/11 PT Kalbe Farma (KLBF IJ) - HK 8/11 - 12 SJM Holdings (0880 HK) - HK 8/11 - 12
Hyundai E&C (000720.KS),KRW85,500.00 Buy Price Target KRW110,000.00
Buy on Street's misunderstanding for 2Q
Sanghi Han
Page 30 NEW: PCCW (0008 HK) - HK 8/15 - 16, SG 8/19 ComfortDelGro Corporation - SG 8/16 CapitaMalls Asia (CMA SP) - HK 8/18 - 19 China State Construction Int'l Holdings (3311 HK) - HK 8/22 PT Charoen Pokphand Indonesia (CPIN IJ) - SG 8/23
Korea Autos Carmakers' domestic sales up 6%, global sales up 10% YoY
Sanjeev RanaPage 31
LIG Insurance (002550.KS),KRW27,050.00 Buy Price Target KRW31,000.00
JunQ11 results; Good progress in recovery
Francis Yim
Page 32
Marine LNG ship prices going up, Buy DSME
China Longyuan Power (0916 HK) - HK 8/25 Franshion Properties - SG 8/25 - 26 China Rongsheng Heavy Industries Group (1101 HK) - SG 9/1 - 2 AIA Group Ltd (1299 HK) - SG 9/13
Sanjeev RanaPage 33
Meritz Fire & Marine (000060.KS),KRW12,100.00 Hold Price Target KRW9,500.00
Decent JunQ11 results
P T Summarecon Agung (SMRA IJ) - HK 9/26
DB ANALYST/SALES ROADSHOWS Francis Yim
Page 34
POSCO (005490.KS) KRW471,500 Buy Price Target KRW640,000
Indonesia site tour; paving the way for growth
Eugene Yeoh: 2H11 Small Mid Cap - SG 8/2 James Kan & Johnson Wan : HK/China Coal & Cement - PEK 8/3 - 4, SHA 8/5 Joelian Tseng : Taiwan Market - HK 8/4 - 5, SG 8/15 -16Judy Zhang : China Banking - SHA 8/10
Chanwook Park Page 35
Samsung F&M (000810.KS),KRW239,500.00 Buy Price Target KRW280,000.00
Strong JunQ11 results
NEW: Abhay Laijawala: India Strategy/Metals & Minings - SG 8/11 - 12 John Kim : Korean Telecommunications - HK 8/18
Francis Yim
Page 36
Bharat Forge Limited (BFRG.BO),INR315.80 Buy Price Target INR400.00
Mining ban could impact Bharat Forge's steel supplies
DB INTERNATIONAL PRODUCT ROADSHOWS
BAE Systems PLC (BA LN) - SG 8/2 Ben Fidler: Aerospace & Defence - HK 8/11, SG 8/12
Amyn Pirani
Page 37
Bharti Airtel Limited (BRTI.BO) INR440.25 Buy Price Target INR460.00
1QFY12 preview: watch for three data points
Reinaldo Santana & Renata Coutinho: LatAm Retail - SG 8/29, HK 8/30, PEK 8/31, SEL 9/1 Matt Spick: Banks Northern Europe - SG 9/1 Elaine Dunphy: Pan European Oil & Gas - HK 9/14, SG 9/15 Warwick Okines : UK Retailers General - SG 9/16
Srinivas RaoPage 38
Grasim (GRAS.BO) INR2,195.20 Buy Price Target INR2,379.00
Are VSF prices stabilizing? Chockalingam Narayanan Page 39
Idea Cellular Limited (IDEA.BO),INR98.25 Hold Price Target INR70.00
1QFY12: A significant beat at operating level
Srinivas RaoPage 40
Mahindra & Mahindra (MAHM.BO),INR730.55 Buy Price Target INR780.00
July 2011 volumes: strong numbers; unlike its peers
Srinivas Rao
Page 41
Maruti Suzuki Limited (MRTI.BO),INR1,208.75 Hold Price Target INR1,250.00
July 2011: soft volume streak continues
Srinivas Rao
Page 42
2 August 2011 Strategy Asia Equities Daily Focus
Deutsche Bank AG/Hong Kong Page 3
ADDITIONAL RESEARCH (cont’) Shree Cement (SHCM.BO) INR1,789.60 Hold Price Target INR1,712.00
Low pricing power with North Indian cement players-how long?
Chockalingam Narayanan Page 43
Steel Authority of India (SAIL.BO),INR119.95 Buy Price Target INR185.00
1Q'FY12 - Earnings disappoint on higher costs
Abhay Laijawala Page 44
Tata Motors Ltd (TAMO.BO) INR960.30 Buy Price Target INR1,365.00
July 2011: another month of slowdown in heavy truck volumes
Srinivas Rao
Page 45
TVS Motor (TVSM.BO),INR53.45 Buy Price Target INR70.00
1QFY12: results better than expected; maintain Buy
Amyn PiraniPage 46
TVS Motor (TVSM.BO),INR53.45 Buy Price Target INR70.00
July 2011: three-wheeler volumes lower than expected
Amyn PiraniPage 47
Agung Podomoro Land (APLN.JK),IDR390.00 Buy Price Target IDR440.00
1H11 Strong Results Raymond Kosasih Page 48
Gajah Tunggal (GJTL.JK),IDR3,125.00 Buy Price Target IDR3,400.00
Weak 2Q11 results as expected Nicholas Nugroho Page 49
Harum Energy (HRUM.JK) IDR9,700 Buy Price Target IDR11,000
2Q11 results; still largely tracking our forecast
Cherie KhoengPage 50
Telkom (TLKM.JK),IDR7,500.00 Buy Price Target IDR8,500.00
2Q11 results : Gaining traction Raymond Kosasih Page 51
International Container (ICT.PS),PHP56.00 Buy Price Target PHP56.00
Withdraws takeover bid for Portek Klyne ResullarPage 52
SM Prime Holdings (SMPH.PS),PHP11.58 Hold Price Target PHP12.84
1H11 net profit up 14%, generally in line
Carl Sy
Page 53
Krung Thai Bank (KTB.BK),THB20.90 Buy Price Target THB25.00
KTB analyst meeting - affirmed positive outlook intact
Worawat Saisuphatphol Page 54
GLOBAL RESEARCH Pioneer (6773.T),¥413 Buy Price Target ¥530
Targeting renewed growth; upgrading rating to Buy (revised)
Yasuo NakanePage 55
Honda Motor (7267.T),¥3,125 Buy Price Target ¥4,150
1Q initial impression: a good "bad" quarter
Kurt SangerPage 56
Fanuc (6954.T),¥15,280 Buy Price Target ¥17,300
Results reaffirm competitiveness: OPM nears Keyence (raising TP)
Toshiharu Morota Page 57
The notes and reports contained in this Daily are all excerpts of previously published documents. Please refer to the published notes on our web site for details on risks, valuations and earnings changes
2 August 2011 Strategy Asia Equities Daily Focus
Page 4 Deutsche Bank AG/Hong Kong
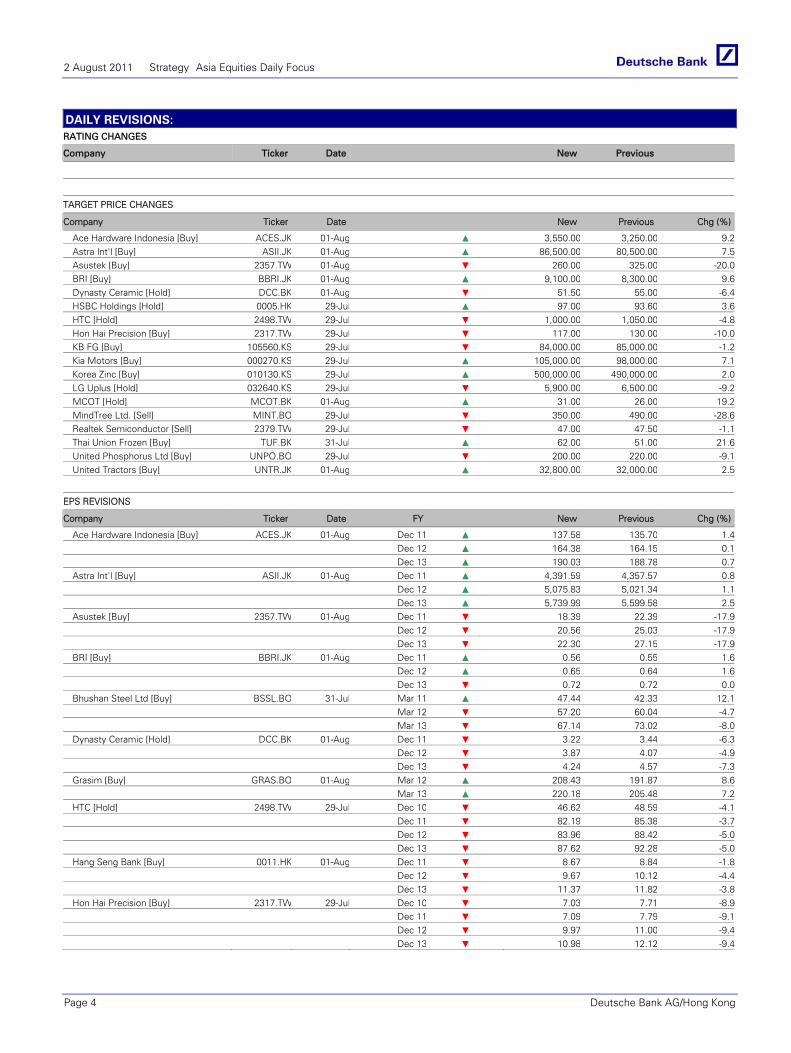
DAILY REVISIONS: RATING CHANGES
Company Ticker Date New Previous
TARGET PRICE CHANGES
Company Ticker Date New Previous Chg (%)
Ace Hardware Indonesia [Buy] ACES.JK 01-Aug ▲ 3,550.00 3,250.00 9.2Astra Int'l [Buy] ASII.JK 01-Aug ▲ 86,500.00 80,500.00 7.5Asustek [Buy] 2357.TW 01-Aug ▼ 260.00 325.00 -20.0BRI [Buy] BBRI.JK 01-Aug ▲ 9,100.00 8,300.00 9.6Dynasty Ceramic [Hold] DCC.BK 01-Aug ▼ 51.50 55.00 -6.4HSBC Holdings [Hold] 0005.HK 29-Jul ▲ 97.00 93.60 3.6HTC [Hold] 2498.TW 29-Jul ▼ 1,000.00 1,050.00 -4.8Hon Hai Precision [Buy] 2317.TW 29-Jul ▼ 117.00 130.00 -10.0KB FG [Buy] 105560.KS 29-Jul ▼ 84,000.00 85,000.00 -1.2Kia Motors [Buy] 000270.KS 29-Jul ▲ 105,000.00 98,000.00 7.1Korea Zinc [Buy] 010130.KS 29-Jul ▲ 500,000.00 490,000.00 2.0LG Uplus [Hold] 032640.KS 29-Jul ▼ 5,900.00 6,500.00 -9.2MCOT [Hold] MCOT.BK 01-Aug ▲ 31.00 26.00 19.2MindTree Ltd. [Sell] MINT.BO 29-Jul ▼ 350.00 490.00 -28.6Realtek Semiconductor [Sell] 2379.TW 29-Jul ▼ 47.00 47.50 -1.1Thai Union Frozen [Buy] TUF.BK 31-Jul ▲ 62.00 51.00 21.6United Phosphorus Ltd [Buy] UNPO.BO 29-Jul ▼ 200.00 220.00 -9.1United Tractors [Buy] UNTR.JK 01-Aug ▲ 32,800.00 32,000.00 2.5
EPS REVISIONS
Company Ticker Date FY New Previous Chg (%)
Ace Hardware Indonesia [Buy] ACES.JK 01-Aug Dec 11 ▲ 137.58 135.70 1.4 Dec 12 ▲ 164.38 164.15 0.1 Dec 13 ▲ 190.03 188.78 0.7Astra Int'l [Buy] ASII.JK 01-Aug Dec 11 ▲ 4,391.59 4,357.57 0.8 Dec 12 ▲ 5,075.83 5,021.34 1.1 Dec 13 ▲ 5,739.99 5,599.58 2.5Asustek [Buy] 2357.TW 01-Aug Dec 11 ▼ 18.39 22.39 -17.9 Dec 12 ▼ 20.56 25.03 -17.9 Dec 13 ▼ 22.30 27.15 -17.9BRI [Buy] BBRI.JK 01-Aug Dec 11 ▲ 0.56 0.55 1.6 Dec 12 ▲ 0.65 0.64 1.6 Dec 13 ▼ 0.72 0.72 0.0Bhushan Steel Ltd [Buy] BSSL.BO 31-Jul Mar 11 ▲ 47.44 42.33 12.1 Mar 12 ▼ 57.20 60.04 -4.7 Mar 13 ▼ 67.14 73.02 -8.0Dynasty Ceramic [Hold] DCC.BK 01-Aug Dec 11 ▼ 3.22 3.44 -6.3 Dec 12 ▼ 3.87 4.07 -4.9 Dec 13 ▼ 4.24 4.57 -7.3Grasim [Buy] GRAS.BO 01-Aug Mar 12 ▲ 208.43 191.87 8.6 Mar 13 ▲ 220.18 205.48 7.2HTC [Hold] 2498.TW 29-Jul Dec 10 ▼ 46.62 48.59 -4.1 Dec 11 ▼ 82.19 85.38 -3.7 Dec 12 ▼ 83.96 88.42 -5.0 Dec 13 ▼ 87.62 92.28 -5.0Hang Seng Bank [Buy] 0011.HK 01-Aug Dec 11 ▼ 8.67 8.84 -1.8 Dec 12 ▼ 9.67 10.12 -4.4 Dec 13 ▼ 11.37 11.82 -3.8Hon Hai Precision [Buy] 2317.TW 29-Jul Dec 10 ▼ 7.03 7.71 -8.9 Dec 11 ▼ 7.09 7.79 -9.1 Dec 12 ▼ 9.97 11.00 -9.4 Dec 13 ▼ 10.98 12.12 -9.4
2 August 2011 Strategy Asia Equities Daily Focus
Deutsche Bank AG/Hong Kong Page 5
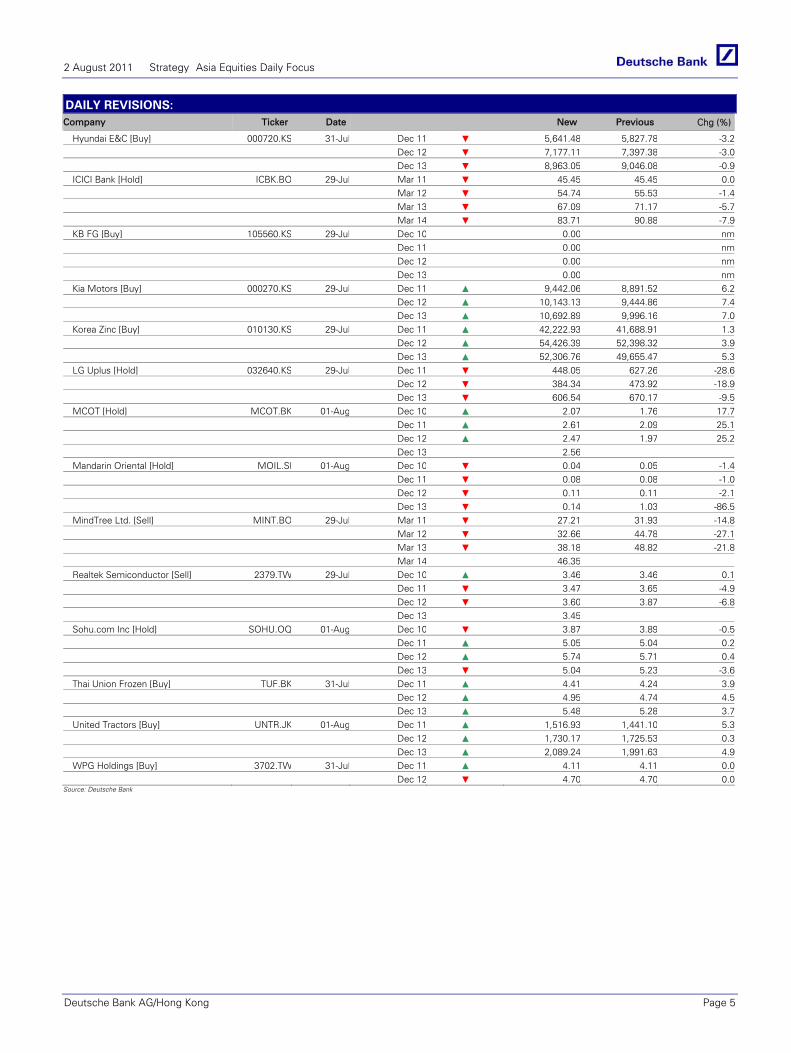
DAILY REVISIONS: Company Ticker Date New Previous Chg (%)
Hyundai E&C [Buy] 000720.KS 31-Jul Dec 11 ▼ 5,641.48 5,827.78 -3.2 Dec 12 ▼ 7,177.11 7,397.38 -3.0 Dec 13 ▼ 8,963.05 9,046.08 -0.9ICICI Bank [Hold] ICBK.BO 29-Jul Mar 11 ▼ 45.45 45.45 0.0 Mar 12 ▼ 54.74 55.53 -1.4 Mar 13 ▼ 67.09 71.17 -5.7 Mar 14 ▼ 83.71 90.88 -7.9KB FG [Buy] 105560.KS 29-Jul Dec 10 0.00 nm Dec 11 0.00 nm Dec 12 0.00 nm Dec 13 0.00 nmKia Motors [Buy] 000270.KS 29-Jul Dec 11 ▲ 9,442.06 8,891.52 6.2 Dec 12 ▲ 10,143.13 9,444.86 7.4 Dec 13 ▲ 10,692.89 9,996.16 7.0Korea Zinc [Buy] 010130.KS 29-Jul Dec 11 ▲ 42,222.93 41,688.91 1.3 Dec 12 ▲ 54,426.39 52,398.32 3.9 Dec 13 ▲ 52,306.76 49,655.47 5.3LG Uplus [Hold] 032640.KS 29-Jul Dec 11 ▼ 448.05 627.26 -28.6 Dec 12 ▼ 384.34 473.92 -18.9 Dec 13 ▼ 606.54 670.17 -9.5MCOT [Hold] MCOT.BK 01-Aug Dec 10 ▲ 2.07 1.76 17.7 Dec 11 ▲ 2.61 2.09 25.1 Dec 12 ▲ 2.47 1.97 25.2 Dec 13 2.56 Mandarin Oriental [Hold] MOIL.SI 01-Aug Dec 10 ▼ 0.04 0.05 -1.4 Dec 11 ▼ 0.08 0.08 -1.0 Dec 12 ▼ 0.11 0.11 -2.1 Dec 13 ▼ 0.14 1.03 -86.5MindTree Ltd. [Sell] MINT.BO 29-Jul Mar 11 ▼ 27.21 31.93 -14.8 Mar 12 ▼ 32.66 44.78 -27.1 Mar 13 ▼ 38.18 48.82 -21.8 Mar 14 46.35 Realtek Semiconductor [Sell] 2379.TW 29-Jul Dec 10 ▲ 3.46 3.46 0.1 Dec 11 ▼ 3.47 3.65 -4.9 Dec 12 ▼ 3.60 3.87 -6.8 Dec 13 3.45 Sohu.com Inc [Hold] SOHU.OQ 01-Aug Dec 10 ▼ 3.87 3.89 -0.5 Dec 11 ▲ 5.05 5.04 0.2 Dec 12 ▲ 5.74 5.71 0.4 Dec 13 ▼ 5.04 5.23 -3.6Thai Union Frozen [Buy] TUF.BK 31-Jul Dec 11 ▲ 4.41 4.24 3.9 Dec 12 ▲ 4.95 4.74 4.5 Dec 13 ▲ 5.48 5.28 3.7United Tractors [Buy] UNTR.JK 01-Aug Dec 11 ▲ 1,516.93 1,441.10 5.3 Dec 12 ▲ 1,730.17 1,725.53 0.3 Dec 13 ▲ 2,089.24 1,991.63 4.9WPG Holdings [Buy] 3702.TW 31-Jul Dec 11 ▲ 4.11 4.11 0.0 Dec 12 ▼ 4.70 4.70 0.0
Source: Deutsche Bank

Asia Hong Kong Banking/Finance Banks
29 July 2011
HSBC Holdings Reuters: 0005.HK Bloomberg: 5 HK Exchange: HKG Ticker: 0005
1H11 results preview
Tracy Yu Research Analyst (+852) 2203 6191 [email protected]
Jason Napier, CFA Research Analyst (+44) 20 754-74433 [email protected]
Sophia Lee, CFA Research Analyst (+852) 2203 6226 [email protected]
9.15am UK time, 4.15pm HK time, Monday 1 Aug 2011 HSBC reports results at 9.15am UK time or 4.15pm HK time on Mon 1 Aug. We expect PBT ex debt FV of US$11bn, or US$5.5bn for 2Q11 in line with 1Q11. We forecast core tier 1 ratio of 11.0%, EPS and DPS of 19cps and 9cps. We have cut our expectations for loan losses (Asia and North America) and the group tax rate, seeing our 11e, 12e and 13e EPS upgraded by 13%, 5% and 5% respectively. Our SOTP-driven target price rises to HK$97.0 from HK$93.6. We maintain our Hold rating as we expect HSBC to perform in line with MSCI Asia-ex JP Fin Index.
Forecasts and ratios
Year End Dec 31 2009A 2010A 2011E 2012E 2013E
Net profit (USDm) 12,187.8 15,854.4 17,708.0 19,934.9 22,304.9
EPS (USD) 0.34 0.73 0.90 1.05 1.16
EPS growth (%) -39.4 21.1 8.7 10.2 9.6
PER (x) 33.7 14.0 11.1 9.4 8.6
Price/book (x) 1.56 1.28 1.18 1.12 1.05
DPS (net) (USD) 0.34 0.36 0.40 0.44 0.48
Yield (net) (%) 3.7 3.5 4.1 4.5 4.8
ROE (%) 5.1 9.4 10.9 12.2 12.7Source: Deutsche Bank estimates, company data
1 DB EPS is fully diluted and excludes non-recurring items 2 Multiples and yields calculations use average historical prices for past years and spot prices for current and future years, except P/B which uses the year end close
Results
Hold Price at 28 Jul 2011 (HKD) 77.35Price target - 12mth (HKD) 97.0052-week range (HKD) 91.75 - 74.75HANG SENG INDEX 22,571
Key changes
Price target 93.60 to 97.00 3.6%Provisioning (FYE) 12,088.6 to 10,914.9 -9.7%Net int margin (FYE) 2.61 to 2.55 -2.4%Net profit (FYE) 14,876.9 to 15,993.2 7.5%
Price/price relative
60
70
80
90
100
7/09 10/09 1/10 4/10 7/10 10/10 1/11 4/11HSBC Holdings
HANG SENG INDEX (Rebased)
Performance (%) 1m 3m 12mAbsolute 2.5 -8.4 -4.4HANG SENG INDEX 2.3 -5.2 7.0
Stock data
Market cap (HKDm) 1,395,385Market cap (USDm) 179,071Shares outstanding (m) 17,756.4Major shareholders –Free float (%) 100Avg daily value traded (USDm) 214.9
Key indicators (FY1)
ROE (%) 10.9Loan/deposit ratio (%) 78.0Book value/share (USD) 8.39Price/book (x) 1.2NPL/total loans (%) 3.3Net int margin (%) 2.55
Margin, loan losses, costs, restructuring and run-off With HSBC's liquid balance sheet and capital strength taken for granted, we expect the focus on results day to be (i) net interest margin (stable through last year ex-BSM – will very rapid loan growth YTD see this lower in 2Q11?), credit quality (sustainability of low losses in high-book-growth Asia, trajectory for improvement in NA), and group restructuring (cost and breadth of cost cutting, magnitude of sold earnings in US cards and other non-core businesses).
Lower impairments, tax rate drives EPS upgrade, TP to HK$97.0, Hold Lower loan losses and lower tax rate in particular, see our 11e, 12e and 13e adj. EPS estimates rise by 13%, 5% and 5%. This leaves HSBC trading at 9.3x 2012 and 1.5x 2011 TNAV, as shown in Figure 6. Our target price is derived by sum of the parts, and increases to HK$97.0 from HK$93.6 driven by the EPS upgrades. We maintain our Hold rating on the stock as the strong business prospects in Asia are offset by growth concerns in the western markets.
Valuation and risks Our TP is derived by sum of the parts, and increases to HK$97.0 from HK$93.6 driven by the EPS upgrades. Share price upside risk derives from better than expected top line momentum, most likely driven by global markets or interest rate sensitivity. Downside risk derives from rising loan losses and weaker than expected margin and cost conditions in PFS and GBM in particular. (See page 6 for details).
2 August 2011 Strategy Asia Equities Daily Focus
Page 6 Deutsche Bank AG/Hong Kong
Asia Hong Kong Banking/Finance Banks
1 August 2011
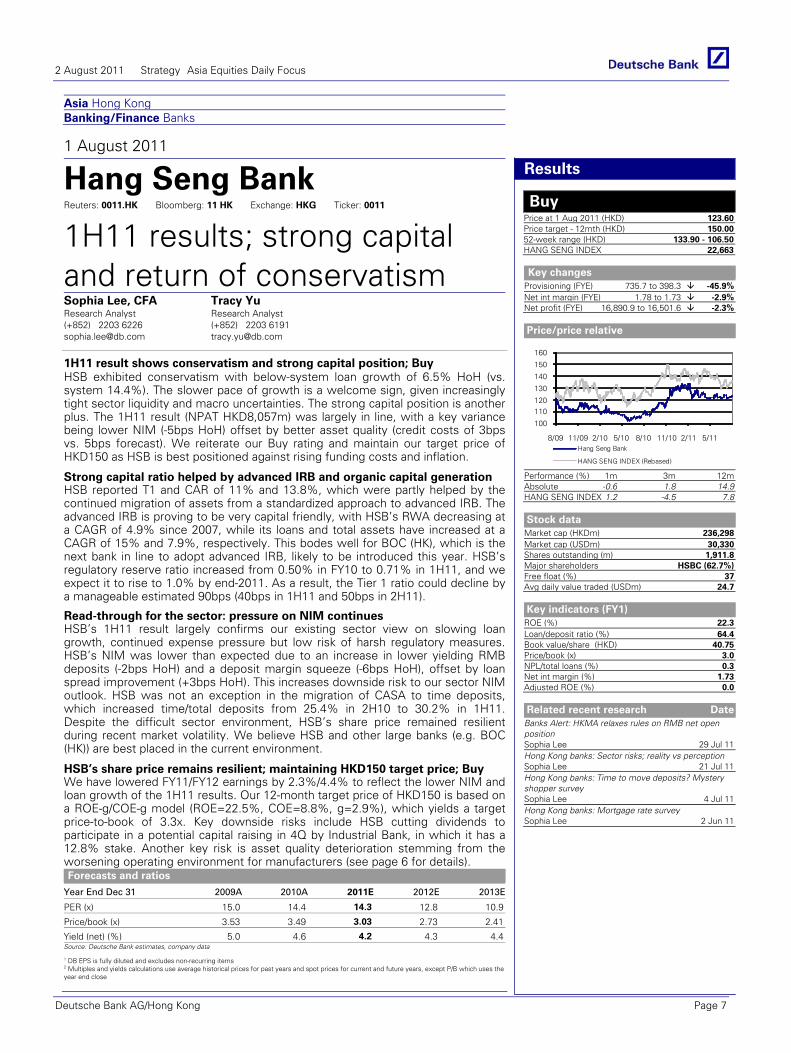
Hang Seng Bank Reuters: 0011.HK Bloomberg: 11 HK Exchange: HKG Ticker: 0011
1H11 results; strong capital and return of conservatismSophia Lee, CFA Research Analyst (+852) 2203 6226 [email protected]
Tracy Yu Research Analyst (+852) 2203 6191 [email protected]
1H11 result shows conservatism and strong capital position; Buy HSB exhibited conservatism with below-system loan growth of 6.5% HoH (vs. system 14.4%). The slower pace of growth is a welcome sign, given increasingly tight sector liquidity and macro uncertainties. The strong capital position is another plus. The 1H11 result (NPAT HKD8,057m) was largely in line, with a key variance being lower NIM (-5bps HoH) offset by better asset quality (credit costs of 3bps vs. 5bps forecast). We reiterate our Buy rating and maintain our target price of HKD150 as HSB is best positioned against rising funding costs and inflation.
Forecasts and ratios
Year End Dec 31 2009A 2010A 2011E 2012E 2013E
PER (x) 15.0 14.4 14.3 12.8 10.9
Price/book (x) 3.53 3.49 3.03 2.73 2.41
Yield (net) (%) 5.0 4.6 4.2 4.3 4.4Source: Deutsche Bank estimates, company data
1 DB EPS is fully diluted and excludes non-recurring items 2 Multiples and yields calculations use average historical prices for past years and spot prices for current and future years, except P/B which uses the year end close
Results
Buy Price at 1 Aug 2011 (HKD) 123.60Price target - 12mth (HKD) 150.0052-week range (HKD) 133.90 - 106.50HANG SENG INDEX 22,663
Key changes
Provisioning (FYE) 735.7 to 398.3 -45.9%Net int margin (FYE) 1.78 to 1.73 -2.9%Net profit (FYE) 16,890.9 to 16,501.6 -2.3%
Price/price relative
100
110120
130
140
150
160
8/09 11/09 2/10 5/10 8/10 11/10 2/11 5/11Hang Seng Bank
HANG SENG INDEX (Rebased)
Performance (%) 1m 3m 12mAbsolute -0.6 1.8 14.9HANG SENG INDEX 1.2 -4.5 7.8
Stock data
Market cap (HKDm) 236,298Market cap (USDm) 30,330Shares outstanding (m) 1,911.8Major shareholders HSBC (62.7%)Free float (%) 37Avg daily value traded (USDm) 24.7
Key indicators (FY1)
ROE (%) 22.3Loan/deposit ratio (%) 64.4Book value/share (HKD) 40.75Price/book (x) 3.0NPL/total loans (%) 0.3Net int margin (%) 1.73Adjusted ROE (%) 0.0
Related recent research Date
Banks Alert: HKMA relaxes rules on RMB net open position Sophia Lee 29 Jul 11Hong Kong banks: Sector risks; reality vs perception Sophia Lee 21 Jul 11Hong Kong banks: Time to move deposits? Mystery shopper survey Sophia Lee 4 Jul 11Hong Kong banks: Mortgage rate survey Sophia Lee 2 Jun 11
Strong capital ratio helped by advanced IRB and organic capital generation HSB reported T1 and CAR of 11% and 13.8%, which were partly helped by the continued migration of assets from a standardized approach to advanced IRB. The advanced IRB is proving to be very capital friendly, with HSB’s RWA decreasing at a CAGR of 4.9% since 2007, while its loans and total assets have increased at a CAGR of 15% and 7.9%, respectively. This bodes well for BOC (HK), which is the next bank in line to adopt advanced IRB, likely to be introduced this year. HSB’s regulatory reserve ratio increased from 0.50% in FY10 to 0.71% in 1H11, and we expect it to rise to 1.0% by end-2011. As a result, the Tier 1 ratio could decline by a manageable estimated 90bps (40bps in 1H11 and 50bps in 2H11).
Read-through for the sector: pressure on NIM continues HSB’s 1H11 result largely confirms our existing sector view on slowing loan growth, continued expense pressure but low risk of harsh regulatory measures. HSB’s NIM was lower than expected due to an increase in lower yielding RMB deposits (-2bps HoH) and a deposit margin squeeze (-6bps HoH), offset by loan spread improvement (+3bps HoH). This increases downside risk to our sector NIM outlook. HSB was not an exception in the migration of CASA to time deposits, which increased time/total deposits from 25.4% in 2H10 to 30.2% in 1H11. Despite the difficult sector environment, HSB’s share price remained resilient during recent market volatility. We believe HSB and other large banks (e.g. BOC (HK)) are best placed in the current environment.
HSB’s share price remains resilient; maintaining HKD150 target price; Buy We have lowered FY11/FY12 earnings by 2.3%/4.4% to reflect the lower NIM and loan growth of the 1H11 results. Our 12-month target price of HKD150 is based on a ROE-g/COE-g model (ROE=22.5%, COE=8.8%, g=2.9%), which yields a target price-to-book of 3.3x. Key downside risks include HSB cutting dividends to participate in a potential capital raising in 4Q by Industrial Bank, in which it has a 12.8% stake. Another key risk is asset quality deterioration stemming from the worsening operating environment for manufacturers (see page 6 for details).
2 August 2011 Strategy Asia Equities Daily Focus
Deutsche Bank AG/Hong Kong Page 7

Asia TaiwanTechnology Hardware & Equipment
01 Aug 2011 - 08:23:06 AM CST
COMPANY ALERT Forecast Change
Asustek Buy
Ex-dividend target price adjustment
Reuters:2357.TW Exchange:TAI Ticker:2357
Price (TWD) 232.00
Price target (TWD) 260.00
52-week range (TWD) 310.50 -210.00
Market cap (USDm) 5,125
Shares outstanding (m) 752.8
Net debt/equity (%) -38.7
Book value/share (TWD) 154.94
Price/book (x) 1.50
FYE 12/31 2010A 2011E 2012E
Sales(TWDm)
321,251 327,800 374,240
Net Profit(TWDm)
16,487.6 13,975.1 15,621.9
DB EPS(TWD)
7.60 18.39 20.56
PER (x) 33.2 12.6 11.3
Yield (net)(%)
1.5 4.0 4.4
We have adjusted Asustek's target price to NT$260 (from NT$330) to reflectthe change in shares to 760m (from 624m) and 11E-12E EPS changes to NT$18.4-NT$20.6 (from NT$22.4-NT$25) due to the stock dividend issued in3Q11.We do not change our 11E-13E net income estimates or valuationmethod for Asustek.Our NT$260 price target is based on SOTP valuation: NT$218 for Asustek'score business (12x target P/E and 2012E brand EPS of NT$18.2, in line withthe company's mid-cycle valuation), NT$21 for its Pegatron holdings (basedon Asustek's holding of 24% and Pegatron's current share price) and NT$21 for excess cash (based on 35% of Asustek's NT$43bn net cash).Key risks for Asustek include: 1) failure to expand NB market share, owingto less-competitive products and weaker channel relations; 2) higher-than-expected costs associated with new projects (e.g. tablet PC), which couldlead to a lower-than-expected operating margin; 3) higher-than-expectediPad cannibalization effect, which could lead to lower netbook/NB ship-ments; 4) slower-than-expected NB outsourcing trend, which could lead tolower operating margins.
Kc Kao, MBAResearch Analyst(+886) 2 2192 [email protected]
Ivy LeeResearch Analyst(+886) 2 2192 [email protected]
2 August 2011 Strategy Asia Equities Daily Focus
Page 8 Deutsche Bank AG/Hong Kong
Asia ASEAN IndonesiaConsumer Retail/Wholesale Trade
01 Aug 2011 - 08:01:54 AM GMT
COMPANY ALERT Company Update
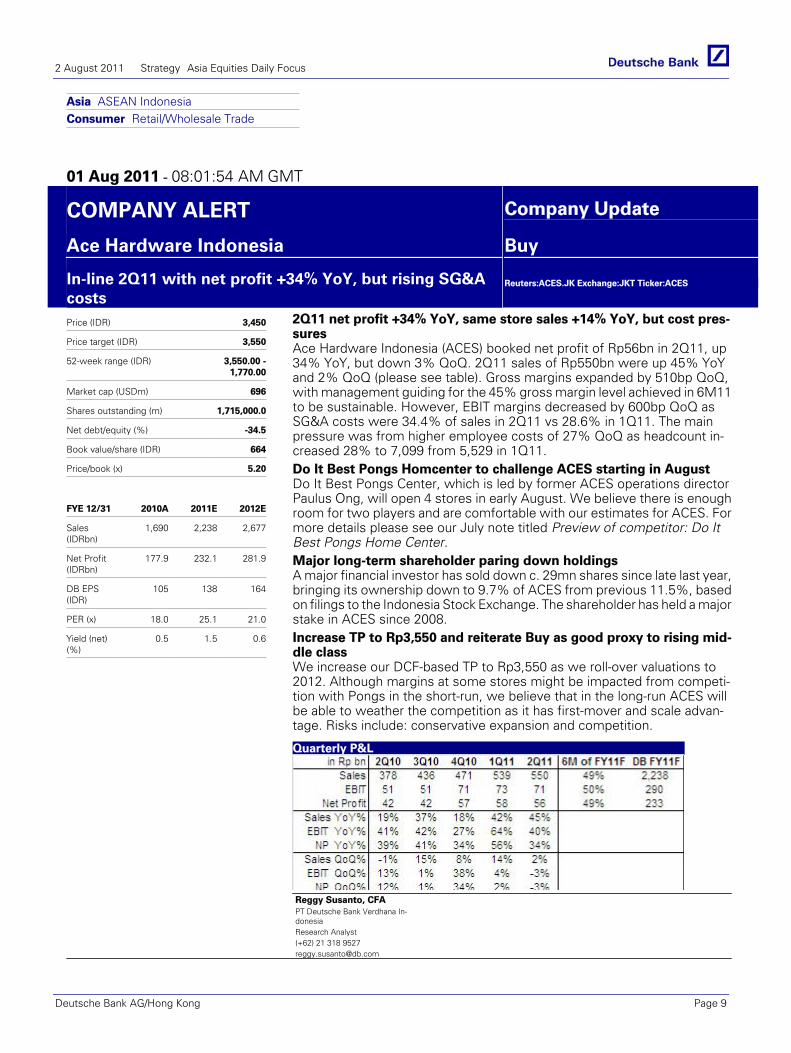
Ace Hardware Indonesia Buy
In-line 2Q11 with net profit +34% YoY, but rising SG&Acosts
Reuters:ACES.JK Exchange:JKT Ticker:ACES
Price (IDR) 3,450
Price target (IDR) 3,550
52-week range (IDR) 3,550.00 -1,770.00
Market cap (USDm) 696
Shares outstanding (m) 1,715,000.0
Net debt/equity (%) -34.5
Book value/share (IDR) 664
Price/book (x) 5.20
FYE 12/31 2010A 2011E 2012E
Sales(IDRbn)
1,690 2,238 2,677
Net Profit(IDRbn)
177.9 232.1 281.9
DB EPS(IDR)
105 138 164
PER (x) 18.0 25.1 21.0
Yield (net)(%)
0.5 1.5 0.6
2Q11 net profit +34% YoY, same store sales +14% YoY, but cost pres-suresAce Hardware Indonesia (ACES) booked net profit of Rp56bn in 2Q11, up34% YoY, but down 3% QoQ. 2Q11 sales of Rp550bn were up 45% YoYand 2% QoQ (please see table). Gross margins expanded by 510bp QoQ,with management guiding for the 45% gross margin level achieved in 6M11to be sustainable. However, EBIT margins decreased by 600bp QoQ asSG&A costs were 34.4% of sales in 2Q11 vs 28.6% in 1Q11. The mainpressure was from higher employee costs of 27% QoQ as headcount in-creased 28% to 7,099 from 5,529 in 1Q11.Do It Best Pongs Homcenter to challenge ACES starting in AugustDo It Best Pongs Center, which is led by former ACES operations directorPaulus Ong, will open 4 stores in early August. We believe there is enoughroom for two players and are comfortable with our estimates for ACES. Formore details please see our July note titled Preview of competitor: Do ItBest Pongs Home Center. Major long-term shareholder paring down holdingsA major financial investor has sold down c. 29mn shares since late last year,bringing its ownership down to 9.7% of ACES from previous 11.5%, basedon filings to the Indonesia Stock Exchange. The shareholder has held a majorstake in ACES since 2008.Increase TP to Rp3,550 and reiterate Buy as good proxy to rising mid-dle classWe increase our DCF-based TP to Rp3,550 as we roll-over valuations to2012. Although margins at some stores might be impacted from competi-tion with Pongs in the short-run, we believe that in the long-run ACES willbe able to weather the competition as it has first-mover and scale advan-tage. Risks include: conservative expansion and competition.
Quarterly P&L
Source: Deutsche Bank and company data
Reggy Susanto, CFAPT Deutsche Bank Verdhana In-donesiaResearch Analyst(+62) 21 318 [email protected]
2 August 2011 Strategy Asia Equities Daily Focus
Deutsche Bank AG/Hong Kong Page 9

Asia ASEAN IndonesiaConsumer Retail/Wholesale Trade
01 Aug 2011 - 09:54:06 AM GMT
COMPANY ALERT Company Update
Ace Hardware Indonesia Buy
Impact & preview of competitor: Do It Best Pongs HomeCenter
Reuters:ACES.JK Exchange:JKT Ticker:ACES
Price (IDR) 3,450
Price target (IDR) 3,550
52-week range (IDR) 3,550.00 -1,770.00
Market cap (USDm) 696
Shares outstanding (m) 1,715,000.0
Net debt/equity (%) -34.5
Book value/share (IDR) 664
Price/book (x) 5.20
FYE 12/31 2010A 2011E 2012E
Sales(IDRbn)
1,690 2,238 2,677
Net Profit(IDRbn)
177.9 232.1 281.9
DB EPS(IDR)
105 138 164
PER (x) 18.0 25.1 21.0
Yield (net)(%)
0.5 1.5 0.6
Preview of Do It Best Pongs Home CenterWe had the privilege of having Paulus Ong, the founder and namesake ofPongs Home Center, give us a preview of his store. Mr. Paulus previouslyspent the past 10 years at Ace Hardware Indonesia, most recently as thedirector in charge of sales operation, distribution and store expansion. Heaims to open 4 Pongs stores in the first week of August and be c. 9% ofACES's store space by year-end. All of the Pongs stores scheduled to beopened will be in a vicinity of an existing ACES store. Pongs aims to open40 stores by 2015 vs the 67 that we expect ACES to have by that time(please see table).However, Mr. Paulus made clear that his aim was to growtogether with ACES, and not to compete aggressively, as he believes thereis enough room for two players.Pongs Home Center to provide "More Brands, More Choices"Pongs's main point of differentiation will be to offer a more diverse rangeof brands than ACES at competitive prices. They will aim to offer 65,000SKUs from 1,000 brands. The product categories will be similar to ACES,but will also include furniture, which is being done by ACES's sister com-pany Informa, and toys, which is being done by ACES's subsidiary ToysKingdom.Background of Paulus OngMr. Paulus entered ACES as a General Manager in 2001, when there were8 stores, and was appointed as Operations Director in 2005, when therewas 12 stores. During his time as a director, revenues grew nearly 5x as hespearheaded the opening of 34 stores.Maintain Buy on ACESWe believe that ACES's long-term prospects remain attractive as we be-lieve there is enough room for growth even with two players. ACES man-agement remains confident of margins and expansion prospects even inthe face of direct competition.
Comparison of Do It Best Pongs Home Center and ACES
Source: Deutsche Bank and company data
Reggy Susanto, CFAPT Deutsche Bank Verdhana In-donesiaResearch Analyst(+62) 21 318 [email protected]
2 August 2011 Strategy Asia Equities Daily Focus
Page 10 Deutsche Bank AG/Hong Kong
Asia ASEAN IndonesiaConglomerates
01 Aug 2011 - 06:41:44 AM GMT
COMPANY ALERT Forecast Change
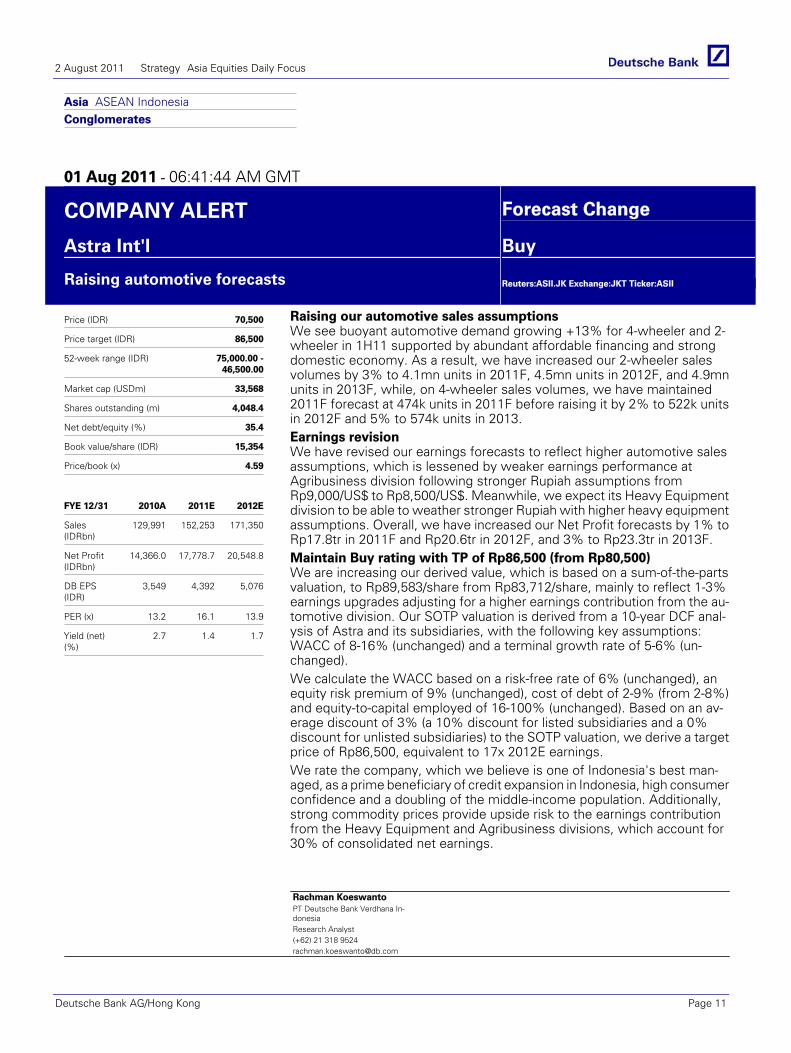
Astra Int'l Buy
Raising automotive forecasts
Reuters:ASII.JK Exchange:JKT Ticker:ASII
Price (IDR) 70,500
Price target (IDR) 86,500
52-week range (IDR) 75,000.00 -46,500.00
Market cap (USDm) 33,568
Shares outstanding (m) 4,048.4
Net debt/equity (%) 35.4
Book value/share (IDR) 15,354
Price/book (x) 4.59
FYE 12/31 2010A 2011E 2012E
Sales(IDRbn)
129,991 152,253 171,350
Net Profit(IDRbn)
14,366.0 17,778.7 20,548.8
DB EPS(IDR)
3,549 4,392 5,076
PER (x) 13.2 16.1 13.9
Yield (net)(%)
2.7 1.4 1.7
Raising our automotive sales assumptionsWe see buoyant automotive demand growing +13% for 4-wheeler and 2-wheeler in 1H11 supported by abundant affordable financing and strongdomestic economy. As a result, we have increased our 2-wheeler salesvolumes by 3% to 4.1mn units in 2011F, 4.5mn units in 2012F, and 4.9mnunits in 2013F, while, on 4-wheeler sales volumes, we have maintained2011F forecast at 474k units in 2011F before raising it by 2% to 522k unitsin 2012F and 5% to 574k units in 2013.Earnings revisionWe have revised our earnings forecasts to reflect higher automotive salesassumptions, which is lessened by weaker earnings performance atAgribusiness division following stronger Rupiah assumptions fromRp9,000/US$ to Rp8,500/US$. Meanwhile, we expect its Heavy Equipmentdivision to be able to weather stronger Rupiah with higher heavy equipmentassumptions. Overall, we have increased our Net Profit forecasts by 1% toRp17.8tr in 2011F and Rp20.6tr in 2012F, and 3% to Rp23.3tr in 2013F.Maintain Buy rating with TP of Rp86,500 (from Rp80,500)We are increasing our derived value, which is based on a sum-of-the-partsvaluation, to Rp89,583/share from Rp83,712/share, mainly to reflect 1-3%earnings upgrades adjusting for a higher earnings contribution from the au-tomotive division. Our SOTP valuation is derived from a 10-year DCF anal-ysis of Astra and its subsidiaries, with the following key assumptions:WACC of 8-16% (unchanged) and a terminal growth rate of 5-6% (un-changed).We calculate the WACC based on a risk-free rate of 6% (unchanged), anequity risk premium of 9% (unchanged), cost of debt of 2-9% (from 2-8%)and equity-to-capital employed of 16-100% (unchanged). Based on an av-erage discount of 3% (a 10% discount for listed subsidiaries and a 0%discount for unlisted subsidiaries) to the SOTP valuation, we derive a targetprice of Rp86,500, equivalent to 17x 2012E earnings.We rate the company, which we believe is one of Indonesia's best man-aged, as a prime beneficiary of credit expansion in Indonesia, high consumerconfidence and a doubling of the middle-income population. Additionally,strong commodity prices provide upside risk to the earnings contributionfrom the Heavy Equipment and Agribusiness divisions, which account for30% of consolidated net earnings.
Rachman KoeswantoPT Deutsche Bank Verdhana In-donesiaResearch Analyst(+62) 21 318 [email protected]
2 August 2011 Strategy Asia Equities Daily Focus
Deutsche Bank AG/Hong Kong Page 11
Asia ASEAN Indonesia Banking/Finance
1 August 2011
BRI Reuters: BBRI.JK Bloomberg: BBRI IJ Exchange: JKT Ticker: BBRI
Banking on micro; upgrading target price to Rp9,100Raymond Kosasih, CFA PT Deutsche Bank Verdhana Indonesia Research Analyst (+62) 21 318 9525 [email protected]
Arinta Harsono PT Deutsche Bank Verdhana Indonesia Research Analyst (+62) 21 318 9519 [email protected]
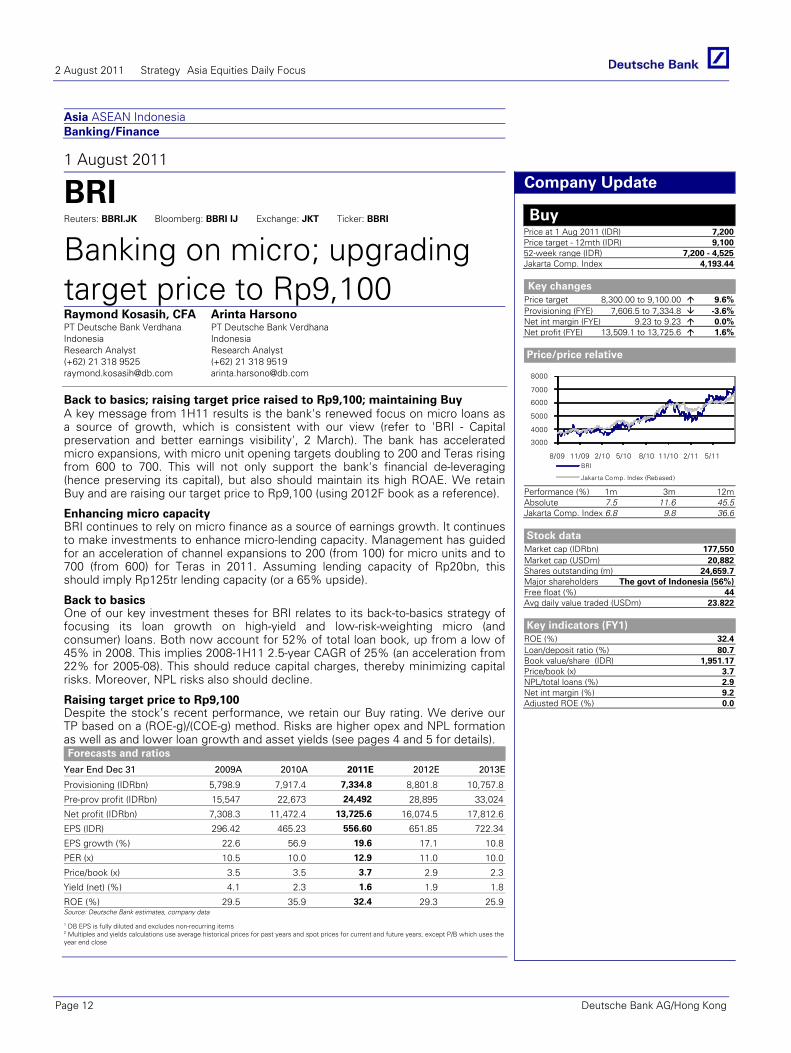
Back to basics; raising target price raised to Rp9,100; maintaining Buy A key message from 1H11 results is the bank's renewed focus on micro loans as a source of growth, which is consistent with our view (refer to 'BRI - Capital preservation and better earnings visibility', 2 March). The bank has accelerated micro expansions, with micro unit opening targets doubling to 200 and Teras rising from 600 to 700. This will not only support the bank's financial de-leveraging (hence preserving its capital), but also should maintain its high ROAE. We retain Buy and are raising our target price to Rp9,100 (using 2012F book as a reference).
Forecasts and ratios
Year End Dec 31 2009A 2010A 2011E 2012E 2013E
Provisioning (IDRbn) 5,798.9 7,917.4 7,334.8 8,801.8 10,757.8
Pre-prov profit (IDRbn) 15,547 22,673 24,492 28,895 33,024
Net profit (IDRbn) 7,308.3 11,472.4 13,725.6 16,074.5 17,812.6
EPS (IDR) 296.42 465.23 556.60 651.85 722.34
EPS growth (%) 22.6 56.9 19.6 17.1 10.8
PER (x) 10.5 10.0 12.9 11.0 10.0
Price/book (x) 3.5 3.5 3.7 2.9 2.3
Yield (net) (%) 4.1 2.3 1.6 1.9 1.8
ROE (%) 29.5 35.9 32.4 29.3 25.9Source: Deutsche Bank estimates, company data
1 DB EPS is fully diluted and excludes non-recurring items 2 Multiples and yields calculations use average historical prices for past years and spot prices for current and future years, except P/B which uses the year end close
Company Update
Buy Price at 1 Aug 2011 (IDR) 7,200Price target - 12mth (IDR) 9,10052-week range (IDR) 7,200 - 4,525Jakarta Comp. Index 4,193.44
Key changes
Price target 8,300.00 to 9,100.00 9.6%Provisioning (FYE) 7,606.5 to 7,334.8 -3.6%Net int margin (FYE) 9.23 to 9.23 0.0%Net profit (FYE) 13,509.1 to 13,725.6 1.6%
Price/price relative
3000
4000
5000
6000
7000
8000
8/09 11/09 2/10 5/10 8/10 11/10 2/11 5/11BRI
Jakarta Comp. Index (Rebased)
Performance (%) 1m 3m 12mAbsolute 7.5 11.6 45.5Jakarta Comp. Index 6.8 9.8 36.6
Stock data
Market cap (IDRbn) 177,550Market cap (USDm) 20,882Shares outstanding (m) 24,659.7Major shareholders The govt of Indonesia (56%)Free float (%) 44Avg daily value traded (USDm) 23.822
Key indicators (FY1)
ROE (%) 32.4Loan/deposit ratio (%) 80.7Book value/share (IDR) 1,951.17Price/book (x) 3.7NPL/total loans (%) 2.9Net int margin (%) 9.2Adjusted ROE (%) 0.0
Enhancing micro capacity BRI continues to rely on micro finance as a source of earnings growth. It continues to make investments to enhance micro-lending capacity. Management has guided for an acceleration of channel expansions to 200 (from 100) for micro units and to 700 (from 600) for Teras in 2011. Assuming lending capacity of Rp20bn, this should imply Rp125tr lending capacity (or a 65% upside).
Back to basics One of our key investment theses for BRI relates to its back-to-basics strategy of focusing its loan growth on high-yield and low-risk-weighting micro (and consumer) loans. Both now account for 52% of total loan book, up from a low of 45% in 2008. This implies 2008-1H11 2.5-year CAGR of 25% (an acceleration from 22% for 2005-08). This should reduce capital charges, thereby minimizing capital risks. Moreover, NPL risks also should decline.
Raising target price to Rp9,100 Despite the stock’s recent performance, we retain our Buy rating. We derive our TP based on a (ROE-g)/(COE-g) method. Risks are higher opex and NPL formation as well as and lower loan growth and asset yields (see pages 4 and 5 for details).
2 August 2011 Strategy Asia Equities Daily Focus
Page 12 Deutsche Bank AG/Hong Kong
Asia ASEAN IndonesiaAutomobiles & Components
01 Aug 2011 - 05:18:41 AM GMT
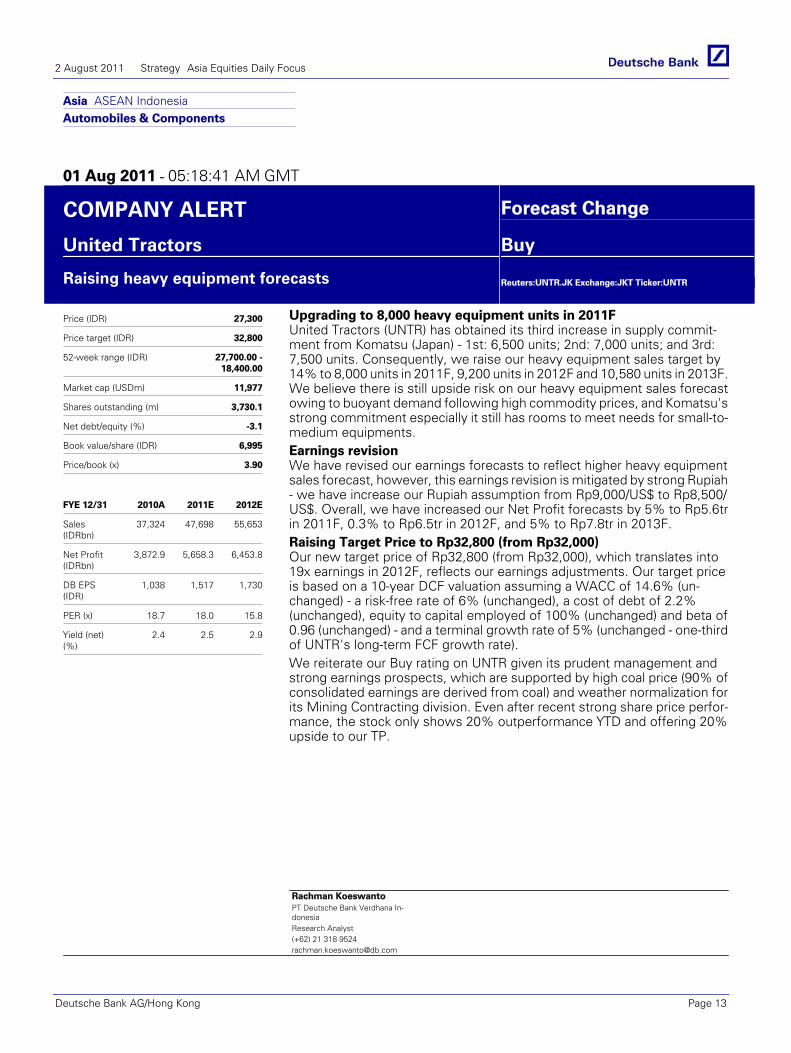
COMPANY ALERT Forecast Change
United Tractors Buy
Raising heavy equipment forecasts
Reuters:UNTR.JK Exchange:JKT Ticker:UNTR
Price (IDR) 27,300
Price target (IDR) 32,800
52-week range (IDR) 27,700.00 -18,400.00
Market cap (USDm) 11,977
Shares outstanding (m) 3,730.1
Net debt/equity (%) -3.1
Book value/share (IDR) 6,995
Price/book (x) 3.90
FYE 12/31 2010A 2011E 2012E
Sales(IDRbn)
37,324 47,698 55,653
Net Profit(IDRbn)
3,872.9 5,658.3 6,453.8
DB EPS(IDR)
1,038 1,517 1,730
PER (x) 18.7 18.0 15.8
Yield (net)(%)
2.4 2.5 2.9
Upgrading to 8,000 heavy equipment units in 2011FUnited Tractors (UNTR) has obtained its third increase in supply commit-ment from Komatsu (Japan) - 1st: 6,500 units; 2nd: 7,000 units; and 3rd:7,500 units. Consequently, we raise our heavy equipment sales target by14% to 8,000 units in 2011F, 9,200 units in 2012F and 10,580 units in 2013F.We believe there is still upside risk on our heavy equipment sales forecastowing to buoyant demand following high commodity prices, and Komatsu'sstrong commitment especially it still has rooms to meet needs for small-to-medium equipments.Earnings revisionWe have revised our earnings forecasts to reflect higher heavy equipmentsales forecast, however, this earnings revision is mitigated by strong Rupiah- we have increase our Rupiah assumption from Rp9,000/US$ to Rp8,500/US$. Overall, we have increased our Net Profit forecasts by 5% to Rp5.6trin 2011F, 0.3% to Rp6.5tr in 2012F, and 5% to Rp7.8tr in 2013F.Raising Target Price to Rp32,800 (from Rp32,000)Our new target price of Rp32,800 (from Rp32,000), which translates into19x earnings in 2012F, reflects our earnings adjustments. Our target priceis based on a 10-year DCF valuation assuming a WACC of 14.6% (un-changed) - a risk-free rate of 6% (unchanged), a cost of debt of 2.2%(unchanged), equity to capital employed of 100% (unchanged) and beta of0.96 (unchanged) - and a terminal growth rate of 5% (unchanged - one-thirdof UNTR's long-term FCF growth rate).We reiterate our Buy rating on UNTR given its prudent management andstrong earnings prospects, which are supported by high coal price (90% ofconsolidated earnings are derived from coal) and weather normalization forits Mining Contracting division. Even after recent strong share price perfor-mance, the stock only shows 20% outperformance YTD and offering 20%upside to our TP.
Rachman KoeswantoPT Deutsche Bank Verdhana In-donesiaResearch Analyst(+62) 21 318 [email protected]
2 August 2011 Strategy Asia Equities Daily Focus
Deutsche Bank AG/Hong Kong Page 13
Asia ASEAN Thailand Resources Construction Materials
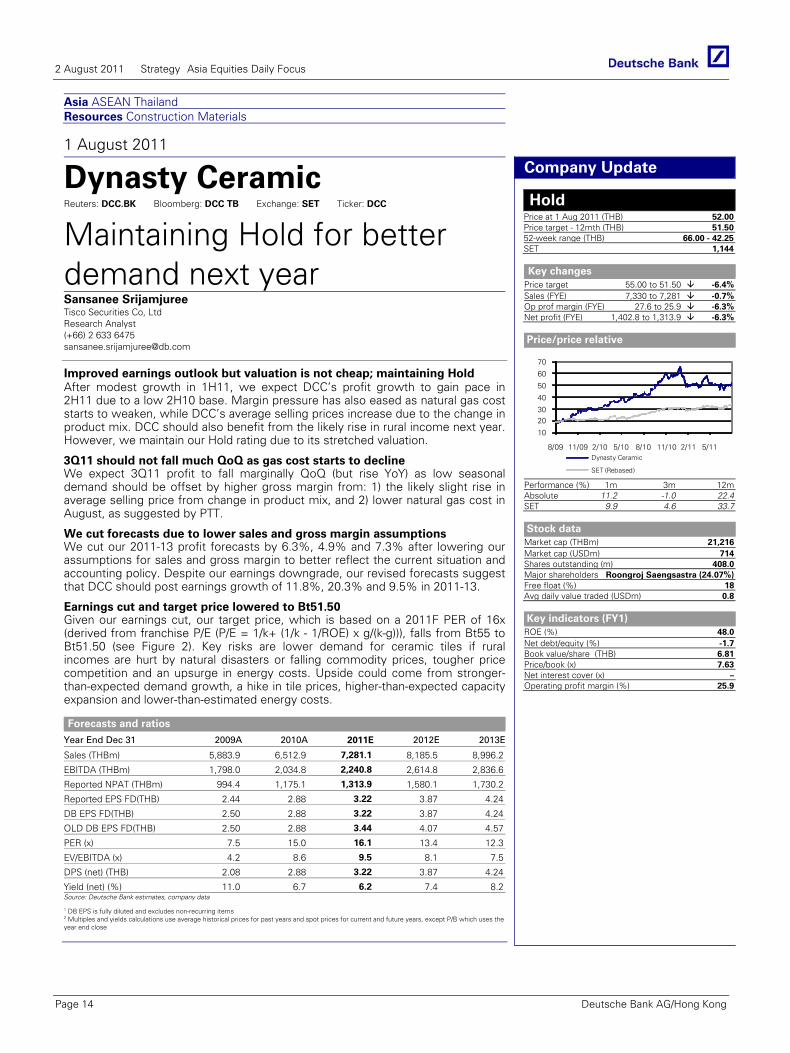
1 August 2011
Dynasty Ceramic Reuters: DCC.BK Bloomberg: DCC TB Exchange: SET Ticker: DCC
Maintaining Hold for better demand next year Sansanee Srijamjuree Tisco Securities Co, Ltd Research Analyst (+66) 2 633 6475 [email protected]
Improved earnings outlook but valuation is not cheap; maintaining Hold After modest growth in 1H11, we expect DCC’s profit growth to gain pace in 2H11 due to a low 2H10 base. Margin pressure has also eased as natural gas cost starts to weaken, while DCC’s average selling prices increase due to the change in product mix. DCC should also benefit from the likely rise in rural income next year. However, we maintain our Hold rating due to its stretched valuation.
Forecasts and ratios
Year End Dec 31 2009A 2010A 2011E 2012E 2013E
Sales (THBm) 5,883.9 6,512.9 7,281.1 8,185.5 8,996.2
EBITDA (THBm) 1,798.0 2,034.8 2,240.8 2,614.8 2,836.6
Reported NPAT (THBm) 994.4 1,175.1 1,313.9 1,580.1 1,730.2
Reported EPS FD(THB) 2.44 2.88 3.22 3.87 4.24
DB EPS FD(THB) 2.50 2.88 3.22 3.87 4.24
OLD DB EPS FD(THB) 2.50 2.88 3.44 4.07 4.57
PER (x) 7.5 15.0 16.1 13.4 12.3
EV/EBITDA (x) 4.2 8.6 9.5 8.1 7.5
DPS (net) (THB) 2.08 2.88 3.22 3.87 4.24
Yield (net) (%) 11.0 6.7 6.2 7.4 8.2Source: Deutsche Bank estimates, company data
1 DB EPS is fully diluted and excludes non-recurring items 2 Multiples and yields calculations use average historical prices for past years and spot prices for current and future years, except P/B which uses the year end close
Company Update
Hold Price at 1 Aug 2011 (THB) 52.00Price target - 12mth (THB) 51.5052-week range (THB) 66.00 - 42.25SET 1,144
Key changes
Price target 55.00 to 51.50 -6.4%Sales (FYE) 7,330 to 7,281 -0.7%Op prof margin (FYE) 27.6 to 25.9 -6.3%Net profit (FYE) 1,402.8 to 1,313.9 -6.3%
Price/price relative
10
2030
40
50
60
70
8/09 11/09 2/10 5/10 8/10 11/10 2/11 5/11Dynasty Ceramic
SET (Rebased)
Performance (%) 1m 3m 12mAbsolute 11.2 -1.0 22.4SET 9.9 4.6 33.7
Stock data
Market cap (THBm) 21,216Market cap (USDm) 714Shares outstanding (m) 408.0Major shareholders Roongroj Saengsastra (24.07%)Free float (%) 18Avg daily value traded (USDm) 0.8
Key indicators (FY1)
ROE (%) 48.0Net debt/equity (%) -1.7Book value/share (THB) 6.81Price/book (x) 7.63Net interest cover (x) –Operating profit margin (%) 25.9
3Q11 should not fall much QoQ as gas cost starts to decline We expect 3Q11 profit to fall marginally QoQ (but rise YoY) as low seasonal demand should be offset by higher gross margin from: 1) the likely slight rise in average selling price from change in product mix, and 2) lower natural gas cost in August, as suggested by PTT.
We cut forecasts due to lower sales and gross margin assumptions We cut our 2011-13 profit forecasts by 6.3%, 4.9% and 7.3% after lowering our assumptions for sales and gross margin to better reflect the current situation and accounting policy. Despite our earnings downgrade, our revised forecasts suggest that DCC should post earnings growth of 11.8%, 20.3% and 9.5% in 2011-13.
Earnings cut and target price lowered to Bt51.50 Given our earnings cut, our target price, which is based on a 2011F PER of 16x (derived from franchise P/E (P/E = 1/k+ (1/k - 1/ROE) x g/(k-g))), falls from Bt55 to Bt51.50 (see Figure 2). Key risks are lower demand for ceramic tiles if rural incomes are hurt by natural disasters or falling commodity prices, tougher price competition and an upsurge in energy costs. Upside could come from stronger-than-expected demand growth, a hike in tile prices, higher-than-expected capacity expansion and lower-than-estimated energy costs.
2 August 2011 Strategy Asia Equities Daily Focus
Page 14 Deutsche Bank AG/Hong Kong
Asia ASEAN Thailand Media Publishing/ Advertising
1 August 2011
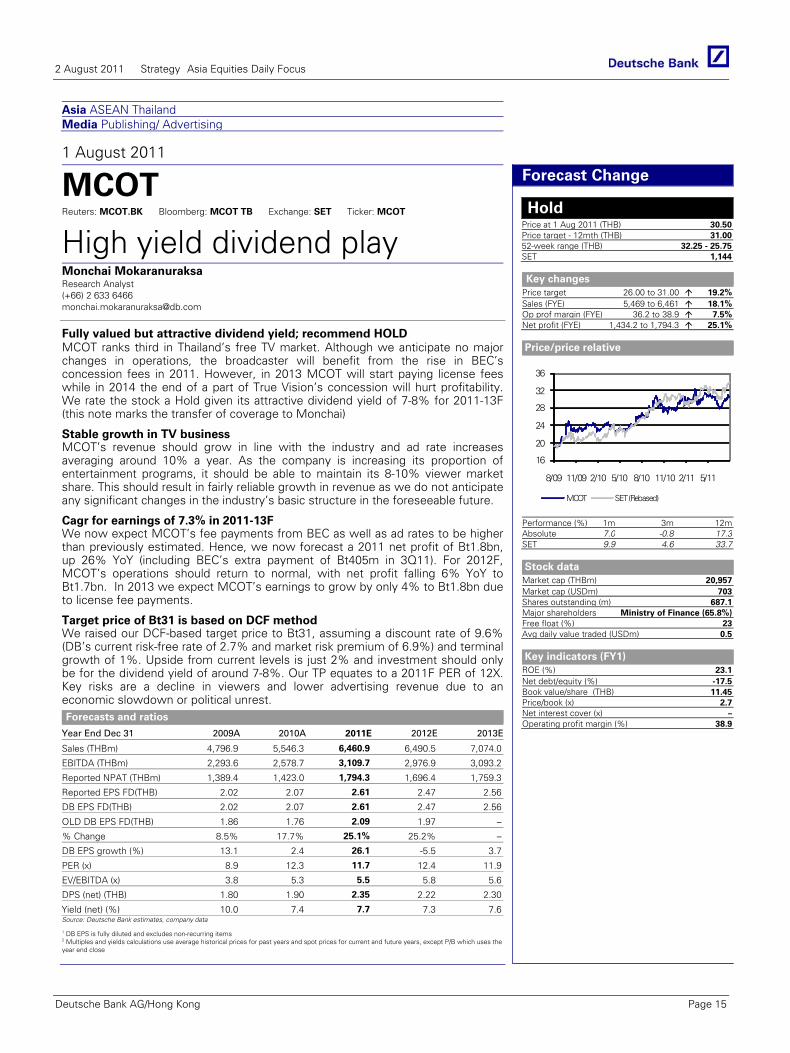
MCOT Reuters: MCOT.BK Bloomberg: MCOT TB Exchange: SET Ticker: MCOT
High yield dividend play Monchai Mokaranuraksa Research Analyst (+66) 2 633 6466 [email protected]
Fully valued but attractive dividend yield; recommend HOLD MCOT ranks third in Thailand’s free TV market. Although we anticipate no major changes in operations, the broadcaster will benefit from the rise in BEC’s concession fees in 2011. However, in 2013 MCOT will start paying license fees while in 2014 the end of a part of True Vision’s concession will hurt profitability. We rate the stock a Hold given its attractive dividend yield of 7-8% for 2011-13F (this note marks the transfer of coverage to Monchai)
Forecasts and ratios
Year End Dec 31 2009A 2010A 2011E 2012E 2013E
Sales (THBm) 4,796.9 5,546.3 6,460.9 6,490.5 7,074.0
EBITDA (THBm) 2,293.6 2,578.7 3,109.7 2,976.9 3,093.2
Reported NPAT (THBm) 1,389.4 1,423.0 1,794.3 1,696.4 1,759.3
Reported EPS FD(THB) 2.02 2.07 2.61 2.47 2.56
DB EPS FD(THB) 2.02 2.07 2.61 2.47 2.56
OLD DB EPS FD(THB) 1.86 1.76 2.09 1.97 –
% Change 8.5% 17.7% 25.1% 25.2% –
DB EPS growth (%) 13.1 2.4 26.1 -5.5 3.7
PER (x) 8.9 12.3 11.7 12.4 11.9
EV/EBITDA (x) 3.8 5.3 5.5 5.8 5.6
DPS (net) (THB) 1.80 1.90 2.35 2.22 2.30
Yield (net) (%) 10.0 7.4 7.7 7.3 7.6Source: Deutsche Bank estimates, company data
1 DB EPS is fully diluted and excludes non-recurring items 2 Multiples and yields calculations use average historical prices for past years and spot prices for current and future years, except P/B which uses the year end close
Forecast Change
Hold Price at 1 Aug 2011 (THB) 30.50Price target - 12mth (THB) 31.0052-week range (THB) 32.25 - 25.75SET 1,144
Key changes
Price target 26.00 to 31.00 19.2%Sales (FYE) 5,469 to 6,461 18.1%Op prof margin (FYE) 36.2 to 38.9 7.5%Net profit (FYE) 1,434.2 to 1,794.3 25.1%
Price/price relative
16
20
24
28
32
36
8/09 11/09 2/10 5/10 8/10 11/10 2/11 5/11
MCOT SET (Rebased)
Performance (%) 1m 3m 12mAbsolute 7.0 -0.8 17.3SET 9.9 4.6 33.7
Stock data
Market cap (THBm) 20,957Market cap (USDm) 703Shares outstanding (m) 687.1Major shareholders Ministry of Finance (65.8%)Free float (%) 23Avg daily value traded (USDm) 0.5
Key indicators (FY1)
ROE (%) 23.1Net debt/equity (%) -17.5Book value/share (THB) 11.45Price/book (x) 2.7Net interest cover (x) –Operating profit margin (%) 38.9
Glo
bal
Mar
kets
Res
earc
h
Stable growth in TV business MCOT’s revenue should grow in line with the industry and ad rate increases averaging around 10% a year. As the company is increasing its proportion of entertainment programs, it should be able to maintain its 8-10% viewer market share. This should result in fairly reliable growth in revenue as we do not anticipate any significant changes in the industry’s basic structure in the foreseeable future.
Cagr for earnings of 7.3% in 2011-13F We now expect MCOT’s fee payments from BEC as well as ad rates to be higher than previously estimated. Hence, we now forecast a 2011 net profit of Bt1.8bn, up 26% YoY (including BEC’s extra payment of Bt405m in 3Q11). For 2012F, MCOT’s operations should return to normal, with net profit falling 6% YoY to Bt1.7bn. In 2013 we expect MCOT’s earnings to grow by only 4% to Bt1.8bn due to license fee payments.
Target price of Bt31 is based on DCF method We raised our DCF-based target price to Bt31, assuming a discount rate of 9.6% (DB’s current risk-free rate of 2.7% and market risk premium of 6.9%) and terminal growth of 1%. Upside from current levels is just 2% and investment should only be for the dividend yield of around 7-8%. Our TP equates to a 2011F PER of 12X. Key risks are a decline in viewers and lower advertising revenue due to an economic slowdown or political unrest.
2 August 2011 Strategy Asia Equities Daily Focus
Deutsche Bank AG/Hong Kong Page 15
Asia ASEAN Thailand Consumer Food & Beverage
1 August 2011
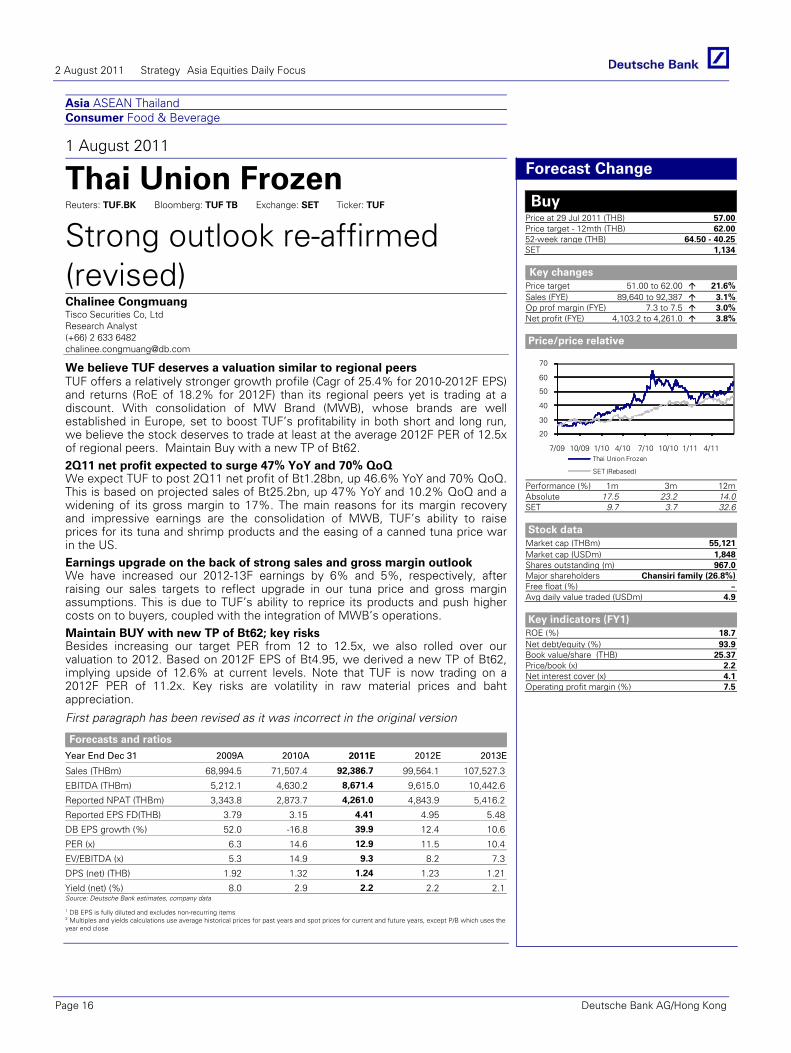
Thai Union Frozen Reuters: TUF.BK Bloomberg: TUF TB Exchange: SET Ticker: TUF
Strong outlook re-affirmed (revised) Chalinee Congmuang Tisco Securities Co, Ltd Research Analyst (+66) 2 633 6482 [email protected]
We believe TUF deserves a valuation similar to regional peers TUF offers a relatively stronger growth profile (Cagr of 25.4% for 2010-2012F EPS) and returns (RoE of 18.2% for 2012F) than its regional peers yet is trading at a discount. With consolidation of MW Brand (MWB), whose brands are well established in Europe, set to boost TUF’s profitability in both short and long run, we believe the stock deserves to trade at least at the average 2012F PER of 12.5x of regional peers. Maintain Buy with a new TP of Bt62.
Forecasts and ratios
Year End Dec 31 2009A 2010A 2011E 2012E 2013E
Sales (THBm) 68,994.5 71,507.4 92,386.7 99,564.1 107,527.3
EBITDA (THBm) 5,212.1 4,630.2 8,671.4 9,615.0 10,442.6
Reported NPAT (THBm) 3,343.8 2,873.7 4,261.0 4,843.9 5,416.2
Reported EPS FD(THB) 3.79 3.15 4.41 4.95 5.48
DB EPS growth (%) 52.0 -16.8 39.9 12.4 10.6
PER (x) 6.3 14.6 12.9 11.5 10.4
EV/EBITDA (x) 5.3 14.9 9.3 8.2 7.3
DPS (net) (THB) 1.92 1.32 1.24 1.23 1.21
Yield (net) (%) 8.0 2.9 2.2 2.2 2.1Source: Deutsche Bank estimates, company data
1 DB EPS is fully diluted and excludes non-recurring items 2 Multiples and yields calculations use average historical prices for past years and spot prices for current and future years, except P/B which uses the year end close
Forecast Change
Buy Price at 29 Jul 2011 (THB) 57.00Price target - 12mth (THB) 62.0052-week range (THB) 64.50 - 40.25SET 1,134
Key changes
Price target 51.00 to 62.00 21.6%Sales (FYE) 89,640 to 92,387 3.1%Op prof margin (FYE) 7.3 to 7.5 3.0%Net profit (FYE) 4,103.2 to 4,261.0 3.8%
Price/price relative
20
30
40
50
60
70
7/09 10/09 1/10 4/10 7/10 10/10 1/11 4/11Thai Union Frozen
SET (Rebased)
Performance (%) 1m 3m 12mAbsolute 17.5 23.2 14.0SET 9.7 3.7 32.6
Stock data
Market cap (THBm) 55,121Market cap (USDm) 1,848Shares outstanding (m) 967.0Major shareholders Chansiri family (26.8%)Free float (%) –Avg daily value traded (USDm) 4.9
Key indicators (FY1)
ROE (%) 18.7Net debt/equity (%) 93.9Book value/share (THB) 25.37Price/book (x) 2.2Net interest cover (x) 4.1Operating profit margin (%) 7.5
2Q11 net profit expected to surge 47% YoY and 70% QoQ We expect TUF to post 2Q11 net profit of Bt1.28bn, up 46.6% YoY and 70% QoQ. This is based on projected sales of Bt25.2bn, up 47% YoY and 10.2% QoQ and a widening of its gross margin to 17%. The main reasons for its margin recovery and impressive earnings are the consolidation of MWB, TUF’s ability to raise prices for its tuna and shrimp products and the easing of a canned tuna price war in the US. Earnings upgrade on the back of strong sales and gross margin outlook We have increased our 2012-13F earnings by 6% and 5%, respectively, after raising our sales targets to reflect upgrade in our tuna price and gross margin assumptions. This is due to TUF’s ability to reprice its products and push higher costs on to buyers, coupled with the integration of MWB’s operations. Maintain BUY with new TP of Bt62; key risks Besides increasing our target PER from 12 to 12.5x, we also rolled over our valuation to 2012. Based on 2012F EPS of Bt4.95, we derived a new TP of Bt62, implying upside of 12.6% at current levels. Note that TUF is now trading on a 2012F PER of 11.2x. Key risks are volatility in raw material prices and baht appreciation.
First paragraph has been revised as it was incorrect in the original version
2 August 2011 Strategy Asia Equities Daily Focus
Page 16 Deutsche Bank AG/Hong Kong
Asia
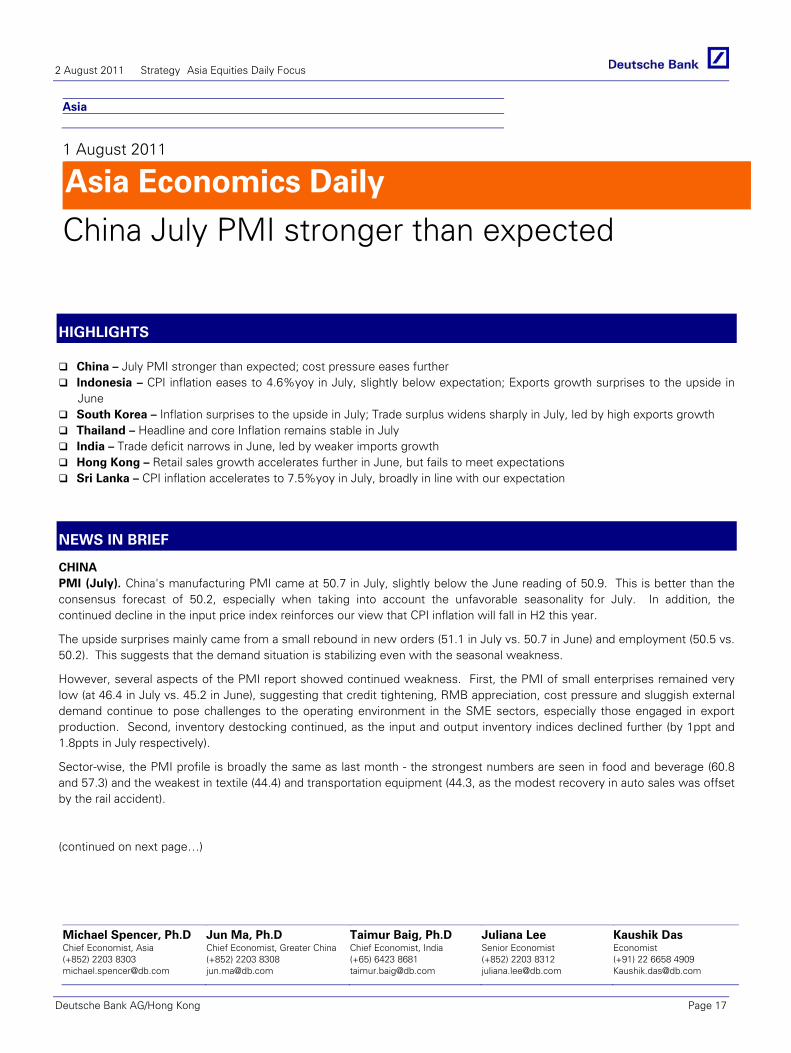
1 August 2011
Asia Economics Daily
China July PMI stronger than expected
Michael Spencer, Ph.D Chief Economist, Asia (+852) 2203 8303 [email protected]
Jun Ma, Ph.D Chief Economist, Greater China (+852) 2203 8308 [email protected]
Taimur Baig, Ph.D Chief Economist, India (+65) 6423 8681 [email protected]
Juliana Lee Senior Economist (+852) 2203 8312 [email protected]
Kaushik Das Economist (+91) 22 6658 4909 [email protected]
Eco
no
mic
s
HIGHLIGHTS
China – July PMI stronger than expected; cost pressure eases further Indonesia – CPI inflation eases to 4.6%yoy in July, slightly below expectation; Exports growth surprises to the upside in
June South Korea – Inflation surprises to the upside in July; Trade surplus widens sharply in July, led by high exports growth Thailand – Headline and core Inflation remains stable in July India – Trade deficit narrows in June, led by weaker imports growth Hong Kong – Retail sales growth accelerates further in June, but fails to meet expectations Sri Lanka – CPI inflation accelerates to 7.5%yoy in July, broadly in line with our expectation
NEWS IN BRIEF
CHINA PMI (July). China's manufacturing PMI came at 50.7 in July, slightly below the June reading of 50.9. This is better than the consensus forecast of 50.2, especially when taking into account the unfavorable seasonality for July. In addition, the continued decline in the input price index reinforces our view that CPI inflation will fall in H2 this year.
The upside surprises mainly came from a small rebound in new orders (51.1 in July vs. 50.7 in June) and employment (50.5 vs. 50.2). This suggests that the demand situation is stabilizing even with the seasonal weakness.
However, several aspects of the PMI report showed continued weakness. First, the PMI of small enterprises remained very low (at 46.4 in July vs. 45.2 in June), suggesting that credit tightening, RMB appreciation, cost pressure and sluggish external demand continue to pose challenges to the operating environment in the SME sectors, especially those engaged in export production. Second, inventory destocking continued, as the input and output inventory indices declined further (by 1ppt and 1.8ppts in July respectively).
Sector-wise, the PMI profile is broadly the same as last month - the strongest numbers are seen in food and beverage (60.8 and 57.3) and the weakest in textile (44.4) and transportation equipment (44.3, as the modest recovery in auto sales was offset by the rail accident).
(continued on next page…)
2 August 2011 Strategy Asia Equities Daily Focus
Deutsche Bank AG/Hong Kong Page 17
As for outlook, we expect the PMI to begin its modest recovery from August (to 51), and will gradually trend upwards to 53-54 (similar to historical average) by mid-Q4. The key factors that should help improve the PMI outlook in Q4 include: 1) the end of the inventory destocking; 2) the easing of power shortage; 3) some relaxation in credit, especially for SMEs (note that the State Council is now drafting a new set of policies to support SMEs); 4) the acceleration in public housing construction; and 5) a recovery in auto demand.
Another point to note in the PMI report is that the input price index fell further to 56.3 in July from 56.7 in June, the fourth consecutive monthly decline. This reinforces our expectation that PPI inflation will be falling in H2 this year, and thus help containing CPI inflation (especially non-food inflation) going forward. We estimate that non-food inflation will hover around only 0.1% mom in the remainder of this year, thanks to the benefits of monetary tightening in the past 18 months and the stabilization of global commodities prices. We forecast that yoy CPI inflation will fall to 6.2% yoy in July (to be released on August 9), down from 6.4% in June (the peak in the current inflation cycle). By November and December, yoy CPI inflation will likely decline to or even below 4%.
INDONESIA CPI Inflation (July). Headline inflation moderated further in July to 4.6%yoy, down sharply from 5.5% in June, broadly in line with our expectations. However, note that on a mom (nsa) basis, inflation pressure accelerated in July compared to June (+0.7% vs. +0.6%), led primarily by a sharp jump in food prices (+1.8%mom; 5.2%yoy). Price pressures were also visible in components such as transport (+0.2%mom), processed food (+0.4%mom) and education (+1.0% mom). We expect inflation pressure to sustain on a mom basis in the next couple of months due to Ramadan festival. However, favorable base effect will guide yoy inflation lower in the second half (well below 6%); hence, we don't expect any rate hike from BI at least until Q4.
External Trade (June). Exports growth accelerated to a sixteen month high of 49.3%yoy in June, up from 44.9% in May and was well above the consensus (45.0%) as well as our (42.5%) expectation. This was largely driven by oil and gas, exports of which rose at a faster pace of 88.9% in June vs. 71.9% in May, mainly benefitting from rising international oil prices. Also, non-oil & gas exports witnessed a strong growth of 42.1% (38.7% in May) during the month. Meanwhile, imports growth slowed sharply to 28.3% in June, down from 48.6% in May. The trade surplus for the month of June stood broadly stable at USD3.3bn (USD3.4bn in May).
SOUTH KOREA CPI Inflation (July). CPI inflation rose to 4.7%yoy in July, up from 4.4% in June and was above consensus as well as our expectation 4.4% and 4.5% respectively. This upward surprise was mainly led by food items, inflation of which touched 10% in July, after rising 8.5% in June. Also, transport inflation rose at a faster pace of 7.3% in July, as compared to 6.4% in June. On the other hand, housing inflation remained stable at 5.2% in July. Meanwhile, the core inflation rate rose further in July, to 3.8% from 3.7% in June, reflecting underlying demand-pull pressure. We expect headline inflation to remain above 4% until late Q3, before easing to about 3.5% in Q4. On the policy front, we expect the Bank of Korea to deliver only two more 25bps rate hikes in the coming 18 months, taking the policy rate to 3.75% beyond 2012. With inflation rising faster than expected and drawing more public complaints, the political weight on the monetary policy has tilted in favour of a rate hike by end of this quarter, though the BoK may consider rate hike in August as well.
External Trade (July). Exports growth accelerated to 27.3%yoy in July, up from 13.6% (revised) growth reported in June and was well above our (18.0%) as well as consensus (17.1%) expectation. This strong growth was led by volatile vessels exports, which grew sharply by 22.8% in July vs. 35.2% decline in June. Also, exports of petroleum products (91.1% in July vs. 58.1% in June) and metal products (34.1% vs. 20.1%) posted a strong growth during the month. In contrast, exports of electric/electronic products declined by 1.1% in July from 1.6% growth reported in June. By destination, shipments to China grew by 19.4% in July vs. 16.7% growth in June, while exports to US slowed from 11.6% to 1.9% during the month. With imports growth slowing from 27.5% to 24.8% in June, the trade surplus widened sharply to USD 7.2bn in June, from USD2.8bn in May.
THAILAND CPI Inflation (July). Headline inflation remained unchanged at 4.1%yoy in July, broadly in line with our as well consensus expectation of 4.2%. By category, food inflation moderated further in July, to 7.2% from 7.8% in June, led by falling vegetable/fruits prices. In contrast transport (3.7% in July vs. 3.5% in June) inflation rose further in July, suggesting sustained pressure from rising international oil prices. Meanwhile, core inflation too remained broadly stable at 2.6% in July, suggesting temporary pull back in domestic demand. We expect core inflation to head higher, rising above the BoT's upper tolerance
2 August 2011 Strategy Asia Equities Daily Focus
Page 18 Deutsche Bank AG/Hong Kong
level of 3% for the remainder of the year. On the policy front, we expect two more 25bps rate hikes in 2H, with the next one (25bps) in August.
INDIA External trade (June). As expected, exports growth eased to 46.4%yoy (USD29.2bn) in June, from 56.9% in May. Also, imports posted a weaker growth of 42.5% (USD36.9bn) in June, as compared to 54.1% in May. With relatively lower imports growth as compared to exports, the trade deficit narrowed sharply in June, to USD7.8bn from USD15.0bn in May. Within the segment, non-oil imports growth slowed to 47.8% from 71.0% in May, while, oil imports rose at a faster pace of 30.1% in June, as compared to 18.6% in May.
HONG KONG Retail Sales (June). Retail sales (volume) growth was up 22.2%yoy in June compared to 21.1% (revised) in May, but was somewhat weaker than our (24.5%) as well as consensus (24.4%) estimate. Even in value terms, retail sales posted a strong growth of 28.8% in June vs. 27.8% in May. During second quarter of this year, retail sales in volume terms rose by 21.8%, higher than 16.3% growth reported in Q1. We expect strong retail sales growth to continue in the second half, led by sharp rise in tourism income.
SRI LANKA CPI Inflation (July). Consumer price inflation accelerated to 7.5%yoy in July, up from 7.1% in June, broadly in line with our expectation (7.3%) while being above the consensus estimate of 7.1%. This upward surprise was mainly on account of higher transportation inflation in July compared to June (10.1%yoy vs. 6.3%yoy). Clothing (14.5%yoy in July vs. 13.4% in June), housing (4.8% vs. 3.7%) and health (3.3% vs. 1.6%) inflation also edged higher during the month. In contrast, food inflation moderated to 9.3%yoy, from 10.1% in June. Our forecasts show that headline CPI inflation has already peaked in April at 8.8% and should trend lower in the remaining part of 2011 (to about 5.0% by end-December 2011), assuming no further external shocks. We expect headline CPI inflation to average 7% in 2011. Core inflation, in our view, should also gradually ease to around 6.5% by end-December 2011. Given this inflation outlook, we think that CBSL will not want to hike policy rates anytime soon, though continuing to remain vigilant, so as to ensure that demand side inflation pressures remain under control.
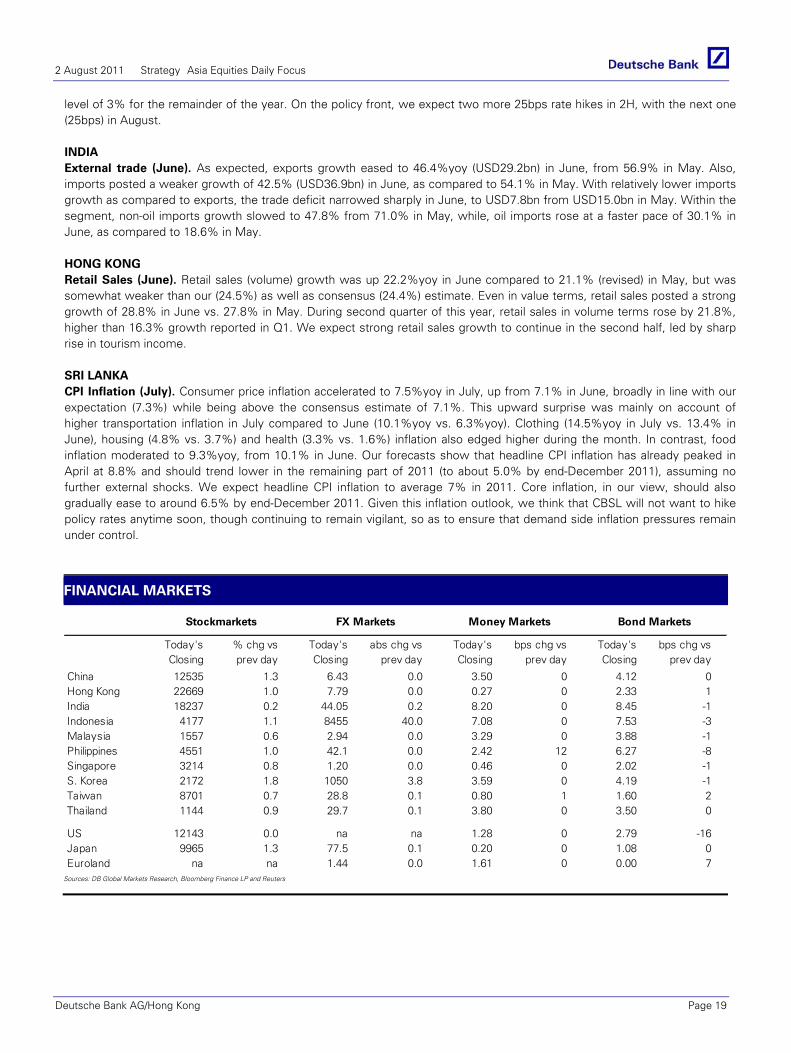
FINANCIAL MARKETS
Today's % chg vs Today's abs chg vs Today's bps chg vs Today's bps chg vsClosing prev day Closing prev day Closing prev day Closing prev day
China 12535 1.3 6.43 0.0 3.50 0 4.12 0Hong Kong 22669 1.0 7.79 0.0 0.27 0 2.33 1India 18237 0.2 44.05 0.2 8.20 0 8.45 -1Indonesia 4177 1.1 8455 40.0 7.08 0 7.53 -3Malaysia 1557 0.6 2.94 0.0 3.29 0 3.88 -1Philippines 4551 1.0 42.1 0.0 2.42 12 6.27 -8Singapore 3214 0.8 1.20 0.0 0.46 0 2.02 -1S. Korea 2172 1.8 1050 3.8 3.59 0 4.19 -1Taiwan 8701 0.7 28.8 0.1 0.80 1 1.60 2Thailand 1144 0.9 29.7 0.1 3.80 0 3.50 0
US 12143 0.0 na na 1.28 0 2.79 -16Japan 9965 1.3 77.5 0.1 0.20 0 1.08 0Euroland na na 1.44 0.0 1.61 0 0.00 7
Stockmarkets FX Markets Money Markets Bond Markets
Sources: DB Global Markets Research, Bloomberg Finance LP and Reuters
2 August 2011 Strategy Asia Equities Daily Focus
Deutsche Bank AG/Hong Kong Page 19
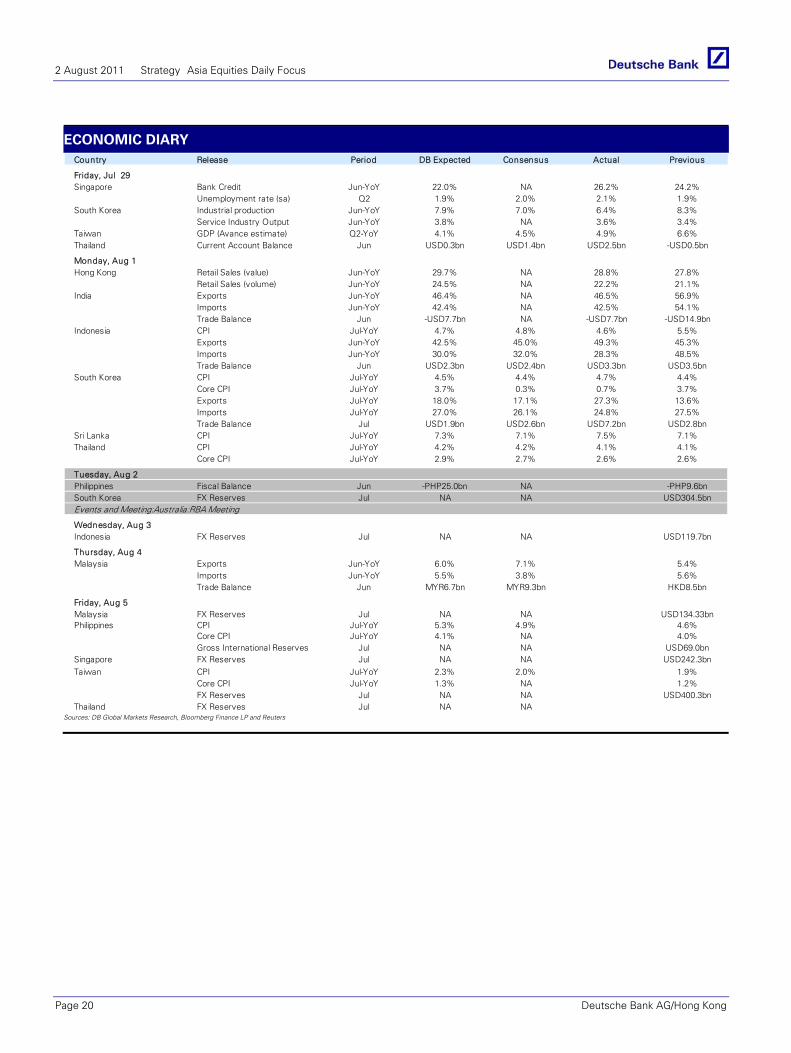
ECONOMIC DIARY Country Release Period DB Expected Consensus Actual Previous
Friday, Jul 29Singapore Bank Credit Jun-YoY 22.0% NA 26.2% 24.2%
Unemployment rate (sa) Q2 1.9% 2.0% 2.1% 1.9%South Korea Industrial production Jun-YoY 7.9% 7.0% 6.4% 8.3%
Service Industry Output Jun-YoY 3.8% NA 3.6% 3.4%Taiwan GDP (Avance estimate) Q2-YoY 4.1% 4.5% 4.9% 6.6%Thailand Current Account Balance Jun USD0.3bn USD1.4bn USD2.5bn -USD0.5bn
Monday, Aug 1Hong Kong Retail Sales (value) Jun-YoY 29.7% NA 28.8% 27.8%
Retail Sales (volume) Jun-YoY 24.5% NA 22.2% 21.1%India Exports Jun-YoY 46.4% NA 46.5% 56.9%
Imports Jun-YoY 42.4% NA 42.5% 54.1%Trade Balance Jun -USD7.7bn NA -USD7.7bn -USD14.9bn
Indonesia CPI Jul-YoY 4.7% 4.8% 4.6% 5.5%Exports Jun-YoY 42.5% 45.0% 49.3% 45.3%Imports Jun-YoY 30.0% 32.0% 28.3% 48.5%Trade Balance Jun USD2.3bn USD2.4bn USD3.3bn USD3.5bn
South Korea CPI Jul-YoY 4.5% 4.4% 4.7% 4.4%Core CPI Jul-YoY 3.7% 0.3% 0.7% 3.7%Exports Jul-YoY 18.0% 17.1% 27.3% 13.6%Imports Jul-YoY 27.0% 26.1% 24.8% 27.5%Trade Balance Jul USD1.9bn USD2.6bn USD7.2bn USD2.8bn
Sri Lanka CPI Jul-YoY 7.3% 7.1% 7.5% 7.1%Thailand CPI Jul-YoY 4.2% 4.2% 4.1% 4.1%
Core CPI Jul-YoY 2.9% 2.7% 2.6% 2.6%
Tuesday, Aug 2Philippines Fiscal Balance Jun -PHP25.0bn NA -PHP9.6bnSouth Korea FX Reserves Jul NA NA USD304.5bnEvents and Meeting:Australia:RBA Meeting
Wednesday, Aug 3Indonesia FX Reserves Jul NA NA USD119.7bn
Thursday, Aug 4Malaysia Exports Jun-YoY 6.0% 7.1% 5.4%
Imports Jun-YoY 5.5% 3.8% 5.6%Trade Balance Jun MYR6.7bn MYR9.3bn HKD8.5bn
Friday, Aug 5Malaysia FX Reserves Jul NA NA USD134.33bnPhilippines CPI Jul-YoY 5.3% 4.9% 4.6%
Core CPI Jul-YoY 4.1% NA 4.0%Gross International Reserves Jul NA NA USD69.0bn
Singapore FX Reserves Jul NA NA USD242.3bnTaiwan CPI Jul-YoY 2.3% 2.0% 1.9%
Core CPI Jul-YoY 1.3% NA 1.2%FX Reserves Jul NA NA USD400.3bn
Thailand FX Reserves Jul NA NASources: DB Global Markets Research, Bloomberg Finance LP and Reuters
2 August 2011 Strategy Asia Equities Daily Focus
Page 20 Deutsche Bank AG/Hong Kong
Global 1 August 2011
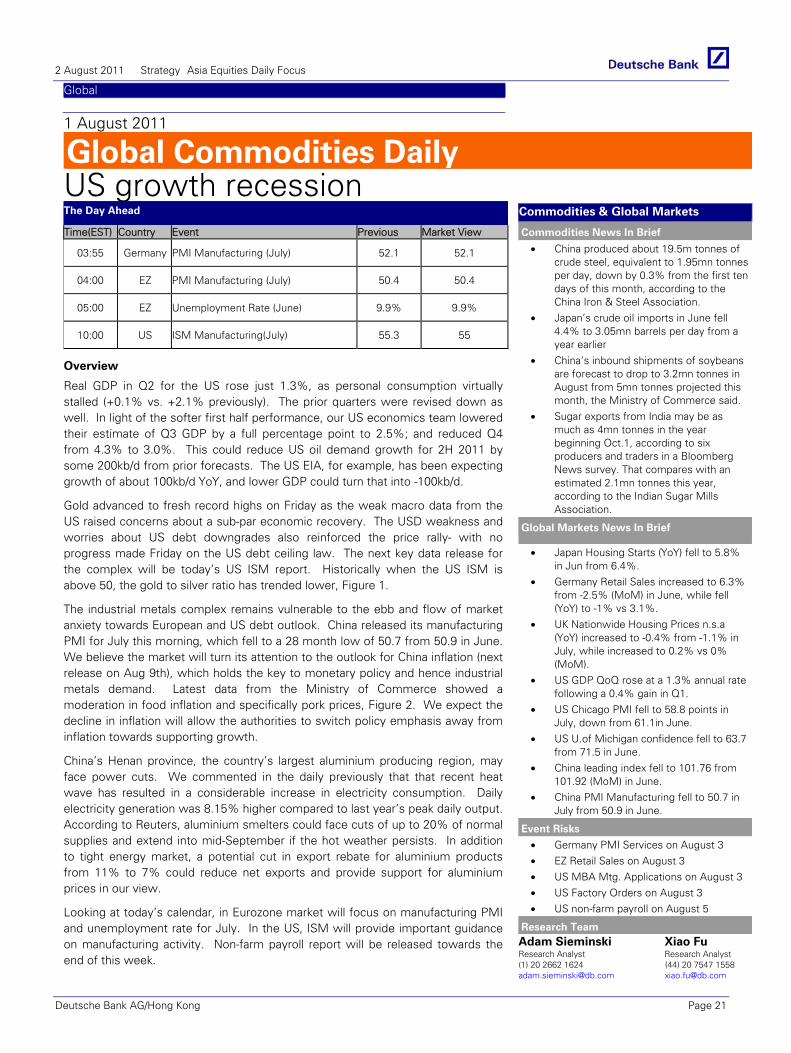
Global Commodities DailyUS growth recession
Co
mm
od
itie
s
The Day Ahead
Time(EST) Country Event Previous Market View
03:55 Germany PMI Manufacturing (July) 52.1 52.1
04:00 EZ PMI Manufacturing (July) 50.4 50.4
05:00 EZ Unemployment Rate (June) 9.9% 9.9%
10:00 US ISM Manufacturing(July) 55.3 55
Overview
Real GDP in Q2 for the US rose just 1.3%, as personal consumption virtually stalled (+0.1% vs. +2.1% previously). The prior quarters were revised down as well. In light of the softer first half performance, our US economics team lowered their estimate of Q3 GDP by a full percentage point to 2.5%; and reduced Q4 from 4.3% to 3.0%. This could reduce US oil demand growth for 2H 2011 by some 200kb/d from prior forecasts. The US EIA, for example, has been expecting growth of about 100kb/d YoY, and lower GDP could turn that into -100kb/d.
Gold advanced to fresh record highs on Friday as the weak macro data from the US raised concerns about a sub-par economic recovery. The USD weakness and worries about US debt downgrades also reinforced the price rally- with no progress made Friday on the US debt ceiling law. The next key data release for the complex will be today’s US ISM report. Historically when the US ISM is above 50, the gold to silver ratio has trended lower, Figure 1.
The industrial metals complex remains vulnerable to the ebb and flow of market anxiety towards European and US debt outlook. China released its manufacturing PMI for July this morning, which fell to a 28 month low of 50.7 from 50.9 in June. We believe the market will turn its attention to the outlook for China inflation (next release on Aug 9th), which holds the key to monetary policy and hence industrial metals demand. Latest data from the Ministry of Commerce showed a moderation in food inflation and specifically pork prices, Figure 2. We expect the decline in inflation will allow the authorities to switch policy emphasis away from inflation towards supporting growth.
China’s Henan province, the country’s largest aluminium producing region, may face power cuts. We commented in the daily previously that that recent heat wave has resulted in a considerable increase in electricity consumption. Daily electricity generation was 8.15% higher compared to last year’s peak daily output. According to Reuters, aluminium smelters could face cuts of up to 20% of normal supplies and extend into mid-September if the hot weather persists. In addition to tight energy market, a potential cut in export rebate for aluminium products from 11% to 7% could reduce net exports and provide support for aluminium prices in our view.
Looking at today’s calendar, in Eurozone market will focus on manufacturing PMI and unemployment rate for July. In the US, ISM will provide important guidance on manufacturing activity. Non-farm payroll report will be released towards the end of this week.
Commodities & Global Markets
Commodities News In Brief
• China produced about 19.5m tonnes of crude steel, equivalent to 1.95mn tonnes per day, down by 0.3% from the first ten days of this month, according to the China Iron & Steel Association.
• Japan’s crude oil imports in June fell 4.4% to 3.05mn barrels per day from a year earlier
• China’s inbound shipments of soybeans are forecast to drop to 3.2mn tonnes in August from 5mn tonnes projected this month, the Ministry of Commerce said.
• Sugar exports from India may be as much as 4mn tonnes in the year beginning Oct.1, according to six producers and traders in a Bloomberg News survey. That compares with an estimated 2.1mn tonnes this year, according to the Indian Sugar Mills Association.
Global Markets News In Brief
• Japan Housing Starts (YoY) fell to 5.8% in Jun from 6.4%.
• Germany Retail Sales increased to 6.3% from -2.5% (MoM) in June, while fell (YoY) to -1% vs 3.1%.
• UK Nationwide Housing Prices n.s.a (YoY) increased to -0.4% from -1.1% in July, while increased to 0.2% vs 0% (MoM).
• US GDP QoQ rose at a 1.3% annual rate following a 0.4% gain in Q1.
• US Chicago PMI fell to 58.8 points in July, down from 61.1in June.
• US U.of Michigan confidence fell to 63.7 from 71.5 in June.
• China leading index fell to 101.76 from 101.92 (MoM) in June.
• China PMI Manufacturing fell to 50.7 in July from 50.9 in June.
Event Risks
• Germany PMI Services on August 3 • EZ Retail Sales on August 3 • US MBA Mtg. Applications on August 3 • US Factory Orders on August 3 • US non-farm payroll on August 5
Research Team Adam Sieminski Xiao Fu Research Analyst Research Analyst (1) 20 2662 1624 (44) 20 7547 1558 [email protected] [email protected]
2 August 2011 Strategy Asia Equities Daily Focus
Deutsche Bank AG/Hong Kong Page 21
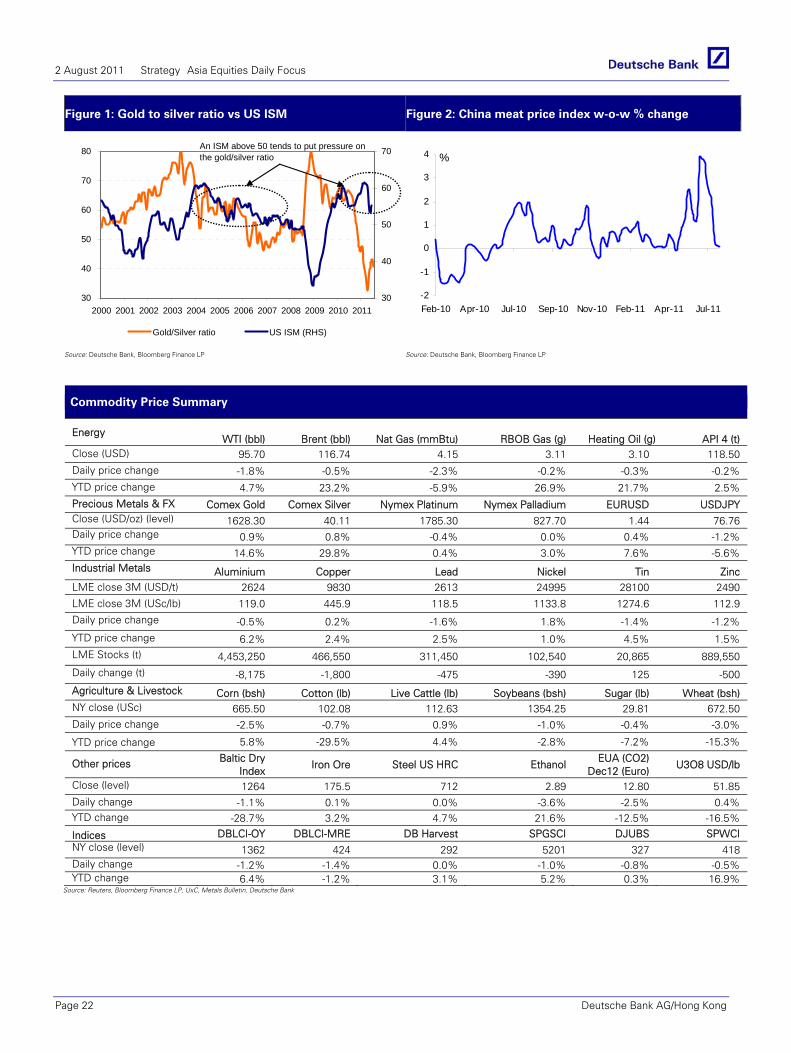
Figure 1: Gold to silver ratio vs US ISM Figure 2: China meat price index w-o-w % change
30
40
50
60
70
80
2000 2001 2002 2003 2004 2005 2006 2007 2008 2009 2010 201130
40
50
60
70
Gold/Silver ratio US ISM (RHS)
An ISM above 50 tends to put pressure on the gold/silver ratio
-2
-1
0
1
2
3
4
Feb-10 Apr-10 Jul-10 Sep-10 Nov-10 Feb-11 Apr-11 Jul-11
%
Source: Deutsche Bank, Bloomberg Finance LP Source: Deutsche Bank, Bloomberg Finance LP
Commodity Price Summary
Energy WTI (bbl) Brent (bbl) Nat Gas (mmBtu) RBOB Gas (g) Heating Oil (g) API 4 (t)
Close (USD) 95.70 116.74 4.15 3.11 3.10 118.50 Daily price change -1.8% -0.5% -2.3% -0.2% -0.3% -0.2% YTD price change 4.7% 23.2% -5.9% 26.9% 21.7% 2.5% Precious Metals & FX Comex Gold Comex Silver Nymex Platinum Nymex Palladium EURUSD USDJPY Close (USD/oz) (level) 1628.30 40.11 1785.30 827.70 1.44 76.76 Daily price change 0.9% 0.8% -0.4% 0.0% 0.4% -1.2% YTD price change 14.6% 29.8% 0.4% 3.0% 7.6% -5.6% Industrial Metals Aluminium Copper Lead Nickel Tin Zinc LME close 3M (USD/t) 2624 9830 2613 24995 28100 2490
LME close 3M (USc/lb) 119.0 445.9 118.5 1133.8 1274.6 112.9
Daily price change -0.5% 0.2% -1.6% 1.8% -1.4% -1.2%
YTD price change 6.2% 2.4% 2.5% 1.0% 4.5% 1.5% LME Stocks (t) 4,453,250 466,550 311,450 102,540 20,865 889,550
Daily change (t) -8,175 -1,800 -475 -390 125 -500
Agriculture & Livestock Corn (bsh) Cotton (lb) Live Cattle (lb) Soybeans (bsh) Sugar (lb) Wheat (bsh) NY close (USc) 665.50 102.08 112.63 1354.25 29.81 672.50 Daily price change -2.5% -0.7% 0.9% -1.0% -0.4% -3.0%
YTD price change 5.8% -29.5% 4.4% -2.8% -7.2% -15.3%
Other prices Baltic Dry Index
Iron Ore Steel US HRC Ethanol EUA (CO2)
Dec12 (Euro) U3O8 USD/lb
Close (level) 1264 175.5 712 2.89 12.80 51.85 Daily change -1.1% 0.1% 0.0% -3.6% -2.5% 0.4% YTD change -28.7% 3.2% 4.7% 21.6% -12.5% -16.5%
Indices DBLCI-OY DBLCI-MRE DB Harvest SPGSCI DJUBS SPWCI NY close (level) 1362 424 292 5201 327 418 Daily change -1.2% -1.4% 0.0% -1.0% -0.8% -0.5% YTD change 6.4% -1.2% 3.1% 5.2% 0.3% 16.9%
Source: Reuters, Bloomberg Finance LP, UxC, Metals Bulletin, Deutsche Bank
2 August 2011 Strategy Asia Equities Daily Focus
Page 22 Deutsche Bank AG/Hong Kong

Asia China Technology
1 August 2011
China TMT Daily More app factoids; also, SINA, 0700.HK
(Please click through to the .pdf version of this document for a full overview of today's
news and views.)
Periodical
TOP CHINA TMT PICKS Company Rating Target Price AsiaInfo-Linkage Buy USD 26.30 China Telecom Buy HKD 5.70 ZTE Buy HKD 35.65
CHINA TMT STOCKS Company Rating Close Price 1D% 3M%
TELCOS as on 29/07China Comm Service Buy 3.9 -1.3 -16.9China Mobile Hold 77.6 -0.3 8.6China Telecom Buy 5.1 -1.4 13.4China Unicom Buy 15.5 -1.0 -1.8 INTERNET/ONLINE GAMING Alibaba.com Hold 10.9 -0.9 -21.2Baidu Buy 157.1 -0.8 5.8Ctrip.com Int'l Hold 46.1 0.3 -5.4Netease.com Buy 50.5 0.2 2.5Shanda Hold 35.0 -0.3 -27.6Shanda Games Hold 6.0 -3.7 -19.9Sina Corp Hold 108.1 -2.7 -19.8Sohu.com Hold 90.1 1.4 -14.8Tencent Buy 202.8 -1.1 -8.2 TECHNOLOGY AsiaInfo-Linkage Buy 15.3 -4.1 -19.2ChinaCache Buy 7.7 -1.3 -54.3Foxconn Int'l Hldgs Hold 3.6 -1.7 -22.5SouFun Buy 20.8 -0.3 -9.8Synnex Technology Buy 74.0 -2.4 1.2ZTE Buy 24.4 -0.8 -12.9 Indices Close 1D% 3M% as on 29/07HSI 22440.3 -0.6 -5.4HSCEI 12373.6 -1.2 -6.3Nasdaq 2756.4 -0.4 -4.1Sources: DB, Bloomberg Finance LP
CALENDAR OF EVENTS
Research Team
Alan Hellawell III Research Analyst (+852) 2203 6240 [email protected]
Eva Leung, CFA Research Analyst (+852) 2203 6190 [email protected]
FEATURE:
71% of freemium game transactions spent on in-app purchases cost under $10 We continue our discussion of the previous TMT daily around the topic of “Free” apps vs. paid apps with some additional updates. As profiled in an earlier Daily, mobile application analytics firm Flurry in a report released in May revealed that games drove 75% of revenue generated among the top 100 grossing iOS apps, of which 65% were generated from freemium games. Flurry recently conducted another study which analyzed how 3.5m consumers spent their money across top iOS and Android freemium games. Flurry organized the data into three price buckets representing the amount of money spent on freemium games: from $0.99 - $10, from $10 - $20, and over $20. Interestingly, about 71% of all transactions were under $10, 16% involved spending of between $10 to $20, and 13% for greater than $20. The average amount spent per transaction was $14.
The "over $20 in-app" price bracket generated half of the total revenues in freemium games Flurry data further showed that within the “under $10” bucket, most transactions clustered at the $9.99 level, followed by $4.99, and finally $0.99. An interesting question that arose was that why do consumers spend $0.99 less than 2% of the time in freemium games when this price point is so popular among premium games? Company analysts suggest that freemium gamers have a different mindset in deciding whether or not to spend. Flurry data showed that about 3% of consumers will spend on freemium games, and that a deeper commitment to the games will drive more spending. Additionally, the study revealed that high-end of the spending spectrum drove up the $14 average price point. Over 5% of all purchases were for amounts greater than $50, which were comparable to the price point of top console and PC games sold at retail shops.
US iOS and Android game revenue will likely surpass $1b by the end of 2011 With regard to the revenues generated by each price bracket, even though about two thirds of all transactions were for spends under $10, this price bracket generated only 31% of total revenues; while the bulk of revenues (51%) were generated at points over $20 and the $10 to $20 bracket accounted for the rest (18%). The “over $20” category and the data showed that 30% of total revenues were generated from transaction sizes over $50. Clearly, a small number of high-spenders actually make up a bulk of the revenues for freemium apps. Flurry meanwhile estimates that US iOS and Android game revenue will continue to see strong growth, surpassing the $1 billion mark by the end of 2011.
2 August 2011 Strategy Asia Equities Daily Focus 2 August 2011 Strategy Asia Equities Daily Focus
Deutsche Bank AG/Hong Kong Page 23
Asia ChinaEnergy Alternative Energy
01 Aug 2011 - 11:47:10 AM HKT
INDUSTRY ALERT Breaking NewsAlternative Energy China announced a national on-grid tariff for solar PV
Focus stocksTrina Solar (TSL.N),USD17.91 Buy,Price Target USD20.90
Renesola (SOL.N),USD4.53 Hold,Price Target USD3.80
Suntech Power Holdings(STP.N),USD7.34 Hold, Price TargetUSD6.20
Yingli Green Energy(YGE.N),USD7.24 Hold, Price TargetUSD7.70
A unified national on-grid solar PV tariff of Rmb1.15/kWh from NDRCThe National Development and Reform Commission (NDRC) announcedtoday that it would unify the benchmark solar PV on-grid tariff. For solar PVprojects approved before 1 July 2011 and completed by 31 December 2011,the on-grid tariff would be set at Rmb1.15/kWh (incl. VAT). While for solarPV projects approved after 1 July 2011, as well as for solar PV projectsapproved before 1 July 2011 but not be able to complete by 31 December2011, the on-grid tariff after VAT would be set at Rmb1/kWh (except forTibet which would still be at Rmb1.15/kWh). Such on-grid solar tariff will beadjusted accordingly based on future investment cost and technology ad-vancement, and will not apply to projects under the Golden Sun Programand concession bidding projects. We expect the renewable energy sur-charge to be raised from the current Rmb0.004/kWh level, in order toprovide sufficient funding for the potential new solar PV projects.
Mid-to-high single digit project IRR under c.US$1.2/W module ASPThe market is likely to react positively to the news in our view, as this islikely to drive higher demand from China in 2H11E (which we highlighted inour report dated 21 July 2011 and expect installations to easily exceed 1GWfor 2011E). However, we believe such level of on-grid solar PV tariff wouldnot have a significant impact to restore the margin of the module makersback to 2010 levels. On our estimate, a tariff of Rmb1.15/kWh (incl. VAT)would only offer a project IRR of mid-to-high single digit, assuming a moduleASP of Rmb9/W (incl. VAT) or c.US$1.2/W (excl. VAT) for regions with 2,000hours of utilisation p.a.
Module ASP unlikely to have a strong rebound; prefer TrinaWe continue to believe a likely demand pick up may present some tradingopportunities in the sector. However, investors should remain selective assupply should remain relatively abundant and ASP should not reboundstrong enough to allow low-tier (or high beta) manufacturers to restore theirprofitability. We prefer the leading low cost Chinese players and have a Buyrating on Trina.
Eric Cheng, CFAResearch Analyst(+852) 2203 [email protected]
Michael Tong, CFAResearch Analyst(+852) 2203 [email protected]
2 August 2011 Strategy Asia Equities Daily Focus
Page 24 Deutsche Bank AG/Hong Kong

Asia China Property Property
1 August 2011
China Prop Weekly Monitor Sales volume continue to rebound in Tier-1 citiesTony Tsang Research Analyst (+852) 2203 6256 [email protected]
Jason Ching, CFA Research Analyst (+852) 2203 6205 [email protected]
Karl Shen Research Associate (+852) 2203 6160 [email protected]
Overall transaction volume up 2.6% WoW Overall volume for the 39 major cities surged 2.6% WoW last week, after a strong 13.4% WoW rise the week before. Though July is traditionally a low season for home sales, volume is still robust as more and more developers are cutting prices to boost sales. While the government is determined to uphold property-tightening measures and boost public housing construction, we think potential end-user demand can be ignited by lower prices despite home purchase restrictions.
Industry Update
Companies featured China Vanke (000002.SZ),CNY8.29 Buy
2010A 2011E 2012EP/E(x) 12.9 9.2 9.1EV/EBITDA(x) 7.5 4.8 4.4Price/book(x) 2.0 1.7 1.5Poly HK (0119.HK),HKD5.74 Buy
2010A 2011E 2012EP/E (x) 22.4 8.4 6.1EV/EBITDA (x) 15.8 7.9 5.1Price/book (x) 1.2 0.8 0.7Yuexiu Property (0123.HK),HKD1.44 Buy
2009A 2010E 2011EP/E(x) – 8.8 6.9EV/EBITDA(x) 12.6 8.8 4.1Price/book(x) 1.0 0.6 0.6Minmetals Land Limited (0230.HK),HKD1.29 Buy
2010A 2011E 2012EP/E(x) 5.2 9.0 3.6EV/EBITDA(x) 11.5 -0.0 -2.0Price/book(x) 0.9 0.7 0.6Shui On Land Ltd (0272.HK),HKD3.45 Buy
2010A 2011E 2012EP/E(x) 22.5 18.4 8.5EV/EBITDA(x) 17.9 14.7 7.2Price/book(x) 0.7 0.5 0.5China Resources Land (1109.HK),HKD15.60 Buy
2010A 2011E 2012EP/E (x) 19.4 14.2 10.8EV/EBITDA (x) 11.9 10.3 7.3Price/book (x) 1.7 1.7 1.5KWG Property (1813.HK),HKD5.54 Buy
2009A 2010E 2011EP/E(x) 10.8 10.9 6.6EV/EBITDA(x) 9.2 7.0 3.5Price/book(x) 1.5 1.2 1.0Country Garden Holdings (2007.HK),HKD4.07 Sell
2009A 2010E 2011EP/E(x) 22.2 21.4 18.4EV/EBITDA(x) 12.6 11.6 10.9Price/book(x) 2.0 2.4 2.2Guangzhou R&F Prop (2777.HK),HKD10.30 Buy
2010A 2011E 2012EP/E(x) 9.4 5.5 4.6EV/EBITDA(x) 5.9 4.6 3.7Price/book(x) 1.6 1.2 1.0Agile Property (3383.HK),HKD12.60 Buy
2010A 2011E 2012EP/E(x) 8.3 8.5 6.7EV/EBITDA(x) 6.0 5.6 4.0Price/book(x) 1.9 1.6 1.4SOHO China (0410.HK),HKD7.11 Buy
2010A 2011E 2012EP/E(x) 6.9 26.4 11.5EV/EBITDA(x) 1.3 9.8 2.7Price/book(x) 1.4 1.5 1.4Evergrande (3333.HK),HKD5.95 Buy
2010A 2011E 2012EP/E(x) 7.3 8.9 6.5EV/EBITDA(x) 5.5 6.2 4.5Price/book(x) 2.4 2.7 2.1Franshion (0817.HK),HKD2.18 Buy
2009A 2010E 2011EP/E(x) 14.3 17.1 13.9EV/EBITDA(x) 12.6 12.3 8.8Price/book(x) 1.5 0.9 0.9
Volume in Tier-1 cities up 23.6% WoW Total sales volume in Tier-1 cities rose 23.6% WoW last week. Volume in Beijing, Shanghai, Shenzhen and Guangzhou rose 23%, 26%, 33% and 14% WoW respectively, thanks to additional price cuts. Overall volume in Tier-1 cities is now 15.2% below the peak of April 2010, but it is still 28.1% higher YoY. Transactions in Tier-1 cities now account for about 19.5% of total sales volume for the 39 major cities. Overall ASP for Tier-1 cities rose 7% WoW last week, with increases of 35.3% in Shenzhen and 7.2% in Guangzhou. ASP fell 8.8% WoW in Beijing and 3.5% WoW in Shanghai.
Volume in Tier-2/3 cities down 1.5% WoW Sales volume in Tier-2/3 cities declined slightly, 1.5% WoW. Volume is now 42% below the April 2010 peak but 21% higher YoY. Wenzhou, Kunming and Wuxi led the rise with WoW gains of 285%, 91% and 64% respectively, while Xi’an, Nanjing and Ningbo had the largest WoW declines of 45%, 41% and 41% respectively. Overall ASP for Tier-2/3 cities fell 2.6% WoW.
Tightening continues and relaxation policy is unlikely before year end President Hu Jintao chaired a meeting of the politburo on 22 July, focusing on containing inflation and property prices. In the meeting, Hu reiterated the central government's determination to uphold property tightening-measures to curb surging home prices and boost public housing constructions. Following the meeting, the CBRC vowed its support for public housing, and the local housing bureau also reiterated the urgency of following through HPR for the remaining of the year.
Our top picks: COLI, COGO, CSCI, CR Land, Evergrande, R&F and Glorious We believe government policies will likely remain focused on three areas: 1) development of public housing; 2) implementation of home purchase restrictions; and 3) credit tightening. In the near term, significant new tightening measures are not likely; some local governments might try to limit developers' selling prices, but these related measures are even more difficult to implement in our view. In addition, regulators may tighten restrictions on trust loans for developers, which means that some of them would be under greater pressure to cut prices. We recommend focusing on: 1) developers that can pursue counter-cyclical expansion amid credit tightening, such as COLI, Vanke, and SOHO China; 2) companies participating in the development of public housing, like CSCI; 3) developers focusing on Tier-3/4 cities, such as COGO and Evergrande; and 4) developers that look undervalued, like CR Land, R&F and Glorious, which could achieve a turnaround if sales continue to accelerate. Our target prices are based on DCF-based NAVs. Risks: stronger-than-expected inflationary pressures in China, which may lead to more government measures, and unexpected economic volatility.
2 August 2011 Strategy Asia Equities Daily Focus
Deutsche Bank AG/Hong Kong Page 25
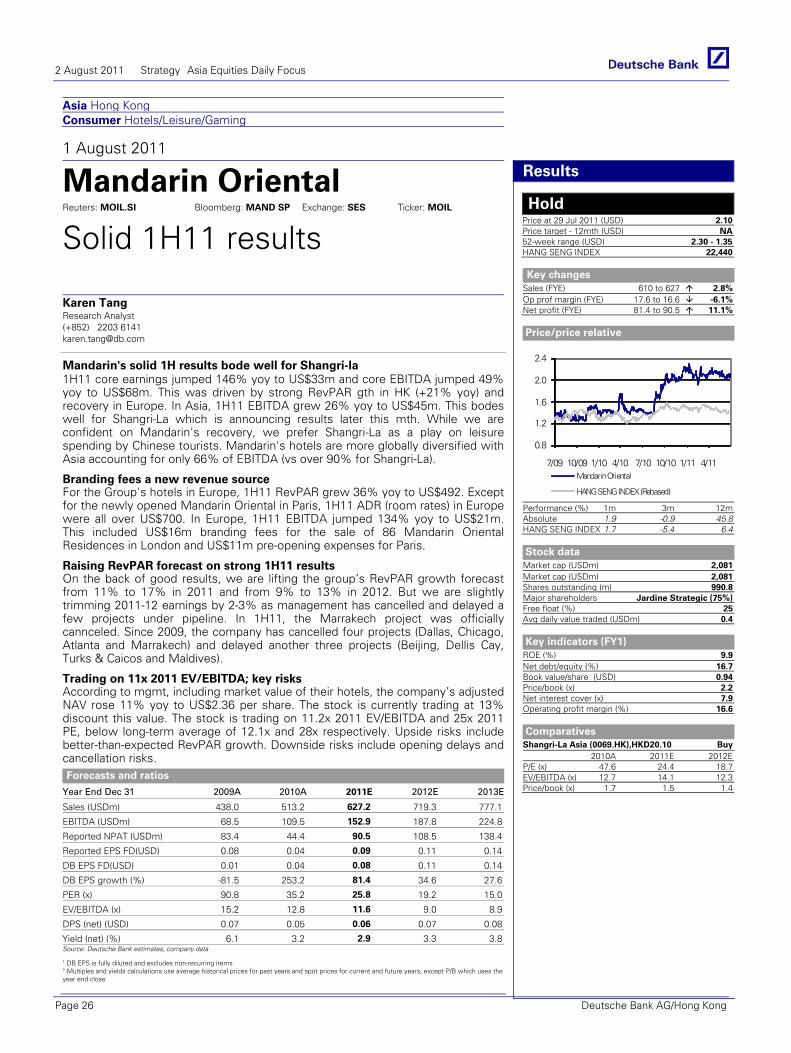
Asia Hong Kong Consumer Hotels/Leisure/Gaming
1 August 2011
Mandarin Oriental Reuters: MOIL.SI Bloomberg: MAND SP Exchange: SES Ticker: MOIL
Solid 1H11 results
Karen Tang Research Analyst (+852) 2203 6141 [email protected]
Mandarin's solid 1H results bode well for Shangri-la 1H11 core earnings jumped 146% yoy to US$33m and core EBITDA jumped 49% yoy to US$68m. This was driven by strong RevPAR gth in HK (+21% yoy) and recovery in Europe. In Asia, 1H11 EBITDA grew 26% yoy to US$45m. This bodes well for Shangri-La which is announcing results later this mth. While we are confident on Mandarin's recovery, we prefer Shangri-La as a play on leisure spending by Chinese tourists. Mandarin's hotels are more globally diversified with Asia accounting for only 66% of EBITDA (vs over 90% for Shangri-La).
Forecasts and ratios
Year End Dec 31 2009A 2010A 2011E 2012E 2013E
Sales (USDm) 438.0 513.2 627.2 719.3 777.1
EBITDA (USDm) 68.5 109.5 152.9 187.8 224.8
Reported NPAT (USDm) 83.4 44.4 90.5 108.5 138.4
Reported EPS FD(USD) 0.08 0.04 0.09 0.11 0.14
DB EPS FD(USD) 0.01 0.04 0.08 0.11 0.14
DB EPS growth (%) -81.5 253.2 81.4 34.6 27.6
PER (x) 90.8 35.2 25.8 19.2 15.0
EV/EBITDA (x) 15.2 12.8 11.6 9.0 8.9
DPS (net) (USD) 0.07 0.05 0.06 0.07 0.08
Yield (net) (%) 6.1 3.2 2.9 3.3 3.8Source: Deutsche Bank estimates, company data
1 DB EPS is fully diluted and excludes non-recurring items 2 Multiples and yields calculations use average historical prices for past years and spot prices for current and future years, except P/B which uses the year end close
Results
Hold Price at 29 Jul 2011 (USD) 2.10Price target - 12mth (USD) NA52-week range (USD) 2.30 - 1.35HANG SENG INDEX 22,440
Key changes
Sales (FYE) 610 to 627 2.8%Op prof margin (FYE) 17.6 to 16.6 -6.1%Net profit (FYE) 81.4 to 90.5 11.1%
Price/price relative
0.8
1.2
1.6
2.0
2.4
7/09 10/09 1/10 4/10 7/10 10/10 1/11 4/11Mandarin Oriental
HANG SENG INDEX (Rebased)
Performance (%) 1m 3m 12mAbsolute 1.9 -0.9 45.8HANG SENG INDEX 1.7 -5.4 6.4
Stock data
Market cap (USDm) 2,081Market cap (USDm) 2,081Shares outstanding (m) 990.8Major shareholders Jardine Strategic (75%)Free float (%) 25Avg daily value traded (USDm) 0.4
Key indicators (FY1)
ROE (%) 9.9Net debt/equity (%) 16.7Book value/share (USD) 0.94Price/book (x) 2.2Net interest cover (x) 7.9Operating profit margin (%) 16.6
Comparatives
Shangri-La Asia (0069.HK),HKD20.10 Buy2010A 2011E 2012E
P/E (x) 47.6 24.4 18.7EV/EBITDA (x) 12.7 14.1 12.3Price/book (x) 1.7 1.5 1.4
Branding fees a new revenue source For the Group's hotels in Europe, 1H11 RevPAR grew 36% yoy to US$492. Except for the newly opened Mandarin Oriental in Paris, 1H11 ADR (room rates) in Europe were all over US$700. In Europe, 1H11 EBITDA jumped 134% yoy to US$21m. This included US$16m branding fees for the sale of 86 Mandarin Oriental Residences in London and US$11m pre-opening expenses for Paris.
Raising RevPAR forecast on strong 1H11 results On the back of good results, we are lifting the group’s RevPAR growth forecast from 11% to 17% in 2011 and from 9% to 13% in 2012. But we are slightly trimming 2011-12 earnings by 2-3% as management has cancelled and delayed a few projects under pipeline. In 1H11, the Marrakech project was officially cannceled. Since 2009, the company has cancelled four projects (Dallas, Chicago, Atlanta and Marrakech) and delayed another three projects (Beijing, Dellis Cay, Turks & Caicos and Maldives).
Trading on 11x 2011 EV/EBITDA; key risks According to mgmt, including market value of their hotels, the company’s adjusted NAV rose 11% yoy to US$2.36 per share. The stock is currently trading at 13% discount this value. The stock is trading on 11.2x 2011 EV/EBITDA and 25x 2011 PE, below long-term average of 12.1x and 28x respectively. Upside risks include better-than-expected RevPAR growth. Downside risks include opening delays and cancellation risks.
2 August 2011 Strategy Asia Equities Daily Focus
Page 26 Deutsche Bank AG/Hong Kong
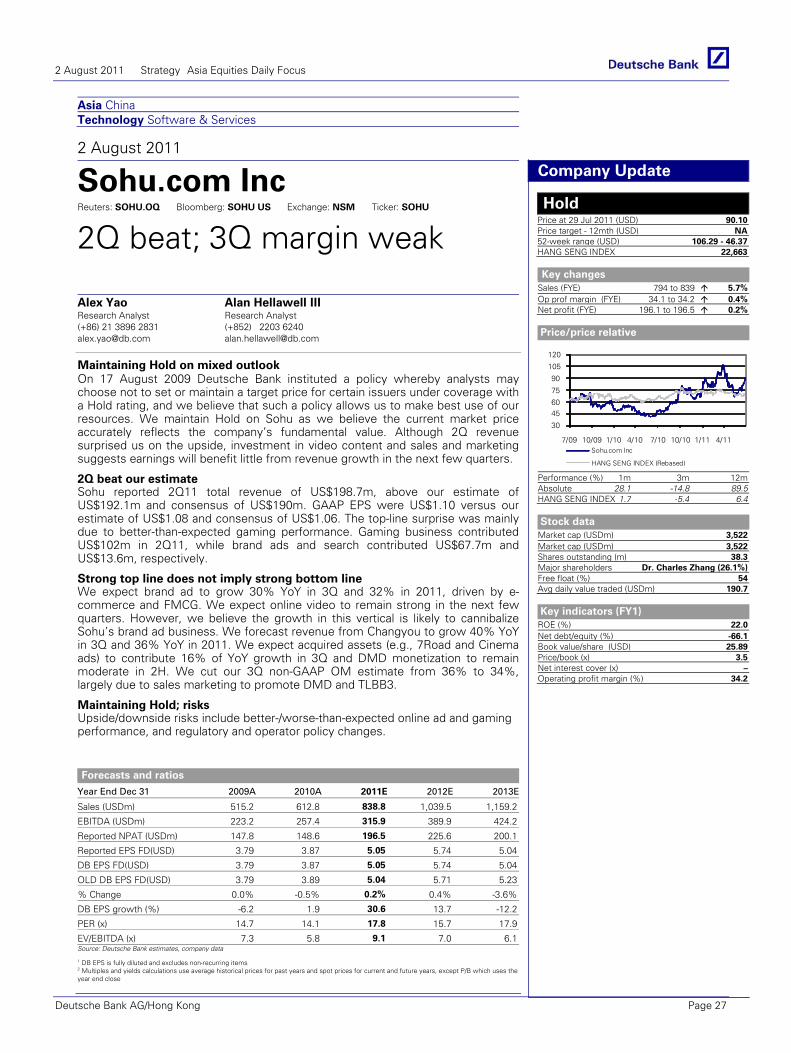
Asia China Technology Software & Services
2 August 2011
Sohu.com Inc Reuters: SOHU.OQ Bloomberg: SOHU US Exchange: NSM Ticker: SOHU
2Q beat; 3Q margin weak
Alex Yao Research Analyst (+86) 21 3896 2831 [email protected]
Alan Hellawell III Research Analyst (+852) 2203 6240 [email protected]
Maintaining Hold on mixed outlook On 17 August 2009 Deutsche Bank instituted a policy whereby analysts may choose not to set or maintain a target price for certain issuers under coverage with a Hold rating, and we believe that such a policy allows us to make best use of our resources. We maintain Hold on Sohu as we believe the current market price accurately reflects the company’s fundamental value. Although 2Q revenue surprised us on the upside, investment in video content and sales and marketing suggests earnings will benefit little from revenue growth in the next few quarters.
Forecasts and ratios
Year End Dec 31 2009A 2010A 2011E 2012E 2013E
Sales (USDm) 515.2 612.8 838.8 1,039.5 1,159.2
EBITDA (USDm) 223.2 257.4 315.9 389.9 424.2
Reported NPAT (USDm) 147.8 148.6 196.5 225.6 200.1
Reported EPS FD(USD) 3.79 3.87 5.05 5.74 5.04
DB EPS FD(USD) 3.79 3.87 5.05 5.74 5.04
OLD DB EPS FD(USD) 3.79 3.89 5.04 5.71 5.23
% Change 0.0% -0.5% 0.2% 0.4% -3.6%
DB EPS growth (%) -6.2 1.9 30.6 13.7 -12.2
PER (x) 14.7 14.1 17.8 15.7 17.9
EV/EBITDA (x) 7.3 5.8 9.1 7.0 6.1Source: Deutsche Bank estimates, company data
1 DB EPS is fully diluted and excludes non-recurring items 2 Multiples and yields calculations use average historical prices for past years and spot prices for current and future years, except P/B which uses the year end close
Company Update
Hold Price at 29 Jul 2011 (USD) 90.10Price target - 12mth (USD) NA52-week range (USD) 106.29 - 46.37HANG SENG INDEX 22,663
Key changes
Sales (FYE) 794 to 839 5.7%Op prof margin (FYE) 34.1 to 34.2 0.4%Net profit (FYE) 196.1 to 196.5 0.2%
Price/price relative
30
4560
75
90
105
120
7/09 10/09 1/10 4/10 7/10 10/10 1/11 4/11Sohu.com Inc
HANG SENG INDEX (Rebased)
Performance (%) 1m 3m 12mAbsolute 28.1 -14.8 89.5HANG SENG INDEX 1.7 -5.4 6.4
Stock data
Market cap (USDm) 3,522Market cap (USDm) 3,522Shares outstanding (m) 38.3Major shareholders Dr. Charles Zhang (26.1%)Free float (%) 54Avg daily value traded (USDm) 190.7
Key indicators (FY1)
ROE (%) 22.0Net debt/equity (%) -66.1Book value/share (USD) 25.89Price/book (x) 3.5Net interest cover (x) –Operating profit margin (%) 34.2
2Q beat our estimate Sohu reported 2Q11 total revenue of US$198.7m, above our estimate of US$192.1m and consensus of US$190m. GAAP EPS were US$1.10 versus our estimate of US$1.08 and consensus of US$1.06. The top-line surprise was mainly due to better-than-expected gaming performance. Gaming business contributed US$102m in 2Q11, while brand ads and search contributed US$67.7m and US$13.6m, respectively.
Strong top line does not imply strong bottom line We expect brand ad to grow 30% YoY in 3Q and 32% in 2011, driven by e-commerce and FMCG. We expect online video to remain strong in the next few quarters. However, we believe the growth in this vertical is likely to cannibalize Sohu’s brand ad business. We forecast revenue from Changyou to grow 40% YoY in 3Q and 36% YoY in 2011. We expect acquired assets (e.g., 7Road and Cinema ads) to contribute 16% of YoY growth in 3Q and DMD monetization to remain moderate in 2H. We cut our 3Q non-GAAP OM estimate from 36% to 34%, largely due to sales marketing to promote DMD and TLBB3.
Maintaining Hold; risks Upside/downside risks include better-/worse-than-expected online ad and gaming performance, and regulatory and operator policy changes.
2 August 2011 Strategy Asia Equities Daily Focus
Deutsche Bank AG/Hong Kong Page 27
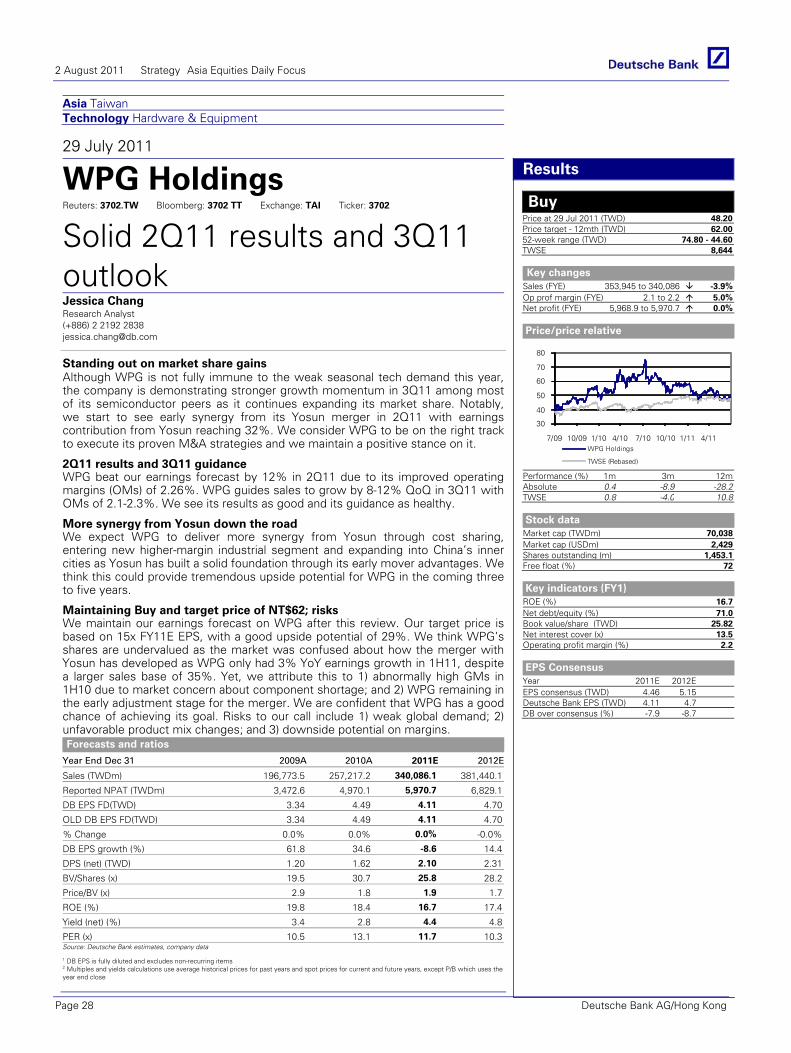
Asia Taiwan Technology Hardware & Equipment
29 July 2011
WPG Holdings Reuters: 3702.TW Bloomberg: 3702 TT Exchange: TAI Ticker: 3702
Solid 2Q11 results and 3Q11 outlook Jessica Chang Research Analyst (+886) 2 2192 2838 [email protected]
Standing out on market share gains Although WPG is not fully immune to the weak seasonal tech demand this year, the company is demonstrating stronger growth momentum in 3Q11 among most of its semiconductor peers as it continues expanding its market share. Notably, we start to see early synergy from its Yosun merger in 2Q11 with earnings contribution from Yosun reaching 32%. We consider WPG to be on the right track to execute its proven M&A strategies and we maintain a positive stance on it.
Forecasts and ratios
Year End Dec 31 2009A 2010A 2011E 2012E
Sales (TWDm) 196,773.5 257,217.2 340,086.1 381,440.1
Reported NPAT (TWDm) 3,472.6 4,970.1 5,970.7 6,829.1
DB EPS FD(TWD) 3.34 4.49 4.11 4.70
OLD DB EPS FD(TWD) 3.34 4.49 4.11 4.70
% Change 0.0% 0.0% 0.0% -0.0%
DB EPS growth (%) 61.8 34.6 -8.6 14.4
DPS (net) (TWD) 1.20 1.62 2.10 2.31
BV/Shares (x) 19.5 30.7 25.8 28.2
Price/BV (x) 2.9 1.8 1.9 1.7
ROE (%) 19.8 18.4 16.7 17.4
Yield (net) (%) 3.4 2.8 4.4 4.8
PER (x) 10.5 13.1 11.7 10.3Source: Deutsche Bank estimates, company data
1 DB EPS is fully diluted and excludes non-recurring items 2 Multiples and yields calculations use average historical prices for past years and spot prices for current and future years, except P/B which uses the year end close
Results
Buy Price at 29 Jul 2011 (TWD) 48.20Price target - 12mth (TWD) 62.0052-week range (TWD) 74.80 - 44.60TWSE 8,644
Key changes
Sales (FYE) 353,945 to 340,086 -3.9%Op prof margin (FYE) 2.1 to 2.2 5.0%Net profit (FYE) 5,968.9 to 5,970.7 0.0%
Price/price relative
30
40
50
60
70
80
7/09 10/09 1/10 4/10 7/10 10/10 1/11 4/11WPG Holdings
TWSE (Rebased)
Performance (%) 1m 3m 12mAbsolute 0.4 -8.9 -28.2TWSE 0.8 -4.0 10.8
Stock data
Market cap (TWDm) 70,038Market cap (USDm) 2,429Shares outstanding (m) 1,453.1Free float (%) 72
Key indicators (FY1)
ROE (%) 16.7Net debt/equity (%) 71.0Book value/share (TWD) 25.82Net interest cover (x) 13.5Operating profit margin (%) 2.2
EPS Consensus
Year 2011E 2012EEPS consensus (TWD) 4.46 5.15Deutsche Bank EPS (TWD) 4.11 4.7DB over consensus (%) -7.9 -8.7
2Q11 results and 3Q11 guidance WPG beat our earnings forecast by 12% in 2Q11 due to its improved operating margins (OMs) of 2.26%. WPG guides sales to grow by 8-12% QoQ in 3Q11 with OMs of 2.1-2.3%. We see its results as good and its guidance as healthy.
More synergy from Yosun down the road We expect WPG to deliver more synergy from Yosun through cost sharing, entering new higher-margin industrial segment and expanding into China’s inner cities as Yosun has built a solid foundation through its early mover advantages. We think this could provide tremendous upside potential for WPG in the coming three to five years.
Maintaining Buy and target price of NT$62; risks We maintain our earnings forecast on WPG after this review. Our target price is based on 15x FY11E EPS, with a good upside potential of 29%. We think WPG’s shares are undervalued as the market was confused about how the merger with Yosun has developed as WPG only had 3% YoY earnings growth in 1H11, despite a larger sales base of 35%. Yet, we attribute this to 1) abnormally high GMs in 1H10 due to market concern about component shortage; and 2) WPG remaining in the early adjustment stage for the merger. We are confident that WPG has a good chance of achieving its goal. Risks to our call include 1) weak global demand; 2) unfavorable product mix changes; and 3) downside potential on margins.
2 August 2011 Strategy Asia Equities Daily Focus
Page 28 Deutsche Bank AG/Hong Kong
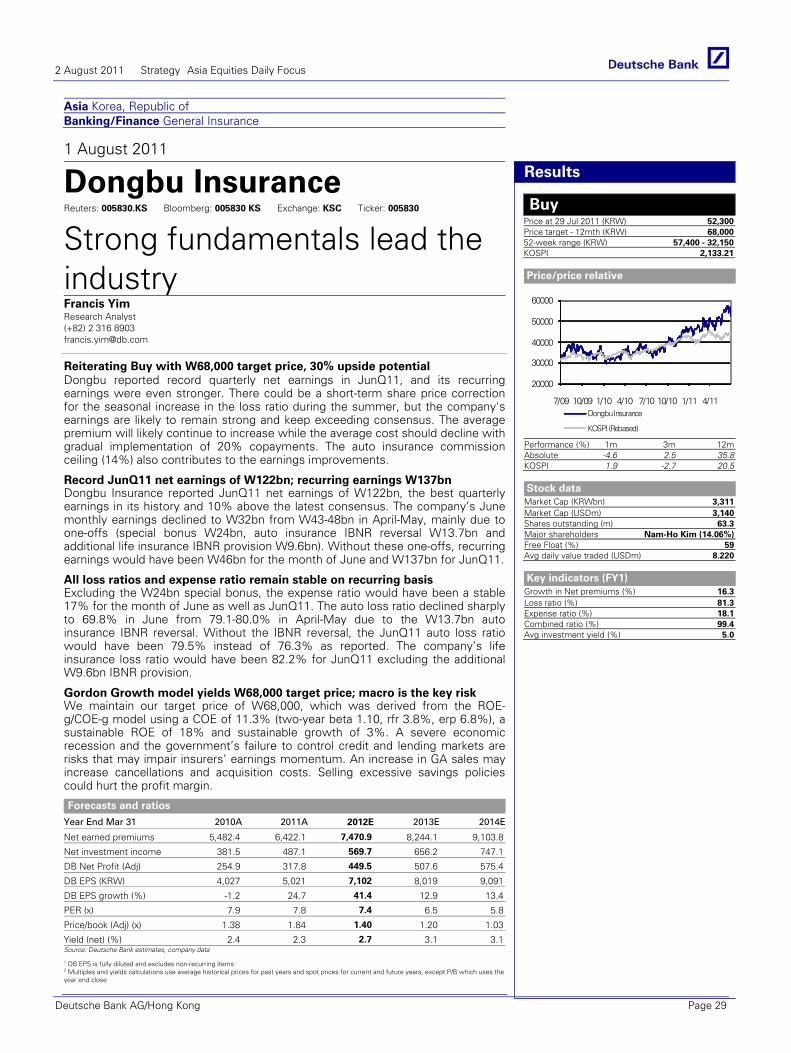
Asia Korea, Republic of Banking/Finance General Insurance
1 August 2011
Dongbu Insurance Reuters: 005830.KS Bloomberg: 005830 KS Exchange: KSC Ticker: 005830
Strong fundamentals lead the industry Francis Yim Research Analyst (+82) 2 316 8903 [email protected]
Reiterating Buy with W68,000 target price, 30% upside potential Dongbu reported record quarterly net earnings in JunQ11, and its recurring earnings were even stronger. There could be a short-term share price correction for the seasonal increase in the loss ratio during the summer, but the company's earnings are likely to remain strong and keep exceeding consensus. The average premium will likely continue to increase while the average cost should decline with gradual implementation of 20% copayments. The auto insurance commission ceiling (14%) also contributes to the earnings improvements.
Forecasts and ratios
Year End Mar 31 2010A 2011A 2012E 2013E 2014E
Net earned premiums 5,482.4 6,422.1 7,470.9 8,244.1 9,103.8
Net investment income 381.5 487.1 569.7 656.2 747.1
DB Net Profit (Adj) 254.9 317.8 449.5 507.6 575.4
DB EPS (KRW) 4,027 5,021 7,102 8,019 9,091
DB EPS growth (%) -1.2 24.7 41.4 12.9 13.4
PER (x) 7.9 7.8 7.4 6.5 5.8
Price/book (Adj) (x) 1.38 1.84 1.40 1.20 1.03
Yield (net) (%) 2.4 2.3 2.7 3.1 3.1Source: Deutsche Bank estimates, company data
1 DB EPS is fully diluted and excludes non-recurring items 2 Multiples and yields calculations use average historical prices for past years and spot prices for current and future years, except P/B which uses the year end close
Results
Buy Price at 29 Jul 2011 (KRW) 52,300Price target - 12mth (KRW) 68,00052-week range (KRW) 57,400 - 32,150KOSPI 2,133.21
Price/price relative
20000
30000
40000
50000
60000
7/09 10/09 1/10 4/10 7/10 10/10 1/11 4/11Dongbu Insurance
KOSPI (Rebased)
Performance (%) 1m 3m 12mAbsolute -4.6 2.5 35.8KOSPI 1.9 -2.7 20.5
Stock data
Market Cap (KRWbn) 3,311Market Cap (USDm) 3,140Shares outstanding (m) 63.3Major shareholders Nam-Ho Kim (14.06%)Free Float (%) 59Avg daily value traded (USDm) 8.220
Key indicators (FY1)
Growth in Net premiums (%) 16.3Loss ratio (%) 81.3Expense ratio (%) 18.1Combined ratio (%) 99.4Avg investment yield (%) 5.0
Record JunQ11 net earnings of W122bn; recurring earnings W137bn Dongbu Insurance reported JunQ11 net earnings of W122bn, the best quarterly earnings in its history and 10% above the latest consensus. The company’s June monthly earnings declined to W32bn from W43-48bn in April-May, mainly due to one-offs (special bonus W24bn, auto insurance IBNR reversal W13.7bn and additional life insurance IBNR provision W9.6bn). Without these one-offs, recurring earnings would have been W46bn for the month of June and W137bn for JunQ11.
All loss ratios and expense ratio remain stable on recurring basis Excluding the W24bn special bonus, the expense ratio would have been a stable 17% for the month of June as well as JunQ11. The auto loss ratio declined sharply to 69.8% in June from 79.1-80.0% in April-May due to the W13.7bn auto insurance IBNR reversal. Without the IBNR reversal, the JunQ11 auto loss ratio would have been 79.5% instead of 76.3% as reported. The company’s life insurance loss ratio would have been 82.2% for JunQ11 excluding the additional W9.6bn IBNR provision.
Gordon Growth model yields W68,000 target price; macro is the key risk We maintain our target price of W68,000, which was derived from the ROE-g/COE-g model using a COE of 11.3% (two-year beta 1.10, rfr 3.8%, erp 6.8%), a sustainable ROE of 18% and sustainable growth of 3%. A severe economic recession and the government’s failure to control credit and lending markets are risks that may impair insurers’ earnings momentum. An increase in GA sales may increase cancellations and acquisition costs. Selling excessive savings policies could hurt the profit margin.
2 August 2011 Strategy Asia Equities Daily Focus
Deutsche Bank AG/Hong Kong Page 29
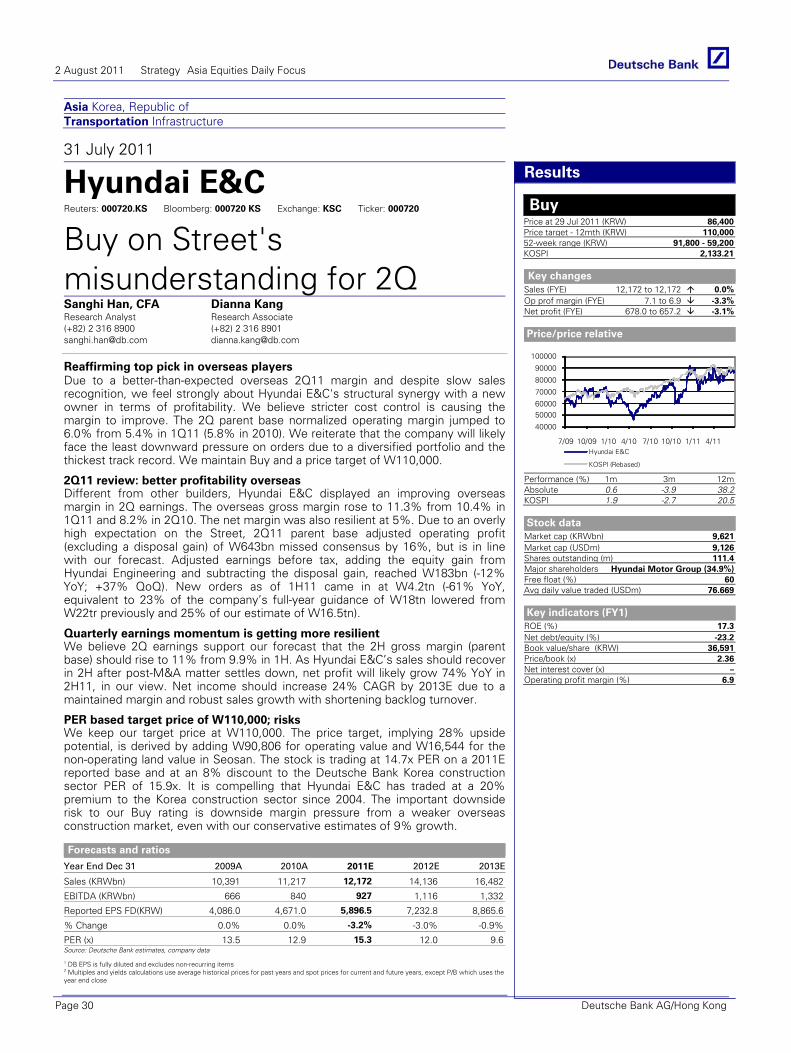
Asia Korea, Republic of Transportation Infrastructure
31 July 2011
Hyundai E&C Reuters: 000720.KS Bloomberg: 000720 KS Exchange: KSC Ticker: 000720
Buy on Street's misunderstanding for 2QSanghi Han, CFA Research Analyst (+82) 2 316 8900 [email protected]
Dianna Kang Research Associate (+82) 2 316 8901 [email protected]
Reaffirming top pick in overseas players Due to a better-than-expected overseas 2Q11 margin and despite slow sales recognition, we feel strongly about Hyundai E&C's structural synergy with a new owner in terms of profitability. We believe stricter cost control is causing the margin to improve. The 2Q parent base normalized operating margin jumped to 6.0% from 5.4% in 1Q11 (5.8% in 2010). We reiterate that the company will likely face the least downward pressure on orders due to a diversified portfolio and the thickest track record. We maintain Buy and a price target of W110,000.
Forecasts and ratios
Year End Dec 31 2009A 2010A 2011E 2012E 2013E
Sales (KRWbn) 10,391 11,217 12,172 14,136 16,482
EBITDA (KRWbn) 666 840 927 1,116 1,332
Reported EPS FD(KRW) 4,086.0 4,671.0 5,896.5 7,232.8 8,865.6
% Change 0.0% 0.0% -3.2% -3.0% -0.9%
PER (x) 13.5 12.9 15.3 12.0 9.6Source: Deutsche Bank estimates, company data
1 DB EPS is fully diluted and excludes non-recurring items 2 Multiples and yields calculations use average historical prices for past years and spot prices for current and future years, except P/B which uses the year end close
Results
Buy Price at 29 Jul 2011 (KRW) 86,400Price target - 12mth (KRW) 110,00052-week range (KRW) 91,800 - 59,200KOSPI 2,133.21
Key changes
Sales (FYE) 12,172 to 12,172 0.0%Op prof margin (FYE) 7.1 to 6.9 -3.3%Net profit (FYE) 678.0 to 657.2 -3.1%
Price/price relative
40000
5000060000
70000
80000
90000
100000
7/09 10/09 1/10 4/10 7/10 10/10 1/11 4/11Hyundai E&C
KOSPI (Rebased)
Performance (%) 1m 3m 12mAbsolute 0.6 -3.9 38.2KOSPI 1.9 -2.7 20.5
Stock data
Market cap (KRWbn) 9,621Market cap (USDm) 9,126Shares outstanding (m) 111.4Major shareholders Hyundai Motor Group (34.9%)Free float (%) 60Avg daily value traded (USDm) 76.669
Key indicators (FY1)
ROE (%) 17.3Net debt/equity (%) -23.2Book value/share (KRW) 36,591Price/book (x) 2.36Net interest cover (x) –Operating profit margin (%) 6.9
2Q11 review: better profitability overseas Different from other builders, Hyundai E&C displayed an improving overseas margin in 2Q earnings. The overseas gross margin rose to 11.3% from 10.4% in 1Q11 and 8.2% in 2Q10. The net margin was also resilient at 5%. Due to an overly high expectation on the Street, 2Q11 parent base adjusted operating profit (excluding a disposal gain) of W643bn missed consensus by 16%, but is in line with our forecast. Adjusted earnings before tax, adding the equity gain from Hyundai Engineering and subtracting the disposal gain, reached W183bn (-12% YoY; +37% QoQ). New orders as of 1H11 came in at W4.2tn (-61% YoY, equivalent to 23% of the company’s full-year guidance of W18tn lowered from W22tr previously and 25% of our estimate of W16.5tn).
Quarterly earnings momentum is getting more resilient We believe 2Q earnings support our forecast that the 2H gross margin (parent base) should rise to 11% from 9.9% in 1H. As Hyundai E&C’s sales should recover in 2H after post-M&A matter settles down, net profit will likely grow 74% YoY in 2H11, in our view. Net income should increase 24% CAGR by 2013E due to a maintained margin and robust sales growth with shortening backlog turnover.
PER based target price of W110,000; risks We keep our target price at W110,000. The price target, implying 28% upside potential, is derived by adding W90,806 for operating value and W16,544 for the non-operating land value in Seosan. The stock is trading at 14.7x PER on a 2011E reported base and at an 8% discount to the Deutsche Bank Korea construction sector PER of 15.9x. It is compelling that Hyundai E&C has traded at a 20% premium to the Korea construction sector since 2004. The important downside risk to our Buy rating is downside margin pressure from a weaker overseas construction market, even with our conservative estimates of 9% growth.
2 August 2011 Strategy Asia Equities Daily Focus
Page 30 Deutsche Bank AG/Hong Kong
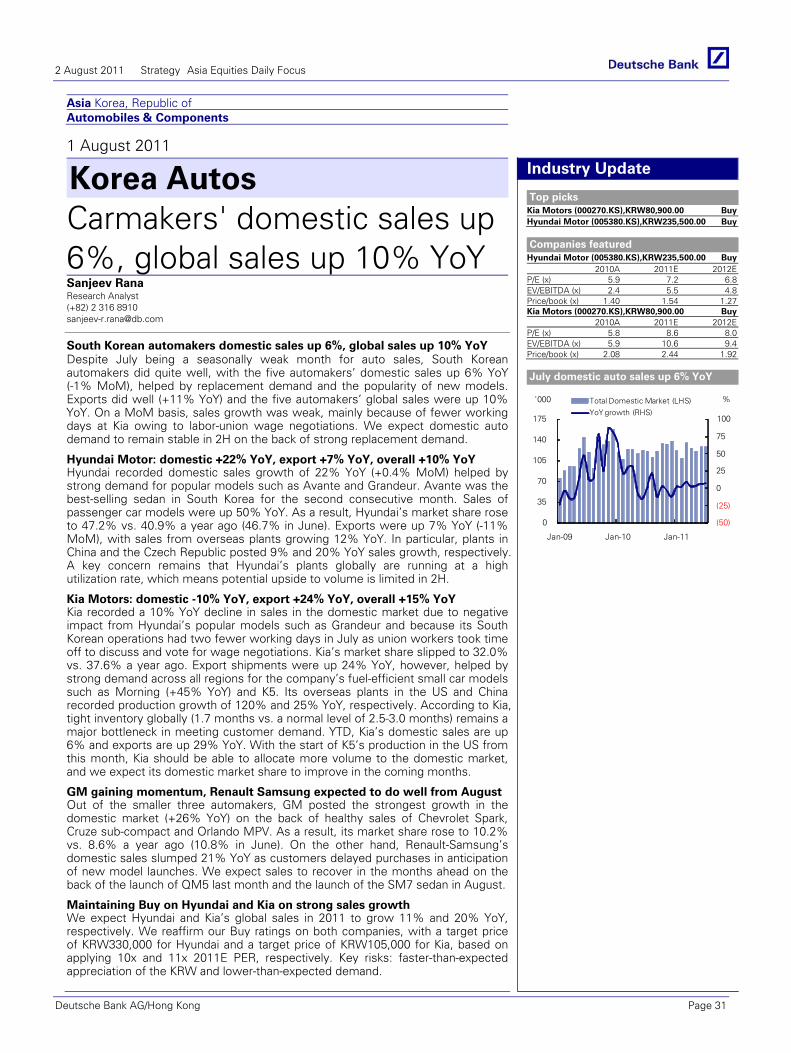
Asia Korea, Republic of Automobiles & Components
1 August 2011
Korea Autos Carmakers' domestic sales up 6%, global sales up 10% YoYSanjeev Rana Research Analyst (+82) 2 316 8910 [email protected]
South Korean automakers domestic sales up 6%, global sales up 10% YoY Despite July being a seasonally weak month for auto sales, South Korean automakers did quite well, with the five automakers’ domestic sales up 6% YoY (-1% MoM), helped by replacement demand and the popularity of new models. Exports did well (+11% YoY) and the five automakers’ global sales were up 10% YoY. On a MoM basis, sales growth was weak, mainly because of fewer working days at Kia owing to labor-union wage negotiations. We expect domestic auto demand to remain stable in 2H on the back of strong replacement demand.
Industry Update
Top picks Kia Motors (000270.KS),KRW80,900.00 BuyHyundai Motor (005380.KS),KRW235,500.00 Buy
Companies featured
Hyundai Motor (005380.KS),KRW235,500.00 Buy2010A 2011E 2012E
P/E (x) 5.9 7.2 6.8EV/EBITDA (x) 2.4 5.5 4.8Price/book (x) 1.40 1.54 1.27Kia Motors (000270.KS),KRW80,900.00 Buy
2010A 2011E 2012EP/E (x) 5.8 8.6 8.0EV/EBITDA (x) 5.9 10.6 9.4Price/book (x) 2.08 2.44 1.92
July domestic auto sales up 6% YoY
(50)
(25)
0
25
50
75
100
0
35
70
105
140
175
Jan-09 Jan-10 Jan-11
Total Domestic Market (LHS)YoY growth (RHS)
'000 %
Hyundai Motor: domestic +22% YoY, export +7% YoY, overall +10% YoY Hyundai recorded domestic sales growth of 22% YoY (+0.4% MoM) helped by strong demand for popular models such as Avante and Grandeur. Avante was the best-selling sedan in South Korea for the second consecutive month. Sales of passenger car models were up 50% YoY. As a result, Hyundai’s market share rose to 47.2% vs. 40.9% a year ago (46.7% in June). Exports were up 7% YoY (-11% MoM), with sales from overseas plants growing 12% YoY. In particular, plants in China and the Czech Republic posted 9% and 20% YoY sales growth, respectively. A key concern remains that Hyundai’s plants globally are running at a high utilization rate, which means potential upside to volume is limited in 2H.
Kia Motors: domestic -10% YoY, export +24% YoY, overall +15% YoY Kia recorded a 10% YoY decline in sales in the domestic market due to negative impact from Hyundai’s popular models such as Grandeur and because its South Korean operations had two fewer working days in July as union workers took time off to discuss and vote for wage negotiations. Kia’s market share slipped to 32.0% vs. 37.6% a year ago. Export shipments were up 24% YoY, however, helped by strong demand across all regions for the company’s fuel-efficient small car models such as Morning (+45% YoY) and K5. Its overseas plants in the US and China recorded production growth of 120% and 25% YoY, respectively. According to Kia, tight inventory globally (1.7 months vs. a normal level of 2.5-3.0 months) remains a major bottleneck in meeting customer demand. YTD, Kia’s domestic sales are up 6% and exports are up 29% YoY. With the start of K5’s production in the US from this month, Kia should be able to allocate more volume to the domestic market, and we expect its domestic market share to improve in the coming months.
GM gaining momentum, Renault Samsung expected to do well from August Out of the smaller three automakers, GM posted the strongest growth in the domestic market (+26% YoY) on the back of healthy sales of Chevrolet Spark, Cruze sub-compact and Orlando MPV. As a result, its market share rose to 10.2% vs. 8.6% a year ago (10.8% in June). On the other hand, Renault-Samsung’s domestic sales slumped 21% YoY as customers delayed purchases in anticipation of new model launches. We expect sales to recover in the months ahead on the back of the launch of QM5 last month and the launch of the SM7 sedan in August.
Maintaining Buy on Hyundai and Kia on strong sales growth We expect Hyundai and Kia’s global sales in 2011 to grow 11% and 20% YoY, respectively. We reaffirm our Buy ratings on both companies, with a target price of KRW330,000 for Hyundai and a target price of KRW105,000 for Kia, based on applying 10x and 11x 2011E PER, respectively. Key risks: faster-than-expected appreciation of the KRW and lower-than-expected demand.
2 August 2011 Strategy Asia Equities Daily Focus
Deutsche Bank AG/Hong Kong Page 31
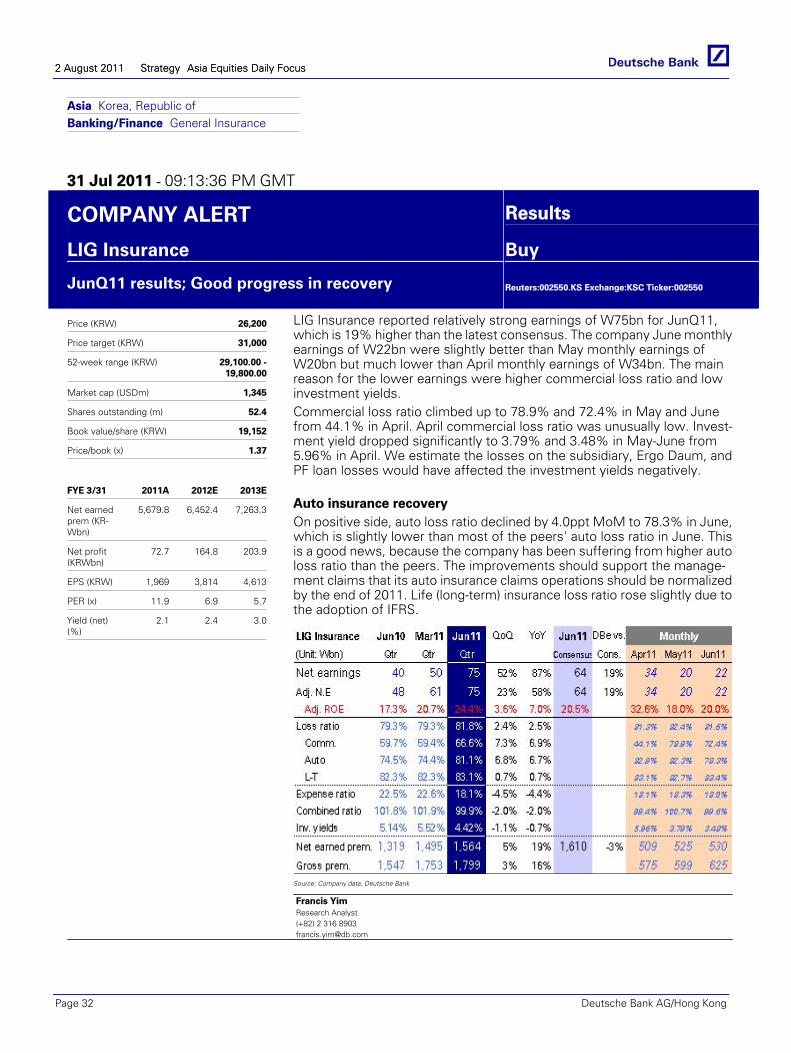
Asia Korea, Republic ofBanking/Finance General Insurance
31 Jul 2011 - 09:13:36 PM GMT
COMPANY ALERT Results
LIG Insurance Buy
JunQ11 results; Good progress in recovery
Reuters:002550.KS Exchange:KSC Ticker:002550
Price (KRW) 26,200
Price target (KRW) 31,000
52-week range (KRW) 29,100.00 -19,800.00
Market cap (USDm) 1,345
Shares outstanding (m) 52.4
Book value/share (KRW) 19,152
Price/book (x) 1.37
FYE 3/31 2011A 2012E 2013E
Net earnedprem (KR-Wbn)
5,679.8 6,452.4 7,263.3
Net profit(KRWbn)
72.7 164.8 203.9
EPS (KRW) 1,969 3,814 4,613
PER (x) 11.9 6.9 5.7
Yield (net)(%)
2.1 2.4 3.0
LIG Insurance reported relatively strong earnings of W75bn for JunQ11,which is 19% higher than the latest consensus. The company June monthlyearnings of W22bn were slightly better than May monthly earnings ofW20bn but much lower than April monthly earnings of W34bn. The mainreason for the lower earnings were higher commercial loss ratio and lowinvestment yields.Commercial loss ratio climbed up to 78.9% and 72.4% in May and Junefrom 44.1% in April. April commercial loss ratio was unusually low. Invest-ment yield dropped significantly to 3.79% and 3.48% in May-June from5.96% in April. We estimate the losses on the subsidiary, Ergo Daum, andPF loan losses would have affected the investment yields negatively.
Auto insurance recoveryOn positive side, auto loss ratio declined by 4.0ppt MoM to 78.3% in June,which is slightly lower than most of the peers' auto loss ratio in June. Thisis a good news, because the company has been suffering from higher autoloss ratio than the peers. The improvements should support the manage-ment claims that its auto insurance claims operations should be normalizedby the end of 2011. Life (long-term) insurance loss ratio rose slightly due tothe adoption of IFRS.
Source: Company data, Deutsche Bank
Francis YimResearch Analyst(+82) 2 316 [email protected]
2 August 2011 Strategy Asia Equities Daily Focus 2 August 2011 Strategy Asia Equities Daily Focus
Page 32 Deutsche Bank AG/Hong Kong
Asia Korea, Republic ofTransportation Marine
31 Jul 2011 - 10:14:04 PM GMT
INDUSTRY ALERT Industry UpdateMarine LNG ship prices going up, Buy DSME
Focus stocksDSME (042660.KS),KRW37,500.00Buy, Price Target KRW57,000.00
Samsung Heavy(010140.KS),KRW42,950.00 Buy,Price Target KRW50,000.00
DSME reports order for LNG ships with contract price of US$212m pership: Last Friday DSME reported that it received an order for four LNG shipsfrom a European customer. Industry publications such as Tradewinds andLlyod's List have indentified Greece based Cardiff Marine Group owned byGeorge Economou as the owner of these ships. The ships are of size 159Kcubic meter and the total value of the order was reported to be W894bn orUS$848m. This would imply a price per ship of US$212m which about 6%higher than the recent LNG ship orders signed by Korean shipyards (US$200m per ship). We believe this is a very positive development and vali‐dates our view that ship prices are expected to go higher in the monthsahead driven by currency, raw material cost pressure and limited dockspace availability at the quality shipyards for early deliveries.
Price increase despite fierce competition points to shipyards' improv‐ing pricing power: Although DSME competed fiercely with SamsungHeavy for this order the fact that order was signed at a 6% higher price thanthose signed recently means the fears of predatory pricing are unfoundedat least in high value add segments such as LNG ships and drill ships. MajorKorean shipyards having received 70‐100% of their order target for this yearare not keen to take orders at lower prices and ship owners seeing thebusiness potential in high demand segments such as LNG appear to beaccommodating shipyards' demand for higher prices. Even in the drillshipand large size containership segment where the demand has been strongwe have seen a 7% and 2% price increase YTD. We believe news of priceincrease will alleviate investors' concerns about the profitability of ship or‐ders.
We remain positive on LNG ship demand and pricing, DSME is our toppick : We remain bullish on demand and pricing for LNG ships. YTD ordersfor 32 LNG ships have been placed (compared to just 5 in 2010) with optionsfor another ten units and Korea's top three shipyards have won 80% ofthese orders. In the Korean shipbuilding sector DSME with nearly half of itsorder backlog coming from offshore and gas vessels and its attractive val‐uation remains our top pick.
Sanjeev RanaResearch Analyst(+82) 2 316 8910sanjeev‐[email protected]
2 August 2011 Strategy Asia Equities Daily Focus
Deutsche Bank AG/Hong Kong Page 33
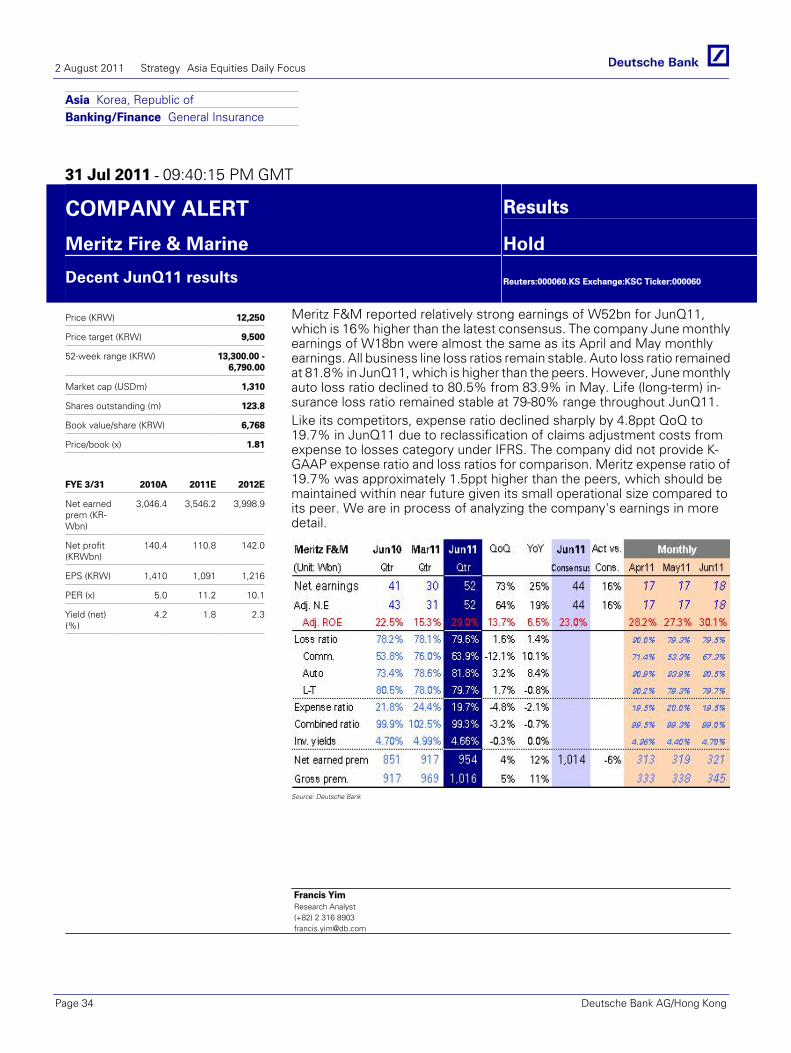
Asia Korea, Republic ofBanking/Finance General Insurance
31 Jul 2011 - 09:40:15 PM GMT
COMPANY ALERT Results
Meritz Fire & Marine Hold
Decent JunQ11 results
Reuters:000060.KS Exchange:KSC Ticker:000060
Price (KRW) 12,250
Price target (KRW) 9,500
52-week range (KRW) 13,300.00 -6,790.00
Market cap (USDm) 1,310
Shares outstanding (m) 123.8
Book value/share (KRW) 6,768
Price/book (x) 1.81
FYE 3/31 2010A 2011E 2012E
Net earnedprem (KR-Wbn)
3,046.4 3,546.2 3,998.9
Net profit(KRWbn)
140.4 110.8 142.0
EPS (KRW) 1,410 1,091 1,216
PER (x) 5.0 11.2 10.1
Yield (net)(%)
4.2 1.8 2.3
Meritz F&M reported relatively strong earnings of W52bn for JunQ11,which is 16% higher than the latest consensus. The company June monthlyearnings of W18bn were almost the same as its April and May monthlyearnings. All business line loss ratios remain stable. Auto loss ratio remainedat 81.8% in JunQ11, which is higher than the peers. However, June monthlyauto loss ratio declined to 80.5% from 83.9% in May. Life (long-term) in-surance loss ratio remained stable at 79-80% range throughout JunQ11.Like its competitors, expense ratio declined sharply by 4.8ppt QoQ to19.7% in JunQ11 due to reclassification of claims adjustment costs fromexpense to losses category under IFRS. The company did not provide K-GAAP expense ratio and loss ratios for comparison. Meritz expense ratio of19.7% was approximately 1.5ppt higher than the peers, which should bemaintained within near future given its small operational size compared toits peer. We are in process of analyzing the company's earnings in moredetail.
Source: Deutsche Bank
Francis YimResearch Analyst(+82) 2 316 [email protected]
2 August 2011 Strategy Asia Equities Daily Focus
Page 34 Deutsche Bank AG/Hong Kong
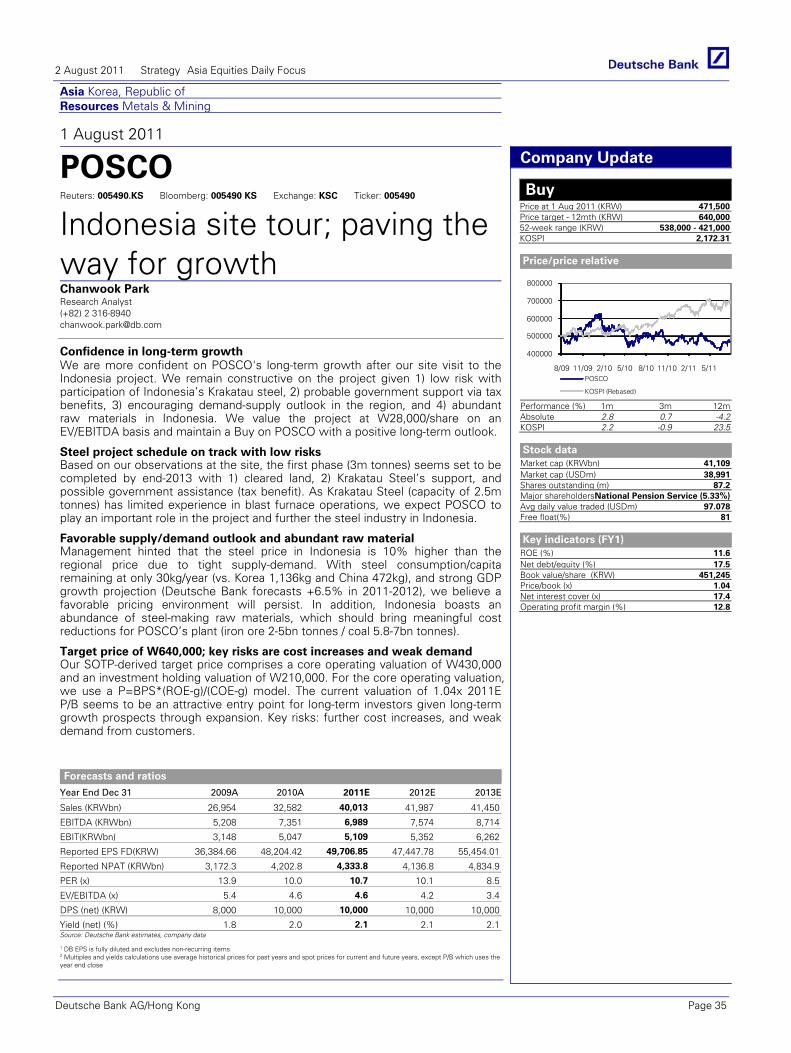
Asia Korea, Republic of Resources Metals & Mining
1 August 2011
POSCO Reuters: 005490.KS Bloomberg: 005490 KS Exchange: KSC Ticker: 005490
Indonesia site tour; paving the way for growth Chanwook Park Research Analyst (+82) 2 316-8940 [email protected]
Confidence in long-term growth We are more confident on POSCO's long-term growth after our site visit to the Indonesia project. We remain constructive on the project given 1) low risk with participation of Indonesia’s Krakatau steel, 2) probable government support via tax benefits, 3) encouraging demand-supply outlook in the region, and 4) abundant raw materials in Indonesia. We value the project at W28,000/share on an EV/EBITDA basis and maintain a Buy on POSCO with a positive long-term outlook.
Forecasts and ratios
Year End Dec 31 2009A 2010A 2011E 2012E 2013E
Sales (KRWbn) 26,954 32,582 40,013 41,987 41,450
EBITDA (KRWbn) 5,208 7,351 6,989 7,574 8,714
EBIT(KRWbn) 3,148 5,047 5,109 5,352 6,262
Reported EPS FD(KRW) 36,384.66 48,204.42 49,706.85 47,447.78 55,454.01
Reported NPAT (KRWbn) 3,172.3 4,202.8 4,333.8 4,136.8 4,834.9
PER (x) 13.9 10.0 10.7 10.1 8.5
EV/EBITDA (x) 5.4 4.6 4.6 4.2 3.4
DPS (net) (KRW) 8,000 10,000 10,000 10,000 10,000
Yield (net) (%) 1.8 2.0 2.1 2.1 2.1Source: Deutsche Bank estimates, company data
1 DB EPS is fully diluted and excludes non-recurring items 2 Multiples and yields calculations use average historical prices for past years and spot prices for current and future years, except P/B which uses the year end close
Company Update
Buy Price at 1 Aug 2011 (KRW) 471,500Price target - 12mth (KRW) 640,00052-week range (KRW) 538,000 - 421,000KOSPI 2,172.31
Price/price relative
400000
500000
600000
700000
800000
8/09 11/09 2/10 5/10 8/10 11/10 2/11 5/11POSCO
KOSPI (Rebased)
Performance (%) 1m 3m 12mAbsolute 2.8 0.7 -4.2KOSPI 2.2 -0.9 23.5
Stock data
Market cap (KRWbn) 41,109Market cap (USDm) 38,991Shares outstanding (m) 87.2Major shareholders National Pension Service (5.33%)Avg daily value traded (USDm) 97.078Free float(%) 81
Key indicators (FY1)
ROE (%) 11.6Net debt/equity (%) 17.5Book value/share (KRW) 451,245Price/book (x) 1.04Net interest cover (x) 17.4Operating profit margin (%) 12.8
Steel project schedule on track with low risks Based on our observations at the site, the first phase (3m tonnes) seems set to be completed by end-2013 with 1) cleared land, 2) Krakatau Steel’s support, and possible government assistance (tax benefit). As Krakatau Steel (capacity of 2.5m tonnes) has limited experience in blast furnace operations, we expect POSCO to play an important role in the project and further the steel industry in Indonesia.
Favorable supply/demand outlook and abundant raw material Management hinted that the steel price in Indonesia is 10% higher than the regional price due to tight supply-demand. With steel consumption/capita remaining at only 30kg/year (vs. Korea 1,136kg and China 472kg), and strong GDP growth projection (Deutsche Bank forecasts +6.5% in 2011-2012), we believe a favorable pricing environment will persist. In addition, Indonesia boasts an abundance of steel-making raw materials, which should bring meaningful cost reductions for POSCO’s plant (iron ore 2-5bn tonnes / coal 5.8-7bn tonnes).
Target price of W640,000; key risks are cost increases and weak demand Our SOTP-derived target price comprises a core operating valuation of W430,000 and an investment holding valuation of W210,000. For the core operating valuation, we use a P=BPS*(ROE-g)/(COE-g) model. The current valuation of 1.04x 2011E P/B seems to be an attractive entry point for long-term investors given long-term growth prospects through expansion. Key risks: further cost increases, and weak demand from customers.
2 August 2011 Strategy Asia Equities Daily Focus
Deutsche Bank AG/Hong Kong Page 35
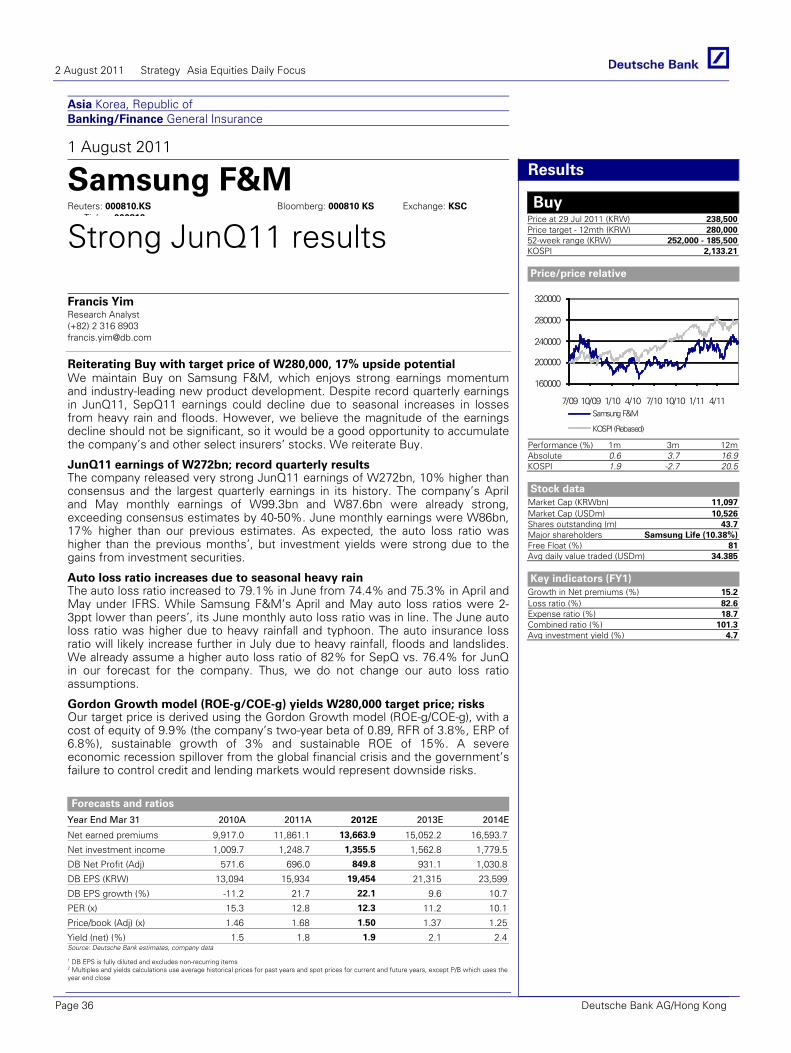
Asia Korea, Republic of Banking/Finance General Insurance
1 August 2011
Samsung F&M Reuters: 000810.KS Bloomberg: 000810 KS Exchange: KSC
Ticker: 000810
Strong JunQ11 results
Francis Yim Research Analyst (+82) 2 316 8903 [email protected]
Reiterating Buy with target price of W280,000, 17% upside potential We maintain Buy on Samsung F&M, which enjoys strong earnings momentum and industry-leading new product development. Despite record quarterly earnings in JunQ11, SepQ11 earnings could decline due to seasonal increases in losses from heavy rain and floods. However, we believe the magnitude of the earnings decline should not be significant, so it would be a good opportunity to accumulate the company’s and other select insurers’ stocks. We reiterate Buy.
Forecasts and ratios
Year End Mar 31 2010A 2011A 2012E 2013E 2014E
Net earned premiums 9,917.0 11,861.1 13,663.9 15,052.2 16,593.7
Net investment income 1,009.7 1,248.7 1,355.5 1,562.8 1,779.5
DB Net Profit (Adj) 571.6 696.0 849.8 931.1 1,030.8
DB EPS (KRW) 13,094 15,934 19,454 21,315 23,599
DB EPS growth (%) -11.2 21.7 22.1 9.6 10.7
PER (x) 15.3 12.8 12.3 11.2 10.1
Price/book (Adj) (x) 1.46 1.68 1.50 1.37 1.25
Yield (net) (%) 1.5 1.8 1.9 2.1 2.4Source: Deutsche Bank estimates, company data
1 DB EPS is fully diluted and excludes non-recurring items 2 Multiples and yields calculations use average historical prices for past years and spot prices for current and future years, except P/B which uses the year end close
Results
Buy Price at 29 Jul 2011 (KRW) 238,500Price target - 12mth (KRW) 280,00052-week range (KRW) 252,000 - 185,500KOSPI 2,133.21
Price/price relative
160000
200000
240000
280000
320000
7/09 10/09 1/10 4/10 7/10 10/10 1/11 4/11Samsung F&M
KOSPI (Rebased)
Performance (%) 1m 3m 12mAbsolute 0.6 3.7 16.9KOSPI 1.9 -2.7 20.5
Stock data
Market Cap (KRWbn) 11,097Market Cap (USDm) 10,526Shares outstanding (m) 43.7Major shareholders Samsung Life (10.38%)Free Float (%) 81Avg daily value traded (USDm) 34.385
Key indicators (FY1)
Growth in Net premiums (%) 15.2Loss ratio (%) 82.6Expense ratio (%) 18.7Combined ratio (%) 101.3Avg investment yield (%) 4.7
JunQ11 earnings of W272bn; record quarterly results The company released very strong JunQ11 earnings of W272bn, 10% higher than consensus and the largest quarterly earnings in its history. The company’s April and May monthly earnings of W99.3bn and W87.6bn were already strong, exceeding consensus estimates by 40-50%. June monthly earnings were W86bn, 17% higher than our previous estimates. As expected, the auto loss ratio was higher than the previous months’, but investment yields were strong due to the gains from investment securities.
Auto loss ratio increases due to seasonal heavy rain The auto loss ratio increased to 79.1% in June from 74.4% and 75.3% in April and May under IFRS. While Samsung F&M’s April and May auto loss ratios were 2-3ppt lower than peers’, its June monthly auto loss ratio was in line. The June auto loss ratio was higher due to heavy rainfall and typhoon. The auto insurance loss ratio will likely increase further in July due to heavy rainfall, floods and landslides. We already assume a higher auto loss ratio of 82% for SepQ vs. 76.4% for JunQ in our forecast for the company. Thus, we do not change our auto loss ratio assumptions.
Gordon Growth model (ROE-g/COE-g) yields W280,000 target price; risks Our target price is derived using the Gordon Growth model (ROE-g/COE-g), with a cost of equity of 9.9% (the company’s two-year beta of 0.89, RFR of 3.8%, ERP of 6.8%), sustainable growth of 3% and sustainable ROE of 15%. A severe economic recession spillover from the global financial crisis and the government’s failure to control credit and lending markets would represent downside risks.
2 August 2011 Strategy Asia Equities Daily Focus
Page 36 Deutsche Bank AG/Hong Kong
Asia IndiaAutomobiles & Components
01 Aug 2011 - 04:00:02 PM IST
COMPANY ALERT Breaking News
Bharat Forge Limited Buy
Mining ban could impact Bharat Forge's steel supplies
Reuters:BFRG.BO Exchange:BSE Ticker:BFRG
Price (INR) 329.10
Price target (INR) 400.00
52-week range (INR) 401.15 -285.85
Market cap (USDm) 1,734
Shares outstanding (m) 232.8
Net debt/equity (%) 46.0
Book value/share (INR) 95.10
Price/book (x) 3.5
FYE 3/31 2011A 2012E 2013E
Sales (INRm) 49,686 61,425 68,803
Net Profit(INRm)
2,899.1 4,118.9 4,806.7
DB EPS(INR)
12.80 17.69 20.64
PER (x) 25.9 18.6 15.9
Yield (net)(%)
1.1 1.2 1.4
Kalyani Steel, group company of Bharat Forge's promoters, has operationsin Karnataka where the Supreme Court has recently ordered a ban on themining of iron ore. We understand that Bharat Forge procures the bulk ofits steel requirements from two group companies - Kalyani steel (25%) andKalyani Carpenters (60%) - and the rest from other vendors (15%). Our in-teraction with the management suggests that Bharat Forge can increase itssourcing from other sources if there is an impact on Kalyani Steel's output.Maintain Buy on Bharat Forge with a target price of Rs 400. The stock cur-rently trades at 8xFY12E EV/EBITDA which is lower than its historicalaverage.
Amyn PiraniResearch Analyst(+91) 22 6658 [email protected]
Srinivas Rao, CFAResearch Analyst(+91) 22 6658 [email protected]
2 August 2011 Strategy Asia Equities Daily Focus
Deutsche Bank AG/Hong Kong Page 37
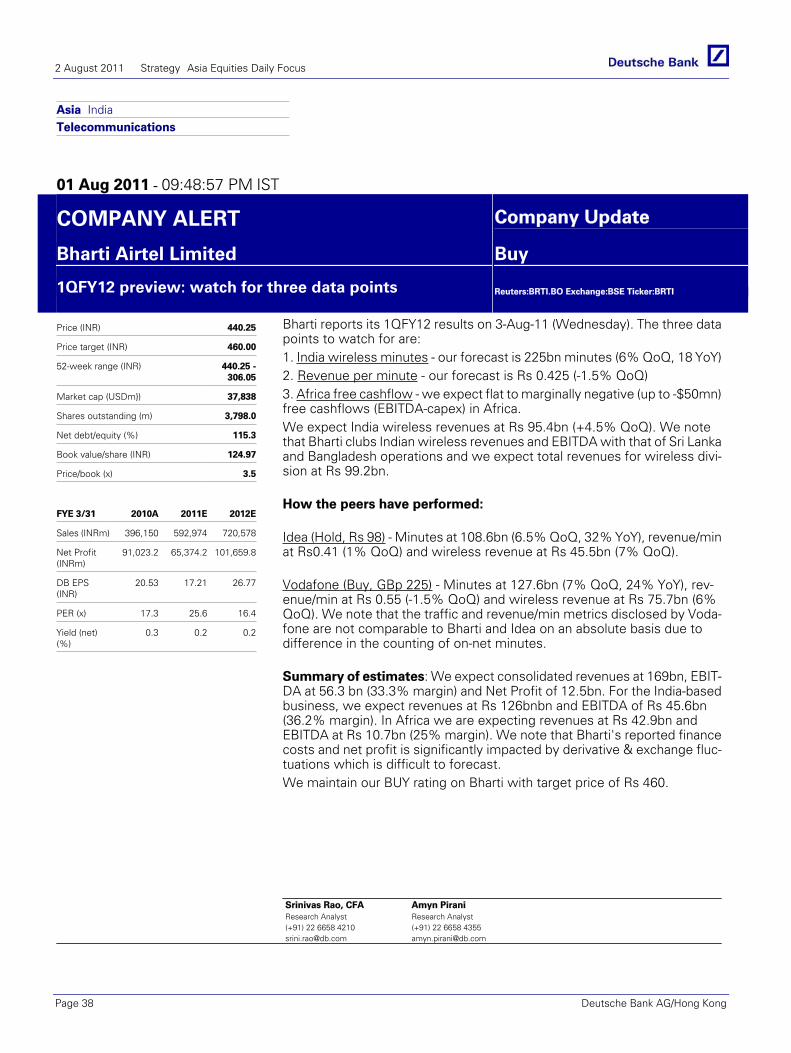
Co
mp
any Asia India
Telecommunications
01 Aug 2011 - 09:48:57 PM IST
Glo
bal
Mar
kets
Res
earc
h
COMPANY ALERT Company Update
Bharti Airtel Limited Buy
1QFY12 preview: watch for three data points
Reuters:BRTI.BO Exchange:BSE Ticker:BRTI
Price (INR) 440.25
Price target (INR) 460.00
52-week range (INR) 440.25 -306.05
Market cap (USDm}) 37,838
Shares outstanding (m) 3,798.0
Net debt/equity (%) 115.3
Book value/share (INR) 124.97
Price/book (x) 3.5
FYE 3/31 2010A 2011E 2012E
Sales (INRm) 396,150 592,974 720,578
Net Profit(INRm)
91,023.2 65,374.2 101,659.8
DB EPS(INR)
20.53 17.21 26.77
PER (x) 17.3 25.6 16.4
Yield (net)(%)
0.3 0.2 0.2
Bharti reports its 1QFY12 results on 3-Aug-11 (Wednesday). The three datapoints to watch for are:1. India wireless minutes - our forecast is 225bn minutes (6% QoQ, 18 YoY)2. Revenue per minute - our forecast is Rs 0.425 (-1.5% QoQ)3. Africa free cashflow - we expect flat to marginally negative (up to -$50mn)free cashflows (EBITDA-capex) in Africa.We expect India wireless revenues at Rs 95.4bn (+4.5% QoQ). We notethat Bharti clubs Indian wireless revenues and EBITDA with that of Sri Lankaand Bangladesh operations and we expect total revenues for wireless divi-sion at Rs 99.2bn.
How the peers have performed:
Idea (Hold, Rs 98) - Minutes at 108.6bn (6.5% QoQ, 32% YoY), revenue/minat Rs0.41 (1% QoQ) and wireless revenue at Rs 45.5bn (7% QoQ).
Vodafone (Buy, GBp 225) - Minutes at 127.6bn (7% QoQ, 24% YoY), rev-enue/min at Rs 0.55 (-1.5% QoQ) and wireless revenue at Rs 75.7bn (6%QoQ). We note that the traffic and revenue/min metrics disclosed by Voda-fone are not comparable to Bharti and Idea on an absolute basis due todifference in the counting of on-net minutes.
Summary of estimates: We expect consolidated revenues at 169bn, EBIT-DA at 56.3 bn (33.3% margin) and Net Profit of 12.5bn. For the India-basedbusiness, we expect revenues at Rs 126bnbn and EBITDA of Rs 45.6bn(36.2% margin). In Africa we are expecting revenues at Rs 42.9bn andEBITDA at Rs 10.7bn (25% margin). We note that Bharti's reported financecosts and net profit is significantly impacted by derivative & exchange fluc-tuations which is difficult to forecast.We maintain our BUY rating on Bharti with target price of Rs 460.
Srinivas Rao, CFAResearch Analyst(+91) 22 6658 [email protected]
Amyn PiraniResearch Analyst(+91) 22 6658 [email protected]
2 August 2011 Strategy Asia Equities Daily Focus
Page 38 Deutsche Bank AG/Hong Kong
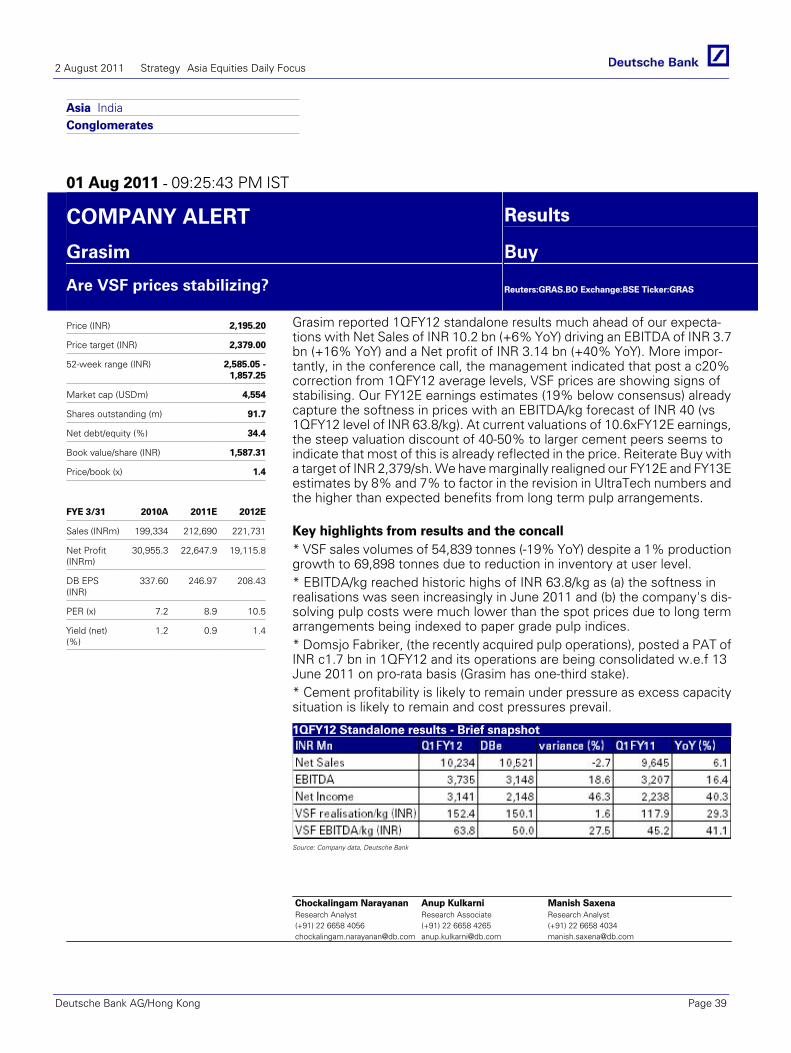
Asia IndiaConglomerates
01 Aug 2011 - 09:25:43 PM IST
COMPANY ALERT Results
Grasim Buy
Are VSF prices stabilizing?
Reuters:GRAS.BO Exchange:BSE Ticker:GRAS
Price (INR) 2,195.20
Price target (INR) 2,379.00
52-week range (INR) 2,585.05 -1,857.25
Market cap (USDm) 4,554
Shares outstanding (m) 91.7
Net debt/equity (%) 34.4
Book value/share (INR) 1,587.31
Price/book (x) 1.4
FYE 3/31 2010A 2011E 2012E
Sales (INRm) 199,334 212,690 221,731
Net Profit(INRm)
30,955.3 22,647.9 19,115.8
DB EPS(INR)
337.60 246.97 208.43
PER (x) 7.2 8.9 10.5
Yield (net)(%)
1.2 0.9 1.4
Grasim reported 1QFY12 standalone results much ahead of our expecta-tions with Net Sales of INR 10.2 bn (+6% YoY) driving an EBITDA of INR 3.7bn (+16% YoY) and a Net profit of INR 3.14 bn (+40% YoY). More impor-tantly, in the conference call, the management indicated that post a c20%correction from 1QFY12 average levels, VSF prices are showing signs ofstabilising. Our FY12E earnings estimates (19% below consensus) alreadycapture the softness in prices with an EBITDA/kg forecast of INR 40 (vs1QFY12 level of INR 63.8/kg). At current valuations of 10.6xFY12E earnings,the steep valuation discount of 40-50% to larger cement peers seems toindicate that most of this is already reflected in the price. Reiterate Buy witha target of INR 2,379/sh. We have marginally realigned our FY12E and FY13Eestimates by 8% and 7% to factor in the revision in UltraTech numbers andthe higher than expected benefits from long term pulp arrangements.
Key highlights from results and the concall* VSF sales volumes of 54,839 tonnes (-19% YoY) despite a 1% productiongrowth to 69,898 tonnes due to reduction in inventory at user level.* EBITDA/kg reached historic highs of INR 63.8/kg as (a) the softness inrealisations was seen increasingly in June 2011 and (b) the company's dis-solving pulp costs were much lower than the spot prices due to long termarrangements being indexed to paper grade pulp indices.* Domsjo Fabriker, (the recently acquired pulp operations), posted a PAT ofINR c1.7 bn in 1QFY12 and its operations are being consolidated w.e.f 13June 2011 on pro-rata basis (Grasim has one-third stake).* Cement profitability is likely to remain under pressure as excess capacitysituation is likely to remain and cost pressures prevail.
1QFY12 Standalone results - Brief snapshot
Source: Company data, Deutsche Bank
Chockalingam NarayananResearch Analyst(+91) 22 6658 [email protected]
Anup KulkarniResearch Associate(+91) 22 6658 [email protected]
Manish SaxenaResearch Analyst(+91) 22 6658 [email protected]
2 August 2011 Strategy Asia Equities Daily Focus
Deutsche Bank AG/Hong Kong Page 39
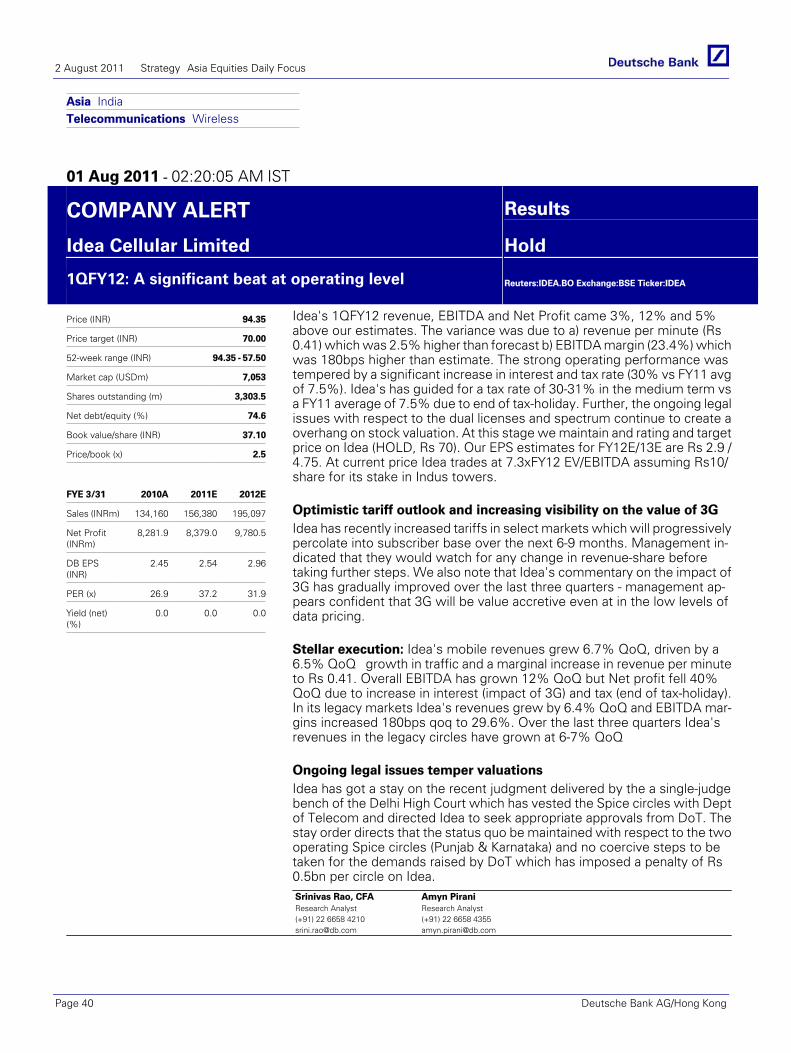
Asia IndiaTelecommunications Wireless
01 Aug 2011 - 02:20:05 AM IST
COMPANY ALERT Results
Idea Cellular Limited Hold
1QFY12: A significant beat at operating level
Reuters:IDEA.BO Exchange:BSE Ticker:IDEA
Price (INR) 94.35
Price target (INR) 70.00
52-week range (INR) 94.35 - 57.50
Market cap (USDm) 7,053
Shares outstanding (m) 3,303.5
Net debt/equity (%) 74.6
Book value/share (INR) 37.10
Price/book (x) 2.5
FYE 3/31 2010A 2011E 2012E
Sales (INRm) 134,160 156,380 195,097
Net Profit(INRm)
8,281.9 8,379.0 9,780.5
DB EPS(INR)
2.45 2.54 2.96
PER (x) 26.9 37.2 31.9
Yield (net)(%)
0.0 0.0 0.0
Idea's 1QFY12 revenue, EBITDA and Net Profit came 3%, 12% and 5%above our estimates. The variance was due to a) revenue per minute (Rs0.41) which was 2.5% higher than forecast b) EBITDA margin (23.4%) whichwas 180bps higher than estimate. The strong operating performance wastempered by a significant increase in interest and tax rate (30% vs FY11 avgof 7.5%). Idea's has guided for a tax rate of 30-31% in the medium term vsa FY11 average of 7.5% due to end of tax-holiday. Further, the ongoing legalissues with respect to the dual licenses and spectrum continue to create aoverhang on stock valuation. At this stage we maintain and rating and targetprice on Idea (HOLD, Rs 70). Our EPS estimates for FY12E/13E are Rs 2.9 /4.75. At current price Idea trades at 7.3xFY12 EV/EBITDA assuming Rs10/share for its stake in Indus towers.
Optimistic tariff outlook and increasing visibility on the value of 3GIdea has recently increased tariffs in select markets which will progressivelypercolate into subscriber base over the next 6-9 months. Management in-dicated that they would watch for any change in revenue-share beforetaking further steps. We also note that Idea's commentary on the impact of3G has gradually improved over the last three quarters - management ap-pears confident that 3G will be value accretive even at in the low levels ofdata pricing.
Stellar execution: Idea's mobile revenues grew 6.7% QoQ, driven by a6.5% QoQ growth in traffic and a marginal increase in revenue per minuteto Rs 0.41. Overall EBITDA has grown 12% QoQ but Net profit fell 40%QoQ due to increase in interest (impact of 3G) and tax (end of tax-holiday).In its legacy markets Idea's revenues grew by 6.4% QoQ and EBITDA mar-gins increased 180bps qoq to 29.6%. Over the last three quarters Idea'srevenues in the legacy circles have grown at 6-7% QoQ
Ongoing legal issues temper valuationsIdea has got a stay on the recent judgment delivered by the a single-judgebench of the Delhi High Court which has vested the Spice circles with Deptof Telecom and directed Idea to seek appropriate approvals from DoT. Thestay order directs that the status quo be maintained with respect to the twooperating Spice circles (Punjab & Karnataka) and no coercive steps to betaken for the demands raised by DoT which has imposed a penalty of Rs0.5bn per circle on Idea.Srinivas Rao, CFAResearch Analyst(+91) 22 6658 [email protected]
Amyn PiraniResearch Analyst(+91) 22 6658 [email protected]
2 August 2011 Strategy Asia Equities Daily Focus
Page 40 Deutsche Bank AG/Hong Kong

Asia IndiaAutomobiles & Components
01 Aug 2011 - 04:33:28 PM IST
COMPANY ALERT Results
Mahindra & Mahindra Buy
July 2011 volumes: strong numbers; unlike its peers
Reuters:MAHM.BO Exchange:BSE Ticker:MAHM
Price (INR) 718.25
Price target (INR) 780.00
52-week range (INR) 813.05 -595.10
Market cap (USDm) 9,979
Shares outstanding (m) 613.9
Net debt/equity (%) 17.4
Book value/share (INR) 167.99
Price/book (x) 4.3
FYE 3/31 2010A 2011E 2012E
Sales (INRm) 180,248 231,921 272,707
Net Profit(INRm)
20,877.5 26,621.0 28,559.7
DB EPS(INR)
35.34 41.45 46.52
PER (x) 12.3 17.3 15.4
Yield (net)(%)
2.2 1.6 1.7
M&M's July-11 volumes continue to be strong for both utility vehicles (UVs)and tractors. YTD, domestic tractor volumes (72,943, +19% YoY) continueto be ahead of management guidance and our expectation of 12% growthin FY12E. For UVs, YTD growth stands at 18% vs our FY12E forecast 15%.Our estimates imply a monthly run rate (MRR) of 20,392 units for tractorsover the next 8 months vs a MRR of 19,218 units in the first 4 months ofFY12. For UVs our estimates imply a MRR of 16,806 over the next 8 monthsvs 15,022 in the first 4 months.
Our FY12E/13 forecasts for headline EPS are Rs 46.5/52 and for core EPSare Rs 40/45. We maintain our Buy rating with a target price of Rs 780. Thestock currently trades at 13.8x FY12E core EPS.
Key highlights (see table below):* 4-wheeler pick-up volumes were at 13,472 units (+91% YoY). We believethis is driven by Maxximo which continues to gain share against Tata's ACEwhich is the sector leader. 3-wheeler volumes stood at 5,395 units forJul-2011.* Domestic car volumes (1,630 units) continue to maintain its upward trendunderlining its revival over the last one year.
Mahindra - monthly volume trends
Source: Company, Deutsche Bank
Srinivas Rao, CFAResearch Analyst(+91) 22 6658 [email protected]
Amyn PiraniResearch Analyst(+91) 22 6658 [email protected]
2 August 2011 Strategy Asia Equities Daily Focus
Deutsche Bank AG/Hong Kong Page 41
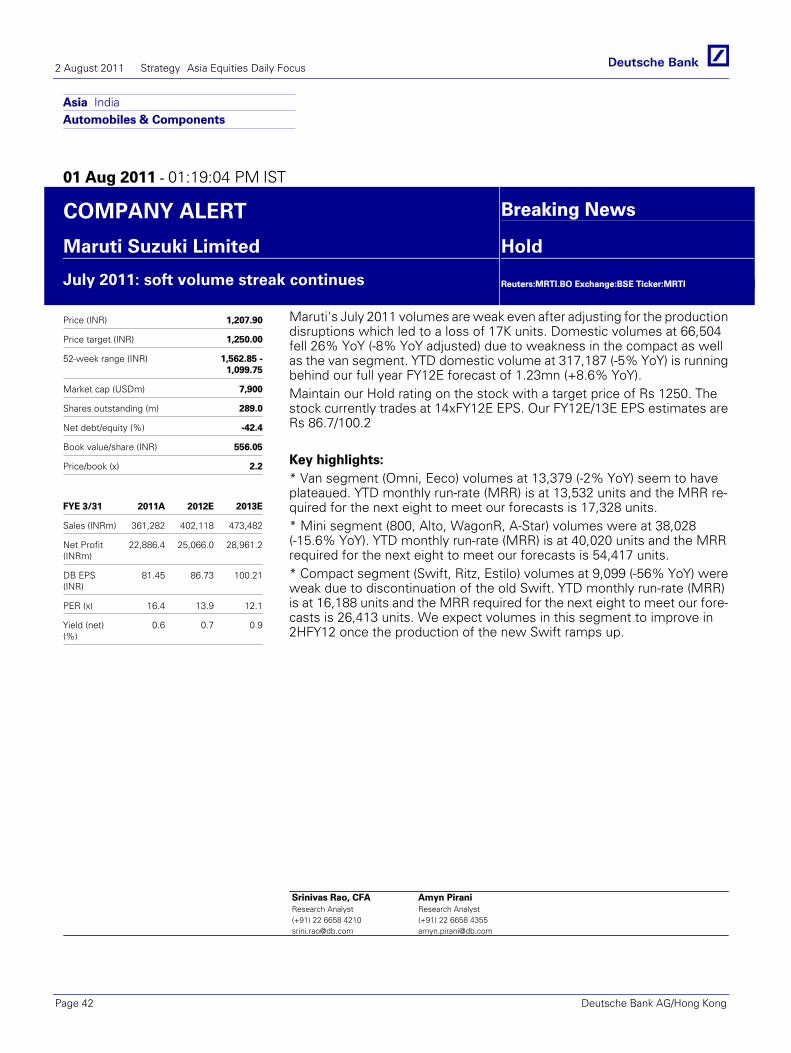
Asia IndiaAutomobiles & Components
01 Aug 2011 - 01:19:04 PM IST
COMPANY ALERT Breaking News
Maruti Suzuki Limited Hold
July 2011: soft volume streak continues
Reuters:MRTI.BO Exchange:BSE Ticker:MRTI
Price (INR) 1,207.90
Price target (INR) 1,250.00
52-week range (INR) 1,562.85 -1,099.75
Market cap (USDm) 7,900
Shares outstanding (m) 289.0
Net debt/equity (%) -42.4
Book value/share (INR) 556.05
Price/book (x) 2.2
FYE 3/31 2011A 2012E 2013E
Sales (INRm) 361,282 402,118 473,482
Net Profit(INRm)
22,886.4 25,066.0 28,961.2
DB EPS(INR)
81.45 86.73 100.21
PER (x) 16.4 13.9 12.1
Yield (net)(%)
0.6 0.7 0.9
Maruti's July 2011 volumes are weak even after adjusting for the productiondisruptions which led to a loss of 17K units. Domestic volumes at 66,504fell 26% YoY (-8% YoY adjusted) due to weakness in the compact as wellas the van segment. YTD domestic volume at 317,187 (-5% YoY) is runningbehind our full year FY12E forecast of 1.23mn (+8.6% YoY).Maintain our Hold rating on the stock with a target price of Rs 1250. Thestock currently trades at 14xFY12E EPS. Our FY12E/13E EPS estimates areRs 86.7/100.2
Key highlights:* Van segment (Omni, Eeco) volumes at 13,379 (-2% YoY) seem to haveplateaued. YTD monthly run-rate (MRR) is at 13,532 units and the MRR re-quired for the next eight to meet our forecasts is 17,328 units.* Mini segment (800, Alto, WagonR, A-Star) volumes were at 38,028(-15.6% YoY). YTD monthly run-rate (MRR) is at 40,020 units and the MRRrequired for the next eight to meet our forecasts is 54,417 units.* Compact segment (Swift, Ritz, Estilo) volumes at 9,099 (-56% YoY) wereweak due to discontinuation of the old Swift. YTD monthly run-rate (MRR)is at 16,188 units and the MRR required for the next eight to meet our fore-casts is 26,413 units. We expect volumes in this segment to improve in2HFY12 once the production of the new Swift ramps up.
Srinivas Rao, CFAResearch Analyst(+91) 22 6658 [email protected]
Amyn PiraniResearch Analyst(+91) 22 6658 [email protected]
2 August 2011 Strategy Asia Equities Daily Focus
Page 42 Deutsche Bank AG/Hong Kong

Asia IndiaResources Construction Materials
01 Aug 2011 - 08:17:45 PM IST
COMPANY ALERT Results
Shree Cement Hold
Low pricing power with North Indian cement players-howlong?
Reuters:SHCM.BO Exchange:BSE Ticker:SHCM
Price (INR) 1,789.60
Price target (INR) 1,712.00
52-week range (INR) 2,297.30 -1,528.70
Market cap (USDm) 1,411
Shares outstanding (m) 34.8
Net debt/equity (%) 77.9
Book value/share (INR) 570.12
Price/book (x) 3.1
FYE 3/31 2010A 2011E 2012E
Sales (INRm) 36,423 35,119 43,202
Net Profit(INRm)
6,761.0 2,097.1 100.1
DB EPS(INR)
194.07 60.20 2.87
PER (x) 8.1 29.7 622.6
Yield (net)(%)
0.8 0.8 0.6
Shree cement 1QFY12 results, with net sales of INR 10.3 bn (+9.5% YoY)driving EBITDA of INR 2.6 bn (-10.5% YoY) and net profit of INR 550 mn(down 48% YoY), once again highlighted the importance of regional pres-sures. Shree, with a predominant presence in Northern India, reportedEBITDA/t of INR 880/t (down 19% YoY and up 2% on QoQ basis). Perhapsit looks like the pricing 'power' exhibited by Southern Indian cement playersfor a similar level of capacity overhang has been better.
Important highlights from the results* Cement and clinker volumes totaled 2.69 mn tonnes (+8% YoY) whilepower volumes increased to 238 mn units (+67% YoY).* Blended cement realisations were up 4% YoY at INR 3,419.* Cement EBITDA/t declined to INR 880 (-18% YoY) largely due to increasesin (a) raw material (+67% YoY on per tonne basis), (b) freight costs (up 18%YoY on per tonne basis) and (c) fuel costs (pet coke costs up by c18% YoY).* Power EBITDA at INR 220 mn implies EBITDA/kwh of INR 0.93 (down30% YoY) on the back of higher fuel costs (up 19% YoY).
However, going forward, what remains to be seen is whether Northern In-dian cement companies, which have seen serious price erosion, look tostabilize the price. At the current valuation of EV/t of US$ 94 (30% discountto large cap peers), we maintain Hold with a target of INR 1,712/sh.
1QFY12 - Brief snapshot
Source: Company data, Deutsche Bank
Chockalingam NarayananResearch Analyst(+91) 22 6658 [email protected]
Anup KulkarniResearch Associate(+91) 22 6658 [email protected]
Manish SaxenaResearch Analyst(+91) 22 6658 [email protected]
2 August 2011 Strategy Asia Equities Daily Focus
Deutsche Bank AG/Hong Kong Page 43

Asia IndiaResources Metals & Mining
01 Aug 2011 - 02:01:25 AM IST
COMPANY ALERT Results
Steel Authority of India Buy
1Q'FY12 - Earnings disappoint on higher costs
Reuters:SAIL.BO Exchange:BSE Ticker:SAIL
Price (INR) 127.70
Price target (INR) 185.00
52-week range (INR) 226.85 -127.70
Market cap (USDm) 11,966
Shares outstanding (m) 4,130.4
Net debt/equity (%) 7.1
Book value/share (INR) 91.09
Price/book (x) 1.4
FYE 3/31 2010A 2011E 2012E
Sales (INRm) 405,514 427,508 483,337
Net Profit(INRm)
67,543.7 49,145.3 68,873.0
DB EPS(INR)
16.35 11.90 16.67
PER (x) 11.1 10.7 7.7
Yield (net)(%)
1.8 1.9 2.7
SAIL reported net sales of INR108bn (+20% YoY) which were in line withDBe but recurring EBITDA at INR14.35bn (-30% YoY, -32% QoQ) was 21%below DBe and 20% below consensus. The variance is attributed to higherthan expected operating costs, which rose 34% YoY (+4% vs DBe). Thecost escalation also adversely impacted SAIL's profitability during the quar-ter with EBITDA margins declining by 929bps YoY to 13.3%. Recurring netprofit at INR10bn (-27% YoY, -34% QoQ) was 20% below DB expectations.Operating results adversely impacted on account of higher costsIn 1Q'FY12, SAIL registered a sharp escalation in costs across the variouscost heads. Employee expenses rose +17% YoY (+12% vs DBe) on accountof increased Dearness Allowance and an increase in provisions for gratuityand leave encashment. There was also a one time charge of INR2.4bn dur-ing the quarter to provide for the new employee scheme for non-executivepersonnel. The power and fuel expenses rose 16% YoY (+23% vs DBe).The adverse impact of high thermal coal prices was further exacerbated bydisruptions in coke oven battery at Bhilai and Bokaro which impacted thecaptive power generation. Other expenditure rose +5% YoY (+15% vs DBe)primarily on account of increased royalty payments towards iron ore.Timely commissioning of brownfield expansions will be critical tomaintain investor confidenceThe company's modernization and expansion programme has been thehallmark of our positive investment thesis for SAIL. However, we are dis-appointed with the slow progress on these expansions. The combinationof a sharp decleration in asset turnover coupled with increasing leveragehas begun worrying investors. We believe that the timely commissioningof the new facilities (IISCO, Jan-Mar'12) remains critical to maintain investorconfidence. We await further details from the management and will becoming out with an update after that.
Source: Deutsche Bank
Abhay LaijawalaStrategist(+91) 22 6658 [email protected]
Anuj SinglaResearch Analyst(+91) 22 6658 [email protected]
2 August 2011 Strategy Asia Equities Daily Focus
Page 44 Deutsche Bank AG/Hong Kong

Asia IndiaAutomobiles & Components
01 Aug 2011 - 09:12:23 PM IST
COMPANY ALERT Company Update
Tata Motors Ltd Buy
July 2011: another month of slowdown in heavy truck vol‐umes
Reuters:TAMO.BO Exchange:BSE Ticker:TAMO
Price (INR) 960.30
Price target (INR) 1,365.00
52-week range (INR) 1,365.60 ‐841.90
Market cap (USDm) 13,793
Shares outstanding (m) 634.7
Net debt/equity (%) 112.5
Book value/share (INR) 302.06
Price/book (x) 3.2
FYE 3/31 2010A 2011E 2012E
Sales (INRm) 904,568 1,224,270 1,494,484
Net Profit(INRm)
-5,698.4 88,113.5 120,244.1
DB EPS(INR)
17.10 136.95 180.82
PER (x) 31.1 7.0 5.3
Yield (net)(%)
3.0 2.1 2.3
Tata Motors' July 2011 volumes point towards continued slowdown inmedium and heavy commercial vehicles (MHCV) while light commercialvehicles (LCV) continue to buck the trend. We had highlighted a similar out-look in our report "-ve read through for trucks from Shriram's conferencecall" dated 27th July 2011.Tata Motors' domestic MHCV volumes came at 15,836 (+4% YoY) and LCVvolumes were at 24,962 (22% YoY) in July-11. YTD, domestic MHCV/LCVvolumes have grown 7%/23% YoY compared to our FY12E forecast of 10%/15%. The car business continues to underperform (-32% YoY) and we be-lieve Tata Motors is unlikely to maintain its marketshare (14%) by end-FY12E.
Our estimates imply a monthly run rate (MRR) of 18,737 MHCVs over thenext 8 months vs a MRR of 15,344 in the first 4 months of FY12E. Similarly,for LCVs our estimates imply a MRR of 25,008 over the next 8 months vs23,198 in the first 4 months.
We maintain our Buy rating on Tata Motors with a target price of Rs 1365.We believe the deceleration in the India business would be offset by robustvolume growth and strong margins in Jaguar Land Rover (75% of EBITDA).The stock is currently trading at 4.0x FY12E EV/EBITDA.
Key highlights (see table below):* Overall volumes for July 2011 were 57,990 units (-9% YoY).* Domestic passenger car volumes (excluding Nano) at 10,737 fell 31% YoYas both Indica and Indigo volumes remained weak. Nano volumes were at3,260 (-64% YoY).* Domestic utility vehicles (UVs) volumes were at 3,195 units (-2% YoY).
Tata Motors ‐ monthly volume trends
Source: Company, Deutsche Bank
Srinivas Rao, CFAResearch Analyst(+91) 22 6658 [email protected]
Amyn PiraniResearch Analyst(+91) 22 6658 [email protected]
2 August 2011 Strategy Asia Equities Daily Focus
Deutsche Bank AG/Hong Kong Page 45
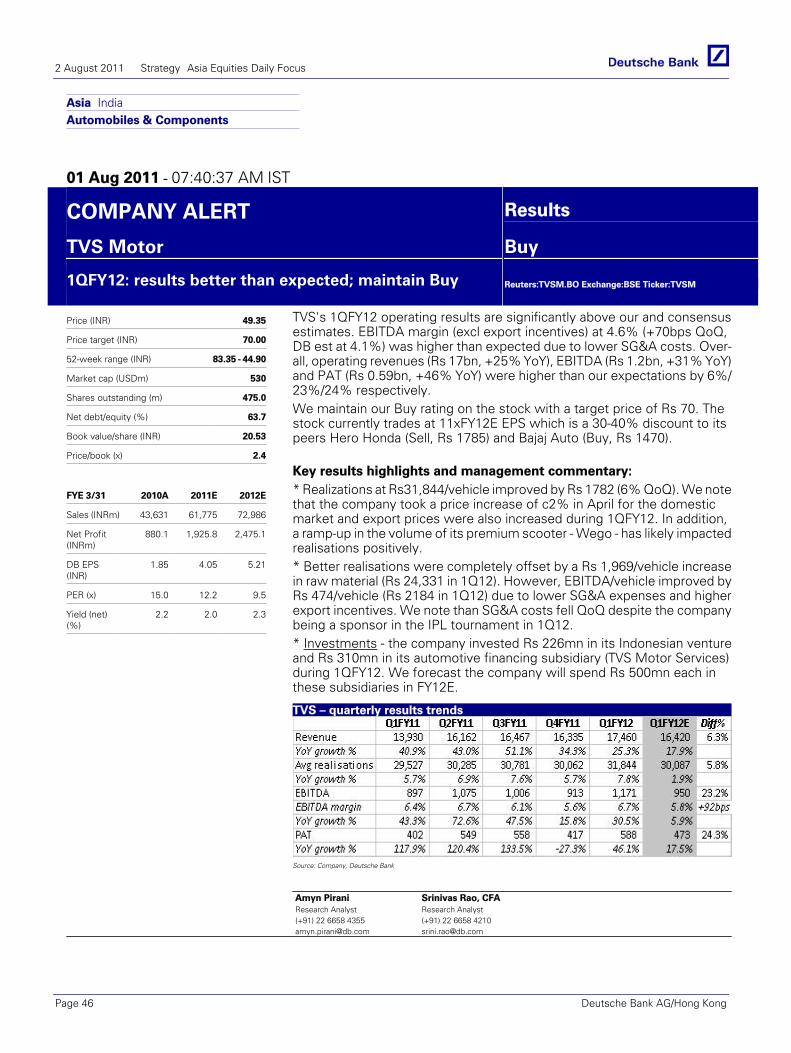
Asia IndiaAutomobiles & Components
01 Aug 2011 - 07:40:37 AM IST
COMPANY ALERT Results
TVS Motor Buy
1QFY12: results better than expected; maintain Buy
Reuters:TVSM.BO Exchange:BSE Ticker:TVSM
Price (INR) 49.35
Price target (INR) 70.00
52-week range (INR) 83.35 - 44.90
Market cap (USDm) 530
Shares outstanding (m) 475.0
Net debt/equity (%) 63.7
Book value/share (INR) 20.53
Price/book (x) 2.4
FYE 3/31 2010A 2011E 2012E
Sales (INRm) 43,631 61,775 72,986
Net Profit(INRm)
880.1 1,925.8 2,475.1
DB EPS(INR)
1.85 4.05 5.21
PER (x) 15.0 12.2 9.5
Yield (net)(%)
2.2 2.0 2.3
TVS's 1QFY12 operating results are significantly above our and consensusestimates. EBITDA margin (excl export incentives) at 4.6% (+70bps QoQ,DB est at 4.1%) was higher than expected due to lower SG&A costs. Over-all, operating revenues (Rs 17bn, +25% YoY), EBITDA (Rs 1.2bn, +31% YoY)and PAT (Rs 0.59bn, +46% YoY) were higher than our expectations by 6%/23%/24% respectively.We maintain our Buy rating on the stock with a target price of Rs 70. Thestock currently trades at 11xFY12E EPS which is a 30-40% discount to itspeers Hero Honda (Sell, Rs 1785) and Bajaj Auto (Buy, Rs 1470).
Key results highlights and management commentary:* Realizations at Rs31,844/vehicle improved by Rs 1782 (6% QoQ). We notethat the company took a price increase of c2% in April for the domesticmarket and export prices were also increased during 1QFY12. In addition,a ramp-up in the volume of its premium scooter - Wego - has likely impactedrealisations positively.* Better realisations were completely offset by a Rs 1,969/vehicle increasein raw material (Rs 24,331 in 1Q12). However, EBITDA/vehicle improved byRs 474/vehicle (Rs 2184 in 1Q12) due to lower SG&A expenses and higherexport incentives. We note than SG&A costs fell QoQ despite the companybeing a sponsor in the IPL tournament in 1Q12.* Investments - the company invested Rs 226mn in its Indonesian ventureand Rs 310mn in its automotive financing subsidiary (TVS Motor Services)during 1QFY12. We forecast the company will spend Rs 500mn each inthese subsidiaries in FY12E.
TVS – quarterly results trends
Source: Company, Deutsche Bank
Amyn PiraniResearch Analyst(+91) 22 6658 [email protected]
Srinivas Rao, CFAResearch Analyst(+91) 22 6658 [email protected]
2 August 2011 Strategy Asia Equities Daily Focus
Page 46 Deutsche Bank AG/Hong Kong
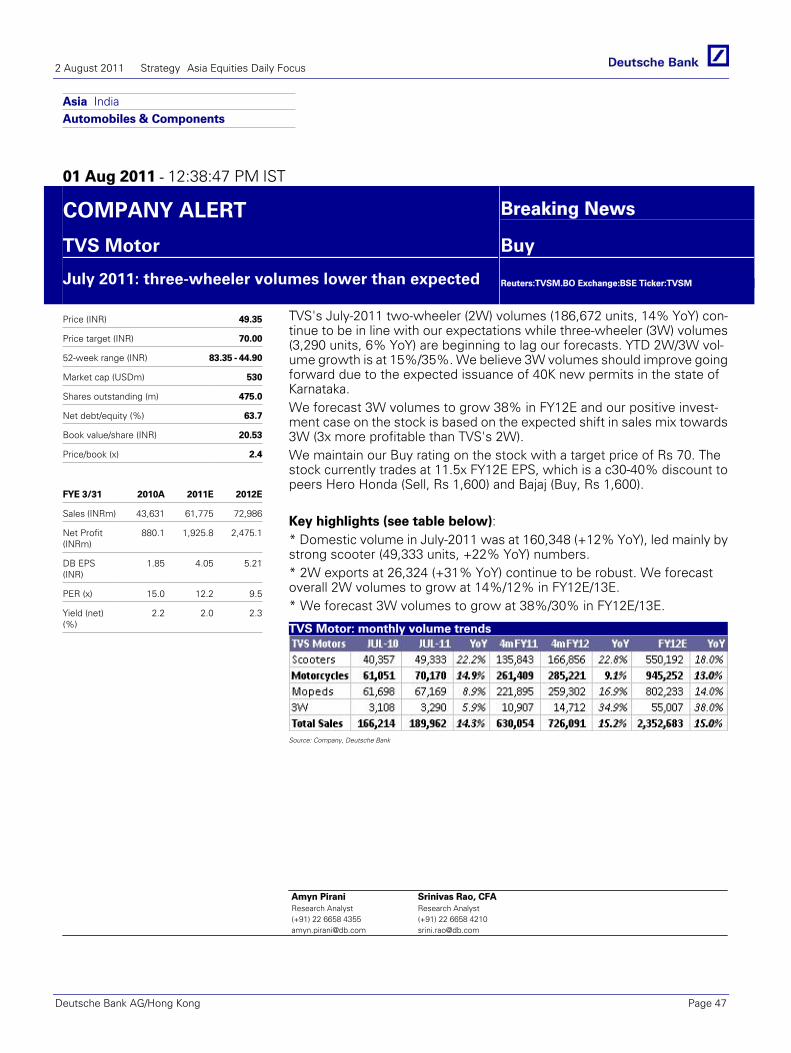
Asia IndiaAutomobiles & Components
01 Aug 2011 - 12:38:47 PM IST
COMPANY ALERT Breaking News
TVS Motor Buy
July 2011: three-wheeler volumes lower than expected
Reuters:TVSM.BO Exchange:BSE Ticker:TVSM
Price (INR) 49.35
Price target (INR) 70.00
52-week range (INR) 83.35 - 44.90
Market cap (USDm) 530
Shares outstanding (m) 475.0
Net debt/equity (%) 63.7
Book value/share (INR) 20.53
Price/book (x) 2.4
FYE 3/31 2010A 2011E 2012E
Sales (INRm) 43,631 61,775 72,986
Net Profit(INRm)
880.1 1,925.8 2,475.1
DB EPS(INR)
1.85 4.05 5.21
PER (x) 15.0 12.2 9.5
Yield (net)(%)
2.2 2.0 2.3
TVS's July-2011 two-wheeler (2W) volumes (186,672 units, 14% YoY) con-tinue to be in line with our expectations while three-wheeler (3W) volumes(3,290 units, 6% YoY) are beginning to lag our forecasts. YTD 2W/3W vol-ume growth is at 15%/35%. We believe 3W volumes should improve goingforward due to the expected issuance of 40K new permits in the state ofKarnataka.We forecast 3W volumes to grow 38% in FY12E and our positive invest-ment case on the stock is based on the expected shift in sales mix towards3W (3x more profitable than TVS's 2W).We maintain our Buy rating on the stock with a target price of Rs 70. Thestock currently trades at 11.5x FY12E EPS, which is a c30-40% discount topeers Hero Honda (Sell, Rs 1,600) and Bajaj (Buy, Rs 1,600).
Key highlights (see table below):* Domestic volume in July-2011 was at 160,348 (+12% YoY), led mainly bystrong scooter (49,333 units, +22% YoY) numbers.* 2W exports at 26,324 (+31% YoY) continue to be robust. We forecastoverall 2W volumes to grow at 14%/12% in FY12E/13E.* We forecast 3W volumes to grow at 38%/30% in FY12E/13E.
TVS Motor: monthly volume trends
Source: Company, Deutsche Bank
Amyn PiraniResearch Analyst(+91) 22 6658 [email protected]
Srinivas Rao, CFAResearch Analyst(+91) 22 6658 [email protected]
2 August 2011 Strategy Asia Equities Daily Focus
Deutsche Bank AG/Hong Kong Page 47
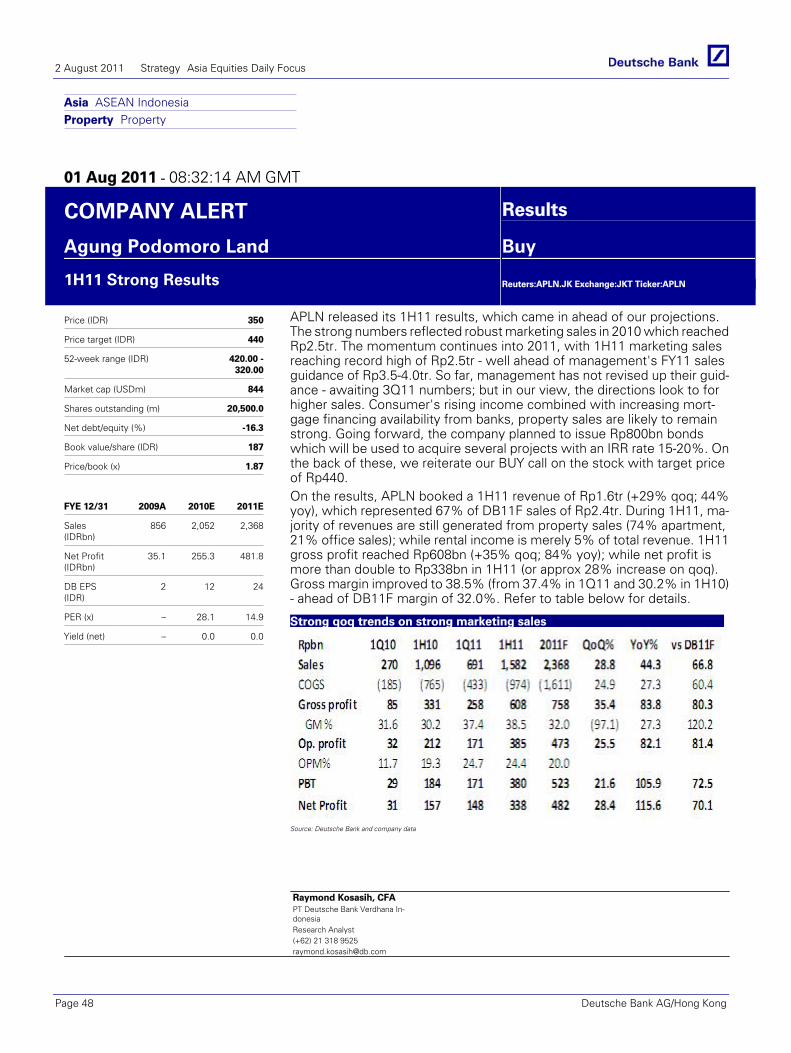
Asia ASEAN IndonesiaProperty Property
01 Aug 2011 - 08:32:14 AM GMT
COMPANY ALERT Results
Agung Podomoro Land Buy
1H11 Strong Results
Reuters:APLN.JK Exchange:JKT Ticker:APLN
Price (IDR) 350
Price target (IDR) 440
52-week range (IDR) 420.00 -320.00
Market cap (USDm) 844
Shares outstanding (m) 20,500.0
Net debt/equity (%) -16.3
Book value/share (IDR) 187
Price/book (x) 1.87
FYE 12/31 2009A 2010E 2011E
Sales(IDRbn)
856 2,052 2,368
Net Profit(IDRbn)
35.1 255.3 481.8
DB EPS(IDR)
2 12 24
PER (x) – 28.1 14.9
Yield (net) – 0.0 0.0
APLN released its 1H11 results, which came in ahead of our projections.The strong numbers reflected robust marketing sales in 2010 which reachedRp2.5tr. The momentum continues into 2011, with 1H11 marketing salesreaching record high of Rp2.5tr - well ahead of management's FY11 salesguidance of Rp3.5-4.0tr. So far, management has not revised up their guid-ance - awaiting 3Q11 numbers; but in our view, the directions look to forhigher sales. Consumer's rising income combined with increasing mort-gage financing availability from banks, property sales are likely to remainstrong. Going forward, the company planned to issue Rp800bn bondswhich will be used to acquire several projects with an IRR rate 15-20%. Onthe back of these, we reiterate our BUY call on the stock with target priceof Rp440.On the results, APLN booked a 1H11 revenue of Rp1.6tr (+29% qoq; 44%yoy), which represented 67% of DB11F sales of Rp2.4tr. During 1H11, ma-jority of revenues are still generated from property sales (74% apartment,21% office sales); while rental income is merely 5% of total revenue. 1H11gross profit reached Rp608bn (+35% qoq; 84% yoy); while net profit ismore than double to Rp338bn in 1H11 (or approx 28% increase on qoq).Gross margin improved to 38.5% (from 37.4% in 1Q11 and 30.2% in 1H10)- ahead of DB11F margin of 32.0%. Refer to table below for details.
Strong qoq trends on strong marketing sales
Source: Deutsche Bank and company data
Raymond Kosasih, CFAPT Deutsche Bank Verdhana In-donesiaResearch Analyst(+62) 21 318 [email protected]
2 August 2011 Strategy Asia Equities Daily Focus
Page 48 Deutsche Bank AG/Hong Kong
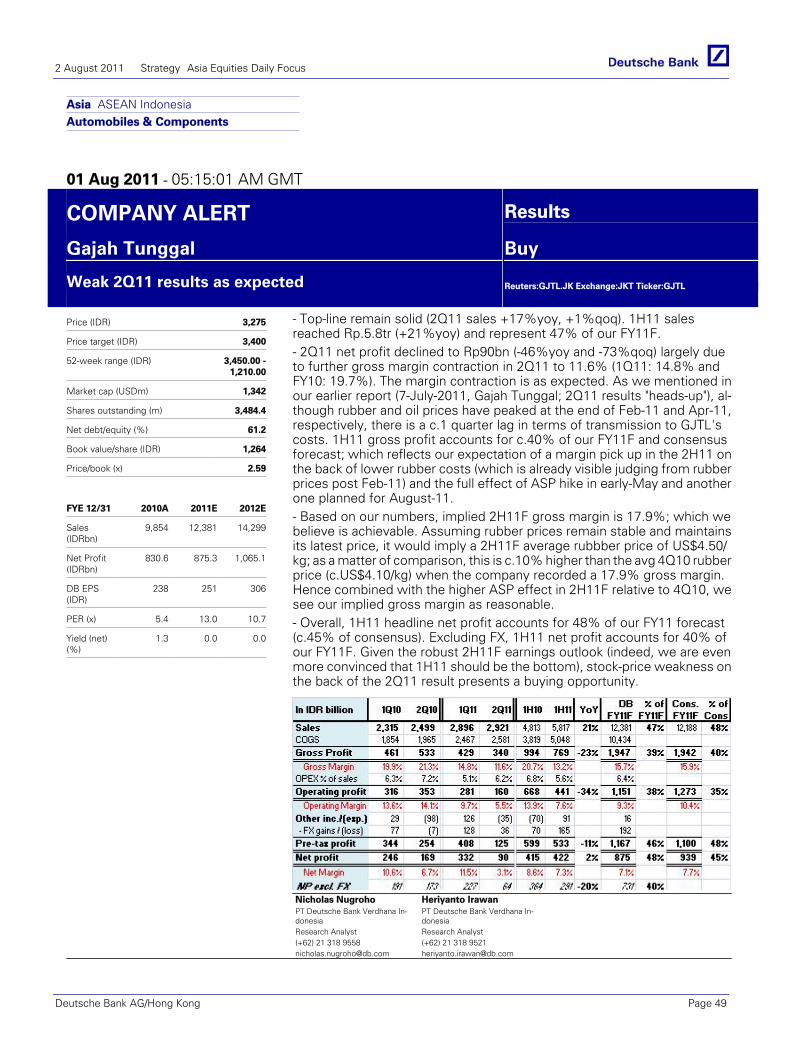
Asia ASEAN IndonesiaAutomobiles & Components
01 Aug 2011 - 05:15:01 AM GMT
COMPANY ALERT Results
Gajah Tunggal Buy
Weak 2Q11 results as expected
Reuters:GJTL.JK Exchange:JKT Ticker:GJTL
Price (IDR) 3,275
Price target (IDR) 3,400
52-week range (IDR) 3,450.00 -1,210.00
Market cap (USDm) 1,342
Shares outstanding (m) 3,484.4
Net debt/equity (%) 61.2
Book value/share (IDR) 1,264
Price/book (x) 2.59
FYE 12/31 2010A 2011E 2012E
Sales(IDRbn)
9,854 12,381 14,299
Net Profit(IDRbn)
830.6 875.3 1,065.1
DB EPS(IDR)
238 251 306
PER (x) 5.4 13.0 10.7
Yield (net)(%)
1.3 0.0 0.0
- Top-line remain solid (2Q11 sales +17%yoy, +1%qoq). 1H11 salesreached Rp.5.8tr (+21%yoy) and represent 47% of our FY11F.- 2Q11 net profit declined to Rp90bn (-46%yoy and -73%qoq) largely dueto further gross margin contraction in 2Q11 to 11.6% (1Q11: 14.8% andFY10: 19.7%). The margin contraction is as expected. As we mentioned inour earlier report (7-July-2011, Gajah Tunggal; 2Q11 results "heads-up"), al-though rubber and oil prices have peaked at the end of Feb-11 and Apr-11,respectively, there is a c.1 quarter lag in terms of transmission to GJTL'scosts. 1H11 gross profit accounts for c.40% of our FY11F and consensusforecast; which reflects our expectation of a margin pick up in the 2H11 onthe back of lower rubber costs (which is already visible judging from rubberprices post Feb-11) and the full effect of ASP hike in early-May and anotherone planned for August-11.- Based on our numbers, implied 2H11F gross margin is 17.9%; which webelieve is achievable. Assuming rubber prices remain stable and maintainsits latest price, it would imply a 2H11F average rubbber price of US$4.50/kg; as a matter of comparison, this is c.10% higher than the avg 4Q10 rubberprice (c.US$4.10/kg) when the company recorded a 17.9% gross margin.Hence combined with the higher ASP effect in 2H11F relative to 4Q10, wesee our implied gross margin as reasonable.- Overall, 1H11 headline net profit accounts for 48% of our FY11 forecast(c.45% of consensus). Excluding FX, 1H11 net profit accounts for 40% ofour FY11F. Given the robust 2H11F earnings outlook (indeed, we are evenmore convinced that 1H11 should be the bottom), stock-price weakness onthe back of the 2Q11 result presents a buying opportunity.
Source: Deutsche Bank and Company dataNicholas NugrohoPT Deutsche Bank Verdhana In-donesiaResearch Analyst(+62) 21 318 [email protected]
Heriyanto IrawanPT Deutsche Bank Verdhana In-donesiaResearch Analyst(+62) 21 318 [email protected]
2 August 2011 Strategy Asia Equities Daily Focus
Deutsche Bank AG/Hong Kong Page 49

Co
mp
any Asia ASEAN Indonesia
Resources Metals & Mining
01 Aug 2011 - 03:17:25 PM GMT
Glo
bal
Mar
kets
Res
earc
h
COMPANY ALERT Results
Harum Energy Buy
2Q11 results; still largely tracking our forecast
Reuters:HRUM.JK Exchange:JKT Ticker:HRUM
Price (IDR) 9,700
Price target (IDR) 11,000
52-week range (IDR) 10,550.00 -5,250.00
Market cap (USDm) 3,080
Shares outstanding (m) 2,700.0
Net debt/equity (%) -76.3
Book value/share (IDR) 1,361
Price/book (x) 7.13
FYE 12/31 2010A 2011E 2012E
Sales(IDRbn)
4,486 8,854 12,729
Net Profit(IDRbn)
824 1,699 3,057
DB EPS(IDR)
348 752 1,365
PER (x) 19.5 12.9 7.1
Yield (net)(%)
1.6 2.3 4.1
2Q'11 results delivered strong production from MSJ, while EBITDA/ton wasin-line with our FY forecast despite the rise in cost. We expect the temporarylag in sales volume relative to production to normalize in 2H, and MSJ'shigher strip ratio in 2Q to normalize in 2H. Furthermore, we expect furthervolume ramp-up at MSJ to fully compensate for the shortfall at SB. WhileTBH is expected to see a delayed start this year (originally 0.5mT contribu-tion) given the still pending borrow-use permit, it only accounts for 5.4% ofHarum's total production on an equity adjusted basis. Maintain Buy.2Q lag in sales volume, to normalize in 3QMSJ's 2Q'11 sales volume was down by 5%QoQ despite the 19%QoQincrease in production - this resulted in the slightly lower QoQ operatingprofits. The lag is partially attributed to shipment delays to China (due toample inventories), which instead will be booked in 3Q. Hence we expectsales vol to normalize relative to production in subsequent quarters. Indeed,some of these were already booked in July, where sales volume is alreadyabout 21% higher than 2Q's monthly average.Robust production MSJ in 2Q & July, to offset SB production shortfallMSJ's 2Q'11 production reached a record 1.9mT (+19%QoQ &YoY), in-linewith new equipment arrivals. With further ramp-ups expected in 2H'11 onthe back of additional equipments still to come, mgmt expects to be ableto exceed its original target. To fully offset the expected shortfall at SB of0.25mT for the FY (50% of 0.5mT) per mgmt's new guidance, MSJ needsto produce 7.75mT for the FY (vs original 7.5mT target) and achieve amonthly run-rate of 708K ton in 2H'11. We believe this is achievable, givenMSJ's realized July run-rate of 798K ton, which is a new record monthlyproduction for the mine.
2Q and 1H financials & operational results
Source: Deutsche Bank, Company
Cherie KhoengPT Deutsche Bank Verdhana In-donesiaResearch Analyst(+62) 21 318 [email protected]
William KhoPT Deutsche Bank Verdhana In-donesiaResearch Associate(+62) 21 318 [email protected]
2 August 2011 Strategy Asia Equities Daily Focus
Page 50 Deutsche Bank AG/Hong Kong
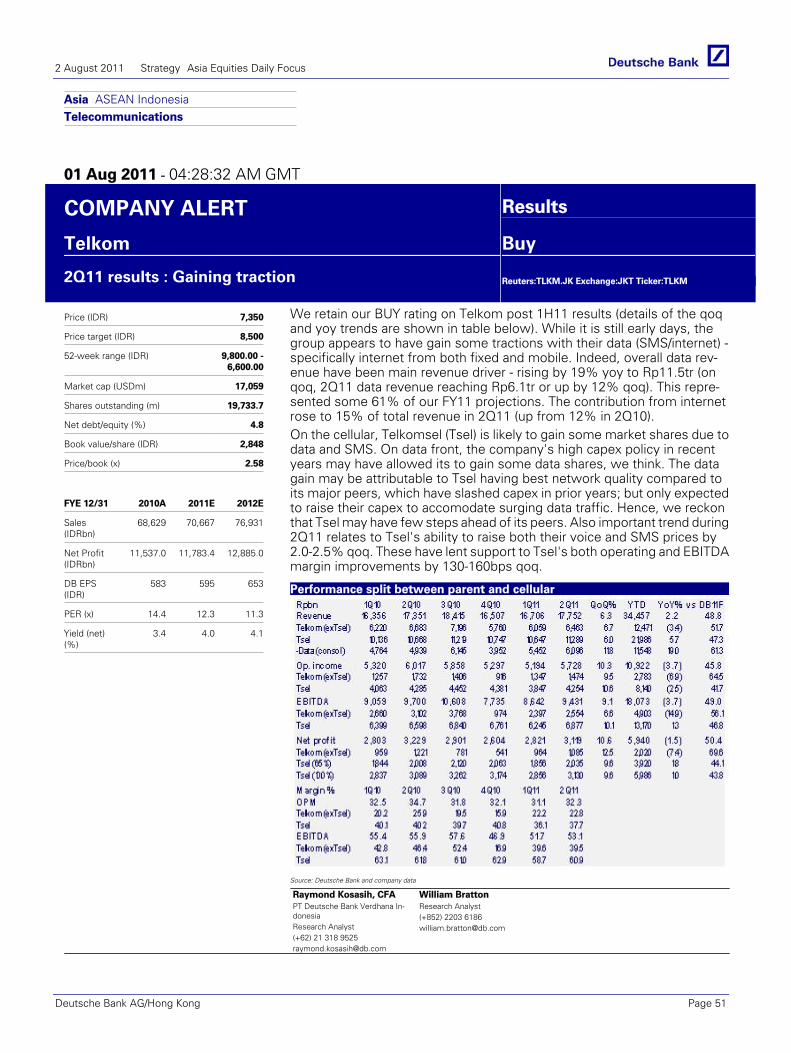
Asia ASEAN IndonesiaTelecommunications
01 Aug 2011 - 04:28:32 AM GMT
COMPANY ALERT Results
Telkom Buy
2Q11 results : Gaining traction
Reuters:TLKM.JK Exchange:JKT Ticker:TLKM
Price (IDR) 7,350
Price target (IDR) 8,500
52-week range (IDR) 9,800.00 -6,600.00
Market cap (USDm) 17,059
Shares outstanding (m) 19,733.7
Net debt/equity (%) 4.8
Book value/share (IDR) 2,848
Price/book (x) 2.58
FYE 12/31 2010A 2011E 2012E
Sales(IDRbn)
68,629 70,667 76,931
Net Profit(IDRbn)
11,537.0 11,783.4 12,885.0
DB EPS(IDR)
583 595 653
PER (x) 14.4 12.3 11.3
Yield (net)(%)
3.4 4.0 4.1
We retain our BUY rating on Telkom post 1H11 results (details of the qoqand yoy trends are shown in table below). While it is still early days, thegroup appears to have gain some tractions with their data (SMS/internet) -specifically internet from both fixed and mobile. Indeed, overall data rev-enue have been main revenue driver - rising by 19% yoy to Rp11.5tr (onqoq, 2Q11 data revenue reaching Rp6.1tr or up by 12% qoq). This repre-sented some 61% of our FY11 projections. The contribution from internetrose to 15% of total revenue in 2Q11 (up from 12% in 2Q10).On the cellular, Telkomsel (Tsel) is likely to gain some market shares due todata and SMS. On data front, the company's high capex policy in recentyears may have allowed its to gain some data shares, we think. The datagain may be attributable to Tsel having best network quality compared toits major peers, which have slashed capex in prior years; but only expectedto raise their capex to accomodate surging data traffic. Hence, we reckonthat Tsel may have few steps ahead of its peers. Also important trend during2Q11 relates to Tsel's ability to raise both their voice and SMS prices by2.0-2.5% qoq. These have lent support to Tsel's both operating and EBITDAmargin improvements by 130-160bps qoq.
Performance split between parent and cellular
Source: Deutsche Bank and company data
Raymond Kosasih, CFAPT Deutsche Bank Verdhana In-donesiaResearch Analyst(+62) 21 318 [email protected]
William BrattonResearch Analyst(+852) 2203 [email protected]
2 August 2011 Strategy Asia Equities Daily Focus
Deutsche Bank AG/Hong Kong Page 51
Asia ASEAN PhilippinesTransportation Marine
01 Aug 2011 - 06:01:54 AM GMT
COMPANY ALERT Company Update
International Container Buy
Withdraws takeover bid for Portek
Reuters:ICT.PS Exchange:PHS Ticker:ICT
Price (PHP) 54.50
Price target (PHP) 56.00
52-week range (PHP) 58.30 - 31.55
Market cap (USDm) 2,504
Shares outstanding (m) 1,935.9
Net debt/equity (%) 66.5
Book value/share (USD) 0.33
Price/book (x) 3.9
FYE 12/31 2010A 2011E 2012E
Sales (US-Dm)
527 617 709
Net Profit(USDm)
98.3 118.6 142.6
DB EPS(USD)
0.05 0.06 0.07
PER (x) 15.0 21.1 17.6
Yield (net)(%)
1.3 0.9 0.9
Withdrawal of takeover bid for Portek (P09.SI)ICTSI withdrew its voluntary conditional cash offer for Portek, following theofficial launch of Japan-based Mitsui's (8031.T) counter bid. Recall that Mit-sui launched a rival bid of S$1.40/sh last July 28, 17% higher than ICT's offerof S$1.20/sh.Possible recognition of a US$8mn one-time gainICT stated its intention to tender all its shares in Portek, currently at c. 25mn(equivelent to c. 17% of Portek). Given that these shares were purchasedat an average of c. S$1/sh, we expect ICT to book a one-off gain of c. US$8mn, should Mitsui proceed with the tender offer.Failed bid but...Mitsui's offer valued Portek at S$213mn (US$178mn), translating to an EV/TEU of US$330. At that valuation, Portek does not appear particularly at-tractive anymore compared to the current replacement cost of announcedcontainer terminal expansions in Asia (US$360). Note that more than 70%of Portek's capacity is in Indonesia and the balance is in Africa and MiddleEast. ICTSI currently trades at an EV/TEU of US$365.
Klyne ResullarDeutsche Regis Partners, Inc.Research Analyst(+63) 2 894 [email protected]
2 August 2011 Strategy Asia Equities Daily Focus
Page 52 Deutsche Bank AG/Hong Kong
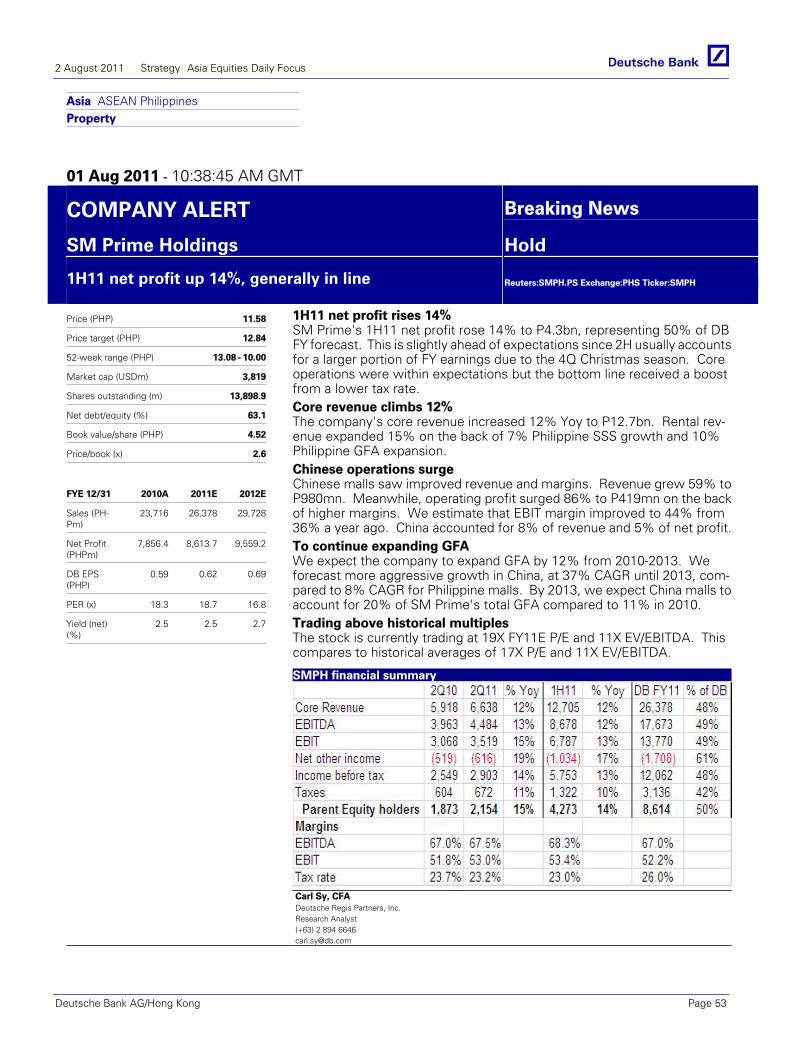
Asia ASEAN PhilippinesProperty
01 Aug 2011 - 10:38:45 AM GMT
COMPANY ALERT Breaking News
SM Prime Holdings Hold
1H11 net profit up 14%, generally in line
Reuters:SMPH.PS Exchange:PHS Ticker:SMPH
Price (PHP) 11.58
Price target (PHP) 12.84
52-week range (PHP) 13.08 - 10.00
Market cap (USDm) 3,819
Shares outstanding (m) 13,898.9
Net debt/equity (%) 63.1
Book value/share (PHP) 4.52
Price/book (x) 2.6
FYE 12/31 2010A 2011E 2012E
Sales (PH-Pm)
23,716 26,378 29,728
Net Profit(PHPm)
7,856.4 8,613.7 9,559.2
DB EPS(PHP)
0.59 0.62 0.69
PER (x) 18.3 18.7 16.8
Yield (net)(%)
2.5 2.5 2.7
1H11 net profit rises 14%SM Prime's 1H11 net profit rose 14% to P4.3bn, representing 50% of DBFY forecast. This is slightly ahead of expectations since 2H usually accountsfor a larger portion of FY earnings due to the 4Q Christmas season. Coreoperations were within expectations but the bottom line received a boostfrom a lower tax rate.Core revenue climbs 12%The company's core revenue increased 12% Yoy to P12.7bn. Rental rev-enue expanded 15% on the back of 7% Philippine SSS growth and 10%Philippine GFA expansion.Chinese operations surgeChinese malls saw improved revenue and margins. Revenue grew 59% toP980mn. Meanwhile, operating profit surged 86% to P419mn on the backof higher margins. We estimate that EBIT margin improved to 44% from36% a year ago. China accounted for 8% of revenue and 5% of net profit.To continue expanding GFAWe expect the company to expand GFA by 12% from 2010-2013. Weforecast more aggressive growth in China, at 37% CAGR until 2013, com-pared to 8% CAGR for Philippine malls. By 2013, we expect China malls toaccount for 20% of SM Prime's total GFA compared to 11% in 2010.Trading above historical multiplesThe stock is currently trading at 19X FY11E P/E and 11X EV/EBITDA. Thiscompares to historical averages of 17X P/E and 11X EV/EBITDA.
SMPH financial summary
Source: Company data, Deutsche Bank (Pmn)Carl Sy, CFADeutsche Regis Partners, Inc.Research Analyst(+63) 2 894 [email protected]
2 August 2011 Strategy Asia Equities Daily Focus
Deutsche Bank AG/Hong Kong Page 53

Asia ASEAN ThailandBanking/Finance Banks
01 Aug 2011 - 06:18:49 AM GMT
COMPANY ALERT Company Update
Krung Thai Bank Buy
KTB analyst meeting - affirmed positive outlook intact
Reuters:KTB.BK Exchange:SET Ticker:KTB
Price (THB) 20.80
Price target (THB) 25.00
52-week range (THB) 20.80 - 12.50
Market cap (USDm) 7,801
Shares outstanding (m) 11,185
NPL/total loans (%) 4.6
Price/book (x) 1.8
FYE 12/31 2010A 2011E 2012E
Provisioning(THBm)
6,124.1 6,513.7 7,200.0
Pre-provprofit(THBm)
25,483 32,901 38,193
EPS (THB) 1.33 1.77 2.04
PER (x) 10.0 11.7 10.2
Yield (net)(%)
3.4 3.1 3.5
Highlights from KTB analyst meeting1) Management expects that 2H11 loan growth could be better than 1H11but still maintains its unofficial loan growth target of 10% for the full-year(6.4% YTD at end of June vs. our target of 12.8%).2) Management believes NIM should continue to improve during the re-mainder of this year, aided by the upward trend in interest rates and shift inloan mix from lower yield government loans to higher yield corporate, SMEand retail loans. The key risk is stepped-up competition for loans and de-posits. Management did not guide on magnitude of NIM expansion but weexpect expansion of 10bps this year.3) The bank maintained its fee growth target of 10-15% for 2011, which isin-line with our projection of 14.7%.4) Management believes KTB's capital funds are sufficient. Although Tier 1fell further to 8.46% in 2Q11, the bank is confident that this should not bean obstacle to its loan growth strategy. Management pointed out that if1H11net profit was included, Tier 1 would actually be 9.3%. It also deniedentering into discussions with a potential strategic partner.5) The bank expects provisioning expenses will remain steady at Bt6bn/ yearover the next few years. This implies lower credit cost and is lower than ourforecast of Bt7bn and Bt8bn in 2012-2013.6) Management expects KTB to sustain RoE of around 14-15% vs. morethan 17% during 1H11. We anticipate a sustainable RoE of 16%.
Our take: Management is positive to overall outlook of bank operation butguidance still appears conservative. We believe there should be more up-side to KTB's loan growth and RoE, with NIM expanding this year due toKTB's shift in loan mix and higher interest rates. Although NIM could beunder pressure in 2012 as banks intensify competition for much-neededliquidity, we believe that the uptrend in KTB's profitability should continue.Our optimistic view is based on the bank's healthy loan growth, coupledwith the credit cycle upturn and improved political stability. Moreover, itsgreater focus on SMEs and corporate clients should lead to long-term up-side for its fee growth target of 15%. We share management's view thatKTB's current capital base is still sufficient but believe that a capital raisingexercise cannot be ruled out. However, any decision to raise capital is un-likely to be done in a hurry. Maintain Buy with TP of Bt25.
Worawat Saisuphatphol,CFATisco Securities Co, LtdResearch Analyst(+66) 2 633 [email protected]
2 August 2011 Strategy Asia Equities Daily Focus
Page 54 Deutsche Bank AG/Hong Kong

Japan Technology Electronics/Consumer
1 August 2011
Pioneer Reuters: 6773.T Bloomberg: 6773 JT Exchange: TYO Ticker: 6773
Targeting renewed growth; upgrading rating to Buy (revised)
Yasuo Nakane, CMA Research Analyst (+81) 3 5156-6709 [email protected]
Upgrading rating from Hold to Buy & raising TP to ¥530 We rate Pioneer Buy because 1) earnings in its core business of car electronics have started expanding, and 2) it has businesses capable of driving long-term earnings, including smartphone navigation, HVT speakers, OEL lighting, and the sale of home electronics to Suning Appliance.
Forecasts and ratios
Year End Mar 31 2011A 2012E 2012CoE 2013E 2014E
Sales (¥bn) 457.5 487.9 470.0 523.8 552.6
YoY (%) 4.2 6.6 2.7 7.4 5.5
Operating profit (¥bn) 15.8 17.9 17.5 21.3 25.1
YoY (%) – 13.4 10.6 19.0 17.5
Recurring profit (¥bn) 12.3 13.6 13.5 17.0 20.7
Net profit (¥bn) 10.4 4.7 4.0 11.2 14.1
EPS (¥) 32 15 12 35 44
P/E (x) 10.2 28.3 33.1 11.8 9.4
EV/EBITDA (x) 3.9 3.5 – 3.0 2.5
CFPS (¥) 125 108 – 138 152
P/CFPS (x) 2.6 3.8 – 3.0 2.7Source: Deutsche Securities Inc. estimates, company data
Recommendation Change
Buy Price at 1 Aug 2011 (¥) 413Price target - 12mth (¥) 53052-week range (¥) 440 - 244
Key changes
Rating Hold to BuyTarget price (¥) 300 to 530 76.7%EPS (¥) 32 to 15 -54.4%
Price/price relative
200240280320360400440480
8/09 2/10 8/10 2/11Pioneer
TOPIX (Rebased)
Performance (%) 1m 3m 12mAbsolute 13.5 21.5 30.7TOPIX -1.5 -1.2 -1.0
Stock data
Market cap (¥bn) 133Shares outstanding (m) 321Foreign shareholding ratio (%) 32.9TOPIX 841
Key indicators (FY1)
ROE (%) 6.0BPS (¥) 215P/B (x) 1.9EPS growth (%) -54.8Dividend yield (%) 0.2
Key point: Policies for expanding sales of consumer market products and generating more cash flow Major issues include expanding sales and generating more cash flow. Increasing sales, particularly of consumer market products, will be important for expanding earnings as benefits from cost reductions from downsizing and restructuring have peaked. An advantage Pioneer has is that it can expect synergies in its core car electronics segment because it handles both OEM and consumer market products. However, to demonstrate this advantage and compete as a global brand, we believe it needs to generate at least ¥500-600bn in sales. This will require considerable expenditure for advertising, incentives, and expanding its sales channels. We will be watching whether the company can come up with a credible, cost-effective plan for increasing spending to expand profits (especially in the car electronics segment). We also intend to monitor its ability to generate cash flow. Forecast point to 1Q OP of ¥1bn, FY3/12 profits slightly above guidance, and ongoing earnings improvement We forecast 1Q OP of ¥1bn, which is above what we presume to be the company's guidance. We revise our FY3/12 sales forecast to ¥487.9bn (+7% YoY), OP to ¥17.9bn (+13%), and NP to ¥4.7bn (-55%). Our profit forecasts are slightly above guidance. We forecast FY3/13 sales of ¥523.8bn (+7% over our FY3/12 forecast), OP of ¥21.3bn (+19%), and NP of ¥11.2bn (2.4x). We revise our FY3/12 EPS forecast from ¥32 to ¥15, and our FY3/13 EPS forecast from ¥43 to ¥35. Valuation and risk We base our ¥530 TP on a P/E of 15x our FY3/13 EPS forecast; a premium to the roughly 13x average of the six major car electronics companies (see pg 3). Risks include 1) poorer earnings due to the rapid appreciation of the yen against the euro and the Thai baht against the dollar, and 2) significantly lower-than-expected sales of autos and car electronics products due to accelerating inflation in emerging economies and weak private consumption in developed countries.
Revision note: This is the revised version of a report published on 1 August. The subtitle above the first paragraph on pg. 5 has been corrected to read “FY3/12 and FY3/13: Profits get set to recover”.
2 August 2011 Strategy Asia Equities Daily Focus
Deutsche Bank AG/Hong Kong Page 55
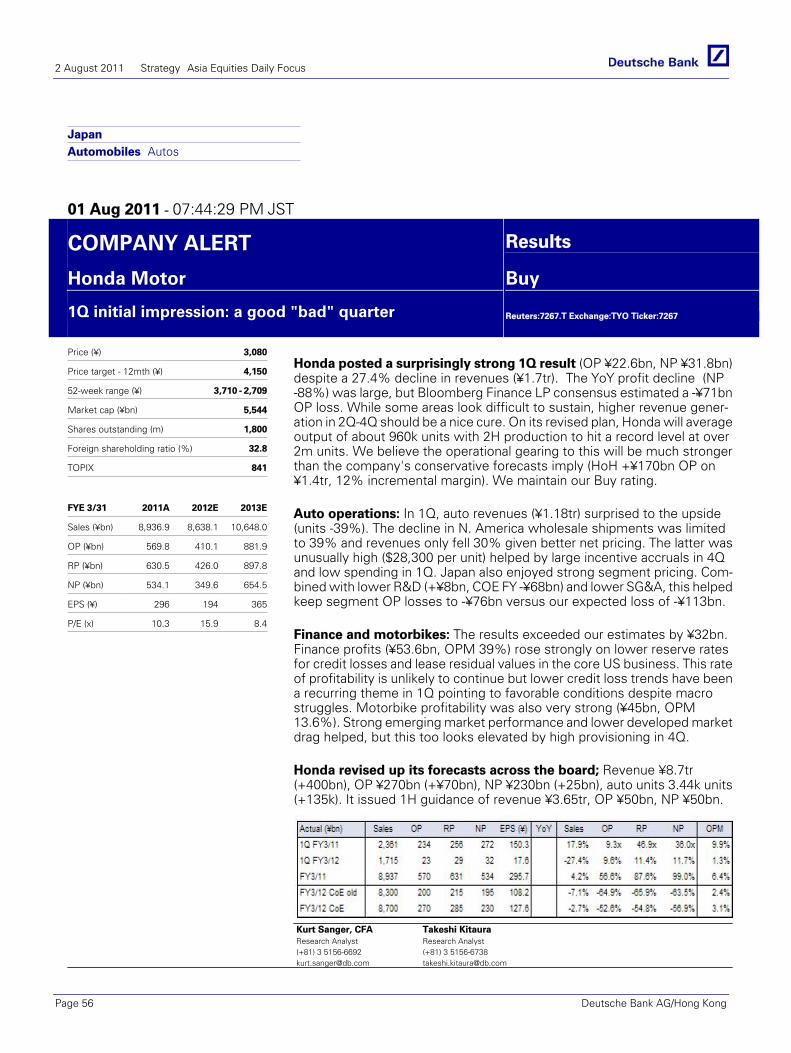
Japan Automobiles Autos
01 Aug 2011 - 07:44:29 PM JST
COMPANY ALERT Results
Honda Motor Buy
1Q initial impression: a good "bad" quarter
Reuters:7267.T Exchange:TYO Ticker:7267
Price (¥) 3,080
Price target - 12mth (¥) 4,150
52-week range (¥) 3,710 - 2,709
Market cap (¥bn) 5,544
Shares outstanding (m) 1,800
Foreign shareholding ratio (%) 32.8
TOPIX 841
FYE 3/31 2011A 2012E 2013E
Sales (¥bn) 8,936.9 8,638.1 10,648.0
OP (¥bn) 569.8 410.1 881.9
RP (¥bn) 630.5 426.0 897.8
NP (¥bn) 534.1 349.6 654.5
EPS (¥) 296 194 365
P/E (x) 10.3 15.9 8.4
Honda posted a surprisingly strong 1Q result (OP ¥22.6bn, NP ¥31.8bn)despite a 27.4% decline in revenues (¥1.7tr). The YoY profit decline (NP-88%) was large, but Bloomberg Finance LP consensus estimated a -¥71bnOP loss. While some areas look difficult to sustain, higher revenue gener-ation in 2Q-4Q should be a nice cure. On its revised plan, Honda will averageoutput of about 960k units with 2H production to hit a record level at over2m units. We believe the operational gearing to this will be much strongerthan the company's conservative forecasts imply (HoH +¥170bn OP on¥1.4tr, 12% incremental margin). We maintain our Buy rating.
Auto operations: In 1Q, auto revenues (¥1.18tr) surprised to the upside(units -39%). The decline in N. America wholesale shipments was limitedto 39% and revenues only fell 30% given better net pricing. The latter wasunusually high ($28,300 per unit) helped by large incentive accruals in 4Qand low spending in 1Q. Japan also enjoyed strong segment pricing. Com-bined with lower R&D (+¥8bn, COE FY -¥68bn) and lower SG&A, this helpedkeep segment OP losses to -¥76bn versus our expected loss of -¥113bn.
Finance and motorbikes: The results exceeded our estimates by ¥32bn.Finance profits (¥53.6bn, OPM 39%) rose strongly on lower reserve ratesfor credit losses and lease residual values in the core US business. This rateof profitability is unlikely to continue but lower credit loss trends have beena recurring theme in 1Q pointing to favorable conditions despite macrostruggles. Motorbike profitability was also very strong (¥45bn, OPM13.6%). Strong emerging market performance and lower developed marketdrag helped, but this too looks elevated by high provisioning in 4Q.
Honda revised up its forecasts across the board; Revenue ¥8.7tr(+400bn), OP ¥270bn (+¥70bn), NP ¥230bn (+25bn), auto units 3.44k units(+135k). It issued 1H guidance of revenue ¥3.65tr, OP ¥50bn, NP ¥50bn.
Source: CompanyKurt Sanger, CFAResearch Analyst(+81) 3 [email protected]
Takeshi KitauraResearch Analyst(+81) 3 [email protected]
2 August 2011 Strategy Asia Equities Daily Focus
Page 56 Deutsche Bank AG/Hong Kong
Japan Machinery
1 August 2011
Fanuc Reuters: 6954.T Bloomberg: 6954 JP Exchange: TYO Ticker: 6954
Results reaffirm competitiveness: OPM nears Keyence (raising TP)
Toshiharu Morota, CMA Research Analyst (+81) 3 5156-6721 [email protected]
Tomonori Ohata Research Analyst (+81) 3 5156-6342 [email protected]
Yukiko Nagatomo Research Associate (+81) 3 5156-6722 [email protected]
TP raised from ¥14,800 to ¥17,300; maintaining Buy rating Fanuc’s 1Q FY3/12 results show it further improved its competitiveness, and point to clearer visibility for 2Q and later. Fanuc avoided the impact of supply chain breakdowns after the quake by making design changes in less than four months (they normally take one year). Fanuc also absorbed higher costs and the stronger yen on its way to recording its highest 1Q OP margin ever. We view Fanuc as one of the most competitive manufacturers in Japan, and maintain our Buy rating.
Forecasts and ratios
Year End Mar 31 2011A 2012E 2012CoE 2013E 2014E
Sales (¥bn) 446.2 540.0 – 590.0 610.0
YoY (%) 76.1 21.0 – 9.3 3.4
Operating profit (¥bn) 189.8 240.0 – 265.0 275.0
YoY (%) 244.9 26.5 – 10.4 3.8
Recurring profit (¥bn) 195.4 247.0 – 272.5 283.0
Net profit (¥bn) 120.2 153.5 – 169.5 176.0
EPS (¥) 614 784 – 866 899
P/E (x) 18.1 18.6 – 16.9 16.2
EV/EBITDA (x) 7.9 8.7 – 7.5 6.9
CFPS (¥) 682 851 – 930 960
P/CFPS (x) 16.3 17.2 – 15.7 15.2Source: Deutsche Securities Inc. estimates, company data
Forecast Change
Buy Price at 29 Jul 2011 (¥) 14,610Price target - 12mth (¥) 17,30052-week range (¥) 14,730 - 9,020
Key changes
Target price (¥) 14,800 to 17,300 16.9%EPS (¥) 715 to 784 9.6%OP (¥bn) 220.0 to 240.0 9.1%RP (¥bn) 225.0 to 247.0 9.8%
Price/price relative
6000
8000
10000
12000
14000
16000
7/09 1/10 7/10 1/11
Fanuc TOPIX (Rebased)
Performance (%) 1m 3m 12mAbsolute 8.8 8.6 38.0TOPIX -0.3 -1.2 -2.3
Stock data
Market cap (¥bn) 2,860Shares outstanding (m) 196Foreign shareholding ratio (%) 51.0TOPIX 841
Key indicators (FY1)
ROE (%) 16.2BPS (¥) 5,109P/B (x) 2.9EPS growth (%) 27.8Dividend yield (%) 1.6
Heightened possibility of new OP record in FY3/12: OP margin nears Keyence Consolidated orders were ¥154.4bn (+28.6% YoY) in 1Q FY3/12 (qtly record). Fanuc raised 1H sales est to ¥265.3bn (+26.8%) and OP est to ¥116.8bn (+31.1%). Its 1Q 41.8% OPM is a quarterly record, and 2Q OPM of 46.2%(CoE) should be another record. Fanuc’s OP margin may be near Keyence, which has one of the highest margins among listed companies. The adverse business environment may have further strengthened Fanuc’s competitiveness. Meanwhile, based on 1Q orders, we view 2Q sales guidance as conservative. Recovering capital spending at automakers should also aid 2H earnings, so we think Fanuc could again post record earnings in FY3/12. We raise our EPS est from ¥715 to ¥784 for FY3/12 and from ¥766 to ¥866 for FY3/13. Hon Hai Precision Industry purchased 1,005 machining centers from Fanuc Apple has widened its use of unibody construction, and we think this is aiding Fanuc’s earnings. Hon Hai purchased 2,023 robomachines from Fanuc in 1Q and 1,005 more in July. Wide use of Fanuc products by Hon Hai, which is one of the major EMSs, could make its robomachine a quasi-de-facto standard there. We estimate that the factory automation (FA) market in China is growing by 25-30% a year. It took almost 10 years for Chinese excavator makers to approach the market share of Japanese makers – for FA the gap may remain for even longer. Valuation and risk We base our ¥17,300 TP on a P/E of 20x our FY3/13 EPS est of ¥865.9; referencing the 5-yr historical avg S&P 500 P/E + 2 standard deviations (about 20x). Our TP was previously based on the avg EPS for FY3/12 and FY3/13 but now we only use the FY3/13 figure as Fanuc’s visibility should improve next year (judging from its increased strength and competitiveness, based on 1Q results). Risks are China’s macro trends/expectations and less orders from non-Japan Asian EMS companies. Mgmt has not allowed visits and discloses little info, leaving room for surprises (see pg 6).
2 August 2011 Strategy Asia Equities Daily Focus
Deutsche Bank AG/Hong Kong Page 57
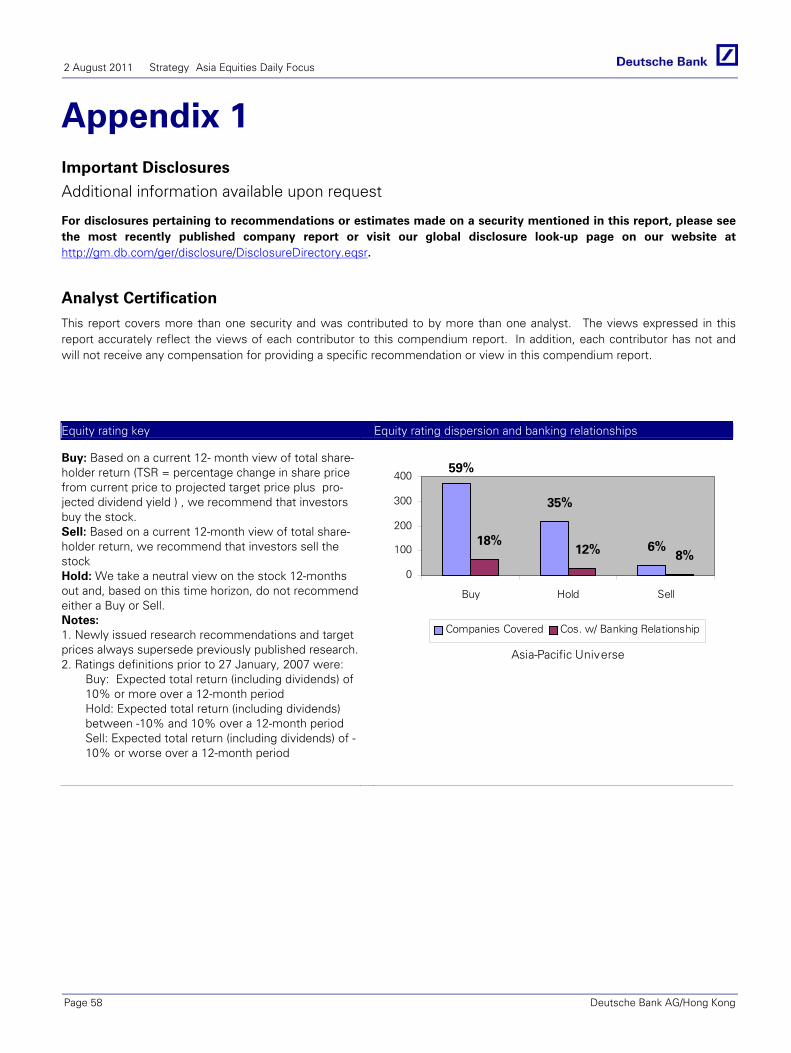
2 August 2011 Strategy Asia Equities Daily Focus
Appendix 1 Important Disclosures
Additional information available upon request
For disclosures pertaining to recommendations or estimates made on a security mentioned in this report, please see the most recently published company report or visit our global disclosure look-up page on our website at http://gm.db.com/ger/disclosure/DisclosureDirectory.eqsr.
Analyst Certification
This report covers more than one security and was contributed to by more than one analyst. The views expressed in this report accurately reflect the views of each contributor to this compendium report. In addition, each contributor has not and will not receive any compensation for providing a specific recommendation or view in this compendium report.
Equity rating key Equity rating dispersion and banking relationships Buy: Based on a current 12- month view of total share-holder return (TSR = percentage change in share price from current price to projected target price plus pro-jected dividend yield ) , we recommend that investors buy the stock. Sell: Based on a current 12-month view of total share-holder return, we recommend that investors sell the stock Hold: We take a neutral view on the stock 12-months out and, based on this time horizon, do not recommend either a Buy or Sell. Notes: 1. Newly issued research recommendations and target prices always supersede previously published research.2. Ratings definitions prior to 27 January, 2007 were:
Buy: Expected total return (including dividends) of 10% or more over a 12-month period Hold: Expected total return (including dividends) between -10% and 10% over a 12-month period Sell: Expected total return (including dividends) of -10% or worse over a 12-month period
6%
35%
59%
8%12%18%
0
100
200
300
400
Buy Hold Sell
Asia-Pacific Universe
Companies Covered Cos. w/ Banking Relationship
Page 58 Deutsche Bank AG/Hong Kong
2 August 2011 Strategy Asia Equities Daily Focus
Deutsche Bank AG/Hong Kong Page 59
Regulatory Disclosures
1. Important Additional Conflict Disclosures
Aside from within this report, important conflict disclosures can also be found at https://gm.db.com/equities under the "Disclosures Lookup" and "Legal" tabs. Investors are strongly encouraged to review this information before investing.
2. Short-Term Trade Ideas
Deutsche Bank equity research analysts sometimes have shorter-term trade ideas (known as SOLAR ideas) that are consistent or inconsistent with Deutsche Bank's existing longer term ratings. These trade ideas can be found at the SOLAR link at http://gm.db.com.
3. Country-Specific Disclosures
Australia: This research, and any access to it, is intended only for "wholesale clients" within the meaning of the Australian Corporations Act. Brazil: The views expressed above accurately reflect personal views of the authors about the subject company(ies) and its(their) securities, including in relation to Deutsche Bank. The compensation of the equity research analyst(s) is indirectly affected by revenues deriving from the business and financial transactions of Deutsche Bank. EU countries: Disclosures relating to our obligations under MiFiD can be found at http://globalmarkets.db.com/riskdisclosures. Japan: Disclosures under the Financial Instruments and Exchange Law: Company name - Deutsche Securities Inc. Registration number - Registered as a financial instruments dealer by the Head of the Kanto Local Finance Bureau (Kinsho) No. 117. Member of associations: JSDA, The Financial Futures Association of Japan. Commissions and risks involved in stock transactions - for stock transactions, we charge stock commissions and consumption tax by multiplying the transaction amount by the commission rate agreed with each customer. Stock transactions can lead to losses as a result of share price fluctuations and other factors. Transactions in foreign stocks can lead to additional losses stemming from foreign exchange fluctuations. "Moody's", "Standard & Poor's", and "Fitch" mentioned in this report are not registered credit rating agencies in Japan unless “Japan” is specifically designated in the name of the entity. New Zealand: This research is not intended for, and should not be given to, "members of the public" within the meaning of the New Zealand Securities Market Act 1988. Russia: This information, interpretation and opinions submitted herein are not in the context of, and do not constitute, any appraisal or evaluation activity requiring a license in the Russian Federation.
Deutsche Bank AG/Hong Kong
Asia-Pacific locations
Deutsche Bank AG Deutsche Bank Place Level 16 Corner of Hunter & Phillip Streets Sydney, NSW 2000 Australia Tel: (61) 2 8258 1234
Deutsche Bank AG Filiale Hongkong International Commerce Centre, 1 Austin Road West,Kowloon, Hong Kong tel: (852) 2203 8888
Deutsche Equities India Pte Ltd 3rd Floor, Kodak House 222, Dr D.N. Road Fort, Mumbai 400 001 SEBI Nos: INB231196834 INB011196830, INF231196834 Tel: (91) 22 6658 4600
Deutsche Securities Inc. 2-11-1 Nagatacho
Sanno Park Tower Chiyoda-ku, Tokyo 100-6171 Japan Tel: (81) 3 5156 6770
Deutsche Bank (Malaysia) Berhad Level 18-20 Menara IMC 8 Jalan Sultan Ismail Kuala Lumpur 50250 Malaysia Tel: (60) 3 2053 6760
In association with Deutsche Regis Partners, Inc. Level 23, Tower One Ayala Triangle, Ayala Avenue Makati City, Philippines Tel: (63) 2 894 6600
Deutsche Securities Korea Co. 17th Floor, YoungPoong Bldg., 33 SeoRin-Dong, Chongro-Ku, Seoul (110-752) Republic of Korea Tel: (82) 2 316 8888
Deutsche Bank AG Singapore One Raffles Quay South Tower Singapore 048583 Tel: (65) 6423 8001
Deutsche Securities Asia Ltd Taiwan Branch Level 6 296 Jen-Ai Road, Sec 4 Taipei 106
In association with In association with TISCO Securities Co., Ltd PT Deutsche Verdhana Indonesia TISCO Tower Deutsche Bank Building, 48/8 North Sathorn Road 6th Floor, Jl. Imam Bonjol No.80, Bangkok 10500 Central Jakarta,
Taiwan Thailand Indonesia Tel: (886) 2 2192 2888 Tel: (66) 2 633 6470 Tel: (62 21) 318 9541
International locations
Deutsche Bank Securities Inc. Deutsche Bank AG London Deutsche Bank AG Deutsche Bank AG 60 Wall Street 1 Great Winchester Street Große Gallusstraße 10-14 Deutsche Bank Place New York, NY 10005 London EC2N 2EQ 60272 Frankfurt am Main Level 16 United States of America United Kingdom Germany Corner of Hunter & Phillip Streets Tel: (1) 212 250 2500 Tel: (44) 20 7545 8000 Tel: (49) 69 910 00 Sydney, NSW 2000
Australia Tel: (61) 2 8258 1234
Deutsche Securities Inc. Deutsche Bank AG Filiale Hongkong 2-11-1 Nagatacho International Commerce Centre, Sanno Park Tower 1 Austin Road West,Kowloon, Chiyoda-ku, Tokyo 100-6171 Hong Kong Japan Tel: (852) 2203 8888 Tel: (81) 3 5156 6770
Global Disclaimer The information and opinions in this report were prepared by Deutsche Bank AG or one of its affiliates (collectively "Deutsche Bank"). The information herein is believed to be reliable and has been obtained from public sources believed to be reliable. Deutsche Bank makes no representation as to the accuracy or completeness of such information.
Deutsche Bank may engage in securities transactions, on a proprietary basis or otherwise, in a manner inconsistent with the view taken in this research report. In addition, others within Deutsche Bank, including strategists and sales staff, may take a view that is inconsistent with that taken in this research report.
Opinions, estimates and projections in this report constitute the current judgement of the author as of the date of this report. They do not necessarily reflect the opinions of Deutsche Bank and are subject to change without notice. Deutsche Bank has no obligation to update, modify or amend this report or to otherwise notify a recipient thereof in the event that any opinion, forecast or estimate set forth herein, changes or subsequently becomes inaccurate. Prices and availability of financial instruments are subject to change without notice. This report is provided for informational purposes only. It is not an offer or a solicitation of an offer to buy or sell any financial instruments or to participate in any particular trading strategy. Target prices are inherently imprecise and a product of the analyst judgement.
As a result of Deutsche Bank’s March 2010 acquisition of BHF-Bank AG, a security may be covered by more than one analyst within the Deutsche Bank group. Each of these analysts may use differing methodologies to value the security; as a result, the recommendations may differ and the price targets and estimates of each may vary widely.
In August 2009, Deutsche Bank instituted a new policy whereby analysts may choose not to set or maintain a target price of certain issuers under coverage with a Hold rating. In particular, this will typically occur for "Hold" rated stocks having a market cap smaller than most other companies in its sector or region. We believe that such policy will allow us to make best use of our resources. Please visit our website at http://gm.db.com to determine the target price of any stock.
The financial instruments discussed in this report may not be suitable for all investors and investors must make their own informed investment decisions. Stock transactions can lead to losses as a result of price fluctuations and other factors. If a financial instrument is denominated in a currency other than an investor's currency, a change in exchange rates may adversely affect the investment. Past performance is not necessarily indicative of future results. Deutsche Bank may with respect to securities covered by this report, sell to or buy from customers on a principal basis, and consider this report in deciding to trade on a proprietary basis.
Unless governing law provides otherwise, all transactions should be executed through the Deutsche Bank entity in the investor's home jurisdiction. In the U.S. this report is approved and/or distributed by Deutsche Bank Securities Inc., a member of the NYSE, the NASD, NFA and SIPC. In Germany this report is approved and/or communicated by Deutsche Bank AG Frankfurt authorized by the BaFin. In the United Kingdom this report is approved and/or communicated by Deutsche Bank AG London, a member of the London Stock Exchange and regulated by the Financial Services Authority for the conduct of investment business in the UK and authorized by the BaFin. This report is distributed in Hong Kong by Deutsche Bank AG, Hong Kong Branch, in Korea by Deutsche Securities Korea Co. This report is distributed in Singapore by Deutsche Bank AG, Singapore Branch, and recipients in Singapore of this report are to contact Deutsche Bank AG, Singapore Branch in respect of any matters arising from, or in connection with, this report. Where this report is issued or promulgated in Singapore to a person who is not an accredited investor, expert investor or institutional investor (as defined in the applicable Singapore laws and regulations), Deutsche Bank AG, Singapore Branch accepts legal responsibility to such person for the contents of this report. In Japan this report is approved and/or distributed by Deutsche Securities Inc. The information contained in this report does not constitute the provision of investment advice. In Australia, retail clients should obtain a copy of a Product Disclosure Statement (PDS) relating to any financial product referred to in this report and consider the PDS before making any decision about whether to acquire the product. Deutsche Bank AG Johannesburg is incorporated in the Federal Republic of Germany (Branch Register Number in South Africa: 1998/003298/10). Additional information relative to securities, other financial products or issuers discussed in this report is available upon request. This report may not be reproduced, distributed or published by any person for any purpose without Deutsche Bank's prior written consent. Please cite source when quoting.
Copyright © 2011 Deutsche Bank AG