Embed Size (px)
Citation preview

Asia Pan-Asia Strategy
18 January 2011
Asia Equities Daily Focus Today's research headlines Asian Edition
Deutsche Bank AG/Hong Kong
All prices are those current at the end of the previous trading session unless otherwise indicated. Prices are sourced from local exchanges via Reuters, Bloomberg and other vendors. Data is sourced from Deutsche Bank and subject companies. Deutsche Bank does and seeks to do business with companies covered in its research reports. Thus, investors should be aware that the firm may have a conflict of interest that could affect the objectivity of this report. Investors should consider this report as only a single factor in making their investment decision. DISCLOSURES AND ANALYST CERTIFICATIONS ARE LOCATED IN APPENDIX 1. MICA(P) 007/05/2010
Periodical
Asian Index Closings EQUITIES Close 1D Chg %Chg
SHSZ300 2974.35 -3.80 -4.92 HSCEI 12938.05 -1.63 1.94 HSI 24156.97 -0.52 4.87 TWSE 8925.09 -0.53 -0.53 KOSPI 2099.85 -0.40 2.38 FSSTI 3238.63 -0.23 1.52 KLCI 1574.49 0.29 3.66 SENSEX 18882.25 0.12 -7.93 NIFTY 5654.75 0.00 -7.82 SET 1023.19 -0.88 -0.93 JCI 3535.73 -0.94 -4.53 PCOMP 4148.16 0.39 -1.26 ASX200 4763.10 -0.80 0.38 FOREX (vs US$) Close 1D Chg YTD %Chg Rmb 6.59 0.05 0.20 HK$ 7.78 -0.02 -0.03 NT$ 29.02 0.01 0.97 Won 1117.48 -0.28 0.76 S$ 1.29 -0.01 -0.36 M$ 3.06 -0.05 0.16 Rupee 45.52 -0.34 -1.79 Baht 30.57 -0.33 -1.67 Rupiah 9063.00 -0.10 -0.74 Peso 44.52 -0.66 -1.61 A$ 0.99 0.50 -2.89
Source: Bloomberg Finance LP
Latest Commodity Prices COMMODITIES Close 1D %Chg YTD %Chg West Texas 91.54 0.15 0.18 Brent 97.16 -0.97 3.03 CRB 333.06 0.00 0.08 Copper 440.35 0.84 -0.81 Gold (Spot) 1362.65 0.07 -4.09 Alum. (LME) 2472.00 -0.48 0.08 Baltic Dry 1439.00 0.07 -18.84
Source: Bloomberg Finance LP
DB CORPORATE ACCESS DB Access India Conference 2011 - Mumbai 3/7 - 9 DB Access Asia Conference 2011 - Singapore 5/23 - 26
Research Team
Carissa Szeto Equity Focus (+852) 2203 6171 [email protected] Ching-Li Teo, CFA Equity Focus (+852) 2203 6206 [email protected]
Co
mp
any
Glo
bal
Mar
kets
Res
earc
h
Nodita_ 1. 2.
TOP STORIES Malaysia Strategy Charging forward; Bullish Su-Yin Teoh Page 5
Siliconware Precision (2325.TW),TWD36.20 Buy Price Target TWD46.00
Structural turnaround in sight; upgrading to Buy Michael Chou Page 6
RECOMMENDATION CHANGES
Shinsegae (004170.KS) KRW 603,000 Hold Price Target KRW 660,000
No excitement expected; downgrading to Hold
Jihyun Song Page 7
Bursa Malaysia (BMYS.KL),MYR8.90 Hold Price Target MYR8.20
Turnover rebound; upgrade to Hold Andrew HillPage 8
ESTIMATE & TARGET PRICE CHANGES
Hengan Intl. (1044.HK),HKD61.25 Buy Price Target HKD69.50
Near-term hiccups; long term staying positive; maintain Buy
Mabel WongPage 9
PICC (2328.HK),HKD10.76 Sell Price Target HKD8.10
Group restructuring is still a dilutionrisk
Bob LeungPage 10
Axis Bank (AXBK.BO) INR 1,201.35 Buy Target Price INR 1,560.00
Profitability intact on pricing power &liquidity management
Dipankar Choudhury Page 11
Glenmark Pharma (GLEN.BO),INR347.55 Hold Price Target INR325.00
Traction in US but slower recoveryacross markets
Abhay Shanbhag Page 12
Steel Authority of India (SAIL.BO),INR157.15 Buy Price Target INR207.00
Revising estimates down but remainpositive
Abhay Laijawala Page 13
STRATEGY/ECONOMICS
Asia Economics Daily China RRR hike; Singapore inflation and trade
Michael Spencer Page 14
Asia Economics Monthly January Michael Spencer Page 17
Asia Real Exchange Rates November Indices Juliana Lee
Page 19
Global Commodities Daily Harsh weather and inflation Michael Lewis
Page 22
Commodities Outlook Michael LewisPage 24
Tech@DB Infosys disappoints, Elpida and Toshiba look interesting
Kishore Suratkal Page 26
18 January 2011 Strategy Asia Equities Daily Focus
Page 2 Deutsche Bank AG/Hong Kong
ADDITIONAL RESEARCH
Banks Another RRR hike of 50bps DB CORPORATE ACCESS
Tracy Yu Page 27
China Prop Weekly Monitor Volume rebounds with tier-2/3 cities'
recovery
DB Access India Conference 2011 - Mumbai 3/7 - 9 DB Access Asia Conference 2011 - Singapore 5/23 – 26
Tony Tsang Page 28
Li Ning Co Ltd (2331.HK) HKD17.08 Sell Price Target HKD14.68
Two-year transition period ahead?
NDRs Ciputra Property TBK PT (CTRP IJ) - SG 1/19 - 20
Rebecca Jiang
Page 29
Property Banks might cancel discounts for first-home mortgages
PT Kawasan Industri Jababeka (KIJA IJ) - HK 1/21 Nan Ya Printed Circuit Board Corp (8046 TT) - Shenzhen 2/21, HK 2/22 - 23 Mirae Asset Securities (037620 KS) - HK 1/24 - 26, SG 1/27 - 28
Tony Tsang Page 30
Property New launch received strong responses
DB ANALYST/SALES ROADSHOWS Tony Tsang Page 31
Asustek (2357.TW),TWD267.00 Buy Price Target TWD285.00
Asustek to sell Pegatron shares; reiterating Buy
Alan Hellawell: China TMT - SG 1/18 Heriyanto Irawan: Indonesia Strategy - SG 1/18 - 19, HK 1/20 - 21 Kc Kao
Page 32
Ascendas Real Estate (AEMN.SI),SGD2.16 Buy Price Target SGD2.33
3Q slightly below forecast; regional opportunities beckon
Tony Tsang, Jason Ching & Venant Chiang: China /HK Property - HK 1/19 - 25 Jaehoon Park: Korea Banks Marketing Outlook for 2011 - SG 1/24 - 25, HK 1/26 - 27 Vincent Ha: China Auto - SG 1/25 - 26, HK 1/27 - 28 Rafael Garchitorena: Philippine Strategy - HK 1/19 - 21, SG 1/26 - 28
DB INTERNATIONAL PRODUCT ROADSHOWS
Gregory Lui
Page 33
Property Dec new home sales slide 30%; more weakness ahead
Elaine Khoo Page 34
SP Setia (SETI.KL) MYR6.70 Buy Price Target MYR7.35
Secures prime land; proposes placement and bonus issue
Aun-Ling Chia
Page 35Repsol - YPF (REP SM) - PEK 1/19, HK 1/20
Mario Pierry: LatAm Banking - Abu Dhabi/Dubai 1/23, SG 1/24, HK 1/25
Manish Shukla Banks Magma call indicates upbeat prospects for CV & auto finance
Page 36
Power Finance Corp (PWFC.BO),INR272.45 Buy Price Target INR405.00
3QFY11 - core results solid, exceptionals pull down profit
Dipankar Choudhury
Page 37
Bank Mandiri (BMRI.JK),IDR5,750.00 Buy Price Target IDR7,700.00
Strong Oct-10 trend - on track to beat consensus forecast
Raymond Kosasih
Page 38
DB Indonesia Banking Sector Rate convergence Raymond
Kosasih Page 39
Telkom (TLKM.JK),IDR7,500.00 Buy Price Target IDR9,000.00
Telkomsel targets higher net adds in 2011
Raymond Kosasih
Page 40
GLOBAL RESEARCH
Yamada Denki (9831.T),¥5,430 Hold Price Target ¥5,900
Revising forecasts: Cash flow outlook acts as buffer
Takahiro Kazahaya Page 41
The notes and reports contained in this Daily are all excerpts of previously published documents. Please refer to the published notes on our web site for details on risks, valuations and earnings changes
18 January 2011 Strategy Asia Equities Daily Focus
Deutsche Bank AG/Hong Kong Page 3
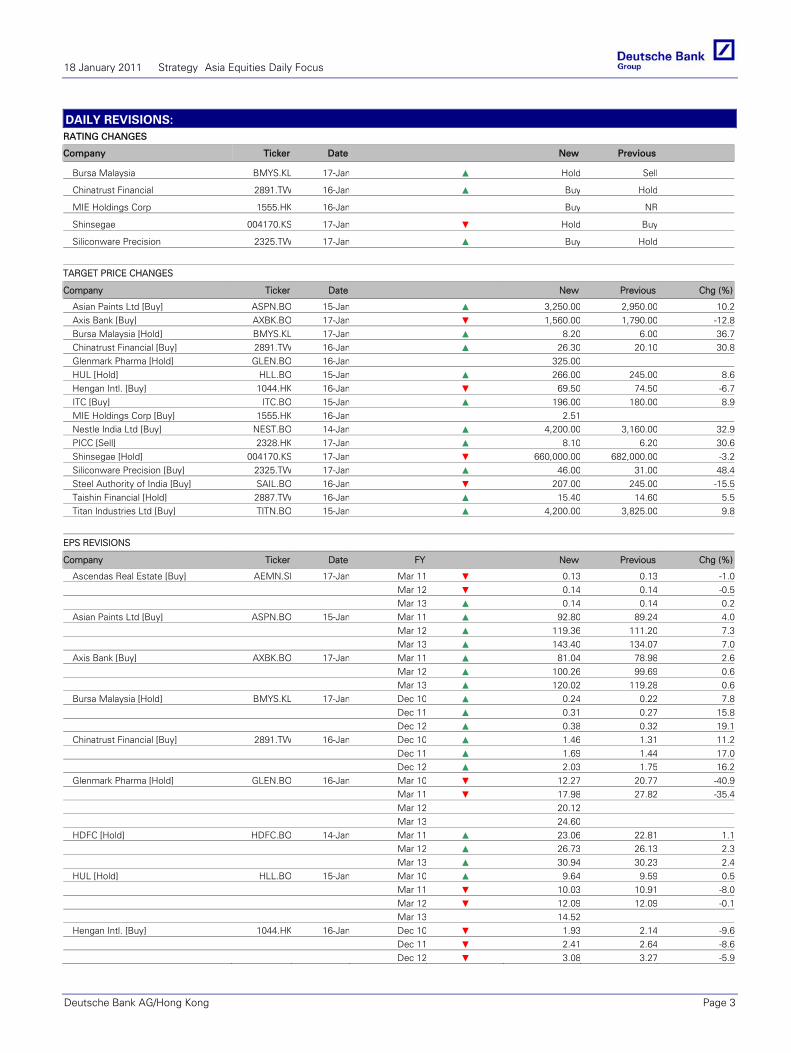
DAILY REVISIONS: RATING CHANGES
Company Ticker Date New Previous
Bursa Malaysia BMYS.KL 17-Jan ▲ Hold Sell
Chinatrust Financial 2891.TW 16-Jan ▲ Buy Hold
MIE Holdings Corp 1555.HK 16-Jan Buy NR
Shinsegae 004170.KS 17-Jan ▼ Hold Buy
Siliconware Precision 2325.TW 17-Jan ▲ Buy Hold
TARGET PRICE CHANGES
Company Ticker Date New Previous Chg (%)
Asian Paints Ltd [Buy] ASPN.BO 15-Jan ▲ 3,250.00 2,950.00 10.2Axis Bank [Buy] AXBK.BO 17-Jan ▼ 1,560.00 1,790.00 -12.8Bursa Malaysia [Hold] BMYS.KL 17-Jan ▲ 8.20 6.00 36.7Chinatrust Financial [Buy] 2891.TW 16-Jan ▲ 26.30 20.10 30.8Glenmark Pharma [Hold] GLEN.BO 16-Jan 325.00 HUL [Hold] HLL.BO 15-Jan ▲ 266.00 245.00 8.6Hengan Intl. [Buy] 1044.HK 16-Jan ▼ 69.50 74.50 -6.7ITC [Buy] ITC.BO 15-Jan ▲ 196.00 180.00 8.9MIE Holdings Corp [Buy] 1555.HK 16-Jan 2.51 Nestle India Ltd [Buy] NEST.BO 14-Jan ▲ 4,200.00 3,160.00 32.9PICC [Sell] 2328.HK 17-Jan ▲ 8.10 6.20 30.6Shinsegae [Hold] 004170.KS 17-Jan ▼ 660,000.00 682,000.00 -3.2Siliconware Precision [Buy] 2325.TW 17-Jan ▲ 46.00 31.00 48.4Steel Authority of India [Buy] SAIL.BO 16-Jan ▼ 207.00 245.00 -15.5Taishin Financial [Hold] 2887.TW 16-Jan ▲ 15.40 14.60 5.5Titan Industries Ltd [Buy] TITN.BO 15-Jan ▲ 4,200.00 3,825.00 9.8
EPS REVISIONS
Company Ticker Date FY New Previous Chg (%)
Ascendas Real Estate [Buy] AEMN.SI 17-Jan Mar 11 ▼ 0.13 0.13 -1.0 Mar 12 ▼ 0.14 0.14 -0.5 Mar 13 ▲ 0.14 0.14 0.2Asian Paints Ltd [Buy] ASPN.BO 15-Jan Mar 11 ▲ 92.80 89.24 4.0 Mar 12 ▲ 119.36 111.20 7.3 Mar 13 ▲ 143.40 134.07 7.0Axis Bank [Buy] AXBK.BO 17-Jan Mar 11 ▲ 81.04 78.98 2.6 Mar 12 ▲ 100.26 99.69 0.6 Mar 13 ▲ 120.02 119.28 0.6Bursa Malaysia [Hold] BMYS.KL 17-Jan Dec 10 ▲ 0.24 0.22 7.8 Dec 11 ▲ 0.31 0.27 15.8 Dec 12 ▲ 0.38 0.32 19.1Chinatrust Financial [Buy] 2891.TW 16-Jan Dec 10 ▲ 1.46 1.31 11.2 Dec 11 ▲ 1.69 1.44 17.0 Dec 12 ▲ 2.03 1.75 16.2Glenmark Pharma [Hold] GLEN.BO 16-Jan Mar 10 ▼ 12.27 20.77 -40.9 Mar 11 ▼ 17.98 27.82 -35.4 Mar 12 20.12 Mar 13 24.60 HDFC [Hold] HDFC.BO 14-Jan Mar 11 ▲ 23.06 22.81 1.1 Mar 12 ▲ 26.73 26.13 2.3 Mar 13 ▲ 30.94 30.23 2.4HUL [Hold] HLL.BO 15-Jan Mar 10 ▲ 9.64 9.59 0.5 Mar 11 ▼ 10.03 10.91 -8.0 Mar 12 ▼ 12.09 12.09 -0.1 Mar 13 14.52 Hengan Intl. [Buy] 1044.HK 16-Jan Dec 10 ▼ 1.93 2.14 -9.6 Dec 11 ▼ 2.41 2.64 -8.6 Dec 12 ▼ 3.08 3.27 -5.9
18 January 2011 Strategy Asia Equities Daily Focus
Page 4 Deutsche Bank AG/Hong Kong
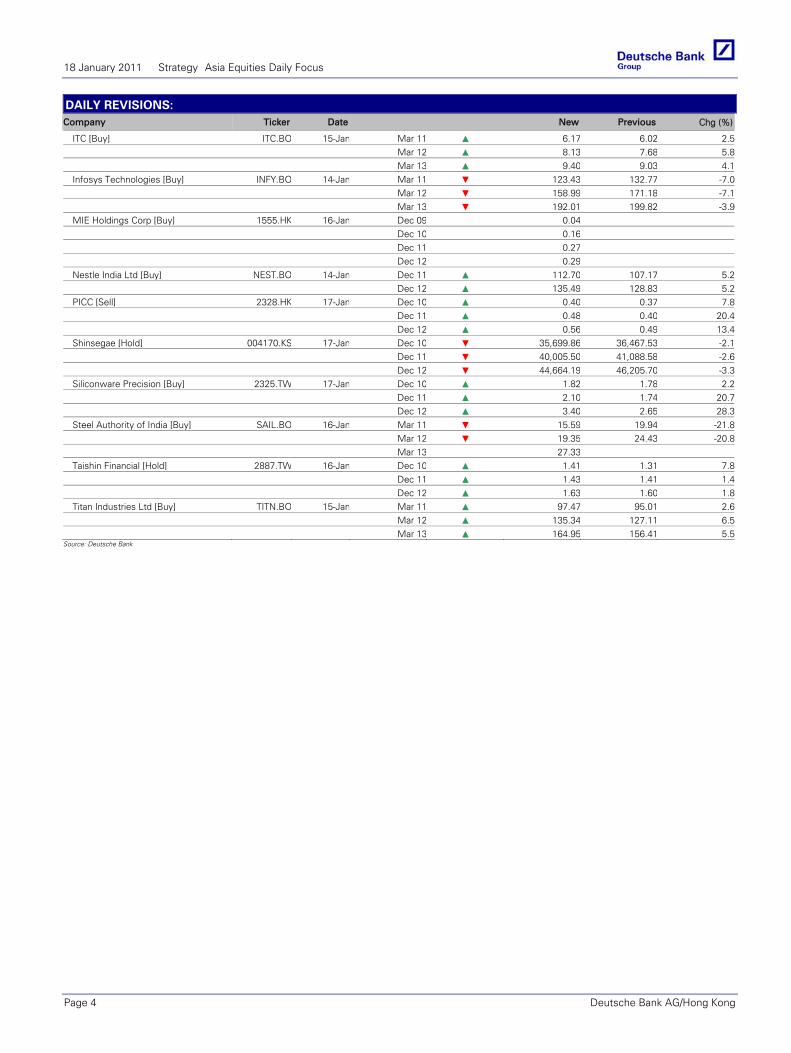
DAILY REVISIONS: Company Ticker Date New Previous Chg (%)
ITC [Buy] ITC.BO 15-Jan Mar 11 ▲ 6.17 6.02 2.5 Mar 12 ▲ 8.13 7.68 5.8 Mar 13 ▲ 9.40 9.03 4.1Infosys Technologies [Buy] INFY.BO 14-Jan Mar 11 ▼ 123.43 132.77 -7.0 Mar 12 ▼ 158.99 171.18 -7.1 Mar 13 ▼ 192.01 199.82 -3.9MIE Holdings Corp [Buy] 1555.HK 16-Jan Dec 09 0.04 Dec 10 0.16 Dec 11 0.27 Dec 12 0.29 Nestle India Ltd [Buy] NEST.BO 14-Jan Dec 11 ▲ 112.70 107.17 5.2 Dec 12 ▲ 135.49 128.83 5.2PICC [Sell] 2328.HK 17-Jan Dec 10 ▲ 0.40 0.37 7.8 Dec 11 ▲ 0.48 0.40 20.4 Dec 12 ▲ 0.56 0.49 13.4Shinsegae [Hold] 004170.KS 17-Jan Dec 10 ▼ 35,699.86 36,467.53 -2.1 Dec 11 ▼ 40,005.50 41,088.58 -2.6 Dec 12 ▼ 44,664.19 46,205.70 -3.3Siliconware Precision [Buy] 2325.TW 17-Jan Dec 10 ▲ 1.82 1.78 2.2 Dec 11 ▲ 2.10 1.74 20.7 Dec 12 ▲ 3.40 2.65 28.3Steel Authority of India [Buy] SAIL.BO 16-Jan Mar 11 ▼ 15.59 19.94 -21.8 Mar 12 ▼ 19.35 24.43 -20.8 Mar 13 27.33 Taishin Financial [Hold] 2887.TW 16-Jan Dec 10 ▲ 1.41 1.31 7.8 Dec 11 ▲ 1.43 1.41 1.4 Dec 12 ▲ 1.63 1.60 1.8Titan Industries Ltd [Buy] TITN.BO 15-Jan Mar 11 ▲ 97.47 95.01 2.6 Mar 12 ▲ 135.34 127.11 6.5 Mar 13 ▲ 164.95 156.41 5.5
Source: Deutsche Bank
Asia ASEAN Malaysia Strategy Update
17 January 2011
Malaysia Strategy
Charging forward; Bullish
We are Bulls in 2011 We expect the market to remain strong in 1H2011 as the government pushes through its reform initiatives and positive newsflow on deals/M&A continues. EPS growth momentum should persist on high commodity prices and brisk property sales.
Superior growth + ASEAN champions + confident Malaysians
Su-Yin Teoh Strategist (+60) 3 2053 6770 [email protected]
Cameron Robson Research Assistant (+60) 3 2053 6767 [email protected]
Deutsche Bank AG/Hong Kong
All prices are those current at the end of the previous trading session unless otherwise indicated. Prices are sourced from local exchanges via Reuters, Bloomberg and other vendors. Data is sourced from Deutsche Bank and subject companies. Deutsche Bank does and seeks to do business with companies covered in its research reports. Thus, investors should be aware that the firm may have a conflict of interest that could affect the objectivity of this report. Investors should consider this report as only a single factor in making their investment decision. DISCLOSURES AND ANALYST CERTIFICATIONS ARE LOCATED IN APPENDIX 1. MICA(P) 007/05/2010
Companies featured
CIMB Group (CIMB.KL),MYR8.80 Buy2009A 2010E 2011E
P/E (x) 23.0 16.8 14.1Div yield (%) 1.0 1.0 2.8Price/book (x) 4.5 2.5 2.3Petronas Chemicals Group (PCGB.KL),MYR6.35Buy
2010A 2011E 2012EP/E (x) 19.0 17.7 12.0EV/EBITDA (x) 8.5 10.2 6.5Price/book (x) 2.4 2.6 2.3AMMB Holdings (AMMB.KL),MYR7.00 Buy
2010A 2011E 2012EP/E (x) 11.7 15.5 12.4Div yield (%) 1.4 1.8 2.3Price/book (x) 1.5 1.9 1.7IJM Corp (IJMS.KL),MYR6.77 Buy
2010A 2011E 2012EP/E (x) 26.1 23.6 18.7EV/EBITDA (x) 11.9 10.6 9.1Price/book (x) 1.3 1.7 1.5AirAsia (AIRA.KL),MYR2.97 Buy
2009A 2010E 2011EP/E (x) 6.1 10.2 8.6EV/EBITDA (x) 7.4 8.3 7.1Price/book (x) 1.5 2.4 1.9SP Setia (SETI.KL),MYR6.70 Buy
2010A 2011E 2012EP/E (x) 18.2 28.0 20.7EV/EBITDA (x) 18.2 21.4 15.8Price/book (x) 2.4 3.0 2.7
Related recent research Date
Truly Malaysia Su-Yin Teoh 28 Oct 2010Malaysia Budget 2010 Su-Yin Teoh 15 Oct 2010Detailed road map Aun-Ling Chia 21 Sep 2010What to focus on in 2H2010 Su-Yin Teoh 14 Jul 2010
Off to a strong start (3.9% YTD); transformation underway In an ASEAN context, Deutsche Bank is positive on the Malaysian market in 2011. Confounding the skeptics, Malaysia is (finally) delivering on its ambitious transformation plans and this is increasingly being recognised by the market. Food and fuel subsidies are gradually being abolished (kerosene +4.2% since November, diesel +8.6%). This is a bold political move given decades of hefty subsidies. Local contractors are busy again with projects (e.g. RM36bn MRT project just approved by the cabinet) essential for keeping pace with economic growth. Malaysians are confident again, evident in the strong rebound in retail sales (projected at 10-12% YoY in 2011), M&A activity accelerating (Malaysia posted the biggest YoY jump in M&A in Asia in 2010) and property sales lifting.
This is not a defensive market; Malaysia to deliver 26% growth in 2011 Collectively, the structural initiatives over the last five years have started to pay off. These include a) the aggressive restructuring of most GLCs, b) rapid offshore expansion by Malaysia companies, c) market liberalisation measures, d) abolishment of the Foreign Investment Committee (FIC) guidelines in selected sectors, and e) the listings of companies such as Petronas Chemicals, MMHE and Maxis. These initiatives have raised earnings volatility but, in turn, earnings growth has strengthened materially. Earnings from offshore entities (largely ASEAN based) now account for 32% of total earnings (based on our universe of stocks) versus just 10% in 2005. By 2012E, we forecast this number to climb to 36%. This is a significant change that we believe the market has yet to fully appreciate. And it is why Malaysia’s earnings growth of 26% in 2011E is just slightly behind that of Indonesia at 27%. The Malaysian market offers a strong growth proposition combined with a dividend yield of 3.5%, above the regional average.
14% upside to our FBM KLCI index target of 1,790 We see further upside risk to earnings in 2011 as commodity prices stay lofty, M&A activity accelerates further, and earnings from offshore entities have an impact. Our index target of 1,790 suggests 14% upside to the market over the next 12 months, pegging the market at 15.5x PER 2012, which is one standard deviation above post-2002 earnings. We do not think this is demanding for a market that is delivering on positive structural changes, offering superior growth in 2011 and greater exposure to the ASEAN growth footprint. Malaysia is enjoying strong inflows into the equity market (ADTV YTD at US$830m vs. US$480m in 2H2010), foreign shareholding is climbing (22% as of December 2010) and by June, FTSE should upgrade Malaysia from “Secondary Emerging” to “Advanced Emerging”, which should drive passive inflows (c. US$392m) and positive sentiment. For exposure to Malaysia’s growth themes, we like CIMB, Petronas Chemicals, KLK, AMMB, IJM Corp, AirAsia and SP Setia.
18 January 2011 Strategy Asia Equities Daily Focus
Deutsche Bank AG/Hong Kong Page 5
Asia Taiwan Technology Semiconductor & Semiconductor Equipment
17 January 2011
Siliconware Precision Reuters: 2325.TW Bloomberg: 2325 TT Exchange: TAI Ticker: 2325
Structural turnaround in sight; upgrading to Buy Michael Chou Research Analyst (+886) 2 2192 2836 [email protected]
Tommy Kuo Research Assistant (+886) 2 2192 2823 [email protected]
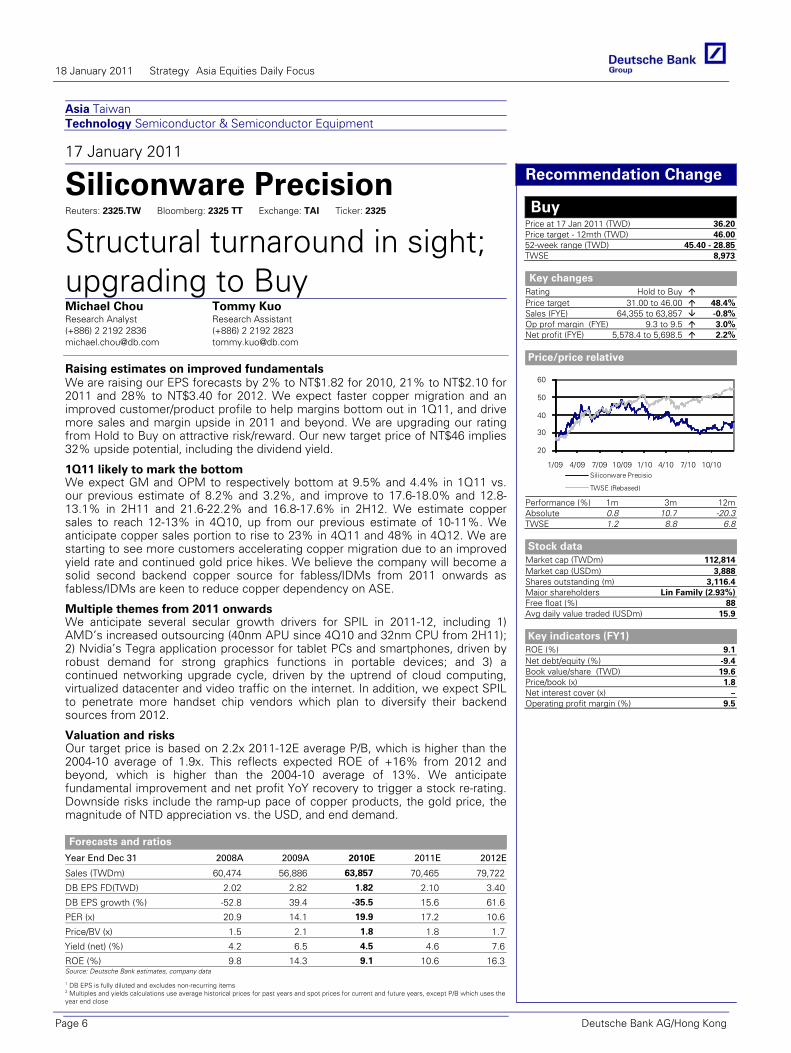
Raising estimates on improved fundamentals We are raising our EPS forecasts by 2% to NT$1.82 for 2010, 21% to NT$2.10 for 2011 and 28% to NT$3.40 for 2012. We expect faster copper migration and an improved customer/product profile to help margins bottom out in 1Q11, and drive more sales and margin upside in 2011 and beyond. We are upgrading our rating from Hold to Buy on attractive risk/reward. Our new target price of NT$46 implies 32% upside potential, including the dividend yield.
Forecasts and ratios
Year End Dec 31 2008A 2009A 2010E 2011E 2012E
Sales (TWDm) 60,474 56,886 63,857 70,465 79,722
DB EPS FD(TWD) 2.02 2.82 1.82 2.10 3.40
DB EPS growth (%) -52.8 39.4 -35.5 15.6 61.6
PER (x) 20.9 14.1 19.9 17.2 10.6
Price/BV (x) 1.5 2.1 1.8 1.8 1.7
Yield (net) (%) 4.2 6.5 4.5 4.6 7.6
ROE (%) 9.8 14.3 9.1 10.6 16.3Source: Deutsche Bank estimates, company data
1 DB EPS is fully diluted and excludes non-recurring items 2 Multiples and yields calculations use average historical prices for past years and spot prices for current and future years, except P/B which uses the year end close
Deutsche Bank AG/Hong Kong
Recommendation Change
Buy Price at 17 Jan 2011 (TWD) 36.20Price target - 12mth (TWD) 46.0052-week range (TWD) 45.40 - 28.85TWSE 8,973
Key changes
Rating Hold to Buy Price target 31.00 to 46.00 48.4%Sales (FYE) 64,355 to 63,857 -0.8%Op prof margin (FYE) 9.3 to 9.5 3.0%Net profit (FYE) 5,578.4 to 5,698.5 2.2%
Price/price relative
20
30
40
50
60
1/09 4/09 7/09 10/09 1/10 4/10 7/10 10/10Siliconware Precisio
TWSE (Rebased)
Performance (%) 1m 3m 12mAbsolute 0.8 10.7 -20.3TWSE 1.2 8.8 6.8
Stock data
Market cap (TWDm) 112,814Market cap (USDm) 3,888Shares outstanding (m) 3,116.4Major shareholders Lin Family (2.93%)Free float (%) 88Avg daily value traded (USDm) 15.9
Key indicators (FY1)
ROE (%) 9.1Net debt/equity (%) -9.4Book value/share (TWD) 19.6Price/book (x) 1.8Net interest cover (x) –Operating profit margin (%) 9.5
1Q11 likely to mark the bottom We expect GM and OPM to respectively bottom at 9.5% and 4.4% in 1Q11 vs. our previous estimate of 8.2% and 3.2%, and improve to 17.6-18.0% and 12.8-13.1% in 2H11 and 21.6-22.2% and 16.8-17.6% in 2H12. We estimate copper sales to reach 12-13% in 4Q10, up from our previous estimate of 10-11%. We anticipate copper sales portion to rise to 23% in 4Q11 and 48% in 4Q12. We are starting to see more customers accelerating copper migration due to an improved yield rate and continued gold price hikes. We believe the company will become a solid second backend copper source for fabless/IDMs from 2011 onwards as fabless/IDMs are keen to reduce copper dependency on ASE.
Multiple themes from 2011 onwards We anticipate several secular growth drivers for SPIL in 2011-12, including 1) AMD’s increased outsourcing (40nm APU since 4Q10 and 32nm CPU from 2H11); 2) Nvidia’s Tegra application processor for tablet PCs and smartphones, driven by robust demand for strong graphics functions in portable devices; and 3) a continued networking upgrade cycle, driven by the uptrend of cloud computing, virtualized datacenter and video traffic on the internet. In addition, we expect SPIL to penetrate more handset chip vendors which plan to diversify their backend sources from 2012.
Valuation and risks Our target price is based on 2.2x 2011-12E average P/B, which is higher than the 2004-10 average of 1.9x. This reflects expected ROE of +16% from 2012 and beyond, which is higher than the 2004-10 average of 13%. We anticipate fundamental improvement and net profit YoY recovery to trigger a stock re-rating. Downside risks include the ramp-up pace of copper products, the gold price, the magnitude of NTD appreciation vs. the USD, and end demand.
18 January 2011 Strategy Asia Equities Daily Focus
Page 6 Deutsche Bank AG/Hong Kong
Asia Korea, Republic of Consumer Retail/Wholesale Trade
17 January 2011
Shinsegae Reuters: 004170.KS Bloomberg: 004170 KS Exchange: KSC Ticker: 004170
No excitement expected; downgrading to HoldJihyun Song Research Analyst (+82) 2 316 8906 [email protected]
Jeremy Kim Research Associate (+82) 2 316 8902 [email protected]
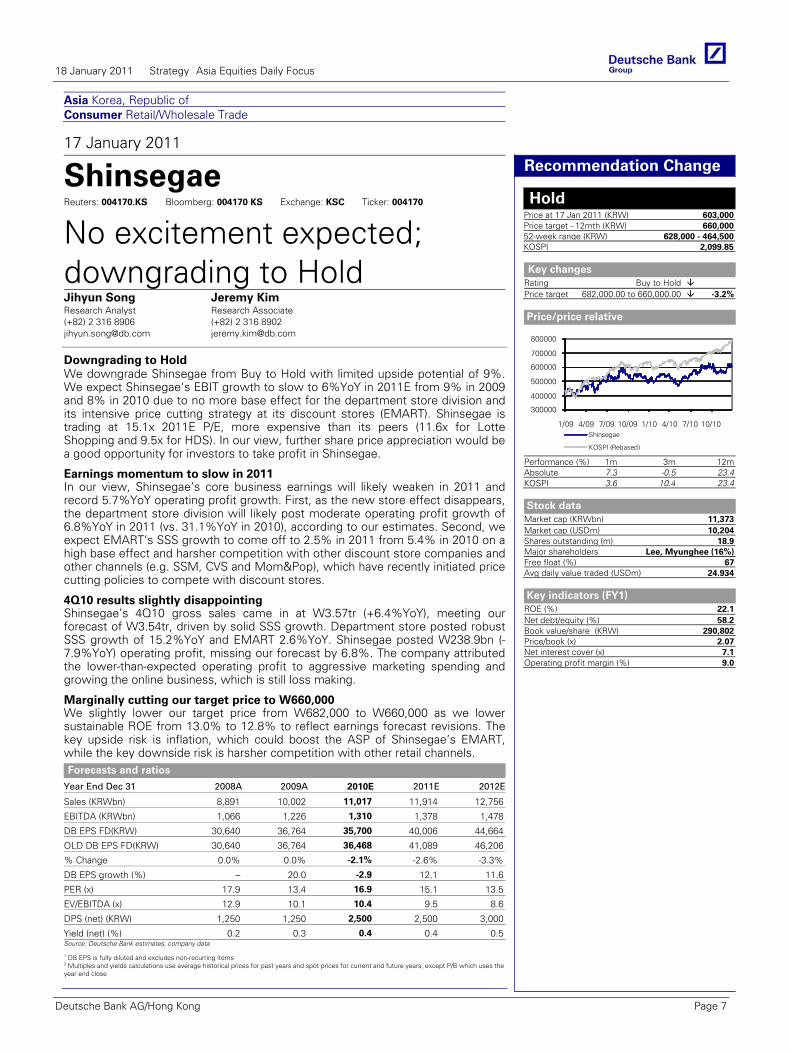
Downgrading to Hold We downgrade Shinsegae from Buy to Hold with limited upside potential of 9%. We expect Shinsegae's EBIT growth to slow to 6%YoY in 2011E from 9% in 2009 and 8% in 2010 due to no more base effect for the department store division and its intensive price cutting strategy at its discount stores (EMART). Shinsegae is trading at 15.1x 2011E P/E, more expensive than its peers (11.6x for Lotte Shopping and 9.5x for HDS). In our view, further share price appreciation would be a good opportunity for investors to take profit in Shinsegae.
Forecasts and ratios
Year End Dec 31 2008A 2009A 2010E 2011E 2012E
Sales (KRWbn) 8,891 10,002 11,017 11,914 12,756
EBITDA (KRWbn) 1,066 1,226 1,310 1,378 1,478
DB EPS FD(KRW) 30,640 36,764 35,700 40,006 44,664
OLD DB EPS FD(KRW) 30,640 36,764 36,468 41,089 46,206
% Change 0.0% 0.0% -2.1% -2.6% -3.3%
DB EPS growth (%) – 20.0 -2.9 12.1 11.6
PER (x) 17.9 13.4 16.9 15.1 13.5
EV/EBITDA (x) 12.9 10.1 10.4 9.5 8.6
DPS (net) (KRW) 1,250 1,250 2,500 2,500 3,000
Yield (net) (%) 0.2 0.3 0.4 0.4 0.5Source: Deutsche Bank estimates, company data
1 DB EPS is fully diluted and excludes non-recurring items 2 Multiples and yields calculations use average historical prices for past years and spot prices for current and future years, except P/B which uses the year end close
Deutsche Bank AG/Hong Kong
Recommendation Change
Hold Price at 17 Jan 2011 (KRW) 603,000Price target - 12mth (KRW) 660,00052-week range (KRW) 628,000 - 464,500KOSPI 2,099.85
Key changes
Rating Buy to Hold Price target 682,000.00 to 660,000.00 -3.2%
Price/price relative
300000
400000
500000
600000
700000
800000
1/09 4/09 7/09 10/09 1/10 4/10 7/10 10/10Shinsegae
KOSPI (Rebased)
Performance (%) 1m 3m 12mAbsolute 7.3 -0.5 23.4KOSPI 3.6 10.4 23.4
Stock data
Market cap (KRWbn) 11,373Market cap (USDm) 10,204Shares outstanding (m) 18.9Major shareholders Lee, Myunghee (16%)Free float (%) 67Avg daily value traded (USDm) 24.934
Key indicators (FY1)
ROE (%) 22.1Net debt/equity (%) 58.2Book value/share (KRW) 290,802Price/book (x) 2.07Net interest cover (x) 7.1Operating profit margin (%) 9.0
Co
mp
any
Glo
bal
Mar
kets
Res
earc
h
Earnings momentum to slow in 2011 In our view, Shinsegae’s core business earnings will likely weaken in 2011 and record 5.7%YoY operating profit growth. First, as the new store effect disappears, the department store division will likely post moderate operating profit growth of 6.8%YoY in 2011 (vs. 31.1%YoY in 2010), according to our estimates. Second, we expect EMART’s SSS growth to come off to 2.5% in 2011 from 5.4% in 2010 on a high base effect and harsher competition with other discount store companies and other channels (e.g. SSM, CVS and Mom&Pop), which have recently initiated price cutting policies to compete with discount stores.
4Q10 results slightly disappointing Shinsegae’s 4Q10 gross sales came in at W3.57tr (+6.4%YoY), meeting our forecast of W3.54tr, driven by solid SSS growth. Department store posted robust SSS growth of 15.2%YoY and EMART 2.6%YoY. Shinsegae posted W238.9bn (-7.9%YoY) operating profit, missing our forecast by 6.8%. The company attributed the lower-than-expected operating profit to aggressive marketing spending and growing the online business, which is still loss making.
Marginally cutting our target price to W660,000 We slightly lower our target price from W682,000 to W660,000 as we lower sustainable ROE from 13.0% to 12.8% to reflect earnings forecast revisions. The key upside risk is inflation, which could boost the ASP of Shinsegae’s EMART, while the key downside risk is harsher competition with other retail channels.
18 January 2011 Strategy Asia Equities Daily Focus
Deutsche Bank AG/Hong Kong Page 7
Asia ASEAN Malaysia Banking/Finance Exchanges
17 January 2011
Bursa Malaysia Reuters: BMYS.KL Bloomberg: BURSA MK Exchange: KLS Ticker: BMYS
Turnover rebound; upgrade to Hold Andrew Hill, CFA Research Analyst (+65) 6423 8507 [email protected]
Su-Yin Teoh Strategist (+60) 3 2053 6770 [email protected]
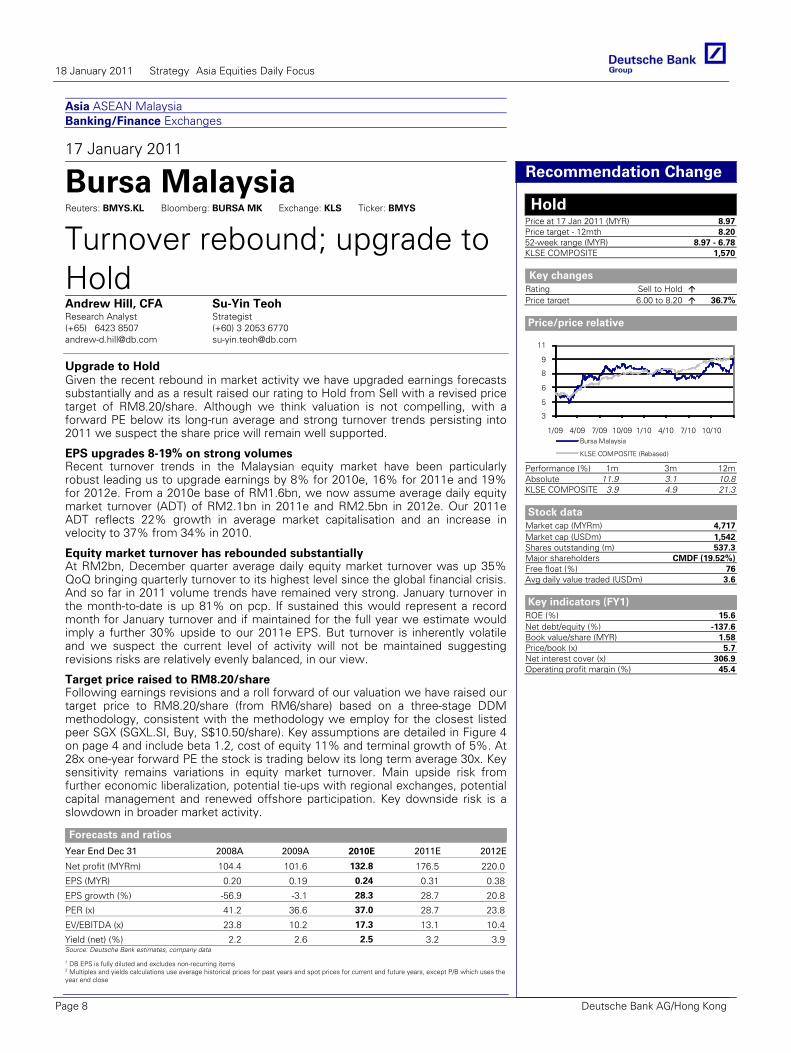
Upgrade to Hold Given the recent rebound in market activity we have upgraded earnings forecasts substantially and as a result raised our rating to Hold from Sell with a revised price target of RM8.20/share. Although we think valuation is not compelling, with a forward PE below its long-run average and strong turnover trends persisting into 2011 we suspect the share price will remain well supported.
Forecasts and ratios
Year End Dec 31 2008A 2009A 2010E 2011E 2012E
Net profit (MYRm) 104.4 101.6 132.8 176.5 220.0
EPS (MYR) 0.20 0.19 0.24 0.31 0.38
EPS growth (%) -56.9 -3.1 28.3 28.7 20.8
PER (x) 41.2 36.6 37.0 28.7 23.8
EV/EBITDA (x) 23.8 10.2 17.3 13.1 10.4
Yield (net) (%) 2.2 2.6 2.5 3.2 3.9Source: Deutsche Bank estimates, company data
1 DB EPS is fully diluted and excludes non-recurring items 2 Multiples and yields calculations use average historical prices for past years and spot prices for current and future years, except P/B which uses the year end close
Deutsche Bank AG/Hong Kong
Recommendation Change
Hold Price at 17 Jan 2011 (MYR) 8.97Price target - 12mth 8.2052-week range (MYR) 8.97 - 6.78KLSE COMPOSITE 1,570
Key changes
Rating Sell to Hold Price target 6.00 to 8.20 36.7%
Price/price relative
3
5
6
8
9
11
1/09 4/09 7/09 10/09 1/10 4/10 7/10 10/10Bursa Malaysia
KLSE COMPOSITE (Rebased)
Performance (%) 1m 3m 12mAbsolute 11.9 3.1 10.8KLSE COMPOSITE 3.9 4.9 21.3
Stock data
Market cap (MYRm) 4,717Market cap (USDm) 1,542Shares outstanding (m) 537.3Major shareholders CMDF (19.52%)Free float (%) 76Avg daily value traded (USDm) 3.6
Key indicators (FY1)
ROE (%) 15.6Net debt/equity (%) -137.6Book value/share (MYR) 1.58Price/book (x) 5.7Net interest cover (x) 306.9Operating profit margin (%) 45.4
Glo
bal
Mar
kets
Res
earc
h
EPS upgrades 8-19% on strong volumes Recent turnover trends in the Malaysian equity market have been particularly robust leading us to upgrade earnings by 8% for 2010e, 16% for 2011e and 19% for 2012e. From a 2010e base of RM1.6bn, we now assume average daily equity market turnover (ADT) of RM2.1bn in 2011e and RM2.5bn in 2012e. Our 2011e ADT reflects 22% growth in average market capitalisation and an increase in velocity to 37% from 34% in 2010.
Equity market turnover has rebounded substantially At RM2bn, December quarter average daily equity market turnover was up 35% QoQ bringing quarterly turnover to its highest level since the global financial crisis. And so far in 2011 volume trends have remained very strong. January turnover in the month-to-date is up 81% on pcp. If sustained this would represent a record month for January turnover and if maintained for the full year we estimate would imply a further 30% upside to our 2011e EPS. But turnover is inherently volatile and we suspect the current level of activity will not be maintained suggesting revisions risks are relatively evenly balanced, in our view.
Target price raised to RM8.20/share Following earnings revisions and a roll forward of our valuation we have raised our target price to RM8.20/share (from RM6/share) based on a three-stage DDM methodology, consistent with the methodology we employ for the closest listed peer SGX (SGXL.SI, Buy, S$10.50/share). Key assumptions are detailed in Figure 4 on page 4 and include beta 1.2, cost of equity 11% and terminal growth of 5%. At 28x one-year forward PE the stock is trading below its long term average 30x. Key sensitivity remains variations in equity market turnover. Main upside risk from further economic liberalization, potential tie-ups with regional exchanges, potential capital management and renewed offshore participation. Key downside risk is a slowdown in broader market activity.
18 January 2011 Strategy Asia Equities Daily Focus
Page 8 Deutsche Bank AG/Hong Kong
Asia China Consumer
16 January 2011
Hengan Intl. Reuters: 1044.HK Bloomberg: 1044 HK Exchange: HKG Ticker: 1044
Near-term hiccups; long term staying positive; maintain BuyMabel Wong, CFA Research Analyst (+852) 2203 6178 [email protected]
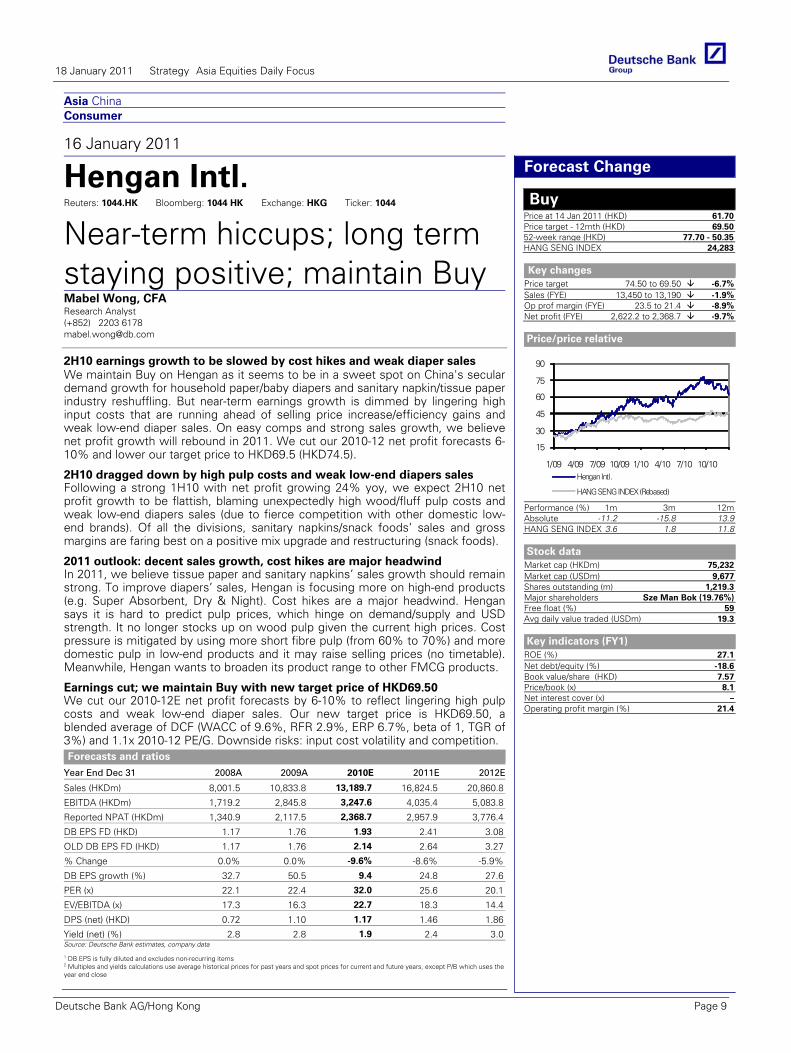
2H10 earnings growth to be slowed by cost hikes and weak diaper sales We maintain Buy on Hengan as it seems to be in a sweet spot on China's secular demand growth for household paper/baby diapers and sanitary napkin/tissue paper industry reshuffling. But near-term earnings growth is dimmed by lingering high input costs that are running ahead of selling price increase/efficiency gains and weak low-end diaper sales. On easy comps and strong sales growth, we believe net profit growth will rebound in 2011. We cut our 2010-12 net profit forecasts 6-10% and lower our target price to HKD69.5 (HKD74.5).
Forecasts and ratios
Year End Dec 31 2008A 2009A 2010E 2011E 2012E
Sales (HKDm) 8,001.5 10,833.8 13,189.7 16,824.5 20,860.8
EBITDA (HKDm) 1,719.2 2,845.8 3,247.6 4,035.4 5,083.8
Reported NPAT (HKDm) 1,340.9 2,117.5 2,368.7 2,957.9 3,776.4
DB EPS FD (HKD) 1.17 1.76 1.93 2.41 3.08
OLD DB EPS FD (HKD) 1.17 1.76 2.14 2.64 3.27
% Change 0.0% 0.0% -9.6% -8.6% -5.9%
DB EPS growth (%) 32.7 50.5 9.4 24.8 27.6
PER (x) 22.1 22.4 32.0 25.6 20.1
EV/EBITDA (x) 17.3 16.3 22.7 18.3 14.4
DPS (net) (HKD) 0.72 1.10 1.17 1.46 1.86
Yield (net) (%) 2.8 2.8 1.9 2.4 3.0Source: Deutsche Bank estimates, company data
1 DB EPS is fully diluted and excludes non-recurring items 2 Multiples and yields calculations use average historical prices for past years and spot prices for current and future years, except P/B which uses the year end close
Deutsche Bank AG/Hong Kong
Forecast Change
Buy Price at 14 Jan 2011 (HKD) 61.70Price target - 12mth (HKD) 69.5052-week range (HKD) 77.70 - 50.35HANG SENG INDEX 24,283
Key changes
Price target 74.50 to 69.50 -6.7%Sales (FYE) 13,450 to 13,190 -1.9%Op prof margin (FYE) 23.5 to 21.4 -8.9%Net profit (FYE) 2,622.2 to 2,368.7 -9.7%
Price/price relative
15
30
45
60
75
90
1/09 4/09 7/09 10/09 1/10 4/10 7/10 10/10Hengan Intl.
HANG SENG INDEX (Rebased)
Performance (%) 1m 3m 12mAbsolute -11.2 -15.8 13.9HANG SENG INDEX 3.6 1.8 11.8
Stock data
Market cap (HKDm) 75,232Market cap (USDm) 9,677Shares outstanding (m) 1,219.3Major shareholders Sze Man Bok (19.76%)Free float (%) 59Avg daily value traded (USDm) 19.3
Key indicators (FY1)
ROE (%) 27.1Net debt/equity (%) -18.6Book value/share (HKD) 7.57Price/book (x) 8.1Net interest cover (x) –Operating profit margin (%) 21.4
2H10 dragged down by high pulp costs and weak low-end diapers sales Following a strong 1H10 with net profit growing 24% yoy, we expect 2H10 net profit growth to be flattish, blaming unexpectedly high wood/fluff pulp costs and weak low-end diapers sales (due to fierce competition with other domestic low-end brands). Of all the divisions, sanitary napkins/snack foods’ sales and gross margins are faring best on a positive mix upgrade and restructuring (snack foods).
2011 outlook: decent sales growth, cost hikes are major headwind In 2011, we believe tissue paper and sanitary napkins’ sales growth should remain strong. To improve diapers’ sales, Hengan is focusing more on high-end products (e.g. Super Absorbent, Dry & Night). Cost hikes are a major headwind. Hengan says it is hard to predict pulp prices, which hinge on demand/supply and USD strength. It no longer stocks up on wood pulp given the current high prices. Cost pressure is mitigated by using more short fibre pulp (from 60% to 70%) and more domestic pulp in low-end products and it may raise selling prices (no timetable). Meanwhile, Hengan wants to broaden its product range to other FMCG products.
Earnings cut; we maintain Buy with new target price of HKD69.50 We cut our 2010-12E net profit forecasts by 6-10% to reflect lingering high pulp costs and weak low-end diaper sales. Our new target price is HKD69.50, a blended average of DCF (WACC of 9.6%, RFR 2.9%, ERP 6.7%, beta of 1, TGR of 3%) and 1.1x 2010-12 PE/G. Downside risks: input cost volatility and competition.
18 January 2011 Strategy Asia Equities Daily Focus
Deutsche Bank AG/Hong Kong Page 9

Asia China Banking/Finance General Insurance
17 January 2011
PICC Reuters: 2328.HK Bloomberg: 2328 HK Exchange: HKG Ticker: 2328
Group restructuring is still a dilution risk Bob Leung Research Analyst (+852) 2203 6200 [email protected]
Rolling DCF model into 2011, raising target price to HK$8.10 without dilution We roll forward our normalized DCF valuation model for PICC to 2011 and raise our target price to HK$8.10 per share (assuming no capital-raising). We also raise our FY10E net profit by 11% due to faster-than-expected GWP growth of PICC’s motor insurance portfolio. Factoring in up to a 75bps rise in interest rates in 2011 and raising our premium growth target to 16%, we also raise our FY11E net profit by 32%.
Forecasts and ratios
Year End Dec 31 2008A 2009A 2010E 2011E 2012E
Net earned premiums 80,019.0 93,296.0 118,324.8 136,763.9 151,118.3
Underwriting income -2,605.0 -2,060.0 2,142.4 2,711.2 3,181.3
Net investment income 3,716.0 2,866.0 3,910.2 4,989.5 5,727.9
Net profit (CNYm) 47.0 1,640.0 4,433.2 5,318.1 6,229.5
DB EPS (CNY) 0.01 0.16 0.40 0.48 0.56
OLD DB EPS (CNY) 0.01 0.16 0.37 0.40 0.49
% Change 0.0% 0.0% 7.8% 20.4% 13.4%
DB EPS growth (%) – 1,535.7 148.6 20.0 17.1
PER (x) 508.7 28.6 22.9 19.1 16.3
Price/book (x) 2.1 3.2 3.9 3.2 2.7Source: Deutsche Bank estimates, company data
1 DB EPS is fully diluted and excludes non-recurring items 2 Multiples and yields calculations use average historical prices for past years and spot prices for current and future years, except P/B which uses the year end close
Deutsche Bank AG/Hong Kong
Forecast Change
Sell Price at 17 Jan 2011 (HKD) 10.76Price target - 12mth (HKD) 8.1052-week range (HKD) 12.24 - 6.57HANG SENG INDEX 24,157
Key changes
Price target 6.20 to 8.10 30.6%Net earned prem (FYE)109,452.7 to 118,324.8Underwriting inc (FYE) 1,892.7 to 2,142.4 13.2%Net profit (FYE) 4,111.6 to 4,433.2 7.8%
Price/price relative
2
46
8
10
12
14
1/09 4/09 7/09 10/09 1/10 4/10 7/10 10/10PICC
HANG SENG INDEX (Rebased)
Performance (%) 1m 3m 12mAbsolute 0.9 -9.3 36.9HANG SENG INDEX 6.3 1.7 11.6
Stock data
Market Cap (HKDm) 119,888Market Cap (USDm) 15,421Shares outstanding (m) 11,142.0Major shareholders PICC Holdings (72%)Free Float (%) 18Avg daily value traded (USDm) 23.0
Key indicators (FY1)
ROE (%) 18.5Growth in Net premiums (%) 26.8Loss ratio (%) 66.7Expense ratio (%) 31.5Combined ratio (%) 98.2
Glo
bal
Mar
kets
Res
earc
h
Priced in 18% growth in next five years with forever underwriting profits Our DCF valuation currently assumes a forever strong combine ratio at 97.5% –98% with average long-term investment yield at 4%. With an effective tax rate of approximately 22%, PICC’s current stock price at HK$10.76 implies a self-sustained (without capital injection) 18% premium growth for the next five years. This is clearly unrealistic, in our view, given PICC’s solvency will most likely drop towards 100% as at December 2010 with the group debt-to-net equity ratio already more than 35%.
Group restructuring is a dilution risk, not a capital solution Even in the event of PICC’s parent group finally restructuring and seeking eventual listing (which is a complex and difficult event), this would not provide a solution to PICC’s capital needs without significant dilution to earnings. We estimate that PICC would now need up to Rmb8-11bn fresh equity capital (keeping the debt-to-net equity ratio below 35%) to sustain growth above 12-15% over the next three years if it is to maintain a solvency margin of more than 150%.
Downside risk to our valuation PICC’s stock price still trades over 3.3x our revised FY11 P/B. With a high debt-to-equity ratio, further dilution looks likely. We are already assuming forever strong underwriting profitability, which is unlikely, with increasing natural disasters. We maintain Sell with a downside risk to our valuation, where capital-raising is highly likely in 2011 to support growth. Strong A-share performance is an upside risk.
18 January 2011 Strategy Asia Equities Daily Focus 18 January 2011 Strategy Asia Equities Daily Focus
Page 10 Deutsche Bank AG/Hong Kong
Asia India Banking/Finance Banks
17 January 2011
Axis Bank Reuters: AXBK.BO Bloomberg: AXSB IN Exchange: BSE Ticker: AXBK
Profitability intact on pricing power & liquidity managementDipankar Choudhury Research Analyst (+91) 22 6658 4212 [email protected]
Manish Shukla Research Analyst (+91) 22 6658 4211 [email protected]
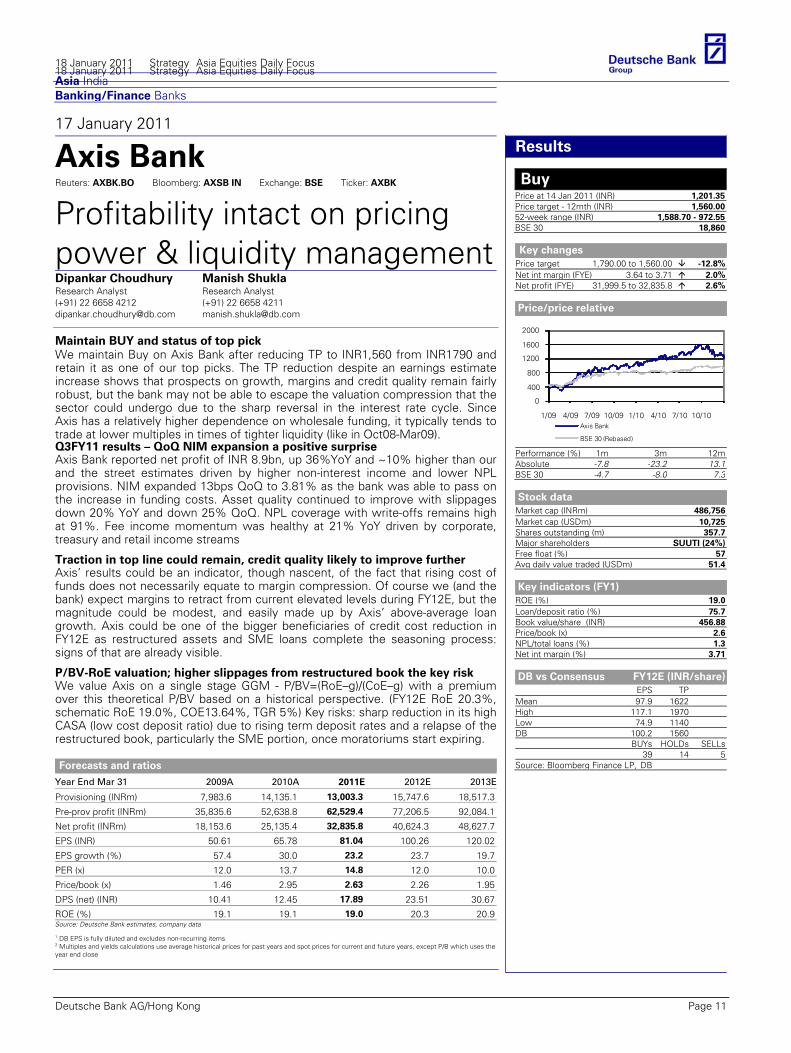
Maintain BUY and status of top pick We maintain Buy on Axis Bank after reducing TP to INR1,560 from INR1790 and retain it as one of our top picks. The TP reduction despite an earnings estimate increase shows that prospects on growth, margins and credit quality remain fairly robust, but the bank may not be able to escape the valuation compression that the sector could undergo due to the sharp reversal in the interest rate cycle. Since Axis has a relatively higher dependence on wholesale funding, it typically tends to trade at lower multiples in times of tighter liquidity (like in Oct08-Mar09).
Forecasts and ratios
Year End Mar 31 2009A 2010A 2011E 2012E 2013E
Provisioning (INRm) 7,983.6 14,135.1 13,003.3 15,747.6 18,517.3
Pre-prov profit (INRm) 35,835.6 52,638.8 62,529.4 77,206.5 92,084.1
Net profit (INRm) 18,153.6 25,135.4 32,835.8 40,624.3 48,627.7
EPS (INR) 50.61 65.78 81.04 100.26 120.02
EPS growth (%) 57.4 30.0 23.2 23.7 19.7
PER (x) 12.0 13.7 14.8 12.0 10.0
Price/book (x) 1.46 2.95 2.63 2.26 1.95
DPS (net) (INR) 10.41 12.45 17.89 23.51 30.67
ROE (%) 19.1 19.1 19.0 20.3 20.9Source: Deutsche Bank estimates, company data
1 DB EPS is fully diluted and excludes non-recurring items 2 Multiples and yields calculations use average historical prices for past years and spot prices for current and future years, except P/B which uses the year end close
Deutsche Bank AG/Hong Kong
Results
Buy Price at 14 Jan 2011 (INR) 1,201.35Price target - 12mth (INR) 1,560.0052-week range (INR) 1,588.70 - 972.55BSE 30 18,860
Key changes
Price target 1,790.00 to 1,560.00 -12.8%Net int margin (FYE) 3.64 to 3.71 2.0%Net profit (FYE) 31,999.5 to 32,835.8 2.6%
Price/price relative
0
400
800
1200
1600
2000
1/09 4/09 7/09 10/09 1/10 4/10 7/10 10/10Axis Bank
BSE 30 (Rebased)
Performance (%) 1m 3m 12mAbsolute -7.8 -23.2 13.1BSE 30 -4.7 -8.0 7.3
Stock data
Market cap (INRm) 486,756Market cap (USDm) 10,725Shares outstanding (m) 357.7Major shareholders SUUTI (24%)Free float (%) 57Avg daily value traded (USDm) 51.4
Key indicators (FY1)
ROE (%) 19.0Loan/deposit ratio (%) 75.7Book value/share (INR) 456.88Price/book (x) 2.6NPL/total loans (%) 1.3Net int margin (%) 3.71
DB vs Consensus FY12E (INR/share)
EPS TPMean 97.9 1622High 117.1 1970Low 74.9 1140DB 100.2 1560
BUYs HOLDs SELLs39 14 5
Source: Bloomberg Finance LP, DB
Co
mp
any
Q3FY11 results – QoQ NIM expansion a positive surprise Axis Bank reported net profit of INR 8.9bn, up 36%YoY and ~10% higher than our and the street estimates driven by higher non-interest income and lower NPL provisions. NIM expanded 13bps QoQ to 3.81% as the bank was able to pass on the increase in funding costs. Asset quality continued to improve with slippages down 20% YoY and down 25% QoQ. NPL coverage with write-offs remains high at 91%. Fee income momentum was healthy at 21% YoY driven by corporate, treasury and retail income streams
Traction in top line could remain, credit quality likely to improve further Axis’ results could be an indicator, though nascent, of the fact that rising cost of funds does not necessarily equate to margin compression. Of course we (and the bank) expect margins to retract from current elevated levels during FY12E, but the magnitude could be modest, and easily made up by Axis’ above-average loan growth. Axis could be one of the bigger beneficiaries of credit cost reduction in FY12E as restructured assets and SME loans complete the seasoning process: signs of that are already visible.
P/BV-RoE valuation; higher slippages from restructured book the key risk We value Axis on a single stage GGM - P/BV=(RoE–g)/(CoE–g) with a premium over this theoretical P/BV based on a historical perspective. (FY12E RoE 20.3%, schematic RoE 19.0%, COE13.64%, TGR 5%) Key risks: sharp reduction in its high CASA (low cost deposit ratio) due to rising term deposit rates and a relapse of the restructured book, particularly the SME portion, once moratoriums start expiring.
18 January 2011 Strategy Asia Equities Daily Focus 18 January 2011 Strategy Asia Equities Daily Focus
Deutsche Bank AG/Hong Kong Page 11
Asia India Health Care Health Care
16 January 2011
Glenmark Pharma Reuters: GLEN.BO Bloomberg: GNP IN Exchange: BSE Ticker: GLEN
Traction in US but slower recovery across marketsAbhay Shanbhag Research Analyst (+91) 22 6658 4035 [email protected]
Mayank Kankaria Research Associate (+91) 22 6658 4358 [email protected]
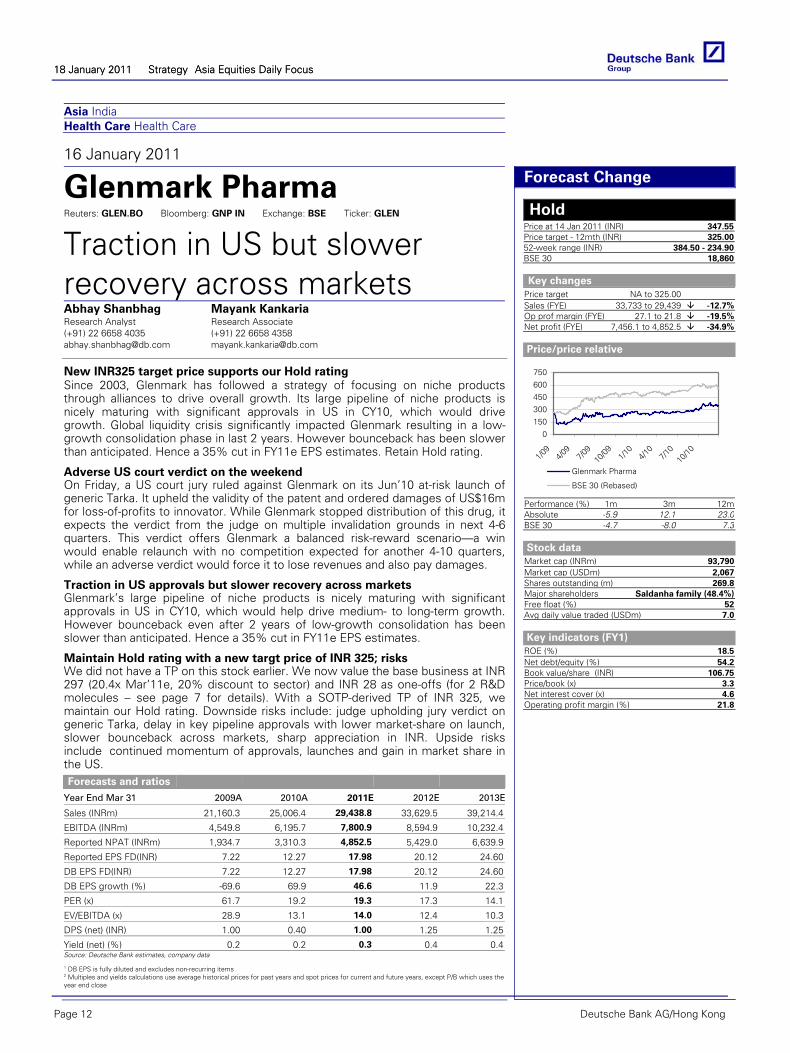
New INR325 target price supports our Hold rating Since 2003, Glenmark has followed a strategy of focusing on niche products through alliances to drive overall growth. Its large pipeline of niche products is nicely maturing with significant approvals in US in CY10, which would drive growth. Global liquidity crisis significantly impacted Glenmark resulting in a low-growth consolidation phase in last 2 years. However bounceback has been slower than anticipated. Hence a 35% cut in FY11e EPS estimates. Retain Hold rating.
Forecasts and ratios
Year End Mar 31 2009A 2010A 2011E 2012E 2013E
Sales (INRm) 21,160.3 25,006.4 29,438.8 33,629.5 39,214.4
EBITDA (INRm) 4,549.8 6,195.7 7,800.9 8,594.9 10,232.4
Reported NPAT (INRm) 1,934.7 3,310.3 4,852.5 5,429.0 6,639.9
Reported EPS FD(INR) 7.22 12.27 17.98 20.12 24.60
DB EPS FD(INR) 7.22 12.27 17.98 20.12 24.60
DB EPS growth (%) -69.6 69.9 46.6 11.9 22.3
PER (x) 61.7 19.2 19.3 17.3 14.1
EV/EBITDA (x) 28.9 13.1 14.0 12.4 10.3
DPS (net) (INR) 1.00 0.40 1.00 1.25 1.25
Yield (net) (%) 0.2 0.2 0.3 0.4 0.4Source: Deutsche Bank estimates, company data
1 DB EPS is fully diluted and excludes non-recurring items 2 Multiples and yields calculations use average historical prices for past years and spot prices for current and future years, except P/B which uses the year end close
Deutsche Bank AG/Hong Kong
Forecast Change
Hold Price at 14 Jan 2011 (INR) 347.55Price target - 12mth (INR) 325.0052-week range (INR) 384.50 - 234.90BSE 30 18,860
Key changes
Price target NA to 325.00 Sales (FYE) 33,733 to 29,439 -12.7%Op prof margin (FYE) 27.1 to 21.8 -19.5%Net profit (FYE) 7,456.1 to 4,852.5 -34.9%
Price/price relative
0
150
300450
600
750
1/09
4/09
7/09
10/09 1/1
04/1
07/1
010
/10
Glenmark Pharma
BSE 30 (Rebased)
Performance (%) 1m 3m 12mAbsolute -5.9 12.1 23.0BSE 30 -4.7 -8.0 7.3
Stock data
Market cap (INRm) 93,790Market cap (USDm) 2,067Shares outstanding (m) 269.8Major shareholders Saldanha family (48.4%)Free float (%) 52Avg daily value traded (USDm) 7.0
Key indicators (FY1)
ROE (%) 18.5Net debt/equity (%) 54.2Book value/share (INR) 106.75Price/book (x) 3.3Net interest cover (x) 4.6Operating profit margin (%) 21.8
Adverse US court verdict on the weekend On Friday, a US court jury ruled against Glenmark on its Jun’10 at-risk launch of generic Tarka. It upheld the validity of the patent and ordered damages of US$16m for loss-of-profits to innovator. While Glenmark stopped distribution of this drug, it expects the verdict from the judge on multiple invalidation grounds in next 4-6 quarters. This verdict offers Glenmark a balanced risk-reward scenario—a win would enable relaunch with no competition expected for another 4-10 quarters, while an adverse verdict would force it to lose revenues and also pay damages.
Traction in US approvals but slower recovery across markets Glenmark’s large pipeline of niche products is nicely maturing with significant approvals in US in CY10, which would help drive medium- to long-term growth. However bounceback even after 2 years of low-growth consolidation has been slower than anticipated. Hence a 35% cut in FY11e EPS estimates.
Maintain Hold rating with a new targt price of INR 325; risks We did not have a TP on this stock earlier. We now value the base business at INR 297 (20.4x Mar’11e, 20% discount to sector) and INR 28 as one-offs (for 2 R&D molecules – see page 7 for details). With a SOTP-derived TP of INR 325, we maintain our Hold rating. Downside risks include: judge upholding jury verdict on generic Tarka, delay in key pipeline approvals with lower market-share on launch, slower bounceback across markets, sharp appreciation in INR. Upside risks include �continued momentum of approvals, launches and gain in market share in the US.
18 January 2011 Strategy Asia Equities Daily Focus 18 January 2011 Strategy Asia Equities Daily Focus
Page 12 Deutsche Bank AG/Hong Kong
Asia India Resources Metals & Mining
17 January 2011
Steel Authority of India Reuters: SAIL.BO Bloomberg: SAIL IN Exchange: BSE Ticker: SAIL
Revising estimates down but remain positive Abhay Laijawala Research Analyst (+91) 22 6658 4205 [email protected]
Anuj Singla Research Analyst (+91) 22 6658 4172 [email protected]
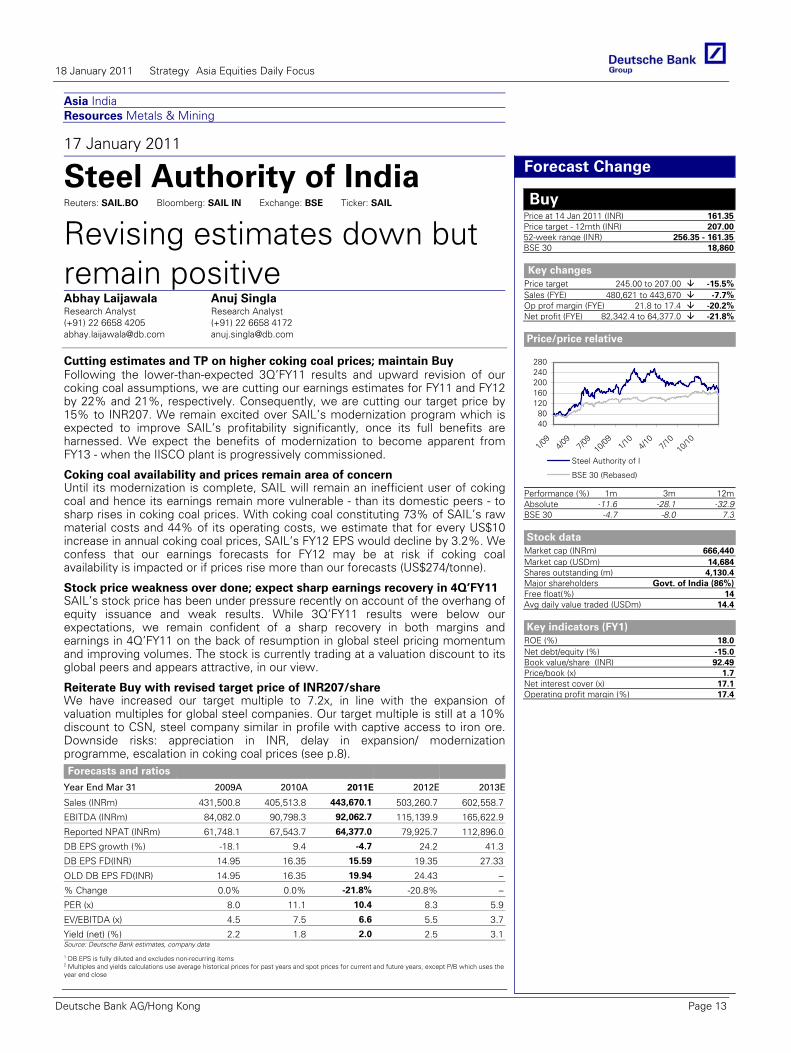
Cutting estimates and TP on higher coking coal prices; maintain Buy Following the lower-than-expected 3Q’FY11 results and upward revision of our coking coal assumptions, we are cutting our earnings estimates for FY11 and FY12 by 22% and 21%, respectively. Consequently, we are cutting our target price by 15% to INR207. We remain excited over SAIL’s modernization program which is expected to improve SAIL’s profitability significantly, once its full benefits are harnessed. We expect the benefits of modernization to become apparent from FY13 - when the IISCO plant is progressively commissioned.
Forecasts and ratios
Year End Mar 31 2009A 2010A 2011E 2012E 2013E
Sales (INRm) 431,500.8 405,513.8 443,670.1 503,260.7 602,558.7
EBITDA (INRm) 84,082.0 90,798.3 92,062.7 115,139.9 165,622.9
Reported NPAT (INRm) 61,748.1 67,543.7 64,377.0 79,925.7 112,896.0
DB EPS growth (%) -18.1 9.4 -4.7 24.2 41.3
DB EPS FD(INR) 14.95 16.35 15.59 19.35 27.33
OLD DB EPS FD(INR) 14.95 16.35 19.94 24.43 –
% Change 0.0% 0.0% -21.8% -20.8% –
PER (x) 8.0 11.1 10.4 8.3 5.9
EV/EBITDA (x) 4.5 7.5 6.6 5.5 3.7
Yield (net) (%) 2.2 1.8 2.0 2.5 3.1Source: Deutsche Bank estimates, company data
1 DB EPS is fully diluted and excludes non-recurring items 2 Multiples and yields calculations use average historical prices for past years and spot prices for current and future years, except P/B which uses the year end close
Deutsche Bank AG/Hong Kong
Forecast Change
Buy Price at 14 Jan 2011 (INR) 161.35Price target - 12mth (INR) 207.0052-week range (INR) 256.35 - 161.35BSE 30 18,860
Key changes
Price target 245.00 to 207.00 -15.5%Sales (FYE) 480,621 to 443,670 -7.7%Op prof margin (FYE) 21.8 to 17.4 -20.2%Net profit (FYE) 82,342.4 to 64,377.0 -21.8%
Price/price relative
4080
120160200240280
1/09
4/09
7/09
10/09 1/1
04/1
07/1
010
/10
Steel Authority of I
BSE 30 (Rebased)
Performance (%) 1m 3m 12mAbsolute -11.6 -28.1 -32.9BSE 30 -4.7 -8.0 7.3
Stock data
Market cap (INRm) 666,440Market cap (USDm) 14,684Shares outstanding (m) 4,130.4Major shareholders Govt. of India (86%)Free float(%) 14Avg daily value traded (USDm) 14.4
Key indicators (FY1)
ROE (%) 18.0Net debt/equity (%) -15.0Book value/share (INR) 92.49Price/book (x) 1.7Net interest cover (x) 17.1Operating profit margin (%) 17.4
Coking coal availability and prices remain area of concern Until its modernization is complete, SAIL will remain an inefficient user of coking coal and hence its earnings remain more vulnerable - than its domestic peers - to sharp rises in coking coal prices. With coking coal constituting 73% of SAIL’s raw material costs and 44% of its operating costs, we estimate that for every US$10 increase in annual coking coal prices, SAIL’s FY12 EPS would decline by 3.2%. We confess that our earnings forecasts for FY12 may be at risk if coking coal availability is impacted or if prices rise more than our forecasts (US$274/tonne).
Stock price weakness over done; expect sharp earnings recovery in 4Q’FY11 SAIL’s stock price has been under pressure recently on account of the overhang of equity issuance and weak results. While 3Q’FY11 results were below our expectations, we remain confident of a sharp recovery in both margins and earnings in 4Q’FY11 on the back of resumption in global steel pricing momentum and improving volumes. The stock is currently trading at a valuation discount to its global peers and appears attractive, in our view.
Reiterate Buy with revised target price of INR207/share We have increased our target multiple to 7.2x, in line with the expansion of valuation multiples for global steel companies. Our target multiple is still at a 10% discount to CSN, steel company similar in profile with captive access to iron ore. Downside risks: appreciation in INR, delay in expansion/ modernization programme, escalation in coking coal prices (see p.8).
18 January 2011 Strategy Asia Equities Daily Focus
Deutsche Bank AG/Hong Kong Page 13
Asia
17 January 2011
Asia Economics Daily
China RRR hike; Singapore inflation and trade
Deutsche Bank AG/Hong Kong
Michael Spencer, Ph.D Chief Economist, Asia (+852) 2203 8303 [email protected]
Jun Ma, Ph.D Chief Economist, Greater China (+852) 2203 8308 [email protected]
Taimur Baig, Ph.D Chief Economist, India (+65) 6423 8681 [email protected]
Juliana Lee Senior Economist (+852) 2203 8312 [email protected]
Kaushik Das Economist (+91) 22 6658 4909 [email protected]
Mac
ro
Glo
bal
Mar
kets
Res
earc
h
Eco
no
mic
s
HIGHLIGHTS
China - PBOC's first RRR hike in 2011; many more to come Singapore - Inflation may rise to 5% in the near term; non-oil domestic exports rise 8.9%mom (sa) in December, above
expectation UPCOMING RELEASES
Hong Kong – Unemployment rate (Dec). DB forecast 4.0% (4.1% in Nov)
NEWS IN BRIEF
CHINA Monetary policy. The PBOC announced a 50bps RRR hike Friday evening. It will be effective from January 20. This is the first hike in 2011 but the fourth hike over the past three months. This RRR increase will raise the RRR for large banks to 19% and will drain liquidity of approximately RMB350bn from the market.
This action is justified by the large amount of OMO redemption in January, limited issuance of PBOC bills (as 1-yr bill yield is now at 2.7% vs interest on RRR at 1.62%), as well as the continued trade surplus and net capital inflows. It also make sense given that M2 and loan growth reached nearly 20% last year, vs the original M2 growth target of 17%. We expect the PBOC to raise the RRR by 3-4 more times in the first half of this year.
The PBOC is also planning to introduce a "dynamic and differentiated RRR program" as part of its "counter-cyclical" macro prudential policy. While a number of technical details are still being discussed, its basic idea is to impose a higher RRR on banks with excessive loan growth and inadequate capital. While theoretically it makes sense, we think policy makers will need to more carefully assess the impact of such a program on market rate volatility, the predictability of the total RRR, as well as the potential over protection for large banks.
18 January 2011 Strategy Asia Equities Daily Focus
Page 14 Deutsche Bank AG/Hong Kong
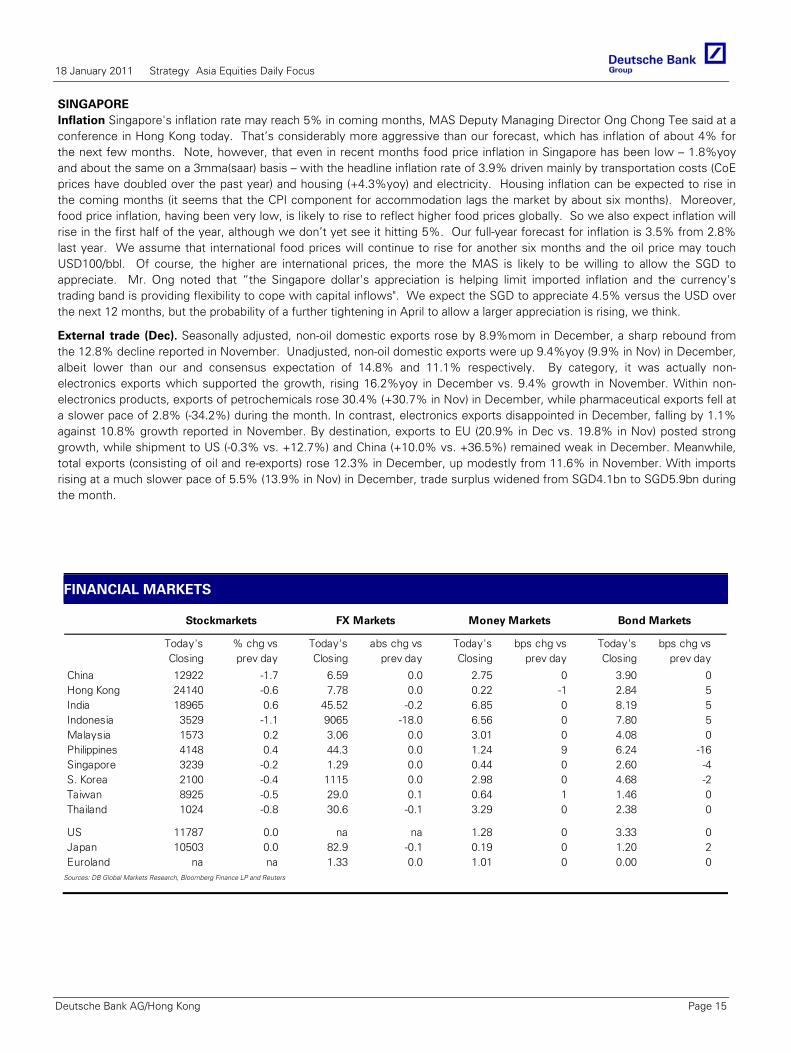
SINGAPORE Inflation Singapore's inflation rate may reach 5% in coming months, MAS Deputy Managing Director Ong Chong Tee said at a conference in Hong Kong today. That’s considerably more aggressive than our forecast, which has inflation of about 4% for the next few months. Note, however, that even in recent months food price inflation in Singapore has been low – 1.8%yoy and about the same on a 3mma(saar) basis – with the headline inflation rate of 3.9% driven mainly by transportation costs (CoE prices have doubled over the past year) and housing (+4.3%yoy) and electricity. Housing inflation can be expected to rise in the coming months (it seems that the CPI component for accommodation lags the market by about six months). Moreover, food price inflation, having been very low, is likely to rise to reflect higher food prices globally. So we also expect inflation will rise in the first half of the year, although we don’t yet see it hitting 5%. Our full-year forecast for inflation is 3.5% from 2.8% last year. We assume that international food prices will continue to rise for another six months and the oil price may touch USD100/bbl. Of course, the higher are international prices, the more the MAS is likely to be willing to allow the SGD to appreciate. Mr. Ong noted that “the Singapore dollar's appreciation is helping limit imported inflation and the currency's trading band is providing flexibility to cope with capital inflows". We expect the SGD to appreciate 4.5% versus the USD over the next 12 months, but the probability of a further tightening in April to allow a larger appreciation is rising, we think.
External trade (Dec). Seasonally adjusted, non-oil domestic exports rose by 8.9%mom in December, a sharp rebound from the 12.8% decline reported in November. Unadjusted, non-oil domestic exports were up 9.4%yoy (9.9% in Nov) in December, albeit lower than our and consensus expectation of 14.8% and 11.1% respectively. By category, it was actually non-electronics exports which supported the growth, rising 16.2%yoy in December vs. 9.4% growth in November. Within non-electronics products, exports of petrochemicals rose 30.4% (+30.7% in Nov) in December, while pharmaceutical exports fell at a slower pace of 2.8% (-34.2%) during the month. In contrast, electronics exports disappointed in December, falling by 1.1% against 10.8% growth reported in November. By destination, exports to EU (20.9% in Dec vs. 19.8% in Nov) posted strong growth, while shipment to US (-0.3% vs. +12.7%) and China (+10.0% vs. +36.5%) remained weak in December. Meanwhile, total exports (consisting of oil and re-exports) rose 12.3% in December, up modestly from 11.6% in November. With imports rising at a much slower pace of 5.5% (13.9% in Nov) in December, trade surplus widened from SGD4.1bn to SGD5.9bn during the month.
FINANCIAL MARKETS
Today's % chg vs Today's abs chg vs Today's bps chg vs Today's bps chg vsClosing prev day Closing prev day Closing prev day Closing prev day
China 12922 -1.7 6.59 0.0 2.75 0 3.90 0Hong Kong 24140 -0.6 7.78 0.0 0.22 -1 2.84 5India 18965 0.6 45.52 -0.2 6.85 0 8.19 5Indonesia 3529 -1.1 9065 -18.0 6.56 0 7.80 5Malaysia 1573 0.2 3.06 0.0 3.01 0 4.08 0Philippines 4148 0.4 44.3 0.0 1.24 9 6.24 -16Singapore 3239 -0.2 1.29 0.0 0.44 0 2.60 -4S. Korea 2100 -0.4 1115 0.0 2.98 0 4.68 -2Taiwan 8925 -0.5 29.0 0.1 0.64 1 1.46 0Thailand 1024 -0.8 30.6 -0.1 3.29 0 2.38 0
US 11787 0.0 na na 1.28 0 3.33 0Japan 10503 0.0 82.9 -0.1 0.19 0 1.20 2Euroland na na 1.33 0.0 1.01 0 0.00 0
Stockmarkets FX Markets Money Markets Bond Markets
Sources: DB Global Markets Research, Bloomberg Finance LP and Reuters
18 January 2011 Strategy Asia Equities Daily Focus
Deutsche Bank AG/Hong Kong Page 15
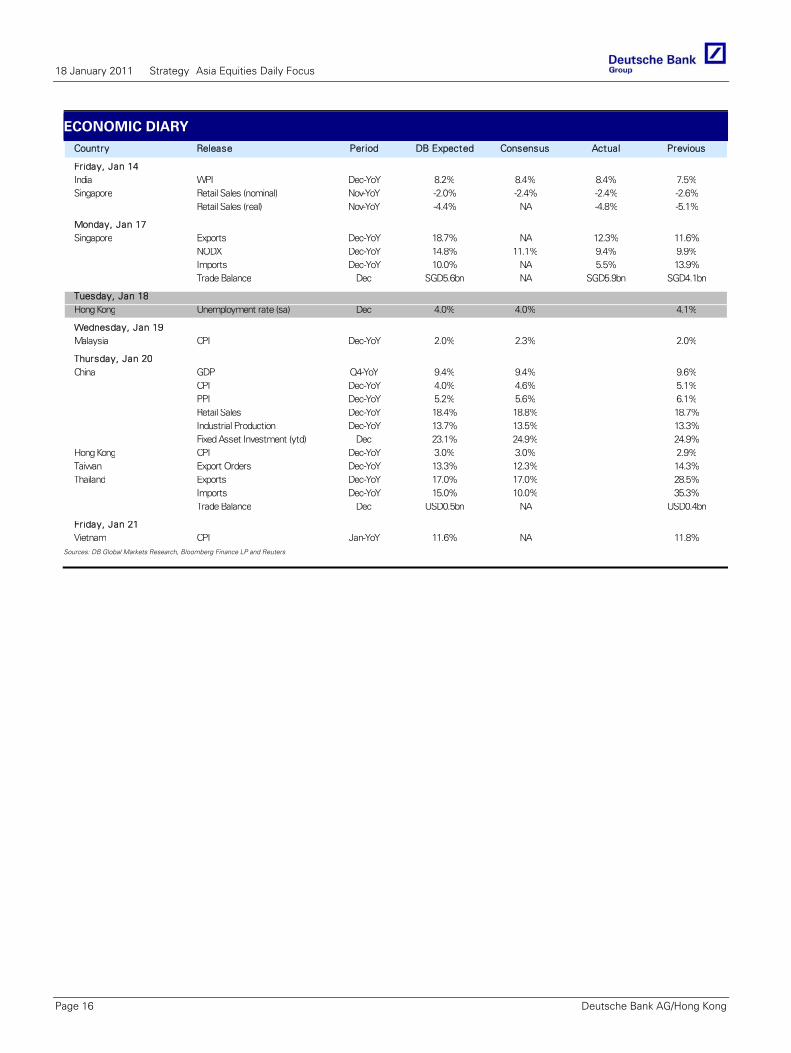
ECONOMIC DIARY Country Release Period DB Expected Consensus Actual Previous
Friday, Jan 14India WPI Dec-YoY 8.2% 8.4% 8.4% 7.5%Singapore Retail Sales (nominal) Nov-YoY -2.0% -2.4% -2.4% -2.6%
Retail Sales (real) Nov-YoY -4.4% NA -4.8% -5.1%
Monday, Jan 17Singapore Exports Dec-YoY 18.7% NA 12.3% 11.6%
NODX Dec-YoY 14.8% 11.1% 9.4% 9.9%Imports Dec-YoY 10.0% NA 5.5% 13.9%Trade Balance Dec SGD5.6bn NA SGD5.9bn SGD4.1bn
Tuesday, Jan 18Hong Kong Unemployment rate (sa) Dec 4.0% 4.0% 4.1%
Wednesday, Jan 19Malaysia CPI Dec-YoY 2.0% 2.3% 2.0%
Thursday, Jan 20China GDP Q4-YoY 9.4% 9.4% 9.6%
CPI Dec-YoY 4.0% 4.6% 5.1%PPI Dec-YoY 5.2% 5.6% 6.1%Retail Sales Dec-YoY 18.4% 18.8% 18.7%Industrial Production Dec-YoY 13.7% 13.5% 13.3%Fixed Asset Investment (ytd) Dec 23.1% 24.9% 24.9%
Hong Kong CPI Dec-YoY 3.0% 3.0% 2.9%Taiwan Export Orders Dec-YoY 13.3% 12.3% 14.3%Thailand Exports Dec-YoY 17.0% 17.0% 28.5%
Imports Dec-YoY 15.0% 10.0% 35.3%Trade Balance Dec USD0.5bn NA USD0.4bn
Friday, Jan 21Vietnam CPI Jan-YoY 11.6% NA 11.8%
Sources: DB Global Markets Research, Bloomberg Finance LP and Reuters
18 January 2011 Strategy Asia Equities Daily Focus
Page 16 Deutsche Bank AG/Hong Kong
Asia
17 January 2011
Asia Economics Monthly January
Economics
Table of Contents Asia economic and financial forecasts ............... Page 2Overview ............................................................ Page 3China................................................................... Page 8Hong Kong........................................................ Page 10India .................................................................. Page 12Indonesia .......................................................... Page 16Malaysia............................................................ Page 18Philippines ........................................................ Page 20Singapore ......................................................... Page 22South Korea ...................................................... Page 24Taiwan .............................................................. Page 28Thailand ............................................................ Page 30Interest rate and inflation charts....................... Page 32Asian economic indicators ............................... Page 36
Research Team
Michael Spencer, Ph.D Chief Economist, Asia (+852) 2203 8305 [email protected]
Jun Ma, Ph.D Chief Economist, Greater China (+852) 2203 8308 [email protected]
Taimur Baig, Ph.D Chief Economist, India (+65) 6423 8681 [email protected]
Juliana Lee Senior Economist (+852) 2203 8312 [email protected]
Kaushik Das Economist (+91) 22 6658-4909 [email protected]
Eco
no
mic
s
OVERVIEW: International food prices are rising as fast as they did in 2007/08 and most economies in Asia appear likely to import this inflation. However, we do not expect a vigorous policy response to higher inflation.
CHINA: PMI and export growth moderated in December but our growth outlook for 2011 remains on track. Property tax will be rolled out in Chongqing and Shanghai soon. Fiscal policy will support public housing and tax cuts for individuals and services.
HONG KONG: A moderation in export growth this year should bring slower overall growth. Inflation is rising due to external and local (property) factors. Retail sales boom shows no signs of abating and could drive growth higher than expected.
INDIA: November IP growth pulled down sharply due to holiday and base effect; but other indicators of growth remain strong. Inflation risks have accentuated, with food prices soaring once again. The rise in global crude oil prices has complicated the government’s petroleum subsidy policy.
INDONESIA: Real activities remain robust, suggesting a 6%+ growth outlook; inflation has picked up considerably.
MALAYSIA: Subsidies are being removed gradually, so inflation is muted in the near-term. The external growth impulse is much weaker than it was for most of 2010 and domestic demand growth could slow sharply.
PHILIPPINES: Economic growth would likely be robust, but inflation will gradually rise. Global food and fuel prices could surge, causing a sharp rise in inflation.
SINGAPORE: Growth rebounds in Q4, but YoY growth will fall sharply until Q2. Some upside risk perhaps to growth from exports but similarly upside risk to inflation.
SOUTH KOREA: Growth to slow, led by weaker investment and exports, although the latter likely to be stronger than expected, while private consumption remains relatively stable. Rising food and oil prices pose downside risks to growth.
TAIWAN: Export growth remains relatively stable, posing upside risks to Taiwan’s growth in Q4 and 2011, while rising (CPI and real estate price) inflation points to sustained rate hikes.
THAILAND: Better-than-expected domestic and international (US) data pose upside risks to our Q4 2010 and 2011 GDP growth forecast for Thailand.
18 January 2011 Strategy Asia Equities Daily Focus
Deutsche Bank AG/Hong Kong Page 17
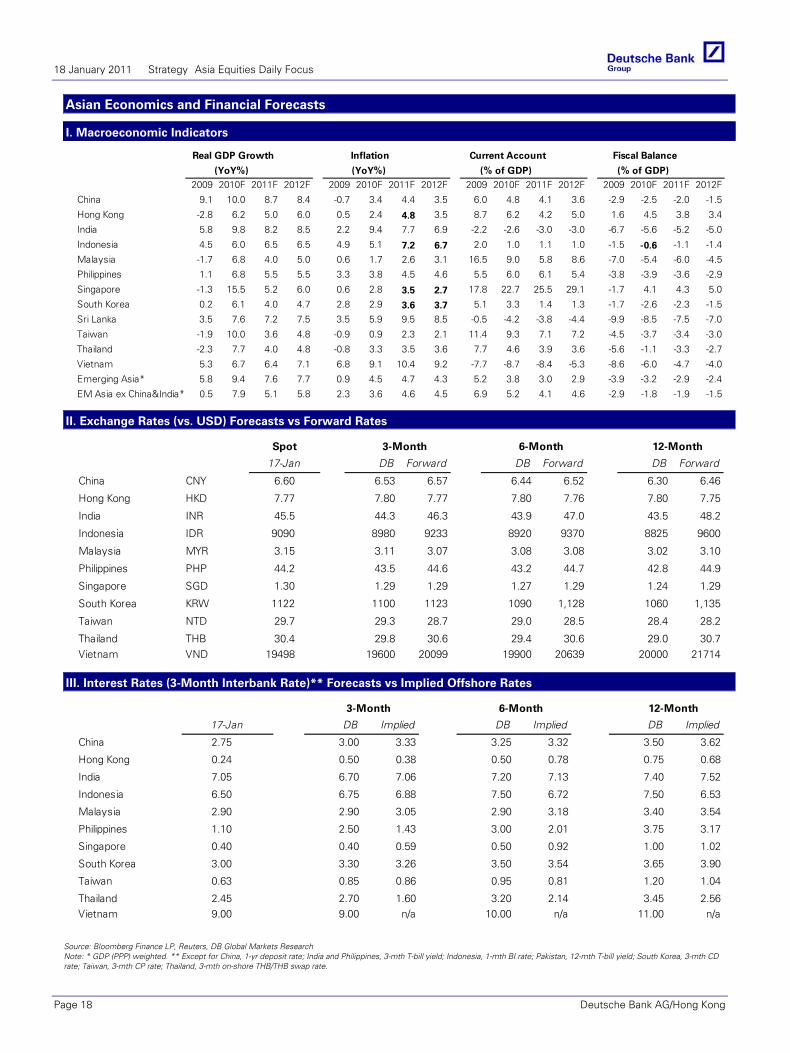
Asian Economics and Financial Forecasts
I. Macroeconomic Indicators
(YoY%) (YoY%) (% of GDP) (% of GDP)2009 2010F 2011F 2012F 2009 2010F 2011F 2012F 2009 2010F 2011F 2012F 2009 2010F 2011F 2012F
China 9.1 10.0 8.7 8.4 -0.7 3.4 4.4 3.5 6.0 4.8 4.1 3.6 -2.9 -2.5 -2.0 -1.5
Hong Kong -2.8 6.2 5.0 6.0 0.5 2.4 4.8 3.5 8.7 6.2 4.2 5.0 1.6 4.5 3.8 3.4
India 5.8 9.8 8.2 8.5 2.2 9.4 7.7 6.9 -2.2 -2.6 -3.0 -3.0 -6.7 -5.6 -5.2 -5.0
Indonesia 4.5 6.0 6.5 6.5 4.9 5.1 7.2 6.7 2.0 1.0 1.1 1.0 -1.5 -0.6 -1.1 -1.4
Malaysia -1.7 6.8 4.0 5.0 0.6 1.7 2.6 3.1 16.5 9.0 5.8 8.6 -7.0 -5.4 -6.0 -4.5
Philippines 1.1 6.8 5.5 5.5 3.3 3.8 4.5 4.6 5.5 6.0 6.1 5.4 -3.8 -3.9 -3.6 -2.9
Singapore -1.3 15.5 5.2 6.0 0.6 2.8 3.5 2.7 17.8 22.7 25.5 29.1 -1.7 4.1 4.3 5.0
South Korea 0.2 6.1 4.0 4.7 2.8 2.9 3.6 3.7 5.1 3.3 1.4 1.3 -1.7 -2.6 -2.3 -1.5
Sri Lanka 3.5 7.6 7.2 7.5 3.5 5.9 9.5 8.5 -0.5 -4.2 -3.8 -4.4 -9.9 -8.5 -7.5 -7.0
Taiwan -1.9 10.0 3.6 4.8 -0.9 0.9 2.3 2.1 11.4 9.3 7.1 7.2 -4.5 -3.7 -3.4 -3.0
Thailand -2.3 7.7 4.0 4.8 -0.8 3.3 3.5 3.6 7.7 4.6 3.9 3.6 -5.6 -1.1 -3.3 -2.7
Vietnam 5.3 6.7 6.4 7.1 6.8 9.1 10.4 9.2 -7.7 -8.7 -8.4 -5.3 -8.6 -6.0 -4.7 -4.0
Emerging Asia* 5.8 9.4 7.6 7.7 0.9 4.5 4.7 4.3 5.2 3.8 3.0 2.9 -3.9 -3.2 -2.9 -2.4
EM Asia ex China&India* 0.5 7.9 5.1 5.8 2.3 3.6 4.6 4.5 6.9 5.2 4.1 4.6 -2.9 -1.8 -1.9 -1.5
Real GDP Growth Inflation Current Account Fiscal Balance
II. Exchange Rates (vs. USD) Forecasts vs Forward Rates
DB Forward DB Forward DB Forward
China CNY 6.60 6.53 6.57 6.44 6.52 6.30 6.46
Hong Kong HKD 7.77 7.80 7.77 7.80 7.76 7.80 7.75
India INR 45.5 44.3 46.3 43.9 47.0 43.5 48.2
Indonesia IDR 9090 8980 9233 8920 9370 8825 9600
Malaysia MYR 3.15 3.11 3.07 3.08 3.08 3.02 3.10
Philippines PHP 44.2 43.5 44.6 43.2 44.7 42.8 44.9
Singapore SGD 1.30 1.29 1.29 1.27 1.29 1.24 1.29
South Korea KRW 1122 1100 1123 1090 1,128 1060 1,135
Taiwan NTD 29.7 29.3 28.7 29.0 28.5 28.4 28.2
Thailand THB 30.4 29.8 30.6 30.6 29.4 30.6 30.6 29.0 30.7 #Vietnam VND 19498 19600 20099 19900 20639 20000 21714
12-Month 6-Month 3-Month
17-Jan
Spot
III. Interest Rates (3-Month Interbank Rate)** Forecasts vs Implied Offshore Rates
DB Implied DB Implied DB Implied
China 2.75 3.00 3.33 3.25 3.32 3.50 3.62
Hong Kong 0.24 0.50 0.38 0.50 0.78 0.75 0.68
India 7.05 6.70 7.06 7.20 7.13 7.40 7.52
Indonesia 6.50 6.75 6.88 7.50 6.72 7.50 6.53
Malaysia 2.90 2.90 3.05 2.90 3.18 3.40 3.54
Philippines 1.10 2.50 1.43 3.00 2.01 3.75 3.17
Singapore 0.40 0.40 0.59 0.50 0.92 1.00 1.02
South Korea 3.00 3.30 3.26 3.50 3.54 3.65 3.90
Taiwan 0.63 0.85 0.86 0.95 0.81 1.20 1.04
Thailand 2.45 2.70 1.60 3.20 2.14 3.45 2.56Vietnam 9.00 9.00 n/a 10.00 n/a 11.00 n/a
17-Jan
3-Month 6-Month 12-Month
Source: Bloomberg Finance LP, Reuters, DB Global Markets Research Note: * GDP (PPP) weighted. ** Except for China, 1-yr deposit rate; India and Philippines, 3-mth T-bill yield; Indonesia, 1-mth BI rate; Pakistan, 12-mth T-bill yield; South Korea, 3-mth CD rate; Taiwan, 3-mth CP rate; Thailand, 3-mth on-shore THB/THB swap rate.
18 January 2011 Strategy Asia Equities Daily Focus
Page 18 Deutsche Bank AG/Hong Kong
Asia
17 January 2011
Asia Real Exchange Rates
November Indices
Economics
Research Team
Juliana Lee Senior Economist (852) 2203-8312 [email protected]
Eco
no
mic
s
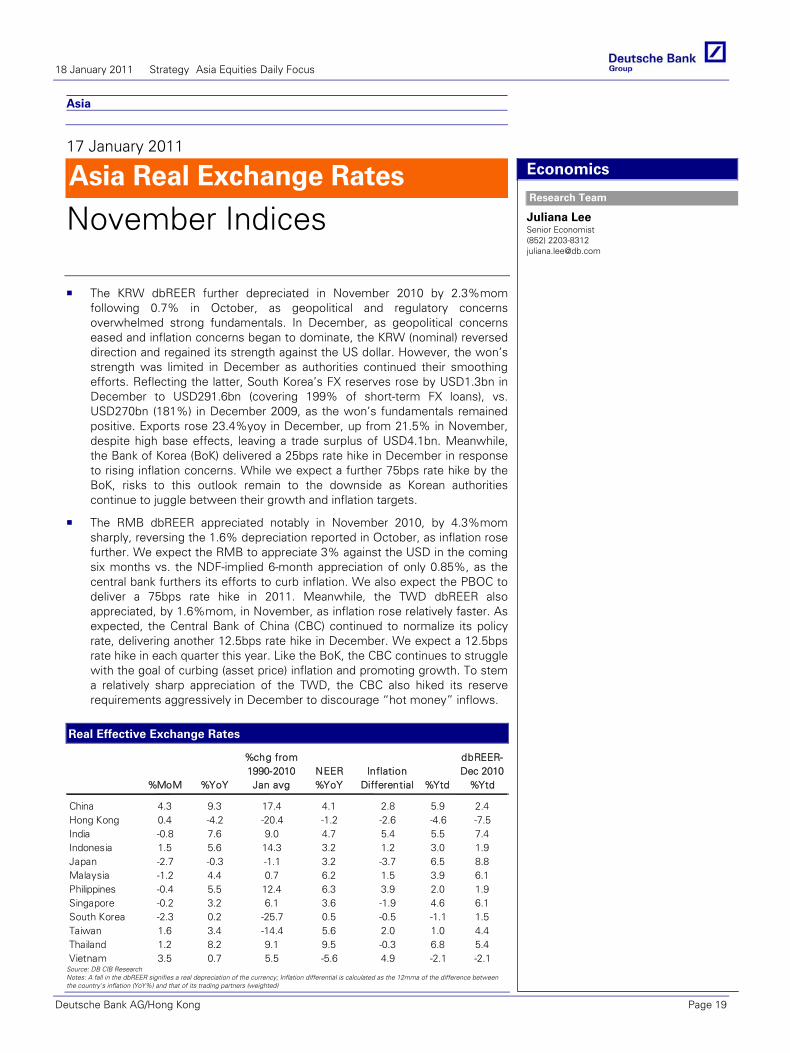
The KRW dbREER further depreciated in November 2010 by 2.3%mom following 0.7% in October, as geopolitical and regulatory concerns overwhelmed strong fundamentals. In December, as geopolitical concerns eased and inflation concerns began to dominate, the KRW (nominal) reversed direction and regained its strength against the US dollar. However, the won’s strength was limited in December as authorities continued their smoothing efforts. Reflecting the latter, South Korea’s FX reserves rose by USD1.3bn in December to USD291.6bn (covering 199% of short-term FX loans), vs. USD270bn (181%) in December 2009, as the won’s fundamentals remained positive. Exports rose 23.4%yoy in December, up from 21.5% in November, despite high base effects, leaving a trade surplus of USD4.1bn. Meanwhile, the Bank of Korea (BoK) delivered a 25bps rate hike in December in response to rising inflation concerns. While we expect a further 75bps rate hike by the BoK, risks to this outlook remain to the downside as Korean authorities continue to juggle between their growth and inflation targets.
The RMB dbREER appreciated notably in November 2010, by 4.3%mom sharply, reversing the 1.6% depreciation reported in October, as inflation rose further. We expect the RMB to appreciate 3% against the USD in the coming six months vs. the NDF-implied 6-month appreciation of only 0.85%, as the central bank furthers its efforts to curb inflation. We also expect the PBOC to deliver a 75bps rate hike in 2011. Meanwhile, the TWD dbREER also appreciated, by 1.6%mom, in November, as inflation rose relatively faster. As expected, the Central Bank of China (CBC) continued to normalize its policy rate, delivering another 12.5bps rate hike in December. We expect a 12.5bps rate hike in each quarter this year. Like the BoK, the CBC continues to struggle with the goal of curbing (asset price) inflation and promoting growth. To stem a relatively sharp appreciation of the TWD, the CBC also hiked its reserve requirements aggressively in December to discourage “hot money” inflows.
Real Effective Exchange Rates
%MoM %YoY
%chg from 1990-2010 Jan avg
NEER %YoY
Inflation Differential %Ytd
dbREER-Dec 2010
%Ytd
China 4.3 9.3 17.4 4.1 2.8 5.9 2.4Hong Kong 0.4 -4.2 -20.4 -1.2 -2.6 -4.6 -7.5India -0.8 7.6 9.0 4.7 5.4 5.5 7.4Indonesia 1.5 5.6 14.3 3.2 1.2 3.0 1.9Japan -2.7 -0.3 -1.1 3.2 -3.7 6.5 8.8Malaysia -1.2 4.4 0.7 6.2 1.5 3.9 6.1Philippines -0.4 5.5 12.4 6.3 3.9 2.0 1.9Singapore -0.2 3.2 6.1 3.6 -1.9 4.6 6.1South Korea -2.3 0.2 -25.7 0.5 -0.5 -1.1 1.5Taiwan 1.6 3.4 -14.4 5.6 2.0 1.0 4.4Thailand 1.2 8.2 9.1 9.5 -0.3 6.8 5.4Vietnam 3.5 0.7 5.5 -5.6 4.9 -2.1 -2.1
Source: DB CIB Research Notes: A fall in the dbREER signifies a real depreciation of the currency; Inflation differential is calculated as the 12mma of the difference between the country's inflation (YoY%) and that of its trading partners (weighted)
18 January 2011 Strategy Asia Equities Daily Focus
Deutsche Bank AG/Hong Kong Page 19
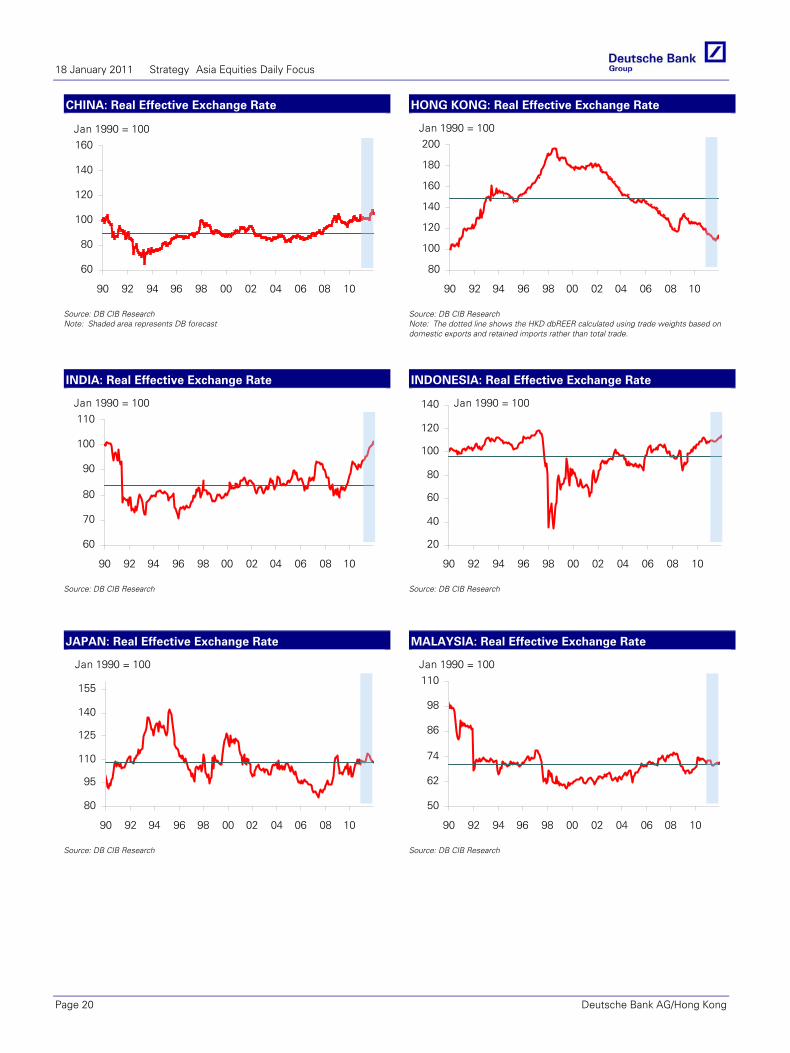
CHINA: Real Effective Exchange Rate HONG KONG: Real Effective Exchange Rate
60
80
100
120
140
160
90 92 94 96 98 00 02 04 06 08 10
Jan 1990 = 100
80
100
120
140
160
180
200
90 92 94 96 98 00 02 04 06 08 10
Jan 1990 = 100
Source: DB CIB Research Note: Shaded area represents DB forecast
Source: DB CIB Research Note: The dotted line shows the HKD dbREER calculated using trade weights based on domestic exports and retained imports rather than total trade.
INDIA: Real Effective Exchange Rate INDONESIA: Real Effective Exchange Rate
60
70
80
90
100
110
90 92 94 96 98 00 02 04 06 08 10
Jan 1990 = 100
20
40
60
80
100
120
140
90 92 94 96 98 00 02 04 06 08 10
Jan 1990 = 100
Source: DB CIB Research
Source: DB CIB Research
JAPAN: Real Effective Exchange Rate MALAYSIA: Real Effective Exchange Rate
80
95
110
125
140
155
90 92 94 96 98 00 02 04 06 08 10
Jan 1990 = 100
50
62
74
86
98
110
90 92 94 96 98 00 02 04 06 08 10
Jan 1990 = 100
Source: DB CIB Research
Source: DB CIB Research
18 January 2011 Strategy Asia Equities Daily Focus
Page 20 Deutsche Bank AG/Hong Kong
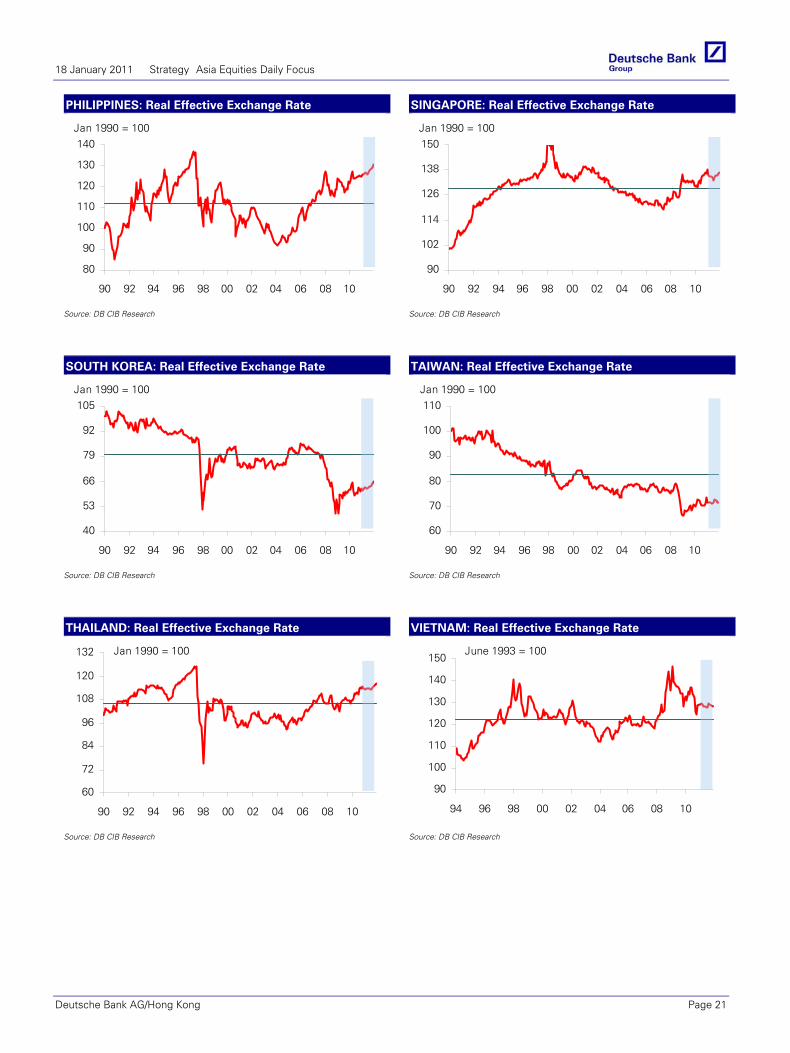
PHILIPPINES: Real Effective Exchange Rate SINGAPORE: Real Effective Exchange Rate
80
90
100
110
120
130
140
90 92 94 96 98 00 02 04 06 08 10
Jan 1990 = 100
90
102
114
126
138
150
90 92 94 96 98 00 02 04 06 08 10
Jan 1990 = 100
Source: DB CIB Research
Source: DB CIB Research
SOUTH KOREA: Real Effective Exchange Rate TAIWAN: Real Effective Exchange Rate
40
53
66
79
92
105
90 92 94 96 98 00 02 04 06 08 10
Jan 1990 = 100
60
70
80
90
100
110
90 92 94 96 98 00 02 04 06 08 10
Jan 1990 = 100
Source: DB CIB Research
Source: DB CIB Research
THAILAND: Real Effective Exchange Rate VIETNAM: Real Effective Exchange Rate
60
72
84
96
108
120
132
90 92 94 96 98 00 02 04 06 08 10
Jan 1990 = 100
90
100
110
120
130
140
150
94 96 98 00 02 04 06 08 10
June 1993 = 100
Source: DB CIB Research
Source: DB CIB Research
18 January 2011 Strategy Asia Equities Daily Focus
Deutsche Bank AG/Hong Kong Page 21
Global
17 January 2011
Global Commodities DailyHarsh weather and inflation
Deutsche Bank AG/London
All prices are those current at the end of the previous trading session unless otherwise indicated. Prices are sourced from local exchanges via Reuters, Bloomberg and other vendors. Data is sourced from Deutsche Bank and subject companies. DISCLOSURES AND ANALYST CERTIFICATIONS ARE LOCATED IN APPENDIX 1. MICA(P) 007/05/2010
Co
mm
od
itie
s
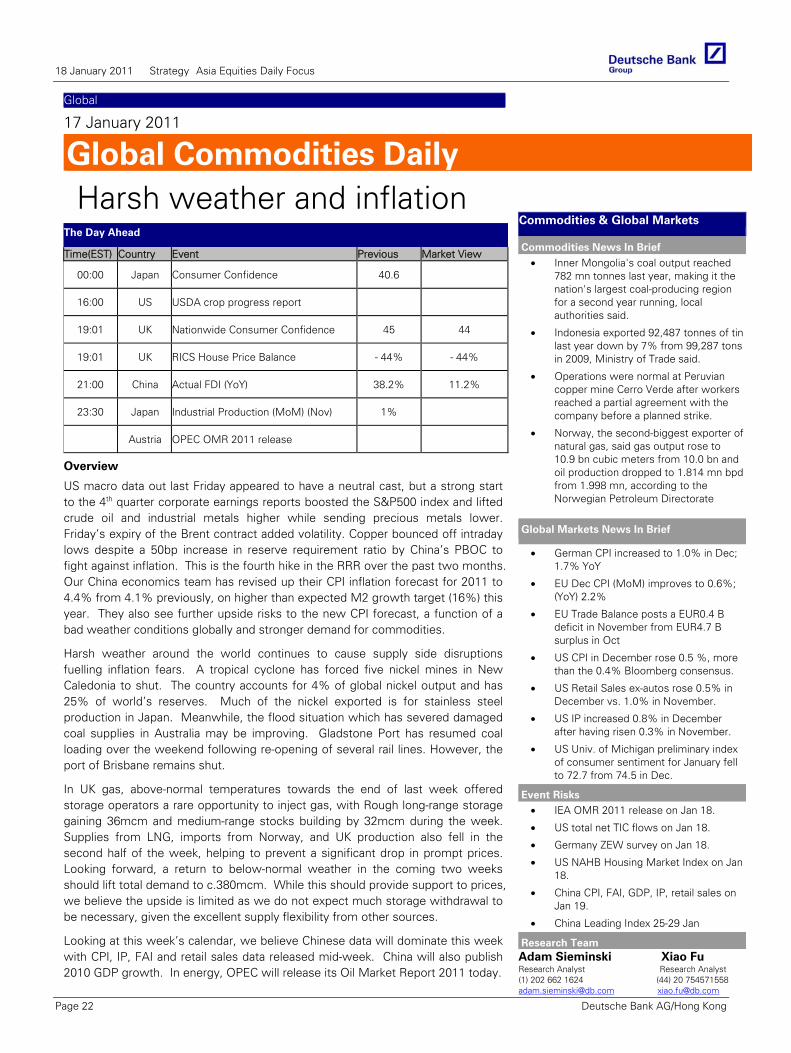
The Day Ahead
Time(EST) Country Event Previous Market View
00:00 Japan Consumer Confidence 40.6
16:00 US USDA crop progress report
19:01 UK Nationwide Consumer Confidence 45 44
19:01 UK RICS House Price Balance - 44% - 44%
21:00 China Actual FDI (YoY) 38.2% 11.2%
23:30 Japan Industrial Production (MoM) (Nov) 1%
Austria OPEC OMR 2011 release
Overview
US macro data out last Friday appeared to have a neutral cast, but a strong start to the 4th quarter corporate earnings reports boosted the S&P500 index and lifted crude oil and industrial metals higher while sending precious metals lower. Friday’s expiry of the Brent contract added volatility. Copper bounced off intraday lows despite a 50bp increase in reserve requirement ratio by China’s PBOC to fight against inflation. This is the fourth hike in the RRR over the past two months. Our China economics team has revised up their CPI inflation forecast for 2011 to 4.4% from 4.1% previously, on higher than expected M2 growth target (16%) this year. They also see further upside risks to the new CPI forecast, a function of a bad weather conditions globally and stronger demand for commodities.
Harsh weather around the world continues to cause supply side disruptions fuelling inflation fears. A tropical cyclone has forced five nickel mines in New Caledonia to shut. The country accounts for 4% of global nickel output and has 25% of world’s reserves. Much of the nickel exported is for stainless steel production in Japan. Meanwhile, the flood situation which has severed damaged coal supplies in Australia may be improving. Gladstone Port has resumed coal loading over the weekend following re-opening of several rail lines. However, the port of Brisbane remains shut.
In UK gas, above-normal temperatures towards the end of last week offered storage operators a rare opportunity to inject gas, with Rough long-range storage gaining 36mcm and medium-range stocks building by 32mcm during the week. Supplies from LNG, imports from Norway, and UK production also fell in the second half of the week, helping to prevent a significant drop in prompt prices. Looking forward, a return to below-normal weather in the coming two weeks should lift total demand to c.380mcm. While this should provide support to prices, we believe the upside is limited as we do not expect much storage withdrawal to be necessary, given the excellent supply flexibility from other sources.
Looking at this week’s calendar, we believe Chinese data will dominate this week with CPI, IP, FAI and retail sales data released mid-week. China will also publish 2010 GDP growth. In energy, OPEC will release its Oil Market Report 2011 today.
Commodities & Global Markets
Commodities News In Brief • Inner Mongolia's coal output reached
782 mn tonnes last year, making it the nation's largest coal-producing region for a second year running, local authorities said.
• Indonesia exported 92,487 tonnes of tin last year down by 7% from 99,287 tons in 2009, Ministry of Trade said.
• Operations were normal at Peruvian copper mine Cerro Verde after workers reached a partial agreement with the company before a planned strike.
• Norway, the second-biggest exporter of natural gas, said gas output rose to 10.9 bn cubic meters from 10.0 bn and oil production dropped to 1.814 mn bpd from 1.998 mn, according to the Norwegian Petroleum Directorate
Global Markets News In Brief
• German CPI increased to 1.0% in Dec; 1.7% YoY
• EU Dec CPI (MoM) improves to 0.6%; (YoY) 2.2%
• EU Trade Balance posts a EUR0.4 B deficit in November from EUR4.7 B surplus in Oct
• US CPI in December rose 0.5 %, more than the 0.4% Bloomberg consensus.
• US Retail Sales ex-autos rose 0.5% in December vs. 1.0% in November.
• US IP increased 0.8% in December after having risen 0.3% in November.
• US Univ. of Michigan preliminary index of consumer sentiment for January fell to 72.7 from 74.5 in Dec.
Event Risks • IEA OMR 2011 release on Jan 18.
• US total net TIC flows on Jan 18.
• Germany ZEW survey on Jan 18.
• US NAHB Housing Market Index on Jan 18.
• China CPI, FAI, GDP, IP, retail sales on Jan 19.
• China Leading Index 25-29 Jan
Research Team Adam Sieminski Xiao Fu Research Analyst Research Analyst (1) 202 662 1624 (44) 20 754571558 [email protected] [email protected]
18 January 2011 Strategy Asia Equities Daily Focus
Page 22 Deutsche Bank AG/Hong Kong
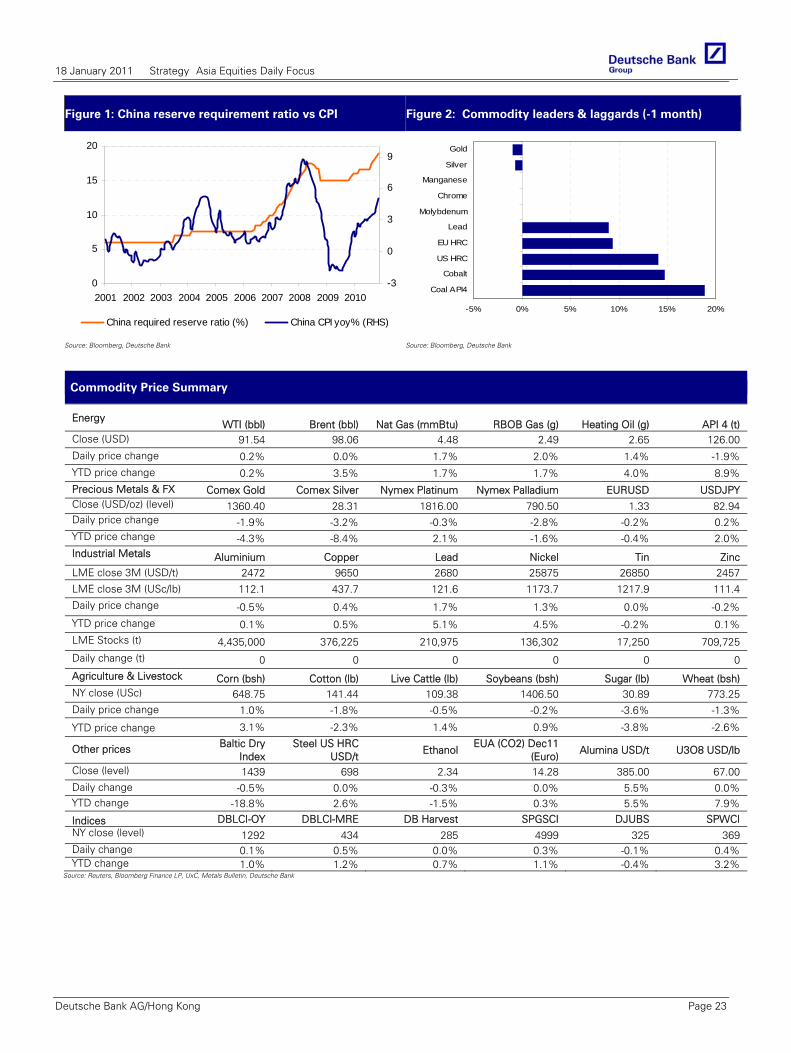
Figure 1: China reserve requirement ratio vs CPI Figure 2: Commodity leaders & laggards (-1 month)
0
5
10
15
20
2001 2002 2003 2004 2005 2006 2007 2008 2009 2010-3
0
3
6
9
China required reserve ratio (%) China CPI yoy% (RHS)-5% 0% 5% 10% 15% 20%
Coal API4
Cobalt
US HRC
EU HRC
Lead
Molybdenum
Chrome
Manganese
Silver
Gold
Source: Bloomberg, Deutsche Bank Source: Bloomberg, Deutsche Bank
Commodity Price Summary
Energy WTI (bbl) Brent (bbl) Nat Gas (mmBtu) RBOB Gas (g) Heating Oil (g) API 4 (t)
Close (USD) 91.54 98.06 4.48 2.49 2.65 126.00 Daily price change 0.2% 0.0% 1.7% 2.0% 1.4% -1.9% YTD price change 0.2% 3.5% 1.7% 1.7% 4.0% 8.9% Precious Metals & FX Comex Gold Comex Silver Nymex Platinum Nymex Palladium EURUSD USDJPY Close (USD/oz) (level) 1360.40 28.31 1816.00 790.50 1.33 82.94 Daily price change -1.9% -3.2% -0.3% -2.8% -0.2% 0.2% YTD price change -4.3% -8.4% 2.1% -1.6% -0.4% 2.0% Industrial Metals Aluminium Copper Lead Nickel Tin Zinc LME close 3M (USD/t) 2472 9650 2680 25875 26850 2457
LME close 3M (USc/lb) 112.1 437.7 121.6 1173.7 1217.9 111.4
Daily price change -0.5% 0.4% 1.7% 1.3% 0.0% -0.2%
YTD price change 0.1% 0.5% 5.1% 4.5% -0.2% 0.1% LME Stocks (t) 4,435,000 376,225 210,975 136,302 17,250 709,725
Daily change (t) 0 0 0 0 0 0
Agriculture & Livestock Corn (bsh) Cotton (lb) Live Cattle (lb) Soybeans (bsh) Sugar (lb) Wheat (bsh) NY close (USc) 648.75 141.44 109.38 1406.50 30.89 773.25 Daily price change 1.0% -1.8% -0.5% -0.2% -3.6% -1.3%
YTD price change 3.1% -2.3% 1.4% 0.9% -3.8% -2.6%
Other prices Baltic Dry Index
Steel US HRC USD/t
Ethanol EUA (CO2) Dec11
(Euro) Alumina USD/t U3O8 USD/lb
Close (level) 1439 698 2.34 14.28 385.00 67.00 Daily change -0.5% 0.0% -0.3% 0.0% 5.5% 0.0% YTD change -18.8% 2.6% -1.5% 0.3% 5.5% 7.9%
Indices DBLCI-OY DBLCI-MRE DB Harvest SPGSCI DJUBS SPWCI NY close (level) 1292 434 285 4999 325 369 Daily change 0.1% 0.5% 0.0% 0.3% -0.1% 0.4% YTD change 1.0% 1.2% 0.7% 1.1% -0.4% 3.2%
Source: Reuters, Bloomberg Finance LP, UxC, Metals Bulletin, Deutsche Bank
18 January 2011 Strategy Asia Equities Daily Focus
Deutsche Bank AG/Hong Kong Page 23
Global
17 January 2011
Commodities Outlook
Deutsche Bank AG/London
Market Update
Table of Contents
Commodity Views ..................................... 2#1 Executive Summary .............................. 3#2 Trade Recommendations...................... 4#3 Commodity Indices............................... 9#4 Global Macro....................................... 13#5 Crude Oil ............................................. 17#6 Transatantic Crude Arb ....................... 23#7 Global Refining.................................... 24#8 Refined Products ................................ 27#9 US Natural Gas.................................... 33#10 German Power.................................. 36#11 UK Gas .............................................. 39#12 Carbon Emissions ............................. 42#13 US Carbon Trading............................ 45#14 Precious Metals ................................ 47#15 PGM.................................................. 50#16 Industrial Metals ............................... 53#17 Bulk Commodities............................. 63#18 Agriculture ........................................ 69#19 Uranium ............................................ 72Commodities Chartbook ......................... 75Price Forecasts ........................................ 82Correlation Matrix .................................... 86
Research Team
Michael Lewis Research Analyst (44) 20 7545 2166 [email protected]
Daniel Brebner, CFA Research Analyst (44) 20 7547 3843 [email protected]
Michael Hsueh Research Analyst (44) 20 7547 8015 [email protected]
Xiao Fu Research Analyst (44) 20 7547 1558 [email protected]
Adam Sieminski, CFA Research Analyst (1) 202 662 1624 [email protected]
Soozhana Choi Research Analyst (65) 6423 5261 [email protected]
Mark-C Lewis Research Analyst (33) 1 4495 6761 [email protected]
Isabelle Curien Research Analyst (33) 1 4495 6616 [email protected]
Mac
ro
Glo
bal
Mar
kets
Res
earc
h
Co
mm
od
itie
s
Commodities As An Asset Class: We believe commodities will enjoy a fresh
wave of investment inflows during 2011. To exploit the properties of mean reversion, carry and momentum we are introducing the DBLCI Apex index, which performs well when commodity prices are trending.
Crude Oil: We believe oil price rallies will be based on more solid foundations in 2011. This reflects upside risks to global oil demand and falling crude oil inventories, which we expect will push the crude oil forward curve into backwardation.
US Natural Gas: After dry freight, US natural gas was the worst performing commodity market in 2010. We expect natural gas prices will continue to struggle due to excess storage levels. However, we believe market fundamentals will start to tighten from the fourth quarter of this year.
EU Power & Gas: With clean dark and clean spark spreads at three-year lows in Germany, we believe generators will remain cautious in H1. We expect this to lead to greater volatility in both power and carbon prices in the second half of the year as larger volumes of forward production are sold at shorter-dated maturities than usual.
Precious Metals: We believe precious metals will continue to perform strongly. Gold is expected to benefit from a low real interest rate environment, central bank diversification and inflows into physically backed ETFs. Our upbeat assessment towards global growth should also ensure that silver continues to out-perform gold.
Industrial Metals: We expect another strong year for the metals complex with differentiation based on relative scarcity. In this context, copper is expected to outperform. Also, we anticipate that aluminium could be a strong performer as cost inflation and tight energy markets in China create the potential for the country to become a net importer during 2011. Nickel and zinc are expected to be laggards.
Agriculture: We view physical fundamentals in corn as extremely tight. Droughts in South America and lower US plantings should encourage further price advances in soybeans, in our view. Ample inventories should mean wheat under-performs.
Commodity Markets In 2011
18 January 2011 Strategy Asia Equities Daily Focus
Page 24 Deutsche Bank AG/Hong Kong
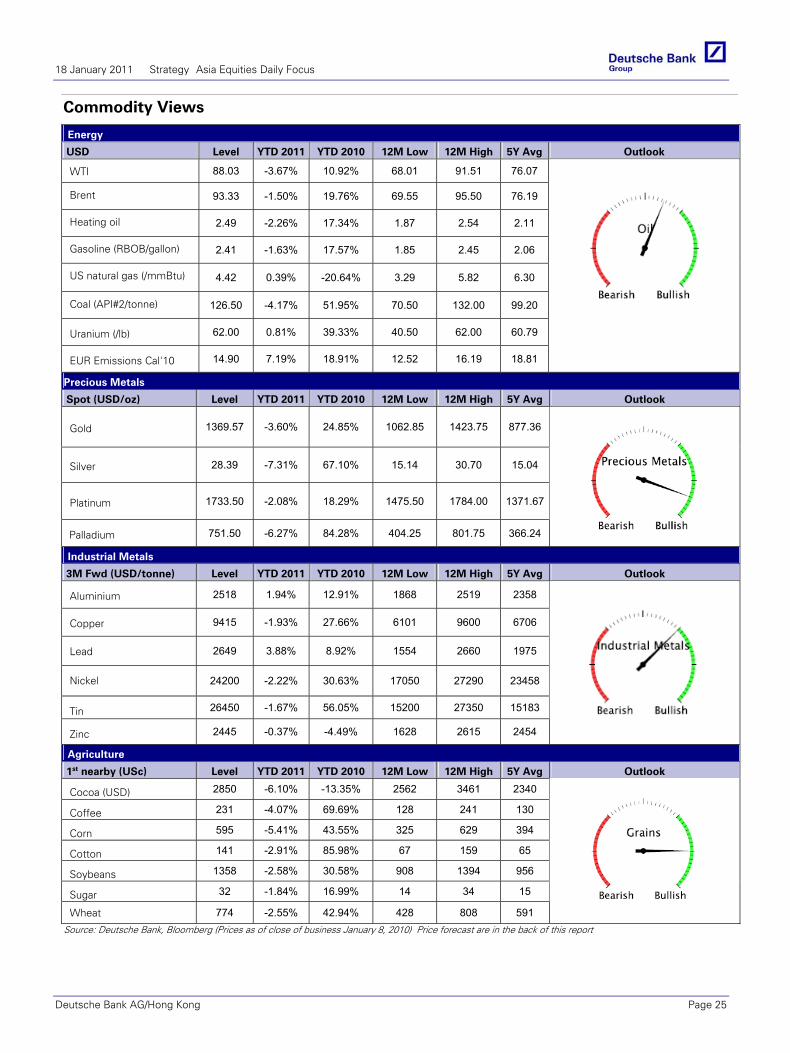
Commodity Views
Energy
USD Level YTD 2011 YTD 2010 12M Low 12M High 5Y Avg Outlook
WTI 88.03 -3.67% 10.92% 68.01 91.51 76.07
Brent 93.33 -1.50% 19.76% 69.55 95.50 76.19
Heating oil 2.49 -2.26% 17.34% 1.87 2.54 2.11
Gasoline (RBOB/gallon) 2.41 -1.63% 17.57% 1.85 2.45 2.06
US natural gas (/mmBtu) 4.42 0.39% -20.64% 3.29 5.82 6.30
Coal (API#2/tonne) 126.50 -4.17% 51.95% 70.50 132.00 99.20
Uranium (/lb) 62.00 0.81% 39.33% 40.50 62.00 60.79
EUR Emissions Cal'10 14.90 7.19% 18.91% 12.52 16.19 18.81
Precious Metals
Spot (USD/oz) Level YTD 2011 YTD 2010 12M Low 12M High 5Y Avg Outlook
Gold 1369.57 -3.60% 24.85% 1062.85 1423.75 877.36
Silver 28.39 -7.31% 67.10% 15.14 30.70 15.04
Platinum 1733.50 -2.08% 18.29% 1475.50 1784.00 1371.67
Palladium 751.50 -6.27% 84.28% 404.25 801.75 366.24
Industrial Metals
3M Fwd (USD/tonne) Level YTD 2011 YTD 2010 12M Low 12M High 5Y Avg Outlook
Aluminium 2518 1.94% 12.91% 1868 2519 2358
Copper 9415 -1.93% 27.66% 6101 9600 6706
Lead 2649 3.88% 8.92% 1554 2660 1975
Nickel 24200 -2.22% 30.63% 17050 27290 23458
Tin 26450 -1.67% 56.05% 15200 27350 15183
Zinc 2445 -0.37% -4.49% 1628 2615 2454
Agriculture
1st nearby (USc) Level YTD 2011 YTD 2010 12M Low 12M High 5Y Avg Outlook
Cocoa (USD) 2850 -6.10% -13.35% 2562 3461 2340
Coffee 231 -4.07% 69.69% 128 241 130
Corn 595 -5.41% 43.55% 325 629 394
Cotton 141 -2.91% 85.98% 67 159 65
Soybeans 1358 -2.58% 30.58% 908 1394 956
Sugar 32 -1.84% 16.99% 14 34 15
Wheat 774 -2.55% 42.94% 428 808 591
Source: Deutsche Bank, Bloomberg (Prices as of close of business January 8, 2010) Price forecast are in the back of this report
18 January 2011 Strategy Asia Equities Daily Focus
Deutsche Bank AG/Hong Kong Page 25
Asia Technology
17 January 2011
Tech@DB Infosys disappoints, Elpida and Toshiba look interestingKishore Suratkal Research Analyst (+852) 2203 6150 [email protected]
In Focus today
Periodical 2010 Estimates EPS P/E RoE
Long
SEC 88970.24 10.49 19.99
Infosys Technologies 108.30 19.86 29.95
Hon Hai Precision 7.39 15.82 16.22
LG Display 4021.81 9.45 13.44
Asahi Glass 91.00 10.57 14.33
Short
Hynix 4739.21 5.75 40.32
Mediatek 29.26 13.86 28.62
HCL Tech 19.06 17.41 21.06
Nintendo 1787.86 14.02 17.65
Source: DB Estimates
FOCUS TECH RESEARCH
• Infosys Technologies - Growth drivers intact; Buy on 19% potential upside
• Tech Strat, The Taiwan dollar conundrum
• Industrial, 3Q preview: wider earnings gaps expected; Focusing on Toshiba
• IT Hardware, 2011 Outlook - Go for Growth
• Semicap Equipment, Intel raises the bar -upgrading the semicap equipment group
TECH NEWSBYTES
• Passive component makers see orders pick up
• Nanya denies report that it will give up Inotera shares
• LED lighting market may take-off in 3Q11
• TSMC’s order visibility is reportedly extended to early 3Q11, thanks to the IDM orders.
• Compal targets to have 15% yoy growth on its NB PC shipment
%Change 1DAY 1MTH 1YR
SOX Index 2.7 10.0 26.5
Apple 0.8 8.8 66.4
Google 1.2 4.9 5.8
Intel -1.0 -1.8 -1.7
Cisco 0.6 8.5 -15.0
Hewlett-Packard 1.3 11.3 -11.9
Qualcomm 0.3 5.8 7.6
Texas Instruments 1.7 3.8 37.8
Research in Motion 1.2 7.1 -2.6
Dell -0.8 5.5 -4.4
Nvidia 0.9 61.7 33.8
Sandisk 2.7 6.9 78.5
Source: Bloomberg Finance LP. Prices as of January 13
DRAM bottoming in Jan-Mar 2010. Upgrade Elpida from Sell to Hold. Our Japanese memory analyst Takeo Miyamoto believes that the average price of commodity DRAM, which fell 35% QoQ during Oct-Dec 2010, will decline 30% QoQ in Jan-Mar 2011. However he sees a modest recovery in prices from Mar-Apr as low-end makers, who are facing average DRAM prices lower than their breakeven point, begin to reduce supplies. Moreover, for Elpida in particular, Takeo believes Elpida will only see a 15% decline in its 4Q earnings due to a rise in the ratio of its mobile DRAM sales. The company will allocate more of its production to mobile DRAM, which may increase 20% QoQ over the next few quarters. At this pace, mobile DRAM sales may eventually rise to a level where they can offset commodity DRAM losses. Takeo now believes that Elpida should make less losses than previously expected in FY3/12. Takeo hence revises up his EPS from -¥96 to -¥13 in FY3/12, and from ¥25 to ¥30 in FY3/13.
Japan tech: 3Q10FY earnings gaps widen. Toshiba is the top pick Also on Japan tech, our local tech team doesn’t expect any major 3Q earnings surprises. What they expect is wider earnings gaps among sector companies based on the effectiveness of each company’s strategies to achieve earnings growth. Hitachi, Toshiba and Mitsubishi Electric are likely to stand out. Among the three, Toshiba is the top pick on the back of its memory segment and bright prospects for earnings growth. The team also likes Hitachi for all of the company’s segments are showing strength and the full-year OP is likely to exceed management’s target. They are positive on Mitsubishi Electric as earnings at the factory automation business bottomed out in October and strong earnings shall continue.
Infosys -S/T setback doesn’t change our L/T positive view. Aniruddha Bhosale, our India IT services analyst, cut his FY12 and FY13 earnings estimates on Infosys by 7% and 4% respectively for the weaker than expected December 10 quarter. The disappointment came from a lower volume growth - Infosys’ Western clients’ spending was front loaded before Dec 2010-quarter. As a result, the Dec-Q volumes were abysmally low. Though volume growth was sub-par, the company’s performance improved in terms of operating margins, new deal pipeline and clients’ spending outlook. Given the company’s earnings CAGR at 25% in FY11-13, Aniruddha remains his Buy rating on this company unchanged.
Semicap Equipment, Intel raises the bar - upgrading the semicap equipment group (Peter Kim). Intel guided 2011 CapEx to $9B +/- $300M. Peter believes competitive pressure from Intel's spending boost will also lower the risk to the foundry spending outlook, and drive overall spending higher in 2011.
Other key Asia tech research reports include… Tech Strat, The Taiwan dollar conundrum (Kishore Suratkal). In this note we look at the sensitivity of Taiwan tech earnings and margins to the Taiwan dollar. Semiconductor companies are the most affected by this scenario whereas Acer and Synnex benefit. IT Hardware, 2011 Outlook - Go for Growth (Chris Whitmore). In conjunction with improving macro conditions Chris sees healthy corporate IT spending trends continuing in 2011 and into 2012.
18 January 2011 Strategy Asia Equities Daily Focus
Page 26 Deutsche Bank AG/Hong Kong
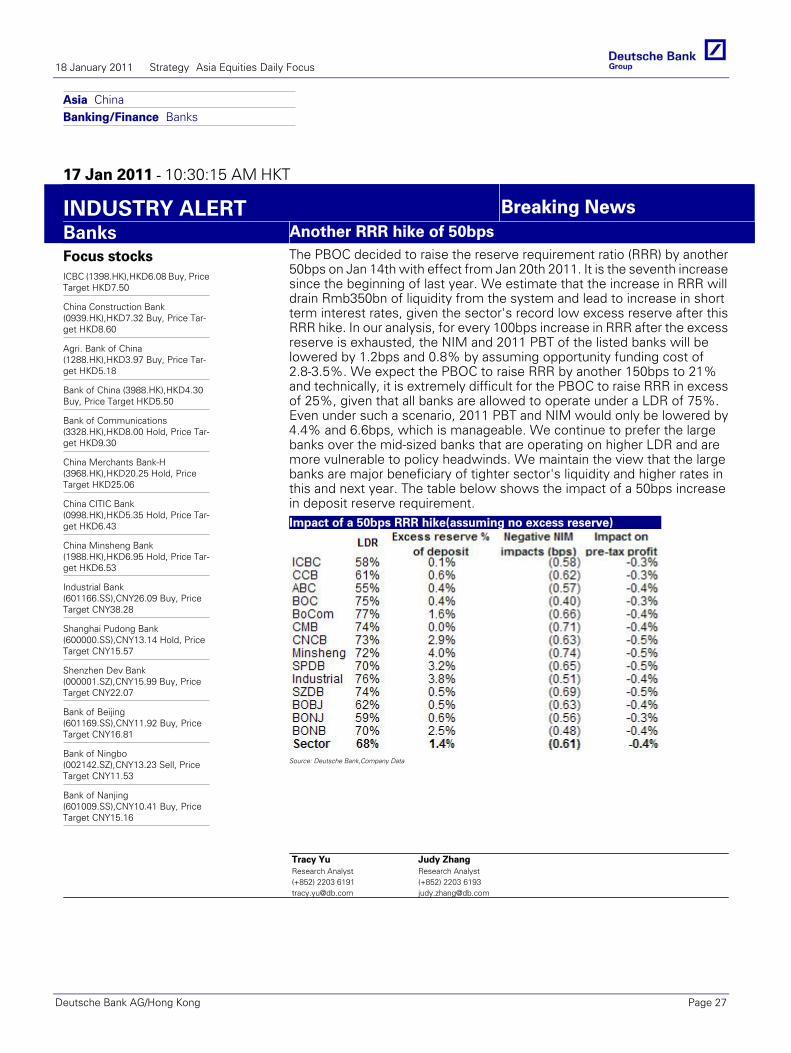
Asia ChinaBanking/Finance Banks
17 Jan 2011 - 10:30:15 AM HKT
INDUSTRY ALERT Breaking NewsBanks Another RRR hike of 50bps
Focus stocksICBC (1398.HK),HKD6.08 Buy, PriceTarget HKD7.50
China Construction Bank(0939.HK),HKD7.32 Buy, Price Tar‐get HKD8.60
Agri. Bank of China(1288.HK),HKD3.97 Buy, Price Tar‐get HKD5.18
Bank of China (3988.HK),HKD4.30Buy, Price Target HKD5.50
Bank of Communications(3328.HK),HKD8.00 Hold, Price Tar‐get HKD9.30
China Merchants Bank‐H(3968.HK),HKD20.25 Hold, PriceTarget HKD25.06
China CITIC Bank(0998.HK),HKD5.35 Hold, Price Tar‐get HKD6.43
China Minsheng Bank(1988.HK),HKD6.95 Hold, Price Tar‐get HKD6.53
Industrial Bank(601166.SS),CNY26.09 Buy, PriceTarget CNY38.28
Shanghai Pudong Bank(600000.SS),CNY13.14 Hold, PriceTarget CNY15.57
Shenzhen Dev Bank(000001.SZ),CNY15.99 Buy, PriceTarget CNY22.07
Bank of Beijing(601169.SS),CNY11.92 Buy, PriceTarget CNY16.81
Bank of Ningbo(002142.SZ),CNY13.23 Sell, PriceTarget CNY11.53
Bank of Nanjing(601009.SS),CNY10.41 Buy, PriceTarget CNY15.16
The PBOC decided to raise the reserve requirement ratio (RRR) by another50bps on Jan 14th with effect from Jan 20th 2011. It is the seventh increasesince the beginning of last year. We estimate that the increase in RRR willdrain Rmb350bn of liquidity from the system and lead to increase in shortterm interest rates, given the sector's record low excess reserve after thisRRR hike. In our analysis, for every 100bps increase in RRR after the excessreserve is exhausted, the NIM and 2011 PBT of the listed banks will belowered by 1.2bps and 0.8% by assuming opportunity funding cost of2.8‐3.5%. We expect the PBOC to raise RRR by another 150bps to 21%and technically, it is extremely difficult for the PBOC to raise RRR in excessof 25%, given that all banks are allowed to operate under a LDR of 75%.Even under such a scenario, 2011 PBT and NIM would only be lowered by4.4% and 6.6bps, which is manageable. We continue to prefer the largebanks over the mid‐sized banks that are operating on higher LDR and aremore vulnerable to policy headwinds. We maintain the view that the largebanks are major beneficiary of tighter sector's liquidity and higher rates inthis and next year. The table below shows the impact of a 50bps increasein deposit reserve requirement.Impact of a 50bps RRR hike(assuming no excess reserve)
Source: Deutsche Bank,Company Data
Tracy YuResearch Analyst(+852) 2203 [email protected]
Judy ZhangResearch Analyst(+852) 2203 [email protected]
18 January 2011 Strategy Asia Equities Daily Focus
Deutsche Bank AG/Hong Kong Page 27
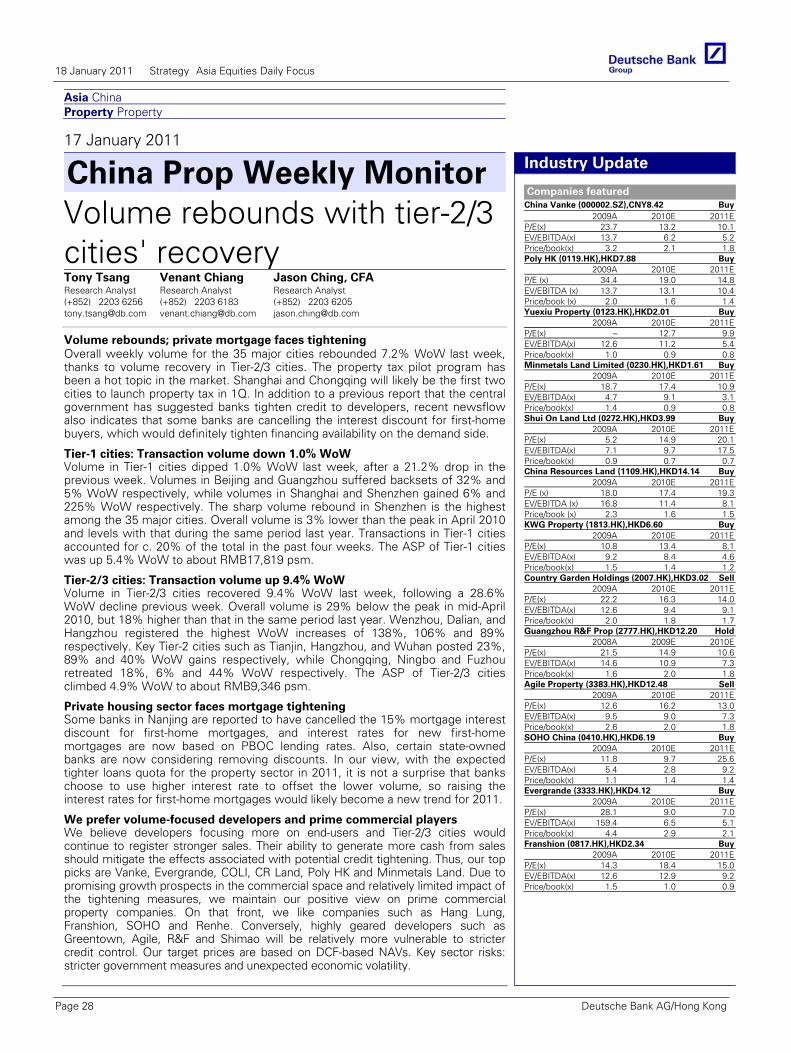
Asia China Property Property
17 January 2011
China Prop Weekly Monitor Volume rebounds with tier-2/3 cities' recovery Tony Tsang Research Analyst (+852) 2203 6256 [email protected]
Venant Chiang Research Analyst (+852) 2203 6183 [email protected]
Jason Ching, CFA Research Analyst (+852) 2203 6205 [email protected]
Volume rebounds; private mortgage faces tightening Overall weekly volume for the 35 major cities rebounded 7.2% WoW last week, thanks to volume recovery in Tier-2/3 cities. The property tax pilot program has been a hot topic in the market. Shanghai and Chongqing will likely be the first two cities to launch property tax in 1Q. In addition to a previous report that the central government has suggested banks tighten credit to developers, recent newsflow also indicates that some banks are cancelling the interest discount for first-home buyers, which would definitely tighten financing availability on the demand side.
Deutsche Bank AG/Hong Kong
Industry Update
Companies featured China Vanke (000002.SZ),CNY8.42 Buy
2009A 2010E 2011EP/E(x) 23.7 13.2 10.1EV/EBITDA(x) 13.7 6.2 5.2Price/book(x) 3.2 2.1 1.8Poly HK (0119.HK),HKD7.88 Buy
2009A 2010E 2011EP/E (x) 34.4 19.0 14.8EV/EBITDA (x) 13.7 13.1 10.4Price/book (x) 2.0 1.6 1.4Yuexiu Property (0123.HK),HKD2.01 Buy
2009A 2010E 2011EP/E(x) – 12.7 9.9EV/EBITDA(x) 12.6 11.2 5.4Price/book(x) 1.0 0.9 0.8Minmetals Land Limited (0230.HK),HKD1.61 Buy
2009A 2010E 2011EP/E(x) 18.7 17.4 10.9EV/EBITDA(x) 4.7 9.1 3.1Price/book(x) 1.4 0.9 0.8Shui On Land Ltd (0272.HK),HKD3.99 Buy
2009A 2010E 2011EP/E(x) 5.2 14.9 20.1EV/EBITDA(x) 7.1 9.7 17.5Price/book(x) 0.9 0.7 0.7China Resources Land (1109.HK),HKD14.14 Buy
2009A 2010E 2011EP/E (x) 18.0 17.4 19.3EV/EBITDA (x) 16.8 11.4 8.1Price/book (x) 2.3 1.6 1.5KWG Property (1813.HK),HKD6.60 Buy
2009A 2010E 2011EP/E(x) 10.8 13.4 8.1EV/EBITDA(x) 9.2 8.4 4.6Price/book(x) 1.5 1.4 1.2Country Garden Holdings (2007.HK),HKD3.02 Sell
2009A 2010E 2011EP/E(x) 22.2 16.3 14.0EV/EBITDA(x) 12.6 9.4 9.1Price/book(x) 2.0 1.8 1.7Guangzhou R&F Prop (2777.HK),HKD12.20 Hold
2008A 2009E 2010EP/E(x) 21.5 14.9 10.6EV/EBITDA(x) 14.6 10.9 7.3Price/book(x) 1.6 2.0 1.8Agile Property (3383.HK),HKD12.48 Sell
2009A 2010E 2011EP/E(x) 12.6 16.2 13.0EV/EBITDA(x) 9.5 9.0 7.3Price/book(x) 2.6 2.0 1.8SOHO China (0410.HK),HKD6.19 Buy
2009A 2010E 2011EP/E(x) 11.8 9.7 25.6EV/EBITDA(x) 5.4 2.8 9.2Price/book(x) 1.1 1.4 1.4Evergrande (3333.HK),HKD4.12 Buy
2009A 2010E 2011EP/E(x) 28.1 9.0 7.0EV/EBITDA(x) 159.4 6.5 5.1Price/book(x) 4.4 2.9 2.1Franshion (0817.HK),HKD2.34 Buy
2009A 2010E 2011EP/E(x) 14.3 18.4 15.0EV/EBITDA(x) 12.6 12.9 9.2Price/book(x) 1.5 1.0 0.9
Tier-1 cities: Transaction volume down 1.0% WoW Volume in Tier-1 cities dipped 1.0% WoW last week, after a 21.2% drop in the previous week. Volumes in Beijing and Guangzhou suffered backsets of 32% and 5% WoW respectively, while volumes in Shanghai and Shenzhen gained 6% and 225% WoW respectively. The sharp volume rebound in Shenzhen is the highest among the 35 major cities. Overall volume is 3% lower than the peak in April 2010 and levels with that during the same period last year. Transactions in Tier-1 cities accounted for c. 20% of the total in the past four weeks. The ASP of Tier-1 cities was up 5.4% WoW to about RMB17,819 psm.
Tier-2/3 cities: Transaction volume up 9.4% WoW Volume in Tier-2/3 cities recovered 9.4% WoW last week, following a 28.6% WoW decline previous week. Overall volume is 29% below the peak in mid-April 2010, but 18% higher than that in the same period last year. Wenzhou, Dalian, and Hangzhou registered the highest WoW increases of 138%, 106% and 89% respectively. Key Tier-2 cities such as Tianjin, Hangzhou, and Wuhan posted 23%, 89% and 40% WoW gains respectively, while Chongqing, Ningbo and Fuzhou retreated 18%, 6% and 44% WoW respectively. The ASP of Tier-2/3 cities climbed 4.9% WoW to about RMB9,346 psm.
Private housing sector faces mortgage tightening Some banks in Nanjing are reported to have cancelled the 15% mortgage interest discount for first-home mortgages, and interest rates for new first-home mortgages are now based on PBOC lending rates. Also, certain state-owned banks are now considering removing discounts. In our view, with the expected tighter loans quota for the property sector in 2011, it is not a surprise that banks choose to use higher interest rate to offset the lower volume, so raising the interest rates for first-home mortgages would likely become a new trend for 2011.
We prefer volume-focused developers and prime commercial players We believe developers focusing more on end-users and Tier-2/3 cities would continue to register stronger sales. Their ability to generate more cash from sales should mitigate the effects associated with potential credit tightening. Thus, our top picks are Vanke, Evergrande, COLI, CR Land, Poly HK and Minmetals Land. Due to promising growth prospects in the commercial space and relatively limited impact of the tightening measures, we maintain our positive view on prime commercial property companies. On that front, we like companies such as Hang Lung, Franshion, SOHO and Renhe. Conversely, highly geared developers such as Greentown, Agile, R&F and Shimao will be relatively more vulnerable to stricter credit control. Our target prices are based on DCF-based NAVs. Key sector risks: stricter government measures and unexpected economic volatility.
18 January 2011 Strategy Asia Equities Daily Focus
Page 28 Deutsche Bank AG/Hong Kong
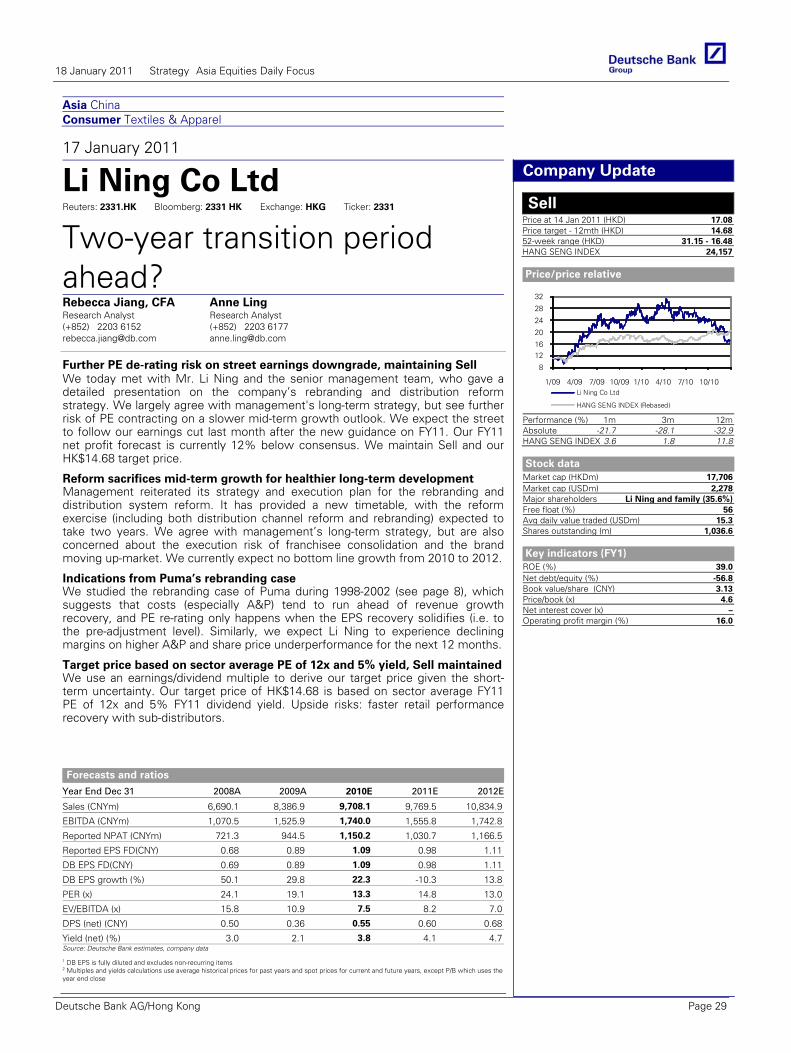
Asia China Consumer Textiles & Apparel
17 January 2011
Li Ning Co Ltd Reuters: 2331.HK Bloomberg: 2331 HK Exchange: HKG Ticker: 2331
Two-year transition period ahead? Rebecca Jiang, CFA Research Analyst (+852) 2203 6152 [email protected]
Anne Ling Research Analyst (+852) 2203 6177 [email protected]
Further PE de-rating risk on street earnings downgrade, maintaining Sell We today met with Mr. Li Ning and the senior management team, who gave a detailed presentation on the company’s rebranding and distribution reform strategy. We largely agree with management's long-term strategy, but see further risk of PE contracting on a slower mid-term growth outlook. We expect the street to follow our earnings cut last month after the new guidance on FY11. Our FY11 net profit forecast is currently 12% below consensus. We maintain Sell and our HK$14.68 target price.
Forecasts and ratios
Year End Dec 31 2008A 2009A 2010E 2011E 2012E
Sales (CNYm) 6,690.1 8,386.9 9,708.1 9,769.5 10,834.9
EBITDA (CNYm) 1,070.5 1,525.9 1,740.0 1,555.8 1,742.8
Reported NPAT (CNYm) 721.3 944.5 1,150.2 1,030.7 1,166.5
Reported EPS FD(CNY) 0.68 0.89 1.09 0.98 1.11
DB EPS FD(CNY) 0.69 0.89 1.09 0.98 1.11
DB EPS growth (%) 50.1 29.8 22.3 -10.3 13.8
PER (x) 24.1 19.1 13.3 14.8 13.0
EV/EBITDA (x) 15.8 10.9 7.5 8.2 7.0
DPS (net) (CNY) 0.50 0.36 0.55 0.60 0.68
Yield (net) (%) 3.0 2.1 3.8 4.1 4.7Source: Deutsche Bank estimates, company data
1 DB EPS is fully diluted and excludes non-recurring items 2 Multiples and yields calculations use average historical prices for past years and spot prices for current and future years, except P/B which uses the year end close
Deutsche Bank AG/Hong Kong
Company Update
Sell Price at 14 Jan 2011 (HKD) 17.08Price target - 12mth (HKD) 14.6852-week range (HKD) 31.15 - 16.48HANG SENG INDEX 24,157
Price/price relative
8
1216
20
24
28
32
1/09 4/09 7/09 10/09 1/10 4/10 7/10 10/10Li Ning Co Ltd
HANG SENG INDEX (Rebased)
Performance (%) 1m 3m 12mAbsolute -21.7 -28.1 -32.9HANG SENG INDEX 3.6 1.8 11.8
Stock data
Market cap (HKDm) 17,706Market cap (USDm) 2,278Major shareholders Li Ning and family (35.6%)Free float (%) 56Avg daily value traded (USDm) 15.3Shares outstanding (m) 1,036.6
Key indicators (FY1)
ROE (%) 39.0Net debt/equity (%) -56.8Book value/share (CNY) 3.13Price/book (x) 4.6Net interest cover (x) –Operating profit margin (%) 16.0
Reform sacrifices mid-term growth for healthier long-term development Management reiterated its strategy and execution plan for the rebranding and distribution system reform. It has provided a new timetable, with the reform exercise (including both distribution channel reform and rebranding) expected to take two years. We agree with management’s long-term strategy, but are also concerned about the execution risk of franchisee consolidation and the brand moving up-market. We currently expect no bottom line growth from 2010 to 2012.
Indications from Puma’s rebranding case We studied the rebranding case of Puma during 1998-2002 (see page 8), which suggests that costs (especially A&P) tend to run ahead of revenue growth recovery, and PE re-rating only happens when the EPS recovery solidifies (i.e. to the pre-adjustment level). Similarly, we expect Li Ning to experience declining margins on higher A&P and share price underperformance for the next 12 months.
Target price based on sector average PE of 12x and 5% yield, Sell maintained We use an earnings/dividend multiple to derive our target price given the short-term uncertainty. Our target price of HK$14.68 is based on sector average FY11 PE of 12x and 5% FY11 dividend yield. Upside risks: faster retail performance recovery with sub-distributors.
18 January 2011 Strategy Asia Equities Daily Focus
Deutsche Bank AG/Hong Kong Page 29
Asia ChinaProperty Property
17 Jan 2011 - 02:06:48 PM HKT
INDUSTRY ALERT Industry UpdateProperty Banks might cancel discounts for first-home mortgages
Focus stocksChina Vanke (000002.SZ),CNY9.05Buy, Price Target CNY11.47
Evergrande (3333.HK),HKD4.22Buy, Price Target HKD5.00
COLI (0688.HK),HKD15.24 Buy,Price Target HKD18.68
China Resources Land(1109.HK),HKD14.68 Buy, Price Tar‐get HKD18.80
Minmetals Land Limited(0230.HK),HKD1.66 Buy, Price Tar‐get HKD2.46
Agile Property (3383.HK),HKD12.80Sell, Price Target HKD8.40
As reported by Hexun, six banks in Nanjing ‐ Minseng Bank, Shenzhen De‐velopment Bank, CITIC Bank, Xinye Bank, China Merchant Bank, and Ever‐brigt Bank ‐ have cancelled the 15% mortgage interest discount for first‐home mortgages, and interest rates for new first‐home mortgages will nowbe based on the PBOC best lending rates.According to Hexun, while the banks in Beijing have not cancelled the dis‐counts yet, some banks in Beijing are considering removing the discountsfor first‐home mortgages too. In addition, the head office of certain state‐owned banks are now considering the removal of the discounts, and if thedecision is made and communicated to the branches, the branches wouldremove the mortgage discounts immediately.For 2011, the total loan quota for the whole country would likely be lowerthan last year. At the same time, a larger percentage of this loan quota willlikely go to the new phases of financing of the infrastructure projects thatstarted last year, and a larger percentage of the public housing develop‐ments. Thus there would likely be less quota for the property sector.In our view, with the expected tighter loans quota for the property sectorin 2011, it is not a surprise that banks would choose to use higher interestrate to offset the lower volume, so raising the interest rates for first‐homemortgages would likely become a new trend for 2011.This is in line with our view that a new direction of tighening measures for2011 would be on the financing to the sector ‐ i.e. tighter financing to boththe developers and the homebuyers.We believe that the higher‐gearing developers like Greentown, R&F, Agileand Shimao would be more affected by the further credit tightening. Ourtop picks are Vanke, Evergrande, COLI, CR Land, and Minmetals Land forstrong sales, and higher Tier‐2/3 cities exposure.
Tony TsangResearch Analyst(+852) 2203 [email protected]
Venant ChiangResearch Analyst(+852) 2203 [email protected]
Jason Ching, CFAResearch Analyst(+852) 2203 [email protected]
18 January 2011 Strategy Asia Equities Daily Focus
Page 30 Deutsche Bank AG/Hong Kong
Asia Hong KongProperty Property
17 Jan 2011 - 06:59:47 AM HKT
INDUSTRY ALERT Breaking NewsProperty New launch received strong responses
Focus stocksSino Land Co (0083.HK),HKD16.14Buy, Price Target HKD19.84
SHK Properties Ltd(0016.HK),HKD136.60 Buy, PriceTarget HKD140.70
Hang Lung Properties(0101.HK),HKD35.95 Buy, Price Tar‐get HKD41.87
SHKP launched Park Nara in Yuen Long last Friday (Nov 14) and receivedstrong responses. 63 units have been sold in first two days, representing75% of total units available. The ASP was HK$4,800‐5,000psf, very good inour view given the location of the project. The strong response to Park Nara,in terms of both price and volume, suggested that the homebuyers havenot really been impacted by the new property market measures introducedby the HK government in Nov 2010, and that the new property market mea‐sures have again been ineffective in altering the strong upward momentumof the residential market.Following the successful launch of Park Nara, we expect more new launch‐es in the next 2‐3 months, like Avignon and Shouson Peak by SHKP, 1Broadcast Drive by Sino Land, and the Hung Shui Kiu project by CheungKong. Added the continued recovery of the secondary market, we expectthese new launches to generate strong sales, hence presenting more cat‐alysts to the develoepers.In our view, there is a stark contrast between the homebuyers in the phys‐ical property market and stock investors in the stock market ‐ that thehomebuyers are not much impacted by the HK government measures butthe stock investors are somewhat concerned on those policies. This pre‐sented a "policy gap" between the phyiscal home prices and the share pricesof the developers ‐ that the former continued to outperform the latter. Forexample, in 2010, residential prices were up by 20.7%, but share prices ofthe leading developers have well underperformed ‐SHKP up only 11% andSino Land down 4%.This presents opportunities to buy the high quality developers like Sino Landand SHKP at attractive valuations. We recommend switching from the prop‐erty landlords into the developers like SIno Land, SHKP and Hang LungProperties.
Tony TsangResearch Analyst(+852) 2203 [email protected]
Venant ChiangResearch Analyst(+852) 2203 [email protected]
Jason Ching, CFAResearch Analyst(+852) 2203 [email protected]
18 January 2011 Strategy Asia Equities Daily Focus
Deutsche Bank AG/Hong Kong Page 31
Asia TaiwanTechnology Hardware & Equipment
17 Jan 2011 - 03:12:59 PM CST
COMPANY ALERT Company Update
Asustek Buy
Asustek to sell Pegatron shares; reiterating Buy
Reuters:2357.TW Exchange:TAI Ticker:2357
Price (TWD) 260.00
Price target (TWD) 285.00
52-week range (TWD) 327.17 -210.00
Market cap (USDm) 5,708
Shares outstanding (m) 2,141.2
Net debt/equity (%) -37.6
Book value/share (TWD) 51.56
Price/book (x) 5.04
FYE 12/31 2009A 2010E 2011E
Sales(TWDm)
248,179 318,189 342,110
Net Profit(TWDm)
12,616.8 15,972.4 14,208.5
DB EPS(TWD)
2.95 7.36 22.27
PER (x) 75.3 35.3 11.7
Yield (net)(%)
0.9 1.4 4.3
Asustek has applied to the regulator to sell 277m shares (or 12%) of Pega-tron through block trades from 18 January to 17 February (Source : Com-mercial Times). This event is supportive of our turn-around/restructuringthesis for Asustek. We think the Pegatron spinoff would benefit bothAsustek and Pegatron as it should reduce conflicts of interest betweenAsustek's brand business and Pegatron's ODM business. We reiterate Buyand our target price of NT$285.If Asustek is able to successfully dispose of Pegatron shares at the currentmarket price of NT$40, we expect the following:We estimate the potential share disposal would generate NT$11bn cash forAsustek (based on Pegatron's current share price of NT$39.7). This wouldincrease Asustek's net cash position from NT$30bn to NT$41bn (or 25% ofits market cap). We believe Asustek could deploy its excess cash to pay outmore dividend and/or invest more to grow its brand business. Asustek couldalso recognize the potential NT$11bn one-off investment income in case itcompletes the Pegatron disposal at NT$40. This could increase Asustek'sreported EPS by 59% to NT$35.4 for 2011E. The disposal would not affectour current NT$285 intrinsic value estimate for Asustek. Our intrinsic valueestimate comprises NT$235 for Asustek brand, NT$35 for the Pegatronholding (we value Pegatron at NT$40/share) and NT$15 for excess cash(based on 30% discount of Asustek's current net cash of NT$30bn) . Afterthe disposal, Asustek would still own 12% of Pegatron shares. Regulationsallow Asustek to sell its remaining 12% holding from 24 June 2011.
Kc Kao, MBAResearch Analyst(+886) 2 2192 [email protected]
Ivy LeeResearch Associate(+886) 2 2192 [email protected]
18 January 2011 Strategy Asia Equities Daily Focus
Page 32 Deutsche Bank AG/Hong Kong
Asia ASEAN Singapore Property Property
17 January 2011
Ascendas Real Estate Reuters: AEMN.SI Bloomberg: AREIT SP Exchange: SES Ticker: AEMN
3Q slightly below forecast; regional opportunities beckonGregory Lui, CFA Strategist (+65) 6423 5958 [email protected]
Elaine Khoo, CFA Research Analyst (+65) 6423 6435 [email protected]
Muted 3Q; seeking growth abroad AREIT’s 3Q was slightly below forecast on retained income and more muted rental reversions. However, the demand outlook is encouraging with recovering spot rents, rising enquiries for space and rebounding occupancy. Its announced expansion in investment scope to the region suggests a more active stance on acquisitions after having lagged peers last year. The resumption in BTS projects and AEIs undertaken should also help enhance its growth profile. Maintain Buy.
Forecasts and ratios
Year End Mar 31 2009A 2010A 2011E 2012E 2013E
Sales (SGDm) 396.5 413.7 449.6 457.6 481.8
Reported NPAT (SGDm) 94.4 148.0 292.8 254.2 266.4
Reported EPS FD(SGD) 0.06 0.08 0.16 0.14 0.14
PER (x) 33.1 22.1 13.9 16.1 15.4
DPU (SGD) 0.15 0.13 0.14 0.14 0.14
Yield (%) 8.2 7.5 6.2 6.3 6.6Source: Deutsche Bank estimates, company data
1 DB EPS is fully diluted and excludes non-recurring items 2 Multiples and yields calculations use average historical prices for past years and spot prices for current and future years, except P/B which uses the year end close
Deutsche Bank AG/Hong Kong
Results
Buy Price at 14 Jan 2011 (SGD) 2.18Price target - 12mth (SGD) 2.3352-week range (SGD) 2.29 - 1.82Straits Times Index 3,246
Key changes
Sales(FYE) 451 to 450 -0.2%Op prof margin (FYE) 70.4 to 70.3 -0.1%Net profit(FYE) 252.2 to 292.8 16.1%
Price/price relative
0.8
1.2
1.6
2.0
2.4
2.8
1/09 4/09 7/09 10/09 1/10 4/10 7/10 10/10Ascendas Real Estate
Straits Times Index (Rebased)
Performance (%) 1m 3m 12mAbsolute 5.3 4.8 7.4Straits Times Index 2.2 1.6 11.6
Stock data
Market cap (SGDm) 4,085Market cap (USDm) 3,171Shares outstanding (m) 1,873.1Major shareholders Ascendas (20.6%)Free float (%) 65Avg daily value traded (USDm) 9.5
Key indicators (FY1)
ROE (%) 9.9Net debt/equity (%) 56.7Book value/share (SGD) 1.60Price/book (x) 1.4Net interest cover (x) 4.7Operating profit margin (%) 70.3
Co
mp
any
Glo
bal
Mar
kets
Res
earc
h
3QFY11 DPU of 3.29cts (+0.6% YoY, -0.3% QoQ) slightly below DBe of 3.42cts 3Q distributable income rose 0.8% YoY on the back of a 2% NPI increase. AREIT retained S$1.1m in 3Q (S$4.5m YTD) pending IRAS approval for tax transparency which will be fully distributed. Incld this, 9M10 DPU would have risen 4% to 10.2cts vs +1.5%. AREIT completed Ph 2, Plot 8 CBP (100% leased by Citibank) within budget & ahead of schedule in Dec 10 achieving a revaluation gain of S$43m or 123% above the devt cost. Occupancy rate for MTBs has bottomed out, improving fr 90.5% in 2Q to 91.1% (overall occupancy 95.6%). Revenue for 3Q was dampened by negative rent reversions (-4 to -9% for biz park & hi-tech industrial) although new take-up rates rose 6-12% for light industrial & biz park.
11th development project announced; regional acquisitions on the cards AREIT has embarked on a BTS of a logistics facility in the East of SG for S$35.9m which is pre-committed to a MNC for an initial tenure of 10yrs with annual rental escalation (est. yield of 8+%, annualized pro-forma FY10 DPU of 0.037cts). Mgmt also recently announced that it is actively exploring investment opportunities in China & the region. With gearing of 34.7%, it can fully debt fund S$930m of acquisitions before breaching 45% which could potentially enhance its FY12 DPU growth (DBe+1.7%) with relatively muted underlying growth trend. Mgmt is also evaluating the 2 tranches of industrial properties being divested by JTC.
Maintain Buy with DDM-pegged TP of S$2.33; risks We fine-tune our forecast post-3Q results and incorporate the latest BTS resulting in a minor +/- 0.3-1% change in FY11-13e DPU (FY11 DPU of 13.58cts). AREIT is trading at 1.36x P/B (LT avg of 1.33x) and offering FY11e and FY12e yield of 6.3% and 6.4% respectively implying a 366bps spread over the 10-year bond. Risks: reversal of growth trends affecting leasing demand, credit risk from tenants on long sale & leaseback leases, development risk and deterioration in credit markets.
18 January 2011 Strategy Asia Equities Daily Focus
Deutsche Bank AG/Hong Kong Page 33
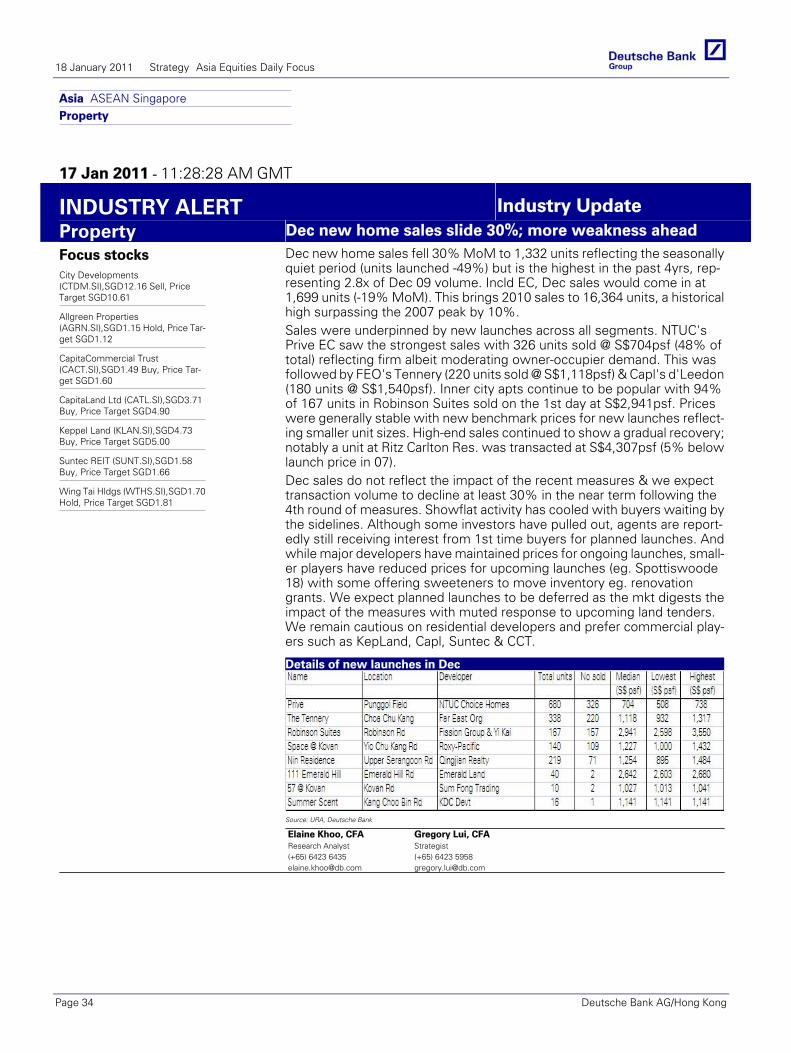
Asia ASEAN SingaporeProperty
17 Jan 2011 - 11:28:28 AM GMT
INDUSTRY ALERT Industry UpdateProperty Dec new home sales slide 30%; more weakness ahead
Focus stocksCity Developments(CTDM.SI),SGD12.16 Sell, PriceTarget SGD10.61
Allgreen Properties(AGRN.SI),SGD1.15 Hold, Price Tar‐get SGD1.12
CapitaCommercial Trust(CACT.SI),SGD1.49 Buy, Price Tar‐get SGD1.60
CapitaLand Ltd (CATL.SI),SGD3.71Buy, Price Target SGD4.90
Keppel Land (KLAN.SI),SGD4.73Buy, Price Target SGD5.00
Suntec REIT (SUNT.SI),SGD1.58Buy, Price Target SGD1.66
Wing Tai Hldgs (WTHS.SI),SGD1.70Hold, Price Target SGD1.81
Dec new home sales fell 30% MoM to 1,332 units reflecting the seasonallyquiet period (units launched ‐49%) but is the highest in the past 4yrs, rep‐resenting 2.8x of Dec 09 volume. Incld EC, Dec sales would come in at1,699 units (‐19% MoM). This brings 2010 sales to 16,364 units, a historicalhigh surpassing the 2007 peak by 10%.Sales were underpinned by new launches across all segments. NTUC'sPrive EC saw the strongest sales with 326 units sold @ S$704psf (48% oftotal) reflecting firm albeit moderating owner‐occupier demand. This wasfollowed by FEO's Tennery (220 units sold @ S$1,118psf) & Capl's d'Leedon(180 units @ S$1,540psf). Inner city apts continue to be popular with 94%of 167 units in Robinson Suites sold on the 1st day at S$2,941psf. Priceswere generally stable with new benchmark prices for new launches reflect‐ing smaller unit sizes. High‐end sales continued to show a gradual recovery;notably a unit at Ritz Carlton Res. was transacted at S$4,307psf (5% belowlaunch price in 07).Dec sales do not reflect the impact of the recent measures & we expecttransaction volume to decline at least 30% in the near term following the4th round of measures. Showflat activity has cooled with buyers waiting bythe sidelines. Although some investors have pulled out, agents are report‐edly still receiving interest from 1st time buyers for planned launches. Andwhile major developers have maintained prices for ongoing launches, small‐er players have reduced prices for upcoming launches (eg. Spottiswoode18) with some offering sweeteners to move inventory eg. renovationgrants. We expect planned launches to be deferred as the mkt digests theimpact of the measures with muted response to upcoming land tenders.We remain cautious on residential developers and prefer commercial play‐ers such as KepLand, Capl, Suntec & CCT.
Details of new launches in Dec
Source: URA, Deutsche Bank
Elaine Khoo, CFAResearch Analyst(+65) 6423 [email protected]
Gregory Lui, CFAStrategist(+65) 6423 [email protected]
18 January 2011 Strategy Asia Equities Daily Focus
Page 34 Deutsche Bank AG/Hong Kong

Asia ASEAN Malaysia Property Property
17 January 2011
SP Setia Reuters: SETI.KL Bloomberg: SPSB MK Exchange: KLS Ticker: SETI
Secures prime land; proposes placement and bonus issueAun-Ling Chia, CFA Research Analyst (+60) 3 2053 6768 [email protected]
Cementing premier builder position with more land; maintaining buy SP Setia's latest land swap deal should not only enhance its medium-term growth prospects with a 30% boost to remaining GDV, but also unlock and add value to its existing landbank. Though the proposed new placement could translate into near-term EPS dilution, the impact is minimised by the current premium valuation and its ability to expedite existing projects to tap today’s strong property market.
Forecasts and ratios
Year End Oct 31 2009A 2010A 2011E 2012E 2013E
Sales (MYRm) 1,408.4 1,745.9 2,097.0 2,474.5 3,213.1
EBITDA (MYRm) 214.1 259.2 351.2 484.8 633.2
Reported NPAT (MYRm) 171.2 251.8 265.3 365.2 473.6
Reported EPS FD(MYR) 0.16 0.23 0.24 0.32 0.43
DB EPS FD (MYR) 0.16 0.23 0.24 0.32 0.43
DB EPS growth (%) -10.6 43.0 5.0 35.5 33.3
PER (x) 22.7 18.2 28.0 20.7 15.5
EV/EBITDA (x) 19.5 18.2 21.4 15.8 11.0
DPS (net) (MYR) 0.10 0.15 0.15 0.20 0.24
Yield (net) (%) 2.9 3.6 2.2 2.9 3.6Source: Deutsche Bank estimates, company data
1 DB EPS is fully diluted and excludes non-recurring items 2 Multiples and yields calculations use average historical prices for past years and spot prices for current and future years, except P/B which uses the year end close
Deutsche Bank AG/Hong Kong
Company Update
Buy Price at 17 Jan 2011 (MYR) 6.70Price target - 12mth (MYR) 7.3552-week range (MYR) 6.93 - 3.66KLSE COMPOSITE 1,574
Price/price relative
2.0
3.0
4.0
5.0
6.0
7.0
1/09 4/09 7/09 10/09 1/10 4/10 7/10 10/10SP Setia
KLSE COMPOSITE (Rebased)
Performance (%) 1m 3m 12mAbsolute 20.9 37.3 61.1KLSE COMPOSITE 5.0 5.7 21.2
Stock data
Market cap (MYRm) 6,811Market cap (USDm) 2,227Shares outstanding (m) 1,016.7Major shareholders PNB (26.7%)Free float (%) 88Avg daily value traded (USDm) 4.1
Key indicators (FY1)
ROE (%) 12.5Net debt/equity (%) 33.1Book value/share (MYR) 2.26Price/book (x) 3.0Net interest cover (x) 425.1Operating profit margin (%) 16.2
Co
mp
any
A sweet land swap deal; we estimate 30% boost to remaining GDV SP Setia, via a 50% associate, has secured the government’s approval in principle to develop a new National Health Institute at its existing Setia Alam township. In return, SP Setia will develop 40 acres of prime government land in Bangsar. While detailed pricing for the land deal is still being worked out, this swap allows SP Setia to (i) develop prime Bangsar land with what we estimate to be a potential GDV of RM9.5bn, boosting domestic GDV by 30%; and (ii) enhance and unlock existing Setia Alam land value, which made up half of SP Setia’s existing landbank.
Proposing up to 15% private placement; 1-for-2 bonus issue SP Setia proposes to issue up to 15% new private placement, raising c. RM1.0bn at the current share price, to fund and expedite existing projects (i.e., KL Eco City, Setia City and Melbourne Fulton Lane) and new land deals. On our current forecasts, the proposed placement could dilute FY12E EPS by 8%, assuming no changes in project launches. This is, however, positive in the mid term as it beefs up its war chest to fully capitalise on the current property up-cycle. It is also likely to be NAV accretive as the stock currently trades at a 9% premium to NAV.
Target price of RM7.35 excludes new land deal and proposed placement Our current target price of RM7.35 is pegged at a 20% premium to FY11 NAV, which does not include new land banking deals or the proposed placement. We believe the Bangsar land deal is NAV accretive but will wait for pricing details before estimating the impact. The NAV premium reflects the robust operating landscape and exciting growth opportunities. Key risks: delay in new property launches and therefore lower sales; any government property cooling measures.
18 January 2011 Strategy Asia Equities Daily Focus
Deutsche Bank AG/Hong Kong Page 35
Asia IndiaBanking/Finance Banks
17 Jan 2011 - 01:56:46 PM IST
INDUSTRY ALERT Industry UpdateBanks Magma call indicates upbeat prospects for CV & auto finance
Focus stocksShriram Transport Finance(SRTR.BO),INR723.50 Buy, PriceTarget INR960.00
HDFC Bank(HDBK.BO),INR2,053.00 Buy, PriceTarget INR2,715.00
State Bank of India(SBI.BO),INR2,502.25 Hold, PriceTarget INR2,880.00
***Magma Fincorp (MAGM.BO, unrated, INR 62.90) indicated on a confer‐ence call that the demand for commercial vehicle (CV) loans and auto loansis very strong. But for supply constraints on the part of manufacturers, vol‐ume growth could even be higher. They expect both CV and auto loans togrow at 20‐25% in the medium term.
***They also expect demand for construction equipment (CE) loans to re‐main robust given the focus on infrastructure in the 11th and 12th Five Yearplans.
***The company intends to increase the share of high‐yield segments ‐used CV, tractors and SME loans in order to maintain NIM as the cost offunds increases.
***We believe that this augurs well for Shriram Transport Finance (STFC)as it is the market leader in used CV financing. Given the growth outlook forconstruction equipment (CE) sector, STFC has recently started a subsidiaryto focus on CE finance. While CE is a small portion of total AuM, it is ex‐pected to grow rapidly over the next 2‐3 years.
***The strong demand for auto loans should benefit HDFC Bank and SBIwhich are the largest players in the segment. The strong demand in thesegment has also been corroborated by our earlier meetings with car deal‐ers, credit operations staff of some banks and credit rating agencies.
***We have Buy rating on STFC and HDFC Bank and Hold rating onSBI.
Manish ShuklaResearch Analyst(+91) 22 6658 [email protected]
Dipankar ChoudhuryResearch Analyst(+91) 22 6658 [email protected]
18 January 2011 Strategy Asia Equities Daily Focus
Page 36 Deutsche Bank AG/Hong Kong
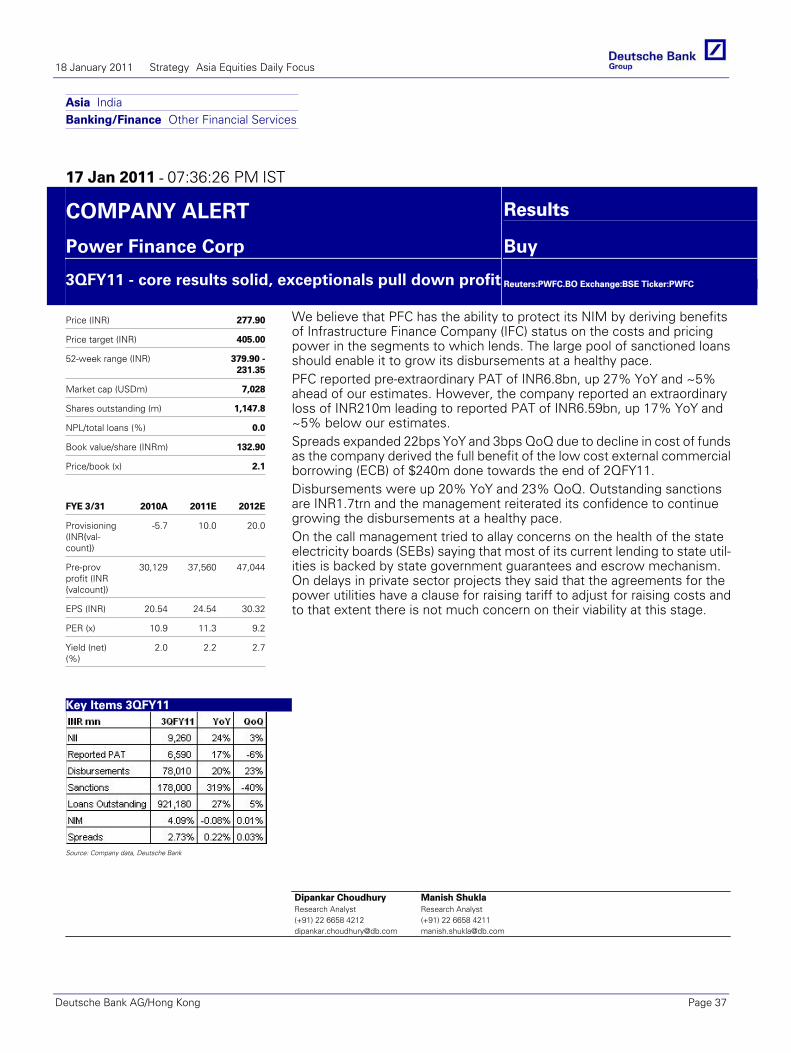
Asia IndiaBanking/Finance Other Financial Services
17 Jan 2011 - 07:36:26 PM IST
COMPANY ALERT Results
Power Finance Corp Buy
3QFY11 - core results solid, exceptionals pull down profit
Reuters:PWFC.BO Exchange:BSE Ticker:PWFC
Price (INR) 277.90
Price target (INR) 405.00
52-week range (INR) 379.90 -231.35
Market cap (USDm) 7,028
Shares outstanding (m) 1,147.8
NPL/total loans (%) 0.0
Book value/share (INRm) 132.90
Price/book (x) 2.1
FYE 3/31 2010A 2011E 2012E
Provisioning(INR{val-count})
-5.7 10.0 20.0
Pre-provprofit (INR{valcount})
30,129 37,560 47,044
EPS (INR) 20.54 24.54 30.32
PER (x) 10.9 11.3 9.2
Yield (net)(%)
2.0 2.2 2.7
Key Items 3QFY11
Source: Company data, Deutsche Bank
We believe that PFC has the ability to protect its NIM by deriving benefitsof Infrastructure Finance Company (IFC) status on the costs and pricingpower in the segments to which lends. The large pool of sanctioned loansshould enable it to grow its disbursements at a healthy pace.PFC reported pre-extraordinary PAT of INR6.8bn, up 27% YoY and ~5%ahead of our estimates. However, the company reported an extraordinaryloss of INR210m leading to reported PAT of INR6.59bn, up 17% YoY and~5% below our estimates.Spreads expanded 22bps YoY and 3bps QoQ due to decline in cost of fundsas the company derived the full benefit of the low cost external commercialborrowing (ECB) of $240m done towards the end of 2QFY11.Disbursements were up 20% YoY and 23% QoQ. Outstanding sanctionsare INR1.7trn and the management reiterated its confidence to continuegrowing the disbursements at a healthy pace.On the call management tried to allay concerns on the health of the stateelectricity boards (SEBs) saying that most of its current lending to state util-ities is backed by state government guarantees and escrow mechanism.On delays in private sector projects they said that the agreements for thepower utilities have a clause for raising tariff to adjust for raising costs andto that extent there is not much concern on their viability at this stage.
Dipankar ChoudhuryResearch Analyst(+91) 22 6658 [email protected]
Manish ShuklaResearch Analyst(+91) 22 6658 [email protected]
18 January 2011 Strategy Asia Equities Daily Focus
Deutsche Bank AG/Hong Kong Page 37
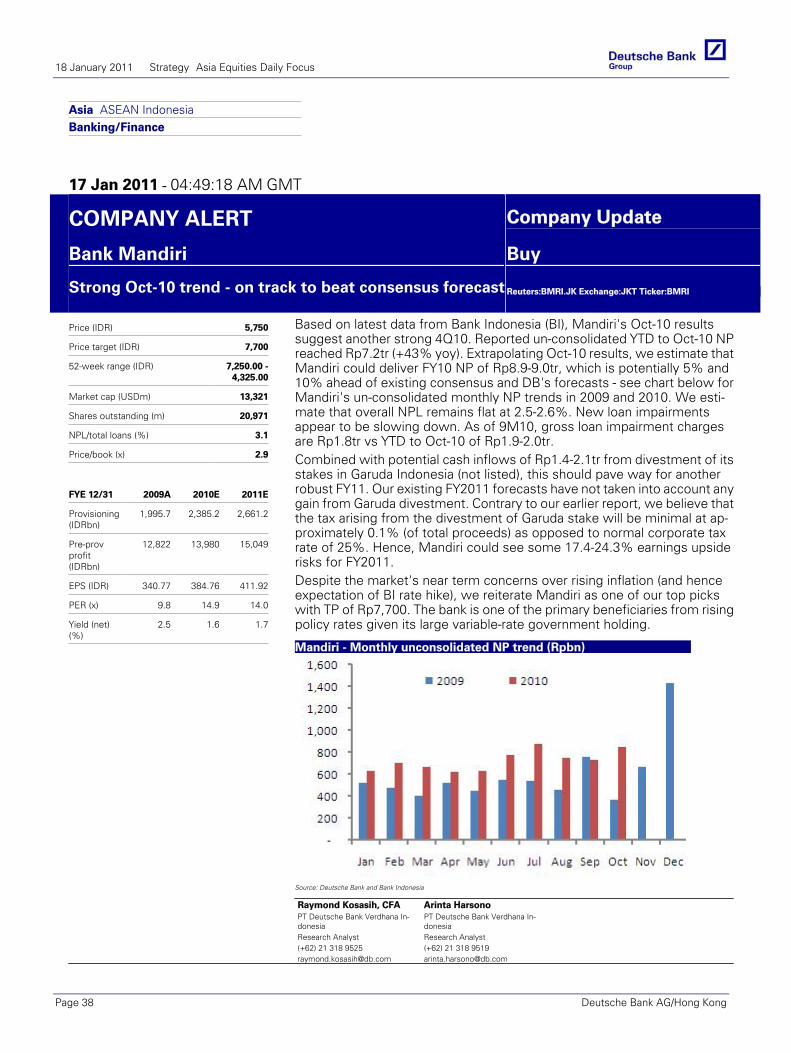
Asia ASEAN IndonesiaBanking/Finance
17 Jan 2011 - 04:49:18 AM GMT
COMPANY ALERT Company Update
Bank Mandiri Buy
Strong Oct-10 trend - on track to beat consensus forecast
Reuters:BMRI.JK Exchange:JKT Ticker:BMRI
Price (IDR) 5,750
Price target (IDR) 7,700
52-week range (IDR) 7,250.00 -4,325.00
Market cap (USDm) 13,321
Shares outstanding (m) 20,971
NPL/total loans (%) 3.1
Price/book (x) 2.9
FYE 12/31 2009A 2010E 2011E
Provisioning(IDRbn)
1,995.7 2,385.2 2,661.2
Pre-provprofit(IDRbn)
12,822 13,980 15,049
EPS (IDR) 340.77 384.76 411.92
PER (x) 9.8 14.9 14.0
Yield (net)(%)
2.5 1.6 1.7
Based on latest data from Bank Indonesia (BI), Mandiri's Oct-10 resultssuggest another strong 4Q10. Reported un-consolidated YTD to Oct-10 NPreached Rp7.2tr (+43% yoy). Extrapolating Oct-10 results, we estimate thatMandiri could deliver FY10 NP of Rp8.9-9.0tr, which is potentially 5% and10% ahead of existing consensus and DB's forecasts - see chart below forMandiri's un-consolidated monthly NP trends in 2009 and 2010. We esti-mate that overall NPL remains flat at 2.5-2.6%. New loan impairmentsappear to be slowing down. As of 9M10, gross loan impairment chargesare Rp1.8tr vs YTD to Oct-10 of Rp1.9-2.0tr.Combined with potential cash inflows of Rp1.4-2.1tr from divestment of itsstakes in Garuda Indonesia (not listed), this should pave way for anotherrobust FY11. Our existing FY2011 forecasts have not taken into account anygain from Garuda divestment. Contrary to our earlier report, we believe thatthe tax arising from the divestment of Garuda stake will be minimal at ap-proximately 0.1% (of total proceeds) as opposed to normal corporate taxrate of 25%. Hence, Mandiri could see some 17.4-24.3% earnings upsiderisks for FY2011.Despite the market's near term concerns over rising inflation (and henceexpectation of BI rate hike), we reiterate Mandiri as one of our top pickswith TP of Rp7,700. The bank is one of the primary beneficiaries from risingpolicy rates given its large variable-rate government holding.
Mandiri - Monthly unconsolidated NP trend (Rpbn)
Source: Deutsche Bank and Bank Indonesia
Raymond Kosasih, CFAPT Deutsche Bank Verdhana In-donesiaResearch Analyst(+62) 21 318 [email protected]
Arinta HarsonoPT Deutsche Bank Verdhana In-donesiaResearch Analyst(+62) 21 318 [email protected]
18 January 2011 Strategy Asia Equities Daily Focus
Page 38 Deutsche Bank AG/Hong Kong
Asia ASEAN Indonesia Banking/Finance
17 January 2011
DB Indonesia Banking Rate convergence
Raymond Kosasih, CFA PT Deutsche Bank Verdhana Indonesia Research Analyst (+62) 21 318 9525 [email protected]
Arinta Harsono PT Deutsche Bank Verdhana Indonesia Research Analyst (+62) 21 318 9519 [email protected]
More apparent lending rate decline; BBNI/BMRI/BBCA as top picks Despite growing inflation concerns (and subsequent rate increases), Indonesia’s banking sector remains fundamentally robust. For 2011, we project loan growth of 20-25% (vs BI's 19-23%). Despite risks of a policy rate hike, the existing interest rate environment remains conducive and is structurally below the level of the last decade. Hence, competition should keep lending rates tight, particularly when the rate gap over the policy rates is 500bps. In this environment, banks with low COF and more liquidity will outperform their peers over the longer term.
Deutsche Bank AG/Hong Kong
Industry Update
Top picks BCA (BBCA.JK),IDR6,050.00 BuyBNI (BBNI.JK),IDR3,350.00 BuyBank Mandiri (BMRI.JK),IDR5,750.00 Buy
Companies featured
BCA (BBCA.JK),IDR6,050.00 Buy2009A 2010E 2011E
P/E (x) 13.7 18.6 17.9Div yield (%) 2.9 2.1 2.2Price/book (x) 4.3 4.6 4.1BNI (BBNI.JK),IDR3,350.00 Buy
2009A 2010E 2011EP/E (x) 9.2 13.2 13.1Div yield (%) 3.0 1.2 1.2Price/book (x) 1.6 2.3 1.7Bank Mandiri (BMRI.JK),IDR5,750.00 Buy
2009A 2010E 2011EP/E (x) 9.8 14.9 14.0Div yield (%) 2.5 1.6 1.7Price/book (x) 2.8 2.9 2.6BRI (BBRI.JK),IDR5,150.00 Buy
2009A 2010E 2011EP/E (x) 21.1 14.3 12.6Div yield (%) 2.1 2.1 2.5Price/book (x) 6.9 3.8 3.1Danamon (BDMN.JK),IDR5,300.00 Hold
2009A 2010E 2011EP/E (x) 20.5 17.1 16.3Div yield (%) 2.0 2.3 2.4Price/book (x) 2.4 2.5 2.3
Lending competition driving down rates for new loans (2) Our latest data suggests that lending competition continues, particularly when the rate gap (between lending and policy rates) is still over 500bps. Indeed, based on Bank of Indonesia’s (BI) Nov-10 data, the average lending rate in the system is approximately 13.3%, which implies a rate gap of 680bps over the policy rate. For new loans disbursed YTD-to-Nov10, we estimate lending rates of 11.5%, down from 11.7% in Aug-10. This represents a decline of 250-350bps from average loan rates of 14% in 2009 and 15% in 2008. Consequently, as the portion of new loans grows, the decline in blended lending rates should become more visible. Moreover, BI’s new regulations pertaining to prime lending rate disclosures (implementation in Mar-11) could induce competition further, driving lending rates lower.
Exposing banks with higher rates Among three loan segments, consumer loans have posted the biggest decline in rates of 480bps (to 11.6% for YTD-Nov2010 new loans) vs 180bps (to 11.9%) for working capital and 230bps (to 10.7%) for investment loans. In addition to possibly changes in the consumer loan mix, the decline may reflect greater competition risks in the higher-yielding loans. Consequently, banks that have greater exposure to (high yield) consumer loans would have higher long-term competition risks.
Our long-term overweight view remains with BBNI/BMRI/BBCA as top picks We maintain our overweight call on the sector. However, in the near term, the sector has been under pressure primarily reflecting concerns over rising inflation (and subsequent increase in policy rates). Still, we believe that a policy rate increase would have a minimal implication in curbing inflation; hence future rate hikes would be manageable. We derive our target prices based on the Gordon Growth model – see inside for details. Key risks are regulatory changes and macroeconomic downturns.
18 January 2011 Strategy Asia Equities Daily Focus
Deutsche Bank AG/Hong Kong Page 39
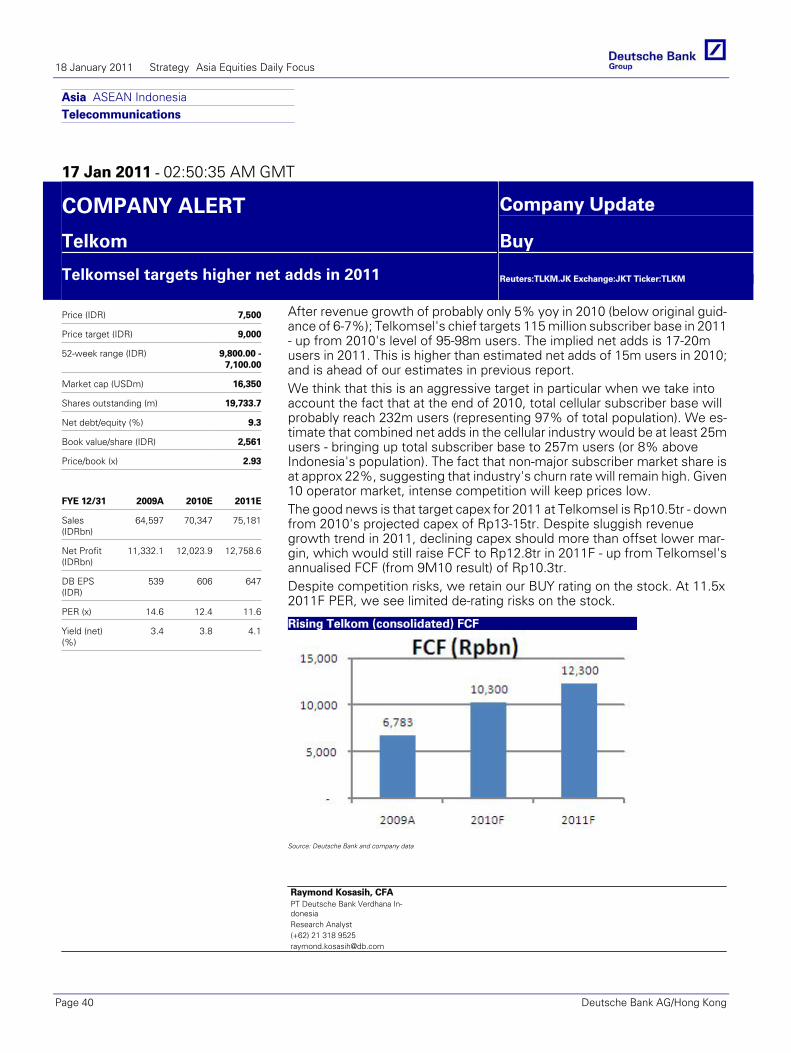
Asia ASEAN IndonesiaTelecommunications
17 Jan 2011 - 02:50:35 AM GMT
COMPANY ALERT Company Update
Telkom Buy
Telkomsel targets higher net adds in 2011
Reuters:TLKM.JK Exchange:JKT Ticker:TLKM
Price (IDR) 7,500
Price target (IDR) 9,000
52-week range (IDR) 9,800.00 -7,100.00
Market cap (USDm) 16,350
Shares outstanding (m) 19,733.7
Net debt/equity (%) 9.3
Book value/share (IDR) 2,561
Price/book (x) 2.93
FYE 12/31 2009A 2010E 2011E
Sales(IDRbn)
64,597 70,347 75,181
Net Profit(IDRbn)
11,332.1 12,023.9 12,758.6
DB EPS(IDR)
539 606 647
PER (x) 14.6 12.4 11.6
Yield (net)(%)
3.4 3.8 4.1
After revenue growth of probably only 5% yoy in 2010 (below original guid-ance of 6-7%); Telkomsel's chief targets 115 million subscriber base in 2011- up from 2010's level of 95-98m users. The implied net adds is 17-20musers in 2011. This is higher than estimated net adds of 15m users in 2010;and is ahead of our estimates in previous report.We think that this is an aggressive target in particular when we take intoaccount the fact that at the end of 2010, total cellular subscriber base willprobably reach 232m users (representing 97% of total population). We es-timate that combined net adds in the cellular industry would be at least 25musers - bringing up total subscriber base to 257m users (or 8% aboveIndonesia's population). The fact that non-major subscriber market share isat approx 22%, suggesting that industry's churn rate will remain high. Given10 operator market, intense competition will keep prices low.The good news is that target capex for 2011 at Telkomsel is Rp10.5tr - downfrom 2010's projected capex of Rp13-15tr. Despite sluggish revenuegrowth trend in 2011, declining capex should more than offset lower mar-gin, which would still raise FCF to Rp12.8tr in 2011F - up from Telkomsel'sannualised FCF (from 9M10 result) of Rp10.3tr.Despite competition risks, we retain our BUY rating on the stock. At 11.5x2011F PER, we see limited de-rating risks on the stock.
Rising Telkom (consolidated) FCF
Source: Deutsche Bank and company data
Raymond Kosasih, CFAPT Deutsche Bank Verdhana In-donesiaResearch Analyst(+62) 21 318 [email protected]
18 January 2011 Strategy Asia Equities Daily Focus
Page 40 Deutsche Bank AG/Hong Kong
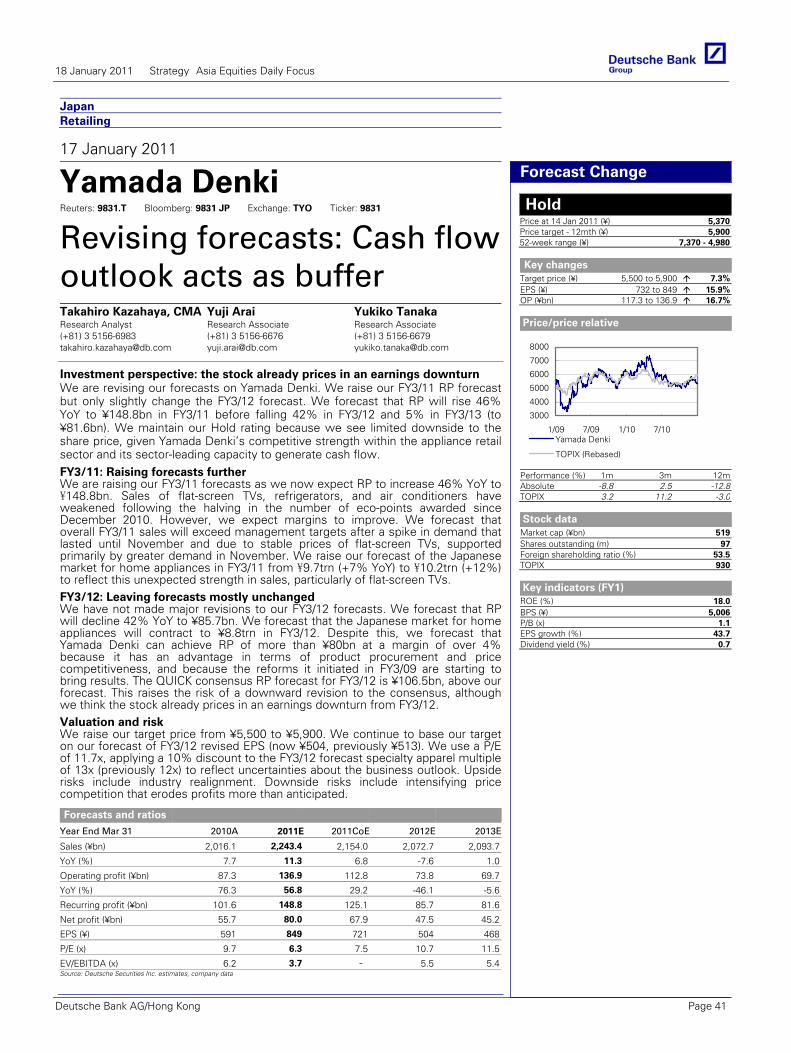
Japan Retailing
17 January 2011
Yamada Denki Reuters: 9831.T Bloomberg: 9831 JP Exchange: TYO Ticker: 9831
Revising forecasts: Cash flow outlook acts as buffer Takahiro Kazahaya, CMA Research Analyst (+81) 3 5156-6983 [email protected]
Yuji Arai Research Associate (+81) 3 5156-6676 [email protected]
Yukiko Tanaka Research Associate (+81) 3 5156-6679 [email protected]
Investment perspective: the stock already prices in an earnings downturn We are revising our forecasts on Yamada Denki. We raise our FY3/11 RP forecast but only slightly change the FY3/12 forecast. We forecast that RP will rise 46% YoY to ¥148.8bn in FY3/11 before falling 42% in FY3/12 and 5% in FY3/13 (to ¥81.6bn). We maintain our Hold rating because we see limited downside to the share price, given Yamada Denki’s competitive strength within the appliance retail sector and its sector-leading capacity to generate cash flow.
Forecasts and ratios
Year End Mar 31 2010A 2011E 2011CoE 2012E 2013E
Sales (¥bn) 2,016.1 2,243.4 2,154.0 2,072.7 2,093.7
YoY (%) 7.7 11.3 6.8 -7.6 1.0
Operating profit (¥bn) 87.3 136.9 112.8 73.8 69.7
YoY (%) 76.3 56.8 29.2 -46.1 -5.6
Recurring profit (¥bn) 101.6 148.8 125.1 85.7 81.6
Net profit (¥bn) 55.7 80.0 67.9 47.5 45.2
EPS (¥) 591 849 721 504 468
P/E (x) 9.7 6.3 7.5 10.7 11.5
EV/EBITDA (x) 6.2 3.7 – 5.5 5.4Source: Deutsche Securities Inc. estimates, company data
Forecast Change
Hold Price at 14 Jan 2011 (¥) 5,370Price target - 12mth (¥) 5,90052-week range (¥) 7,370 - 4,980
Key changes
Target price (¥) 5,500 to 5,900 7.3%EPS (¥) 732 to 849 15.9%OP (¥bn) 117.3 to 136.9 16.7%
Price/price relative
3000
4000
5000
6000
7000
8000
1/09 7/09 1/10 7/10Yamada Denki
TOPIX (Rebased)
Performance (%) 1m 3m 12mAbsolute -8.8 2.5 -12.8TOPIX 3.2 11.2 -3.0
Stock data
Market cap (¥bn) 519Shares outstanding (m) 97Foreign shareholding ratio (%) 53.5TOPIX 930
Key indicators (FY1)
ROE (%) 18.0BPS (¥) 5,006P/B (x) 1.1EPS growth (%) 43.7Dividend yield (%) 0.7
FY3/11: Raising forecasts further We are raising our FY3/11 forecasts as we now expect RP to increase 46% YoY to ¥148.8bn. Sales of flat-screen TVs, refrigerators, and air conditioners have weakened following the halving in the number of eco-points awarded since December 2010. However, we expect margins to improve. We forecast that overall FY3/11 sales will exceed management targets after a spike in demand that lasted until November and due to stable prices of flat-screen TVs, supported primarily by greater demand in November. We raise our forecast of the Japanese market for home appliances in FY3/11 from ¥9.7trn (+7% YoY) to ¥10.2trn (+12%) to reflect this unexpected strength in sales, particularly of flat-screen TVs. FY3/12: Leaving forecasts mostly unchanged We have not made major revisions to our FY3/12 forecasts. We forecast that RP will decline 42% YoY to ¥85.7bn. We forecast that the Japanese market for home appliances will contract to ¥8.8trn in FY3/12. Despite this, we forecast that Yamada Denki can achieve RP of more than ¥80bn at a margin of over 4% because it has an advantage in terms of product procurement and price competitiveness, and because the reforms it initiated in FY3/09 are starting to bring results. The QUICK consensus RP forecast for FY3/12 is ¥106.5bn, above our forecast. This raises the risk of a downward revision to the consensus, although we think the stock already prices in an earnings downturn from FY3/12. Valuation and risk We raise our target price from ¥5,500 to ¥5,900. We continue to base our target on our forecast of FY3/12 revised EPS (now ¥504, previously ¥513). We use a P/E of 11.7x, applying a 10% discount to the FY3/12 forecast specialty apparel multiple of 13x (previously 12x) to reflect uncertainties about the business outlook. Upside risks include industry realignment. Downside risks include intensifying price competition that erodes profits more than anticipated.
18 January 2011 Strategy Asia Equities Daily Focus
Deutsche Bank AG/Hong Kong Page 41
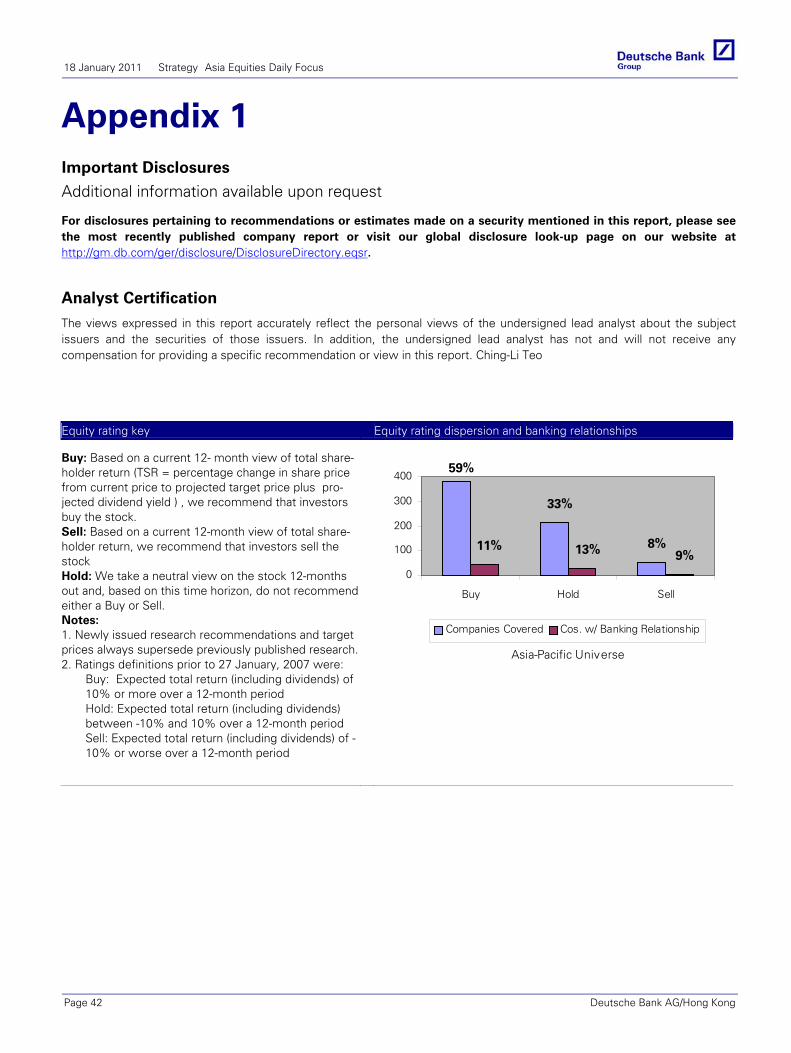
18 January 2011 Strategy Asia Equities Daily Focus
Appendix 1 Important Disclosures
Additional information available upon request
For disclosures pertaining to recommendations or estimates made on a security mentioned in this report, please see the most recently published company report or visit our global disclosure look-up page on our website at http://gm.db.com/ger/disclosure/DisclosureDirectory.eqsr.
Analyst Certification
The views expressed in this report accurately reflect the personal views of the undersigned lead analyst about the subject issuers and the securities of those issuers. In addition, the undersigned lead analyst has not and will not receive any compensation for providing a specific recommendation or view in this report. Ching-Li Teo
Equity rating key Equity rating dispersion and banking relationships Buy: Based on a current 12- month view of total share-holder return (TSR = percentage change in share price from current price to projected target price plus pro-jected dividend yield ) , we recommend that investors buy the stock. Sell: Based on a current 12-month view of total share-holder return, we recommend that investors sell the stock Hold: We take a neutral view on the stock 12-months out and, based on this time horizon, do not recommend either a Buy or Sell. Notes: 1. Newly issued research recommendations and target prices always supersede previously published research.2. Ratings definitions prior to 27 January, 2007 were:
Buy: Expected total return (including dividends) of 10% or more over a 12-month period Hold: Expected total return (including dividends) between -10% and 10% over a 12-month period Sell: Expected total return (including dividends) of -10% or worse over a 12-month period
8%
33%
59%
9%13%11%
0
100
200
300
400
Buy Hold Sell
Asia-Pacific Universe
Companies Covered Cos. w/ Banking Relationship
Page 42 Deutsche Bank AG/Hong Kong
18 January 2011 Strategy Asia Equities Daily Focus
Deutsche Bank AG/Hong Kong Page 43
Regulatory Disclosures
1. Important Additional Conflict Disclosures
Aside from within this report, important conflict disclosures can also be found at https://gm.db.com/equities under the "Disclosures Lookup" and "Legal" tabs. Investors are strongly encouraged to review this information before investing.
2. Short-Term Trade Ideas
Deutsche Bank equity research analysts sometimes have shorter-term trade ideas (known as SOLAR ideas) that are consistent or inconsistent with Deutsche Bank's existing longer term ratings. These trade ideas can be found at the SOLAR link at http://gm.db.com.
3. Country-Specific Disclosures
Australia: This research, and any access to it, is intended only for "wholesale clients" within the meaning of the Australian Corporations Act. Brazil: The views expressed above accurately reflect personal views of the authors about the subject company(ies) and its(their) securities, including in relation to Deutsche Bank. The compensation of the equity research analyst(s) is indirectly affected by revenues deriving from the business and financial transactions of Deutsche Bank. EU countries: Disclosures relating to our obligations under MiFiD can be found at http://globalmarkets.db.com/riskdisclosures. Japan: Disclosures under the Financial Instruments and Exchange Law: Company name - Deutsche Securities Inc. Registration number - Registered as a financial instruments dealer by the Head of the Kanto Local Finance Bureau (Kinsho) No. 117. Member of associations: JSDA, The Financial Futures Association of Japan. Commissions and risks involved in stock transactions - for stock transactions, we charge stock commissions and consumption tax by multiplying the transaction amount by the commission rate agreed with each customer. Stock transactions can lead to losses as a result of share price fluctuations and other factors. Transactions in foreign stocks can lead to additional losses stemming from foreign exchange fluctuations. "Moody's", "Standard & Poor's", and "Fitch" mentioned in this report are not registered as rating agency in Japan unless specifically indicated as Japan entities of such rating agencies. New Zealand: This research is not intended for, and should not be given to, "members of the public" within the meaning of the New Zealand Securities Market Act 1988. Russia: This information, interpretation and opinions submitted herein are not in the context of, and do not constitute, any appraisal or evaluation activity requiring a license in the Russian Federation.
Deutsche Bank AG/Hong Kong
North American locations
Deutsche Bank Securities Inc. 60 Wall Street New York, NY 10005 Tel: (212) 250 2500
Deutsche Bank Securities Inc. One International Place 12th Floor Boston, MA 02110 United States of America Tel: (1) 617 217 6100
Deutsche Bank Securities Inc. 222 South Riverside Plaza 30th Floor Chicago, IL 60606 Tel: (312) 537-3758
Deutsche Bank Securities Inc. 3033 East First Avenue Suite 303, Third Floor Denver, CO 80206 Tel: (303) 394 6800
Deutsche Bank Securities Inc. 1735 Market Street 24th Floor Philadelphia, PA 19103 Tel: (215) 854 1546
Deutsche Bank Securities Inc. 101 California Street 46th Floor San Francisco, CA 94111 Tel: (415) 617 2800
Deutsche Bank Securities Inc. 700 Louisiana Street Houston, TX 77002 Tel: (832) 239-4600
International locations
Deutsche Bank Securities Inc. 60 Wall Street New York, NY 10005 United States of America Tel: (1) 212 250 2500
Deutsche Bank AG London Deutsche Bank AG Deutsche Bank AG 1 Great Winchester Street Große Gallusstraße 10-14 Deutsche Bank Place London EC2N 2EQ 60272 Frankfurt am Main Level 16
United Kingdom Germany Corner of Hunter & Phillip Streets Tel: (44) 20 7545 8000 Tel: (49) 69 910 00 Sydney, NSW 2000
Australia Tel: (61) 2 8258 1234
Deutsche Securities Inc. Deutsche Bank AG Level 55 2-11-1 Nagatacho Cheung Kong Center Sanno Park Tower 2 Queen's Road Central Chiyoda-ku, Tokyo 100-6171 Hong Kong Japan Tel: (852) 2203 8888 Tel: (81) 3 5156 6701
Global Disclaimer The information and opinions in this report were prepared by Deutsche Bank AG or one of its affiliates (collectively "Deutsche Bank"). The information herein is believed to be reliable and has been obtained from public sources believed to be reliable. Deutsche Bank makes no representation as to the accuracy or completeness of such information.
Deutsche Bank may engage in securities transactions, on a proprietary basis or otherwise, in a manner inconsistent with the view taken in this research report. In addition, others within Deutsche Bank, including strategists and sales staff, may take a view that is inconsistent with that taken in this research report.
Opinions, estimates and projections in this report constitute the current judgement of the author as of the date of this report. They do not necessarily reflect the opinions of Deutsche Bank and are subject to change without notice. Deutsche Bank has no obligation to update, modify or amend this report or to otherwise notify a recipient thereof in the event that any opinion, forecast or estimate set forth herein, changes or subsequently becomes inaccurate. Prices and availability of financial instruments are subject to change without notice. This report is provided for informational purposes only. It is not an offer or a solicitation of an offer to buy or sell any financial instruments or to participate in any particular trading strategy. Target prices are inherently imprecise and a product of the analyst judgement.
As a result of Deutsche Bank’s recent acquisition of BHF-Bank AG, a security may be covered by more than one analyst within the Deutsche Bank group. Each of these analysts may use differing methodologies to value the security; as a result, the recommendations may differ and the price targets and estimates of each may vary widely.
Deutsche Bank has instituted a new policy whereby analysts may choose not to set or maintain a target price of certain issuers under coverage with a Hold rating. In particular, this will typically occur for "Hold" rated stocks having a market cap smaller than most other companies in its sector or region. We believe that such policy will allow us to make best use of our resources. Please visit our website at http://gm.db.com to determine the target price of any stock.
The financial instruments discussed in this report may not be suitable for all investors and investors must make their own informed investment decisions. Stock transactions can lead to losses as a result of price fluctuations and other factors. If a financial instrument is denominated in a currency other than an investor's currency, a change in exchange rates may adversely affect the investment. Past performance is not necessarily indicative of future results. Deutsche Bank may with respect to securities covered by this report, sell to or buy from customers on a principal basis, and consider this report in deciding to trade on a proprietary basis.
Unless governing law provides otherwise, all transactions should be executed through the Deutsche Bank entity in the investor's home jurisdiction. In the U.S. this report is approved and/or distributed by Deutsche Bank Securities Inc., a member of the NYSE, the NASD, NFA and SIPC. In Germany this report is approved and/or communicated by Deutsche Bank AG Frankfurt authorized by the BaFin. In the United Kingdom this report is approved and/or communicated by Deutsche Bank AG London, a member of the London Stock Exchange and regulated by the Financial Services Authority for the conduct of investment business in the UK and authorized by the BaFin. This report is distributed in Hong Kong by Deutsche Bank AG, Hong Kong Branch, in Korea by Deutsche Securities Korea Co. This report is distributed in Singapore by Deutsche Bank AG, Singapore Branch, and recipients in Singapore of this report are to contact Deutsche Bank AG, Singapore Branch in respect of any matters arising from, or in connection with, this report. Where this report is issued or promulgated in Singapore to a person who is not an accredited investor, expert investor or institutional investor (as defined in the applicable Singapore laws and regulations), Deutsche Bank AG, Singapore Branch accepts legal responsibility to such person for the contents of this report. In Japan this report is approved and/or distributed by Deutsche Securities Inc. The information contained in this report does not constitute the provision of investment advice. In Australia, retail clients should obtain a copy of a Product Disclosure Statement (PDS) relating to any financial product referred to in this report and consider the PDS before making any decision about whether to acquire the product. Deutsche Bank AG Johannesburg is incorporated in the Federal Republic of Germany (Branch Register Number in South Africa: 1998/003298/10). Additional information relative to securities, other financial products or issuers discussed in this report is available upon request. This report may not be reproduced, distributed or published by any person for any purpose without Deutsche Bank's prior written consent. Please cite source when quoting.
Copyright © 2011 Deutsche Bank AG