Embed Size (px)
Citation preview

International Journal of
Geo-Information
Article
TOD District Planning Based on Residents’ Perspectives
Chia-Nung Li 1,*, Chiang Lin 2 and Tsu-Kuang Hsieh 1
1 Department of Natural Resources, Chinese Culture University, Taipei 11114, Taiwan;[email protected]
2 Graduate Institute of Urban Planning, National Taipei University, New Taipei 23741, Taiwan;[email protected]
* Correspondence: [email protected]; Tel.: +886-2-2861-0511 (ext. 31434)
Academic Editor: Wolfgang KainzReceived: 19 November 2015; Accepted: 8 April 2016; Published: 14 April 2016
Abstract: This study uses the MRT (mass rapid transit system) Banqiao Station as an exampleto explore residents’ satisfaction toward transit-oriented development (TOD) living environmentcharacteristics around the Banqiao MRT station. The study uses descriptive statistics, reliabilityanalysis, the factor analysis method and multiple regression analysis to verify the data, and oneshould expect the study to serve as a reference basis for the government, academia and businesses toformulate urban development and transportation policies. This study shows that residents are mostlysatisfied with a 10-minute walk distance to convenience stores. Furthermore, this study uses the factoranalysis method and thus brings forth five major TOD factors. With stepwise regression analysis, wediscovered that Factors 1 and 2 represent land use and transportation, respectively, while Factor 5represents high-density development, all of which are significantly related to resident satisfaction.Additionally, gender, age, career, educational background and incomes are individual characteristicsthat should be forcibly entered into the regression equation. Only Factors 1 and 5 achieve statisticalsignificance. Finally, the study suggests improvements to the surrounding environments of BanqiaoStation by focusing on the TOD characteristics of design and density, which can increase TODresidential satisfaction and the public health of residents surrounding the MRT Banqiao Station.
Keywords: transit-oriented development; resident satisfaction
1. Introduction
For residents that live in the cities north of Taiwan, a current major problem within their residentialenvironment is a lack of appropriate urban planning, resulting in a lack of comfortable, safe andconvenient walking spaces and transportation services. Although the major cities in Taiwan havealready implemented the concept of transit-oriented development (TOD), their focus was often onlyon the development of mass rapid transit (MRT), leading to the transportation network service beingconfined to certain areas. This causes the traffic flow in areas that lack MRT stations to greatly increaseduring rush hours, consequently causing worse urban congestion and increased air pollution.
Regarding the TOD living environment characteristics, Jing et al. (2010) [1] indicated that thehigher density of development, mixed land use, pleasant walking space environment and high qualityof public highway transportation services are what the TOD living environment characteristics feature.Sung et al. (2011) [2], however, argued that the provisions of transportation services, land use, streetnetworks and urban design are indispensable conditions. Mu and Jong (2012) [3] emphasized thaturban design, governing design, land use, restriction of car use, transportation services and realestate shall instead serve as the evaluation criteria for TOD living environment characteristics. Thisstudy integrates the above ideas and suggests that the TOD living environment characteristics shallcontain five major aspects, including a high-density living environment, mixed land use environment,
ISPRS Int. J. Geo-Inf. 2016, 5, 52; doi:10.3390/ijgi5040052 www.mdpi.com/journal/ijgi

ISPRS Int. J. Geo-Inf. 2016, 5, 52 2 of 18
pedestrian-oriented environment for pleasant walking, a high-quality transport services environmentand the far and near surrounding environment to the public transport stations and public facilities.The purpose of higher density land development is to upgrade the development density to increaseland use efficiency. The purpose of a mixed land use environment is to provide a wide variety ofconvenient services for residents, such as shops, banks, shopping centers/malls, parks, etc. The TODmodel focuses on the comfortable walking environment, which is due to a belief that the provision of acomfortable, safe, convenient and human-based walking environment is of significant importance. Ahigh-quality transport services environment and the far and near surrounding environments to thepublic transport stations and public facilities can both increase convenience for residents and increasetheir satisfaction. In recent years, TOD studies have largely been focused on discussing the effectthat TOD has on land use or economic development issues. Currently, most TOD concept designs inTaiwan are produced from the perspective of planners, without studying any correlations betweenthe TOD surrounding living environments and resident satisfaction. Hence, it is important to discussresident satisfaction, given the knowledge gap in the literature.
Recently, the government has been proactive in developing the New Banqiao Station specialdistrict to be a composite four-railroad system station (high-speed rail, heavy rail, mass rapid railand light rail) and wants it to serve as the new city center. Thus, this study shall take the MRT(mass rapid transit system) Banqiao Station as the case study focus, using 25 TOD living environmentcharacteristics collected from reviewing the literature to serve as the measuring factors. First, itengages a reliability analysis to ensure the results of the questionnaire surveys. Then, based on thosedescriptive statistics, it intends to determine what the residents feel most satisfied or unsatisfied within terms of TOD living environment characteristics. Once the descriptive statistics are completed,the 25 TOD living environment characteristics are categorized by using factor analysis; verificationby a multiple regression analysis, the study intends to identify the connection between TOD livingenvironment characteristics and resident satisfaction, while simultaneously inputting individualresident characteristics, such as gender, age, job, education level and salary, in order to see if theindividual resident characteristics have any influence on resident satisfaction. In the end, it is thesincere wish of the author that the findings of this study can serve as a reference and resource for thegovernment and academia in formulating urban development and transport policies.
2. Literature Review
The basic characteristics of the TOD model shall include higher density development, mixedland use, a comfortable walking environment and high-quality public transport services. The densityof development is mainly intended to increase the public transport use rate through high-densitydevelopment of the areas surrounding the station. The main purpose of mixed land use is to increaseconvenience and the willingness of citizens to use public transportation. The human-oriented urbanspace is intended to create a comfortable transit environment for walking and additional public space,while also enhancing the service of transfer buses. The high-quality public transport service shallattract existing and potential passengers.
The living characteristics of TOD include the provision of transportation services, land use, streetnetwork and urban design. Sung et al. [2] believe that good TOD planning can create a transport-basedcity. The primary objective of TOD is not to continuously pursue increased density development, butinstead, to foster the utility structure of the land surrounding the train station, in addition to adjustingthe street network, urban design and a friendly pedestrian environment to serve as an adaptive strategyfor the enhancement of a transportation service network.
Mu and Jong (2012) [3] believe that TOD provides a broad future perspective for development byintroducing the faster urbanization phenomenon to many other areas, including cities in mainlandChina, through the TOD model, following a sustainable development model to foster city development.With the development of TOD, urban expansion and citizen accessibility become possible, and issuesof improving the railway and bus transfer system shall become feasible, as well. Meanwhile, the

ISPRS Int. J. Geo-Inf. 2016, 5, 52 3 of 18
government is strongly advised to upgrade the urban landscape and pedestrian environment. The TODshall be accompanied by an intensive and diversified land use pattern to provide quality transportationservices and restrict the use of automobiles and cars. Mu and Jong (2012) [3] propose the TODevaluation criterion characteristics, which include urban design, governing design, land use, restrictionof car use, transportation services and real estate, to serve as measurement elements to determinewhether Dalian is equipped with the prerequisites of a city. Taking the governing design as anexample, the original transportation system and urban planning of Dalian were unable to achievegoverning/administering conditions. The planners only focused on the major regions, which caused alack of coordination within the planning of the urban traffic system, including a lack of public institutesto coordinate the different transport service schedules, transport route maps and passenger fare lists.After introducing the TOD concept to Dalian City, general urban planning and rapid railway transitplanning began. The TOD also produced several satellite programs for railway transit and connectionwith new towns.
The majority of the literature on TOD studies has focused on exploring the effect of TOD on landuse. In recent years, many cities in the U.S. have begun to discuss the economic development that isbrought forth by the surrounding areas of transport system stations. Denver as an example, by probingthe causes of Denver’s urbanization. Their findings show that from 1997–2010, Denver adopted TODcharacteristics to engage in a railway transport system and high-density, mixed-use development,which greatly upgraded the average level of Denver’s urbanization density. The influence resulted inan increase of 180,000 residential housing units, 5,300,000 square feet of retail space, 5,400,000 squarefeet of office space and 6,200,000 square feet of medical space [4]. Ratner and Goetz (2013) [4] believethat the five major characteristics of a successful TOD model include location, rich mix of choices,value, place-making and transit stations. Location refers to the relative location of the transportationstations to living areas, workplaces, offices, shopping areas, entertainment spots, parks and otherlocal infrastructure. If the station is closer to the above locations, people are more likely to usewalking and bike-riding areas, as well as public transportation services. The rich mix of choices refersto a maximum combination of all surrounding living areas, transportation stations and shoppingcenters/malls, which aim to allow the people living around the TOD stations to enjoy traveling, evenin a thoroughly trafficked area, as well as shopping convenience [4]. Value is centered on livingareas, shops, offices, shopping centers/malls, entertainment spots, parks, etc., within 500 m of theTOD station, amounting to a solid value or the sum of the abstract value of people’s comfortablenessproduced by the introduction of the TOD concept. Place-making refers to the importance of selectinga station’s location. The old, first-generation transport systems, such as those in Washington D.C.,San Francisco and Chicago, have significant and inherent restrictions to developing the TOD concept.For example, the transit stations influence employment, living areas, culture, entertainment, shoppingfacilities and, consequently, the city’s economy.
One of the basic TOD characteristics is the high development-density of land, the purpose ofwhich is to increase land use efficiency by fostering development density. An increase in developmentdensity can not only increase the flow of passengers using the public transportation infrastructure andincrease the revenue of the transport service providers, but can also increase the number of people inthe commercial centers within the region, thus raising the commercial value of such a region. Cerveroand Kockelman (1997) [5] mainly adopted the development density, mixed land use and urban designof creating a pedestrian-friendly environment near the transit center as the main TOD planning model.Cervero et al. (2009) [6] used dwelling units per hectare, percentage of land area occupied by buildings,average building floor height and plot ratio as the factors to conduct their research. Sung et al. (2011) [2]considered Seoul as an example to perform a case study on a TOD high-density city. In their study,they also used the sum of residential density, commercial density and office density to estimate thebuilding floor area of land use. The study used building density, architectural volume, residentialpopulation, employed population, employment and the percentage of land area occupied by buildingsto serve as the density characteristics to estimate the TOD environment characteristics.

ISPRS Int. J. Geo-Inf. 2016, 5, 52 4 of 18
The TOD concept provides many types of convenient services, such as stores, banks, shoppingcenters/malls, parks/public green spaces, etc., to meet the needs of the residents. Mixed land usecan be implemented not just by ground area or multiple buildings within an area, but also withinthe same building, which is called vertical-mixed land use. Cervero et al. (2009) [6] used the entropyindex of land use mix, the proportion of buildings vertically mixed and the proportion of buildingsand the double use of total buildings in relation to the total building area to estimate the mixed-usecharacteristics of TOD environment characteristics. Sung et al. (2011) [2] used land use mix to estimatemixed use and to separate it into two different types for estimation. One type is to use resident andnon-resident area to estimate index and land use type. The other is to estimate the diversity by usingresident type, commercial type, office type and other types of land use.
Deng and Nelson (2013) [7] believe that if the government has its own budget limit concern, thegovernment can adopt the economical BRT (bus rapid transit) system to solve the problem. The BRTsystem contains a high-quality transportation service and a cost-effective advantage, such as the BRTNumber 1 in Beijing, which significantly increased convenience for the communities close to the cityalong the BRT highway road network, greatly improving traffic problems in the southern areas. Hence,the author proposes three conclusions from the findings on the basis of the BRT Number 1 project: first,BRT can provide a higher passenger-carrying capacity in faster, more reliable and more comfortableconditions, as compared to conventional bus routes; second, the BRT system can accelerate a changein travel behavior, while the BRT can also serve as important transit locations for improving localtransportation; third, an important BRT transit station can produce a positive attraction effect on theresidential industry. In addition, the author also suggests that the design of the BRT station itselfneeds to improve. Using the Beijing station as an example, BRT stations often provide safe pedestrianoverhead bridges or underground passages and are equipped with escalators. However, lackingbarrier-free accessible elevators, the BRT station becomes inconvenient for special groups of people,such as bicycle riders, the disabled, pregnant women, children and the elderly trying to enter or exit.
Jun et al. (2012) [8] used Seoul as an example for their study. Their findings show that the higheremployed population and level of mixed land use help foster better public transportation development.The solution to the high frequency of automobile use is to upgrade the public transport services forlocal residents, encourage TOD to extend its development to the urban outskirts and encourage citizensto change their behavior patterns when using transportation, such as changing from driving cars totaking public transportation systems. Jun et al. (2012) [8] suggest that the government can implementincentivizing measures to attain a balance between resident area and employment status, which canbenefit the factories and enterprises that moved to the urban outskirts and lower the use of personaltransportation vehicles.
The TOD model attaches importance to the walking environment, as the TOD spatial scale ismainly measured by the use of walking distance. Thus, the walking environment must be human-based,allowing people to enjoy a comfortable, safe and convenient pedestrian space. Calthorpe (1999) [9]believes that a good walking environment constitutes the most important part of the TOD. Hence,there is a need to create a comfortable walking environment at all starting and stopping points forall of the transport routes and passages. We also need to plant trees along both sides of roads andstreets and doors for buildings, which will truly allow the walking environment to become morepedestrian-friendly and foster the TOD.
Frank and Devlin (2010) [10] point out that when living in a community with a good walkingenvironment, one only needs to walk or use public transportation two to three times or more to reducethe use of automobiles by 58%. Furthermore, street connectivity and land use mix can also influencethe willingness of residents to walk. Sung et al. (2011) [2] use different types of streets and buildingpatterns to evaluate the degree of convenience for pedestrians and drivers.
Litman (2012) [11] suggests that living in a community with pedestrian and bicycle-ridingconvenience can help reduce the use of automobiles and improve traffic congestion, greatlycontributing to more converged mixed-land development. Jiang et al. (2012) [12] use protection,

ISPRS Int. J. Geo-Inf. 2016, 5, 52 5 of 18
comfort, enjoyment and directness to serve as indicators for evaluating the BRT. One of the indicatorsrefers to traffic safety risks. It is used to evaluate whether or not pedestrians are safe while walking onthe pedestrian sidewalk. The findings prove that less than one-third of citizens believe that walking onthe sidewalk is safe. Comfort means convenient walking by the pedestrians, including the barrier-freeaccessibility concept, quality of sidewalk construction and the cleanness and tidiness of the road/street.The findings point out that about 67% of the citizens in Jinan are satisfied with the comfort of thesidewalks of Jingshi Boulevard. Enjoyment refers to the aesthetic standard, and about 70% of citizensare satisfied with Jingshi Boulevard’s sidewalks. Directness refers to the curvature of the pedestriansidewalk, the measured data of which comes from a direct survey and on-site collection regarding thecurvature of the pedestrian sidewalk and engineering measurement means. The findings indicate thatthe average coefficient of the BRT sidewalks on Jingshi Boulevard is 1.59; the boulevard itself is 1.36,and the expressway corridor of the BRT is 1.33, which means that pedestrians need to spend 17%–20%more time to reach the BRT station.
The most important core of TOD will be transport services. Successful TOD relies onthe attractiveness of the transport services. Generally, railway transport is the main means oftransportation, while road transport is the second most important. In the TOD planning area, landdevelopment and transport operation are interdependent. Therefore, the quality of the transportservices depends not only on the frequency of dispatching trains and operational efficiency, but also onthe design of the bus stop or the building design of the bus transit station, route indicator and schedulecoordination between different kinds of transportation means/vehicles. These factors can influencethe quality of transportation services. Cervero et al. (2009) use the quantity of public schools, hospitals,public libraries, shopping centers, churches and banks to serve as the indicators for evaluation, whileSung et al. (2011) use the travel time of automobiles or trains from one area to another and the averagetravel time of taking a train or taxi cab from a specific area to the other CBDs for evaluation [2,6].
The accessibility of public transportation is represented by service quality and convenience forcitizens when taking public transportation to a certain location. The study by Cervero et al. (2009)indicates that TOD can decrease the percentage of citizens using personal transportation means, such ascars. The far and near public infrastructure facility environment represents the service quantity of thepublic infrastructure facilities that can be reached within a certain time unit or the degree of accessibilityfrom the activity or work location to the nearby local public infrastructure facilities. Therefore, theaccessibility degree of the location has a huge influence on the distance of travel. People who livefar from the public infrastructure facilities tend to be more willing to drive than people living nearthe public infrastructure facilities. Cervero et al. (2009) [6] use BRT numbers, the shortest distanceto the BRT station and the BRT shuttle bus station numbers for measurement reference bases, whileSung et al. (2011) [2] use a fixed train station area for a case study in order to explore the quality ofpublic transportation services and to discuss the connection between the stations and the passengers.For example, the average allocation time for the bus route schedule, the operating number of buses ata speed of less than 20 kilometers per hour, the number of exits of one railroad station and the distanceto nearby stations are all considered.
In addition, Olaru and Smith (2011) [13] take the cities of west Australia as the research subjectfor their case study. The author uses stores, schools, medical centers, entertainment facilities andpublic transportation facilities for empirical analysis to discuss the factors that make TOD attractiveto residents. The findings show that residential locations and transportation facilities closer to thecity appear more attractive to residents. However, the study only focuses on the transportationenvironment and does not explain the real reason that the residents want to continue to live in suchlocations. Hence, this study shall use the built environment to discuss the degree of satisfaction ofresidents toward the current TOD living environment characteristics.
According to the above literature regarding the TOD living environment characteristic density inthis study, it adopts building density, building volume, resident population, employed population,employment and the percentage of land area occupied by buildings as the density characteristics of

ISPRS Int. J. Geo-Inf. 2016, 5, 52 6 of 18
evaluating the TOD environment characteristics. On the part of the mixed use or the diversity in thisstudy, it adopts mix use, vertical mixing and the balance between residency and business. As for thedesign, it adopts walking environment, bicycle-riding environment, parking space, parks, green spacesand safety to serve as the design characteristics for evaluating the TOD environment characteristics.As for the high-quality traffic transport service environment, it adopts schooling, medical treatment,office work, leisure and shopping to serve as element factors for measuring the design characteristicsof TOD environment characteristics. As for the transferring distance between the public transportationsystems, this study uses the bus stops, coach transfer stations, train stations, MRT (subway/metro)stations and taxi stops to serve as the transferring distance characteristics of public transportation forevaluating the TOD environment characteristics.
While studies of TOD and the implementation of TOD have been popular topics in America, Taiwanwas stagnating in the reverse planning strategy of “land development guiding public transportation”.That is, the location of public transportation systems is determined by the demand of land development,which has further accelerated the arbitrary land development and low-efficiency disposition of landuse, forming the developing model of “transit-adjacent development (TAD)”. Moreover, current landdevelopment in Taiwan is based on “car-oriented development”, which generates urban sprawl, andthe role of public transportation has accelerated the deterioration of this phenomenon. Because theexperience of the development process of metropolitan and transportation policies in Taiwan is similarto that of other countries, Taiwan has recently urged for a policy shift to TOD, in an attempt to solve thecurrent crisis of urban development. Since the first TOD study conducted in Taiwan, there have beenmore relevant studies proposing the concept and strategy of TOD development. However, there hasnot been any study of the appropriate target system of TOD in Taiwan; without a common target, TODbecomes a multi-headed strategy and fails to fulfill its fundamental meaning.
In the past, urban development in Taiwan concentrated on road construction, where it encounteredsimilar difficulties. According to the National Energy Conference in 2006, greenhouse gas emissionsrevealed by the Ministry of Transportation and Communications have been increasing in recent years,and road travel is responsible for 85% of the emissions in the entire transport division. It is estimatedthat these emissions will grow four-fold from 1990–2025. Energy consumption accounted for 15.1% ofnational energy consumption in 2003 and is the second-largest energy consumption division in Taiwan,but it is worst in terms of the achievement rate of saving energy, at only 28%. Further observationshows that the energy consumption of the road system accounts for 93.4% of the entire transportationdivision, while the rail transportation system takes up less than 2%. With regard to road transportation,private cars and motorcycles accounted for a large percentage of energy consumption; the number ofsmall private cars in Taiwan increased significantly from 1971–2003, but the annual growth rate showsa generally descending trend. The high growth rate of the use of automobiles and motorcycles willcause numerous issues, such as an increase in the excessive consumption of fossil fuels, greenhouse andpollution gas emissions and traffic congestion. In addition, in response to the “Kyoto Protocol”, whichcame into effect on 16 February 2005, the issue of the use and possession of private transportationshould be the major concern in our country.
Recently, Taiwan has started considering the development of public transportation (particularly amainstream rail transportation system), such as the Mass Rapid Transit Act in 1988 and the Regulationof Encouraging Public Transportation Development in 2002. However, none of the regulationsand related policies mention integration plans for public transportation and land use to resolvethe problems. When making policies, the government takes into account the American experienceof implementing TOD through the improvement of planning policies and systems to change theprevious demand-oriented, unplanned developmental style of land and public transportation, in orderto achieve the following policy goals: prevention of unreasonable and inefficient urban expansion,saving public financial expenditure, promoting the effective use of land development, protectionof environmental resources, reconstruction of the use of urban space and providing high qualityresidential environments in the urban space.

ISPRS Int. J. Geo-Inf. 2016, 5, 52 7 of 18
This study refers to the TOD literature proposed by Sung et al. (2011), Mu and Jong (2012)and Ratner and Goetz (2013) [2–4]. This study believes that the above-mentioned 25 TOD livingenvironment characteristics represent five major aspects, including a high-density living environment,mixed land use environment, pedestrian-oriented walking environment, high-quality transportingservices environment and the far and near surrounding environments to the public transportationstation and public facilities, as shown in Figure 1.
ISPRS Int. J. Geo-Inf. 2016, 5, 52 7 of 19
environment, mixed land use environment, pedestrian-oriented walking environment, high-quality
transporting services environment and the far and near surrounding environments to the public
transportation station and public facilities, as shown in Figure 1.
Figure 1. TOD (transit-oriented development) living environment characteristics.
Currently, most of the TOD literature has been aimed at the present city situations and is based
on the actual land status characteristics, such as the percentage of land area occupied by buildings,
the floor area of the buildings, land use structure entropy index, street density, etc., under which
direct enquiries of residents regarding their feelings about their current living environment rarely
occur. In city planning, the opinions and thoughts of the residents are very important. Therefore, this
study focuses on the perspective of the residents and uses 25 TOD living environment characteristics
to understand the satisfaction level of the residents living with such environment characteristics.
3. Research Design
The research method and design consist of two major parts. The first is the subject research and
analysis, which is the experimental design basis of this study for evaluating satisfaction with the TOD
living environment. The second part is the questionnaire survey design, which is an exploration of
how to engage data for sampling and how to design the questionnaire survey.
3.1. How to Evaluate the TOD Living Environment Characteristics?
According to the literature both at home and abroad on TOD studies, most researchers base their
studies on their own experience as planners or expert/scholar questionnaire surveys to conduct their
TOD planning design. However, few interviews are performed on residents. The eventual users of
the public transportation systems are the residents, and different TOD living environment
characteristics generate different feelings in those residents. Therefore, the relevant authorities or the
local government should provide a compatible living environment for the residents. Therefore, how
to evaluate the TOD living environment characteristics is an important issue for this study [14].
In the review of past literature, although no specific definition was ever established on the TOD
living environment characteristics, some scholars have already explored issues related to TOD and
residents. For example, Cervero et al. (2009) [6] explore the impact of architectural environments on
walking and biking through a case study in Bogota, under which the relations between TOD and
walking were discussed. Jing et al. (2010) [1] in their Thinking and Implementation of Commodities
Flow along the City Railroad Traffic Routes explore numerous TOD characteristics. Olaru et al. (2011)
[13] in their New Transport Corridor, and Resident Location and TOD Transport-oriented
Development, explore various TOD and living issues. All of the above studies discuss the TOD living
environment or TOD characteristics. This study has taken the above literature and the authors’ own
viewpoints into account and therefore concludes that TOD living environment characteristics shall
center on the mass transit/transport station and cover the area of a high-density living environment
(density), highly mixed land use environment (diversity), high-quality pedestrian design walking
environment (design), high-quality traffic transportation service environment (destination
accessibility) and the far and near surrounding environment to the mass transit/transport station
(distance to transit) within a 500-meter radius range from the center, as shown in Figure 2.
Figure 1. TOD (transit-oriented development) living environment characteristics.
Currently, most of the TOD literature has been aimed at the present city situations and is basedon the actual land status characteristics, such as the percentage of land area occupied by buildings, thefloor area of the buildings, land use structure entropy index, street density, etc., under which directenquiries of residents regarding their feelings about their current living environment rarely occur. Incity planning, the opinions and thoughts of the residents are very important. Therefore, this studyfocuses on the perspective of the residents and uses 25 TOD living environment characteristics tounderstand the satisfaction level of the residents living with such environment characteristics.
3. Research Design
The research method and design consist of two major parts. The first is the subject research andanalysis, which is the experimental design basis of this study for evaluating satisfaction with the TODliving environment. The second part is the questionnaire survey design, which is an exploration ofhow to engage data for sampling and how to design the questionnaire survey.
3.1. How to Evaluate the TOD Living Environment Characteristics?
According to the literature both at home and abroad on TOD studies, most researchers basetheir studies on their own experience as planners or expert/scholar questionnaire surveys to conducttheir TOD planning design. However, few interviews are performed on residents. The eventualusers of the public transportation systems are the residents, and different TOD living environmentcharacteristics generate different feelings in those residents. Therefore, the relevant authorities or thelocal government should provide a compatible living environment for the residents. Therefore, how toevaluate the TOD living environment characteristics is an important issue for this study [14].
In the review of past literature, although no specific definition was ever established on the TODliving environment characteristics, some scholars have already explored issues related to TOD andresidents. For example, Cervero et al. (2009) [6] explore the impact of architectural environments onwalking and biking through a case study in Bogota, under which the relations between TOD andwalking were discussed. Jing et al. (2010) [1] in their Thinking and Implementation of CommoditiesFlow along the City Railroad Traffic Routes explore numerous TOD characteristics. Olaru et al.(2011) [13] in their New Transport Corridor, and Resident Location and TOD Transport-orientedDevelopment, explore various TOD and living issues. All of the above studies discuss the TOD livingenvironment or TOD characteristics. This study has taken the above literature and the authors’ ownviewpoints into account and therefore concludes that TOD living environment characteristics shallcenter on the mass transit/transport station and cover the area of a high-density living environment(density), highly mixed land use environment (diversity), high-quality pedestrian design walking

ISPRS Int. J. Geo-Inf. 2016, 5, 52 8 of 18
environment (design), high-quality traffic transportation service environment (destination accessibility)and the far and near surrounding environment to the mass transit/transport station (distance to transit)within a 500-meter radius range from the center, as shown in Figure 2.ISPRS Int. J. Geo-Inf. 2016, 5, 52 8 of 19
Figure 2. The five characteristics of the TOD living environment.
3.2. The Relationship between the TOD Living Environment and Residential Satisfaction
After the questionnaire survey, it is important to identify which econometric model is
appropriate in analyzing the impact of TOD environment characteristics on resident satisfaction.
Other than using simple descriptive statistics to analyze the collected questionnaire survey results, it
is essential to select an additional model that is appropriate for analyzing the relationship between
TOD living environment characteristics and resident satisfaction.
Through the literature, we discover that in past studies on residential satisfaction, most adopt
statistical analysis for analysis. Figure 3 shows the flowchart of analysis for the present study.
Figure 3. Analysis framework flowchart.
According to the literature review, TOD living environment characteristics represent five major
factors, including density (high-density living environment), diversity (mixed land use
environment), design (pedestrian-oriented walking environment), destination accessibility (the far
and near surrounding environment to the mass transit/transport station and public facilities) and
distance to transit (high-quality traffic transit/transport environment). This study focuses on the
Figure 2. The five characteristics of the TOD living environment.
3.2. The Relationship between the TOD Living Environment and Residential Satisfaction
After the questionnaire survey, it is important to identify which econometric model is appropriatein analyzing the impact of TOD environment characteristics on resident satisfaction. Other than usingsimple descriptive statistics to analyze the collected questionnaire survey results, it is essential toselect an additional model that is appropriate for analyzing the relationship between TOD livingenvironment characteristics and resident satisfaction.
Through the literature, we discover that in past studies on residential satisfaction, most adoptstatistical analysis for analysis. Figure 3 shows the flowchart of analysis for the present study.
ISPRS Int. J. Geo-Inf. 2016, 5, 52 8 of 19
Figure 2. The five characteristics of the TOD living environment.
3.2. The Relationship between the TOD Living Environment and Residential Satisfaction
After the questionnaire survey, it is important to identify which econometric model is
appropriate in analyzing the impact of TOD environment characteristics on resident satisfaction.
Other than using simple descriptive statistics to analyze the collected questionnaire survey results, it
is essential to select an additional model that is appropriate for analyzing the relationship between
TOD living environment characteristics and resident satisfaction.
Through the literature, we discover that in past studies on residential satisfaction, most adopt
statistical analysis for analysis. Figure 3 shows the flowchart of analysis for the present study.
Figure 3. Analysis framework flowchart.
According to the literature review, TOD living environment characteristics represent five major
factors, including density (high-density living environment), diversity (mixed land use
environment), design (pedestrian-oriented walking environment), destination accessibility (the far
and near surrounding environment to the mass transit/transport station and public facilities) and
distance to transit (high-quality traffic transit/transport environment). This study focuses on the
Figure 3. Analysis framework flowchart.
According to the literature review, TOD living environment characteristics represent fivemajor factors, including density (high-density living environment), diversity (mixed land use

ISPRS Int. J. Geo-Inf. 2016, 5, 52 9 of 18
environment), design (pedestrian-oriented walking environment), destination accessibility (the farand near surrounding environment to the mass transit/transport station and public facilities) anddistance to transit (high-quality traffic transit/transport environment). This study focuses on thequestionnaire-sampled residents living in the surrounding area within a 500-meter radius of BanqiaoMRT station as a case study and proposes the following hypotheses.
The TOD highly mixed land use concept offers various convenient services for residents, suchas stores, banks, shopping centers, parks and green spaces, etc. The mixed land use concept can beapplied to ground floor buildings and diversified buildings. Even in the same building, the conceptcan still be applied, called vertically-mixed land use. For residents living in such a highly-mixed landuse environment, it will be convenient for them in terms of shopping, business engagement, etc. Inshort, a more highly-mixed land use environment will make the living functions much better andresult in more satisfied residents.
If residents live in an area with many transit/transport stations or public facilities, they find itconvenient to use the systems (buses, train, etc.) or to engage in business. This will almost certainlylower their use of personal automobiles. Therefore, the far or near distance to the surroundingenvironment of mass transit/transport station and public facilities shall certainly impact residents’satisfaction with their living environment.
4. Questionnaire Design
This study mainly targets TOD living environment characteristics. Therefore, it is necessaryto conduct questionnaire interviews. Accordingly, it is important to determine an appropriatequestionnaire design and an information framework on the following 5D (density, diversity, design,destination accessibility, distance to transit) in order to truly reflect the actual thinking of the residentsand to collect the necessary information materials. Please refer to Figure 4 for the informationcollection framework.
ISPRS Int. J. Geo-Inf. 2016, 5, 52 9 of 19
questionnaire-sampled residents living in the surrounding area within a 500-meter radius of Banqiao
MRT station as a case study and proposes the following hypotheses.
The TOD highly mixed land use concept offers various convenient services for residents, such
as stores, banks, shopping centers, parks and green spaces, etc. The mixed land use concept can be
applied to ground floor buildings and diversified buildings. Even in the same building, the concept
can still be applied, called vertically-mixed land use. For residents living in such a highly-mixed land
use environment, it will be convenient for them in terms of shopping, business engagement, etc. In
short, a more highly-mixed land use environment will make the living functions much better and
result in more satisfied residents.
If residents live in an area with many transit/transport stations or public facilities, they find it
convenient to use the systems (buses, train, etc.) or to engage in business. This will almost certainly
lower their use of personal automobiles. Therefore, the far or near distance to the surrounding
environment of mass transit/transport station and public facilities shall certainly impact residents’
satisfaction with their living environment.
4. Questionnaire Design
This study mainly targets TOD living environment characteristics. Therefore, it is necessary to
conduct questionnaire interviews. Accordingly, it is important to determine an appropriate
questionnaire design and an information framework on the following 5D (density, diversity, design,
destination accessibility,distance to transit) in order to truly reflect the actual thinking of the residents
and to collect the necessary information materials. Please refer to Figure 4 for the information
collection framework.
Figure 4. Information collection framework drawing.
This study focuses on the specific area within a 500-meter radius around the new Banqiao Station
of the Banqiao District of New Taipei City. First, we determine the exact names of the streets/roads
where the above center is located, e.g., Mingchuan Road, Gongguan Street, Xinchan Road, Chanchien
Road, for the facilitation of an on-site questionnaire survey. The major questionnaire interview
subjects are focused on the local residents. We start from the actual address (i.e., xx Section of xx
Road/Street) where the residents reside. We introduce ourselves first, then ask passers-by whether
they are local residents and then ask if they would agree to participate in our questionnaire interview.
The questionnaire comprises statistical analysis and a five-point Likert scale and quantity table for
further research. The questionnaire is divided into three parts: the first part serves as a satisfaction
inquiry and investigation to understand to what extent the residents are satisfied with various local
TOD living environment characteristics; each question is divided into five levels, from very
dissatisfied (one point), to very satisfied (five points), as well as acceptable (three points). The second
part is an investigation of overall satisfaction and asks hypothesis questions about the following five
subjects, “traffic transportation environment”, “living environment”, “working environment”,
“leisure environment” and “schooling environment”, to see if the residents are satisfied with the
overall living environment. The third part is basic information collection from the interviewees,
Figure 4. Information collection framework drawing.
This study focuses on the specific area within a 500-meter radius around the new Banqiao Station ofthe Banqiao District of New Taipei City. First, we determine the exact names of the streets/roads wherethe above center is located, e.g., Mingchuan Road, Gongguan Street, Xinchan Road, Chanchien Road,for the facilitation of an on-site questionnaire survey. The major questionnaire interview subjects arefocused on the local residents. We start from the actual address (i.e., xx Section of xx Road/Street) wherethe residents reside. We introduce ourselves first, then ask passers-by whether they are local residentsand then ask if they would agree to participate in our questionnaire interview. The questionnairecomprises statistical analysis and a five-point Likert scale and quantity table for further research. Thequestionnaire is divided into three parts: the first part serves as a satisfaction inquiry and investigationto understand to what extent the residents are satisfied with various local TOD living environmentcharacteristics; each question is divided into five levels, from very dissatisfied (one point), to verysatisfied (five points), as well as acceptable (three points). The second part is an investigation of overallsatisfaction and asks hypothesis questions about the following five subjects, “traffic transportation
ISPRS Int. J. Geo-Inf. 2016, 5, 52 10 of 18
environment”, “living environment”, “working environment”, “leisure environment” and “schoolingenvironment”, to see if the residents are satisfied with the overall living environment. The third partis basic information collection from the interviewees, including their gender, age, job, educationalbackground and monthly income, for follow-up statistical information analysis.
This study mainly explores the impact of TOD environment characteristics on resident satisfaction.The data source has to be collected firsthand through questionnaire interviews in order to conduct acomplete analysis. TOD environment characteristics mainly derive from previous literature. The TODenvironment characteristics include high-density living environment, mixed land use environment,pedestrian-oriented walking environment, high-quality traffic transport services and the far and neardistance environment to mass transit/transport station or public infrastructure facilities.
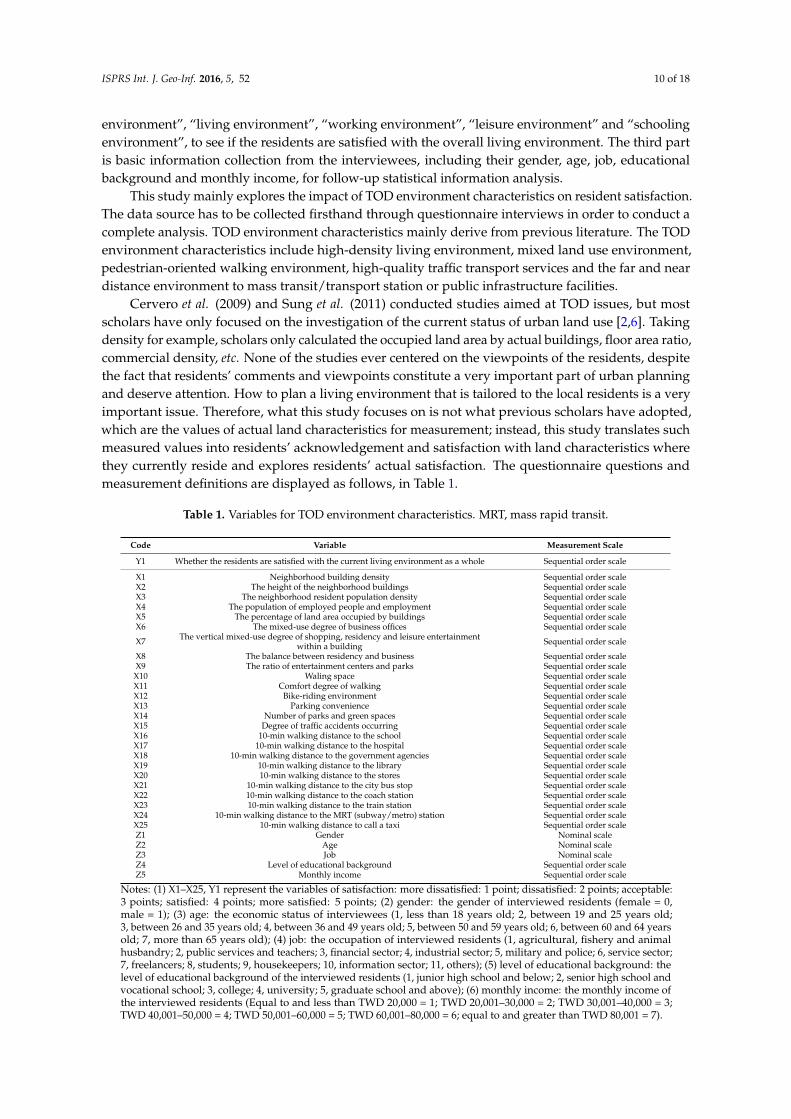
Cervero et al. (2009) and Sung et al. (2011) conducted studies aimed at TOD issues, but mostscholars have only focused on the investigation of the current status of urban land use [2,6]. Takingdensity for example, scholars only calculated the occupied land area by actual buildings, floor area ratio,commercial density, etc. None of the studies ever centered on the viewpoints of the residents, despitethe fact that residents’ comments and viewpoints constitute a very important part of urban planningand deserve attention. How to plan a living environment that is tailored to the local residents is a veryimportant issue. Therefore, what this study focuses on is not what previous scholars have adopted,which are the values of actual land characteristics for measurement; instead, this study translates suchmeasured values into residents’ acknowledgement and satisfaction with land characteristics wherethey currently reside and explores residents’ actual satisfaction. The questionnaire questions andmeasurement definitions are displayed as follows, in Table 1.
Table 1. Variables for TOD environment characteristics. MRT, mass rapid transit.
Code Variable Measurement Scale
Y1 Whether the residents are satisfied with the current living environment as a whole Sequential order scale
X1 Neighborhood building density Sequential order scaleX2 The height of the neighborhood buildings Sequential order scaleX3 The neighborhood resident population density Sequential order scaleX4 The population of employed people and employment Sequential order scaleX5 The percentage of land area occupied by buildings Sequential order scaleX6 The mixed-use degree of business offices Sequential order scale
X7 The vertical mixed-use degree of shopping, residency and leisure entertainmentwithin a building Sequential order scale
X8 The balance between residency and business Sequential order scaleX9 The ratio of entertainment centers and parks Sequential order scale
X10 Waling space Sequential order scaleX11 Comfort degree of walking Sequential order scaleX12 Bike-riding environment Sequential order scaleX13 Parking convenience Sequential order scaleX14 Number of parks and green spaces Sequential order scaleX15 Degree of traffic accidents occurring Sequential order scaleX16 10-min walking distance to the school Sequential order scaleX17 10-min walking distance to the hospital Sequential order scaleX18 10-min walking distance to the government agencies Sequential order scaleX19 10-min walking distance to the library Sequential order scaleX20 10-min walking distance to the stores Sequential order scaleX21 10-min walking distance to the city bus stop Sequential order scaleX22 10-min walking distance to the coach station Sequential order scaleX23 10-min walking distance to the train station Sequential order scaleX24 10-min walking distance to the MRT (subway/metro) station Sequential order scaleX25 10-min walking distance to call a taxi Sequential order scaleZ1 Gender Nominal scaleZ2 Age Nominal scaleZ3 Job Nominal scaleZ4 Level of educational background Sequential order scaleZ5 Monthly income Sequential order scale
Notes: (1) X1–X25, Y1 represent the variables of satisfaction: more dissatisfied: 1 point; dissatisfied: 2 points; acceptable:3 points; satisfied: 4 points; more satisfied: 5 points; (2) gender: the gender of interviewed residents (female = 0,male = 1); (3) age: the economic status of interviewees (1, less than 18 years old; 2, between 19 and 25 years old;3, between 26 and 35 years old; 4, between 36 and 49 years old; 5, between 50 and 59 years old; 6, between 60 and 64 yearsold; 7, more than 65 years old); (4) job: the occupation of interviewed residents (1, agricultural, fishery and animalhusbandry; 2, public services and teachers; 3, financial sector; 4, industrial sector; 5, military and police; 6, service sector;7, freelancers; 8, students; 9, housekeepers; 10, information sector; 11, others); (5) level of educational background: thelevel of educational background of the interviewed residents (1, junior high school and below; 2, senior high school andvocational school; 3, college; 4, university; 5, graduate school and above); (6) monthly income: the monthly income ofthe interviewed residents (Equal to and less than TWD 20,000 = 1; TWD 20,001–30,000 = 2; TWD 30,001–40,000 = 3;TWD 40,001–50,000 = 4; TWD 50,001–60,000 = 5; TWD 60,001–80,000 = 6; equal to and greater than TWD 80,001 = 7).

ISPRS Int. J. Geo-Inf. 2016, 5, 52 11 of 18
5. Model Analysis
5.1. Statistical Result of Basic Questionnaire Survey Data
The total number of people that were interviewed under the questionnaire survey of the BanqiaoMRT station was 370, of which there were 364 valid samples and six invalid samples. There were171 male interviewees, accounting for 47% of the total interviewees, and 193 female interviewees,accounting for 53%. Fifteen-point-one percent of interviewees were less than 18 years old; 22% ofinterviewees were between 19 and 25 years old; 31% of interviewees were between 26 and 35 yearsold; 8% of interviewees were between 36 and 49 years old; 11% of interviewees were between 50and 64 years old; and 12.9% of interviewees were more than 65 years old. In terms of occupation,30.8% of interviewees were students; while 12.1% of interviewees were involved in public services;9.9% of the interviewees were from the service sector; and 15% of the interviewees worked in otheroccupations. As for the level of educational background, 54% of interviewees were of college level,and 14% of interviewees held a master’s degree or higher. Concerning income, 28% of intervieweesearned 20,000 TWD/month; 24% of interviewees earned between 20,001 TWD and 30,000 TWD; and18% of interviewees earned an income between 30,001 TWD and 40,000 TWD.
5.2. Questionnaire Reliability Analysis
This study expects to discover the quality of the questionnaire survey design through reliabilityanalysis. Therefore, the first part of the questionnaire, survey satisfaction X1–X25, and the second part,overall satisfaction Y1, were verified by using Cronbach’s alpha model. The result shows that the totalreliability coefficient was 0.871, confirming that the internal consistency of the questionnaire survey isgood enough to support the results of this research.
5.3. Average Satisfaction of 25 TOD Characteristics
Table 2 is the satisfaction descriptive statistics table of 25 TOD living environment characteristics,which allow us to know whether the resident is dissatisfied with some current TOD characteristics andalso allow us to improve those dissatisfying conditions beforehand, if there are any.
Using 5D categorization to differentiate the top three characteristics, with regard to density, theresidents proved more satisfied with building volume, resident population and building density interms of TOD environment characteristics; on the part of mixed use, the residents proved more satisfiedwith a balanced residency/business combination, the ratio of entertainment centers and parks and avertical mix of TOD environment characteristics; on the part of design, the residents are more satisfiedwith parks/green spaces, parking space and bike-riding TOD environment characteristics; on thepart of accessibility, the residents are more satisfied with shopping, schooling and medical care; onthe part of distance, the residents are more satisfied with city bus stop, taxi stand and coach transferstation TOD environment characteristics. Therefore, if the government or the planning sector wants toconduct improvements or planning efforts toward individual 5D characteristics, they should be aimedat the improvement and planning of the fourth and fifth ranking places, where the residents are moredissatisfied with the characteristics.
The residents are most dissatisfied with the railway station, MRT (sub/metro) stations, coachtransfer station, taxi calling stand, mixed-use, business, walking and bike-riding environments, as wellas parking and the walking space. If the government or the planning sector wants to conductimprovements or planning efforts toward all of the TOD characteristics, the first efforts should bemade on the above dissatisfaction characteristics.

ISPRS Int. J. Geo-Inf. 2016, 5, 52 12 of 18
Table 2. Satisfaction descriptive statistics table of 25 TOD living environment characteristics.
TOD Living Environment Characteristics Mean Rankings of Major Characteristics Rankings of All Characteristics
Neighborhood building density 3.33 3 8The height of the neighborhood buildings 3.46 1 5
The neighborhood resident population 3.41 2 6The population of employed people
and employment 3.10 4 12
The percentage of land area occupiedby buildings 3.05 5 14
The mixed-use degree of business offices 2.76 5 20The vertical mixed-use degree of shopping,
residency and leisure entertainmentwithin a building
3.05 3 15
The balance between residency and business 3.41 1 6The ratio of entertainment centers and parks 3.20 2 9
Vitasphere 3.04 4 16Comfort degree of walking 2.91 4 19
Bike-riding environment 2.98 3 18Parking convenience 3.03 2 17
Number of parks and green spaces 3.18 1 10Degree of traffic accidents occurring 3.18 1 11
10-min walking distance to the school 3.96 2 210-min walking distance to the hospital 3.65 3 4
10-min walking distance to thegovernment agencies 2.76 5 20
10-min walking distance to the library 3.06 4 1310-min walking distance to the stores 4.07 1 1
10-min walking distance to the city bus stop 3.90 1 310-min walking distance to the coach station 2.62 3 2310-min walking distance to the train station 2.51 5 25
10-min walking distance to the MRT(subway/metro) station 2.57 4 24
10-min walking distance to call a taxi 2.68 2 22
Notes: Satisfaction degree: more dissatisfied: 1 point; dissatisfied: 2 points; acceptable: 3 points; satisfied:4 points; more satisfied: 5 points.
5.4. The Factor Analysis
Since there are many satisfactory items from the 25 living environment characteristics, we usefactor analysis to simplify them via principal components analysis and varimax and then extract aneigenvalue of greater than one. The 25 living environment characteristics represent a good result afterfactor analysis. Furthermore, the Bartlett test value attains a significant level of 0.000, indicating thatthese items are suitable for factor analysis.
In addition, from the total variation explaining scale, we understand that of the 25 livingenvironment characteristics, there are six satisfactory components, which are different from thisstudy’s five desired components. Therefore, we need to delete more questions, namely questionsfrom the rightmost factors in the statement paper sheet. We delete the sixth component, which statesthat “the people reside here more than the people who work here in your neighborhood”, with thehighest factor load of 0.675. Then, we ran the factor analysis again, getting the KMO (measured by theKaiser-Meyer-Olkin) statistic value of 0.840 on the remaining 24 living environment characteristics,representing a normal status. Cronbach’s alpha values are shown in Table 3.
Table 3. Cronbach’s alpha values.
Factor Cronbach’s Alpha
Factor 1 0.811Factor 2 0.819Factor 3 0.735Factor 4 0.783Factor 5 0.661
5.5. Stepwise Regression Analysis
A stepwise regression analysis is adopted to forecast the living environment satisfaction of theresidents living in the area surrounding Banqiao Station via TOD living environment characteristics and

ISPRS Int. J. Geo-Inf. 2016, 5, 52 13 of 18
the residents’ personal characteristics. We further establish this study’s forecast model of residentialsatisfaction, as described below.
Here, we set the dependent variable as y1 then we set five major factors of TOD living environmentcharacteristics as independent variables using stepwise regression analysis (predictive regressionmethod), and the data results are shown in Table 4.
Table 4. Model calibration.
Model R R2 adj-R2 Altered Values of R2 F
1 0.400 0.160 0.157 0.160 68.786 ***2 0.438 0.192 0.187 0.032 14.211 ***
Notes: *** p-value < 0.001.
This study adopts a stepwise analysis approach to select an optimal combination of independentvariables, and the computer will automatically select the relevant independent variables to enter intothe model, which can temporarily avoid collinearity problems.
Land use and transportation design of the first-stage factors can explain 16% variance values(F change amount of 68.786, p = 0.000). After adjustment, R-squared proves to have 15.7% of explanatorypower. Through the gradual analysis approach, we discovered that the coefficients possess only oneindependent variable and no collinearity problems, which means that the factors of land use andtransportation design are independent of other factors’ interference.
The second selected independent variable is Factor 5 for density, which can explain 19.2% variancevalues (F change amount of 14.211, p = 0.000), satisfying the selection criteria. Model 2 has commonfactors: land use and transportation design and Factor 5: density’s two independent variables. Afterit is adjusted, it can explain 18.7% of the variance values, verified with F test results, of which theexplanatory power possesses statistical significance. Table 5 shows the regression coefficient table forTOD living environment and living environment satisfaction.
Table 5. The regression coefficient table for TOD living environment characteristics and livingenvironment satisfaction.
Model Coefficient
Non-StandardizedCoefficient
StandardizedCoefficients
t
Collinearity
B Estimate Values StandardDeviation
BetaAllocation Tolerance Variance Inflation
Factor (VIF)
1 (Constant) 1.629 0.235 - 6.928 *** - -
Factor 1 (Design) 0.644 0.078 0.400 8.294 *** 1.000 1.000
2 (Constant) 0.926 0.297 - 3.117 *** - -
Factor 1 (Design) 0.604 0.077 0.375 7.848 *** 0.981 1.019
Factor 5 (Density) 0.267 0.071 0.180 3.770 *** 0.981 1.019
Note: *** p-value < 0.001.
After the VIF test, either Model 1 or 2, the variable VIF values are less than 10 and showthat there is no significant overlap between the independent variables. The last equation containstwo independent variables. The equation is as follows: the residential satisfaction of TOD livingenvironment = 0.926 + 0.604 Factor 1 for land use and transportation design +0.267 Factor 5 for density.
By using this equation, we are able to forecast the residential satisfaction of the actual livingenvironment, with an estimated standard deviation of 0.930. Through the equation’s regressioncoefficients, we can also understand that the greatest impact is Factor 1 for land use and transportationdesign on the residential satisfaction with the living environment, which is followed by Factor 5for density.

ISPRS Int. J. Geo-Inf. 2016, 5, 52 14 of 18
5.6. Personal Characteristics and TOD Living Environment
Here, we use a forced entry of variance approach to input residents’ personal characteristics,gender, age, occupation, level of education and income into the regression model test. Since thepersonal characteristics of residents belong to the category variables, we must then use the categoricalvariables, with gender referring to women variable for the reference category; as to the age, we referto above 65 years old variable as the reference category; for occupation, we refer to other variable forthe reference category; for the educational level, we refer to graduate school and above variable for thereference category; for income, we refer to more than NT$80,001 for the reference category. Meanwhile,we set the dependent variable as y2 The independent variables use Factor 1 for design, Factor 2 forhigh-quality transportation services, Factor 3 for accessibility, Factor 4 for mixed-use and Factor 5 fordensity. Table 6 summarizes the residential satisfaction of residents’ personal characteristics and TODliving environment characteristics.
Table 6. Summary of residents’ personal characteristics and TOD living environment.
Model R R2 adj-R2 Altered Values of R2 F
Gender 0.451 (a) 0.204 0.190 0.204 15.202 ***Age 0.454 (b) 0.206 0.181 0.206 8.303 ***Job 0.474 (c) 0.225 0.192 0.225 6.740 ***
Education 0.461 (d) 0.213 0.193 0.213 10.618 ***Income 0.489 (e) 0.239 0.215 0.239 10.044 ***
Notes: *** p-value < 0.001.
For gender, we adopt a forced entry approach to engage variable analysis. By doing so, wewill discuss all of the variables. Through the forced entry multiple regression equation, we cantest each independent variable for the dependent variables’ explanatory power. The findings showthat if we add a gender-visualized variable into the regression analysis, it significantly enhances theexplanatory power. Gender and five TOD living environment characteristic factors have an impacton residential satisfaction, with an overall R-squared interpretation of 0.204, indicating that five TODliving environment characteristic factors can explain the residential satisfaction of 20.4% in variancevalues. After adjustment, the R-squared value is 19.0% in the interpretation ratio. The model testresults point out that the regression effect reaches F change value of 15.202 with statistical significance.
We reviewed two important papers. Firstly, Amérigo and Aragonés (1997) [15] present atheoretical and methodological approach to the study of residential satisfaction, and they seekto give a general view of the relationships established between a person and his/her residentialenvironment.Bonaiuto et al. (1999) [16] test a path model in which residential satisfaction,operationalized in terms of multidimensional perceived residential environment quality (PREQ),predicts neighborhood attachment, which is considered as the final criterion. Socio-demographic (age,sex, socio-economic level) and residential (length of residence both in a neighborhood and in Romeand the number of persons living together) variables are also included in the theoretical model aspredictors of both PREQ and neighborhood attachment. Age is an important variable for residentialsatisfaction, which is highly correlated with occupancy.
Age and five TOD living environment characteristic factors have an impact on residentialsatisfaction, with an overall R-squared interpretation of 0.206, indicating that five TOD livingenvironment characteristic factors can explain residential satisfaction effects of 18.1% in the variancevalues. After adjustment, the R-squared interpretation ratio is 18.1%. Model test results point out thatthe regression effect reaches F change values of 8.303, p = 0.000, with statistical significance. Of the sixage-visualized variables, no significant factor is attained, indicating that different ages have no impacton the residential satisfaction evaluation.
When an occupational-visualized variable is added to the regression analysis, it proves thatit significantly enhances the explanatory power. Occupation and five TOD living environment

ISPRS Int. J. Geo-Inf. 2016, 5, 52 15 of 18
characteristic factors have an impact on residential satisfaction, with an overall R-squared explanatorypower of 0.225, indicating that five TOD living environment characteristic factors can explain theresidential satisfaction effect by 22.5% of the variance values. After adjustment, the R-squared valuespossess 19.2% of the interpretation ratio. The model test results point out that the regression effectreaches F change values of 6.740, p = 0.000, with statistical significance.
When the education level-visualized variable is added to the regression analysis, it proves that theexplanatory power has significantly improved. The educational level and five TOD living environmentcharacteristic factors have an impact on residential satisfaction, with an overall R-squared interpretationof 0.213, indicating that five TOD living environment characteristic factors can explain the residentialsatisfaction effect by 21.3% of the variance values. After adjustment, the R-squared ratio possesses19.3% of the explanatory power. The model test results point out that the regression effect reaches Fchange values of 10.618, p = 0.000, with statistical significance.
When the salary variable and the income-visualized variable are added to the regression analysis,they significantly enhance the explanatory power. Monthly salary income and five TOD livingenvironment characteristic factors have an impact on residential satisfaction, with an overall R-squaredinterpretation of 0.239, indicating that five TOD living environment characteristic factors can explainthe residential satisfaction effect by 23.9% of the variance values. After adjustment, the R-squaredexplanatory ratio is 21.5%. The model test results point out that the regression effect reaches F changevalues of 10.044, p = 0.000, with statistical significance.
Furthermore, with the test of individual independent variables afterwards, we can understand theoptimal explanation. Table 7 shows the residents’ satisfaction regression coefficient table for residents’personal characteristics and the residential satisfaction of TOD living environment characteristics.
Table 7. Residents’ personal characteristics and residential satisfaction.
Reference Category Factors
Non-StandardizedCoefficients
StandardizedCoefficients
T testB Estimates Standard
DeviationBeta
Distribution
Gender: female Factor 1: Design 0.618 0.085 0.384 7.261 ***Gender: female Factor 5: Density 0.258 0.078 0.174 3.323 ***
Age 65 years old and above Factor 1: Design 0.617 0.086 0.383 7.188 ***Age 65 years old and above Factor 5: Density 0.244 0.079 0.165 3.103 **
Occupation: others Factor 1: Design 0.618 0.086 0.383 7.160 ***Occupation: others Factor 5: Density 0.248 0.078 0.167 3.167 **
Level of education: graduate level and above Factor 1: Design 0.613 0.085 0.380 7.169 ***
Level of education: graduate level and above Factor 1: Density 0.248 0.078 0.167 3.186 **
Income of more than NT$80,001 Factor 1: Design 0.642 0.085 0.398 7.585 ***Income of more than NT$80,001 Factor 5: Density 0.248 0.077 0.167 3.233 ***
Note: *** p-value < 0.001, ** p-value < 0.05.
Regarding gender, we refer to women as the reference category and then further engage afterwardsthe test of individual independent variables. The coefficient estimates point out that Factor 1 forland use and transportation design has the best explanatory power of the beta coefficient up to 0.384,indicating that if Factor 1 for land use and transportation design in terms of TOD characteristics of theliving environment increases, residents’ satisfaction will rise. Secondly, regarding Factor 5 for density,we get a beta coefficient of 0.174, indicating that if we increase the density of Factor 5 and the TODliving environment characteristics, it will also enhance residents’ satisfaction. The last equation willcontain six independent variables as follows in Table 7.
In terms of age, we refer to 65 years old and above variable for the reference category. When wefurther conduct tests on individual independent variables, we get the coefficient estimate results, whichindicate that Factor 1 for land use and transportation design has the best explanatory power, with abeta coefficient as high as 0.383, indicating that if we can increase the TOD residential characteristics ofFactor 1 for land use and transportation design for TOD living environment characteristics, we willenhance the residents’ satisfaction; this is followed by Factor 5 for density, with a beta coefficient of

ISPRS Int. J. Geo-Inf. 2016, 5, 52 16 of 18
0.165, indicating that if we increase the TOD living environment characteristics of Factor 5 for density,residents’ living satisfaction will be raised.
Regarding occupation, which refers to the other category, the results point out that further tests onthe individual independent variable are useful; the coefficient estimates indicate that Factor 1 for landuse and transportation design has the best explanatory power, with a beta coefficient as high as 0.383,showing that if we increase Factor 1 for land use and transportation design for TOD characteristics ofthe living environment, residents’ living satisfaction will improve. This is followed by Factor 5 fordensity, with a beta coefficient of 0.167, indicating that if we increase the TOD living environmentcharacteristics of Factor 5 for density, it will also enhance residents’ living satisfaction.
Regarding educational level, we refer to graduate level and above. Furthermore, we test theindividual independent variable afterwards, and the coefficient estimates point out that Factor 1 forland use and transportation design has the best explanatory power, with a beta coefficient as high as0.380, indicating that if we increase the TOD living environment characteristics of Factor 1 for landuse and transportation design, the residents’ living satisfaction will be enhanced; this is followedby Factor 5 for density, with a beta coefficient of 0.167, indicating that if we increase the TOD livingenvironment characteristics of Factor 5 for density, we will enhance residents’ living satisfaction.
In terms of income, we refer to more than NT$80,001 for the reference category. Further testsafterwards on individual independent variables prove that the coefficient estimate results indicatethat Factor 1 for land use and transportation design has the best explanatory power, with a betacoefficient as high as 0.398, showing that if we can increase the TOD living environment characteristicsof Factor 1 for land use and transportation design, we will enhance residents’ living satisfaction. Next,this is followed by Factor 5 for density, with a beta coefficient of 0.167, indicating that if we increasethe TOD living environment characteristics of Factor 1 for density, we will also enhance residents’living satisfaction.
6. Conclusions
This study found that residents within a 10-min walking distance to the stores of TOD livingenvironment characteristics are the most satisfied with the living environment; residents within a10-min walking distance to the railway station of TOD living environment characteristics are the leastsatisfied. If ranking the arrangement of five major TOD characteristics, density, residents’ viewpointstoward building volume, residents’ viewpoints toward resident population and building density ofTOD living environment characteristics are more satisfactory; regarding mixed-use, the residents’viewpoints toward a balanced ratio of residency and businesses, the ratio of entertainment centers andparks, and a vertical mix of TOD living environment characteristics are more satisfactory; regardingdesign, residents’ viewpoints toward parks, green spaces, parking and the bike-riding environmentof TOD living environment characteristics are more satisfactory; regarding accessibility, residents’viewpoints on shopping, schooling and medical treatment, the TOD living environment characteristicsare more satisfactory; regarding distance, residents’ viewpoints toward urban bus stops, taxi-callingstands, and coach transfer stations of TOD living environment characteristics are more satisfactory.If we use all of the TOD living environment characteristics for satisfaction sorting order, the leastsatisfactory for the residents includes train station, MRT stations, coach transfer station, taxi-callingstand, mixed-use, office, walking, bike-riding, parking and Vitasphere. Assuming that the futureeffort for the government or planning departments is to improve the living environment for TODcharacteristics, it is recommended that the first efforts target the least satisfied 5D characteristics orwhat the residents consider the least satisfactory characteristics.
By using factor analysis, we get five major factors for TOD living environment characteristics,including Factor 1 for land use and transportation design, named “design”, with eight TODliving environment characteristics, such as “sufficient parking spaces for automobiles”, “bike-ridingenvironment”, “comfortable pedestrian sidewalks with no motorcycles illegally parked nearby”,“collision of bikes and motorcycles”, “not too converged buildings”, “buildings are not too high or

ISPRS Int. J. Geo-Inf. 2016, 5, 52 17 of 18
too big”, “parks are enjoyable and attractive” and “the area of the park is larger than that of theentertainment center.”
Since Factor 2 concerns public transportation, it has been named “distance to transit”, with sixTOD living environment characteristics, including 10-min walking distance to the “coach transferstation”, “railway station”, “subway station”, “taxi-calling stand”, “the municipal government anddistrict office”, “libraries, concert halls”, etc. Factor 3 concerns offices and business and is hence named“destination accessibility”, including four TOD living environment characteristics, such as 10-minwalking distance to “stores or market”, “bus stop”, “school” and “hospital or clinic.” Factor 4 concernsshopping and is hence named “diversity”, with two TOD living environment characteristics, including“shopping centers and entertainment centers” and “shopping, residential, leisure and entertainmentbusinesses or homes.” Factor 5 concerns density and is therefore named “density”, with four TODliving environment characteristics, including “nine-to-five workers”, “residents”, “buildings” and“offices and business buildings.”
After factor analysis, we used a forecast regression model and found that of the TOD livingenvironment characteristics, only Factor 1 for land use and transportation design and Factor 5for density are significant. The residential satisfaction of TOD living environment characteristics= 0.926, +0.604 Factor 1 for land use and transportation design, +0.267 Factors 5 for density.Therefore, if government departments want to engage in efforts to improve the living environmentfor TOD characteristics, it is recommended that they target Factor 1 for land use and transportationdesign characteristics, which include eight TOD living environment characteristics for their priorityimprovement strategy.
If we include the resident characteristics and adopt a forced entry approach for validation, we canonly get Factor 1 for land use and transportation design and Factor 5 for density, which can attain asignificant level and are positively correlated. In terms of other residents’ personal characteristics, theyprove insignificant. Our findings are generalized in Table 8.
Table 8. Study findings for residents’ satisfaction with TOD living environment characteristics.
Items Statistical Methods Purpose Results
1
Multiple regressionanalysis: stepwiseregression analysis
mode
To establish a forecastmodel on residential
satisfaction
Factor 1 for land use and transportation design andFactor 5 for density prove significant.
The regression equation for residential satisfaction withTOD living environment.
The residential satisfaction with TOD livingenvironment = 0.926, +0.604 Factor 1 for land use and
transportation design, +0.267 Factor 5 for density
2Multiple regression
analysis: forcedentry approach
To establish a forecastmodel on residentialsatisfaction for this
study and add residents’personal characteristics
Regardless of gender, age, occupation, educationallevel and salary income, when added with residents’
personal characteristics, only Factor 1 for land use andtransportation design and Factor 2 for density
prove significant.
The scope of research shall center on the newly-assigned Banqiao District of New Taipei City(Xin-Ban Special District) within a 500-meter radius from the center. The so-called Xin-Ban SpecificDistrict Area features a combination construction of integrated four-railroad systems, containing anarea of 10,000 hectare of parks, one large square, the Grand Taipei Opera House, the Convention& Exhibition Center, tourist hotels and shopping complex centers or shopping malls. Compared toother cities and counties of the current development type, this area possesses considerable advantages.Therefore, in the research planning stage, it is highly recommended that appropriate importancebe attached to the local development characteristics in order to avoid inconsistency in the area’sdevelopment, which may in turn cause inappropriate misinterpretations or mistakes for urban andrural development planning.

ISPRS Int. J. Geo-Inf. 2016, 5, 52 18 of 18
Acknowledgments: Thanks to the Ministry of Science and Technology, Taiwan (R.O.C.), for funding our research.Project Number NSC 101-2410-H-034-046.
Author Contributions: This research was designed and written by Chia-Nung Li. The data were analyzed byChia-Nung Li and Chiang Lin. The authors approved the final manuscript.
Conflicts of Interest: The authors declare no conflict of interest.
References
1. Jing, B.; Shengwen, L.; Xiao, Y. Urban Rail Transit along the Property: Thinking and Practice; Xi-an JiaotongUniversity Press: Xi’an, China, 2010.
2. Sung, H.; Oh, J.-T. Transit-oriented development in a high-density city: Identifying its association withtransit ridership in Seoul, Korea. Cities 2011, 28, 70–82. [CrossRef]
3. Mu, R.; Jong, M.D. Establishing the conditions for effective transit-oriented development in China: The caseof Dalian. J. Transp. Geogr. 2012, 24, 234–249. [CrossRef]
4. Ratner, K.A.; Goetz, A.R. The reshaping of land use and urban form in Denver through transit-orienteddevelopment. Cities 2013, 30, 31–46. [CrossRef]
5. Cervero, R.; Kockelman, K. Travel demand and the 3Ds: Density, diversity, and design. Transp. Res. Part DTransp. Environ. 1997, 2, 199–219. [CrossRef]
6. Cervero, R.; Sarmiento, O.L.; Jacoby, E.; Gomez, L.F.; Neiman, A. Influences of built environments on walkingand cycling: Lessons from bogota. Int. J. Sustain. Transp. 2009, 3, 203–226. [CrossRef]
7. Deng, T.; Nelson, J.D. Bus rapid transit implementation in Beijing: An evaluation of performance andimpacts. Res. Transp. Econ. 2013, 39, 108–113. [CrossRef]
8. Jun, M.J.; Kim, J.I.; Kwon, J.H.; Jeong, J.E. The effects of high-density suburban development on commutermode choices in Seoul, Korea. Cities 2013, 31, 230–238. [CrossRef]
9. Calthorpe, P. The Next American Metropolis: Ecology, Community, and the American Dream; PrincetonArchitectural Press: Princeton, NJ, USA, 1993.
10. Frank, L.D.; Devlin, A. Neighborhood Design, Travel, and Health in Metro Vancouver: Using a Walkability Index;UBC Active Transportation Collaborator: Vancouver, BC, Canada, 2010.
11. Litman, T. Comprehensive evaluation of energy conservation and emission reduction policies. Transp. Res.Part A Policy Pract. 2013, 47, 153–166. [CrossRef]
12. Jiang, Y.; Christopher Zegras, P.; Mehndiratta, S. Walk the line: Station context, corridor type and bus rapidtransit walk access in Jinan, China. J. Transp. Geogr. 2012, 20, 1–14. [CrossRef]
13. Olaru, D.; Smith, B. Residential location and transit-oriented development in a new rail corridor. Transp. Res.Part A Policy Pract. 2011, 45, 219–237. [CrossRef]
14. Zhang, M.; Wang, L. The impacts of mass transit on land development in China: The case of Beijing.Res. Transp. Econ. 2013, 40, 124–133. [CrossRef]
15. Amérigo, M.; Aragonés, J.I. A theoretical and methodological approach to the study of residential satisfaction.J. Environ. Psychol. 1997, 17, 47–57. [CrossRef]
16. Bonaiuto, M.; Aiello, A.; Perugini, M.; Bonnes, M.; Ercolani, A.P. Multidimensional perception of residentialenvironment quality and neighbourhood attachment in the urban environment. J. Environ. Psychol. 1999, 19,331–352. [CrossRef]
© 2016 by the authors; licensee MDPI, Basel, Switzerland. This article is an open accessarticle distributed under the terms and conditions of the Creative Commons Attribution(CC-BY) license (http://creativecommons.org/licenses/by/4.0/).


![TOD Project Practices in Japan - mlit.go.jp10 1968 1974 [Total development area]about 5,000ha [Number of population]about 500,000 residents [Population density] 100 residents per ha](https://img.dokumen.tips/doc/110x75/5e89f22ecfdd6f3cb8684e87/tod-project-practices-in-japan-mlitgojp-10-1968-1974-total-development-areaabout.jpg)