Embed Size (px)
Citation preview

To Ship or Not to Ship:An Extensive Evaluation of Automatic Metrics for Machine Translation
TomKocmi
ChristianFedermann
RomanGrundkiewicz
MarcinJunczys-Dowmunt
HitokazuMatsushita
ArulMenezes
Microsoft1 Microsoft Way
Redmond, WA 98052, USA{tomkocmi,chrife,rogrundk,marcinjd,himatsus,arulm}@microsoft.com
Abstract
Automatic metrics are commonly used as theexclusive tool for declaring the superiority ofone machine translation system’s quality overanother. The community choice of automaticmetric guides research directions and indus-trial developments by deciding which modelsare deemed better. Evaluating metrics correla-tions with sets of human judgements has beenlimited by the size of these sets. In this pa-per, we corroborate how reliable metrics arein contrast to human judgements on – to thebest of our knowledge – the largest collectionof judgements reported in the literature. Ar-guably, pairwise rankings of two systems arethe most common evaluation tasks in researchor deployment scenarios. Taking human judge-ment as a gold standard, we investigate whichmetrics have the highest accuracy in predict-ing translation quality rankings for such sys-tem pairs. Furthermore, we evaluate the per-formance of various metrics across differentlanguage pairs and domains. Lastly, we showthat the sole use of BLEU impeded the devel-opment of improved models leading to bad de-ployment decisions. We release the collectionof 2.3 M sentence-level human judgements for4380 systems for further analysis and replica-tion of our work.
1 Introduction
Automatic evaluation metrics are commonly usedas the main tool for comparing the translation qual-ity of a pair of machine translation (MT) systems(Marie et al., 2021). The decision of which of thetwo systems is better is often done without the helpof human quality evaluation which can be expen-sive and time-consuming. However, as we confirmin this paper, metrics badly approximate humanjudgement (Mathur et al., 2020b), can be affectedby specific phenomena (Zhang and Toral, 2019;Graham et al., 2020; Mathur et al., 2020a; Freitaget al., 2021) or ignore the severity of translation
errors (Freitag et al., 2021), and thus may mis-lead system development by incorrect judgements.Therefore, it is important to study the reliability ofautomatic metrics and follow best practices for theautomatic evaluation of systems.
Significant research effort has been applied toevaluate automatic metrics in the past decade, in-cluding annual metrics evaluation at the WMT con-ference and other studies (Callison-Burch et al.,2007; Przybocki et al., 2009; Stanojevic et al.,2015; Mathur et al., 2020b). Most research has fo-cused on comparing sentence-level (also known assegment-level) correlations between metric scoresand human judgements; or system-level (e.g., scor-ing an entire test set) correlations of individualsystem scores with human judgement. Mathur et al.(2020a) emphasize that this scenario is not identi-cal to the common use of metrics, where instead,researchers and practitioners use automatic scoresto compare a pair of systems, for example whenclaiming a new state-of-the-art, evaluating differentmodel architectures, deciding whether to publishresults or to deploy new production systems.
The main objective of this study is to find anautomatic metric that is best suited for makinga pairwise ranking of systems and measure howmuch we can rely on the metric’s binary verdictsthat one MT system is better than the other. Wedesign a new methodology for pairwise system-level evaluation of metrics and use it on – to thebest of our knowledge – the largest collection ofhuman judgement of machine translation outputswhich we release publicly with this research. Weinvestigate the reliability of metrics across differ-ent language pairs, text domains and how statisticaltests over automatic metrics can help to increasedecision confidence. We examine how the com-mon use of BLEU over the past years has possiblynegatively affected research decisions. Lastly, were-evaluate past findings and put them in perspec-tive with our work. This research evaluates not
arX
iv:2
107.
1082
1v2
[cs
.CL
] 1
3 Se
p 20
21

only the utility of MT metrics in making pairwisecomparisons specifically – it also contributes to thegeneral assessment of MT metrics.
Based on our findings, we suggest the followingbest practices for the use of automatic metrics:
1. Use a pretrained metric as the main automaticmetric; we recommend COMET. Use a string-based metric for unsupported languages andas a secondary metric, for instance ChrF. Donot use BLEU, it is inferior to other metrics,and it has been overused.
2. Run a paired significance test to reduce metricmisjudgement by random sampling variation.
3. Publish your system outputs on public testsets to allow comparison and recalculation ofdifferent metric scores.
2 Data
In this section, we describe test sets, the processfor collecting human assessments, and MT systemsused in our analysis. We publish all humanjudgements, metadata, calculated metrics scores,and the code with replication of our findings andpromoting further research. We cannot release theproprietary test sets and so system outputs for legalreasons. The collection is available at https://github.com/MicrosoftTranslator/ToShipOrNotToShip. Moreover, we plan toevaluate new metrics emerging in the future.
2.1 Test setsWhen evaluating our models, we use internal testsets where references are translated by professionaltranslators from monolingual data. Freitag et al.(2020) have demonstrated that the quality of testset references plays an important role in automaticmetric quality and correlation with human judge-ment. To maintain a high quality of our test sets,we create them by a two-step translation process:the first professional translator translates the textmanually without post-editing followed by a sec-ond independent translator confirming the qualityof the translations. The human translators are askedto translate sentences in isolation; however, theysee context from other sentences.
The test sets are created from authentic sourcesentences, mostly drawn from news articles (newsdomain) or cleaned transcripts of parliamentary dis-cussions (discussion domain). The news domaintest sets are used in both directions, where the au-thentic side is mostly English, Chinese, French, or
German. The discussion domain test sets are usedin the direction from authentic source to transla-tionese reference, e.g., we have two distinct testsets, one for English to Polish and second for Pol-ish to English. Furthermore, some systems areevaluated using various other test sets.
We evaluate 101 different languages within 232translation directions.1 The size of the test sets canvary, and more than one test set or its subsets can beused for a single language direction. The averagesize of our test sets is 1017 sentences. The distri-bution of evaluated systems is not uniform, somelanguage pairs are evaluated only a few times andwhile others repeatedly with different systems. Themajority of the language pairs are English-centric,however, we evaluate a small set of French, Ger-man, and Chinese-centric systems (together only90 system pairs). Details about the system countsof evaluated language pairs and average test setsizes can be found in the Appendix in Table 7.
2.2 Manual quality assessment
Our human evaluation is run periodically to con-firm translation quality improvements by humanjudgements. For this analysis, we use human an-notations performed from the middle of 2018 untilearly 2021. All human judgements were collectedwith identical settings with the same pool of humanannotators. Thus, the human annotations shouldhave similar distributions and characteristics.
The base unit of our human evaluation is calleda campaign, in which we commonly compare twoto four systems in equal conditions: We randomlydraw around 500 sentences from a test set, translatethem with each system and send them to human as-sessment. Each human annotator on average anno-tates 200 sentences, thus a system pair is evaluatedby five different annotators (each annotating dis-tinct set of sentences translated by both systems).
We use source-based Direct Assessment (DA,Graham et al., 2013) for collecting human judge-ments, where bilingual annotators are asked to rateall translated sentences on a continuous scale be-tween 0 to 100 against source sentence withoutaccess to reference translations. This eliminatesreference bias from human judgement by design.
We use the implementation of DA in the Ap-praise evaluation framework (Federmann, 2018),
1We compare metrics only over the intersection of lan-guages supported by all evaluated metrics, which means thatwe use only 39 different target languages when Prism is partof the evaluation.

the same as is used in WMT since 2016 for out-of-English human evaluation (Bojar et al., 2016a).
We do not use crowd workers as human annota-tors. Instead, we use paid bi-lingual speakers thatare familiar with the topic and well-qualified inthe annotation process. Moreover, we track theirperformance, and those who fail quality control(Graham et al., 2013) are permanently removedfrom the pool of annotators, so are their latest an-notations. This increases the overall quality of ourhuman quality assessment.
We have two additional constraints in contrast tothe original DA. Firstly, each system is comparedon the same set of sentences which removes theproblem of a system potentially benefitting froman easier set of randomly selected sentences. More-over, it allows us to use a stronger paired test thatcompares differences in scoring of equal sentencesinstead of an unpaired one that evaluates scores ofboth systems in isolation. We use the Wilcoxonsigned-rank test (Wilcoxon, 1946) in contrast to theMann-Whitney U-test (Mann and Whitney, 1947)originally suggested for DA (Graham et al., 2017).Secondly, each annotator is assigned the same num-ber of sentences for each evaluated system whichmitigates bias from different rating strategies aseach system is affected evenly by each annotator.
When calculating the system score, we take theaverage of human judgements.2 We analyze humanjudgements for 4380 systems and 2.3 M annotatedsentences. This data is one and a half orders ofmagnitude larger than the data used at WMT MetricShared Tasks, which evaluate around 170 systemseach year (see Section 6).
2.3 Systems
We evaluate competing systems against humanjudgement. The system pairs could be separatedinto three groups: (1) model improvements, (2)state-of-the-art evaluation, and (3) comparisonswith third-party models. The first group containssystem pairs where one system is a strong base-line (usually our highest quality system so far)and the second system is an improved candidatemodel; this group evaluates stand-alone modelswithout additional pre- and post-processing steps(e.g., rule-based named entity matching). The sec-ond group contains pairs of the candidate for thenew best performing system and the current best
2We do not assume a normal distribution of annotator’sannotations; therefore, we do not use z-score transformation.
Metric
Sent
ence
-lev
el
Use
hum
anda
ta
Nee
dre
fere
nce
Mul
tiple
refe
r.
Lan
guag
es
stri
ng-b
ased BLEU — — D D any
CharacTER D — D — anyChrF D — D — anyEED D — D — anyTER D — D — any
pret
rain
ed
BERTScore D — D — 104BLEURT D D D — *COMET D D D — 100ESIM D D D — 104Prism D — D — 39COMET-src D D — n/a 100Prism-src D — — n/a 39
Table 1: Comparison of selected string-based and pre-trained automatic evaluation metrics. We mark met-rics designed to work at sentence-level, fine-tunedon human judgements, requiring reference(s), or sup-porting multiple references, and report the number ofsupported languages. *BLEURT is built on top ofEnglish-only BERT (Devlin et al., 2019) in contrast toBERTScore and ESIM that use multilingual BERT.
performing system. The third group compares ourbest-performing model at the time with a publiclyavailable third-party MT system.
Analyzing the variety of systems, hyperparame-ters, training data, and even architectures is out ofthe scope of this paper. However, all models arebased on neural architectures.
3 Automatic metrics
In this study, we investigate metrics that wereshown to provide promising performance in re-cent studies (see Section 6) and currently mostwidely used metrics in the MT field.3 We focuson language-agnostic metrics, therefore we do notinclude metrics supporting only a small set of lan-guages. The full list of evaluated metrics and theirmain features is presented in Table 1.
Two categories of automatic machine translationmetrics can be distinguished: (1) string-based met-rics and (2) metrics using pretrained models. Theformer compares the coverage of various substringsbetween the human reference and MT output texts.String-based methods largely depend on the qualityof reference translations. However, their advantageis that their performance is predictable as it can be
3The YiSi – high correlating metric (Ma et al., 2019) – wasnot publicly available at the time of our evaluation.
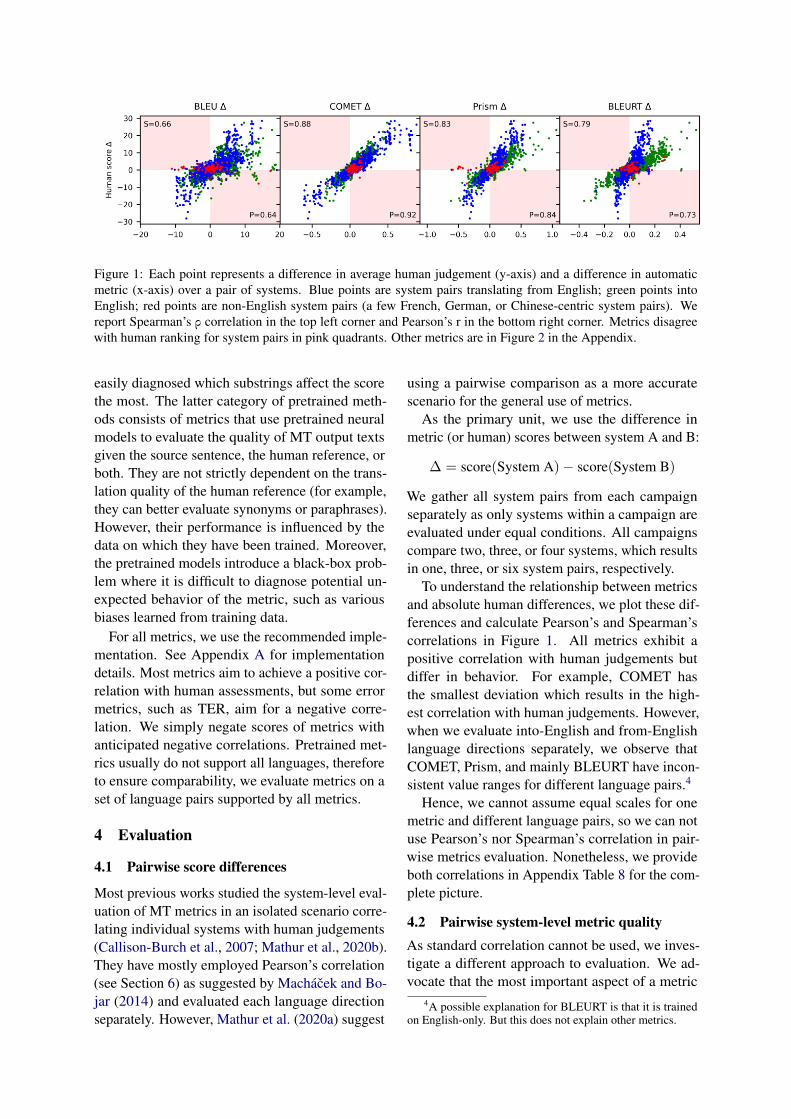
Figure 1: Each point represents a difference in average human judgement (y-axis) and a difference in automaticmetric (x-axis) over a pair of systems. Blue points are system pairs translating from English; green points intoEnglish; red points are non-English system pairs (a few French, German, or Chinese-centric system pairs). Wereport Spearman’s ρ correlation in the top left corner and Pearson’s r in the bottom right corner. Metrics disagreewith human ranking for system pairs in pink quadrants. Other metrics are in Figure 2 in the Appendix.
easily diagnosed which substrings affect the scorethe most. The latter category of pretrained meth-ods consists of metrics that use pretrained neuralmodels to evaluate the quality of MT output textsgiven the source sentence, the human reference, orboth. They are not strictly dependent on the trans-lation quality of the human reference (for example,they can better evaluate synonyms or paraphrases).However, their performance is influenced by thedata on which they have been trained. Moreover,the pretrained models introduce a black-box prob-lem where it is difficult to diagnose potential un-expected behavior of the metric, such as variousbiases learned from training data.
For all metrics, we use the recommended imple-mentation. See Appendix A for implementationdetails. Most metrics aim to achieve a positive cor-relation with human assessments, but some errormetrics, such as TER, aim for a negative corre-lation. We simply negate scores of metrics withanticipated negative correlations. Pretrained met-rics usually do not support all languages, thereforeto ensure comparability, we evaluate metrics on aset of language pairs supported by all metrics.
4 Evaluation
4.1 Pairwise score differences
Most previous works studied the system-level eval-uation of MT metrics in an isolated scenario corre-lating individual systems with human judgements(Callison-Burch et al., 2007; Mathur et al., 2020b).They have mostly employed Pearson’s correlation(see Section 6) as suggested by Machácek and Bo-jar (2014) and evaluated each language directionseparately. However, Mathur et al. (2020a) suggest
using a pairwise comparison as a more accuratescenario for the general use of metrics.
As the primary unit, we use the difference inmetric (or human) scores between system A and B:
∆ = score(System A)− score(System B)
We gather all system pairs from each campaignseparately as only systems within a campaign areevaluated under equal conditions. All campaignscompare two, three, or four systems, which resultsin one, three, or six system pairs, respectively.
To understand the relationship between metricsand absolute human differences, we plot these dif-ferences and calculate Pearson’s and Spearman’scorrelations in Figure 1. All metrics exhibit apositive correlation with human judgements butdiffer in behavior. For example, COMET hasthe smallest deviation which results in the high-est correlation with human judgements. However,when we evaluate into-English and from-Englishlanguage directions separately, we observe thatCOMET, Prism, and mainly BLEURT have incon-sistent value ranges for different language pairs.4
Hence, we cannot assume equal scales for onemetric and different language pairs, so we can notuse Pearson’s nor Spearman’s correlation in pair-wise metrics evaluation. Nonetheless, we provideboth correlations in Appendix Table 8 for the com-plete picture.
4.2 Pairwise system-level metric qualityAs standard correlation cannot be used, we inves-tigate a different approach to evaluation. We ad-vocate that the most important aspect of a metric
4A possible explanation for BLEURT is that it is trainedon English-only. But this does not explain other metrics.

is to make reliable binary pairwise decisions (i.e.,which of two systems provides a higher translationquality) without the focus on the magnitude of dif-ference.5 Therefore, given the size of our data set,we propose to use accuracy on binary comparisons:which system is better when human rankings areconsidered gold labels.
We define the accuracy as follows. For each sys-tem pair, we calculate the difference of the metricscores (metric∆) and the difference in average hu-man judgements (human∆). We calculate accuracyfor a given metric as the number of rank agree-ments between metric and human deltas divided bythe total number of comparisons:
Accuracy =|sign(metric∆) = sign(human∆)|
|all system pairs|
Assuming human judgements as a gold labels, ac-curacy gets an intrinsic meaning of how „reliable”a given metric is when making pairwise compar-isons. On the other hand, accuracy does not takeinto account that two systems can have comparablequality, and thus the accuracy of a metric can beover-estimated by chance if a small human scoredifference has the same sign as the difference ina metric score. To overcome this issue, we alsocalculate accuracy over a subset of system pairs,where we remove system pairs that are deemed tonot be different based on Wilcoxon’s signed-ranktest over human judgements.
In order to estimate the confidence interval foraccuracy, we use the bootstrap method (Efron andTibshirani, 1994), for more details see Appendix B.We consider all metrics that fall into the 95% con-fidence interval of the best performing metric tobe comparable. We visualize the clusters of best-performing metrics in our analysis with a grey back-ground of table cells.
5 Results
5.1 Which metric is best suited for pairwisecomparison?
In this section, we examine all available systempairs and investigate which metric is best suited formaking a pairwise comparison.
The results presented in Table 2 show that pre-trained methods (except for Prism-src) generallyhave higher accuracy than string-based methods,
5The value of score difference (e.g., a difference of 2BLEU) is important mainly to measure the confidence ofa ranking decision.
All 0.05 0.01 0.001 Withinn 3344 1717 1420 1176 541
COMET 83.4 96.5 98.7 99.2 90.6COMET-src 83.2 95.3 97.4 98.1 89.1Prism 80.6 94.5 97.0 98.3 86.3BLEURT 80.0 93.8 95.6 98.2 84.1ESIM 78.7 92.9 95.6 97.5 82.8BERTScore 78.3 92.2 95.2 97.4 81.0ChrF 75.6 89.5 93.5 96.2 75.0TER 75.6 89.2 93.0 96.2 73.9CharacTER 74.9 88.6 91.9 95.2 74.1BLEU 74.6 88.2 91.7 94.6 74.3Prism-src 73.4 85.3 87.6 88.9 77.4EED 68.8 79.4 82.4 84.6 68.2
Table 2: Accuracies for binary comparisons for rank-ing system pairs. Column “All” shows the results forsystem pairs. Each following column evaluates accu-racy over a subset of systems that are deemed differentbased on human judgement and a given alpha level inWilcoxon’s test. Column “Within” represents a subsetof systems where the human judgement p-value is be-tween 0.05 and 0.001. “n” represents the number ofsystem pairs used to calculate accuracies in a given col-umn. Only the scores in each column are comparable.Results with a grey background are considered to betied with the best metric.
which confirms findings from other studies (Maet al., 2018, 2019; Mathur et al., 2020b). COMETreaches the highest accuracy and therefore is themost suited for ranking system pairs. The runner-up is COMET-src, which is a surprising result be-cause, as a quality estimation metric, it does not usea human reference. This opens possibilities to usemonolingual data in machine translation systemsevaluation in an effective way. On the other hand,the second reference-less method Prism-src doesnot reach high accuracy, struggling mainly withinto-English translation directions (see Figure 2 inthe Appendix). In terms of string-based metrics,the highest accuracy is achieved by ChrF, whichmakes it a better choice for comparing system pairsthan the widely used BLEU.
To minimize the risk of being affected by ran-dom flips due to a small human score delta, wealso explore the accuracy after removing sys-tems with comparable performance with respectto Wilcoxon’s test over human judgements. We in-crementally remove system pairs not significantlydifferent with alpha levels of 0.05, 0.01, and 0.001.As expected, removing pairs of most likely equal-quality systems increases the accuracy, however,no metric reaches 100% accuracy even for a set of

Everything Into EN From EN Non Latin Logograms Non WMT Discussionn 1717 ↓ 922 768 131 44 484 78
COMET 96.5 95.3 98.3 96.2 90.9 97.3 93.6COMET-src 95.3 93.5 97.7 95.4 88.6 96.7 93.6Prism 94.5 92.2 98.2 96.2 90.9 96.9 83.3BLEURT 93.8 93.8 95.1 93.1 84.1 94.6 89.7ESIM 92.9 90.6 96.6 93.9 86.4 94.8 76.9BERTScore 92.2 91.2 94.1 95.4 88.6 92.8 71.8ChrF 89.5 88.7 91.0 95.4 88.6 89.7 57.7TER 89.2 87.6 91.7 90.1 72.7 90.9 70.5CharacTER 88.6 86.4 91.7 88.5 70.5 91.9 69.2BLEU 88.2 86.9 90.5 92.4 79.5 89.9 61.5Prism-src 85.3 80.8 91.4 84.0 65.9 91.7 84.6EED 79.4 75.1 84.8 82.4 54.5 83.1 60.3
Table 3: Accuracies for ranking system pairs. Each column represents a different subset of significantly differentsystem pairs with alpha level 0.05. Results with a grey background are considered to be tied with the best metric.Accuracies across columns are not comparable as they compare different sets of systems.
strongly different systems with an alpha level of0.001. This implies that either current metrics can-not fully replace human evaluation or remainingsystems are incorrectly assessed by human anno-tators.6 Moreover, we observe that the ordering ofmetrics by accuracy remains the same even after re-moving system pairs with comparable performance,which implies that accuracy is not negatively af-fected by non-significantly different system pairs.Due to that where we analyze only subsets of thedata, we use systems that are statistically differentby human judgement with an alpha level of 0.05.
Ma et al. (2019) have observed that system out-liers, i.e., systems easily differentiated from othersystems, can inflate Pearson’s correlation values.Moreso, Mathur et al. (2020a) demonstrated that af-ter removing outliers some metrics would actuallyhave negative correlation with humans. To analyzeif outliers might affect our accuracy measurementsand the ordering of metrics, we analyze a subset ofsystems with human judgement p-values between0.05 and 0.001, i.e. removing system pairs thathave equal quality and outlier system pairs thatare easily distinguished. From column “Within”in Table 2, we see that the ordering of metrics re-mains unchanged. This shows that accuracy is notaffected by outliers making it more suitable formetrics evaluation than Pearson’s ρ.
6An alpha level of 0.001 could (mis)lead to the conclusionthat 0.1% of human judgements are incorrect. However, thealpha level only determines if two systems are different enoughand cannot be used to conclude that a human pairwise rankdecision is incorrect.
5.2 Are metrics reliable for non-Englishlanguages and other scenarios?
The superior performance of pretrained metricsraises the question if unbalanced annotation datamight be responsible; around half of the systemstranslate into English. Moreover, COMET andBLEURT are fine-tuned on human annotationsfrom WMT on the news domain. This could leadto an unfair advantage when being evaluated w.r.t.human judgements.7 To shed more light on metricsbehavior and robustness, we analyze various sub-sets, including into and from English translationdirections, languages with non-Latin scripts, andnon-news domain.
We showed in Section 4.1 that some metrics per-form differently for systems translating from andinto English. Analyzing this scenario in Table 3reveals that BLEURT does better (the second bestmetric) for “into English” translation compared toother metrics. It is surprising that BLEURT hasa high accuracy for unseen “from English” pairswhich suggests that BLEURT might have learnedsome kind of string-matching. We also observein Table 3 gains for Prism for the “from English”directions. The overall ranking of metrics, how-ever, remains similar which confirms that the highaccuracy of pretrained methods compared to thestring-based ones cannot be attributed to the abun-dance of system pairs with English as the target.
7We double-checked and removed all campaigns contain-ing test sets from WMT 2015 to 2020 from our work andanalysis.

When investigating language pairs with non-Latin (Arabic, Russian, Chinese, ...) or logogram-based scripts (Chinese, Korean and Japanese) asthe target languages, we observe a slight drop inmetric ranks for some pretrained metric in contrastto higher score for ChrF. This indicates that non-Latin scripts might be a challenge for pretrainedmetrics but more analysis would be required here.For an summary on individual language pairs, referto Table 9 in the Appendix.
We also investigate if some pretrained methodsmight have an unfair advantage due to being fine-tuned on human assessments in the news domain.For this, we analyze a subset of news test sets withtarget languages that were not part of WMT humanevaluation (i.e., languages which those methodshave not been fine-tuned on) and call this set “non-WMT”, and also system pairs evaluated on a propri-etary test sets in the EU parliamentary discussionsdomain covering ten languages. Neither results onnon-WMT nor discussion domains in Table 3 showa change in the ranking of metrics, suggesting thatCOMET is not overfitted to the WMT news domainor WMT languages. Somewhat surprisingly, weactually see a drop in accuracy for the string-basedmetrics for the discussion domain. We speculatethis might be due to their inability to forgivinglymatch disfluent utterances to expected fluent trans-lations (Salesky et al., 2019).
Overall, the results for various subsets show asimilar ordering of metrics based on their accuracy,confirming the general validity of our results.
5.3 Are statistical tests on automatic metricworth it?
Mathur et al. (2020a) studied the effects of statisti-cal testing of automatic metrics and observed thateven large metric score differences can disagreewith human judgement. They have shown that evenfor a BLEU delta of 3 to 5 points, a quarter of thesesystems are judged by humans to differ insignifi-cantly in quality or to contradict the verdict of themetric. In our analysis, we have 203 system pairsdeemed statistically significant by humans (p-valuesmaller than 0.05) for which using BLEU resultsin a flipped ranking compared to humans. Themedian BLEU difference for these system pairsis 1.3 BLEU points. This is concerning as BLEUdifferences higher than one or two BLEU pointsare commonly and historically considered to bereliable by the field.
No test Boot. ↓ Type II Err.
COMET 83.4 95.1 204 (17.3%)COMET-src 83.2 94.2 242 (19.4%)BLEURT 80.0 92.0 349 (25.4%)Prism 80.6 91.3 200 (18.3%)BERTScore 78.3 87.9 244 (20.9%)ChrF 75.6 85.4 350 (27.3%)BLEU 74.6 83.4 378 (27.4%)Prism-src 73.4 81.5 325 (29.4%)
Table 4: The first column shows accuracy for all sys-tem pairs and represent situation, where we would trustany small score difference. The second column showsaccuracy, where we ignore systems considered to betied with respect to the paired bootstrap resamplingtest. The third column represents the number of systempairs incorrectly decided to be non-significantly differ-ent by the paired bootstrap resampling and the percent-age from all non-significant systems.
In this section, we corroborate that statisticalsignificance testing can largely increase the confi-dence of the MT quality improvement and increasethe accuracy of metrics. We compare how accu-rate a metric would be under two situations: eitherwhen not using statistical testing and solely trust-ing in the metric score difference; or when usingstatistical testing and throwing away systems thatare not statistically different.
We evaluated the first situation in Section 5.1and the results are equal with the first column ofTable 2. For the second situation, we calculateaccuracy only over the system pairs that are statisti-cally different. We use paired bootstrap resampling(Koehn, 2004), a non-parametric test, to calculatethe statistical significance for a pair of systems.8
Additionally, the second situation introducestype II errors which represent systems where thestatistical significance test rejected a system pairas being non-significant, but humans would judgethe given pair as significantly different. In otherwords, it shows how many system pairs are incor-rectly rejected as non-significantly different. SeeAppendix C for a detailed explanation.
From the results in Table 4, we can see thatif we apply paired bootstrap resampling on auto-matic metrics with an alpha level 0.05 the accuracyincreases by around 10% for all metrics in con-
8Approximate randomization (Riezler and Maxwell III,2005) can be used as an alternative test, and for metrics basedon the average of sentence-level scores, we can use also testssuch as the Student t-test.

trast to not using statistical testing. On the otherhand, when using statistical testing, we introducetype II errors, where 17.3%, for COMET, of non-significantly different system pairs are deemed sig-nificantly different by humans.9
In conclusion, we corroborate that using statis-tical significance tests largely increases reliabilityin automatic metric decisions. We encourage theusage of statistical significance testing, especiallyin the light of Marie et al. (2021) who show thatstatistical significance tests are widely ignored.
5.4 Does BLEU sabotage progress in MT?
Freitag et al. (2020) have shown that referencetranslations with string-based metrics may system-atically bias against modeling techniques known toimprove human-judged quality and raised the ques-tion of whether previous research has incorrectlydiscarded approaches that improved the quality ofMT due to the use of such references and BLEU.They argue that the use of BLEU might have mis-lead many researcher in their decisions.
In this section, we investigate the hypothesis ifthe usage of BLEU negatively affects model selec-tion. To do so, we compare two groups of systempairs based on the premise if they could be directlyaffected by BLEU. The first group contains pairsof incremental improvements of our systems. Wecan assume that incremental models use similararchitecture, data, and settings, although we donot study particular changes. We use BLEU as themain automatic metric to guide model development.If BLEU shows improvements, we evaluate modelswith human judgements to make a final deploymentdecision. Therefore, systems with degraded BLEUscores which would be deemed improved by hu-mans are missing in this group as we reject thembased on BLEU scores during development. Thesecond group contains independent system pairs,which use different architectures, data, settings,and therefore BLEU has not been used to preselectthem. In this group, we compare our systems withpublicly available third-party MT systems.
We compare three models within the same cam-paign, two internal10 and one external system.Thus, the same annotators annotated the same sen-tences from all three systems under the same con-ditions. We call system pairs comparisons between
9Wilcoxon’s test on human judgement and alpha level 0.05.10The pair of internal models contains the best model from
the last year and our latest improved model.
Incremental Independentn 161 ↓ 246
BLEU 99.4 90.7BERTScore 98.8 91.5ESIM 98.8 92.3Prism 98.1 94.3ChrF 98.1 91.5COMET 98.1 98.4COMET-src 97.5 98.8CharacTER 97.5 89.8Prism-src 96.9 92.7BLEURT 96.9 93.5TER 95.7 91.5EED 78.9 78.0
Table 5: Evaluation of incremental and independentsystem pairs. We use a subset of 333 system pairs sig-nificantly different based on Wilcoxon’s test and alphalevel of 0.05 over human judgement. Results with greybackground are considered tied with the best metric.
two internal models “incremental”, and compar-isons between the newer internal model and theexternal model as “independent”.
Over the past three years we carried out 333campaigns across 17 language pairs (each cam-paign comparing three models), resulting in almost530000 human annotations.
The results in Table 5 show that for independentsystems, the ranking of the metrics is comparablewith results in Table 3. Pretrained metrics generallyoutperform string-based ones and COMET is in thelead. However, when inspecting the incrementalsystems, BLEU wins. This indicates that BLEUinfluenced our model development and we rejectedmodels that would have been preferred by humans.
Another possible explanation is that systems pre-selected by BLEU are easy to differentiate by allmetrics. This could explain why all metrics havehigh accuracy in contrast to the “Independent” col-umn and most of them are in a single cluster.
In conclusion, results showing BLEU as the met-ric with the highest accuracy where we would ex-pect pretrained metrics to dominate, suggests thatBLEU affected system development and we re-jected improved models due to the erroneous degra-dation seen in the BLEU score. However, thisis indirect evidence as for sound conclusions wewould need to evaluate those rejected systems withother metrics and human judgement as well.

WMT Metric task 2020b 2020b 2019 2018 2017 2016b 2015 2014 2013↓ n 168 (no outliers) 184 225 149 152 120 121 92 135
stri
ng-b
ased
BLEU .740 (.727) .837 (.832) .906 .955 .910 .873 .841 .910 .845CharacTER .735 (.723) .873 (.871) .942 .964 .932 .938ChrF .743 (.730) .743 (.864) .948 .959 .942 .911 .908EED .762 (.750) .888 (.885) .951METEOR .900 .884 .878NIST .860 .970 .921 .870 .854 .899 .834TER .609 (.668) .704 (.763) .922 .953 .918 .863 .837 .860 .788WER .917 .934 .913 .846 .829 .818 .752
pret
rain
ed
BEER .942 .973 .938 .925 .942BLEURT .764 (.752) .902 (.900)COMET .711 (.762) .853 (.908)ESIM .770 (.755) .906 (.902)Prism .677 (.710) .846 (.886)YiSi-1 .759 (.744) .894 (.890) .967 .973
Table 6: “n” is sum of systems in each study used to calculate aggregated correlation. The results in brackets arewithout systems on English into Chinese. Correlations are comparable only within columns.
6 Meta Analysis
We analyze findings from past research to put ourresults in the broader context. We focus on theresults on the system-level evaluation, however, alarge part of the research studied a sentence-levelevaluation. The largest source of metrics evalu-ation is yearly WMT Metric Shared Task occur-ring over more than the past ten years (Callison-Burch et al., 2007), where various methods areevaluated with human judgement over the set ofsubmitted systems and language pairs in WMTNews Translation Shared Tasks. Recently, Freitaget al. (2021) reevaluated two translation directionsfrom WMT 2020 with the multidimensional qualitymetric framework and raised a concern that gen-eral crowd-sourced annotators used in into-Englishevaluation in WMT prefer literal translations andhave a lower quality than some automatic metrics.
Past studies evaluate system-level correlationswith Pearson’s correlation calculated for each trans-lation direction separately. We are interested in howmetrics correlate with human judgement in generalacross different language pairs. Thus, to general-ize the past findings, we use the Hunter-Schmidtmethod (Hunter and Schmidt, 2004), which allowscombining already calculated correlations with var-ious sizes. We use it to generalize correlationswithin each study across all language pairs. For thispurpose, Hunter-Schmidt is effectively a weightedmean of the raw correlation coefficients.
Although past studies evaluated a larger numberof methods and their variants, we have selected asubset of metrics that are evaluated in more thanone study or showed promising performance over
other metrics in a given study. When a study eval-uated several variants of a metric with various pa-rameters, we selected the setting closest to eitherthe recommended setting in the recent years, suchas SacreBLEU, or a setting that is used in the laterevaluation study, mainly in Mathur et al. (2020b).
Meta-analysis in Table 6 shows that pretrainedmethods outperform string-based methods as con-cluded by Mathur et al. (2020b); Ma et al. (2019,2018). The second important observation is thatthere was not a single year where BLEU had ahigher correlation than ChrF. This supports ourconclusions and shows that the MT communityhad results supporting the deprecation of BLEU asa standard metric for several years. Comparing thepretrained methods, ESIM is the best performingmethod in general (Mathur et al., 2020b), whileCOMET is the best performing method when re-moving the suspicious system.
In the study by Mathur et al. (2020b), COMETunder-performed other pretrained metrics. Wefound out that submitted COMET scores failed toscore one English-Chinese system with tokenizedoutput. However, we obtain valid COMET scoreson that system output when replicating the results.Moreover, we have not seen any problems withCOMET on Chinese. As this one system largelyskews Pearson’s correlation, we also present analy-sis without English-Chinese systems in Table 6.
7 Discussion
We corroborate results from past studies that pre-trained methods are superior to string-based ones.However, pretrained methods are relatively new

techniques and we can potentially discover signif-icant drawbacks, for example, they could resem-ble biases from training data, fail on particular do-mains, or prefer fluency over adequacy. Anotherproblem could arise if an MT system would betrained on the same data as the metric was or if it in-corporates the same pretrained model, for example,XLM-R (Conneau et al., 2020) used by COMET.Pretrained methods support only a selected set oflanguages and the quality can differ for each ofthem. Thus, we argue that the string-based methodshould be used as a secondary metric.
An interesting solution to dissipate potentialdrawbacks of any metric would be if different re-search groups preselect a different primary pre-trained metric in advance to lead their researchdecisions and to discover improvements not appar-ent under other metrics. However, we fear that itcould lead to “metric-hacking”, i.e., picking a met-ric that confirms results. Therefore, we recommendusing COMET as the primary metric. And to useChrF, the best performing string-based method, asa secondary metric and for unsupported languages.
A surprising results is the high accuracy ofCOMET-src, a reference-free metric. It allows auto-matic evaluation over monolingual domain-specifictestsets as suggested by Agrawal et al. (2021).
Limitations of BLEU are well-known (Reiter,2018; Mathur et al., 2020a). Callison-Burch et al.(2006) argued that MT community is overly re-liant on it, which Marie et al. (2021) confirmed byshowing that 98.8% of MT papers use BLEU. Wepresent indirect evidence that the over-use of BLEUnegatively affects MT development and supportdeprecation of BLEU as the evaluation standard.
We show that the reliability of metrics decisionscan be increased with statistical significance tests.However, Dror et al. (2018) point out the assump-tion of statistical significance tests that data sam-ples are independent and adequately distributed israrely true. Also, statistical significance tests do notaccount for random seed variation across trainingruns. Thus, one should be cautious when makingconclusions based on small metrics improvements.Wasserstein et al. (2019) give recommendations fora better use of statistical significance testing.
Marie et al. (2021) have shown that almost 40%of MT papers from 2020 copied score from dif-ferent papers without recalculating them, which isa concerning trend. Also, new and better metricswill emerge and there is no need to permanently
adhering to a single metric. Instead, the simplestand most effective solution to avoid the need tocopy scores or stick to obsolete metric is to alwayspublish translated outputs of test sets along withthe paper. This allows anyone to recalculate scoreswith different tools and/or metrics and makes com-parisons with past (and future) research easier.
There are some shortcomings in our analysis.We have only a handful of non-English systems,therefore we cannot conclude anything about thebehaviour of the metrics for language pairs withoutEnglish. Similarly, the majority of our languagepairs are high-resource, therefore, we cannot con-clude the reliability of metrics for low-resource lan-guages. Lastly, many of our translation directionsare from translationese into authentic, which asZhang and Toral (2019) showed is the easier direc-tion for systems to score high by human judgement.These are potential directions of future work.
Lastly, we assume that human judgement is thegold standard. However, we need to keep in mindthat there can be potential drawbacks of the methodused for human judgement or human annotators failto capture true assessment as Freitag et al. (2021)observe. For example, humans cannot explicitlymark critical errors in DA and instead they usuallyassign low assessment scores.
8 Conclusion
We show that metrics can use a different scale fordifferent languages, so Pearson’s correlation cannotbe used. We introduce accuracy as a novel evalua-tion of metrics in a pairwise system comparison.
We use and release a large collection of the hu-man judgement confirming that pretrained metricsare superior to string-based. COMET is the bestperforming metric in our study, and ChrF is the bestperforming string-based method. The surprisingeffectiveness of COMET-src could allow the use oflarge monolingual test sets for quality estimation.
We do not see any drawbacks of the metricswhen investigating various languages or domains,especially, for methods pretrained on human judge-ment. We present indirect evidence that the over-use of BLEU negatively affects MT development.
We show that statistical testing of automatic met-rics largely increases the reliability of a pairwisedecision based on automatic metric scores.
We endorse the recommendation for publishingtranslated outputs of research systems to allow com-parisons and recalculation of scores in the future.

Acknowledgments
We are grateful for a feedback and review of the pa-per to many researchers, namely: Shuoyang Ding,Markus Freitag, Hieu Hoang, Alon Lavie, JindrichLibovický, Nitika Mathur, Mathias Müller, MartinNejedlý, Martin Popel, Matt Post, Qingsong Ma,Richardo Rei, Thibault Sellam, Aleš Tamchyna,anonymous reviewers, and our colleagues.
ReferencesSweta Agrawal, George Foster, Markus Freitag, and
Colin Cherry. 2021. Assessing reference-free peerevaluation for machine translation. In Proceedingsof the 2021 Conference of the North American Chap-ter of the Association for Computational Linguistics:Human Language Technologies, pages 1158–1171,Online. Association for Computational Linguistics.
Ondrej Bojar, Rajen Chatterjee, Christian Federmann,Yvette Graham, Barry Haddow, Matthias Huck,Antonio Jimeno Yepes, Philipp Koehn, VarvaraLogacheva, Christof Monz, Matteo Negri, Aure-lie Neveol, Mariana Neves, Martin Popel, MattPost, Raphael Rubino, Carolina Scarton, Lucia Spe-cia, Marco Turchi, Karin Verspoor, and MarcosZampieri. 2016a. Findings of the 2016 confer-ence on machine translation. In Proceedings ofthe First Conference on Machine Translation, pages131–198, Berlin, Germany. Association for Compu-tational Linguistics.
Ondrej Bojar, Yvette Graham, and Amir Kamran. 2017.Results of the WMT17 Metrics Shared Task. InProceedings of the Second Conference on MachineTranslation, Volume 2: Shared Task Papers, pages489–513, Copenhagen, Denmark. Association forComputational Linguistics.
Ondrej Bojar, Yvette Graham, Amir Kamran, andMiloš Stanojevic. 2016b. Results of the WMT16Metrics Shared Task. In Proceedings of the FirstConference on Machine Translation, pages 199–231,Berlin, Germany. Association for ComputationalLinguistics.
Chris Callison-Burch, Cameron Shaw Fordyce, PhilippKoehn, Christof Monz, and Josh Schroeder. 2007.(Meta-) evaluation of machine translation. In Pro-ceedings of the Second Workshop on Statistical Ma-chine Translation, pages 136–158.
Chris Callison-Burch, Miles Osborne, and PhilippKoehn. 2006. Re-evaluating the role of Bleu in ma-chine translation research. In 11th Conference ofthe European Chapter of the Association for Com-putational Linguistics, Trento, Italy. Association forComputational Linguistics.
Alexis Conneau, Kartikay Khandelwal, Naman Goyal,Vishrav Chaudhary, Guillaume Wenzek, Francisco
Guzmán, Edouard Grave, Myle Ott, Luke Zettle-moyer, and Veselin Stoyanov. 2020. Unsupervisedcross-lingual representation learning at scale. InProceedings of the 58th Annual Meeting of the Asso-ciation for Computational Linguistics, pages 8440–8451, Online. Association for Computational Lin-guistics.
Jacob Devlin, Ming-Wei Chang, Kenton Lee, andKristina Toutanova. 2019. BERT: Pre-training ofdeep bidirectional transformers for language under-standing. In Proceedings of the 2019 Conferenceof the North American Chapter of the Associationfor Computational Linguistics: Human LanguageTechnologies, Volume 1 (Long and Short Papers),pages 4171–4186, Minneapolis, Minnesota. Associ-ation for Computational Linguistics.
Rotem Dror, Gili Baumer, Segev Shlomov, and Roi Re-ichart. 2018. The hitchhiker’s guide to testing statis-tical significance in natural language processing. InProceedings of the 56th Annual Meeting of the As-sociation for Computational Linguistics (Volume 1:Long Papers), pages 1383–1392.
Bradley Efron and Robert J Tibshirani. 1994. An intro-duction to the bootstrap. CRC press.
Christian Federmann. 2018. Appraise evaluationframework for machine translation. In Proceedingsof the 27th International Conference on Computa-tional Linguistics: System Demonstrations, pages86–88, Santa Fe, New Mexico. Association for Com-putational Linguistics.
Markus Freitag, George Foster, David Grangier, VireshRatnakar, Qijun Tan, and Wolfgang Macherey. 2021.Experts, errors, and context: A large-scale study ofhuman evaluation for machine translation. arXivpreprint arXiv:2104.14478.
Markus Freitag, David Grangier, and Isaac Caswell.2020. BLEU might be guilty but references are notinnocent. In Proceedings of the 2020 Conferenceon Empirical Methods in Natural Language Process-ing (EMNLP), pages 61–71, Online. Association forComputational Linguistics.
Yvette Graham, Timothy Baldwin, Alistair Moffat, andJustin Zobel. 2013. Continuous measurement scalesin human evaluation of machine translation. In Pro-ceedings of the 7th Linguistic Annotation Workshopand Interoperability with Discourse, pages 33–41,Sofia, Bulgaria. Association for Computational Lin-guistics.
Yvette Graham, Timothy Baldwin, Alistair Moffat, andJustin Zobel. 2017. Can machine translation sys-tems be evaluated by the crowd alone. Natural Lan-guage Engineering, 23(1):3–30.
Yvette Graham, Barry Haddow, and Philipp Koehn.2020. Statistical power and translationese in ma-chine translation evaluation. In Proceedings of the2020 Conference on Empirical Methods in Natural

Language Processing (EMNLP), pages 72–81, On-line. Association for Computational Linguistics.
John E Hunter and Frank L Schmidt. 2004. Methodsof meta-analysis: Correcting error and bias in re-search findings. Sage.
Philipp Koehn. 2004. Statistical significance tests formachine translation evaluation. In Proceedings ofthe 2004 conference on empirical methods in naturallanguage processing, pages 388–395.
Qingsong Ma, Ondrej Bojar, and Yvette Graham. 2018.Results of the WMT18 metrics shared task: Bothcharacters and embeddings achieve good perfor-mance. In Proceedings of the third conference onmachine translation: shared task papers, pages 671–688.
Qingsong Ma, Johnny Wei, Ondrej Bojar, and YvetteGraham. 2019. Results of the WMT19 metricsshared task: Segment-level and strong MT sys-tems pose big challenges. In Proceedings of theFourth Conference on Machine Translation (Volume2: Shared Task Papers, Day 1), pages 62–90.
Matouš Machácek and Ondrej Bojar. 2013. Results ofthe WMT13 Metrics Shared Task. In Proceedings ofthe Eighth Workshop on Statistical Machine Transla-tion, pages 45–51, Sofia, Bulgaria. Association forComputational Linguistics.
Matouš Machácek and Ondrej Bojar. 2014. Results ofthe WMT14 Metrics Shared Task. In Proceedingsof the Ninth Workshop on Statistical Machine Trans-lation, pages 293–301, Baltimore, Maryland, USA.Association for Computational Linguistics.
Henry B Mann and Donald R Whitney. 1947. On a testof whether one of two random variables is stochasti-cally larger than the other. The annals of mathemat-ical statistics, pages 50–60.
Benjamin Marie, Atsushi Fujita, and Raphael Rubino.2021. Scientific credibility of machine translationresearch: A meta-evaluation of 769 papers. arXivpreprint arXiv:2106.15195.
Nitika Mathur, Timothy Baldwin, and Trevor Cohn.2019. Putting evaluation in context: Contextualembeddings improve machine translation evaluation.In Proceedings of the 57th Annual Meeting of theAssociation for Computational Linguistics, pages2799–2808, Florence, Italy. Association for Compu-tational Linguistics.
Nitika Mathur, Timothy Baldwin, and Trevor Cohn.2020a. Tangled up in BLEU: Reevaluating the Eval-uation of Automatic Machine Translation Evalua-tion Metrics. In Proceedings of the 58th AnnualMeeting of the Association for Computational Lin-guistics, pages 4984–4997, Online. Association forComputational Linguistics.
Nitika Mathur, Johnny Wei, Markus Freitag, Qing-song Ma, and Ondrej Bojar. 2020b. Results ofthe WMT20 Metrics Shared Task. In Proceedingsof the Fifth Conference on Machine Translation,pages 688–725, Online. Association for Computa-tional Linguistics.
Kishore Papineni, Salim Roukos, Todd Ward, and Wei-Jing Zhu. 2002. Bleu: a Method for Automatic Eval-uation of Machine Translation. In Proceedings of40th Annual Meeting of the Association for Com-putational Linguistics, pages 311–318, Philadelphia,Pennsylvania, USA. Association for ComputationalLinguistics.
Maja Popovic. 2015. chrF: character n-gram F-scorefor automatic MT evaluation. In Proceedings of theTenth Workshop on Statistical Machine Translation,pages 392–395.
Matt Post. 2018. A Call for Clarity in Reporting BLEUScores. In Proceedings of the Third Conference onMachine Translation: Research Papers, pages 186–191, Belgium, Brussels. Association for Computa-tional Linguistics.
Mark Przybocki, Kay Peterson, Sébastien Bronsart,and Gregory Sanders. 2009. The NIST 2008 Met-rics for machine translation challenge—overview,methodology, metrics, and results. Machine Trans-lation, 23(2):71–103.
Ricardo Rei, Craig Stewart, Ana C Farinha, and AlonLavie. 2020. COMET: A Neural Framework for MTEvaluation. In Proceedings of the 2020 Conferenceon Empirical Methods in Natural Language Process-ing (EMNLP), pages 2685–2702, Online. Associa-tion for Computational Linguistics.
Ehud Reiter. 2018. A structured review of the validityof bleu. Computational Linguistics, 44(3):393–401.
Stefan Riezler and John T Maxwell III. 2005. On somepitfalls in automatic evaluation and significance test-ing for mt. In Proceedings of the ACL workshop onintrinsic and extrinsic evaluation measures for ma-chine translation and/or summarization, pages 57–64.
Elizabeth Salesky, Matthias Sperber, and AlexanderWaibel. 2019. Fluent translations from disfluentspeech in end-to-end speech translation. In Proceed-ings of the 2019 Conference of the North AmericanChapter of the Association for Computational Lin-guistics: Human Language Technologies, Volume 1(Long and Short Papers), pages 2786–2792, Min-neapolis, Minnesota. Association for ComputationalLinguistics.
Thibault Sellam, Dipanjan Das, and Ankur Parikh.2020. BLEURT: Learning Robust Metrics for TextGeneration. In Proceedings of the 58th AnnualMeeting of the Association for Computational Lin-guistics, pages 7881–7892, Online. Association forComputational Linguistics.

Matthew Snover, Bonnie Dorr, Richard Schwartz, Lin-nea Micciulla, and John Makhoul. 2006. A study oftranslation edit rate with targeted human annotation.In Proceedings of association for machine transla-tion in the Americas, volume 200. Citeseer.
Peter Stanchev, Weiyue Wang, and Hermann Ney. 2019.EED: Extended Edit Distance Measure for MachineTranslation. In Proceedings of the Fourth Confer-ence on Machine Translation (Volume 2: SharedTask Papers, Day 1), pages 514–520, Florence, Italy.Association for Computational Linguistics.
Miloš Stanojevic, Amir Kamran, Philipp Koehn, andOndrej Bojar. 2015. Results of the WMT15 Met-rics Shared Task. In Proceedings of the Tenth Work-shop on Statistical Machine Translation, pages 256–273, Lisbon, Portugal. Association for Computa-tional Linguistics.
Brian Thompson and Matt Post. 2020. Automatic Ma-chine Translation Evaluation in Many Languages viaZero-Shot Paraphrasing. In Proceedings of the 2020Conference on Empirical Methods in Natural Lan-guage Processing (EMNLP), Online. Association forComputational Linguistics.
Weiyue Wang, Jan-Thorsten Peter, Hendrik Rosendahl,and Hermann Ney. 2016. CharacTer: Translationedit rate on character level. In Proceedings of theFirst Conference on Machine Translation: Volume2, Shared Task Papers, pages 505–510, Berlin, Ger-many. Association for Computational Linguistics.
Ronald L. Wasserstein, Allen L. Schirm, and Nicole A.Lazar. 2019. Moving to a world beyond "p<0.05".The American Statistician, 73(sup1):1–19.
Frank Wilcoxon. 1946. Individual comparisons ofgrouped data by ranking methods. Journal of eco-nomic entomology, 39(2):269–270.
Mike Zhang and Antonio Toral. 2019. The effect oftranslationese in machine translation test sets. InProceedings of the Fourth Conference on MachineTranslation (Volume 1: Research Papers), pages 73–81, Florence, Italy. Association for ComputationalLinguistics.
Tianyi Zhang, Varsha Kishore, Felix Wu, Kilian Q.Weinberger, and Yoav Artzi. 2020. BERTScore:Evaluating Text Generation with BERT. In Interna-tional Conference on Learning Representations.
A Metrics Implementation Details
We use the most common implementation withdefault or recommended parameters to simulatestandard metric usage.
For BLEU (Papineni et al., 2002), ChrF(Popovic, 2015) and TER (Snover et al., 2006) met-rics, we use SacreBLEU implementation https://github.com/mjpost/sacrebleu/ ver-sion 1.5.0. We use “mteval-v13a” tokenizer for
all language pairs except for Chinese and Japanesewhich use their own tokenizer, as is recommended.
For CharacTER (Wang et al., 2016), weuse https://github.com/rwth-i6/CharacTER commit c4b25cb.
For EED (Stanchev et al., 2019), weuse https://github.com/rwth-i6/ExtendedEditDistance commit f944adc.
For BERTScore (Zhang et al., 2020), we usehttps://github.com/Tiiiger/bert_score version 0.3.7.
For BLEURT (Sellam et al., 2020), weuse the recommended model “bleurt-base-128”and implementation https://github.com/google-research/bleurt version 0.0.1. Itis important to mention, that BLEURT is fine-tunedfor English only. Additionally, we evaluated othervariants and “bleurt-large-512” performed betterthan recommended variant. We add it in Table 8.
For COMET (Rei et al., 2020), we use rec-ommended model “wmt-large-da-estimator-1719”and for COMET-src we use “wmt-large-qe-estimator-1719”. The implementation is https://github.com/Unbabel/COMET in version0.0.6. We evaluated all other COMET models, butneither performed better than recommended model.
For Prism and Prism-src (Thompson andPost, 2020), we use https://github.com/thompsonb/prism commit 06f10da.
For ESIM (Mathur et al., 2019), weuse https://github.com/nitikam/mteval-in-context.
B Confidence Interval for MetricAccuracy
To estimate the confidence interval for the bestperforming metric, we use the bootstrap method(Efron and Tibshirani, 1994). It creates multipleresamples (with replacement) from a set of obser-vations and calculates accuracy on each of theseresamples. We employ modified paired bootstrapresampling (Koehn, 2004), a method which we alsouse for testing statistical significance of the metricdifference in Section 5.3. However, the usage isdifferent.
To calculate the bootstrap resampling. First, wenote the best performing metric on all system pairsfrom the collection as metric α. We create 10 000resamples by drawing system pairs with replace-ments from the collection of all. For each resample,we calculate accuracy for all metrics. We note

which metrics have equal or higher accuracy thanmetric α in a given resample.
If metric α outperforms metric X by less than95% of the time, we draw the conclusion that met-ric X performs on par with 95% statistical signifi-cance to the winning metric α.
C Comparing Statistical Tests
The problem if two systems have the same MTquality is still an open question. Applying statisti-cal tests over the metric scores allows us to confirmif the difference in score is significant or due to arandom change based on the set of translated sen-tences and a given alpha level. To get the gold truthabout system equivalence, we employ Wilcoxon’stest on human judgement and alpha level 0.05. Weuse paired bootstrap resampling approach as thestatistical test for automatic metrics. Unfortunately,we cannot directly compare the outputs of two sta-tistical tests (for example, the Wilcoxon test onhuman judgements with the bootstrap resamplingon metric scores) as even with the same alpha level,these tests have a different power. Therefore, weneed to investigate it in isolation.
The null hypothesis in our setting is that bothevaluated systems have the same translation quality.There are two possible outcomes of a statisticaltest: accept the null hypothesis (i.e. MT qualityof systems is not significantly different) or rejectthe null hypothesis (i.e. MT quality of systems issignificantly different). When observing outcomesof statistical tests over human judgement and overautomatic metric, we get four possible outcomes:
Statistical test on a metricSignif. Not signif.
Hum
ans Signif.
Truly differingsystem pair
Type IIError
Notsignif.
Type I.Error
Systems with theequal MT Quality
There are two outcomes for the statistical testover a metric that we investigate separately.
In the first scenario, the bootstrap resamplingconfirms the statistical difference between systems.However, even when both tests agree that systemshave statistically different MT quality, it still mayhappen that humans and metrics disagree on whichsystem is better than the other. The goal is to evalu-ate how accurate metric decisions are if we employstatistical testing. Therefore, we are interested in
the accuracy of a metric over system pairs thatare deemed statistically different according to thepaired bootstrap resampling, in other words, accu-racy for system pairs that are either truly different(top left quadrant) or fall into type I. error (bottomleft quadrant).
In the second scenario, we want to find out howmany system pairs are diagnosed as non-significanteven though human judgements would deem themdifferent. For this scenario, we investigate for howmany system pairs bootstrap resampling fails toreject the null hypothesis. However, keep in mindthat two statistical tests cannot be directly com-pared because different tests have different powerand the type II error will differ based on that.

Figure 2: Each point represents a difference in average human judgement (y-axis) and a difference in automaticmetric (x-axis) over a pair of systems. Blue points are system pairs translating from English; green points are intoEnglish; red points are non-English systems (French, German, and Chinese centric). Spearman’s ρ correlation isin top left corner, while Pearson’s r is in the bottom right corner. Metrics disagree with human ranking for systempairs in pink quadrants. For better visualization, we have clipped few outliers in BLEU, ChrF, and TER plots.

Language pair Sys. Size Language pair Sys. Size Language pair Sys. Size
English - French 145 1034 English - Hindi 58 540 English - Ukrainian 25 988English - German 139 2544 Polish - English 57 1229 English - Slovak 25 1776French - English 131 1119 Portuguese - English 57 878 English - Irish 24 463German - English 122 1212 Swedish - English 57 1116 English - Persian 24 510Japanese - English 78 925 English - Arabic 56 1054 Slovak - English 23 1476Chinese - English 74 1029 Korean - English 56 1462 Greek - English 23 1526Italian - English 71 1156 Czech - English 55 1105 English - Croatian 22 1625English - Portuguese 70 1679 English - Hungarian 55 1018 English - Welsh 22 497English - Japanese 67 998 English - Korean 55 550 English - Norwegian 22 1533English - Swedish 66 1219 English - Turkish 55 1043 English - Hebrew 22 940English - Chinese 65 2443 English - Thai 54 510 English - Vietnamese 20 1857English - Danish 64 1186 Hindi - English 54 816 Welsh - English 20 1686English - Italian 64 1505 Turkish - English 54 1037 Vietnamese - English 20 1697English - Polish 64 1188 Danish - English 52 986 Catalan - English 20 928Spanish - English 64 1223 English - Russian 49 1159 English - Urdu 18 448Dutch - English 63 927 Russian - English 44 736 English - Finnish 17 1802English - Dutch 61 991 Thai - English 39 457 Tamil - English 16 834English - Indonesian 61 948 English - Catalan 30 981 English - Lithuanian 16 1997Indonesian - English 60 703 Hebrew - English 28 870 Lithuanian - English 16 1997English - Czech 59 1329 English - Romanian 27 1056 English - Maltese 16 489Arabic - English 59 2674 Romanian - English 27 1094 English - Kiswahili 16 457English - Spanish 58 1172 English - Greek 27 1936Hungarian - English 58 976 Persian - English 26 1372
Table 7: The column “Sys.” represents the number of systems for a given translation direction. We list onlytranslation directions with more than 15 evaluated systems. The column “Size” represents the average test set sizefor the given direction. We evaluate 232 translation directions in total.
All 0.05 Within Spearman Pearsonn 3344 1717 541 3347 3347
COMET 83.4 96.5 90.6 0.879 0.919COMET-src 83.2 95.3 89.1 0.824 0.855Prism 80.6 94.5 86.3 0.827 0.839BLEURT-large 80.1 94.4 85.4 0.808 0.748BLEURT 80.0 93.8 84.1 0.787 0.729ESIM 78.7 92.9 82.8 0.780 0.835BERTScore 78.3 92.2 81.0 0.772 0.824ChrF 75.6 89.5 75.0 0.716 0.739TER 75.6 89.2 73.9 0.708 0.321CharacTER 74.9 88.6 74.1 0.700 0.757BLEU 74.6 88.2 74.3 0.661 0.640Prism-src 73.4 85.3 77.4 0.661 0.631EED 68.8 79.4 68.2 0.531 0.541
Table 8: Extended Table 2 with Spearman’s and Pear-son’s correlations over all system pairs. Remainingcolumns are identical to original table. This table alsocontain additional BLEURT-large.

nC
OM
ET
CO
ME
T-sr
cB
LE
UR
TPr
ism
Pris
m-s
rcE
SIM
BL
EU
Chr
FB
ER
TSc
ore
Cha
racT
ER
TE
RE
ED
Eng
lish
-Fre
nch
6298
.493
.590
.388
.787
.182
.364
.564
.562
.962
.958
.141
.9Ja
pane
se-E
nglis
h58
98.3
89.7
84.5
98.3
89.7
98.3
93.1
93.1
96.6
87.9
96.6
82.8
Eng
lish
-Pol
ish
5710
0.0
100.
098
.210
0.0
82.5
100.
010
0.0
100.
010
0.0
100.
010
0.0
98.2
Polis
h-E
nglis
h55
80.0
98.2
83.6
83.6
98.2
83.6
83.6
80.0
83.6
80.0
81.8
81.8
Tha
i-E
nglis
h54
100.
070
.496
.390
.716
.788
.983
.392
.690
.794
.483
.320
.4E
nglis
h-G
erm
an52
100.
010
0.0
80.8
100.
088
.510
0.0
75.0
67.3
82.7
73.1
78.8
75.0
Chi
nese
-Eng
lish
5296
.294
.298
.192
.371
.210
0.0
94.2
96.2
94.2
96.2
86.5
71.2
Turk
ish
-Eng
lish
5198
.010
0.0
100.
096
.110
0.0
96.1
96.1
96.1
96.1
98.0
96.1
94.1
Eng
lish
-Ind
ones
ian
5110
0.0
100.
096
.110
0.0
88.2
100.
092
.298
.010
0.0
96.1
98.0
96.1
Eng
lish
-Tur
kish
4810
0.0
100.
010
0.0
100.
010
0.0
100.
087
.510
0.0
100.
010
0.0
95.8
91.7
Eng
lish
-Sw
edis
h48
91.7
91.7
97.9
97.9
97.9
95.8
93.8
87.5
95.8
95.8
93.8
91.7
Swed
ish
-Eng
lish
4797
.910
0.0
97.9
95.7
89.4
91.5
87.2
91.5
95.7
72.3
91.5
85.1
Eng
lish
-Dut
ch47
97.9
97.9
100.
010
0.0
97.9
100.
010
0.0
100.
010
0.0
100.
010
0.0
87.2
Indo
nesi
an-E
nglis
h46
97.8
100.
097
.897
.810
0.0
97.8
93.5
97.8
97.8
97.8
91.3
89.1
Eng
lish
-Hun
gari
an46
100.
010
0.0
97.8
100.
010
0.0
97.8
84.8
82.6
100.
010
0.0
100.
087
.0C
zech
-Eng
lish
4410
0.0
93.2
100.
010
0.0
93.2
100.
010
0.0
100.
095
.595
.595
.520
.5E
nglis
h-C
zech
4210
0.0
100.
092
.997
.697
.697
.692
.992
.997
.692
.997
.610
0.0
Eng
lish
-Dan
ish
4295
.295
.288
.197
.695
.292
.997
.692
.995
.292
.995
.288
.1H
unga
rian
-Eng
lish
4290
.583
.378
.697
.685
.790
.590
.595
.285
.792
.981
.088
.1H
indi
-Eng
lish
4195
.110
0.0
95.1
82.9
73.2
78.0
61.0
61.0
80.5
65.9
73.2
80.5
Dut
ch-E
nglis
h40
100.
097
.597
.597
.582
.597
.597
.595
.097
.597
.597
.575
.0G
erm
an-E
nglis
h39
97.4
94.9
97.4
97.4
82.1
94.9
82.1
82.1
97.4
82.1
94.9
64.1
Dan
ish
-Eng
lish
3910
0.0
100.
010
0.0
100.
010
0.0
100.
097
.497
.410
0.0
89.7
97.4
74.4
Span
ish
-Eng
lish
3994
.994
.994
.997
.492
.394
.994
.994
.997
.497
.494
.992
.3E
nglis
h-R
ussi
an37
100.
010
0.0
100.
010
0.0
91.9
100.
010
0.0
100.
010
0.0
100.
010
0.0
100.
0Po
rtug
uese
-Eng
lish
3610
0.0
94.4
94.4
94.4
94.4
94.4
94.4
88.9
94.4
94.4
94.4
97.2
Kor
ean
-Eng
lish
3310
0.0
97.0
72.7
87.9
42.4
69.7
63.6
97.0
78.8
90.9
69.7
66.7
Eng
lish
-Por
tugu
ese
3110
0.0
100.
010
0.0
100.
087
.110
0.0
96.8
100.
010
0.0
100.
096
.810
0.0
Eng
lish
-Ita
lian
2810
0.0
100.
010
0.0
100.
096
.410
0.0
96.4
96.4
100.
010
0.0
96.4
75.0
Eng
lish
-Jap
anes
e28
96.4
89.3
100.
096
.475
.096
.478
.696
.496
.467
.978
.646
.4R
ussi
an-E
nglis
h27
92.6
100.
010
0.0
88.9
85.2
81.5
66.7
59.3
88.9
40.7
74.1
59.3
Eng
lish
-Spa
nish
2592
.088
.088
.096
.076
.092
.092
.088
.092
.084
.072
.084
.0
Tabl
e9:
Eac
hro
wre
pres
ents
accu
racy
ofsy
stem
pair
sfo
rgi
ven
lang
uage
pair.
We
list
lang
uage
pair
sw
ithat
leas
t20
syst
empa
irs.
Res
ults
are
calc
ulat
edov
era
set
ofsi
gnifi
cant
lydi
ffer
ent
syst
empa
irs
with
alph
ale
vel
0.05
.R
esul
tsw
ithgr
eyba
ckgr
ound
are
cons
ider
edto
betie
dw
ithth
ebe
stm
etri
c.In
tere
stin
gly,
whe
nw
ein
vest
igat
edPo
lish–
Eng
lish
resu
lts,w
efo
und
outt
hete
stse
tis
likel
ypo
st-e
dite
dM
Tou
tput
.