Embed Size (px)
Citation preview
Frontline of the Global Water Crisis: Efforts to Secure Safe Water in High Need Communities
Steve Luby, MD
OU International WaTER ConferenceNorman, Oklahoma, USA
October 27, 2009
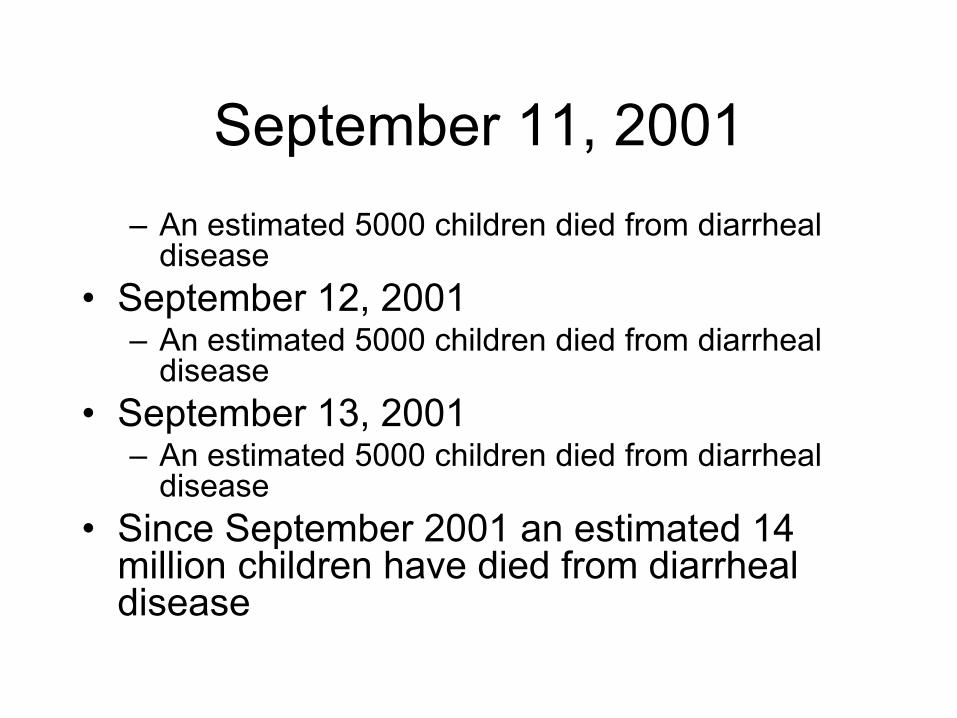
September 11, 2001– An estimated 5000 children died from diarrheal
disease• September 12, 2001
– An estimated 5000 children died from diarrheal disease
• September 13, 2001 – An estimated 5000 children died from diarrheal
disease• Since September 2001 an estimated 14
million children have died from diarrheal disease
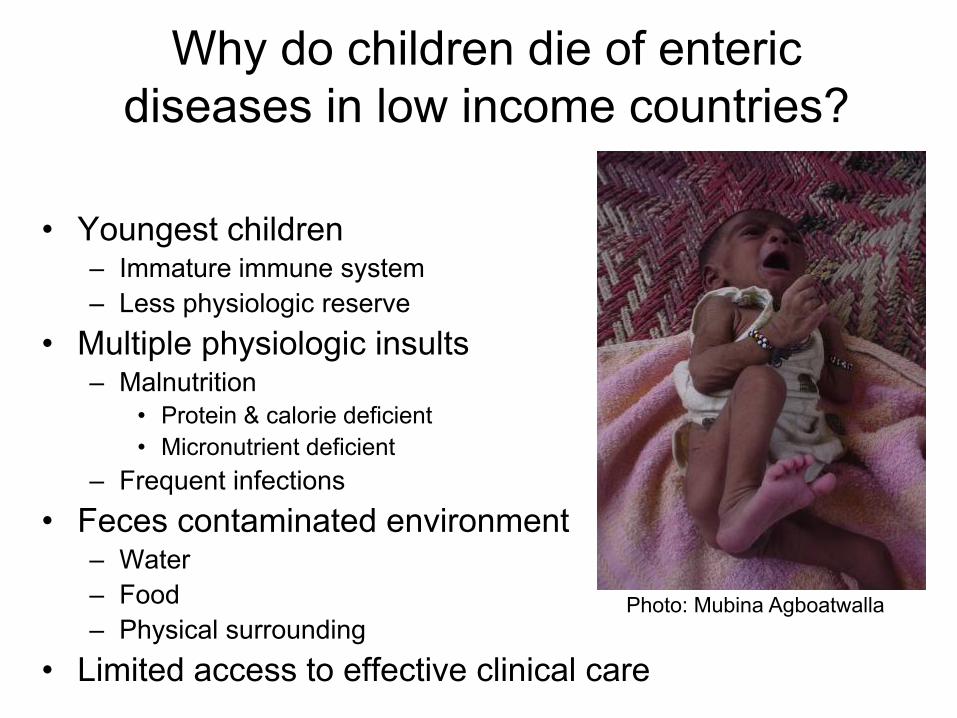
Why do children die of enteric diseases in low income countries?
• Youngest children– Immature immune system– Less physiologic reserve
• Multiple physiologic insults– Malnutrition
• Protein & calorie deficient• Micronutrient deficient
– Frequent infections• Feces contaminated environment
– Water– Food – Physical surrounding
• Limited access to effective clinical care
Photo: Mubina Agboatwalla
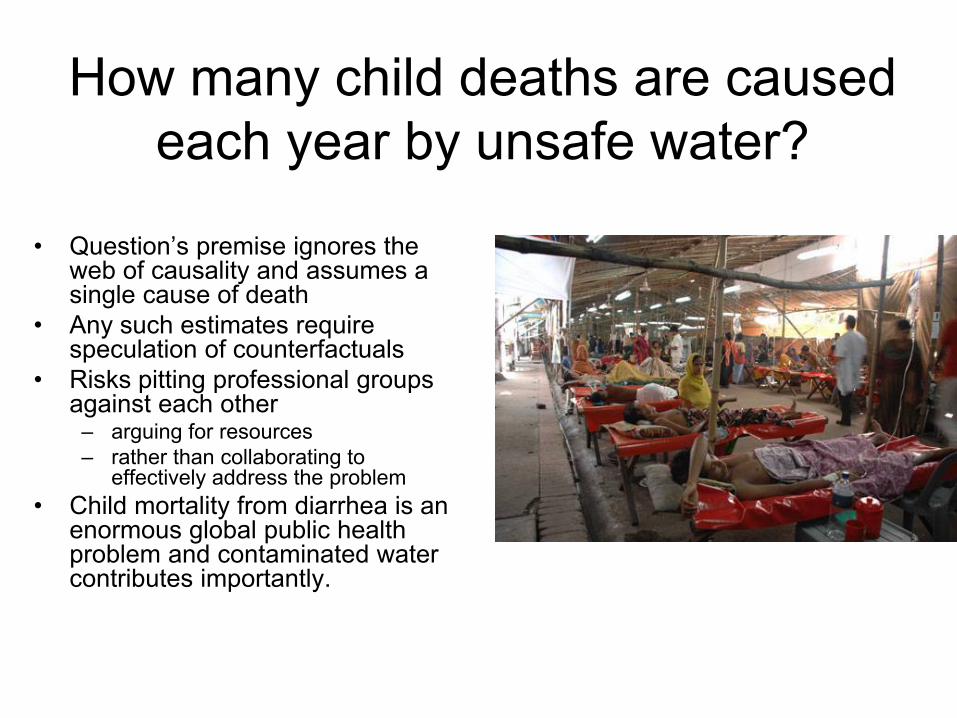
How many child deaths are caused each year by unsafe water?
• Question’s premise ignores the web of causality and assumes a single cause of death
• Any such estimates require speculation of counterfactuals
• Risks pitting professional groups against each other
– arguing for resources – rather than collaborating to
effectively address the problem• Child mortality from diarrhea is an
enormous global public health problem and contaminated water contributes importantly.
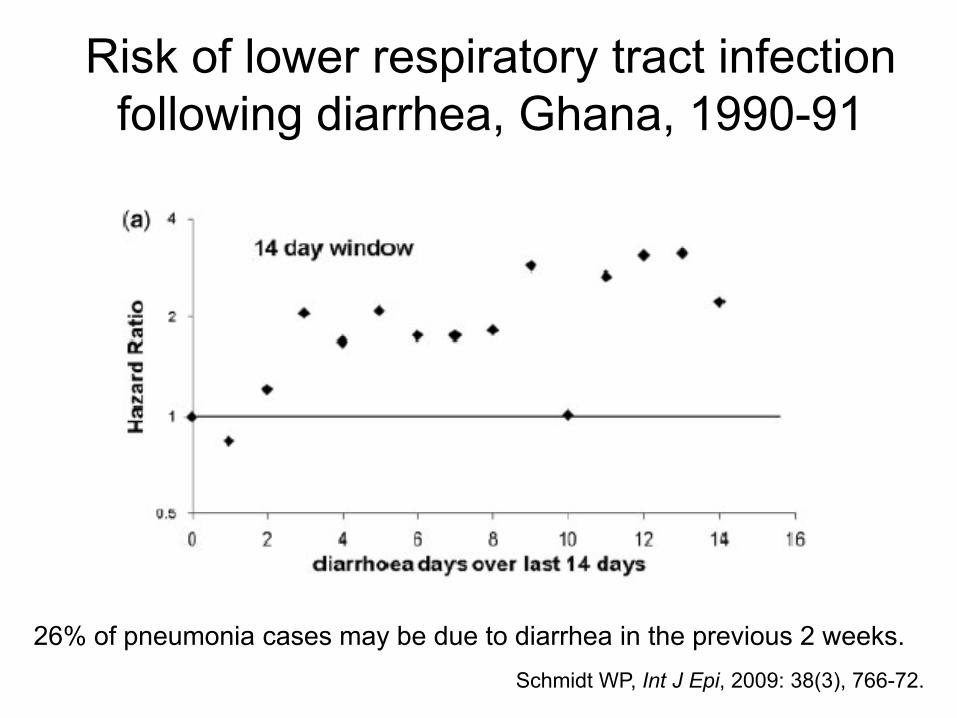
Risk of lower respiratory tract infection following diarrhea, Ghana, 1990-91
26% of pneumonia cases may be due to diarrhea in the previous 2 weeks.Schmidt WP, Int J Epi, 2009: 38(3), 766-72.
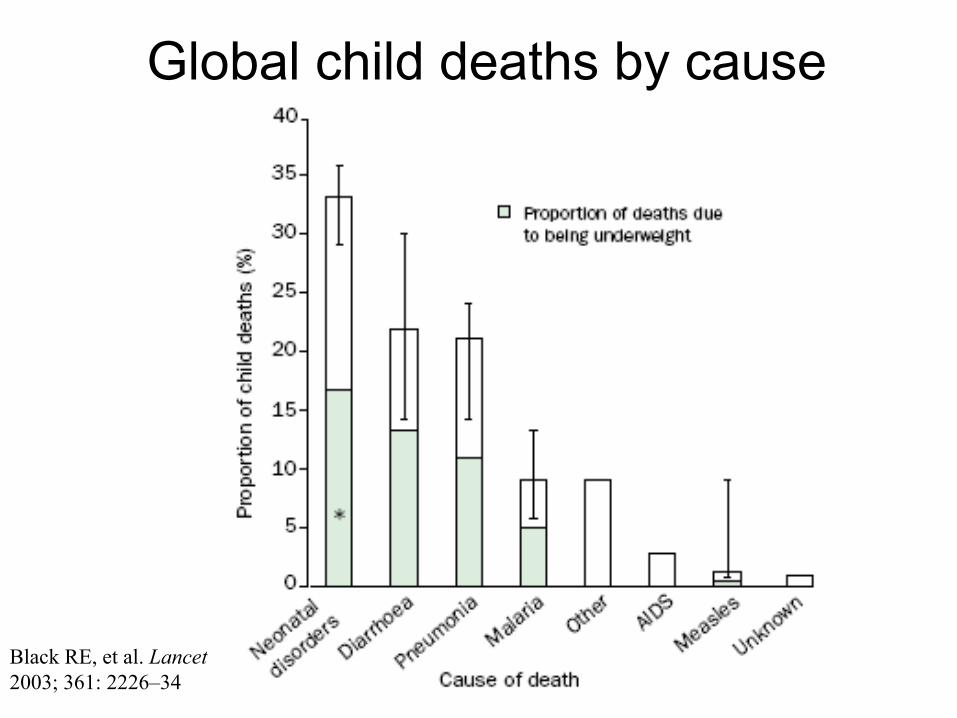
Global child deaths by cause
Black RE, et al. Lancet 2003; 361: 2226–34
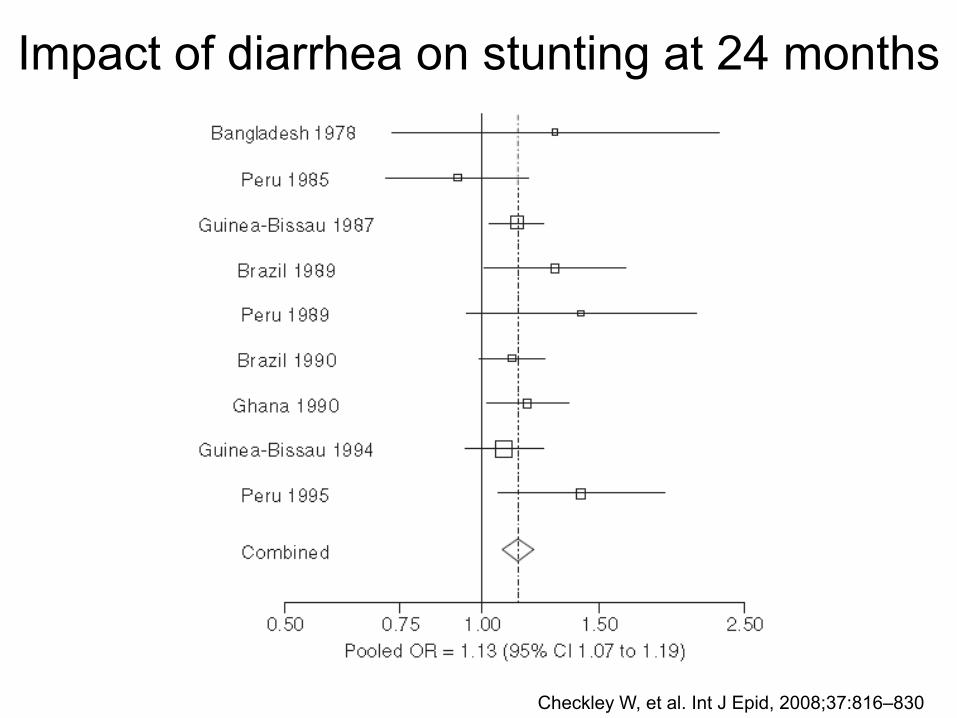
Impact of diarrhea on stunting at 24 months
Checkley W, et al. Int J Epid, 2008;37:816–830
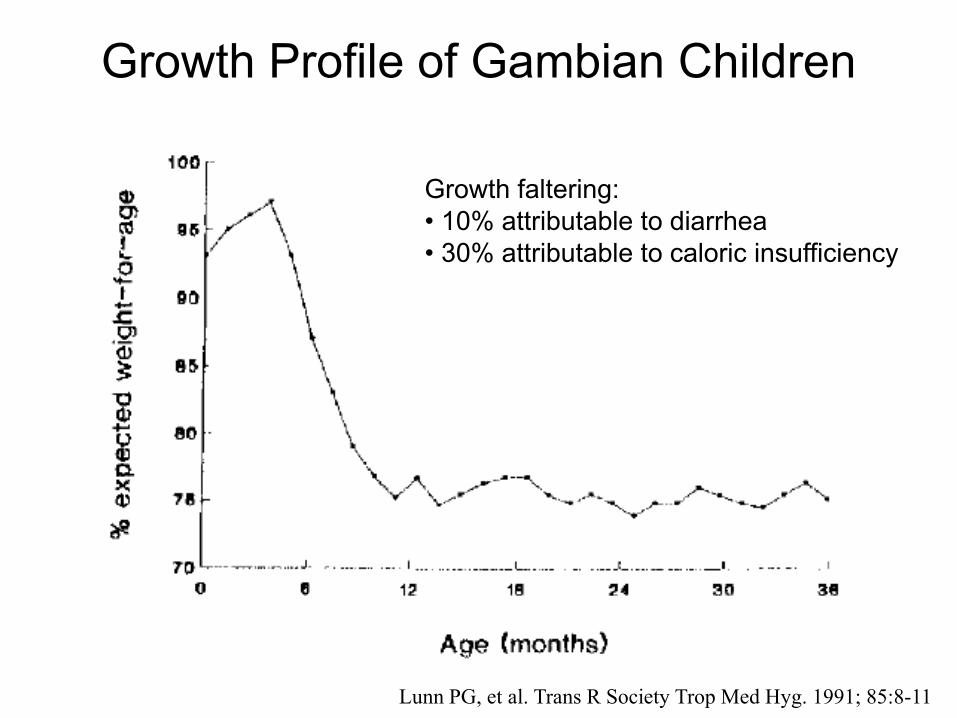
Growth Profile of Gambian Children
Lunn PG, et al. Trans R Society Trop Med Hyg. 1991; 85:8-11
Growth faltering:• 10% attributable to diarrhea• 30% attributable to caloric insufficiency
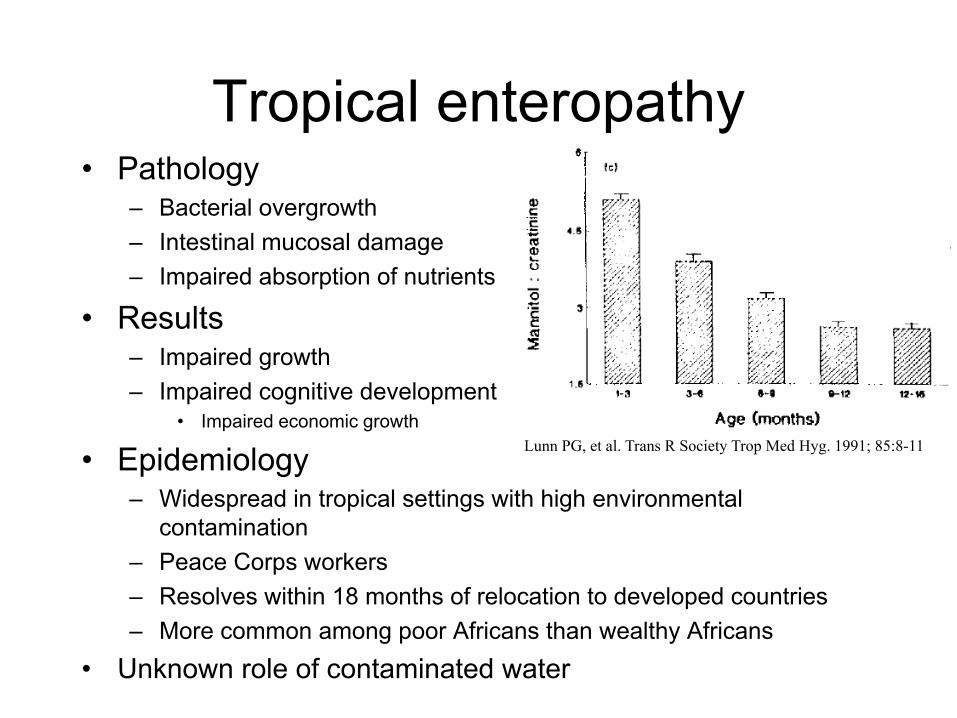
Tropical enteropathy• Pathology
– Bacterial overgrowth– Intestinal mucosal damage– Impaired absorption of nutrients
• Results– Impaired growth– Impaired cognitive development
• Impaired economic growth
• Epidemiology – Widespread in tropical settings with high environmental
contamination– Peace Corps workers– Resolves within 18 months of relocation to developed countries– More common among poor Africans than wealthy Africans
• Unknown role of contaminated water
Lunn PG, et al. Trans R Society Trop Med Hyg. 1991; 85:8-11
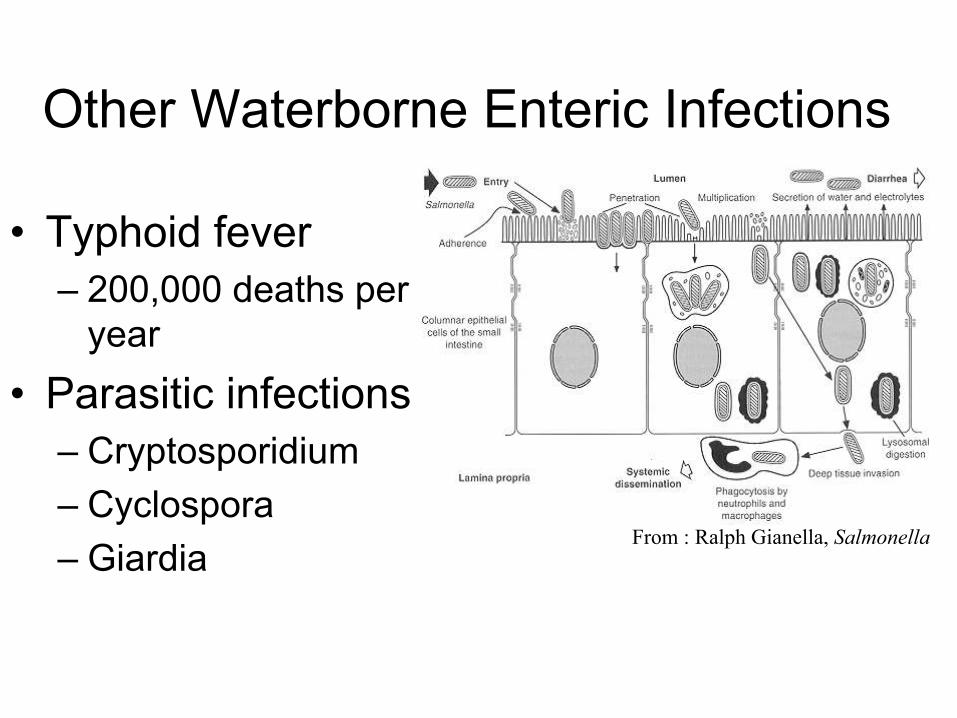
Other Waterborne Enteric Infections
• Typhoid fever– 200,000 deaths per
year• Parasitic infections
– Cryptosporidium– Cyclospora– Giardia
From : Ralph Gianella, Salmonella
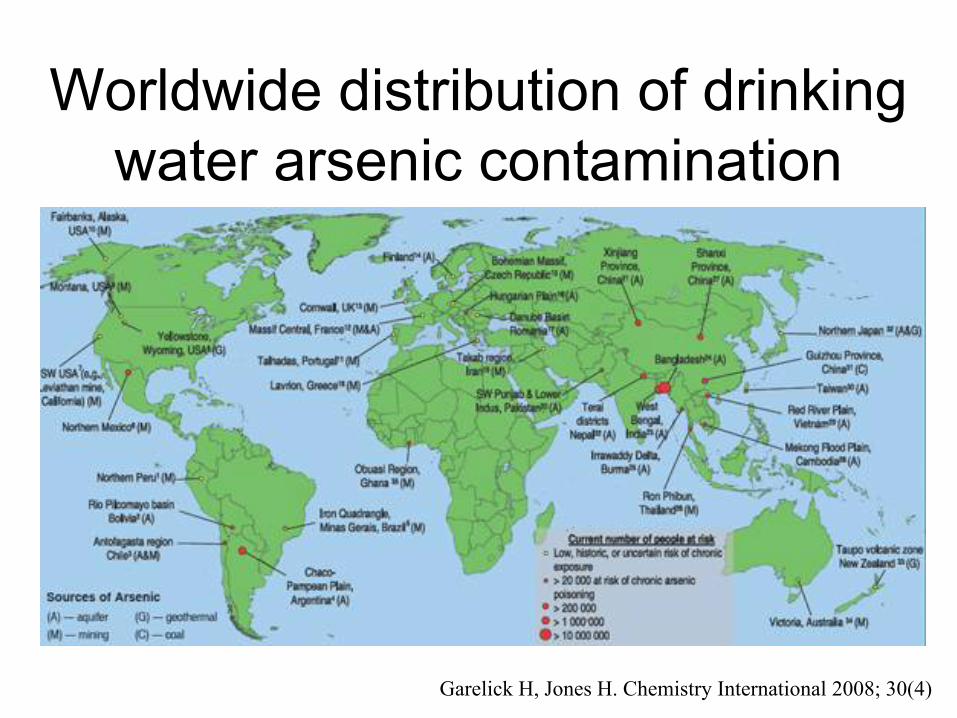
Worldwide distribution of drinking water arsenic contamination
Garelick H, Jones H. Chemistry International 2008; 30(4)
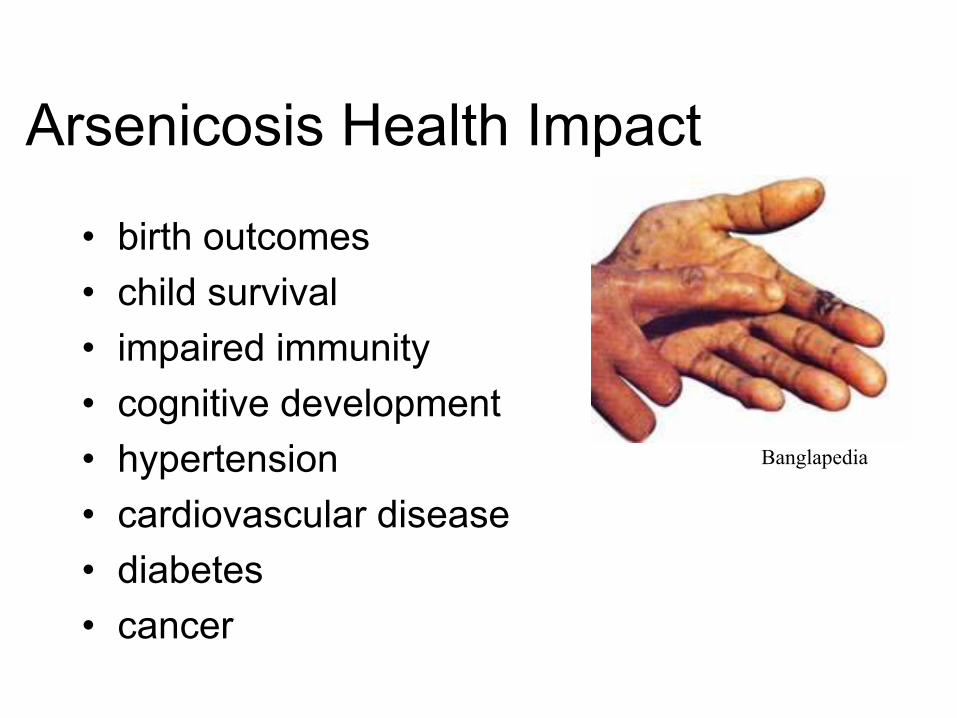
Arsenicosis Health Impact
• birth outcomes• child survival• impaired immunity• cognitive development• hypertension• cardiovascular disease• diabetes• cancer
Banglapedia
Millennium Development Goal 7Ensure Environmental Sustainability
• Halve by 2015 the proportion of people without sustainable access to safe drinking water.
• To assess progress “safe water” is defined as “water from an improved source”

What does the phrase ‘improved water supply’ mean?
• World Health Organization– Improved : Household
connection, public standpipe, borehole, protected dug well, protected spring, rainwater collection.
– Not improved : Unprotected well, unprotected spring, vendor provided water, bottled water, tanker truck provision water
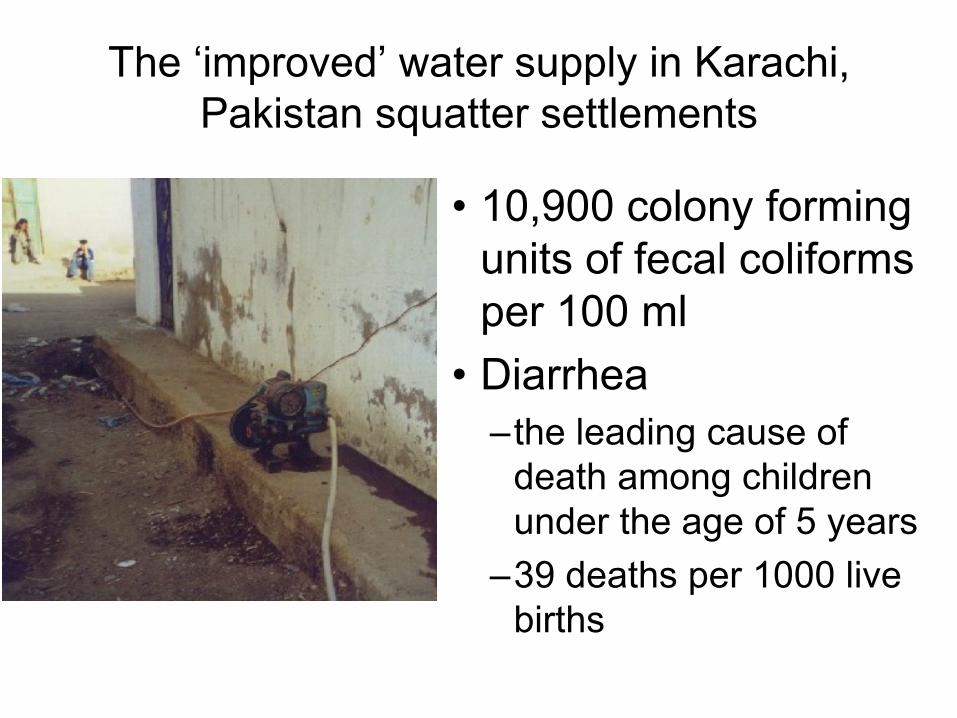
The ‘improved’ water supply in Karachi, Pakistan squatter settlements
• 10,900 colony forming units of fecal coliforms per 100 ml
• Diarrhea –the leading cause of
death among children under the age of 5 years
–39 deaths per 1000 live births
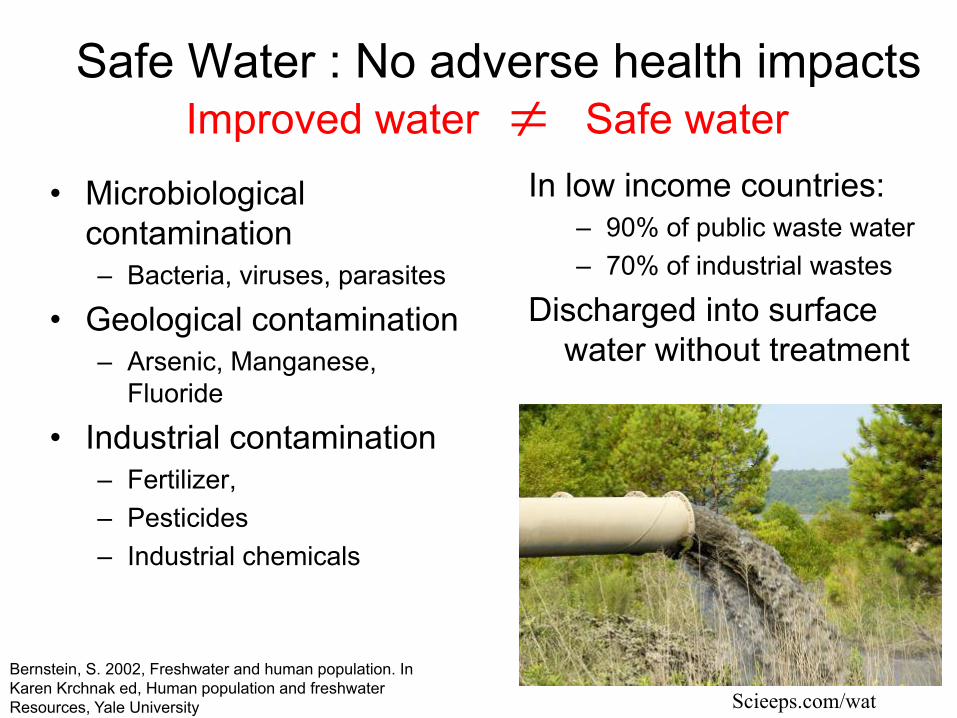
Safe Water : No adverse health impacts
• Microbiological contamination– Bacteria, viruses, parasites
• Geological contamination– Arsenic, Manganese,
Fluoride
• Industrial contamination– Fertilizer, – Pesticides– Industrial chemicals
In low income countries:– 90% of public waste water– 70% of industrial wastes
Discharged into surface water without treatment
Scieeps.com/wat
Improved water Safe water!
Bernstein, S. 2002, Freshwater and human population. In Karen Krchnak ed, Human population and freshwater Resources, Yale University
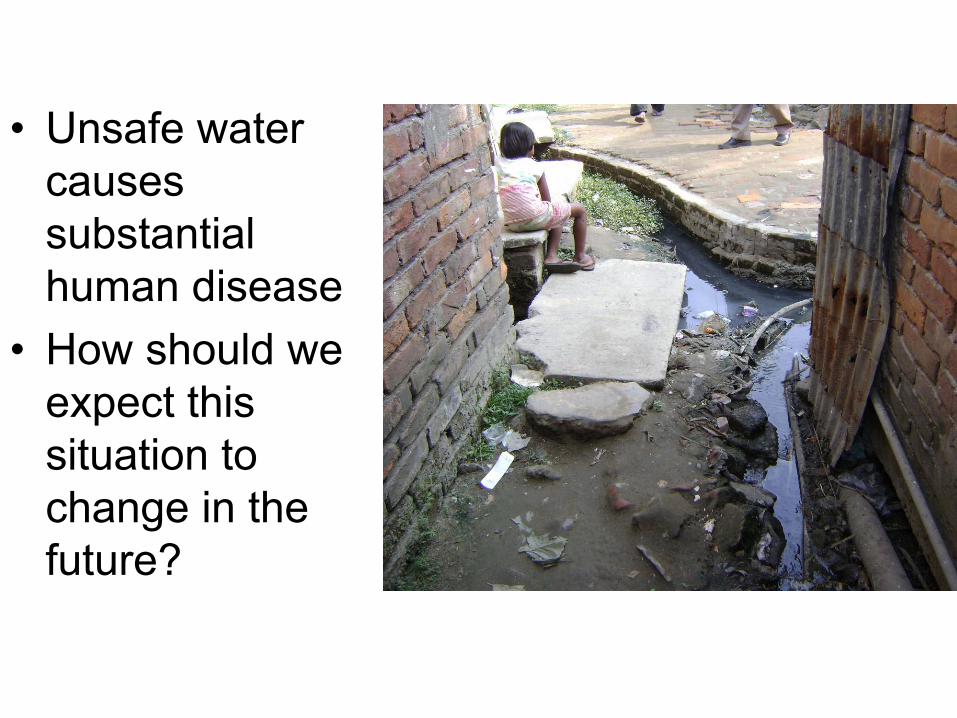
• Unsafe water causes substantial human disease
• How should we expect this situation to change in the future?
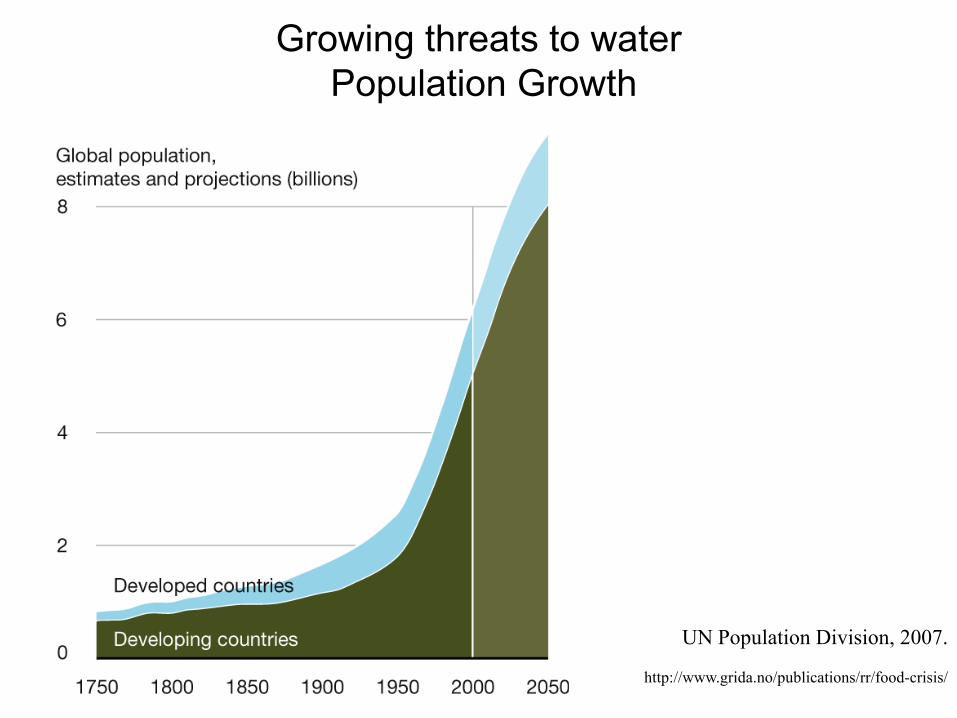
Growing threats to waterPopulation Growth
UN Population Division, 2007.
http://www.grida.no/publications/rr/food-crisis/
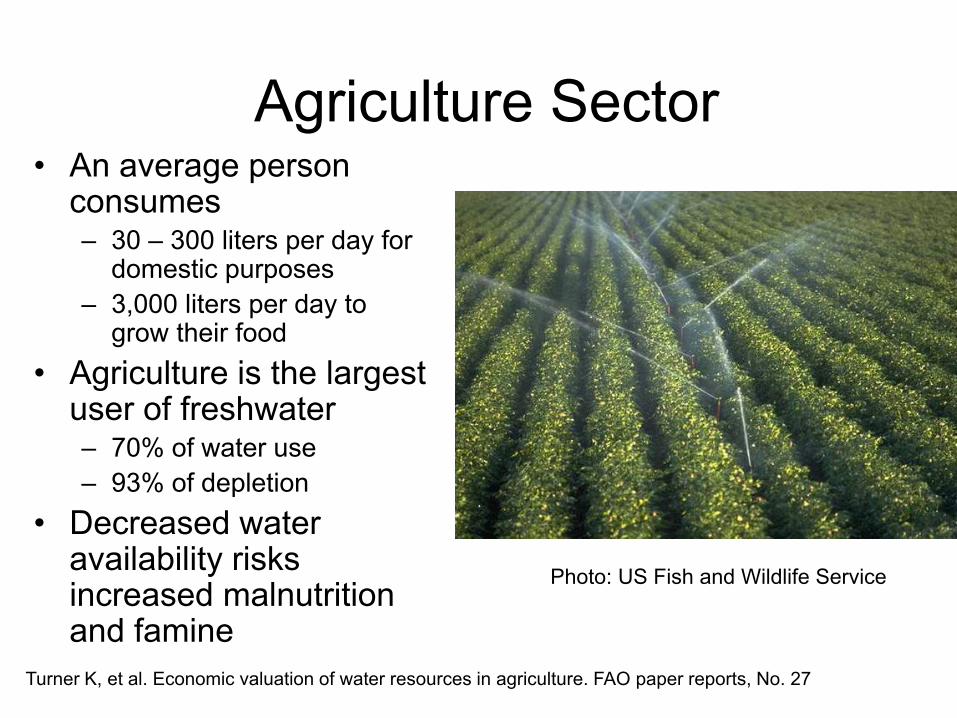
Agriculture Sector• An average person
consumes– 30 – 300 liters per day for
domestic purposes– 3,000 liters per day to
grow their food• Agriculture is the largest
user of freshwater– 70% of water use– 93% of depletion
• Decreased water availability risks increased malnutrition and famine
Turner K, et al. Economic valuation of water resources in agriculture. FAO paper reports, No. 27
Photo: US Fish and Wildlife Service
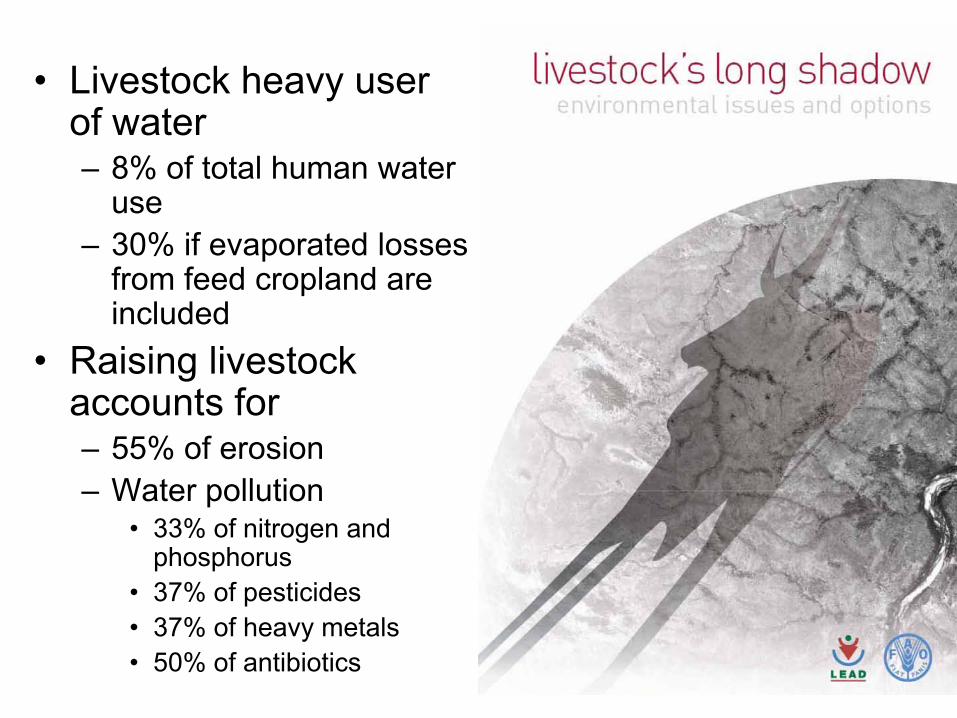
• Livestock heavy user of water– 8% of total human water
use– 30% if evaporated losses
from feed cropland are included
• Raising livestock accounts for– 55% of erosion– Water pollution
• 33% of nitrogen and phosphorus
• 37% of pesticides• 37% of heavy metals• 50% of antibiotics
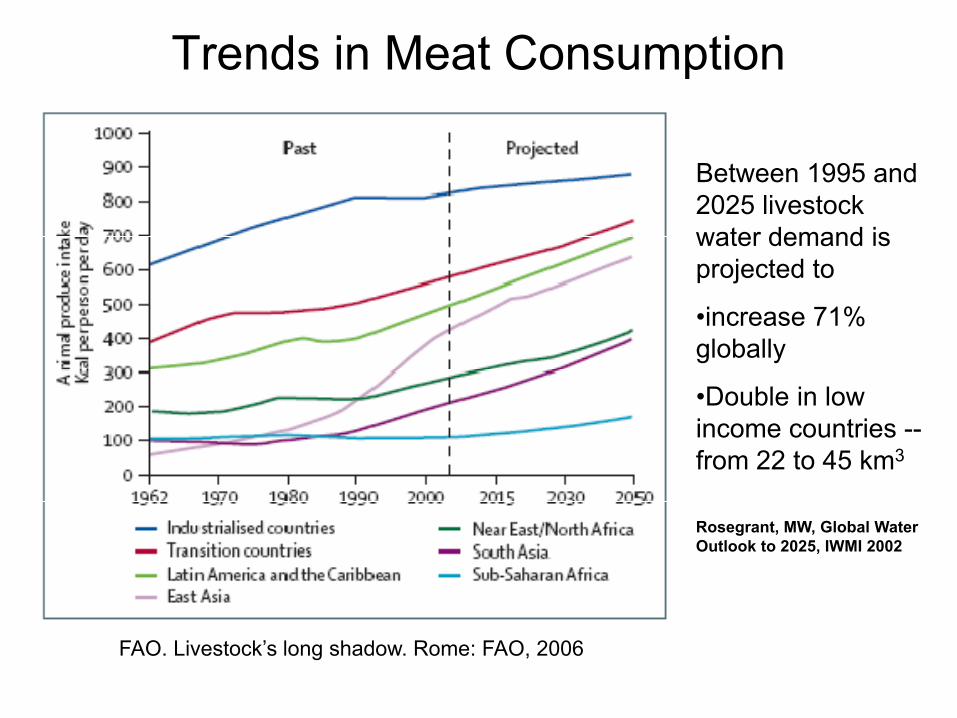
Trends in Meat Consumption
FAO. Livestock’s long shadow. Rome: FAO, 2006
Between 1995 and 2025 livestock water demand is projected to
•increase 71% globally
•Double in low income countries --from 22 to 45 km3
Rosegrant, MW, Global Water Outlook to 2025, IWMI 2002
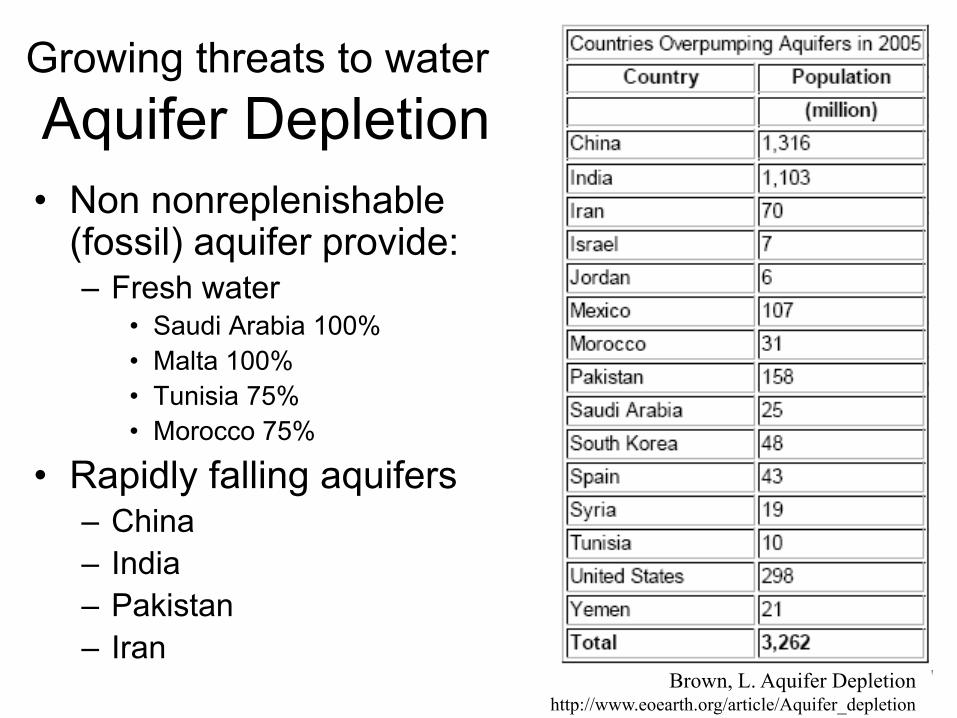
Growing threats to waterAquifer Depletion• Non nonreplenishable
(fossil) aquifer provide:– Fresh water
• Saudi Arabia 100%• Malta 100%• Tunisia 75%• Morocco 75%
• Rapidly falling aquifers– China– India– Pakistan– Iran
Brown, L. Aquifer Depletionhttp://www.eoearth.org/article/Aquifer_depletion
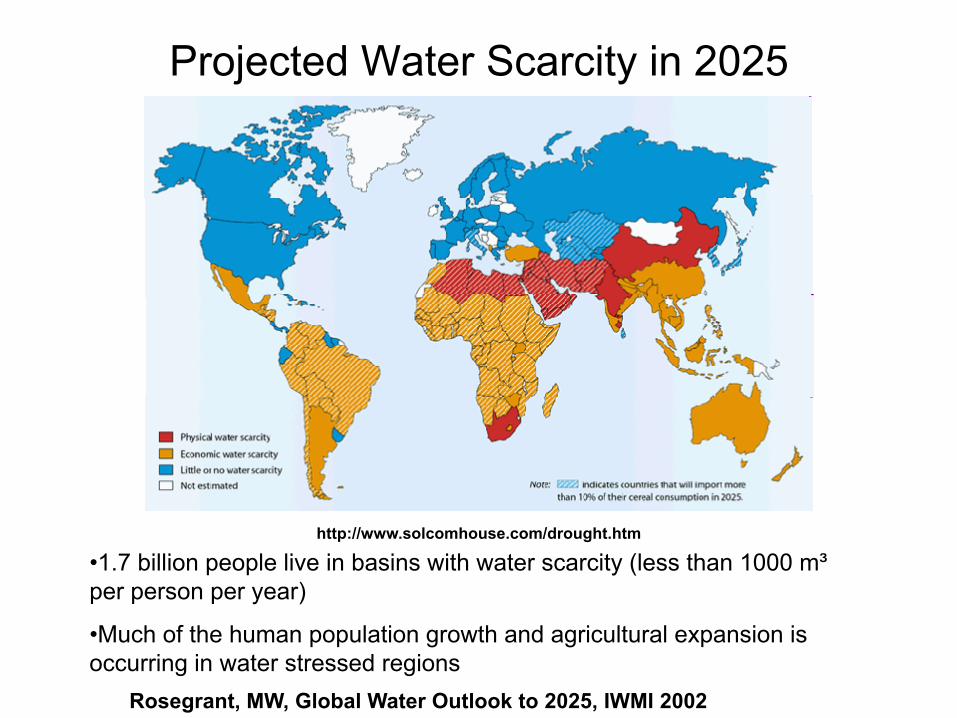
Projected Water Scarcity in 2025
http://www.solcomhouse.com/drought.htm
•1.7 billion people live in basins with water scarcity (less than 1000 m³ per person per year)
•Much of the human population growth and agricultural expansion is occurring in water stressed regions
Rosegrant, MW, Global Water Outlook to 2025, IWMI 2002
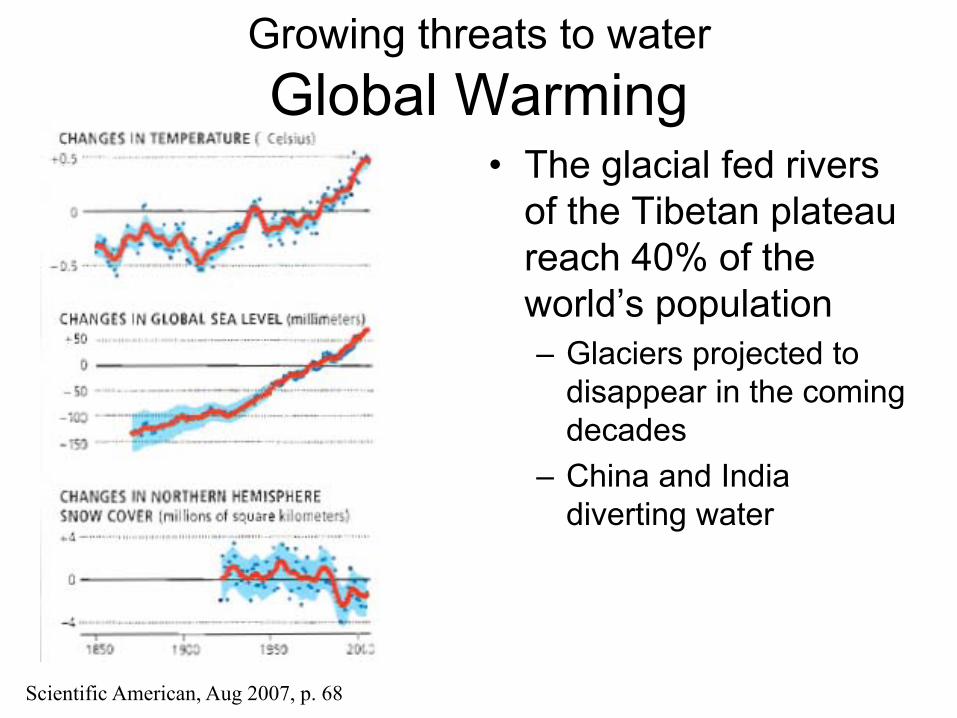
Growing threats to waterGlobal Warming
• The glacial fed rivers of the Tibetan plateau reach 40% of the world’s population– Glaciers projected to
disappear in the coming decades
– China and India diverting water
Scientific American, Aug 2007, p. 68

When water is in short supply
• The poor suffer the most
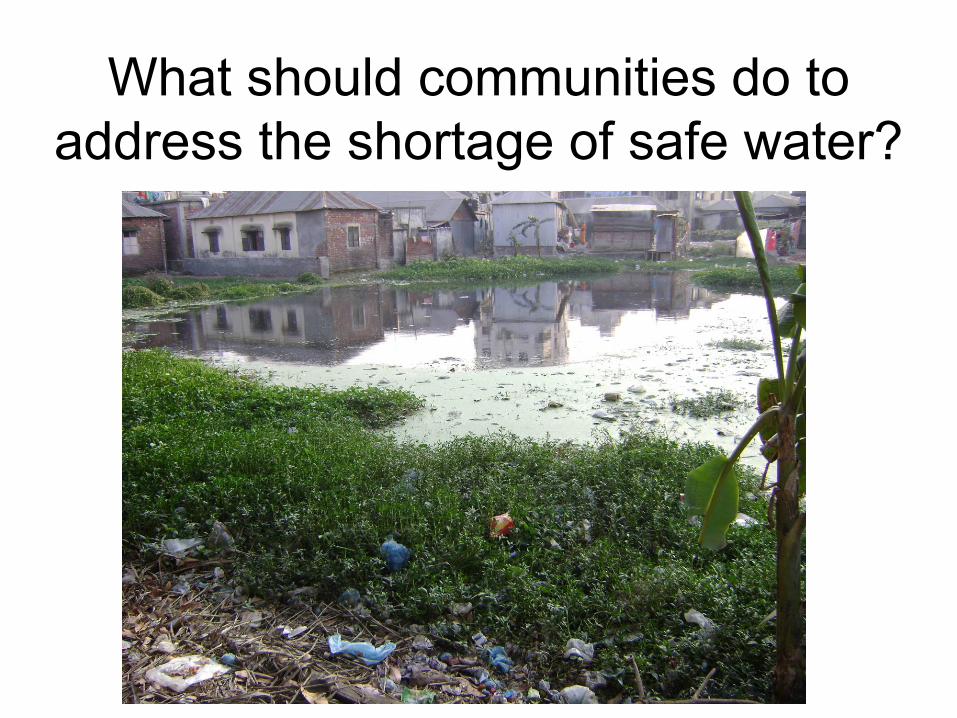
What should communities do to address the shortage of safe water?

Wealthy Countries
• Use capital intensive technology to secure sustainable water supply
• Treat it to remove chemical and microbiological contaminants
• Distribute it to residents • Collect and treat wastewater
before discharging it back into the environment
• Pay for the system by charging end users – Raise bonds for initial construction– Ongoing user fees to support
maintenance
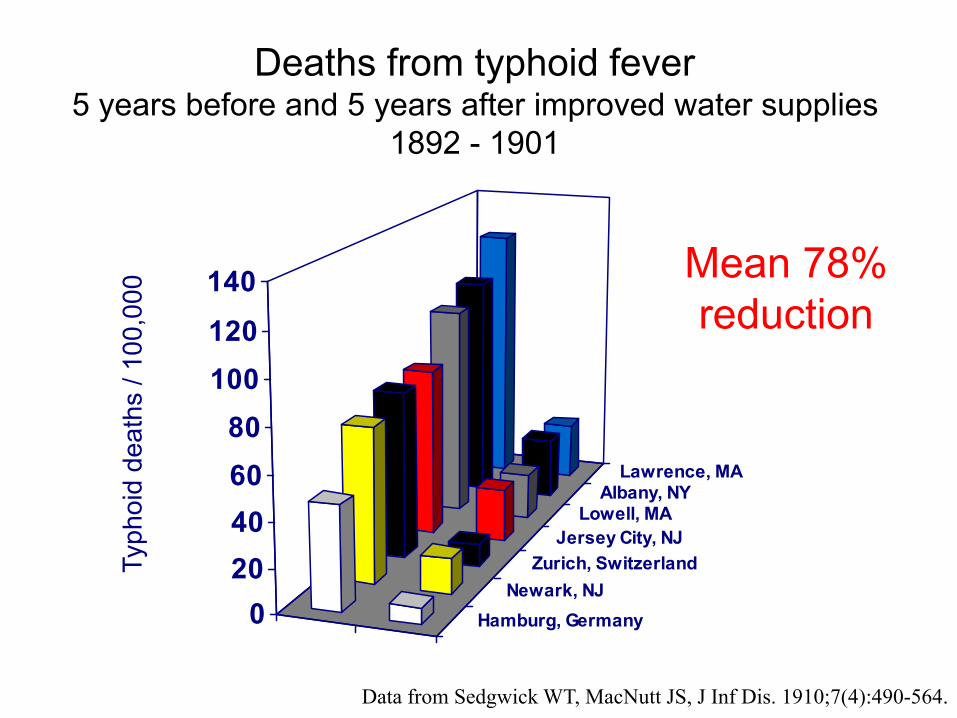
Deaths from typhoid fever 5 years before and 5 years after improved water supplies
1892 - 1901
Hamburg, GermanyNewark, NJ
Zurich, SwitzerlandJersey City, NJ
Lowell, MAAlbany, NY
Lawrence, MA
020406080
100120
140
Typh
oid
deat
hs /
100,
000
Data from Sedgwick WT, MacNutt JS, J Inf Dis. 1910;7(4):490-564.
Mean 78% reduction
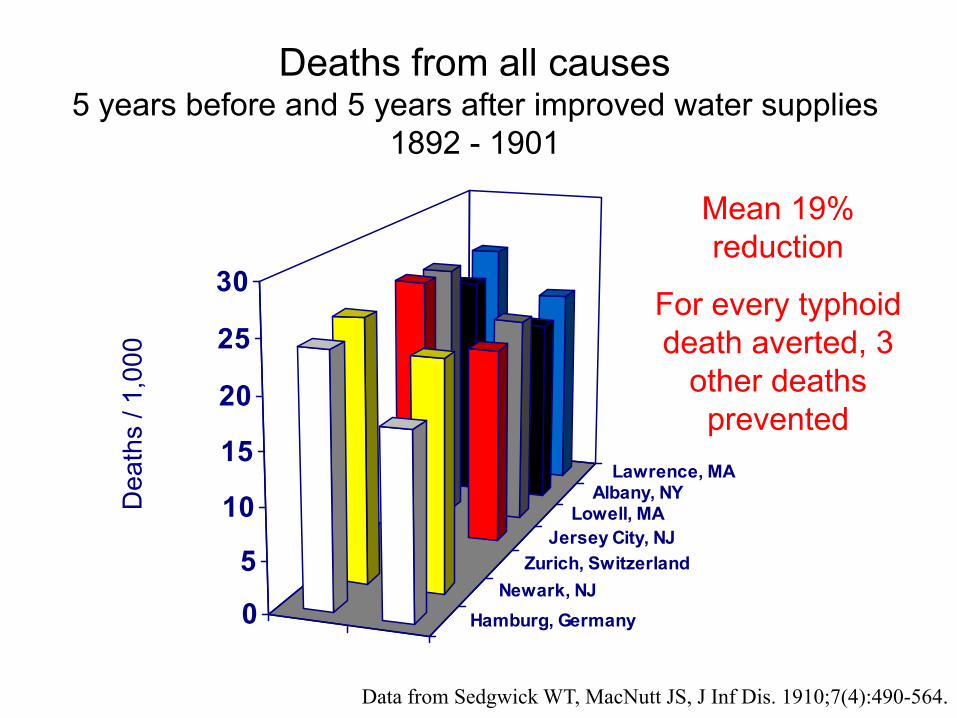
Deaths from all causes 5 years before and 5 years after improved water supplies
1892 - 1901
Hamburg, GermanyNewark, NJ
Zurich, SwitzerlandJersey City, NJ
Lowell, MAAlbany, NY
Lawrence, MA
0
5
10
15
20
25
30
Dea
ths
/ 1,0
00
Data from Sedgwick WT, MacNutt JS, J Inf Dis. 1910;7(4):490-564.
Mean 19% reduction
For every typhoid death averted, 3
other deaths prevented
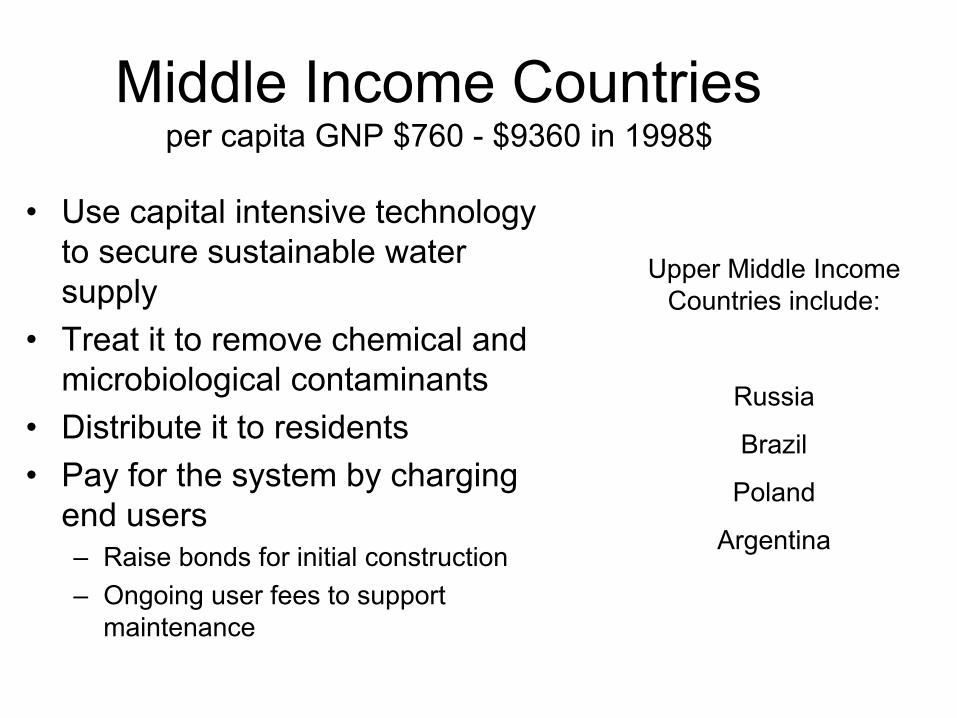
Middle Income Countriesper capita GNP $760 - $9360 in 1998$
• Use capital intensive technology to secure sustainable water supply
• Treat it to remove chemical and microbiological contaminants
• Distribute it to residents • Pay for the system by charging
end users – Raise bonds for initial construction– Ongoing user fees to support
maintenance
Upper Middle Income Countries include:
Russia
Brazil
Poland
Argentina
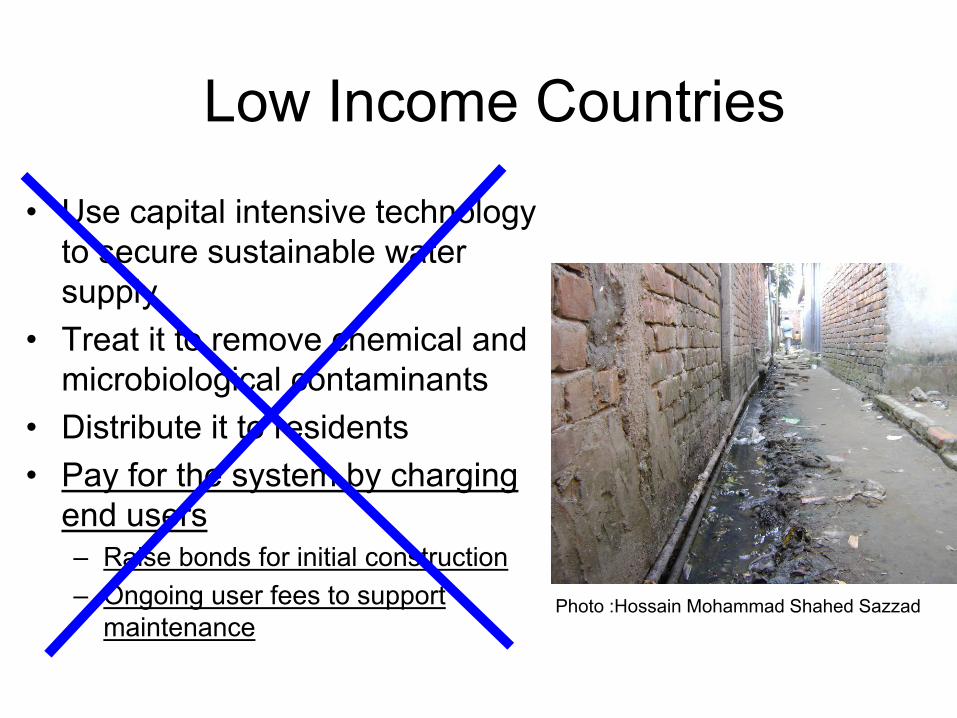
Low Income Countries
• Use capital intensive technology to secure sustainable water supply
• Treat it to remove chemical and microbiological contaminants
• Distribute it to residents • Pay for the system by charging
end users – Raise bonds for initial construction– Ongoing user fees to support
maintenancePhoto :Hossain Mohammad Shahed Sazzad
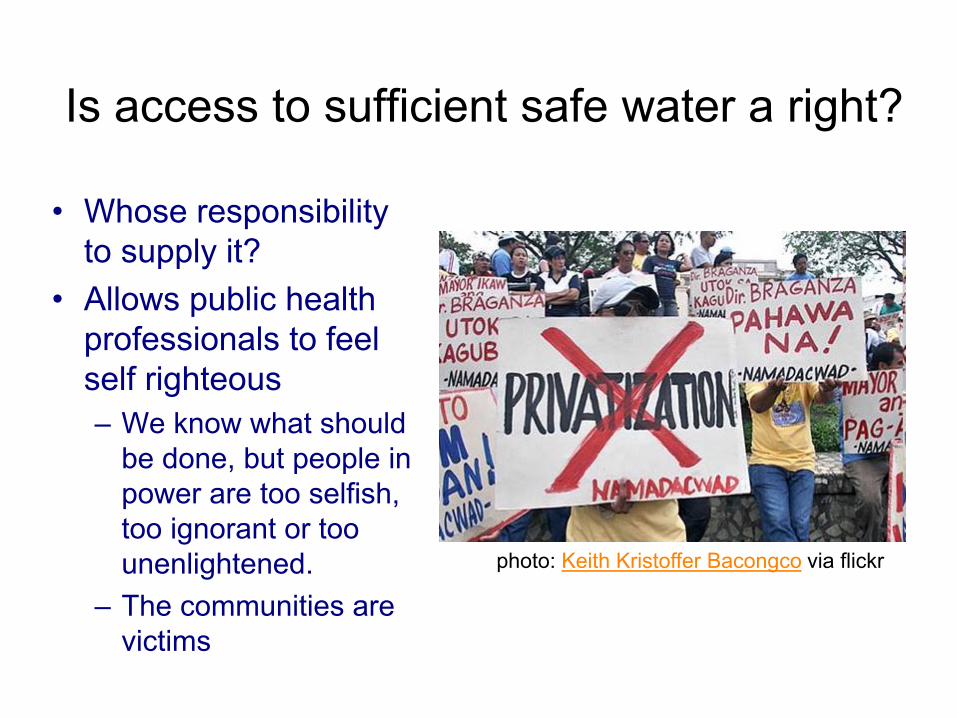
Is access to sufficient safe water a right?
• Whose responsibility to supply it?
• Allows public health professionals to feel self righteous– We know what should
be done, but people in power are too selfish, too ignorant or too unenlightened.
– The communities are victims
photo: Keith Kristoffer Bacongco via flickr

It may be more productive to frame this as a scientific challenge
• With the available constraints– Financial– Hydrogeological– Technical– Political
• The solutions offered by the experts are not supplying the poor with a sufficient supply of safe water
• Perhaps the experts should develop better interventions
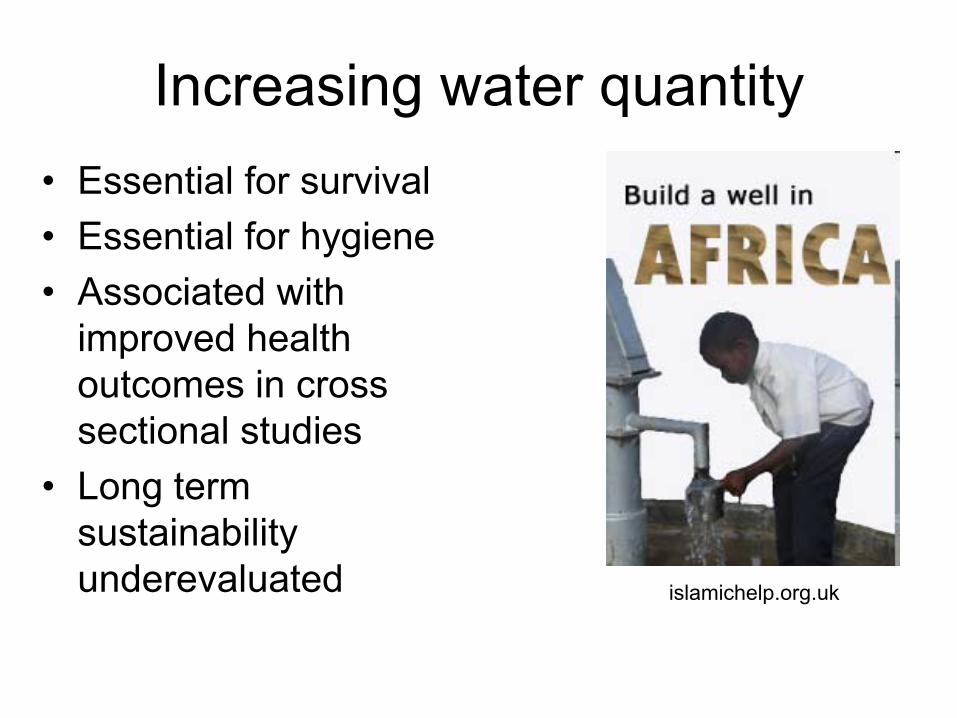
Increasing water quantity• Essential for survival• Essential for hygiene• Associated with
improved health outcomes in cross sectional studies
• Long term sustainability underevaluated islamichelp.org.uk

Post-source Water Contamination
Eric Mintz, CDC
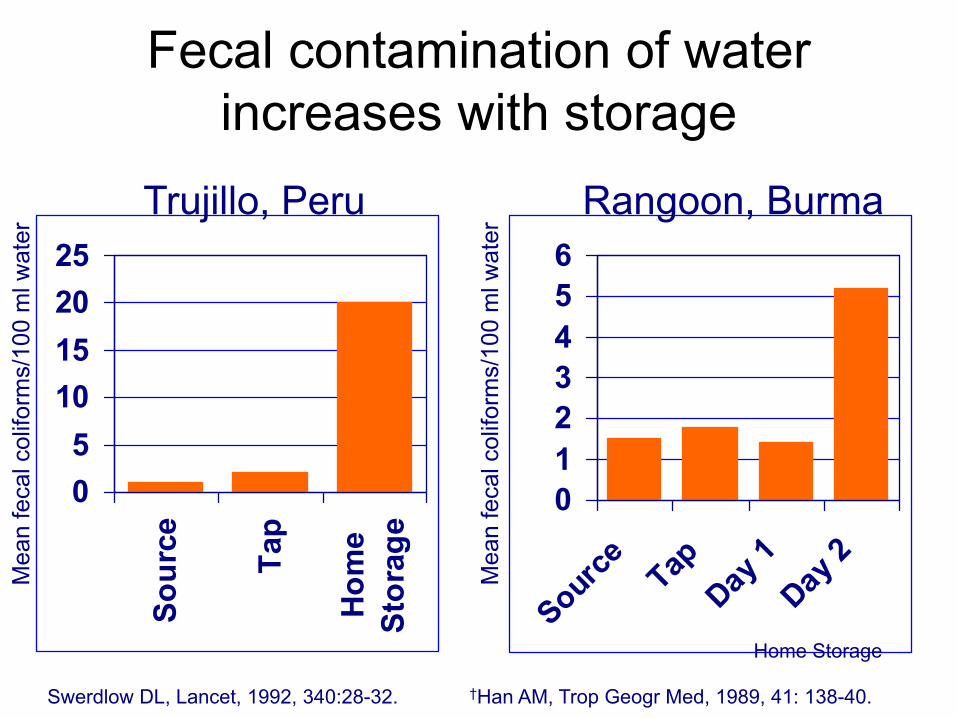
Fecal contamination of water increases with storage
05
10152025
Sour
ce
Tap
Hom
eSt
orag
e
0123456
Source Tap
Day 1
Day 2
Trujillo, Peru Rangoon, Burma
Mea
n fe
cal c
olifo
rms/
100
ml w
ater
Mea
n fe
cal c
olifo
rms/
100
ml w
ater
Home Storage
Swerdlow DL, Lancet, 1992, 340:28-32. †Han AM, Trop Geogr Med, 1989, 41: 138-40.
Epidemic cholera returned to the Americas in 1992
• Affected persons with both ‘improved’ and ‘unimproved’ water
• Risk factors in Trujillo Peru–drinking unboiled water (odds ratio 3.1, 95% CI 1.3-7.3)
–drinking water from a household water storage container in which hands had been introduced into the water (odds ratio 4.2, 95% CI 1.2-14.9)
D. L. Swerdlow et al., Lancet 340, 28 (Jul 4, 1992)
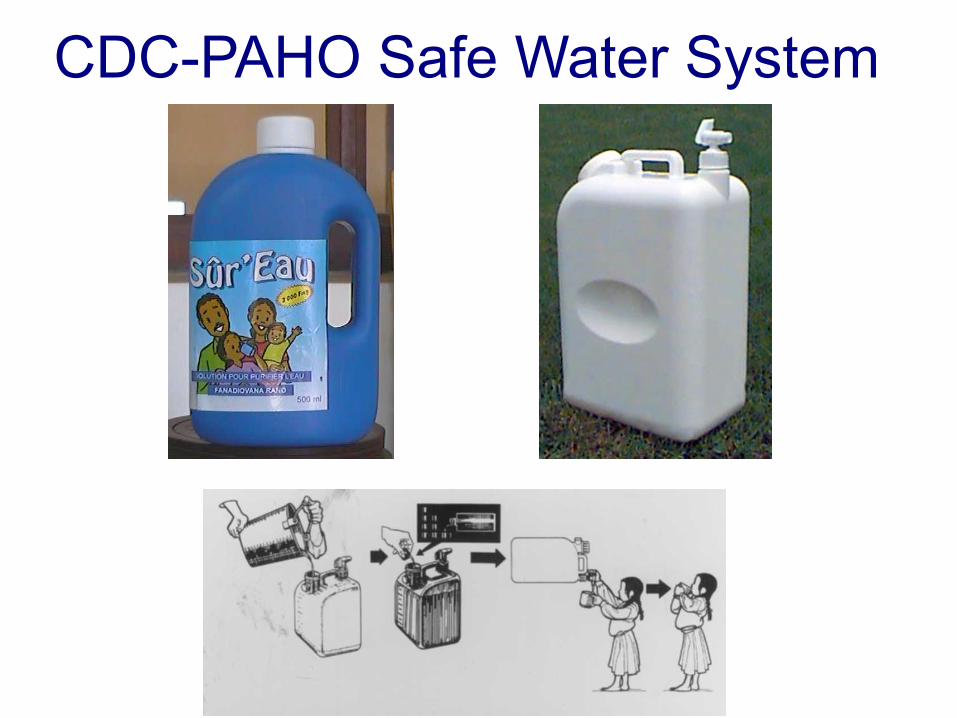
CDC-PAHO Safe Water System

Phase 1 Trial : El Alto Bolivia
• Objective : Evaluate acceptability of the vessel and bleach and its effect on water quality
• Participants : 42 families with shallow contaminated backyard wells
• Methods : Interviews and water testing at baseline and every 3 weeks– 15 families – vessel + bleach– 15 families – vessel alone– 12 families -- control
R. E. Quick et al., Amer J Trop Med Hyg 54, 511 (May, 1996)
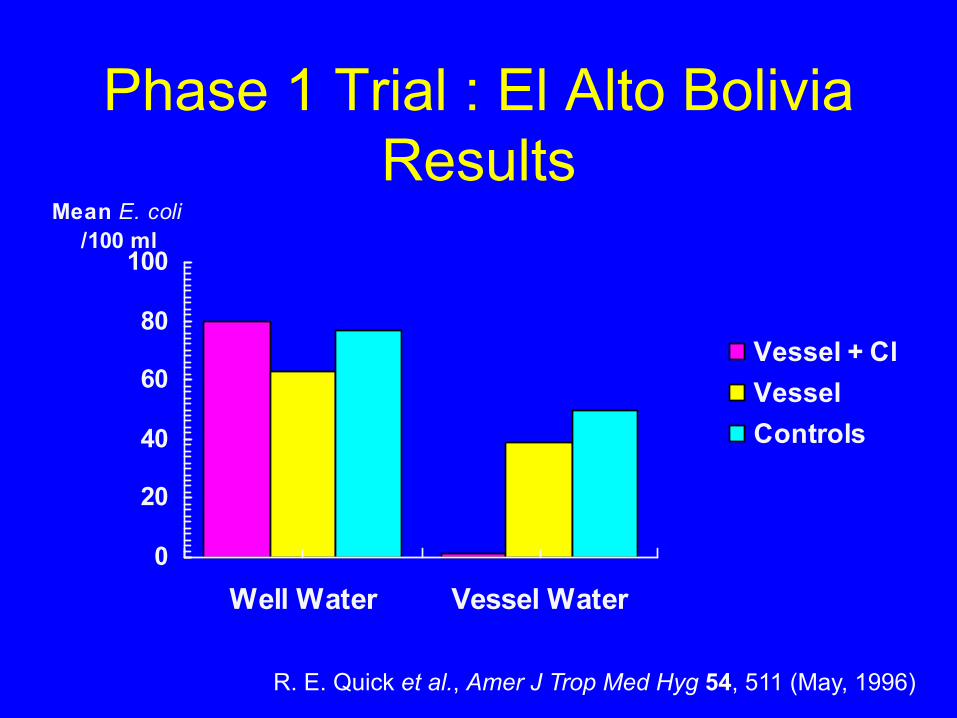
Phase 1 Trial : El Alto BoliviaResults
0
20
40
60
80
100
Well Water Vessel Water
Mean E. coli /100 ml
Vessel + ClVesselControls
R. E. Quick et al., Amer J Trop Med Hyg 54, 511 (May, 1996)

Intervention Effectiveness Phase 2Montero, Bolivia, 1994/95
• Objective : determine impact of intervention on diarrheal incidence
• Study population : 127 households in Montero Bolivia
• Study Design– Baseline survey– Randomization– Active surveillance for diarrhea each week– Active surveillance for water quality each month
• Study Duration : 5 months
R. E. Quick et al., Epidemiol Infect 122, 83 (Feb, 1999).
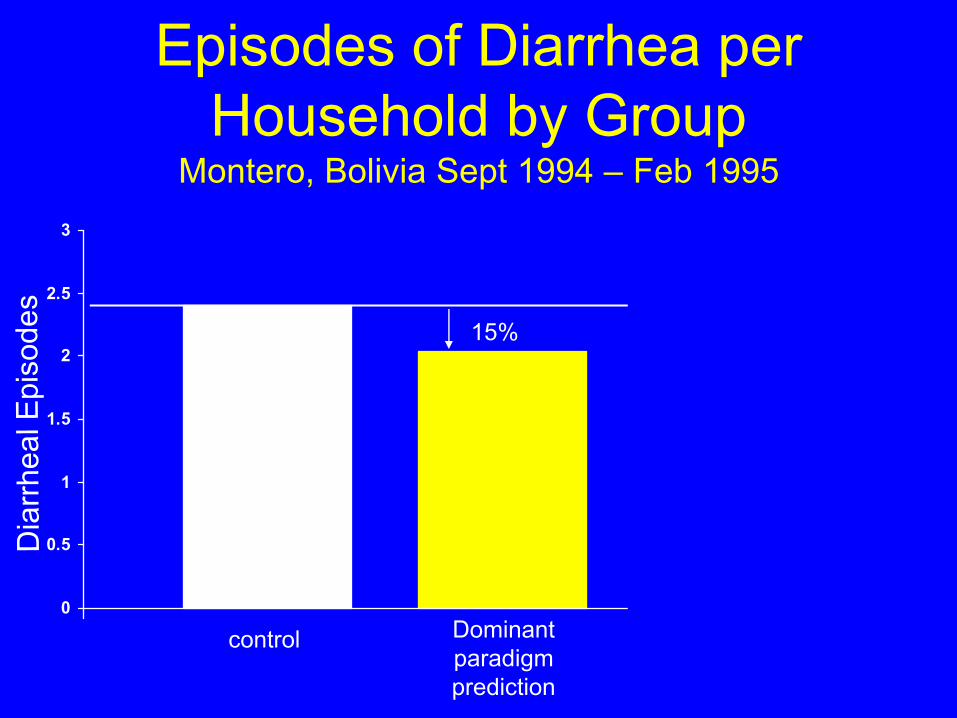
Episodes of Diarrhea per Household by Group
Montero, Bolivia Sept 1994 – Feb 1995
0
0.5
1
1.5
2
2.5
3
control Dominant paradigm prediction
bleach + vessel
15%44% p<.05
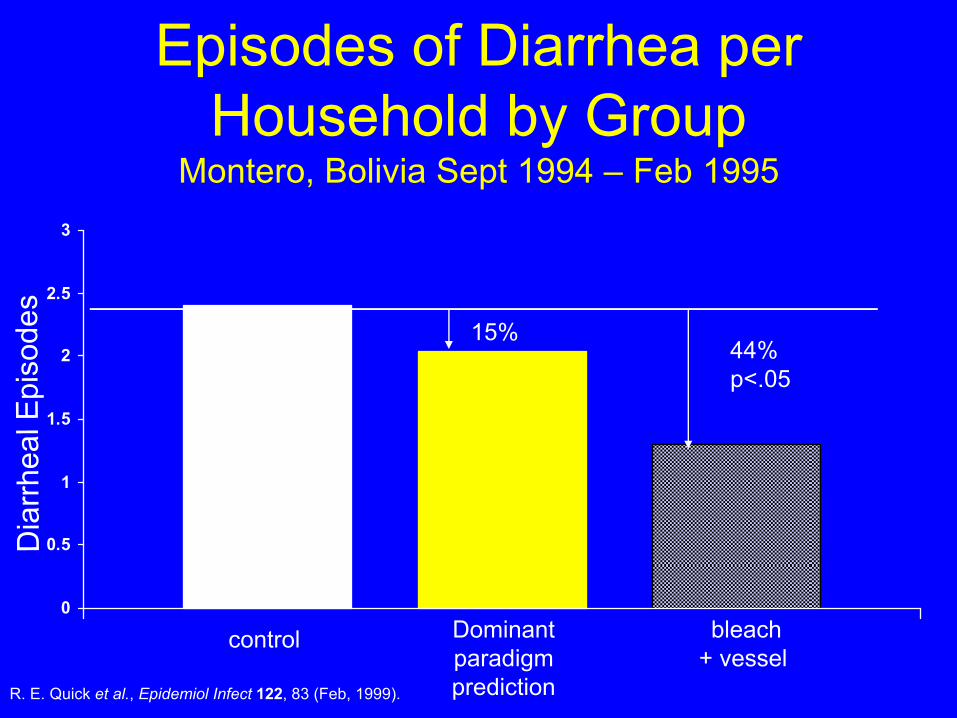
Episodes of Diarrhea per Household by Group
Montero, Bolivia Sept 1994 – Feb 1995
0
0.5
1
1.5
2
2.5
3
control Dominant paradigm prediction
bleach + vessel
15%44% p<.05
R. E. Quick et al., Epidemiol Infect 122, 83 (Feb, 1999).
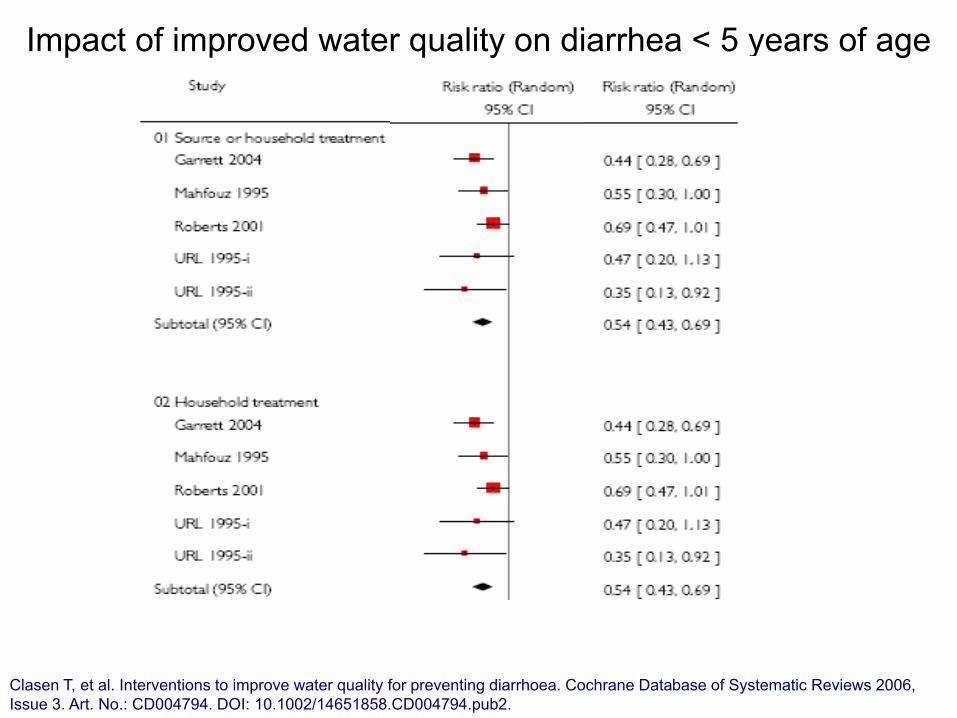
Impact of improved water quality on diarrhea < 5 years of age
Clasen T, et al. Interventions to improve water quality for preventing diarrhoea. Cochrane Database of Systematic Reviews 2006, Issue 3. Art. No.: CD004794. DOI: 10.1002/14651858.CD004794.pub2.
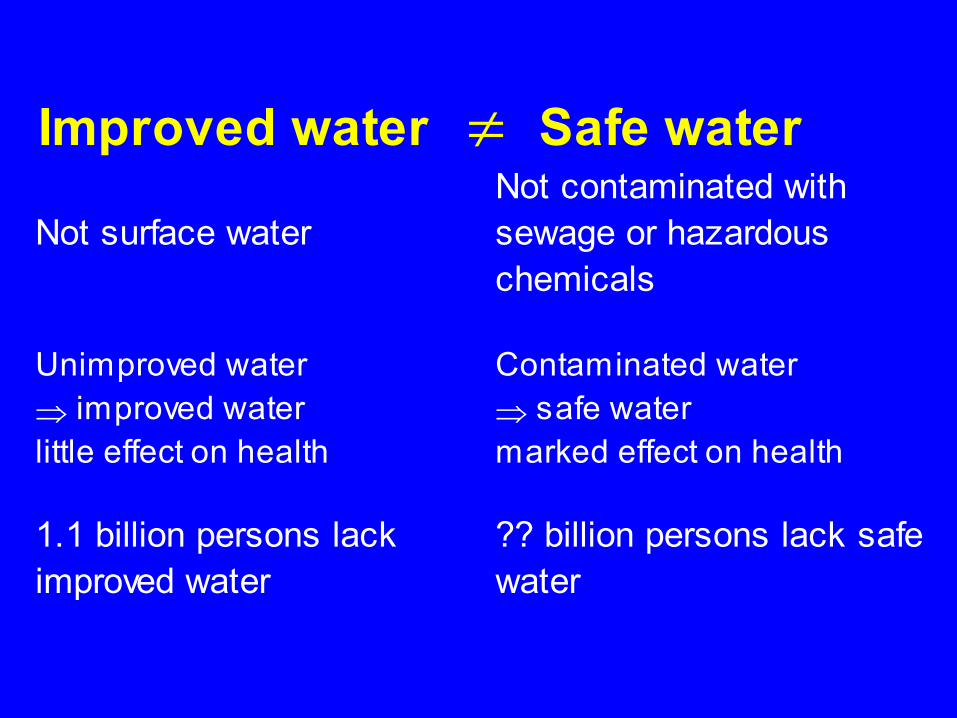
Improved water Safe water
Not surface water Not safe water
Not contaminated with sewage or hazardous chemicals
Unimproved water "iimproved water little effect on health
Contaminated water safe "#safe water marked effect on health
1.1 billion persons lack improved water
?? billion persons lack safe water
!
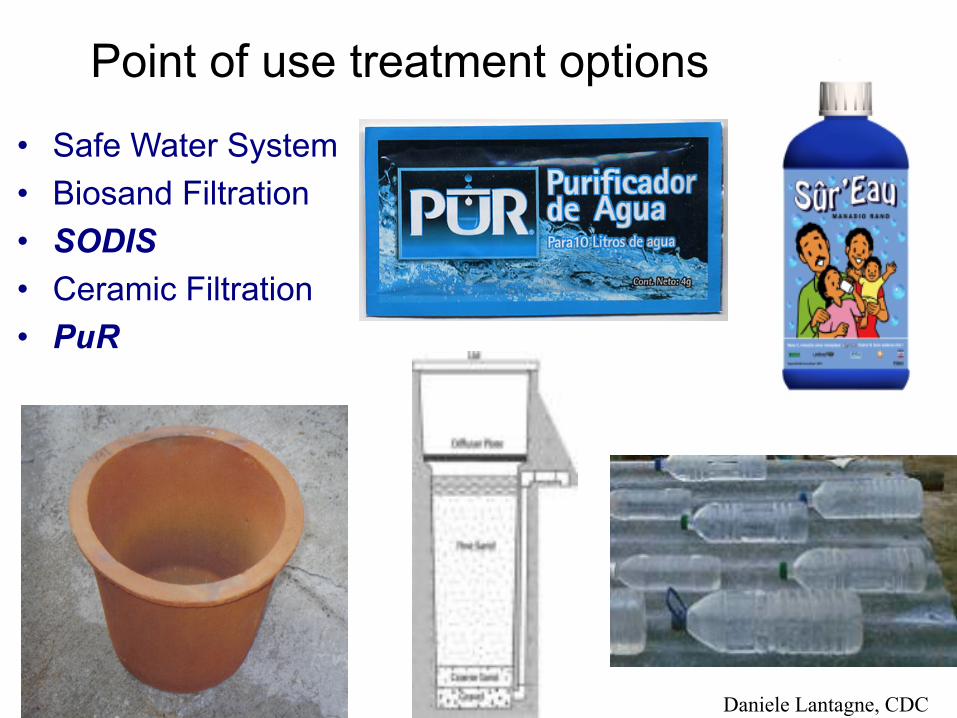
Point of use treatment options
• Safe Water System• Biosand Filtration• SODIS• Ceramic Filtration• PuR
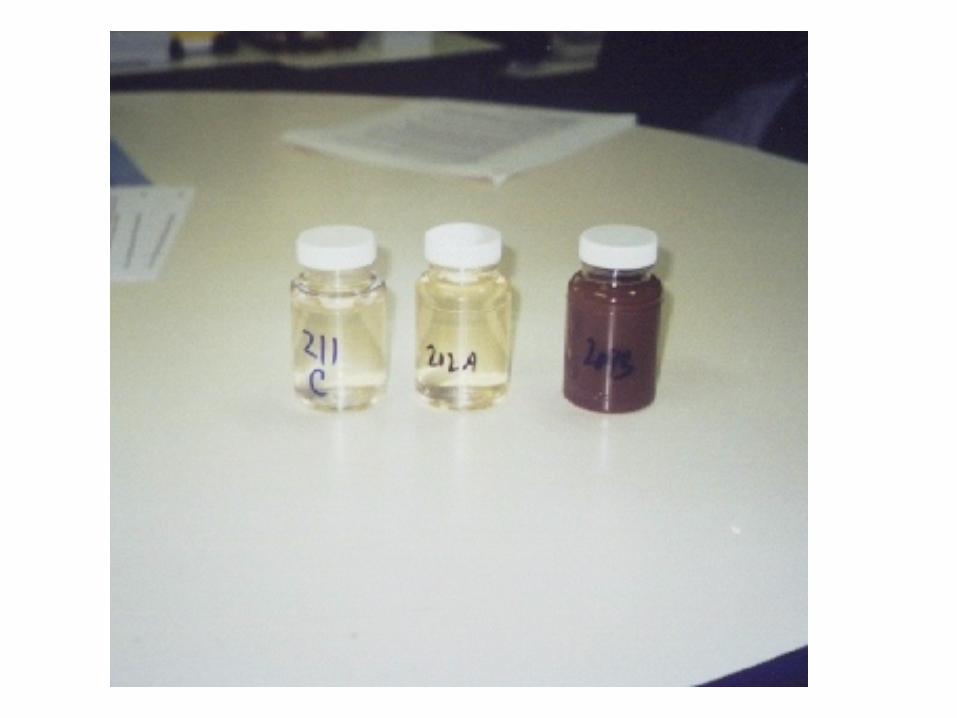
Daniele Lantagne, CDC
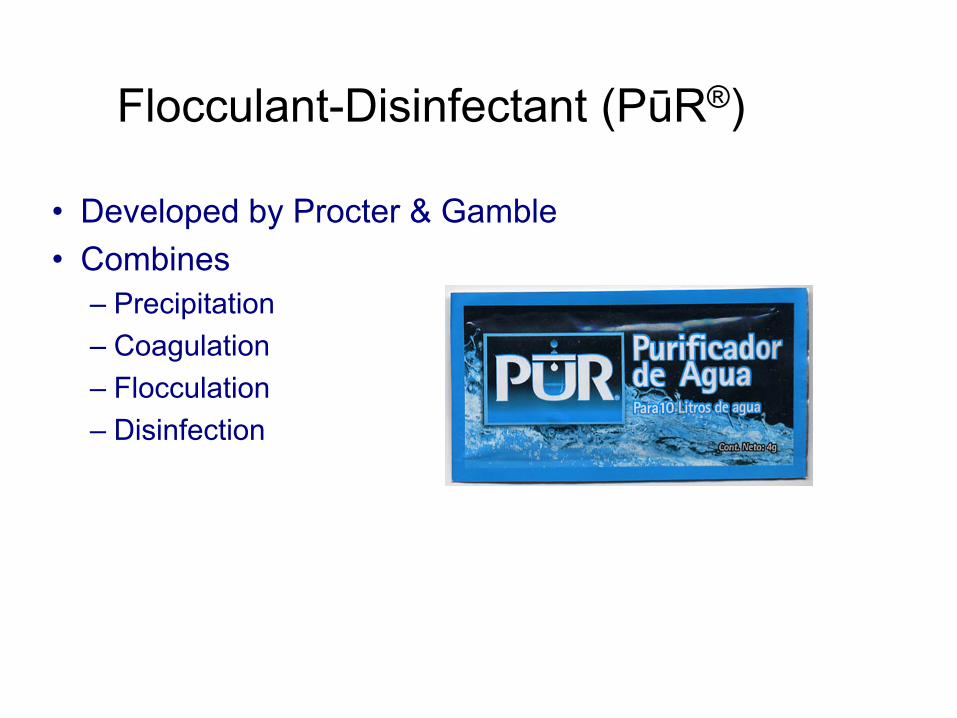
Flocculant-Disinfectant (P!R®)
• Developed by Procter & Gamble• Combines
– Precipitation– Coagulation– Flocculation– Disinfection
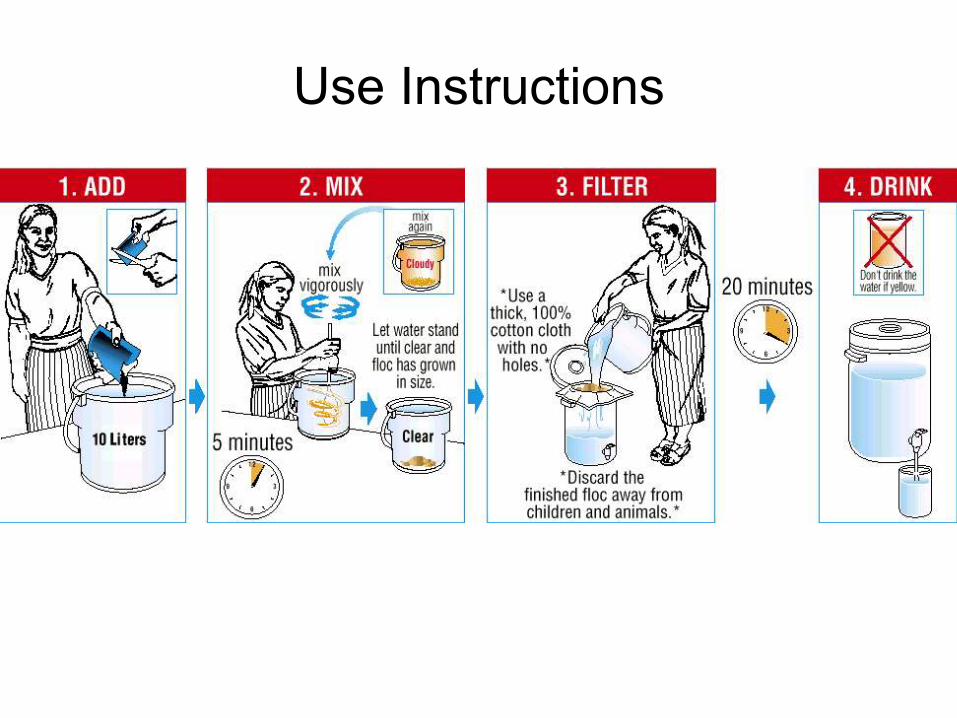
Use Instructions

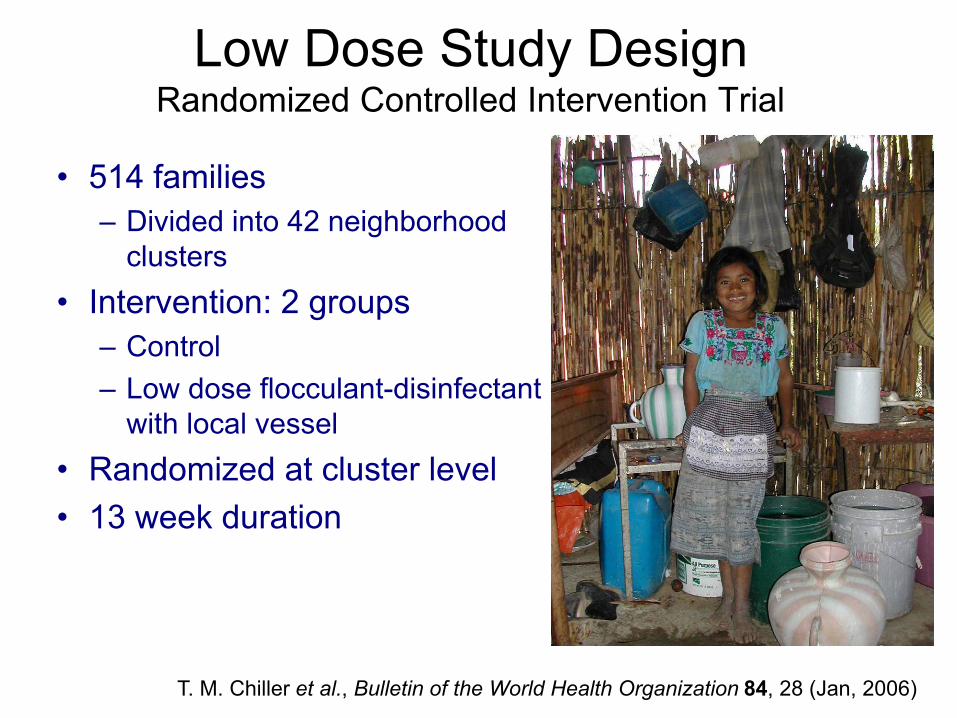
Low Dose Study DesignRandomized Controlled Intervention Trial
• 514 families– Divided into 42 neighborhood
clusters • Intervention: 2 groups
– Control– Low dose flocculant-disinfectant
with local vessel• Randomized at cluster level• 13 week duration
T. M. Chiller et al., Bulletin of the World Health Organization 84, 28 (Jan, 2006)
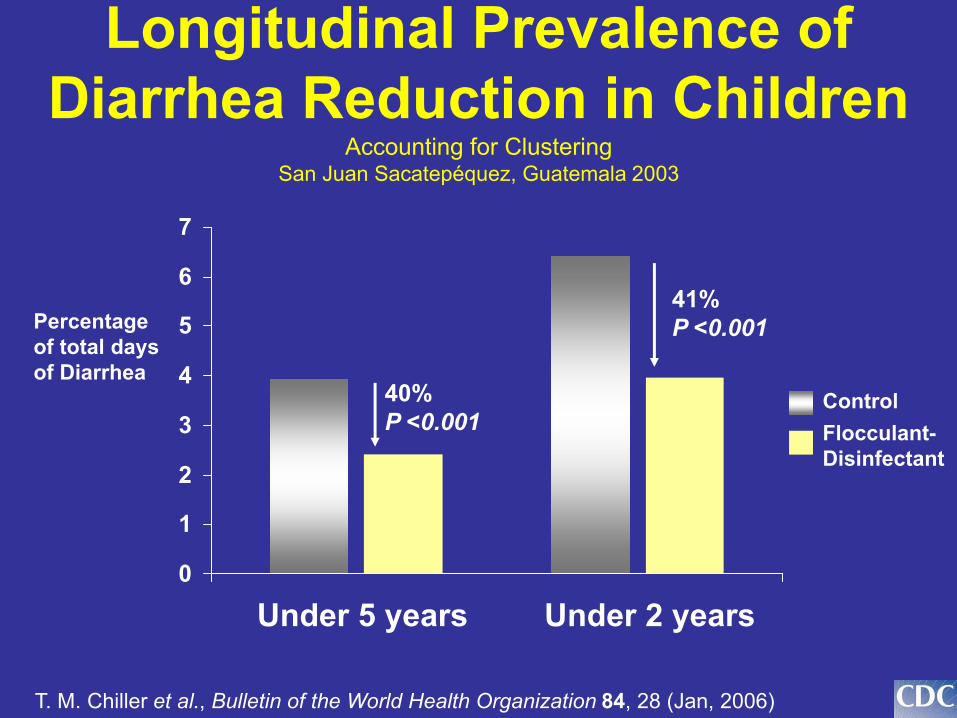
Longitudinal Prevalence of Diarrhea Reduction in Children
Accounting for ClusteringSan Juan Sacatepéquez, Guatemala 2003
0
1
2
3
4
5
6
7
Percentage of total days of Diarrhea
Under 5 years Under 2 years
Flocculant-Disinfectant
Control40% P <0.001
41% P <0.001
T. M. Chiller et al., Bulletin of the World Health Organization 84, 28 (Jan, 2006)
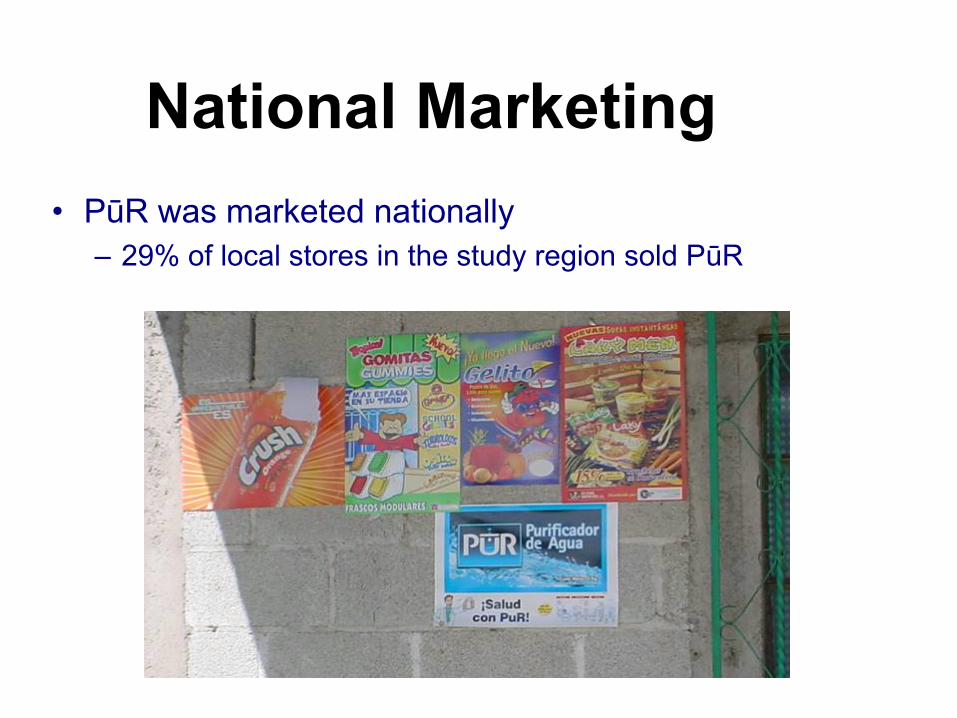
National Marketing• P!R was marketed nationally
– 29% of local stores in the study region sold P!R
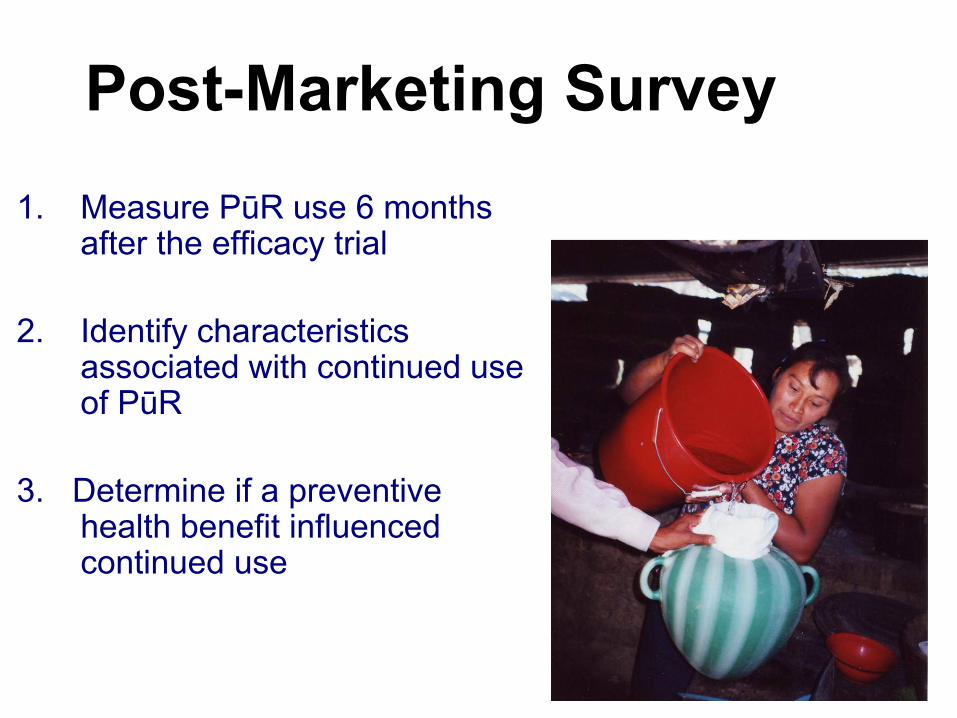
Post-Marketing Survey1. Measure P!R use 6 months
after the efficacy trial
2. Identify characteristics associated with continued use of P!R
3. Determine if a preventive health benefit influenced continued use

Post-Marketing Use (n=462)• Only 5% of households
– Purchased the product within the previous 2 weeks– Used it within the last week– Had an unopened sachet
• Mean consumption was 4 sachets / week (vs. 10 / week in the trial)
• The only predictor of purchasing was belief that drinking water made one’s family sick
– Income was not a predictor– Having been randomized to receive the product was not a
predictor• Similar national rates ! discontinued marketing
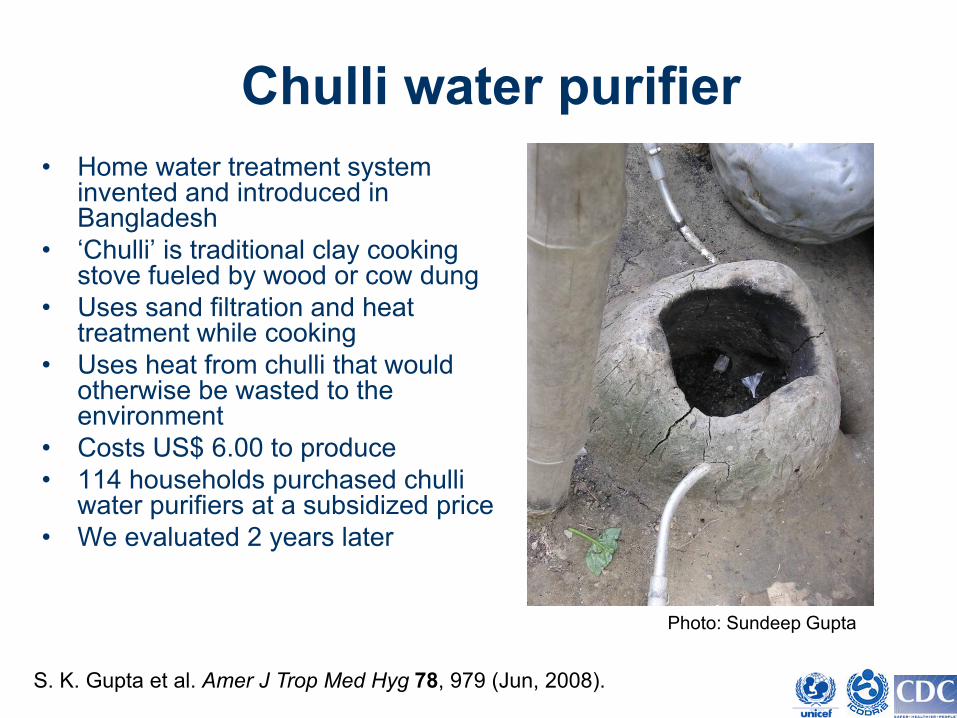
• Home water treatment system invented and introduced in Bangladesh
• ‘Chulli’ is traditional clay cooking stove fueled by wood or cow dung
• Uses sand filtration and heat treatment while cooking
• Uses heat from chulli that would otherwise be wasted to the environment
• Costs US$ 6.00 to produce • 114 households purchased chulli
water purifiers at a subsidized price• We evaluated 2 years later
Chulli water purifier
S. K. Gupta et al. Amer J Trop Med Hyg 78, 979 (Jun, 2008).
Photo: Sundeep Gupta

Chulli water purifier
Bucket with sand
Bamboo stand
Plastic tubing
Aluminum coil inside clay chulli
Aluminum tubing
Plastic tubing
Tap affixed to standAluminum kolshi for water collection or storage
Aluminum tubing
Opening for firewood
Water output
Sand filtration
Heat treatment
Usage of the chulli water purifier (N=101)
• 21 (21%) respondents reported regular use of the chulli water purifier
• On repeat visits for water testing, three weeks after the initial visit, 4 (4%) respondents continued to report regular use
S. K. Gupta et al. Amer J Trop Med Hyg 78, 979 (Jun, 2008).
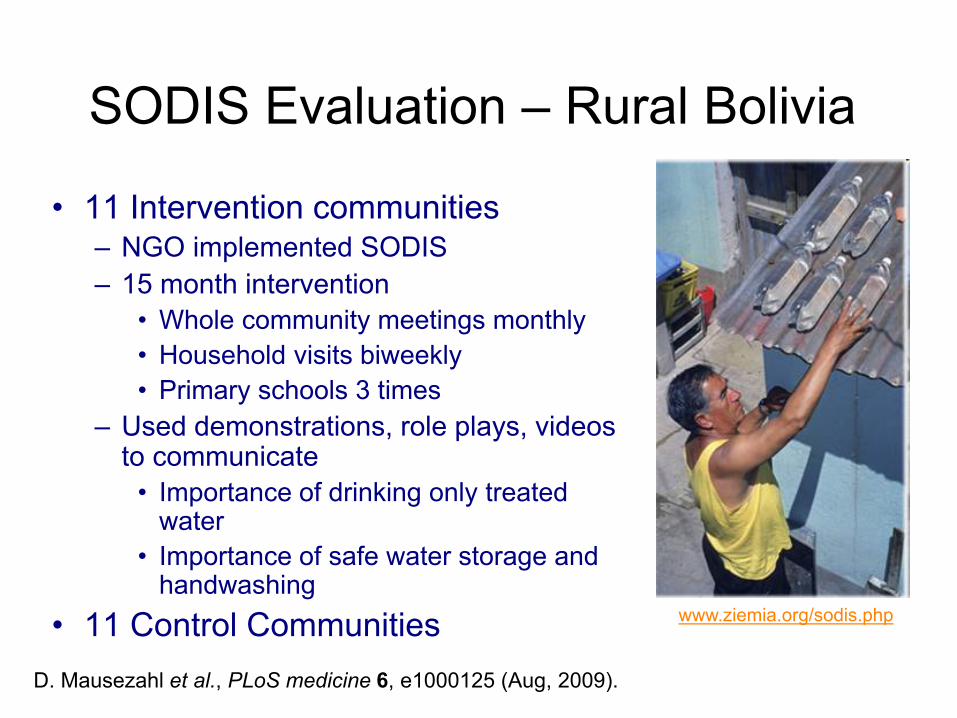
SODIS Evaluation – Rural Bolivia
• 11 Intervention communities– NGO implemented SODIS– 15 month intervention
• Whole community meetings monthly• Household visits biweekly• Primary schools 3 times
– Used demonstrations, role plays, videos to communicate
• Importance of drinking only treated water
• Importance of safe water storage and handwashing
• 11 Control CommunitiesD. Mausezahl et al., PLoS medicine 6, e1000125 (Aug, 2009).
www.ziemia.org/sodis.php
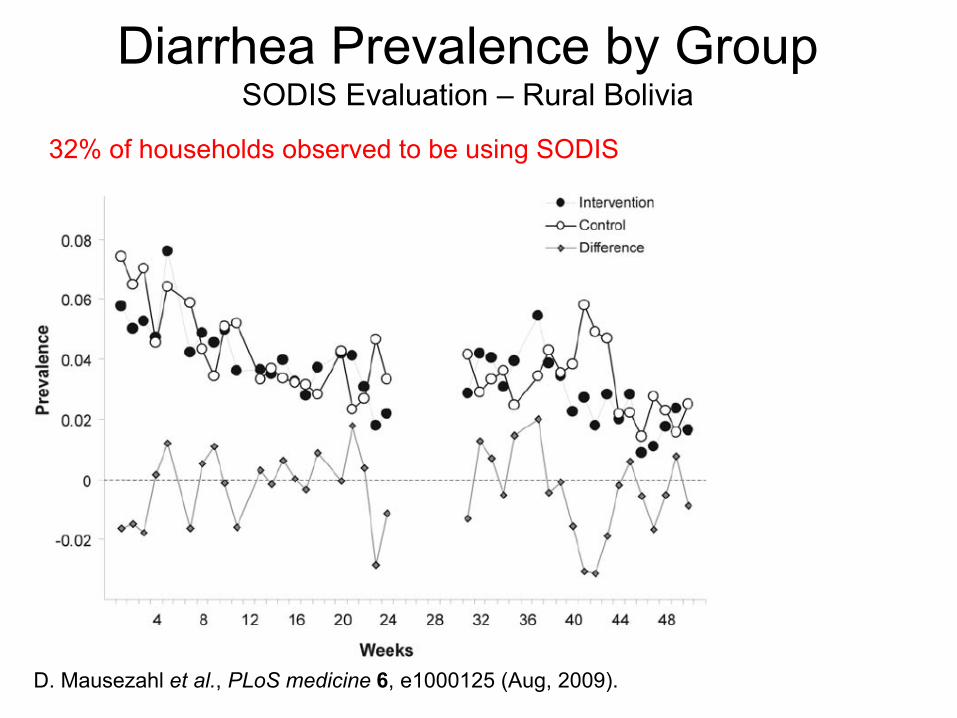
Diarrhea Prevalence by GroupSODIS Evaluation – Rural Bolivia
D. Mausezahl et al., PLoS medicine 6, e1000125 (Aug, 2009).
32% of households observed to be using SODIS

Barriers to household water treatment
• Very low demand for improved water quality, especially among the poor
• The children who suffer most from waterborne disease are the poor
• The poor are those who are least able to afford to purchase products to treat their water.

• Is household water treatment a failed strategy?
• Is it a fundamentally bad idea to expect the poorest people in the world to set up a personal water treatment facility in their home?
Hard questions

Wealthier households use household water treatment
www.aavaas.com
www.aavaas.com
www.opnan.com
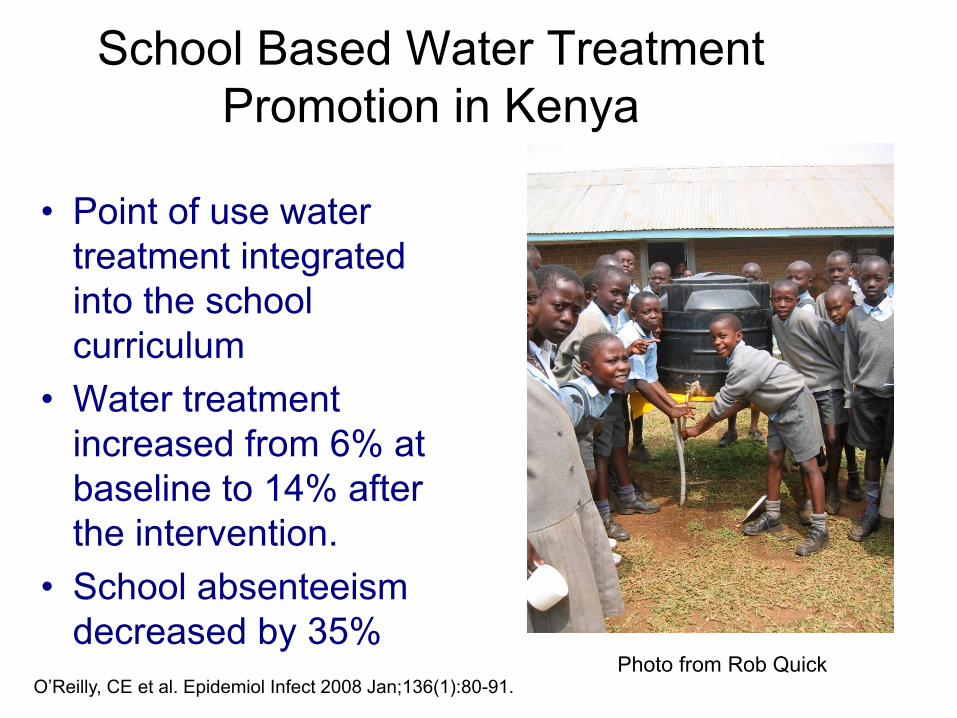
School Based Water Treatment Promotion in Kenya
• Point of use water treatment integrated into the school curriculum
• Water treatment increased from 6% at baseline to 14% after the intervention.
• School absenteeism decreased by 35%
Photo from Rob QuickO’Reilly, CE et al. Epidemiol Infect 2008 Jan;136(1):80-91.
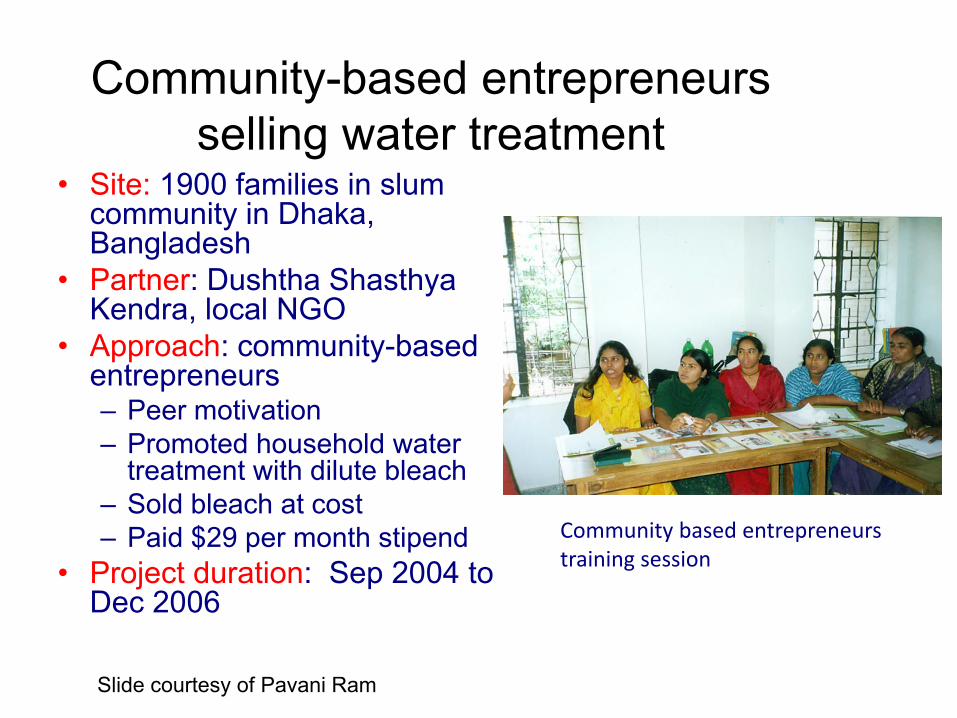
Community-based entrepreneursselling water treatment
• Site: 1900 families in slum community in Dhaka, Bangladesh
• Partner: Dushtha Shasthya Kendra, local NGO
• Approach: community-based entrepreneurs – Peer motivation– Promoted household water
treatment with dilute bleach– Sold bleach at cost– Paid $29 per month stipend
• Project duration: Sep 2004 to Dec 2006
Slide courtesy of Pavani Ram
Community!based!entrepreneurs!training!session

Hardware and behavior change activities
• Hardware sold by local women– Sodium hypochlorite solution in
dropper bottle (5.25% strength)• $0.13 for one-month supply
– Water container with spigot (15 L)• US $2.50 paid in 6 monthly
installments• Maintain safe storage• Facilitate handwashing
• Behavior change activities– Door-to-door mobilization by CBEs
• Information dissemination • Hardware sales• Address individual concerns
– Large group meetings and school-based activities
• Facilitated by DSK staff
Community!resident!disinfecting!her!water!in!the!storage!tank
Slide courtesy of Pavani Ram

Evaluationcommunity-based entrepreneurs
• Aug 2004– Baseline– <1% of drinking water had
detectable chlorine• March 2006 --100 randomly
selected households– 94% had heard of sodium
hypochlorite product– 85% reported purchasing at
least one bottle– 60% of households with
chlorine detected– Median 6 bottles of water
treatment purchased in last 18 months
Slide courtesy of Pavani Ram
Photo: Hossain Mohammad Shahed Sazzad
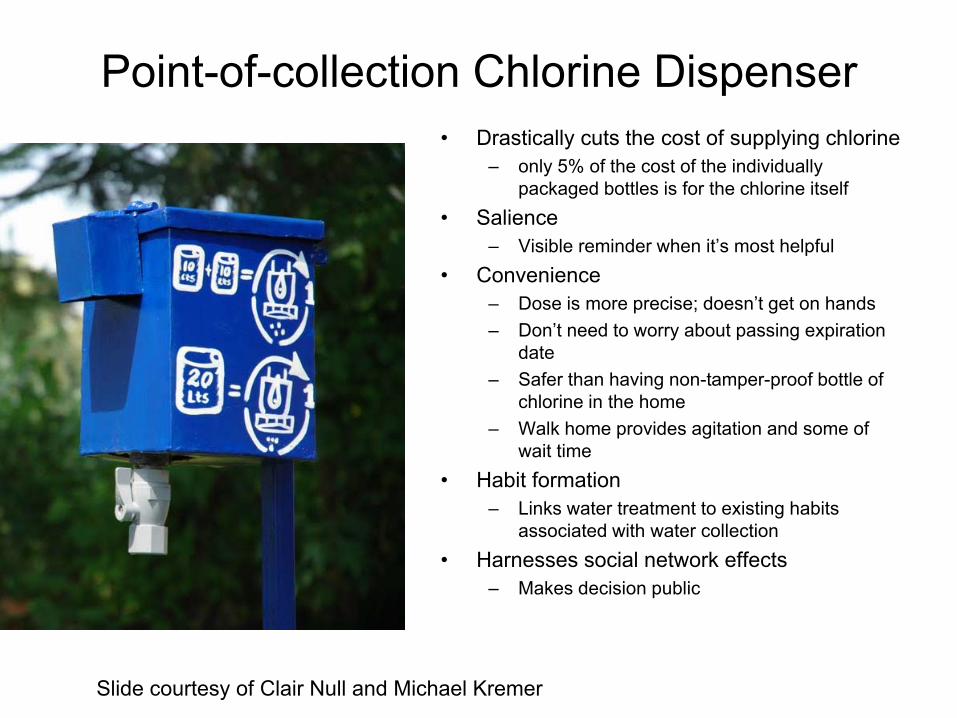
Point-of-collection Chlorine Dispenser• Drastically cuts the cost of supplying chlorine
– only 5% of the cost of the individually packaged bottles is for the chlorine itself
• Salience – Visible reminder when it’s most helpful
• Convenience– Dose is more precise; doesn’t get on hands– Don’t need to worry about passing expiration
date– Safer than having non-tamper-proof bottle of
chlorine in the home– Walk home provides agitation and some of
wait time• Habit formation
– Links water treatment to existing habits associated with water collection
• Harnesses social network effects– Makes decision public
Slide courtesy of Clair Null and Michael Kremer
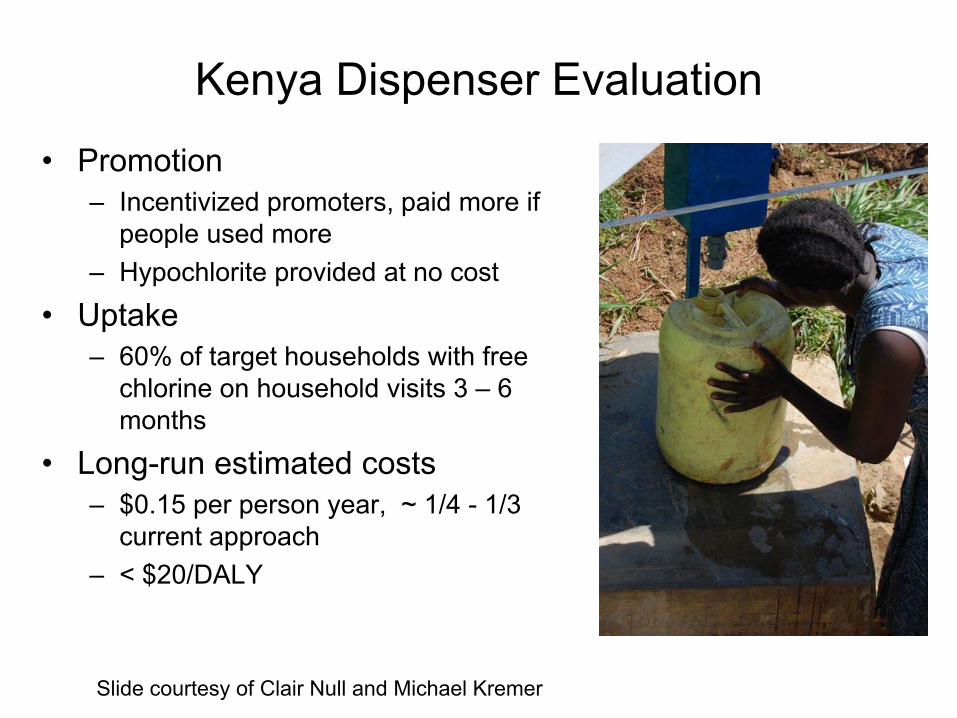
Kenya Dispenser Evaluation
• Promotion– Incentivized promoters, paid more if
people used more– Hypochlorite provided at no cost
• Uptake– 60% of target households with free
chlorine on household visits 3 – 6 months
• Long-run estimated costs – $0.15 per person year, ~ 1/4 - 1/3
current approach– < $20/DALY
Slide courtesy of Clair Null and Michael Kremer
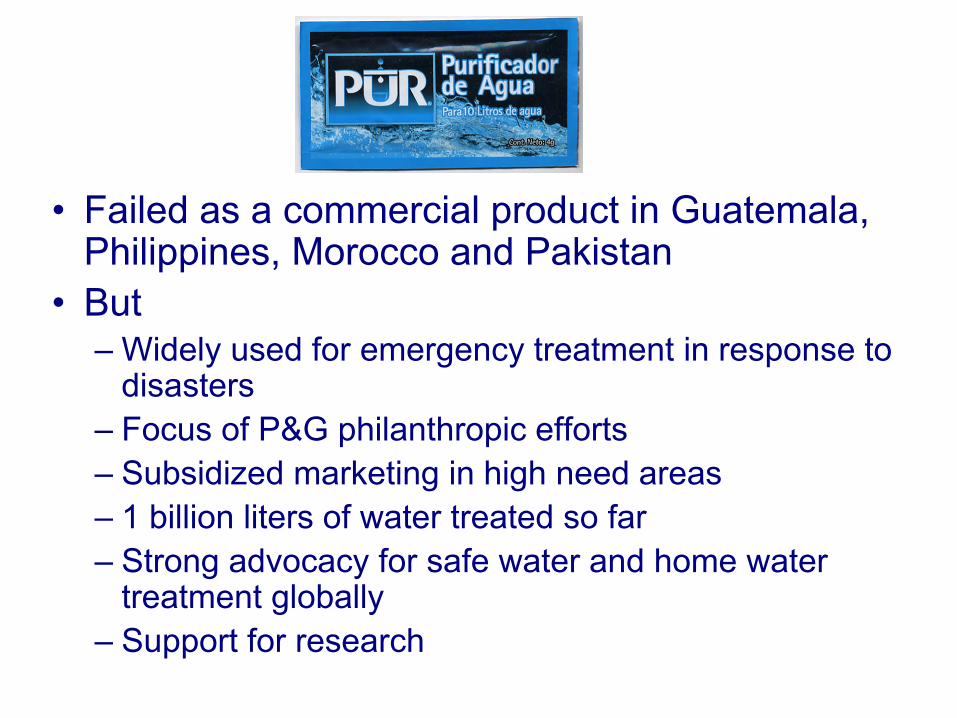
• Failed as a commercial product in Guatemala, Philippines, Morocco and Pakistan
• But– Widely used for emergency treatment in response to
disasters– Focus of P&G philanthropic efforts– Subsidized marketing in high need areas– 1 billion liters of water treated so far– Strong advocacy for safe water and home water
treatment globally– Support for research
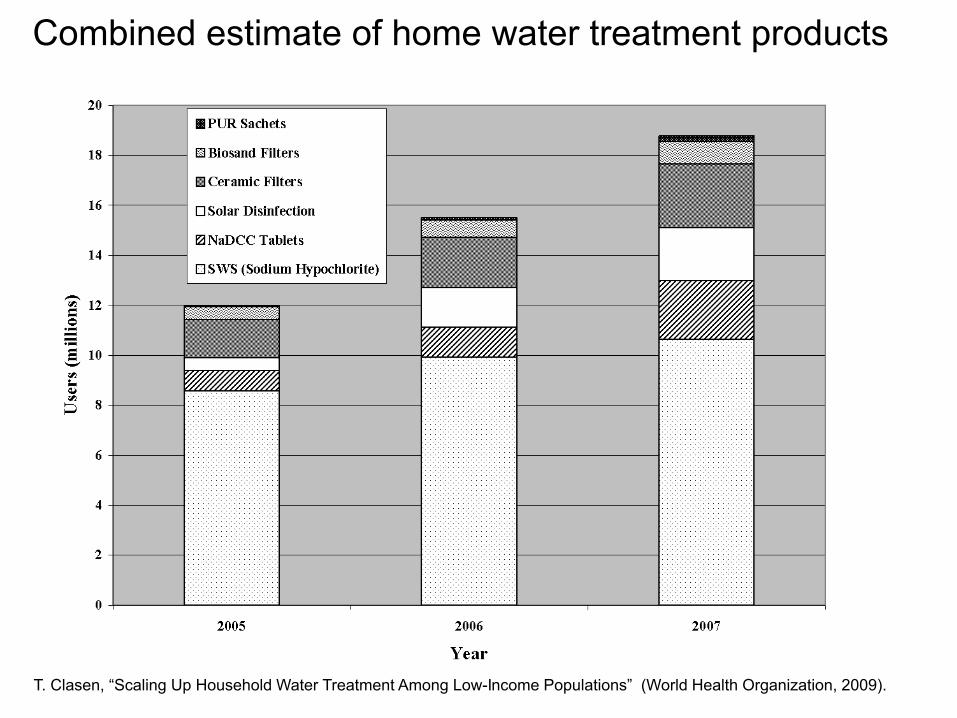
Combined estimate of home water treatment products
T. Clasen, “Scaling Up Household Water Treatment Among Low-Income Populations” (World Health Organization, 2009).
Key questions for point of use water treatment
• Can we increase demand for improved water quality among the group in highest need?
• Can we develop sustainable systems that provide point of use approaches to communities in highest need?
• Can we reduce the burden of disease, particularly among the poorest with this approach?

Improved Water Qualitypolitical dimension
• In the 1990s Argentina allowed privatization of water supplies
• 30% of the countries municipalities embraced privatization.
• With privatization in Buenos Aires– More people connected to the water network
• >580,000 new connections in Buenos Aires• 85% among the poor
– 33 % reduction in child mortality• In 2006 water privatization revoked
Key PointsGlobal Water Crisis
• Lack of sufficient safe water is a major contributor to child death globally
• Population growth, global warming, increasing meat consumption, and depletion of aquifers are adding additional pressure on overstressed fresh drinking water supplies.
• The greatest human cost to the water crises is borne by low income children living in low income countries
• The solutions are not simple
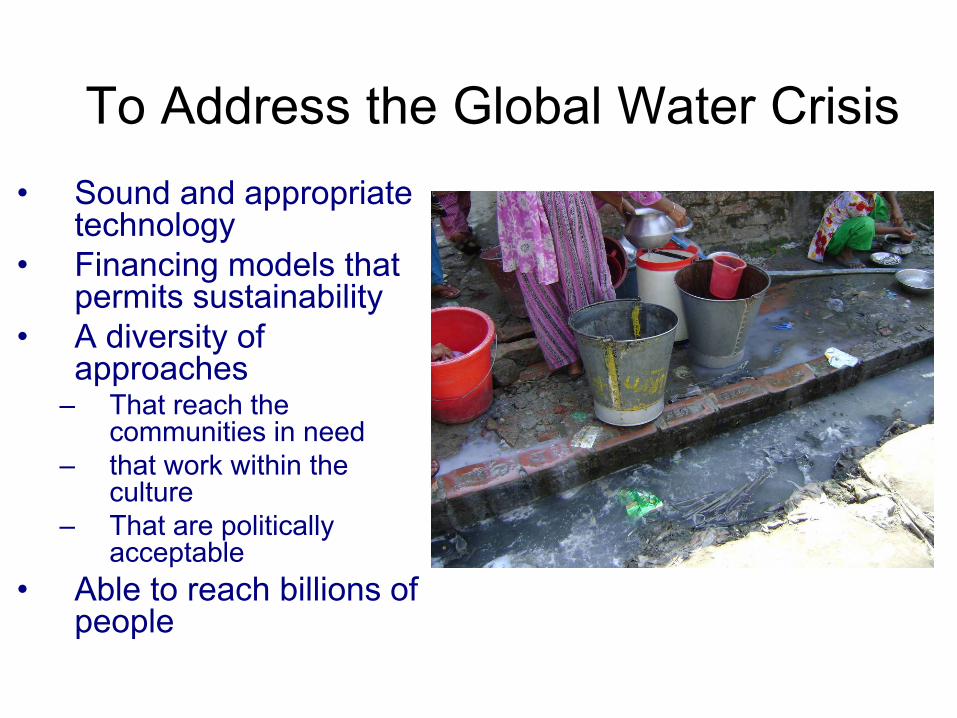
To Address the Global Water Crisis• Sound and appropriate
technology• Financing models that
permits sustainability• A diversity of
approaches– That reach the
communities in need– that work within the
culture– That are politically
acceptable• Able to reach billions of
people
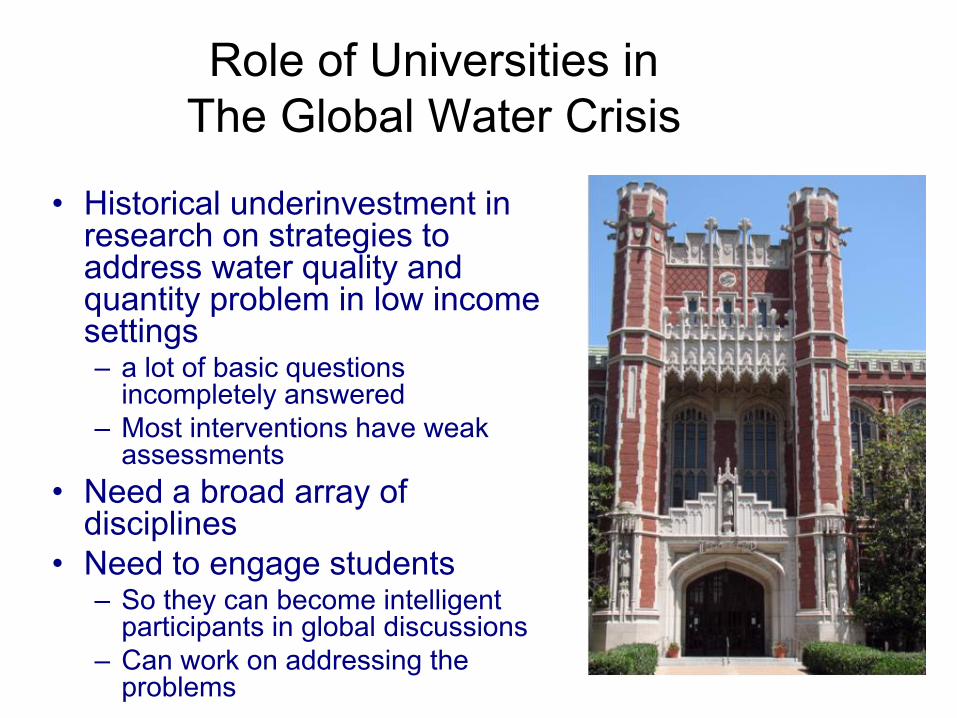
Role of Universities in The Global Water Crisis
• Historical underinvestment in research on strategies to address water quality and quantity problem in low income settings– a lot of basic questions
incompletely answered– Most interventions have weak
assessments• Need a broad array of
disciplines• Need to engage students
– So they can become intelligent participants in global discussions
– Can work on addressing the problems
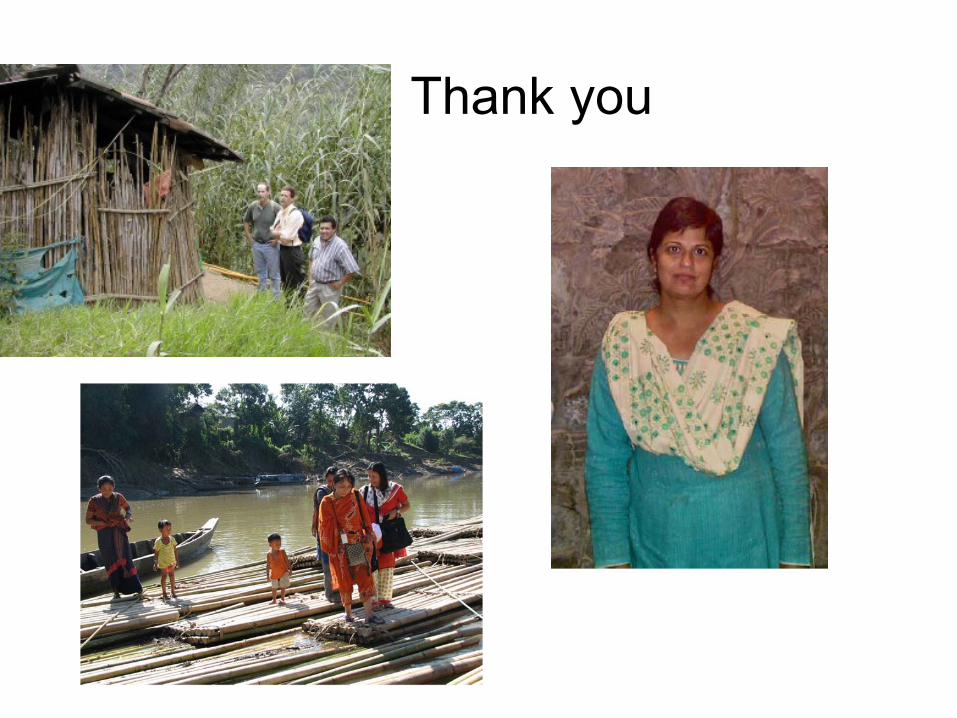
Thank you