Embed Size (px)
Citation preview

DOCIIMENT R SUMF,
ED 023 474 40 PS 001 279By -Rubin, Rosalyn; Balow, BruceA Comparison of Pre -Kindergarten and Pre -1st Grade Boys and Girls on Measures of School Readiness andLangeage Development. Interim Report.
Minnesota Univ Minneapolis . Dept . of Special Education.Spons Agency -Office of Education (DHEW), Washington, DC. Bureau of Research.Bureau No -BR -6 -1176Pub Date 29 Aug 68Grant -OEG -32 -33 -0402 -6021Note-19p.EDRS Price MF -$025 HC -$105Descriptors-Academic Performance, Behavior Rating Scales, *Kindergarten Children, Language Development,Learning Readiness, Measurement Instruments, *Performance Factors, Performance Tests, *PreschoolChildren, Preschool Evaluation, *Sex Differences, *Standardized Tests
Identifiers-Behavior Rating Scale, Illinois Test Of Psycholinguistic Abilities, Metropolitan Readiness TestsAlthough normative figures of the performance of late kindergarten and entering
first grade students on standardized readiness measures are usually available in thetest manuals, no such data is available forioupils about to enter kindergarten. In orderto obtain such data, 638 kindergarten (P-K) 'children in Minnesota were tested onthree instruments: (1) the Metropolitan Readiness Tests (MRT), (2) the Illinois Test ofPsycholinguistic Abilities (ITPA), and (3) the Behavior Rating Scale. Some 570prefirst-grade (P-1) children were 01:-.o tested, including 300 of the children tested atthe P-K level. It was found that P-K girls did significantly better on the MRT than P-Kboys. and girls did better than boys at the P-1 level. Compared with norms availablefor P7-1 children, the P-1 boys in this study fell at the thirty-fifth percentile; the girls, atthe forty-second. On the ITPA, neither at the P-K level nor at the P-1 level did thereexist overall differences in performance on the basis of sex. It appears, therefore.that the kindergarten experience tends to modify initial performance differences onthe basis of sex towards uniformity rather than towards greater divergence in favorof the girls. P-K girls rated higher than the boys on all items of the Behavior RatingScale, but at the P-1 level there was no significant difference. (WD)
ttiz
Ma SA DEPARTMENT OF HEALTH, EDUCATION & WELFARE.. OFFICE OF EaniiON
THIS DOCW.Irri ""TMY A :VFn FROM TrE.PERSON Oil
. i S 01 OR ONN;ONSSTATED DO NOT. NLCESSAidLY OtTieiALOFFiCE OF EDUCATIONPOSITION OR POLICY..
INTERIM REPORTProject N.,6-1176
Grant No. OEG-32-33-0402-6021
3Re-64 /17Pie9-21J
A COMPARISON OF PRE-KINDERGARTEN AND
PRE-1ST GRADE BOYS AND GIRLS ON MEASURES OF SCHOOL
READINESS AND LANGUAGE DEVELOPMENT
August 29, 1968
U. S. DEPARTMENT OFHEALTH, EDUCATION, AND WELFARE
Office of EducationBureau of Research

Interim Report
Project No. 6-1176
Grant No. OEG-32-33-0402-6021
A.Comparison of Pre-Kindergarten andPre-lst Grade Boys and Girls on Measures of School
Readiness and Language Development
Rosalyn RubinBruce Below
Department of Special EducationUniversity of MinnesotaMinneapolis, Minnesota
August 29, 1968
The research reported herein was performed pursuant to agrant from the Office of Education, U.S. Department of Health,Education and welfare. Contractors undertaking such pro-jects under Government sponsorship are encouraged to expressfreely their professional judgment in the conduct of theproject. Points of view or opinions stated do not, therefore,necessarily represent official Office of Education positionor policy.
U. S. DEPARTMENT OFHEALTH, EDUCATION, AND WELFARE
Office of EducationBureau of Research

Table of Contents
Page
Summary i 3
Introduction 3
Design 4
Data Analysis 8
Results 15
List of Tables
Table 1 Children Tested at Pre-KinderRarten andPre-First Grade 5
Table 2 Mean Raw Scores on Metropolitan ReadinessTest at Pre-Kinder arten Level 8
Table 3 Mean Raw Scores on Metropolitan ReadinessTests at Pre-First Grade Leve/ 9
Table 4 Mean ITPA Language Age Tccre at Pre-Kindergarten Level . 0 11
Table 5 Mean ITPA Language Av. -,Ls at Pre-PrU...+at /.076
First Grade Level . 11
Table 6 Number of Subjects With Scores lullingBeyond the ITPA Language Age Norms 13
Table 7 *Mean Rating of Test Behavior at Pre-Kindergarten Level 14
Table 8 Mean Ratings of Test Behavior atPre-First Grade Level 15
-2-
Summary
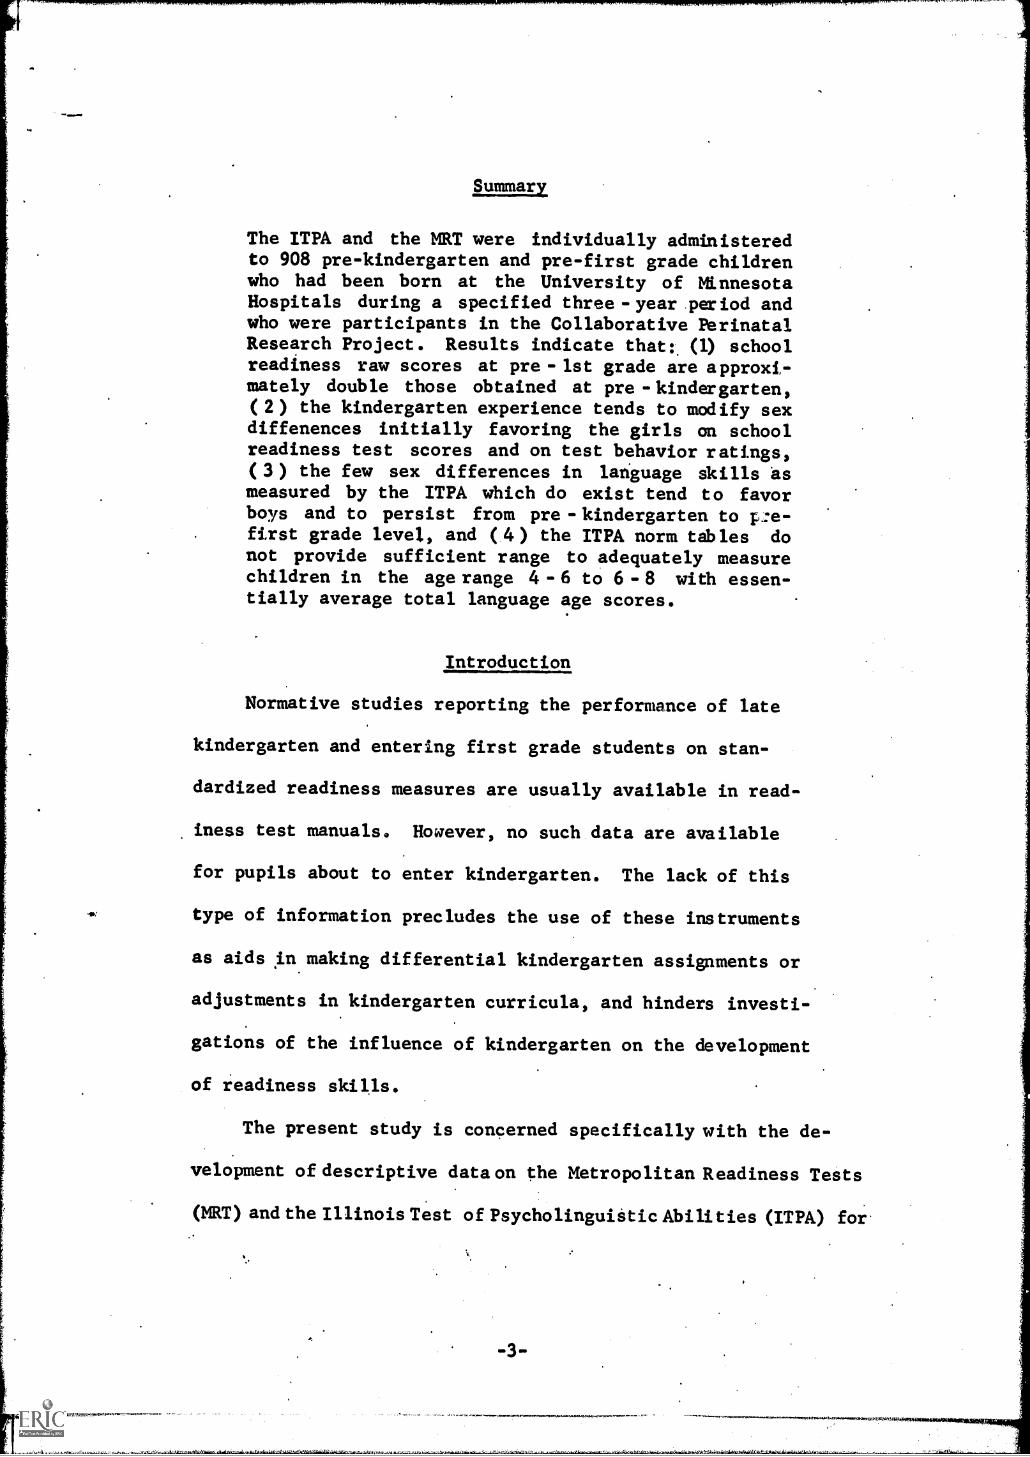
The ITPA and the MRT were individually administeredto 908 pre-kindergarten and pre-first grade childrenwho had been born at the University of MinnesotaHospitals during a specified three-year period andwho were participants in the Collaborative PerinatalResearch Project. Results indicate that:. (1) schoolreadiness raw scores at pre - 1st grade are approxi-mately double those obtained at pre -kindergarten,(2) the kindergarten experience tends to modify sexdiffenences initially favoring the girls on schoolreadiness test scores and on test behavior ratings,(3) the few sex differences in lariguage dkills asmeasured by the ITPA which do exist tend to favorboys and to persist from pre-kindergarten to p:e-first grade level, and (4) the ITPA norm tables donot provide sufficient range to adequately measurechildren in the age range 4-6 to 6-8 with essen-tially average total language age scores.
Introduction
Normative studies reporting the performance of late
kindergarten and entering first grade students on stan-
dardized readiness measures are usually available in read-
iness test manuals. However, no such data are available
for pupils about to enter kindergarten. The lack of this
type of information precludes the use of these instruments
as aids in making differential kindergarten assignments or
adjustments in kindergarten curricula, and hinders investi-
gations of the influence of kindergarten on the development
of readiness skills.
The present study is concerned specificallywith the de-
velopment of descriptive data on the Metropolitan Readiness Tests
(MRT)andtheIllinoisTest of PsycholinguiSticAbilities (ITPA) for-
youngsters who have not yet experienced the possibly modifying
effects of kindergarten, and a comparison of these results with
the performance of youngsters at the point of entrance to first
grade.
Design
Amhitstt
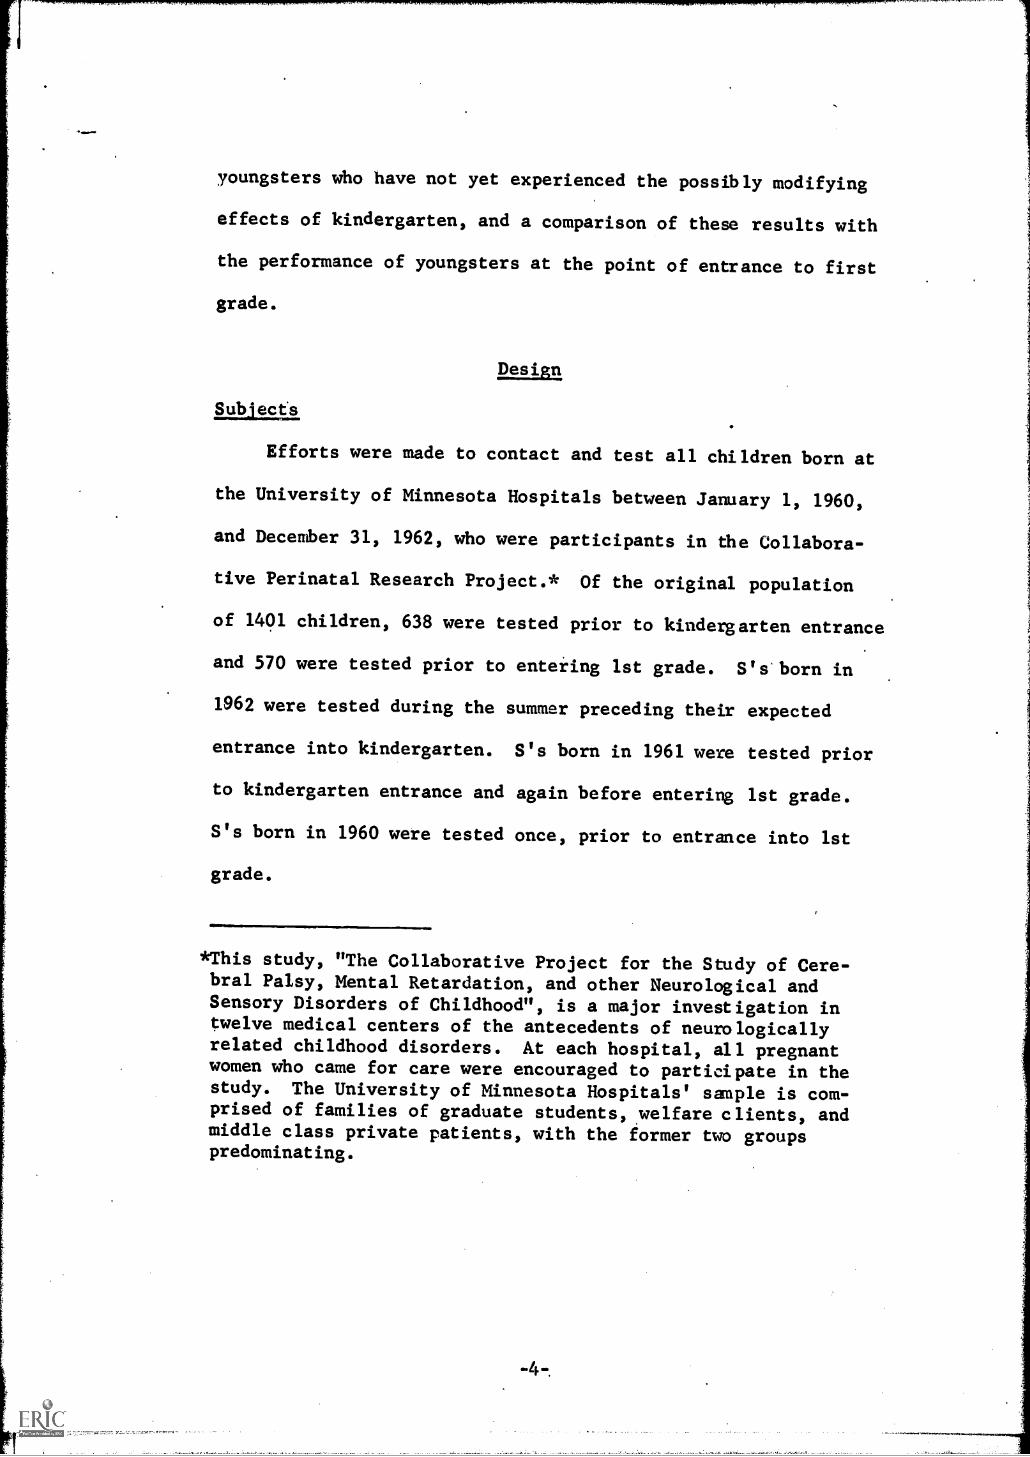
Efforts were made to contact and test all children born at
the University of Minnesota Hospitals between January 1, 1960,
and December 31, 1962, who were participants in ehe Collabora-
tive Perinatal Research Project.* Of the original population
of 1401 children, 638 were tested prior to kindepgarten entrance
and 570 were tested prior to entering 1st grade. S's born in
1962 were tested during the summer preceding their expected
entrance into kindergarten. S's born in 1961 were tested prior
to kindergarten entrance and again before entering 1st grade.
S's born in 1960 were tested once, prior to entrance into 1st
grade.
*This study, "The Collaborative Project for the Study of Cere-bral Palsy, Mental Retardation, and other Neurological andSensory Disorders of Childhood", is a major investigation intwelve medical centers of the antecedents of neurologicallyrelated childhood disorders. At each hospital, all pregnantwomen who came for care were encouraged to participate in thestudy. The University of Minnesota Hospitals' sample is com-prised of families of graduate students, welfare clients, andmiddle class private patients, with the former two groupspredominating.

PS .0
4 12
79
TABLE 1
Children Tested at
Pre-Kdgn., & Pre-lst Grade
Year
of
Birth
Total
Live
Births
Died
Out
of
State
Couldn't Locate
or
Wouldn't Partic.
Tested
Pre-Kd n
Tested
Pre-lst
1960
1961
1962
424
451
526
20
10
12
(5%)
(2%)
(2i)
81
125
130
(19%)
(28%)
(25%)
54
33
53
(13%)
(07%)
(10%)
296
338
(660
(64%)
270
300
(61%)
(67%)
Total
1401
42
(3%)
336
(24%)
140
(10%)
638
1(657o)
570
(657)
165% of all children
2657 of all children
born in 1961 + 1962
born in 1960 + 1961
2
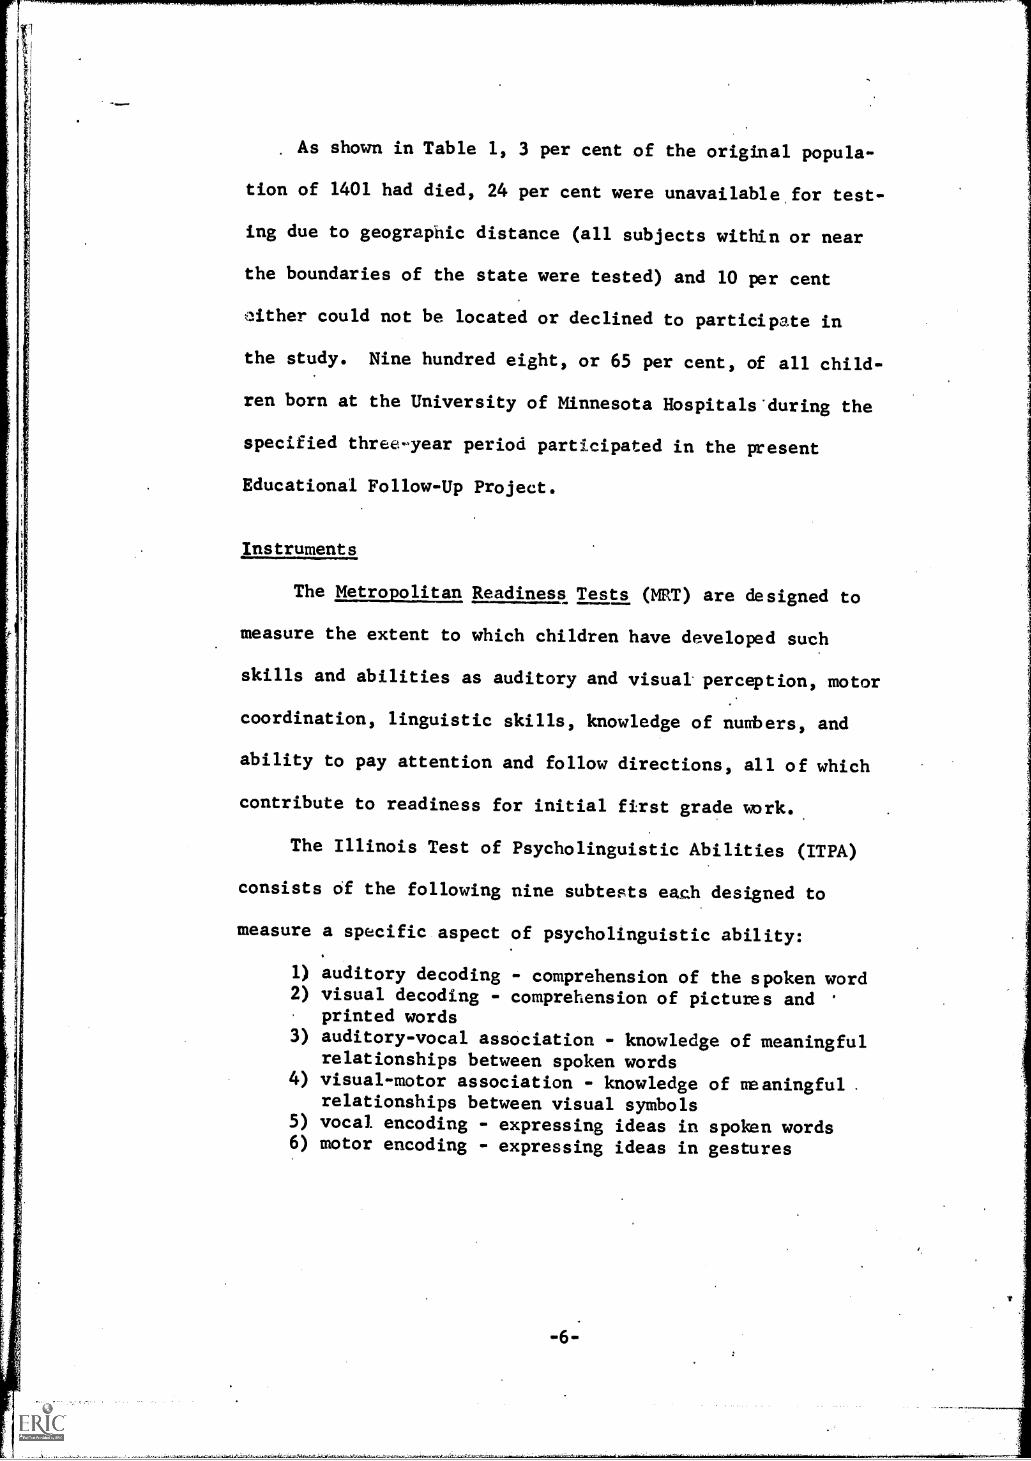
As shown in Table 1, 3 per cent of the original popula-
tion of 1401 had died, 24 per cent were unavailable for test-
ing due to geographic distance (all subjects within or near
the boundaries of the state were tested) and 10 per cent
olther could not be located or declined to participate in
the study. Nine hundred eight, or 65 per cent, of all child-
ren born at the University of Minnesota Hospitals'during the
specified three-year period participated in the present
Educational Follow-Up Project.
Instruments
The Metropolitan Readiness Tests (MRT) are designed to
measure the extent to which children have developed such
skills and abilities as auditory and visual perception, motor
coordination, linguistic skills, knowledge of numbers, and
ability to pay attention and follow directions, all of which
contribute to readiness for initial first grade work.
The Illinois Test of Psycholinguistic Abilities (ITPA)
consists of the following nine subtests each designed to
measure a specific aspect of psycholinguistic ability:
1) auditory decoding - comprehension of the spoken word2) visual decoding - comprehension of pictures and
printed words3) auditory-vocal association - knowledge of meaningful
relationships between spoken words4) visual-motor association - knowledge of meaningful .
relationships between visual symbols5) vocal encoding - expressing ideas in spoken words6) motor encoding - expressing ideas in gestures

7) auditory-vocal automatic - prediction of futurelinguistic events based on grammatical rules
8) auditory-vocal sequencing - repetition of a se-quence of symbols presented auditorally
9) visual-motor sequencing - reproduction of a se-quence of symbols presented visually.
The Behavior Rating Scale was devised for the purposes
of the Educational Follow-Up Project and was used to rate the
test behavior of S's in the areas of attention span, coopera-
tion, perseverance, and social poise, plus a rating of general
test conditions.
Procedure
Parents of children born at the University of Minnesota
Hospitals during the specified three year periodwere
initially cOntacted by mail with an explanation of the pur-
pose of the study and a request for their participation.
This was followed by a phone call to set the appointment for
testing the child in his own home if possible, or in a local
school building if adequate space was not available in the
home. The tests were administered during a single session
with total testing time ranging from one and one-half to two
hours. .
Tests were administered by experienced Educational
Examiners who had received special training in the admin-
istration of the instruments used in the project.
SAUL1112113711LL
Metropolitan Readiness Test
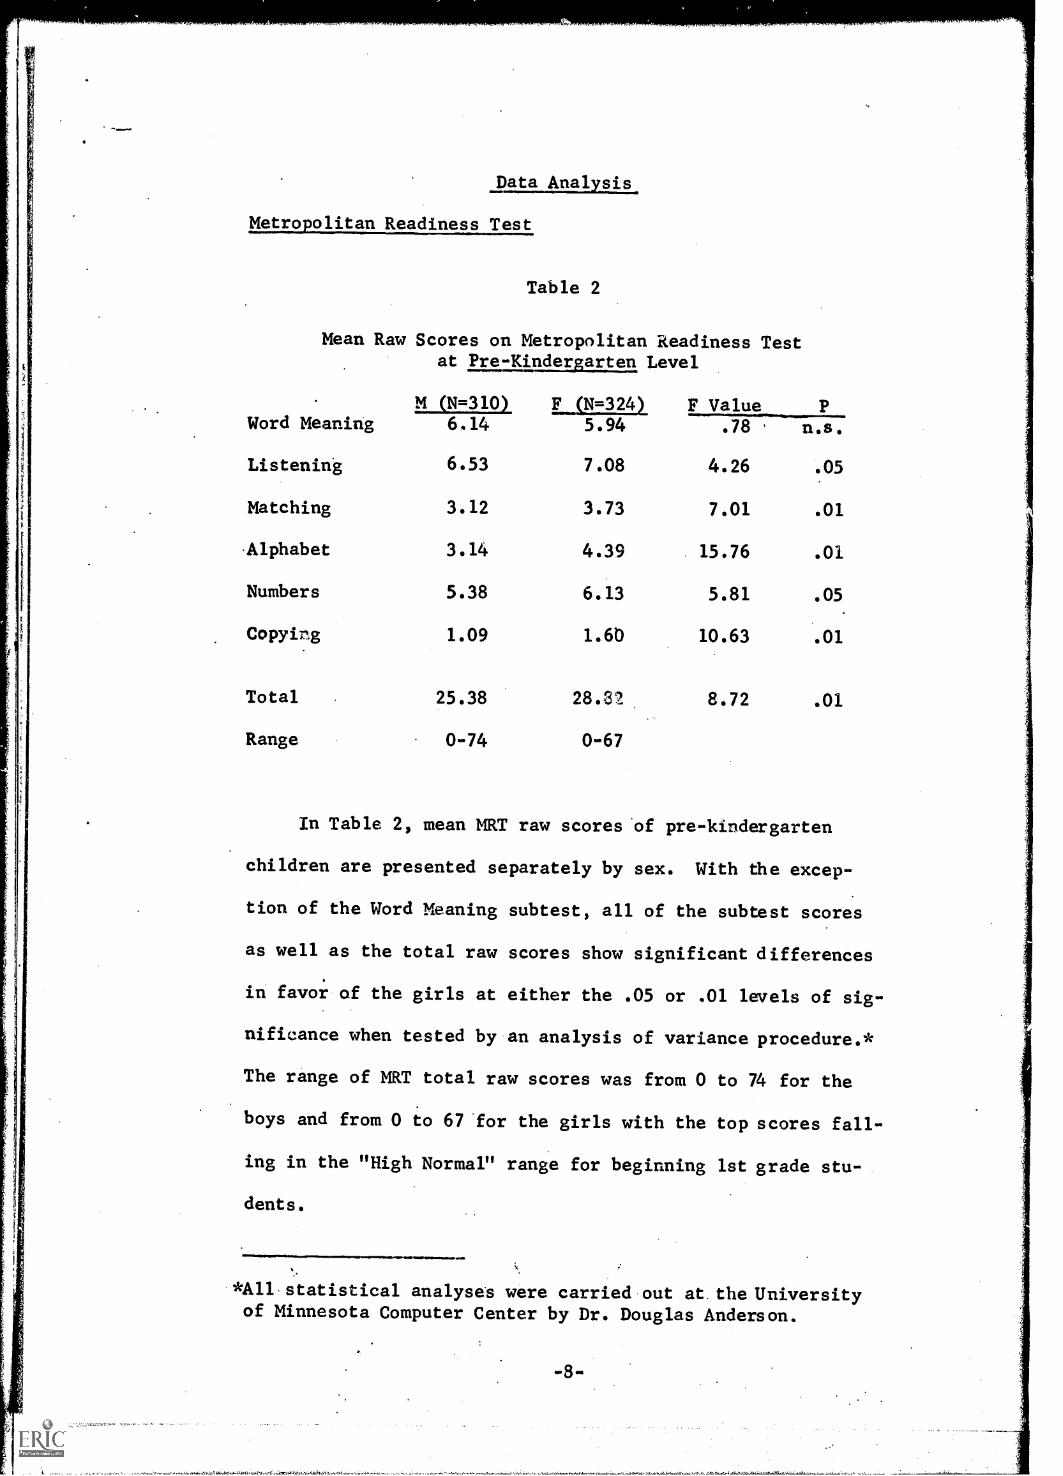
Table 2
Mean Raw Scores on Metropolitan Readiness Testat pre:Eindergarten Level
M (N=310) E_SN=3241Word Meaning 6,14 5.94
Listening 6.53 7.08
Matching 3.12 3.73
Alphabet 3.14 4.39
Numbers 5.38 6.13
Copying 1.09 1.60
Total 25.38 28.32
Range 0-74 0-67
F Value P.78 n.s.
4.26 .05
7.01 .01
15.76 .01
5.81 .05
10.63 .01
8.72 .01
In Table 2, mean MRT raw scores of pre-kindergarten
children are presented separately by sex. With ehe excep-
tion of the Word Meaning subtest, all of the subtest scores
as well as the total raw scores show significant differences
in favor of the girls at either the .05 or .01 levels of sig-
nificance when tested by an analysis of variance procedure.*
The range of MRT total raw scores was from 0 to 74 for the
boys and from 0 to 67 for the girls with the top scores fall-
ing in the "High Normal" range for beginning 1st grade stu-
dents.
11111
*All statistical analyses were carried out at the Universityof Minnesota Computer Center by Dr. Douglas Anderson.
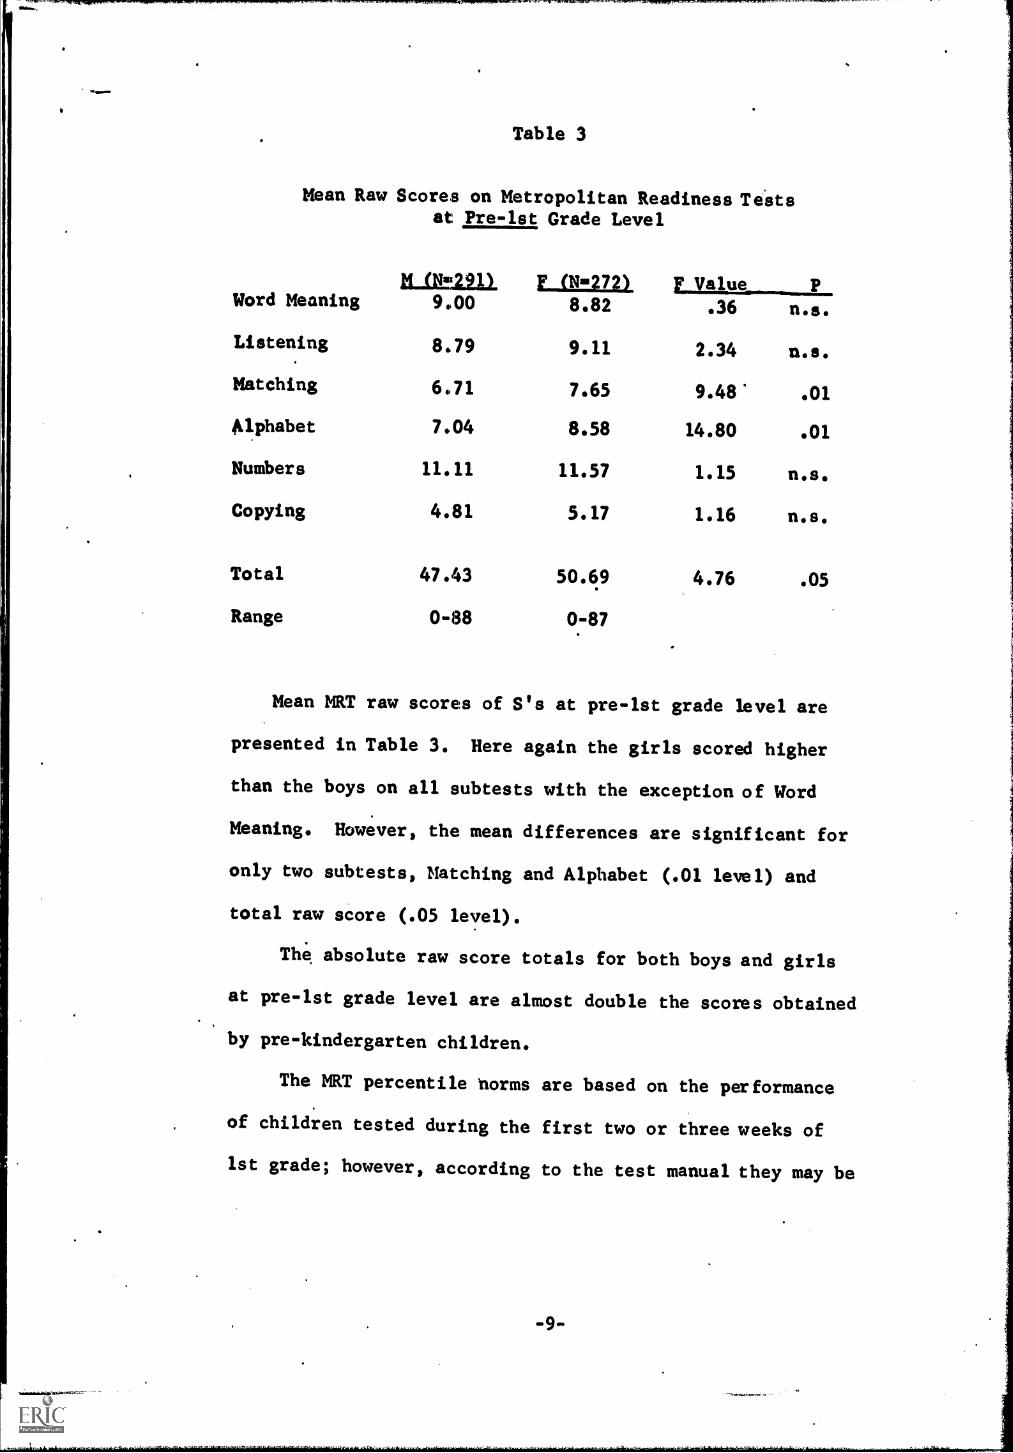
Table 3
Mean Raw Scores on Metropolitan Readiness TeStsat Pre-lst Grade Level
jajwan. y (14=272) Ejake. P
n.s.
n.s.
.01
.01
n.s.
n.s.
Word Meaning 9.00 8.82 .36
Listening 8.79 9.11 2.34
Matching 6.71 7.65 9.48*
Alphabet 7.04 8.58 14.80
Numbers 11.11 11.57 1.15
Copying 4.81 5.17 1.16
Total 47.43 50.69 4.76
Range 0-88 0787
.05
Mean MRT raw scores of S's at pre-lst grade level are
presented in Table 3. Here again the girls scored higher
than the boys on all subtests with the exception of Word
Meaning. However, the mean differences are significant for
only two subtests, Matching and Alphabet (.01 level) and
total raw score (.05 level).
The absolute raw score totals for both boys and girls
at pre-lst grade level are almost double the scores obtained
by pre-kindergarten children.
The MRT percentile horms are based on the performance
of children tested during the first two or three weeks of
1st grade; however, according to the test manual they may be
-9-

used for "interpreting the results of tests administered ...
during the interval between kindergarten and 1st grade." (MRT
Manual of Directions, 1965) The mean raw score tptal for pre-
1st grade boys falls at the 35th percentile and the mean raw
score for pre-lst grade girls is at the 42nd percentile on
these first grade norms. "Research with earlier forms of the
MRT (MRT Manual, 1965) suggests that there may be'an average
difference of from 3 to 6 points in total score between late
kindergarten and beginning 1st grade administration." This
would result in an under-estimate of from 6 to 12 percentile
points in assessing the relative position of the present
study S's compared to the original norm group.
Total raw scores for both boys and girls at pre-lst
grade fall within the range which the MRT manual terms "C"
or "Average" for beginning 1st grade students with a prog-
nosis of "likely to succeed in first grade work." By con-
trast, the pre-kindergarten means fall in the "D" or 4Low
Normal" range of scores.
Illinois Test of Psycholinguistic Abilities
ITPA raw scores were converted to language scores for
analysis. Table 4 presents comparisons of mean language age
scores of boys and of girls at the pre-kindergarten level.
While there was no significant sex difference in total lan-
guage age score, the boys performed significantly better
than did the girls on Visual Decoding (.05 level) and Motor
-10-
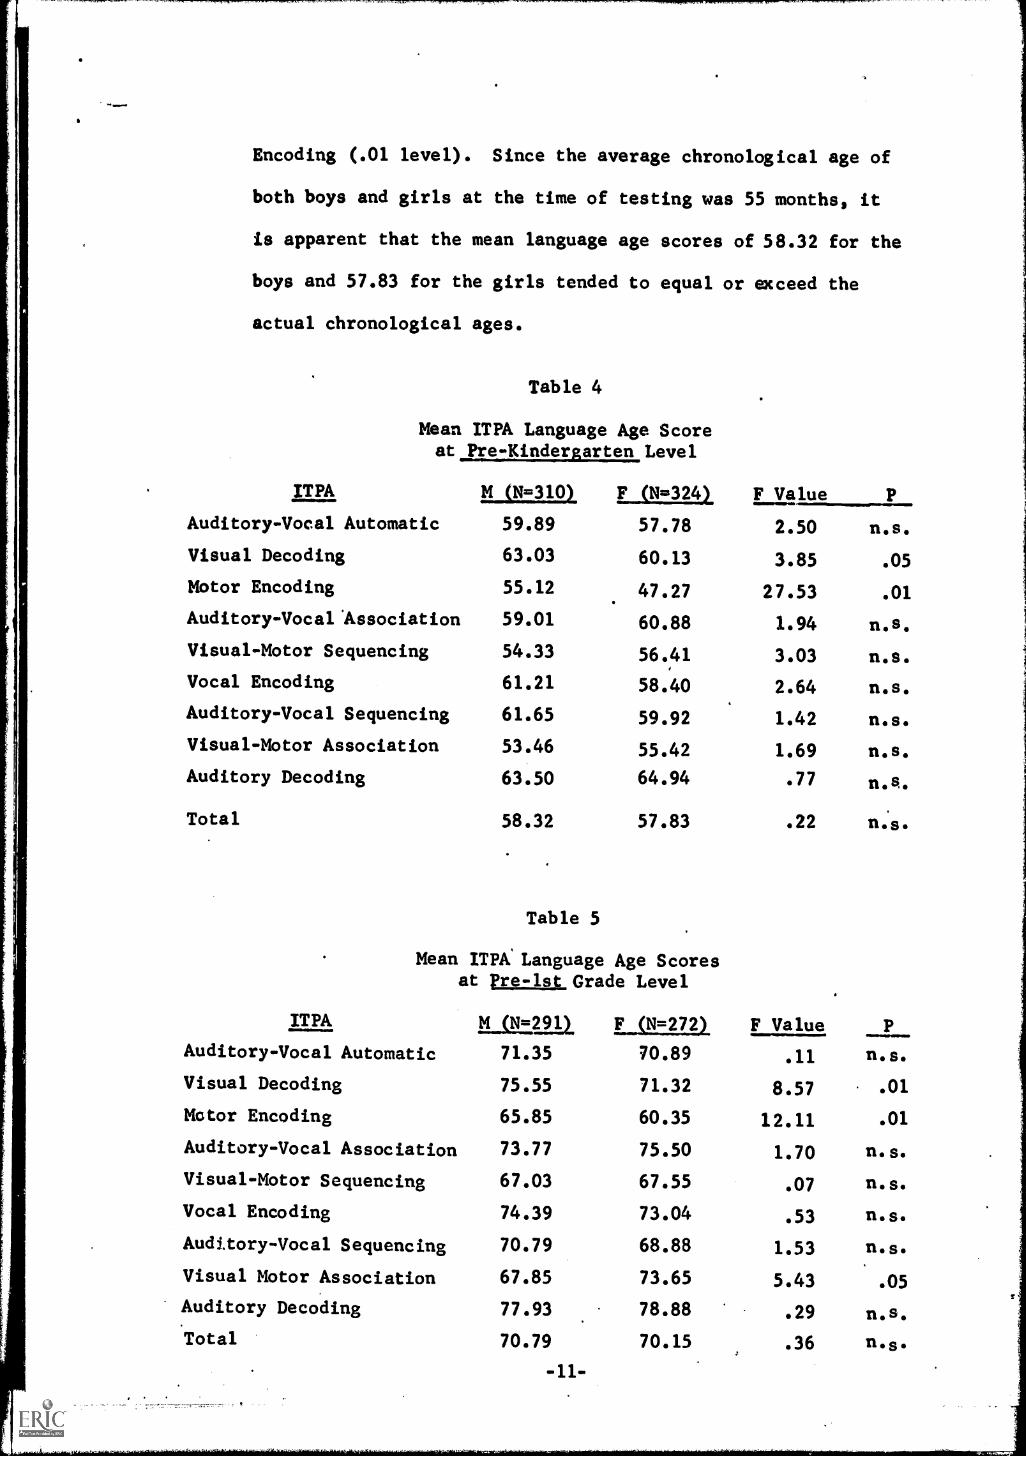
Encoding (.01 level). Since the average chronological age of
both boys and girls at the time of testing was 55 months, it
is apparent that the mean language age scores of 58.32 for the
boys and 57.83 for the girls tended to equal or eKceed the
actual chronological ages.
Meanat
ITPA
Table 4
pIrTeP-AK iLnadnegrusaagret eAng eSvceolr e
m 0=310
Auditory-Vocal Automatic 59.89
Visual Decoding 63.03
Motor Encoding 55.12
Auditory-VocalAssociation 59.01
Visual-Motor Sequencing 54.33
Vocal Encoding 61.21
Auditory-Vocal Sequencing 61.65
Visual-Motor Association 53.46
Auditory Decoding 63.50
Total 58.32
ITPA
Table 5
F (N=3241 F Value
57.78 2.50 n.s.
60.13 3.85 .05
47.27 27.53 .01
60.88 1.94 n.s.
56.41 3.03 n.s.
58.40 2.64 n.s.
59.92 1.42 n.s.
55.42 1.69 n.s.
64.94 .77 n.A.
57.83 .22 n.s.
Mean ITPA' Language Age Scoresat pre-lst Grade Level
Ltiatnil Ealit1721 F Value
Auditory-Vocal Automatic 71.35 70.89 .11
Visual Decoding 75.55 71.32 8.57 .01
Motor Encoding 65.85 60.35 12.11 .01
Auditory-Vocal Association 73.77 75.50 1.70 n.s.
Visual-Motor Sequencing 67.03 67.55 .07 n.s.
Vocal Enoading 74.39 73.04 .53 n.s.
Auditory-Vocal Sequencing 70.79 68.88 1.53 n.s.
Visual Motor Association 67.85 73.65 5.43 .05
Auditory Decoding 77.93 78.88 .29 n.s.
Total 70.79 70.15 .36 n.s.
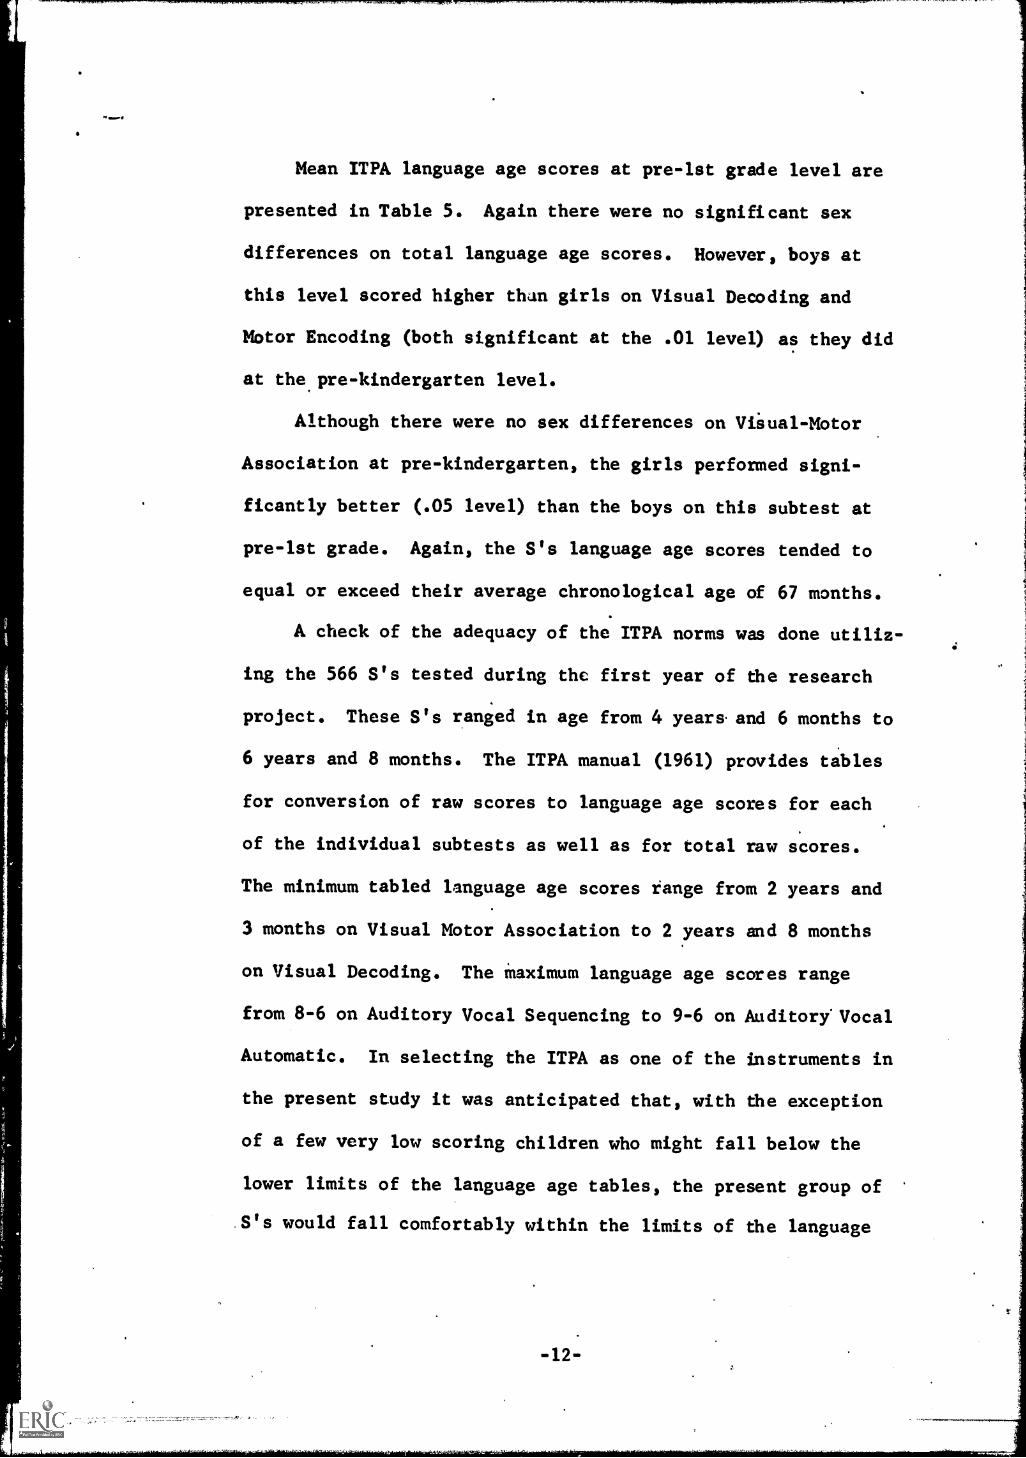
Mean ITPA language age scores at pre-lst grade level are
presented in Table 5. Again there were no significant sex
differences on total language age scores. However, boys at
this level scored higher than girls on Visual Decoding and
Motor Encoding (both significant at the .01 level) as they did
at the.pre-kindergarten level.
Although there were no sex differences on Viival-Motor
Association at pre-kindergarten, the girls performed signi-
ficantly better (.05 level) than the boys on this subtest at
pre-lst grade. Again, the S's language age scores tended to
equal or exceed their average chronological age of 67 months.
A check of the adequacy of the ITPA norms was done utiliz-
ing the 566 S's tested during the first year of dhe research
project. These S's ranged in age from 4 year& and 6 months to
6 years and 8 months. The ITPA manual (1961) provides tables
for conversion of raw scores to language age scores for each
of the individual subtests as well as for total raw scores.
The minimum tabled language age scores range from 2 years and
3 months on Visual Motor Association to 2 years and 8 months
on Visual Decoding. The Maximum language age scores range
from 8 6 on Auditory Vocal Sequencing to 9-6 on Auditory Vocal
Automatic. In selecting the ITPA as one of the hnstruments in
the present study it was anticipated that, with dhe exception
of a few very low scoring children who might fall below the
lower limits of the language age tables, the present group of
.S's would fall comfortably within the limits of the language

.age norm tables provided in the manual. This expectation
proved to be unwarranted.
Table 6
Number of Subjects WithScores Falling Beyond theITPA Language Age Norms
1966 Summer Testing
N = 566
AboveSubtest L.A. Norms L.A. Norms
Auditory-Vocal Automatic 6 0
Visual Decoding 20 8
Motor Encoding 11 8
Auditory-Vocal Association 6 2
Visual-Motor Sequencing 20. 4
Vocal Encoding 6 42
Auditory-Vocal Sequencing 2 33
Visual-Motor Association 19 0
Auditory Decoding 7 73
Total ITPA 1
98 170
The number of raw scores falling either above or below
the ITPA language age scales is shown in Table 6. The sub-
tests involving the visual modality evidently provided the
greatest difficulty for the current study population with
20, 20, and 19 S's respectively scoring below the tabled
norms provided for Visual Decoding, Visual-Motor Sequencing,
and Visual-Motor Association. By contrast, Auditory Decod-
ing, Vocal Encoding, and Auditory-Vocal Sequencing appeared
relatively less difficult for the same population with 73,
42, and 33 S's respectively scoring above the tabled language
age norms. A total of 175 separate individuals scored either
above or below the manual'ss norms on at least one of the ITPA
-13-

subtests, so that the limits of the language age tables proved
insufficient in approximately 1/3 of all cases tested.
Behavior Rating Scale
Table 7
Mean Rating of Test Behaviorat Pre-Kindergarten Level
RATINGS OF TEST BEHAVIOR ION:=310), F(N=324) F Value P
Test Conditions
Attention Span
Cooperation
Perseverance
Social Poise
Interest in Test Activities
2.47 2.52 .77 n.s.
2.19 2.35 7.40 .01
.2.45 2.51 1.14 n.s.
2.12 2.29 7.57 .01
2.29 2.33 .54 n.s.
2.26 2.37 3.86 .05
Mean ratings of test behavior and test conditions for pre-
kindergarten S's are shown in Table 7. Original ratings rangedI.
from Poor to Very Good. Each rating was assigned a numerical
value from one to three, with a rating of Poor equal to one and
a rating of Very Good equal to three. Girls rated higher than
boys in all areas with statistically significant differences
occuring on Interest in Test Activities (..05 level), Attention
Span, and Perseverance (both at the .01 level).
On the mean ratings of test behavior for pre-lst grade S's,
presented in Table 8, it should be noted that there were no sig-
nificant differences between boys and girls and that the non-
significant differences which did exist favor the males as often
as they favor.the females. These findings suggest the possibility
-14-
RW:a7.4A0.

that the kindergarten experience may tend to erase or at least
blur initial sex differences in the areas of behavior under
investigation.
Table 8
Mean Ratings of Test Behaviorat Pre-lst Grade Level
RATINGS OF TEST BEHAVIOR M(N=291) witual F Value
Test Conditions 2.53
Attention Span 2.59
Cooperation 2.76
Perseverance 2.58
Social Poise 2.53
Interest in Test Activities 2.52 .
Results
School readiness as measured b
2.55 .10 nips.
2.61 .13 n.s.
2.70 1.53 n.s.
2.56 .15 n.s.
2.46 1.65 n.s.
2.54 .11 n.s.
the MRT
1. At pre-kindergarten girls scored higher than boys on all
subtests with the exception of Wbrd Meaning. The differ-
. ences were significant at the .05 level for Listening and
Numbers and at the .01 level for Matching, Alphabet, and
Copying as well as for Total Raw Score.
.7. At pre-lst grade girls scored significantly higher than
boys on only two subtests, Matching and Alphdbet, both at
the .01 level, and on Total Raw Score where ehe difference
was significant at the .05 level.

3. . Using the MRT norms which are based on.a standardization
population tested in early weeks of 1st grade, the aver-
age total score for boys fell at the 35th percentile and
the average total score for girls fell at the 42nd per-
centile, when tested at pre-1st grade.
4. When tested at pre-lst grade, total MRT raw scores for
both boys and girls fell within the "C" or "Akierage"
range for beginning 1st grade students.
5. Total raw scores of both male and female pre-lst graders
were almost double the total raw scores of pre-kinder-
garten children.
Language Development as measured by the ITPA
1.. There were no significant sex differences on the ITPA
Total Scores at either pre-kindérgarten or pre-lst
grade levels.
2. At both pre-kindergarten and pre-lst grade boys scored
significantly higher than girls on Motor Encoding (.01
level) and Visual Decoding (.05 level at pre-kindergarten
and .01 level at pre-lst).
3. There were no significant sex differences favoring the
girls at pre-kindergarten and at pre-lst grade girls
scored significantly higher than boys on only one sub-
test, Visual-Motor Association (.05 level).
4. At both pre-kindergarten and pre-lst grade the average
language age scores of both boys and girls tended to
-16-

equal or exceed their average chronological age.
5. Thirty-one per cent of a sample of 566 children aged
four and one-half to six years, with total language age
scores closely approximating their chronological age,
obtained raw scores beyond the limits of the ITPA lan-
guage age conversion table on one or more subtests.
Batings_of Test Behavior
1. Pre-kindergarten girls rated significantly higher than
boys on Attention Span and Perseverance (both at the .01
level) and Interest in Test Activities (.05 level). There
were no significant sex differences in Cooperation, Social
Poise or Test Conditions.
2. At pre-lst grade there were no significant sex differences
in any area of test behavior.
Conclusions
1. These results indicate that the kindergarten experience
tends to greatly modify sex differences initially favor-
ing the girls, both on school readiness test scores and
on t6st behavior ratings, leading to greater between sex
uniformity of test performance and behavior on the part
of boys and girls. Contrary to many opinions, these
data do not support the idea that kindergarten exacerbates
differences in school readiness skills by favoring girls
over boys.
-17-

2. While there were few initial sex differences in language
skills measured by the ITPA, those which did exist tended
to favor the boys and were persistent but relatively un-
influenced by the kindergarten experience.
The Iinding that the ITPA norm tables which nDminally
extend from language age of 2 years and 3 months to
9 years and 6 months in actuality fail to provide suf-
ficient range for a'sample of 4 to 6 year old children
with essentially average total language age scores raises
questions regarding the applicability of the test and the
interpretation of scores for the age range it purports to
measure.