Embed Size (px)
Citation preview

October 11, 2019 TO: Mary Ann Dewan, Ph.D., County Superintendent of Schools FROM: Dan Mason, Manager, Assessment & Accountability SUBJECT: 2019 Santa Clara County Smarter Balanced Summative Assessment Results
The 2018-19 school year marked the fifth year of California’s revamped statewide student assessment system - California Assessment of Student Performance and Progress (CAASPP) – which replaced the previous Standardized Testing and Reporting (STAR) system. The CAASPP system consists of:
Smarter Balanced assessments, which incorporate: o Summative Assessments in grades 3 through 8 and 11 for English language arts/literacy
(ELA) and mathematics (math), o Interim Assessments available for all grades in ELA and math, and o the Digital Library, which is a repository of tools and practices designed to help teachers
utilize formative assessment processes for improved teaching and learning in all grades.
California Alternative Assessments (CAA) in ELA and math for students with significant cognitive abilities in grades 3 through 8 and 11.
California Science Test (CAST) assessments and the California Alternate Assessment for Science Field Test, both of which are taken in grades 5, 8, and high school (grade 10, 11 or 12)
California Spanish Assessment (CSA) (optional) for reading/language arts in grades 2 through 11. The Smarter Balanced Summative Assessments (SBSAs) are the focal point of this analysis. Characteristics of the SBSAs include:
They are aligned with California’s updated content standards for ELA and mathematics.
They reflect the critical thinking and problem solving skills that students will need to be ready for college and the 21st century job market.
They are taken on a computer and are adaptive, which means that during the test, the questions become more or less difficult on the basis of how the student performs.
They provide many more supports for students who need them, including students for whom English is a second language and students with disabilities.
The Smarter Balanced assessment system includes a variety of item types, including: o Selected-response items, which prompt students to choose one or more answers. o Technology-enhanced items, which might prompt students to edit text or draw an object. o Constructed-response items, which prompt students to write a short written or numerical
response. o Performance tasks, in which students engage in a complex set of tasks to demonstrate
their understanding. Students may be asked to conduct research and then write an argumentative essay, using sources as evidence. Or they may be asked to solve a complex

Mary Ann Dewan, Ph.D., County Superintendent of Schools
October 11, 2019 Page 2
problem in mathematics. Performance tasks integrate knowledge and skills across many areas and standards.
For each grade level and subject area, students receive a scale score from approximately 2000 to 3000. The overall score falls into one of four achievement levels:
Standard Exceeded: The student has exceeded the achievement standard and demonstrates advanced progress toward mastery of the knowledge and skills needed for likely success in future coursework.
Standard Met: The student has met the achievement standard and demonstrates progress toward mastery of the knowledge and skills needed for likely success in future coursework.
Standard Nearly Met: The student has nearly met the achievement standard and may require further development to demonstrate the knowledge and skills needed for likely success in future coursework.
Standard Not Met: The student has not met the achievement standard and needs substantial improvement to demonstrate the knowledge and skills needed for likely success in future coursework.
The test reports also show how students performed in key content claims, also called areas, in ELA and math.
ELA Claims: Reading, Writing, Listening, and Research/Inquiry
Math Claims: Problem Solving & Modeling/Data Analysis, Concepts & Procedures, and Communicating Reasoning
For each claim, a student’s performance is represented as “Above Standard,” “Near Standard,” or “Below Standard.” There are only three content claim levels reported, rather than four, because they are based on fewer test items and therefore less precise than the overall achievement levels. The SBSAs are based on a vertically calibrated growth model that allows the California Department of Education (CDE) to produce growth comparisons that can track students’ progress through the grade levels. This being the fifth operational year of the tests means that it is the fourth year that growth comparisons are available. The following is a summary of the CAASPP SBSA results for Santa Clara County and California.

Mary Ann Dewan, Ph.D., County Superintendent of Schools
October 11, 2019 Page 3
Key Findings For the ELA assessments:
Sixty three percent of Santa Clara County students reached the Standard Met or Standard Exceeded achievement levels (28% reached Standard Met and 35% reached Standard Exceeded) compared to fifty one percent of students statewide (29% reached Standard Met and 22% reached Standard Exceeded). See Figure 1
For the math assessments:
Fifty seven percent of Santa Clara County students reached the Standard Met or Standard Exceeded achievement levels (20% reached Standard Met and 37% reached Standard Exceeded) compared to forty percent of students statewide (20% reached Standard Met and 20% reached Standard Exceeded). See Figure 2.
With the exception of the Filipino, Hispanic/Latino and economically disadvantaged student groups, Santa Clara County’s racial/ethnic and program1 student groups met or exceeded standard at higher rates than their statewide counterparts on both the ELA and math assessments.
Santa Clara County Hispanic/Latino student performance was below statewide Hispanic/Latino student performance in ELA (38% vs. 41% met or exceeded standard) and equal in math (28% vs. 28% met or exceeded standard). See Figure 3 and Figure 5.
Santa Clara County Filipino student performance was below statewide Filipino student performance in both ELA (68% vs. 71% met or exceeded standard) and math (55% vs. 59% met or exceeded standard). See Figure 3 and Figure 5.
For the ELA assessments, Santa Clara County economically disadvantaged2 students were equal to California economically disadvantaged students (39% vs. 39%). See Figure 4.
Within Santa Clara County there is a substantial achievement gap between Hispanic/Latino students and Asian students:
For ELA, there is a 46 percentage point difference between the percent of Hispanic/Latino and Asian students that met or exceeded standard (38% vs. 84%, respectively). See Figure 3, Figure 7, Figure 11 and Figure 15.
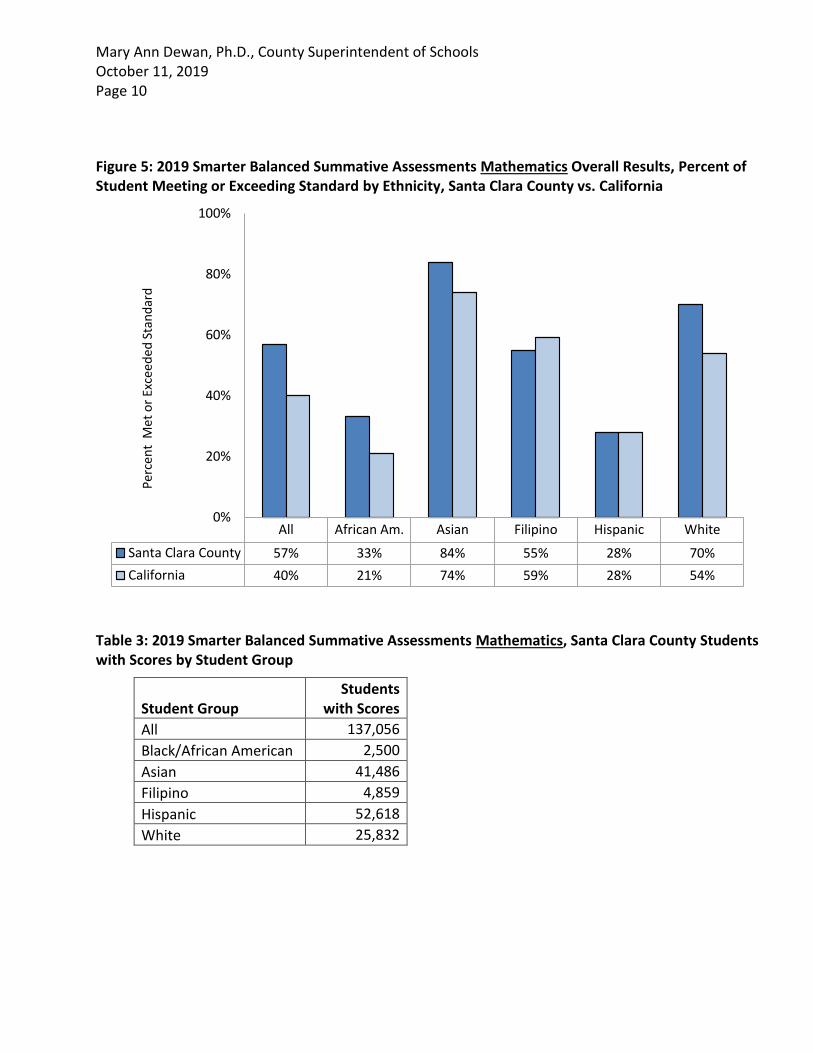
The gap is even larger in math, where there is a 56 percentage point difference (28% vs. 84%, respectively). See Figure 5, Figure 9, Figure 13, and Figure 16.
Within Santa Clara County there are substantial achievement gaps between the program student groups.
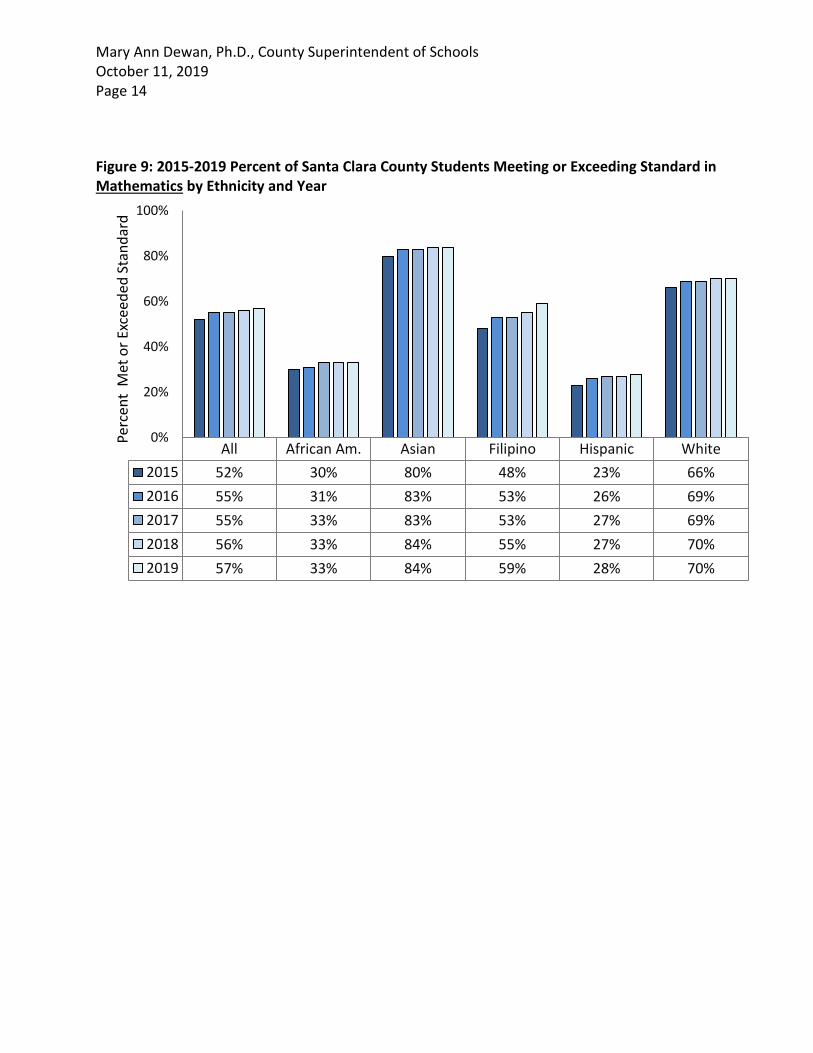
Economically disadvantaged and not-economically disadvantaged students: o For ELA, there is a 38 percentage point difference between the percent of economically
disadvantaged and not-economically disadvantaged students that met or exceeded standard (39% vs. 77%, respectively). See Figure 4, Figure 8 and Figure 12.
1 Program student groups refers to the following student populations: Economically disadvantaged, not-economically disadvantaged, English learner, not-English learner, students with disability, and not-students with disability. 2 Economically disadvantaged students include students eligible for the free and reduced priced meal program (FRPM), foster youth, homeless students, migrant students, and students for whom neither parent is a high school graduate.

Mary Ann Dewan, Ph.D., County Superintendent of Schools
October 11, 2019 Page 4
o The gap is larger in math, where there is a 42 percentage point difference (30% vs. 72%, respectively). See Figure 6, Figure 10, and Figure 14.
English learner and not-English learner3 students: o For ELA, there is a 56 percentage point difference between the percent of English learner
and not-English learner students that met or exceeded standard (17% vs. 73%, respectively). See Figure 4, Figure 8 and Figure 12.
o The gap is smaller in math, but there still is a 45 percentage point difference (20% vs. 65%, respectively). See Figure 6, Figure 10, and Figure 14.
Students with disabilities and not-students with disabilities4: o For ELA, there is a 46 percentage point difference between the percent of students with
disabilities and not-students with disabilities students that met or exceeded standard (22% vs. 68%, respectively). See Figure 4, Figure 8 and Figure 12.
o The gap is smaller in math, but there still is a 41 percentage point difference (20% vs. 61%, respectively). See Figure 6, Figure 10, and Figure 14.
Between 2015 and 2016, the overall percentages of Santa Clara County students meeting or exceeding standard climbed by four percentage points in both ELA and math and all student groups displayed in this memorandum increased by at least one percentage point. These gains may have been attributed to becoming familiar with a new assessment. However, with the exception of Filipino students in math (a 6 percentage point gain), overall and student group gains since 2016 have been modest with two percentage point gains being the largest between 2016 and 2019. See Figure 7, Figure 8, Figure 9 and Figure 10. The lack of significant gains since 2016 has also had the effect of achievement gaps being relatively unchanged. Within Santa Clara County, for the ELA and math assessments:
Asian students had the highest rates among racial/ethnic student groups of Standard Exceeded (56% on ELA and 66% on Math). See Figure 11 and Figure 13.
Hispanic/Latino students had the highest rates of Standard Not Met results among racial/ethnic student groups (35% on ELA and 45% on mathematics). See Figure 11 and Figure 13.
The economically disadvantaged, English learner and students with disabilities student groups all had significant rates of Standard Not Met performance on both assessments:
o Economically disadvantaged students at Standard Not Met: 36 percent for ELA and 43 percent for math;
o English learner students at Standard Not Met: 56 percent for both ELA and math; o Students with disabilities at Standard Not Met: 59 percent for ELA and 63 percent for
math. See Figure 12 and Figure 14.
The economic status of the racial/ethnic student groups is provided. Within Santa Clara County:
3 Not-English learner students are a combination of English only, reclassified fluent English proficient (RFEP) and initial fluent proficient (IFEP) students. 4 CDE displays these students as students with no reported disability.

Mary Ann Dewan, Ph.D., County Superintendent of Schools
October 11, 2019 Page 5
Not-economically disadvantaged Hispanic/Latino students meeting or exceeding standard were on par with economically disadvantaged white students (53% vs. 51% for ELA and 40% vs 41% for math, respectively). See Figure 17, Figure 18, Figure 19 and Figure 20.
Economically disadvantaged Asian students met or exceeded standard at higher rates than not -economically disadvantaged Hispanic/Latino students (68% vs. 53% for ELA and 64% vs 40% for math, respectively). See Figure 17, Figure 18, Figure 19 and Figure 20.
Economic status created the largest difference within student racial/ethnic student groups for white students: seventy nine percent of not-economically disadvantaged white students met or exceeded standard in ELA compared to fifty one percent of economically disadvantaged white students (a 28 percentage point difference); and seventy three percent of not-economically disadvantaged white students met or exceeded standard in math compared to forty one percent of economically disadvantaged white students (a 32 percentage point difference). See Figure 17, Figure 18, Figure 19 and Figure 20.
Santa Clara County students met or exceeded standard at higher rates than their statewide counterparts at all grade levels on the ELA and math assessments. Within Santa Clara County:
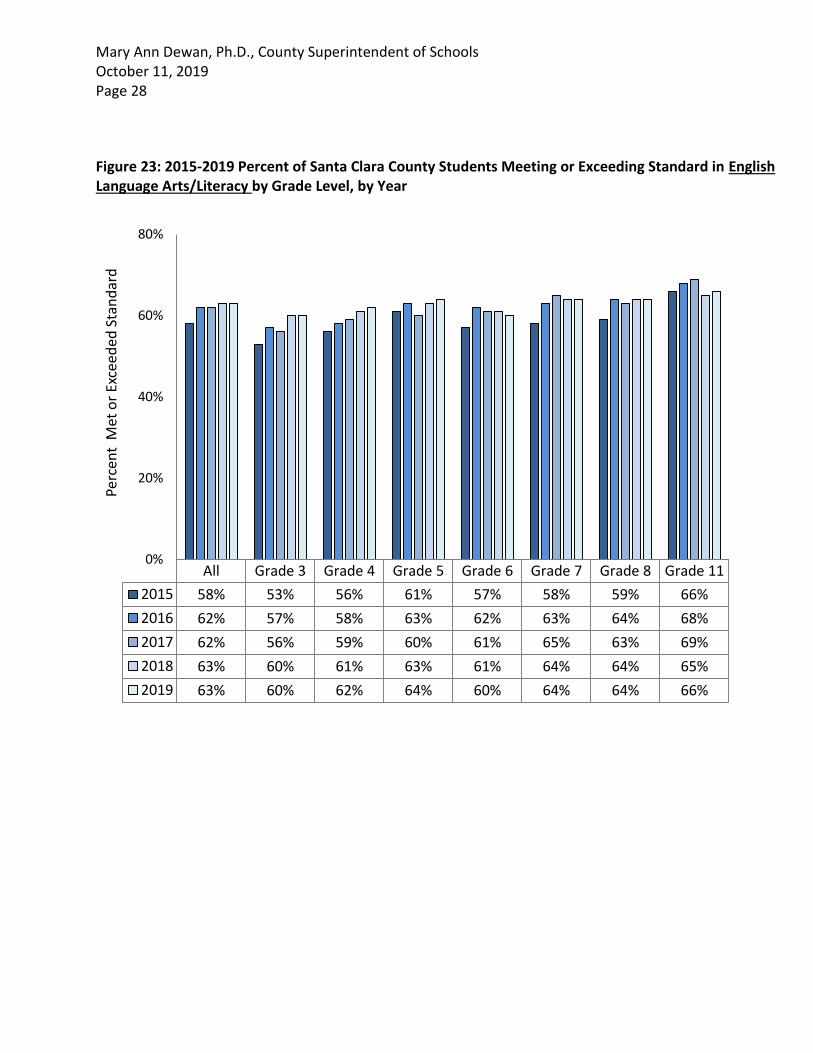
On the ELA assessments, the rates of Santa Clara County students meeting or exceeding standard ranged from sixty percent (grade 3) to sixty six percent (grade 11). See Figure 21 and Figure 23.
On the math assessments, the low and high performing grades were the reverse of the ELA assessments (50% of grade 11 and 64% of grade 3 met or exceeded standard). See Figure 22 and Figure 24.
Excluding 2015 and comparing the rates of students meeting or exceeding standard on the ELA and math assessments at like grade levels from 2016 to 2019, grade 4 has had the largest gains in ELA and math (4 percentage point gains for ELA and math). See Figure 23.
The SBSAs are based on a vertically calibrated growth model, so with the exceptions of grades 3 and 11, it is possible to compare cohort performance to previous grade levels. Within Santa Clara County:
On the ELA assessment, the largest grade level gains in terms of students meeting or exceeding standard over the two prior years’ grade levels occurred at grade 5 (64% for grade 5 in 2019 vs. 61% for grade 4 in 2018 and 56% for grade 3 in 2017). See Figure 25.
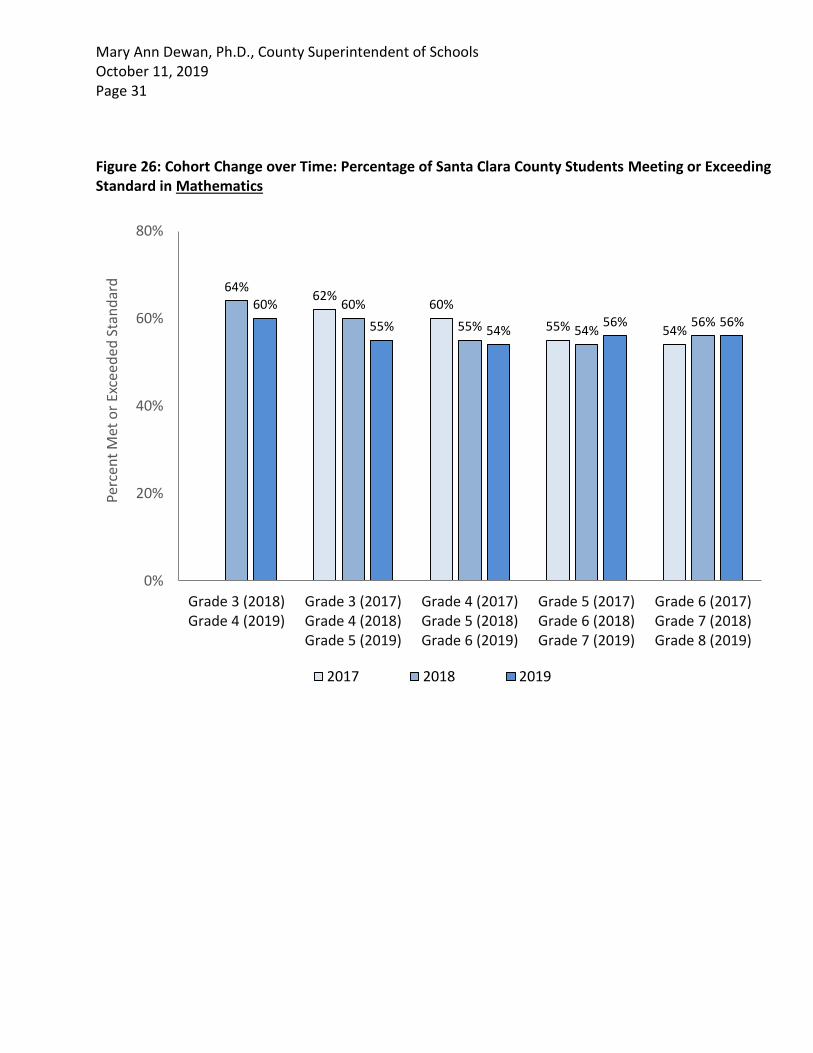
On the math assessment, the largest grade level losses in terms of students meeting or exceeding standard over the two prior years’ grade levels occurred at grade 5 (55% for grade 5 in 2019 vs. 60% for grade 4 in 2018 and 62% for grade 3 in 2017). See Figure 26.
Within Santa Clara County:
For the math assessments, almost a third (31%) of grade 11 students were at the Standard Not Met level. See Figure 28.

Mary Ann Dewan, Ph.D., County Superintendent of Schools
October 11, 2019 Page 6
With the exception of grade 11 math, the mean scale scores5 for both subjects are in the lower to mid-range of the scale scores for Standard Met. The grade 11 math mean scale score is in the very upper range of the scale scores for Standard Nearly Met. See Figure 29 and Figure 30.
For the ELA claims (areas):
Santa Clara County students performed best on the Listening claim (a low of 14% below standard), followed by Research/Inquiry (19% below standard), Writing (19% below standard) and Reading (22% below standard). See Table 13, Table 15, and Table 21.
The percentage of students scoring above standard on the Reading claim rose from 31% in 2015 to 38% in 2019. See Table 13, Table 14, Table 15, Table 16, Table 21, and Table 22
For the math claims (areas):
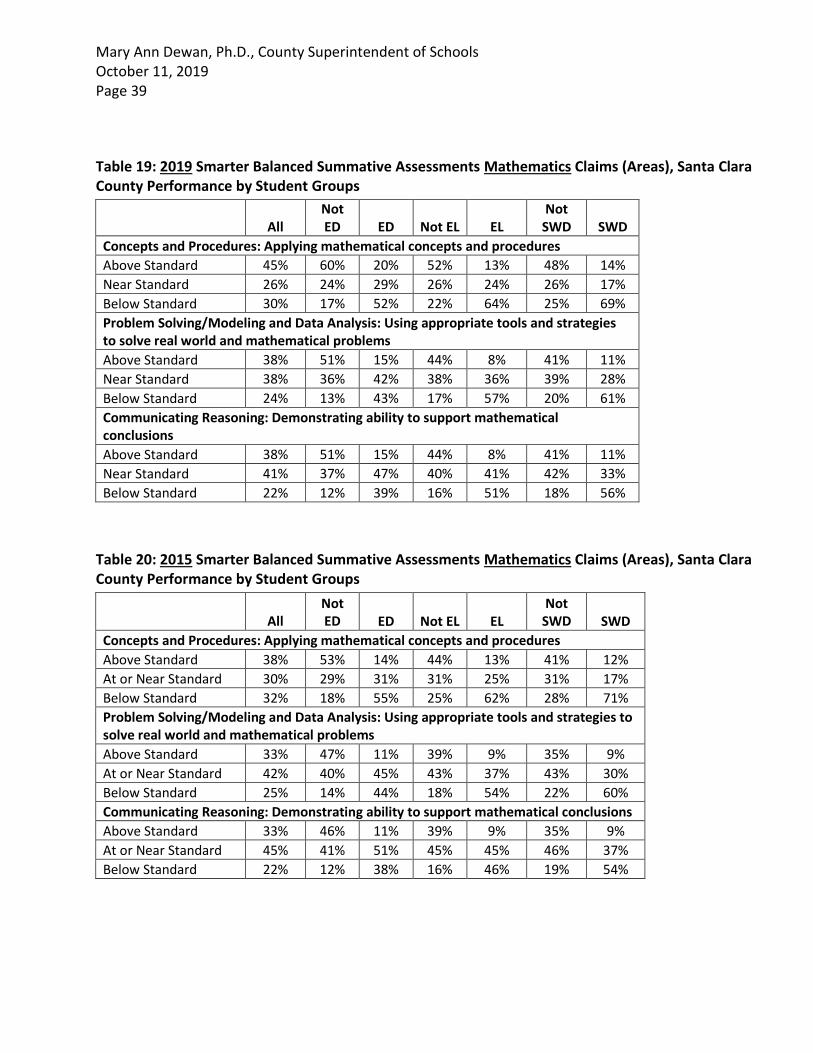
Santa Clara County students performed best on the Communicating Reasoning claim (a low of 22% below standard), followed by Problem Solving/Modeling and Data Analysis (24% below standard) and Concepts and Procedures (30% below standard). See Table 17, Table 18, and Table 23.
The percentage of students scoring above standard on the Concepts and Procedures claim rose from 38% in 2015 to 45% in 2019. See Table 17, Table 18, Table 19, Table 20, Table 23 and Table 24.
Of Santa Clara County students, Hispanic/Latino students made up the largest racial/ethnic student group portion of the students tested (38%), followed by Asian students (30%) and white students (19%). See Table 25. Please note: Because of space constraints, the following abbreviations were sometimes necessary in the graphs and tables:
Black or African American: Black/African American, African American, African Am., Afri. Am.
Hispanic or Latino: Hispanic/Latino, Hispanic
Economically disadvantaged: Economically Disadvan., ED
Not-economically disadvantaged: Not ED
English learner: EL
Not-English learner: Not EL
Students with disability: Students w/ Disability, SWD
Not-Students with disabilities: Not Students w/ Disability, Not SWD Also note that in some cases due to rounding to the nearest whole number, adding the percentage of a given group of students at Standard Met and the percentage of the same group of students at Standard Exceeded may be one whole number different than the percentage of Met or Exceeded Standard that is given for that group of students.
5 The scale score ranges for ELA and math by content area, grade level, and achievement level are displayed in tables 26 and 27 on the final page.

Mary Ann Dewan, Ph.D., County Superintendent of Schools
October 11, 2019 Page 7
Figure 1: 2019 Smarter Balanced Summative Assessments English Language Arts/Literacy Overall Results, Achievement Level Distributions, Santa Clara County vs. California
Figure 2: 2019 Smarter Balanced Summative Assessments Mathematics Overall Results, Achievement Level Distributions, Santa Clara County vs. California
Standard NotMet
StandardNearly Met
Standard MetStandardExceeded
Santa Clara County 19% 18% 28% 35%
California 27% 22% 29% 22%
0%
10%
20%
30%
40%
50%
Per
cen
t o
f St
ud
ents
at
Ach
ieve
men
t Le
vels
Standard NotMet
StandardNearly Met
Standard MetStandardExceeded
Santa Clara County 24% 20% 20% 37%
California 35% 25% 20% 20%
0%
10%
20%
30%
40%
50%
Per
cen
t o
f St
ud
ents
at
Ach
ieve
men
t Le
vels

Mary Ann Dewan, Ph.D., County Superintendent of Schools
October 11, 2019 Page 8
Figure 3: 2019 Smarter Balanced Summative Assessments English Language Arts/Literacy Overall Results, Percent of Students Meeting or Exceeding Standard by Ethnicity, Santa Clara County vs. California
Table 1: 2019 Smarter Balanced Summative Assessments English Language Arts/Literacy, Santa Clara County Students with Scores by Ethnicity
Student Group
Students with Scores
All Students 136,434
Black/African American 2,502
Asian 41,162
Filipino 4,860
Hispanic or Latino 52,418
White 25,776
All African Am. Asian Filipino Hispanic White
Santa Clara County 63% 45% 84% 68% 38% 76%
California 51% 33% 77% 71% 41% 65%
0%
20%
40%
60%
80%
100%
Per
cen
t M
et o
r Ex
cee
ded
Sta
nd
ard

Mary Ann Dewan, Ph.D., County Superintendent of Schools
October 11, 2019 Page 9
Figure 4: 2019 Smarter Balanced Summative Assessments English Language Arts/Literacy Overall Results, Percent of Student Groups Meeting or Exceeding Standard, Santa Clara County vs. California
Table 2: 2019 Smarter Balanced Summative Assessments English Language Arts/Literacy, Santa Clara County Students with Scores by Student Group
Student Group
Students with Scores
All Students 136,434
Not Economically Disadvantaged (Not ED) 85,153
Economically Disadvantaged (ED) 51,281
Not English Learner (Not EL) 112,300
English Learner (EL) 23,913
Not Students with Disability (Not SWD) 122,254
Students with Disability (SWD) 14,180
All Not ED ED Not EL EL Not SWD SWD
Santa Clara County 63% 77% 39% 73% 17% 68% 22%
California 51% 69% 39% 58% 13% 55% 16%
0%
20%
40%
60%
80%
100%
Per
cen
t M
et o
r Ex
cee
ded
Sta
nd
ard
Mary Ann Dewan, Ph.D., County Superintendent of Schools
October 11, 2019 Page 10
Figure 5: 2019 Smarter Balanced Summative Assessments Mathematics Overall Results, Percent of Student Meeting or Exceeding Standard by Ethnicity, Santa Clara County vs. California
Table 3: 2019 Smarter Balanced Summative Assessments Mathematics, Santa Clara County Students with Scores by Student Group
Student Group
Students with Scores
All 137,056
Black/African American 2,500
Asian 41,486
Filipino 4,859
Hispanic 52,618
White 25,832
All African Am. Asian Filipino Hispanic White
Santa Clara County 57% 33% 84% 55% 28% 70%
California 40% 21% 74% 59% 28% 54%
0%
20%
40%
60%
80%
100%
Per
cen
t M
et o
r Ex
cee
ded
Sta
nd
ard

Mary Ann Dewan, Ph.D., County Superintendent of Schools
October 11, 2019 Page 11
Figure 6: 2019 Smarter Balanced Summative Assessments Mathematics Overall Results, Percent of Student Groups Meeting or Exceeding Standard, Santa Clara County vs. California
Table 4: 2019 Smarter Balanced Summative Assessments Mathematics, Santa Clara County Students with Scores by Student Group
Student Group
Students with Scores
All 137,056
Not Economically Disadvantaged (Not ED) 85,538
Economically Disadvantaged (ED) 51,518
Not English Learner (Not EL) 112,073
English Learner (EL) 24,700
Not Students with Disability (Not SWD) 122,939
Students with Disability (SWD) 14,117
All Not ED ED Not EL EL Not SWD SWD
Santa Clara County 57% 72% 30% 65% 20% 61% 20%
California 40% 59% 27% 45% 13% 43% 13%
0%
20%
40%
60%
80%
100%
Per
cen
t M
et o
r Ex
cee
ded
Sta
nd
ard

Mary Ann Dewan, Ph.D., County Superintendent of Schools
October 11, 2019 Page 12
Figure 7: 2015-2019 Percent of Santa Clara County Students Meeting or Exceeding Standard in English Language Arts/Literacy by Ethnicity and Year
All African Am. Asian Filipino Hispanic White
2015 58% 42% 82% 60% 33% 74%
2016 62% 45% 84% 67% 37% 76%
2017 62% 46% 83% 66% 37% 76%
2018 63% 46% 84% 66% 38% 77%
2019 63% 45% 84% 68% 38% 76%
0%
20%
40%
60%
80%
100%
Perc
ent
Met
or
Exce
ed
ed S
tan
dar
d

Mary Ann Dewan, Ph.D., County Superintendent of Schools
October 11, 2019 Page 13
Figure 8: 2015-2019 Percent of Santa Clara County Students Meeting or Exceeding Standard in English Language Arts/Literacy by Student Group and Year
Not ED: Not Economically Disadvantaged ED: Economically Disadvantaged Not EL: Not English Learner EL: English Learner Not SWD: Not Students with Disability SWD: Students with Disability
All Not ED ED Not EL EL Not SWD SWD
2015 58% 75% 33% 68% 18% 62% 19%
2016 62% 78% 38% 72% 19% 67% 20%
2017 62% 77% 38% 72% 18% 66% 20%
2018 63% 78% 39% 73% 18% 67% 21%
2019 63% 77% 39% 73% 17% 68% 22%
0%
20%
40%
60%
80%
100%
Perc
ent
Met
or
Exce
ed
ed S
tan
dar
d
Mary Ann Dewan, Ph.D., County Superintendent of Schools
October 11, 2019 Page 14
Figure 9: 2015-2019 Percent of Santa Clara County Students Meeting or Exceeding Standard in Mathematics by Ethnicity and Year
All African Am. Asian Filipino Hispanic White
2015 52% 30% 80% 48% 23% 66%
2016 55% 31% 83% 53% 26% 69%
2017 55% 33% 83% 53% 27% 69%
2018 56% 33% 84% 55% 27% 70%
2019 57% 33% 84% 59% 28% 70%
0%
20%
40%
60%
80%
100%
Perc
ent
Met
or
Exce
ed
ed S
tan
dar
d

Mary Ann Dewan, Ph.D., County Superintendent of Schools
October 11, 2019 Page 15
Figure 10: 2015-2019 Percent of Santa Clara County Students Meeting or Exceeding Standard in Mathematics by Student Group and Year
Not ED: Not Economically Disadvantaged ED: Economically Disadvantaged Not EL: Not English Learner EL: English Learner Not SWD: Not Students with Disability SWD: Students with Disability
All Not ED ED Not EL EL Not SWD SWD
2015 52% 68% 25% 59% 20% 55% 17%
2016 55% 73% 29% 63% 22% 58% 19%
2017 55% 72% 29% 64% 21% 59% 18%
2018 56% 73% 30% 64% 21% 60% 19%
2019 57% 72% 30% 65% 20% 61% 20%
0%
20%
40%
60%
80%
100%
Perc
ent
Met
or
Exce
ed
ed S
tan
dar
d

Mary Ann Dewan, Ph.D., County Superintendent of Schools
October 11, 2019 Page 16
Figure 11: 2019 Smarter Balanced Summative Assessments English Language Arts/Literacy Overall Results, Percent of Santa Clara County Students by Ethnicity at each Achievement Level
19%
32%
6%
13%
35%
9%
18%24%
9%19%
26%14%
28% 26% 28%38%
26%32%
35%
18%
56%30%
13%
44%
All African American Asian Filipino Hispanic or Latino White
Standard Not Met Standard Nearly Met Standard Met Standard Exceeded
Mary Ann Dewan, Ph.D., County Superintendent of Schools
October 11, 2019 Page 17
Figure 12: 2019 Smarter Balanced Summative Assessments English Language Arts/Literacy Overall Results, Percent of Santa Clara County Student Groups at each Achievement Level
19%
9%
36%
11%
56%
15%
59%
18% 13%25%
16%27%
17% 19%
28% 30% 25%32%
13%
30%
14%
35%
47%
14%
41%
4%
38%
8%
All NotEconomically
Disadvan.
EconomicallyDisadvan.
Not EnglishLearner
EnglishLearner
Not Studentsw/ Disability
Students w/Disability
Standard Not Met Standard Nearly Met Standard Met Standard Exceeded

Mary Ann Dewan, Ph.D., County Superintendent of Schools
October 11, 2019 Page 18
Figure 13: 2019 Smarter Balanced Summative Assessments Mathematics Overall Results, Percent of Santa Clara County Students by Ethnicity at each Achievement Level
24%
41%
6%
19%
45%
12%
20%27%
10%
26% 27%18%
20% 20% 19%27%
17%25%
37%
13%
66%
28%
11%
45%
All African American Asian Filipino Hispanic or Latino White
Standard Not Met Standard Nearly Met Standard Met Standard Exceeded

Mary Ann Dewan, Ph.D., County Superintendent of Schools
October 11, 2019 Page 19
Figure 14: 2019 Smarter Balanced Summative Assessments Mathematics Overall Results, Percent of Santa Clara County Student Groups at each Achievement Level
24%
12%
43%
17%
56%
19%
63%
20% 16%27%
19% 24% 20% 17%
20% 21% 17% 21%13%
21%10%
37%
51%
13%
43%
7%
40%
10%
All NotEconomically
Disadvan.
EconomicallyDisadvan.
Not EnglishLearner
EnglishLearner
Not Studentsw/ Disability
Students w/Disability
Standard Not Met Standard Nearly Met Standard Met Standard Exceeded

Mary Ann Dewan, Ph.D., County Superintendent of Schools
October 11, 2019 Page 20
Figure 15: 2019 Smarter Balanced Summative Assessments English Language Arts/Literacy Results, Percent of Santa Clara County Students Meeting or Exceeding Standard; Displaying the Achievement Gap between Asian Students and Other Student Groups
76%
38%
68%
45%
84%
63%
White
Hispanic or Latino
Filipino
Black/African American
Asian
All Students
ELA/Literacy Gap (between Asian and Other Student Groups)
39 percentage points
46 percentage points
16 percentage points
8 percentage points

Mary Ann Dewan, Ph.D., County Superintendent of Schools
October 11, 2019 Page 21
Figure 16: 2019 Smarter Balanced Summative Assessments Mathematics Results, Percent of Santa Clara County Students Meeting or Exceeding Standard; Displaying the Achievement Gap between Asian Students and Other Student Groups
70%
28%
55%
33%
84%
57%
White
Hispanic or Latino
Filipino
Black/African American
Asian
All Students
Mathematics Gap (between Asian and Other Student Groups)
51 percentage points
56 percentage points
29 percentage points
14 percentage points

Mary Ann Dewan, Ph.D., County Superintendent of Schools
October 11, 2019 Page 22
Figure 17: 2019 Smarter Balanced Summative Assessments English Language Arts/Literacy Overall Results, Percent of Economically Disadvantaged (ED) Ethnic Student Groups Meeting or Exceeding Standard, Santa Clara County vs. California
Table 5: 2019 Smarter Balanced Summative Assessments English Language Arts/Literacy; Santa Clara County Economically Disadvantaged Students with Scores by Student Group
Economically Disadvantaged Student Groups
Students with Scores
All Students 53,281
Black/African American 1,357
Asian 7,283
Filipino 1,355
Hispanic or Latino 36,787
White 2,621
All ED Afri. Am. ED Asian ED Filipino ED Hispanic ED White ED
Santa Clara County 39% 35% 68% 57% 32% 51%
California 39% 27% 63% 62% 36% 47%
0%
20%
40%
60%
80%
100%
Per
cen
t M
et o
r Ex
cee
ded
Sta
nd
ard

Mary Ann Dewan, Ph.D., County Superintendent of Schools
October 11, 2019 Page 23
Figure 18: 2019 Smarter Balanced Summative Assessments Mathematics Overall Results, Percent of Economically Disadvantaged (ED) Ethnic Student Groups Meeting or Exceeding Standard, Santa Clara County vs. California
Table 6: 2019 Smarter Balanced Summative Assessments Mathematics; Santa Clara County Economically Disadvantaged Students with Scores by Student Group
Economically Disadvantaged Student Groups
Students with Scores
All Students 51,518
Black/African American 1,354
Asian 7,359
Filipino 1,362
Hispanic or Latino 36,946
White 2,615
All ED Afri. Am. ED Asian ED Filipino ED Hispanic ED White ED
Santa Clara County 30% 23% 64% 44% 22% 41%
California 27% 16% 57% 48% 25% 35%
0%
20%
40%
60%
80%
100%
Per
cen
t M
et o
r Ex
cee
ded
Sta
nd
ard

Mary Ann Dewan, Ph.D., County Superintendent of Schools
October 11, 2019 Page 24
Figure 19: 2019 Smarter Balanced Summative Assessments English Language Arts/Literacy Overall Results, Percent of Not Economically Disadvantaged (ED) Ethnic Student Groups Meeting or Exceeding Standard, Santa Clara County vs. California
Table 7: 2019 Smarter Balanced Summative Assessments English Language Arts/Literacy; Santa Clara County Not Economically Disadvantaged Students with Scores by Student Group
Economically Disadvantaged Student Groups
Students with Scores
All Students 85,153
Black/African American 1,145
Asian 33,879
Filipino 3,505
Hispanic or Latino 15,631
White 23,155
All Not EDAfrican Am.
Not EDAsian
Not EDFilipinoNot ED
HispanicNot ED
WhiteNot ED
Santa Clara County 77% 56% 88% 72% 53% 79%
California 69% 49% 85% 77% 57% 73%
0%
20%
40%
60%
80%
100%
Per
cen
t M
et o
r Ex
cee
ded
Sta
nd
ard

Mary Ann Dewan, Ph.D., County Superintendent of Schools
October 11, 2019 Page 25
Figure 20: 2019 Smarter Balanced Summative Assessments Mathematics Overall Results, Percent of Not Economically Disadvantaged (ED) Ethnic Student Groups Meeting or Exceeding Standard, Santa Clara County vs. California
Table 8: 2019 Smarter Balanced Summative Assessments Mathematics; Santa Clara County Not Economically Disadvantaged Students with Scores by Student Group
Economically Disadvantaged Student Groups
Students with Scores
All Students 85,538
Black/African American 1,146
Asian 34,127
Filipino 3,497
Hispanic or Latino 15,672
White 23,217
All Not EDAfrican Am.
Not EDAsian
Not EDFilipinoNot ED
HispanicNot ED
WhiteNot ED
Santa Clara County 72% 44% 89% 59% 40% 73%
California 59% 33% 84% 66% 42% 63%
0%
20%
40%
60%
80%
100%
Per
cen
t M
et o
r Ex
cee
ded
Sta
nd
ard

Mary Ann Dewan, Ph.D., County Superintendent of Schools
October 11, 2019 Page 26
Figure 21: 2019 Smarter Balanced Summative Assessments English Language Arts/Literacy Overall Results, Percent of Grade Level Meeting or Exceeding Standard, Santa Clara County vs. California
Table 9: 2019 Smarter Balanced Summative Assessments English Language Arts/Literacy, Santa Clara County Students Tested by Grade Level, with Mean Scale Scores
Student Group
# of Students Enrolled
# of Students
with Scores
% of Enrolled Students
with Scores Mean Scale
Score
All 140,776 136,434 96.9% N/A
Grade 3 19,478 18,954 97.3% 2451.9
Grade 4 19,202 18,774 97.8% 2495.6
Grade 5 20,398 19,986 98.0% 2535.7
Grade 6 20,053 19,695 98.2% 2548.9
Grade 7 20,652 20,185 97.7% 2580.6
Grade 8 20,711 20,266 97.9% 2598.4
Grade 11 20,282 18,574 91.6% 2628.3
All Grade 3 Grade 4 Grade 5 Grade 6 Grade 7 Grade 8 Grade 11
Santa Clara County 63% 60% 62% 64% 60% 64% 64% 66%
California 51% 49% 49% 52% 48% 51% 49% 57%
0%
20%
40%
60%
80%
Per
cen
t M
et o
r Ex
cee
ded
Sta
nd
ard

Mary Ann Dewan, Ph.D., County Superintendent of Schools
October 11, 2019 Page 27
Figure 22: 2019 Smarter Balanced Summative Assessments Mathematics Overall Results, Percent of Grade Level Meeting or Exceeding Standard, Santa Clara County vs. California
Table 10: 2019 Smarter Balanced Summative Assessments Mathematics, Santa Clara County Students Tested by Grade Level, with Mean Scale Scores Achievement
Student Group
# of Students Enrolled
# of Students
with Scores
% of Enrolled Students
with Scores Mean Scale
Score
All 140,774 137,056 97.4% N/A
Grade 3 19,476 19,139 98.3% 2466.2
Grade 4 19,201 18,931 98.6% 2506.3
Grade 5 20,399 20,136 98.7% 2535.5
Grade 6 20,054 19,809 98.8% 2557.0
Grade 7 20,649 20,302 98.3% 2578.5
Grade 8 20,713 20,358 98.3% 2599.2
Grade 11 20,282 18,381 90.6% 2624.6
All Grade 3 Grade 4 Grade 5 Grade 6 Grade 7 Grade 8 Grade 11
Santa Clara County 57% 64% 60% 55% 54% 56% 56% 50%
California 40% 50% 45% 38% 39% 38% 37% 32%
0%
20%
40%
60%
80%
Per
cen
t M
et o
r Ex
cee
ded
Sta
nd
ard
Mary Ann Dewan, Ph.D., County Superintendent of Schools
October 11, 2019 Page 28
Figure 23: 2015-2019 Percent of Santa Clara County Students Meeting or Exceeding Standard in English Language Arts/Literacy by Grade Level, by Year
All Grade 3 Grade 4 Grade 5 Grade 6 Grade 7 Grade 8 Grade 11
2015 58% 53% 56% 61% 57% 58% 59% 66%
2016 62% 57% 58% 63% 62% 63% 64% 68%
2017 62% 56% 59% 60% 61% 65% 63% 69%
2018 63% 60% 61% 63% 61% 64% 64% 65%
2019 63% 60% 62% 64% 60% 64% 64% 66%
0%
20%
40%
60%
80%
Perc
ent
Met
or
Exce
eded
Sta
nd
ard

Mary Ann Dewan, Ph.D., County Superintendent of Schools
October 11, 2019 Page 29
Figure 24: 2015-2019 Percent of Santa Clara County Students Meeting or Exceeding Standard in Mathematics by Grade Level, by Year
All Grade 3 Grade 4 Grade 5 Grade 6 Grade 7 Grade 8 Grade 11
2015 52% 57% 53% 50% 50% 53% 51% 48%
2016 55% 63% 56% 53% 54% 56% 55% 49%
2017 55% 62% 58% 51% 55% 58% 55% 48%
2018 56% 64% 60% 54% 54% 57% 57% 48%
2019 57% 64% 60% 55% 54% 56% 56% 50%
0%
20%
40%
60%
80%
Perc
ent
Met
or
Exce
ed
ed S
tan
dar
d

Mary Ann Dewan, Ph.D., County Superintendent of Schools
October 11, 2019 Page 30
Figure 25: Cohort Change over Time: Percentage of Santa Clara County Students Meeting or Exceeding Standard in English Language Arts/Literacy
56%
61%63%
61%60% 61%63%
61%64%
62%64%
60%
64% 64%
0%
20%
40%
60%
80%
Grade 3 (2018)Grade 4 (2019)
Grade 3 (2017)Grade 4 (2018)Grade 5 (2019)
Grade 4 (2017)Grade 5 (2018)Grade 6 (2019)
Grade 5 (2017)Grade 6 (2018)Grade 7 (2019)
Grade 6 (2017)Grade 7 (2018)Grade 8 (2019)
Perc
ent
Met
or
Exce
ed
ed S
tan
dar
d
2017 2018 2019
Mary Ann Dewan, Ph.D., County Superintendent of Schools
October 11, 2019 Page 31
Figure 26: Cohort Change over Time: Percentage of Santa Clara County Students Meeting or Exceeding Standard in Mathematics
62%60%
55% 54%
64%60%
55% 54%56%
60%
55% 54%56% 56%
0%
20%
40%
60%
80%
Grade 3 (2018)Grade 4 (2019)
Grade 3 (2017)Grade 4 (2018)Grade 5 (2019)
Grade 4 (2017)Grade 5 (2018)Grade 6 (2019)
Grade 5 (2017)Grade 6 (2018)Grade 7 (2019)
Grade 6 (2017)Grade 7 (2018)Grade 8 (2019)
Perc
ent
Met
or
Exce
ed
ed S
tan
dar
d
2017 2018 2019
Mary Ann Dewan, Ph.D., County Superintendent of Schools
October 11, 2019 Page 32
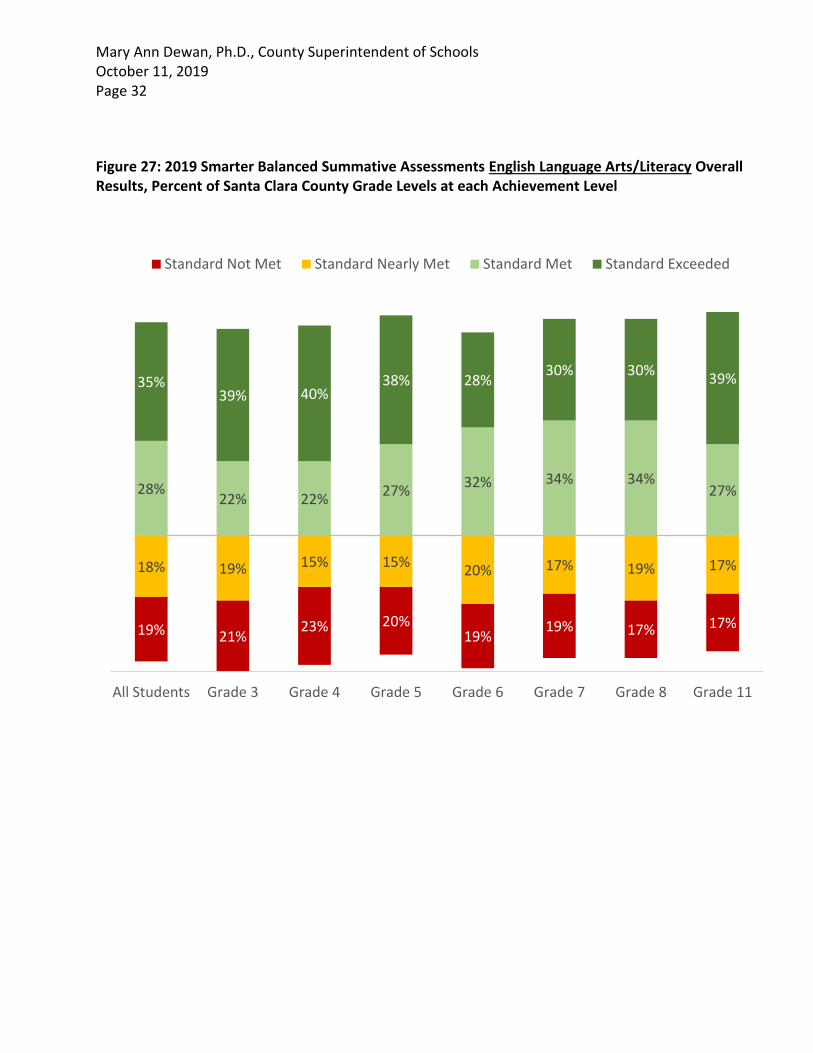
Figure 27: 2019 Smarter Balanced Summative Assessments English Language Arts/Literacy Overall Results, Percent of Santa Clara County Grade Levels at each Achievement Level
19% 21%23% 20%
19%19% 17% 17%
18% 19% 15% 15%20% 17% 19% 17%
28%22% 22%
27%32% 34% 34%
27%
35%39% 40%
38% 28%30% 30%
39%
All Students Grade 3 Grade 4 Grade 5 Grade 6 Grade 7 Grade 8 Grade 11
Standard Not Met Standard Nearly Met Standard Met Standard Exceeded

Mary Ann Dewan, Ph.D., County Superintendent of Schools
October 11, 2019 Page 33
Figure 28: 2019 Smarter Balanced Summative Assessments Mathematics Overall Results, Percent of Santa Clara County Grade Levels at each Achievement Level
24%19%
16% 24% 24%25% 27% 31%
20% 17%24% 21% 22% 19% 18% 18%
20%26% 24%
17% 18% 19% 16% 19%
37%
38%36%
38% 36% 38% 40% 31%
All Students Grade 3 Grade 4 Grade 5 Grade 6 Grade 7 Grade 8 Grade 11
Standard Not Met Standard Nearly Met Standard Met Standard Exceeded

Mary Ann Dewan, Ph.D., County Superintendent of Schools
October 11, 2019 Page 34
Figure 29: Santa Clara County Smarter Balanced Summative Assessments English Language Arts/Literacy Mean Scale Scores, 2015 vs 2019 by Grade Level
Table 11: Santa Clara County Smarter Balanced Summative Assessments English Language Arts/Literacy Mean Scale Scores, 2015 – 2018 by Grade Level
Year Grade 3 Grade 4 Grade 5 Grade 6 Grade 7 Grade 8 Grade 11
2015 2435.0 2481.9 2524.7 2543.8 2567.3 2586.5 2624.7
2016 2444.7 2488.6 2533.6 2555.9 2577.9 2597.1 2629.1
2017 2443.7 2487.5 2524.4 2553.1 2580.7 2595.3 2634.0
2018 2450.6 2494.7 2529.7 2550.3 2580.0 2596.6 2623.2
2019 2451.9 2495.6 2535.7 2548.9 2580.6 2598.4 2628.3
2435
2482
25252544
25672587
2625
2452
2496
25362549
25812598
2628
2100
2200
2300
2400
2500
2600
2700
2800
Grade 3 Grade 4 Grade 5 Grade 6 Grade 7 Grade 8 Grade 11
Standard Not Met Standard Nearly Met Standard Met Standard Exceeded 2015 2019

Mary Ann Dewan, Ph.D., County Superintendent of Schools
October 11, 2019 Page 35
Figure 30: Santa Clara County Smarter Balanced Summative Assessments Mathematics Mean Scale Scores, 2015 vs 2019 by Grade Level
Table 12: Santa Clara County Smarter Balanced Summative Assessments Mathematics Mean Scale Scores, 2015 – 2019 by Grade Level
Year Grade 3 Grade 4 Grade 5 Grade 6 Grade 7 Grade 8 Grade 11
2015 2449.3 2491.5 2522.5 2547.2 2571.0 2584.7 2615.0
2016 2459.6 2497.7 2529.4 2558.4 2578.2 2598.3 2618.9
2017 2460.8 2501.6 2526.0 2557.4 2582.9 2598.0 2616.7
2018 2464.9 2505.5 2530.7 2555.4 2580.8 2601.8 2615.0
2019 2466.2 2506.3 2535.5 2557.0 2578.5 2599.2 2624.6
2449
24922523
25472571 2585
2615
2466
25062536
25572589 2599
2625
2100
2200
2300
2400
2500
2600
2700
2800
2900
Grade 3 Grade 4 Grade 5 Grade 6 Grade 7 Grade 8 Grade 11
Standard Not Met Standard Nearly Met Standard Met Standard Exceeded 2015 2019

Mary Ann Dewan, Ph.D., County Superintendent of Schools
October 11, 2019 Page 36
Table 13: 2019 Smarter Balanced Summative Assessments English Language Arts/Literacy Claims (Areas), Santa Clara County Performance by Ethnicity
All Afr. Am Asian
Fili- pino
Hisp- anic
White
Reading: Demonstrating Understanding of Literacy and Non-Fictional Texts
Above Standard 38% 22% 57% 33% 16% 48%
Near Standard 40% 43% 34% 48% 44% 39%
Below Standard 22% 34% 8% 18% 39% 12%
Writing: Producing Clear and Purposeful Writing
Above Standard 37% 20% 58% 39% 16% 45%
Near Standard 44% 48% 35% 49% 50% 45%
Below Standard 19% 32% 7% 12% 34% 11%
Listening: Demonstrating Effective Communication Skills
Above Standard 27% 16% 42% 22% 12% 36%
Near Standard 59% 61% 53% 68% 63% 58%
Below Standard 14% 23% 5% 10% 25% 7%
Research/Inquiry: Investigating, Analyzing, and Presenting Information
Above Standard 38% 22% 58% 37% 18% 47%
Near Standard 43% 47% 35% 50% 49% 43%
Below Standard 19% 31% 7% 13% 33% 10%
Table 14: 2015 Smarter Balanced Summative Assessments English Language Arts/Literacy Claims (Areas), Santa Clara County Performance by Ethnicity
All Afr. Am Asian
Fili- pino
Hisp- anic
White
Reading: Demonstrating Understanding of Literacy and Non-Fictional Texts
Above Standard 31% 18% 50% 27% 12% 42%
At or Near Standard 43% 45% 40% 50% 43% 43%
Below Standard 26% 37% 10% 23% 45% 14%
Writing: Producing Clear and Purposeful Writing
Above Standard 36% 20% 58% 35% 13% 46%
At or Near Standard 42% 46% 34% 49% 47% 42%
Below Standard 22% 33% 8% 16% 39% 12%
Listening: Demonstrating Effective Communication Skills
Above Standard 23% 13% 36% 18% 9% 31%
At or Near Standard 61% 63% 58% 68% 63% 61%
Below Standard 16% 23% 6% 14% 28% 8%
Research/Inquiry: Investigating, Analyzing, and Presenting Information
Above Standard 35% 21% 55% 33% 16% 44%
At or Near Standard 48% 54% 38% 53% 54% 46%
Below Standard 16% 24% 6% 13% 29% 9%

Mary Ann Dewan, Ph.D., County Superintendent of Schools
October 11, 2019 Page 37
Table 15: 2019 Smarter Balanced Summative Assessments English Language Arts/Literacy Claims (Areas), Santa Clara County Performance by Student Groups
All Not ED
ED Not EL EL
Not SWD SWD
Reading: Demonstrating Understanding of Literacy and Non-Fictional Texts
Above Standard 38% 50% 17% 45% 5% 41% 10%
Near Standard 40% 38% 44% 41% 37% 41% 32%
Below Standard 22% 12% 39% 15% 58% 18% 57%
Writing: Producing Clear and Purposeful Writing
Above Standard 37% 49% 17% 44% 5% 40% 9%
Near Standard 44% 41% 49% 44% 44% 45% 35%
Below Standard 19% 10% 34% 12% 51% 15% 57%
Listening: Demonstrating Effective Communication Skills
Above Standard 27% 36% 12% 32% 4% 29% 8%
Near Standard 59% 57% 63% 59% 57% 60% 50%
Below Standard 14% 7% 25% 8% 39% 11% 41%
Research/Inquiry: Investigating, Analyzing, and Presenting Information
Above Standard 38% 50% 20% 45% 7% 42% 11%
Near Standard 43% 40% 47% 43% 43% 44% 36%
Below Standard 19% 10% 33% 12% 50% 15% 53%
Table 16: 2015 Smarter Balanced Summative Assessments English Language Arts/Literacy Claims (Areas), Santa Clara County Performance by Student Groups
All Not ED
ED Not EL EL Not
SWD
SWD
Reading: Demonstrating Understanding of Literacy and Non-Fictional Texts
Above Standard 31% 44% 12% 38% 6% 34% 9%
At or Near Standard 43% 42% 43% 45% 34% 44% 29%
Below Standard 26% 14% 45% 18% 60% 22% 62%
Writing: Producing Clear and Purposeful Writing
Above Standard 36% 49% 14% 43% 7% 39% 9%
At or Near Standard 42% 39% 46% 43% 39% 43% 29%
Below Standard 22% 11% 39% 14% 54% 18% 61%
Listening: Demonstrating Effective Communication Skills
Above Standard 23% 31% 9% 27% 5% 24% 7%
At or Near Standard 61% 60% 63% 63% 56% 63% 47%
Below Standard 16% 8% 28% 10% 39% 13% 45%
Research/Inquiry: Investigating, Analyzing, and Presenting Information
Above Standard 35% 47% 16% 42% 8% 38% 10%
At or Near Standard 48% 44% 54% 47% 50% 48% 44%
Below Standard 16% 9% 29% 11% 41% 14% 45%

Mary Ann Dewan, Ph.D., County Superintendent of Schools
October 11, 2019 Page 38
Table 17: 2019 Smarter Balanced Summative Assessments Mathematics Claims (Areas), Santa Clara County Performance by Ethnicity
All
Afr. Am.
Asian Fili- pino
Hisp- anic
White
Concepts and Procedures: Applying mathematical concepts and procedures
Above Standard 45% 21% 74% 38% 17% 54%
Near Standard 26% 29% 18% 36% 29% 29%
Below Standard 30% 50% 8% 26% 54% 17%
Problem Solving/Modeling and Data Analysis: Using appropriate tools and strategies to solve real world and mathematical problems
Above Standard 38% 16% 64% 29% 13% 47%
Near Standard 38% 41% 29% 49% 43% 40%
Below Standard 24% 42% 7% 21% 45% 13%
Communicating Reasoning: Demonstrating ability to support mathematical conclusions
Above Standard 38% 15% 64% 30% 13% 46%
Near Standard 41% 48% 30% 52% 47% 42%
Below Standard 22% 37% 6% 18% 40% 12%
Table 18: 2015 Smarter Balanced Summative Assessments Mathematics Claims (Areas), Santa Clara County Performance by Ethnicity
All
Afr. Am.
Asian Fili- pino
Hisp- anic
White
Concepts and Procedures: Applying mathematical concepts and procedures
Above Standard 38% 16% 67% 31% 12% 47%
At or Near Standard 30% 32% 23% 40% 31% 33%
Below Standard 32% 51% 10% 29% 57% 19%
Problem Solving/Modeling and Data Analysis: Using appropriate tools and strategies to solve real world and mathematical problems
Above Standard 33% 13% 59% 25% 9% 43%
At or Near Standard 42% 46% 33% 52% 46% 44%
Below Standard 25% 41% 8% 23% 45% 13%
Communicating Reasoning: Demonstrating ability to support mathematical conclusions
Above Standard 33% 13% 59% 26% 9% 41%
At or Near Standard 45% 51% 34% 54% 51% 46%
Below Standard 22% 35% 7% 20% 40% 12%
Mary Ann Dewan, Ph.D., County Superintendent of Schools
October 11, 2019 Page 39
Table 19: 2019 Smarter Balanced Summative Assessments Mathematics Claims (Areas), Santa Clara County Performance by Student Groups
All Not ED
ED Not EL EL
Not SWD SWD
Concepts and Procedures: Applying mathematical concepts and procedures
Above Standard 45% 60% 20% 52% 13% 48% 14%
Near Standard 26% 24% 29% 26% 24% 26% 17%
Below Standard 30% 17% 52% 22% 64% 25% 69%
Problem Solving/Modeling and Data Analysis: Using appropriate tools and strategies to solve real world and mathematical problems
Above Standard 38% 51% 15% 44% 8% 41% 11%
Near Standard 38% 36% 42% 38% 36% 39% 28%
Below Standard 24% 13% 43% 17% 57% 20% 61%
Communicating Reasoning: Demonstrating ability to support mathematical conclusions
Above Standard 38% 51% 15% 44% 8% 41% 11%
Near Standard 41% 37% 47% 40% 41% 42% 33%
Below Standard 22% 12% 39% 16% 51% 18% 56%
Table 20: 2015 Smarter Balanced Summative Assessments Mathematics Claims (Areas), Santa Clara County Performance by Student Groups
All Not ED
ED Not EL EL Not
SWD SWD
Concepts and Procedures: Applying mathematical concepts and procedures
Above Standard 38% 53% 14% 44% 13% 41% 12%
At or Near Standard 30% 29% 31% 31% 25% 31% 17%
Below Standard 32% 18% 55% 25% 62% 28% 71%
Problem Solving/Modeling and Data Analysis: Using appropriate tools and strategies to solve real world and mathematical problems
Above Standard 33% 47% 11% 39% 9% 35% 9%
At or Near Standard 42% 40% 45% 43% 37% 43% 30%
Below Standard 25% 14% 44% 18% 54% 22% 60%
Communicating Reasoning: Demonstrating ability to support mathematical conclusions
Above Standard 33% 46% 11% 39% 9% 35% 9%
At or Near Standard 45% 41% 51% 45% 45% 46% 37%
Below Standard 22% 12% 38% 16% 46% 19% 54%

Mary Ann Dewan, Ph.D., County Superintendent of Schools
October 11, 2019 Page 40
Table 21: 2019 Smarter Balanced Summative Assessments English Language Arts/Literacy Claims (Areas), Santa Clara County Performance by Grades
All
Grade 3
Grade 4
Grade 5
Grade 6
Grade 7
Grade 8
Grade 11
Reading: Demonstrating Understanding of Literacy and Non-Fictional Texts
Above Standard 38% 38% 37% 41% 33% 34% 38% 42%
Near Standard 41% 41% 42% 39% 41% 41% 40% 37%
Below Standard 21% 21% 21% 20% 25% 25% 22% 21%
Writing: Producing Clear and Purposeful Writing
Above Standard 37% 30% 32% 40% 29% 42% 39% 48%
Near Standard 44% 47% 47% 41% 50% 42% 45% 36%
Below Standard 19% 22% 21% 19% 22% 16% 16% 16%
Listening: Demonstrating Effective Communication Skills
Above Standard 27% 31% 30% 28% 24% 21% 25% 33%
Near Standard 59% 57% 57% 56% 61% 64% 61% 55%
Below Standard 14% 12% 13% 16% 15% 15% 13% 12%
Research/Inquiry: Investigating, Analyzing, and Presenting Information
Above Standard 38% 34% 34% 41% 38% 41% 40% 42%
Near Standard 43% 45% 46% 40% 44% 42% 42% 42%
Below Standard 19% 21% 20% 20% 18% 18% 18% 16%
Table 22: 2015 Smarter Balanced Summative Assessments English Language Arts/Literacy Claims (Areas), Santa Clara County Performance by Grades
All
Grade 3
Grade 4
Grade 5
Grade 6
Grade 7
Grade 8
Grade 11
Reading: Demonstrating Understanding of Literacy and Non-Fictional Texts
Above Standard 31% 29% 31% 32% 26% 30% 33% 41%
At or Near Standard 43% 41% 42% 41% 45% 44% 43% 43%
Below Standard 26% 30% 28% 27% 29% 27% 23% 16%
Writing: Producing Clear and Purposeful Writing
Above Standard 36% 29% 31% 39% 34% 38% 36% 45%
At or Near Standard 42% 44% 44% 39% 43% 41% 44% 38%
Below Standard 22% 27% 24% 22% 23% 21% 19% 17%
Listening: Demonstrating Effective Communication Skills
Above Standard 23% 24% 26% 25% 21% 19% 20% 24%
At or Near Standard 61% 60% 58% 59% 65% 63% 64% 59%
Below Standard 16% 16% 16% 16% 14% 17% 16% 16%
Research/Inquiry: Investigating, Analyzing, and Presenting Information
Above Standard 35% 29% 28% 41% 35% 35% 34% 45%
At or Near Standard 48% 48% 46% 46% 52% 48% 49% 43%
Below Standard 16% 23% 20% 13% 13% 17% 16% 12%

Mary Ann Dewan, Ph.D., County Superintendent of Schools
October 11, 2019 Page 41
Table 23: 2019 Smarter Balanced Summative Assessments Mathematics Claims (Areas), Santa Clara County Performance by Grades
All
Grade 3
Grade 4
Grade 5
Grade 6
Grade 7
Grade 8
Grade 11
Concepts and Procedures: Applying mathematical concepts and procedures
Above Standard 45% 51% 47% 44% 42% 45% 44% 41%
At or Near Standard 26% 27% 27% 25% 27% 25% 25% 22%
Below Standard 30% 22% 26% 31% 31% 31% 31% 37%
Problem Solving/Modeling and Data Analysis: Using appropriate tools and strategies to solve real world and mathematical problems
Above Standard 38% 43% 38% 36% 35% 38% 41% 33%
At or Near Standard 38% 38% 40% 39% 38% 37% 33% 40%
Below Standard 24% 19% 22% 25% 27% 25% 26% 27%
Communicating Reasoning: Demonstrating ability to support mathematical conclusions
Above Standard 38% 43% 39% 34% 36% 36% 39% 34%
At or Near Standard 41% 39% 40% 41% 38% 44% 39% 44%
Below Standard 22% 18% 21% 25% 26% 20% 22% 22%
Table 24: 2015 Smarter Balanced Summative Assessments Mathematics Claims (Areas), Santa Clara County Performance by Grades
All
Grade 3
Grade 4
Grade 5
Grade 6
Grade 7
Grade 8
Grade 11
Concepts and Procedures: Applying mathematical concepts and procedures
Above Standard 38% 41% 38% 36% 35% 40% 39% 36%
At or Near Standard 30% 32% 29% 29% 30% 29% 28% 29%
Below Standard 32% 27% 32% 35% 34% 31% 33% 35%
Problem Solving/Modeling and Data Analysis: Using appropriate tools and strategies to solve real world and mathematical problems
Above Standard 33% 36% 32% 31% 30% 36% 35% 29%
At or Near Standard 42% 40% 43% 38% 43% 42% 43% 46%
Below Standard 25% 25% 25% 31% 27% 22% 22% 25%
Communicating Reasoning: Demonstrating ability to support mathematical conclusions
Above Standard 33% 36% 34% 22% 32% 35% 33% 31%
At or Near Standard 45% 45% 39% 43% 44% 53% 43% 49%
Below Standard 22% 19% 26% 28% 24% 13% 24% 21%

Mary Ann Dewan, Ph.D., County Superintendent of Schools
October 11, 2019 Page 42
Table 25: 2019 Smarter Balanced Summative Assessments Testing, Santa Clara County Student Groups by Percent per Students with Mathematics Scores
Student Groups Percent of
Students Tested
African American 2%
Asian 30%
Filipino 4%
Hispanic 38%
White 19%
Not Economically Disadvantaged 62%
Economically Disadvantaged 38%
Not English Learner 82%
English Learner 18%
Students with No Reported Disability 90%
Students with Disability 10%
Table 26: Smarter Balanced English Language Arts/Literacy Scale Score Ranges
Grade Minimum
Scale Score Maximum Scale Score
Standard Not Met
Standard Nearly Met
Standard Met
Standard Exceeded
3 2114 2623 2114–2366 2367–2431 2432–2489 2490–2623
4 2131 2663 2131–2415 2416–2472 2473–2532 2533–2663
5 2201 2701 2201–2441 2442–2501 2502–2581 2582–2701
6 2210 2724 2210–2456 2457–2530 2531–2617 2618–2724
7 2258 2745 2258–2478 2479–2551 2552–2648 2649–2745
8 2288 2769 2288–2486 2487–2566 2567–2667 2668–2769
11 2299 2795 2299–2492 2493–2582 2583–2681 2682–2795
Table 27: Smarter Balanced Mathematics Scale Score Ranges
Grade Minimum
Scale Score Maximum Scale Score
Standard Not Met
Standard Nearly Met
Standard Met
Standard Exceeded
3 2189 2621 2189–2380 2381–2435 2436–2500 2501–2621
4 2204 2659 2204–2410 2411–2484 2485–2548 2549–2659
5 2219 2700 2219–2454 2455–2527 2528–2578 2579–2700
6 2235 2748 2235–2472 2473–2551 2552–2609 2610–2748
7 2250 2778 2250–2483 2484–2566 2567–2634 2635–2778
8 2265 2802 2265–2503 2504–2585 2586–2652 2653–2802
11 2280 2862 2280–2542 2543–2627 2628–2717 2718–2862