Embed Size (px)
Citation preview
TITLE TEXT BOX
1. Never change the square box shape
2. Allow text to wrap in the box shape
3. Title should be sentence case (cap first word, only cap proper nouns)
Fixed Income 2015 Update
Kathy Jones, Senior Vice President Chief Fixed Income Strategist, Schwab Center for Financial Research™

Charles Schwab 2
1 Fed: Slow and Low
2 Yield Curve Flattening
3 Higher Volatility
4 Mind the Gaps
2015 Fixed Income Outlook

Charles Schwab 3
Source: The Schwab Center for Financial Research
The Fed

Charles Schwab 4
Source: St. Louis Federal Reserve. Real Gross Domestic Product and Real Potential Gross Domestic Product, Billions of Chained 2009 Dollars, Quarterly, Seasonally Adjusted Annual Rate. Data as of Q1 2015
text text text text text text text text text text text text text
Gap 1: The Output Gap is Closing
Dec. 29: 2090.57
$11,000
$13,000
$15,000
$17,000
$19,000
$21,000
2005 2007 2009 2011 2013 2015 2017 2019
Billion Dollars Real Potential GDP Real GDP Projection
A 3% growth rate will close the gap by end-2017
Charles Schwab
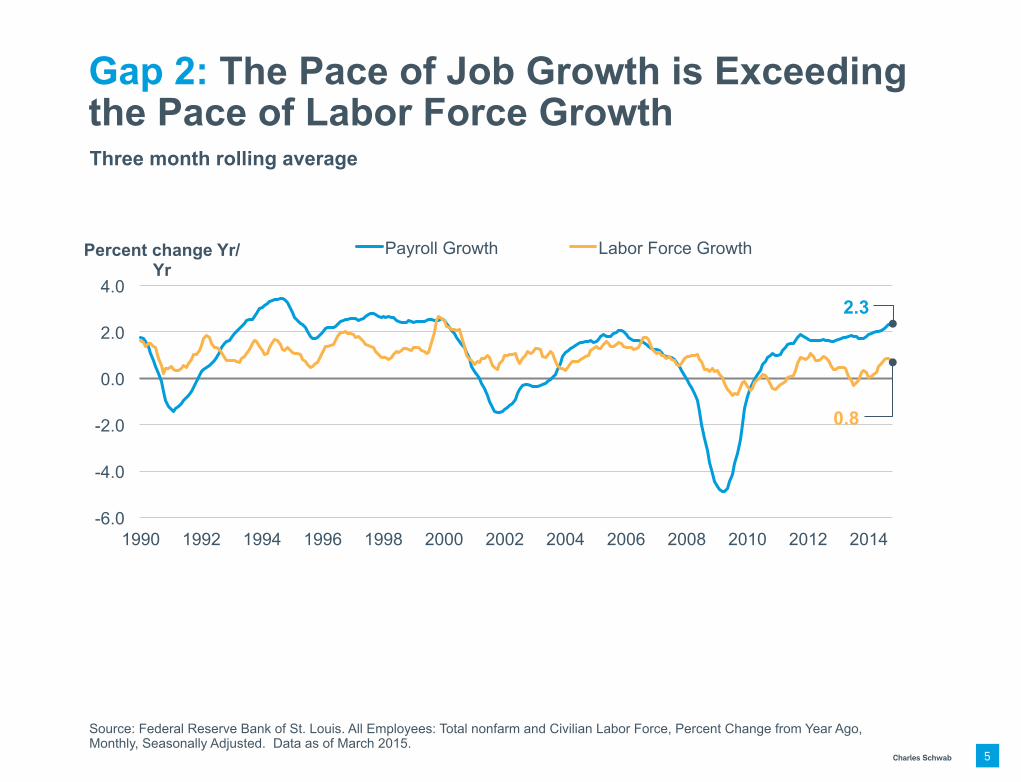
Gap 2: The Pace of Job Growth is Exceeding the Pace of Labor Force Growth
Source: Federal Reserve Bank of St. Louis. All Employees: Total nonfarm and Civilian Labor Force, Percent Change from Year Ago, Monthly, Seasonally Adjusted. Data as of March 2015.
5
-6.0
-4.0
-2.0
0.0
2.0
4.0
1990 1992 1994 1996 1998 2000 2002 2004 2006 2008 2010 2012 2014
Percent change Yr/Yr
Payroll Growth Labor Force Growth
0.8
2.3
Three month rolling average
Charles Schwab 6
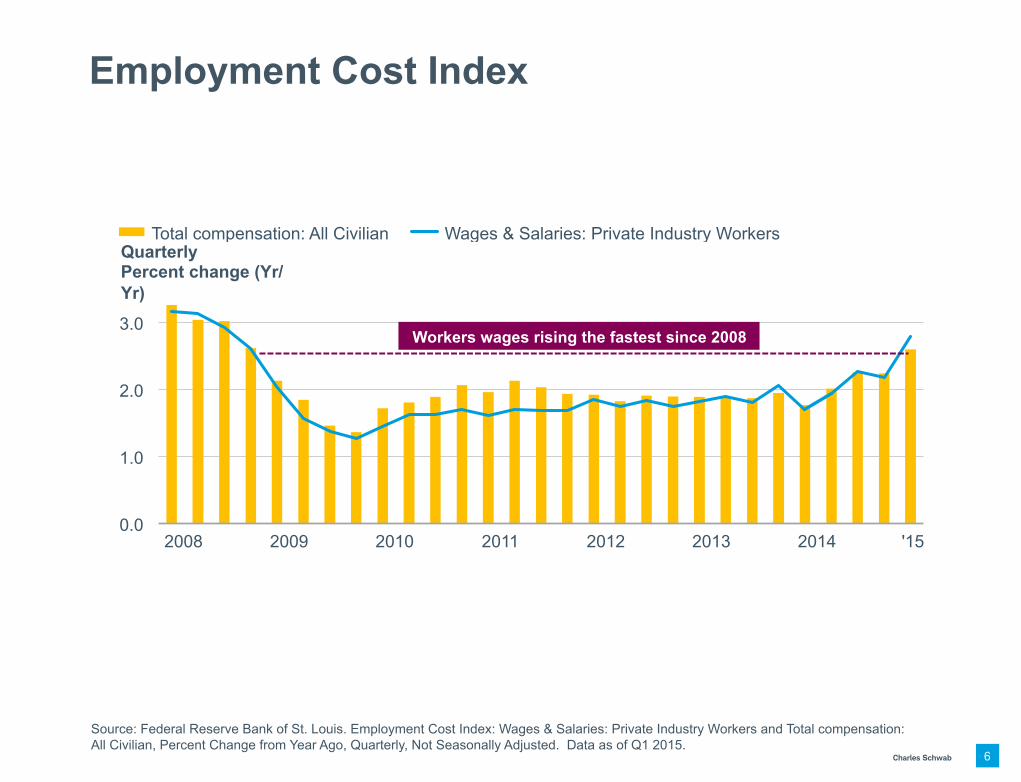
Source: Federal Reserve Bank of St. Louis. Employment Cost Index: Wages & Salaries: Private Industry Workers and Total compensation: All Civilian, Percent Change from Year Ago, Quarterly, Not Seasonally Adjusted. Data as of Q1 2015.
text text text text text text text text text text text text text
Employment Cost Index
0.0
1.0
2.0
3.0
2008 2009 2010 2011 2012 2013 2014 '15
Quarterly Percent change (Yr/Yr)
Total compensation: All Civilian Wages & Salaries: Private Industry Workers
Workers wages rising the fastest since 2008

Charles Schwab 7
Note: Expected Fed funds rate based on March 18, 2015 FOMC projections. Source: Federal Reserve Board, March 18, 2015 and Bloomberg Euro Dollar Synthetic Rate Forecast Analysis (EDSF) as of May 1, 2015.
text text text text text text text text text text text text text
Gap 3: The Market and the Fed Still Far Apart
0.5
1.0
1.5
2.0
2.5
3.0
3.5
4.0
Dec-15 Dec-16 Dec-17 Longer Run
Percent Fed Estimate (Mar-15) Market Estimate

Charles Schwab 8
Source: Bloomberg. Data as of May 1, 2015.
xxxxxxxx
Gap 4: U.S. Yields Far Above Other G-8 Yields
211 184 168 150
65 37 36
4
60 55 71 26
-15 -22
1
-81 -150
-100
-50
0
50
100
150
200
250
U.S. U.K. Canada Italy France Germany Japan Switzerland
Basis Points 10-year bond yield 2-year note yield
Charles Schwab 9
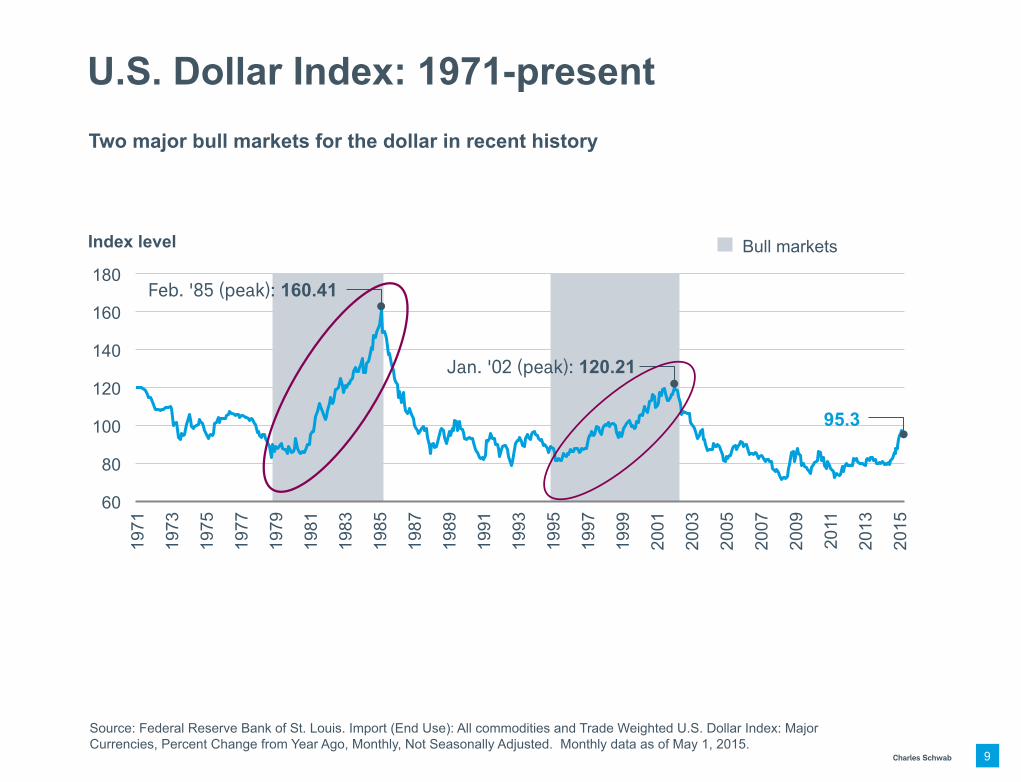
Source: Federal Reserve Bank of St. Louis. Import (End Use): All commodities and Trade Weighted U.S. Dollar Index: Major Currencies, Percent Change from Year Ago, Monthly, Not Seasonally Adjusted. Monthly data as of May 1, 2015.
text text text text text text text text text text text text text
U.S. Dollar Index: 1971-present Two major bull markets for the dollar in recent history
60
80
100
120
140
160
180
1971
1973
1975
1977
1979
1981
1983
1985
1987
1989
1991
1993
1995
1997
1999
2001
2003
2005
2007
2009
2011
2013
2015
Index level Bull markets
Feb. '85 (peak): 160.41
Jan. '02 (peak): 120.21
95.3

Charles Schwab 10
Source: The Schwab Center for Financial Research
There is no average cycle
Historically, the worst time period for bonds is 3 months before and 3 months after first rate hike.
The yield curve eventually flattens when the Fed raises rates. With each cycle it has flattened earlier than the previous cycle.
Long-term bonds are more volatile but can have higher returns over time.
1
2
3

Charles Schwab 11
Source: Schwab Center for Financial Research and Barclays. Cumulative total returns, using monthly data, from August 1993 through July 1995. Two-year time horizon begins six months before the first rate hike. Returns assume reinvestment of interest and capital gains. Indices are unmanaged, do not incur fees or expenses, and cannot be invested in directly. Past performance is no indication of future results.
text text text text text text text text text text text text text
Rate Hike Cycle: 1994 Fed funds rate rose from 3% to 6% from Feb-94 to Feb-95
-10%
-5%
0%
5%
10%
15%
Aug-93 Oct-93 Dec-93 Feb-94 Apr-94 Jun-94 Aug-94 Oct-94 Dec-94 Feb-95 Apr-95 Jun-95 Aug-95
Cumulative Total Return
Barclays U.S. Aggregate Bond Index 75% Barclays Aggregate, 25% Treasury Bills Barclays U.S. Long Treasury Bond Index
Charles Schwab 12
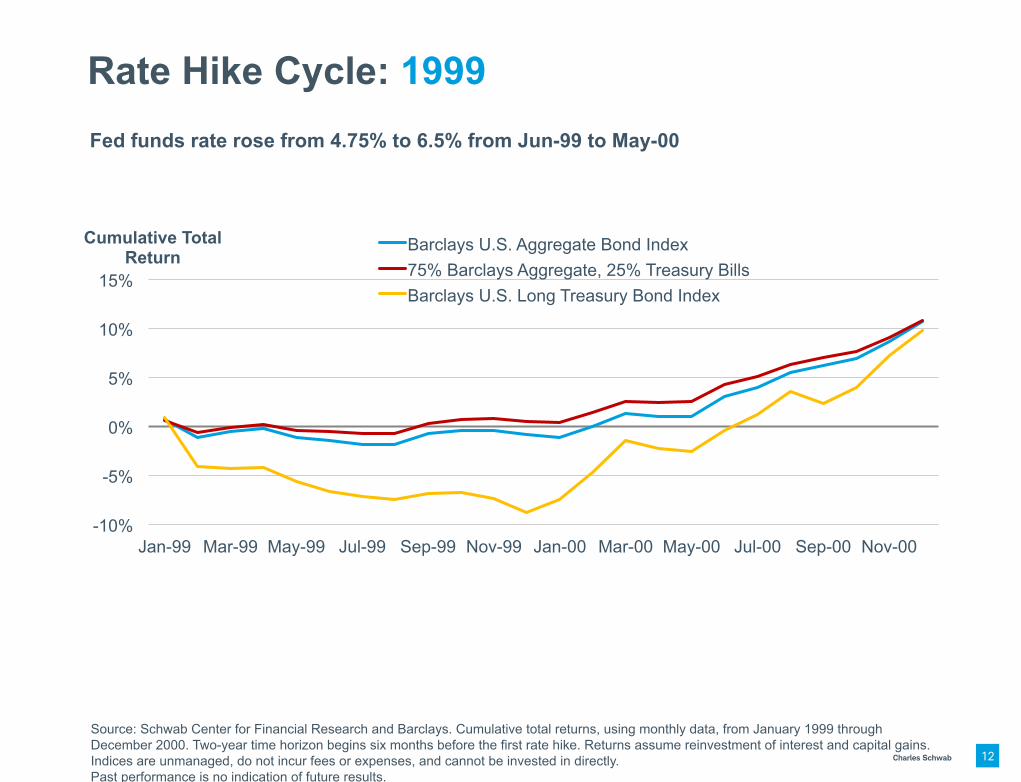
Source: Schwab Center for Financial Research and Barclays. Cumulative total returns, using monthly data, from January 1999 through December 2000. Two-year time horizon begins six months before the first rate hike. Returns assume reinvestment of interest and capital gains. Indices are unmanaged, do not incur fees or expenses, and cannot be invested in directly. Past performance is no indication of future results.
text text text text text text text text text text text text text
Rate Hike Cycle: 1999 Fed funds rate rose from 4.75% to 6.5% from Jun-99 to May-00
-10%
-5%
0%
5%
10%
15%
Jan-99 Mar-99 May-99 Jul-99 Sep-99 Nov-99 Jan-00 Mar-00 May-00 Jul-00 Sep-00 Nov-00
Cumulative Total Return
Barclays U.S. Aggregate Bond Index 75% Barclays Aggregate, 25% Treasury Bills Barclays U.S. Long Treasury Bond Index
Charles Schwab 13
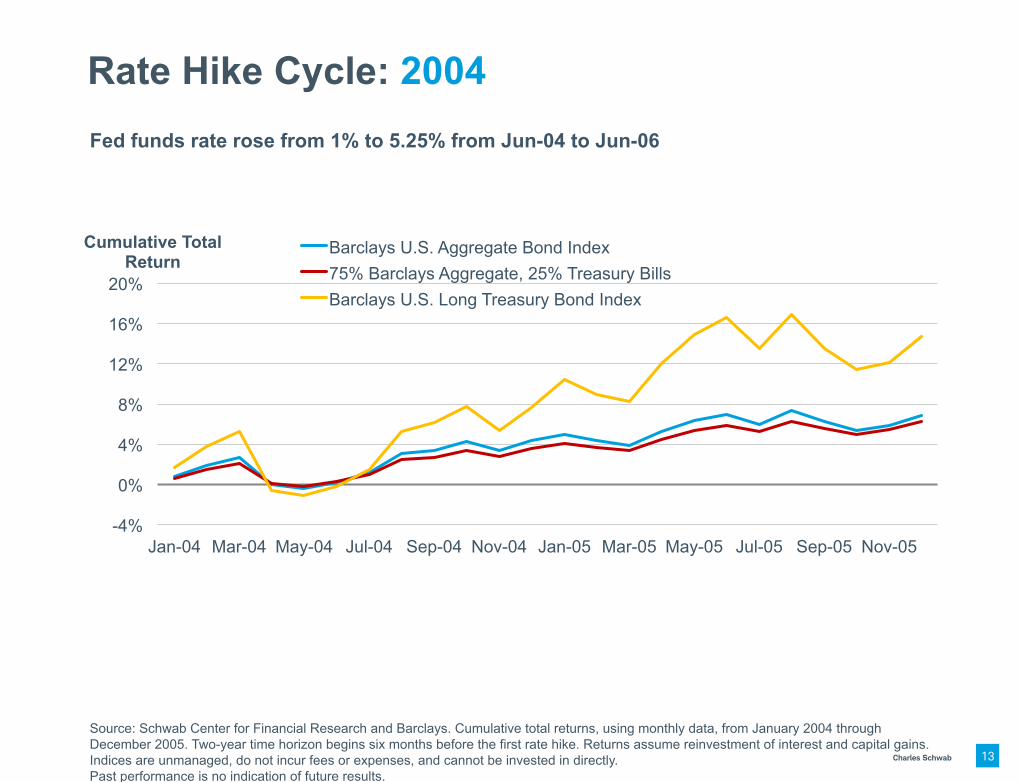
Source: Schwab Center for Financial Research and Barclays. Cumulative total returns, using monthly data, from January 2004 through December 2005. Two-year time horizon begins six months before the first rate hike. Returns assume reinvestment of interest and capital gains. Indices are unmanaged, do not incur fees or expenses, and cannot be invested in directly. Past performance is no indication of future results.
text text text text text text text text text text text text text
Rate Hike Cycle: 2004 Fed funds rate rose from 1% to 5.25% from Jun-04 to Jun-06
-4%
0%
4%
8%
12%
16%
20%
Jan-04 Mar-04 May-04 Jul-04 Sep-04 Nov-04 Jan-05 Mar-05 May-05 Jul-05 Sep-05 Nov-05
Cumulative Total Return
Barclays U.S. Aggregate Bond Index 75% Barclays Aggregate, 25% Treasury Bills Barclays U.S. Long Treasury Bond Index
Charles Schwab
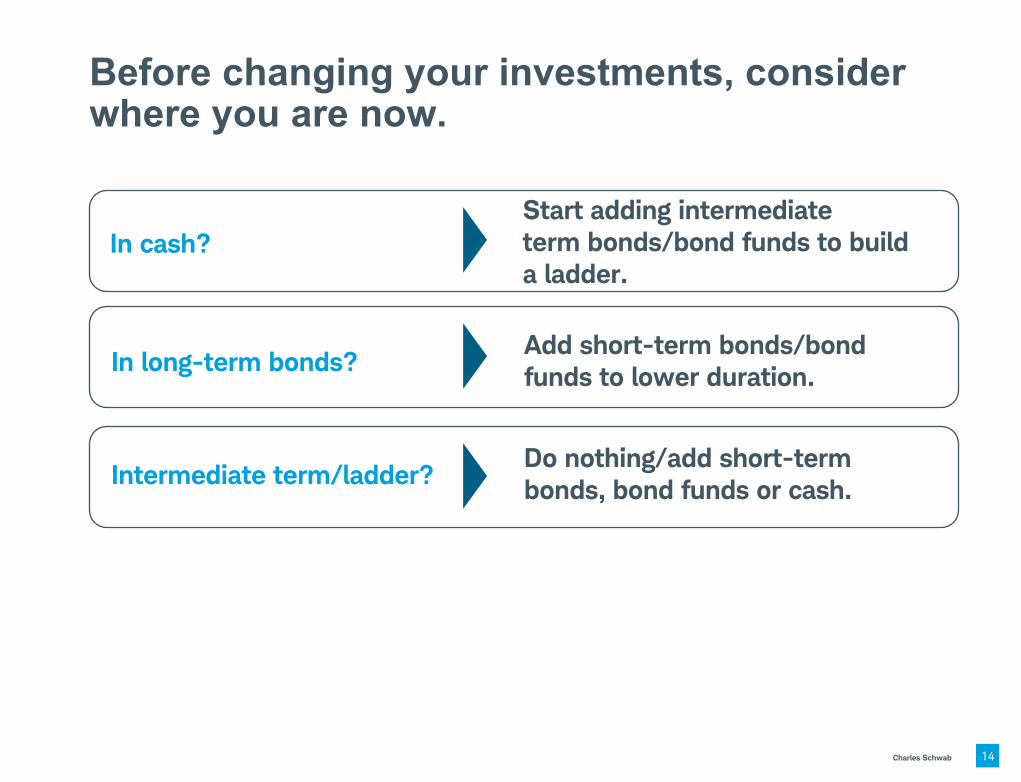
Before changing your investments, consider where you are now.
In cash? Start adding intermediate term bonds/bond funds to build a ladder.
In long-term bonds? Add short-term bonds/bond funds to lower duration.
Intermediate term/ladder? Do nothing/add short-term bonds, bond funds or cash.
14

Charles Schwab 15
Source: Schwab Center for Financial Research with data from Morningstar, Inc. Data shown in the chart are annual total returns including price change and income for the Ibbotson U.S. Intermediate-Term Government Bond Index. Indices are unmanaged, do not incur fees or expenses, and cannot be invested in directly. Past performance is no indication of future results.
text text text text text text text text text text text text text
Even in Bond Bear Markets, Negative Returns Have Been Rare, 1954-1981 Annual total return for intermediate-term government bonds
0
2
4
6
8
10
12
14
16
-10%
-5%
0%
5%
10%
15%
20%
1954 1956 1958 1960 1962 1964 1966 1968 1970 1972 1974 1976 1978 1980
Yield (%) Annual Total Return

Charles Schwab
For more SCFR commentary, access the fixed income research page at:
www.schwab.com/onbonds
Follow Kathy Jones on Twitter @kathyjones
Additional Resources
16
Thank you
17 Charles Schwab
Index Definitions
Indexes are unmanaged, do not incur management fees, costs and expenses and cannot be invested in directly.
The Barclays U.S. Aggregate Index represents securities that are SEC-registered, taxable, and dollar denominated. The index covers the U.S. investment grade fixed rate bond market, with index components for government and corporate securities, mortgage pass-through securities, and asset-backed securities. These major sectors are subdivided into more specific indices that are calculated and reported on a regular basis.
Barclays U.S. Treasury Bond Index includes public obligations of the U.S. Treasury excluding Treasury Bills and U.S. Treasury TIPS. The index rolls up to the U.S. Aggregate. Securities have USD250 million minimum par amount outstanding and at least one year until final maturity.
Barclays U.S. Long Treasury Bond Index includes all public obligations of the U.S. Treasury, excluding foreign-targeted issues with maturates of 10 years or longer.
US Dollar Index (USDX) is an index (or measure) of the value of the United States dollar relative to a basket of foreign currencies.
Morningstar Intermediate-Term Government: A fund with at least 90% of its bond portfolio invested in government issues with a duration of greater than or equal to 3.5 years and less than six years or an average effective maturity of greater than or equal to four years and less than 10 years.
The Employment Cost Index (ECI) is a quarterly economic series detailing the changes in the costs of labor for businesses in the United States economy. The ECI is prepared by the Bureau of Labor Statistics (BLS), in the U.S. Department of Labor
©2015 Charles Schwab & Co., Inc. All rights reserved. Member SIPC
18 Charles Schwab

Additional Definitions
Swap: Traditionally, the exchange of one security for another to change the maturity (bonds), quality of issues (stocks or bonds), or because investment objectives have changed. Recently, swaps have grown to include currency swaps and interest rate swaps.
©2015 Charles Schwab & Co., Inc. All rights reserved. Member SIPC
19 Charles Schwab
Disclosures
Fixed income securities are subject to increased loss of principal during periods of rising interest rates. Investment value will fluctuate, and bond investments, when sold, may be worth more or less than original cost. Fixed income securities are subject to various other risks, including changes in interest rates and credit quality, market valuations, liquidity, prepayments, early redemption, corporate events, tax ramifications, and other factors.
The information provided here is for general informational purposes only and should not be considered an individualized recommendation or personalized investment advice. The investment strategies mentioned here may not be suitable for everyone. Each investor needs to review an investment strategy for his or her own particular situation before making any investment decision.
We believe the information obtained from third-party sources to be reliable, but neither Schwab nor its affiliates guarantee its accuracy, timeliness, or completeness. The views, opinions and estimates herein are as of the date of the material and are subject to change without notice at any time in reaction to shifting market conditions.
The opinions presented should not be viewed as an indicator of future performance. Past performance is no guarantee of future results.
Diversification strategies do not ensure a profit and do not protect against losses in declining markets.
The Schwab Center for Financial Research is a division of Charles Schwab & Co., Inc.
©2015 Charles Schwab & Co., Inc. All rights reserved. Member SIPC (0515-3559)
20 Charles Schwab