Embed Size (px)
Citation preview

Saurashtra University Re – Accredited Grade ‘B’ by NAAC (CGPA 2.93)
Zala, Virambhai S., 2010, A Study of Productivity and Financial Efficiency of Textile Industry of India, thesis PhD, Saurashtra University
http://etheses.saurashtrauniversity.edu/id/eprint/82 Copyright and moral rights for this thesis are retained by the author A copy can be downloaded for personal non-commercial research or study, without prior permission or charge. This thesis cannot be reproduced or quoted extensively from without first obtaining permission in writing from the Author. The content must not be changed in any way or sold commercially in any format or medium without the formal permission of the Author When referring to this work, full bibliographic details including the author, title, awarding institution and date of the thesis must be given.
Saurashtra University Theses Service http://etheses.saurashtrauniversity.edu
© The Author

“A STUDY OF PRODUCTIVITY AND FINANCIAL EFFICIENCY OF TEXTILE INDUSTRY OF INDIA”
THESIS
SUBMITTED TO SAURASHTRA UNIVERSITY
FOR THE DEGREE OF DOCTOR OF PHILOSOPHY
(FACULTY OF COMMERCE)
SUBMITTED BY VIRAMBHAI S. ZALA ASSOCIATE PROFESSOR,
MAHILA ARTS AND COMMERCE COLLEGE, VERAVAL
UNDER THE GUIDANCE OF Dr. SHAILESH J. PARMAR
ASSOCIATE PROFESSOR, DEPARTMENT OF COMMERCE AND BUSINESS ADMINISTRATION,
SAURASHTRA UNIVERSITY, RAJKOT – 360 005
Registration No. – 3803
Date of Registration – 28-02-2008 Submission Date-30-08-2010
DEPARTMENT OF COMMERCE AND BUSINESS ADMINISTRATION SAURASHTRA UNIVERSITY,
RAJKOT – 360 005
CERTIFICATE
This is to certify that Mr. VIRMABHAI S.
ZALA has carried out the Research Work presented in
this thesis on “A STUDY OF PRODUCTIVITY AND
FINANCIAL EFFICIENCY OF TEXTILE
INDUSTRY OF INDIA” under my guidance and
supervision.
I also certify that this is his original work.
Dt.: August 30, 2010 Dr. SHAILESH J. PARMAR Place: Rajkot ASSOCIATE PROFESSOR,
DEPARTMENT OF COMMERCE& BUSINESS ADMINISTRATION,
SAURASHTRA UNIVERSITY, RAJKOT – 360 005

DECLARATION
I, the undersigned, hereby declare that the Research
Work presented in this thesis on “A STUDY OF
PRODUCTIVITY AND FINANCIAL EFFICIENCY OF
TEXTILE INDUSTRY OF INDIA” is my original work and
has been prepared as per the guidance given by my guide.
I also declare that the Research Work has not been
previously submitted to this or any other university for any
degree or award.
Dt.: August 30, 2010 Mr. VIRAMBHAI S. ZALA Place: Rajkot ASSOCIATE PROFESSOR,
MAHIAL ARTS AND COMMERCE COLLEGE, VERAVAL

CONTENTS
Sr. No. Item Page
No. 1 Preface i-v 2 List of Tables vi-viii 3 List of Graphs viii 4 List of Diagrams viii
5 List of Abbreviations ix
CHAPTER PLAN
Sr. No.
Title of Chapter Page No.
1 Profile of Textile Industry 1-41 2 Conceptual Framework of Financial Efficiency and
Productivity Management 42-83
3 Research Methodology 84-114 4 Analysis of Financial Efficiency 115-175 5 Analysis of Material Productivity 176-203 6 Analysis of Labour Productivity 204-227 7 Analysis of Overheads Productivity 228-248 8 Analysis of Overall Productivity 249-273 9 Summary, Findings and Suggestions 274-304 10 Bibliography 305-310

i
PREFACE AND ACKNOWLEDGEMENT
The present study deals with a study of productivity and
financial efficiency of textile Industry of India, which are mainly
engaged in production of textile Products, This study is aimed at
exploring various types of productivities and financial efficiency of
textile industries in India.
The Indian textile industry is the second largest in the world-
second only to china. Indian textiles also account for 38 percent of
the country’s total exports and are therefore, a very important
industry. The forecast is that textiles exports will reach USD 35
billion by the years 2000. To sustain this growth it is imperative
that the textiles industry produces goods of high quality at
reasonable prices. This means that the industry must continuously
moderate its machinery. Therefore, the textiles machinery industry
sector has an integral role to play in the growth of India’s export
Industry analysts note that textile prices are increasingly
competitive worldwide as more and more developing countries
enter the global textile trade. To maintain if not increase, its global
market share, the Indian textile industry must procure modern, low-
cost, textile machinery so that it can produce high quality textiles
and garments for export at competitive prices. It is in this context
that the market for used textile machinery is viewed as very
promising used textiles machinery permits India to incorporate new
technology at low cost. Here are a few important facts about
India’s textile-There are approximately 1200 medium to large scale

ii
textile mills in India. Twenty percent of these mills are located in
Coimbatore.(Tamilnadu).-India has 34 million cotton textile
spindles for manufacturing cotton yarn. Cotton yarn account for 70
percent of India’s textile exports (China has 40 million cotton
spindles.)-Of the Indian textile yarn exports, almost 80 percent
come from coarser yarns (counts below 40s). Consequently, there
is a need to upgrade the technology-For the past two years, there
has been a significant slow-down in the cotton spinning segment,
mainly due to the spiraling price of cotton-For the past two years,
there has been a significant slow-down in the cotton spinning
segment, mainly due to the spiraling price of cotton-The domestic
knitting industry is characterized by small scale units which lack
adequate facilities for dyeing processing and finishing the industry
is concentrated in Tirupur (Tamilnadu) Ludhiana (Punjab). Tirupur
produces 60 percent of the country’s total knitwear exports. Knitted
garments account for almost 32 percent of all exported garments.
For studying the productivity and financial efficiency of
textile industries in India, seven (7) leading companies of textile
industry having a large plant have been selected. The period
covered under the study extends over six years from 2002-03 to
2007-08. Adopting various techniques such as ratio analysis trend
analysis has made analysis of selected units.
In order to analysis the productivity and financial efficiency
of the textile industry of India which the help of published
accounting annual reports, some publications. Most useful
information has been gathered from the various journals reports,
iii
periodicals and daily newspapers. It is hoped that the thesis will be
of immense help and use to practicing financial Managers,
Management, Government officials, employees, Shareholders,
Academicians and research scholars.
The present study is divided into nine chapters. The first
chapter is the Conceptual Framework of financial efficiency and
productivity management. The second chapter focuses on Profile
of textile industries in India. The third chapter is related with the
Research Methodology. In the fourth chapter, financial efficiency
of the textile industry has been analyzed. The Material productivity
of selected textile units has been critically analyzed in the fifth
chapter. The sixth chapter explained analysis of Labour
Productivity f selected textile units. The seventh chapter deals with
the analysis of overheads productivity of selected textile units. The
overall productivity has been analyzed in eighth chapter. Finally, in
the last chapter summary suitable and significant suggestions have
been made and conclusions have been drawn.
It is my first and foremost duty to express my heart-felt
gratitude to my esteemed “GURU” Dr. Shailesh J. Parmar,
Associate Professor, Department of Commerce and Business
Administration. Saurashtra University-Rajkot. I have greatly
benefited from his constructive and elderly advice not only in the
context of the study but in my teaching career also. So, I am
extremely fortunate to have a noble motivating, knowledgeable
and sincere guide.

iv
I express my heartfelt gratitude to Dr. Daxaben C. Gohil,
HOD, Department of Commerce and Business Administration,
Saurashtra University-Rajkot and Dr. Pratapsinh L. Chauhan,
HOD, M.B.A. Department, Saurashtra University-Rajkot for
guiding and motivating me to complete my study in time. I am no
less indebted to Dr. S. J. Bhayani, M.B.A. Department, Saurashtra
University-Rajkot and Dr. B. C. Ajmera, M.B.A. Department,
Bhavanagar University-Bhavanagar for helping throughout my
research work.
I express my thanks to Mahila Arts and Commerce College-
Veraval family and Trustees especially Samirbhai Maru and
Principal Dr. M. J. Bandhiya for providing infrastructural facility.
Shri S. G. Bagul, Librarian for providing necessary reference book
and Shri Hareshbhai Kher. Computer Programmer for guiding me
about computer work from time to time.
I am indebted to my father and mother for their blessings and
my Lt. managing trustee Shri Saramanbhai Maru and former
Principal Shri D. L. Ram for guiding me in my academic life.
I am also thankful to my colleague Asst. Prof. S.V. Bhut for
proof reading of the thesis and helping me in Internet surfing for
my research work. I am also thankful to my friends Dr. A. M.
Chocha, Asso. Prof. Choksi College Veraval and Dr. O. L. Zala
Principal of Lt. J. K. Ram College Veraval.
Last but not least, I gratefully acknowledge the support and
motivation by my beloved wife “BHAVNA” who has always taken
care of my mood and requirements. I also acknowledge my

v
beloved son “HARSHAD” and my daughter “NIRALI” who have
provided me love and affection during the research work.
Finally, I acknowledge that this work would never been
possible without the consistent support and inspiration of God
“KRISHANA”
Date: August 30, 2010 (……………………….)
Place: Rajkot V.S. Zala

vi
List of Tables Table No.
Title of the Tables
Page No.
1.1 Percentage share in total world exports of Textile & clothing 7
1.2 Textile and Clothing Exports by Select Region (%) 8 4.1 Gross Profit Ratio of selected textiles companies in India 124 4.2 Gross Profit Ratio one way ANOVA test 131
4.3 Operating profit Ratio of Selectedtextiles companies in India 132
4.4 Operating Profit Ratio (ANOVA Test) 137 4.5 Net Profit Ratio of Selected Textiles Companies in India 139 4.6 Net Profit Ratio (ANOVA Test) 145
4.7 Earning Per Share of selected companies in India from 2002-03 to 2007-08 147
4.8 Earning per share (ANOVA Test) 152
4.9 The return on gross capital employed ratio of selected textiles companies in India 154
4.10 Return on Gross Capital Employed Ratio (ANOVA Test) 160
4.11 The Return on net capital employed ratio of selected textiles companies in India 161 4.12 Return on Net Capital Employed Ratio (ANOVA Test) 166 4.13 The Return on net worth ratio of textiles companies in India 168 4.14 Return on Net worth Ratio (ANOVA Test) 172
5.1 Analysis of Material Productivity Ratio In Siyaram Silk Mills Ltd. 185
5.2 Calculation of Chi-square value of SSML 186
5.3 Analysis of Material Productivity Ratio in Digjam Ltd 188
5.4 Calculation of Chi-square value of DGL 188
5.5 Analysis of Material Productivity Ratio In Oswal Spinning & Wvg. Mills Ltd 189
5.6 Calculation of Chi-square value of OS &WML 190
5.7 Analysis of Material Productivity Ratio In Shri Dinesh Mills Ltd 191
5.8 Calculation of Chi-square value of SDML 192
5.9 Analysis of Material Productivity Ratio In Welspun India Ltd 194
5.10 Calculation of Chi-square value of WIL 194
5.11 Analysis of Material Productivity Ratio In S Kumars Nationwide Ltd 196
5.12 Calculation of Chi-square value of SKNL 196
5.13 Analysis of Material Productivity Ratios In Mafatlal Industries Ltd 198
5.14 Calculation of Chi-square value of MFTL 199
5.15 Comparative Analysis Of Materialroductivity 200
6.1 Analysis of Labour Productivity in Siyaram Silk Mills Ltd 207
6.2 Calculation of Chi-square value of SSML 207
6.3 Analysis of Labour Productivity in Digjam Ltd 210

vii
6.4 Calculation of Chi-square value of DGL 210
6.5 Analysis of Labour Productivity in Oswal Spinning & Wvg. Mills Ltd 212
6.6 Calculation of Chi-square value of O S & W ML 212
6.7 Analysis of Labour Productivity in Shri Dinesh Mills Ltd. 215
6.8 Calculation of Chi-square value of SDML 215
6.9 Analysis of Labour Productivity in Welspun India Ltd 217
6.10 Calculation of Chi-square value of WIL 217
6.11 Analysis of Labour Productivity in S Kumar’s Nationwide Ltd 220
6.12 Calculation of Chi-square value of S K N L 221
6.13 Analysis of Labour Productivity Ratio in Mafatlal Industries td 223
6.14 Calculation of Chi-square value of MFTL 223
6.15 Comparative analysis of labour productivity 226
7.1 Analysis of Overhead Productivity Ratio in Siyaram Silk Mills Ltd 231
7.2 Calculation of Chi-square value of SSML 232
7.3 Analysis of Overhead Productivity Ratio in Digjam Ltd 233
7.4 Calculation of Chi-square value of DGL 233
7.5 Analysis of Overhead Productivity Ratio in Oswal Spinning & Wvg. Mills Ltd 235
7.6 Calculation of Chi-square value of OS&WML 236 7.7 Analysis of Overhead Productivity Ratio in Shri Dinesh Mills Ltd. 238 7.8 Calculation of Chi-square value OF SDML 239 7.9 Analysis of Overhead Productivity Ratio in Welspun India Ltd 240
7.10 Calculation of Chi-square value OF WIL 240 7.11 Analysis of Overhead Productivity Ratio in S Kumars Nationwide Ltd 242 7.12 Calculation of Chi-square value of SKNL 243 7.13 Analysis of Overhead Productivity Ratio in Mafatlal Industries Ltd 246 7.14 Calculation of Chi-square value of MFTL 246 7.15 Comparative analysis of overheads productivity 248 8.1 Analysis of overall Productivity Ratio in Siyaram Silk Mills Ltd 252 8.2 Calculation of Chi-square value of SSML 252 8.3 Analysis of overall Productivity Ratio in Digjam Ltd 255 8.4 Calculation of Chi-square value of DGL 255
8.5 Analysis of overall Productivity Ratio in Oswal Spinning & Wvg. Mills Ltd 257
8.6 Calculation of Chi-square value of OS&WML 258 8.7 Analysis of overall Productivity Ratio in Shri Dinesh Mills Ltd. 260 8.8 Calculation of Chi-square value OF SDML 261 8.9 Analysis of overall Productivity Ratio in Welspun India Ltd 263
8.10 Calculation of Chi-square value OF WIL 264

viii
8.11 Analysis of overall Productivity Ratio in S Kumars Nationwide Ltd 266 8.12 Calculation of Chi-square value of SKNL 267 8.13 Analysis of overall Productivity Ratio in Mafatlal Industries Ltd 269 8.14 Calculation of Chi-square value of MFTL 269 8.15 Comparative analysis of overall productivity 272
LIST OF GRAPHS
Graph No. TITLE OF THE GRAPH Page No. 4.1 Gross Profit Ratio 127 4.2 Operating profit Ratio 135 4.3 Net Profit Ratio 144 4.4 Earning Per Share Ratio 149 4.5 Return on Gross Capital Employed 159 4.6 Return on Net Capital Employed 162 4.7 Return on Net-Worth Ratio 171
LIST OF DIAGRAMS
Diagram No. Tittles of the Diagram Page No. 1.1 World Textile & Clothing Trade 6 4.1 Conversion of Operating Cycle 122

ix
LIST OF ABBREVIATIONS
AVE. AVERAGE C.V COEFFICIENT OF VARIANCE DGL DIGJAM LTD. EPS EARNING PER SHARE EBIT EARNING BEFORE INTEREST AND TAX EBT EARNING BEFORE TAX MFTL. MAFATLAL INDUSTRIES LTD MIN MINIMUM MAX MAXIMUM O S & W ML OSWAL SPINNING & WVG. MILLS LTD RNK RANK SDML SHRI DINESH MILLS LTD S K N L S KUMARS NATIONWIDE LTD SS M L SIYARAM SILK MILLS LTD S.D STANDARD DEVIATION VAL. VALUE WIL WELSPUN INDIA LTD

CHAPTER – 1
PROFILE OF TEXTILE INDUSTRY OF INDIA 1.1 History and Background
1.2 Colonization-An end of the Indian Textile
Industry
1.3 MFA Quota Removal and Indian Textile Exports
1.4 Overview of the Global Textile Market
1.5 Changing Shares in World Trade
1.6 Share in World Trade by Region
1.7 Indian Textile Industry – Present Scenario
1.8 Process of Globalization
1.9 Reforms Era: Re- Emergence of the Indian
Textile Industry
1.10 Present Situation in Indian Textile Industry
1.11 Vision for the Future
1.12 Introduction of Selected Units
I. Siyaram Silk Mills (SSML) II. Digjam Ltd.(DGL)
III. Oswal Spinning & Wvg. Mills Ltd. (OSWML)
IV. Shri Dinesh Mills Ltd. (SDML) V. Welspun India Ltd. (WIL)
VI. S.Kumar Nationalwide Ltd.(SKNL) VII. Mafatlal Industries Ltd. (MFTL)
References

CHAPTER – 2
CONCEPTUAL FRAMEWORK OF FINANCIAL
PERFORMANCE AND PRODUCTIVIT MANAGEMENT
2.1 Concept of Efficiency and Performance
2.2 Financial Performance
2.3 Concept of Efficiency
2.4 Operational Efficiency
2.5 Measurement of Performance
2.6 Concept of Performance Appraisal
2.7 Meaning of Performance Appraisal
2.8 Basis of Performance Appraisal
2.9 Objective of Performance Appraisal
2.10 Concept of Profitability
2.11 Profit and Profitability
2.12 Concept of Financial Efficiency
2.13 Measurement Tools of Profitability
2.14 Types of Performance
2.15 Concept of Productivity
2.16 Production and Productivity
2.17 Significant of Productivity
2.18 Relationships of Productivity with
Efficiency
2.19 Concept of Profitability Performance
2.20 Measurement Tools of Financial
Efficiency

2.21 Evaluation Methods
I. Ratio Analysis
II. Trend Analysis
III. Comparative Statement
Analysis
IV. Fund Flow Analysis
V. Other Techniques of Analysis
2.22 Significance of the Study
References

CHAPTER – 3 RESEARCH METHODOLOGY
3.1 Problem Identification
3.2 Survey of Existing Literature
3.3 Title of the Problem
3.4 Objectives of the Study
3.5 Hypothesis
3.6 Scope of the Study
3.7 Period of the Study
3.8 Data Collection and Data Analysis
3.9 (I) Tools of Analysis:
1. Output and Input Variable
Analysis
2. Ratio Analysis
3. Trend Analysis
(II) Statistical Tools
1. Chi-Square Test
2. Index Numbers
3. Arithmetic Mean
4. Standard Deviation
5. Co-efficient of Variation
3.10 Chapter Plan
3.11 Limitations of Study
References

CHAPTER – 4 ANALYSIS OF FINACIAL
EFFICIENCY
4.1 Concept of Financial Efficiency and
Performance
4.2 Financial Performance
4.3 Financial Efficiency
4.4 Operational Efficiency
4.5 Concept of Profitability
4.6 Profit and Profitability
4.7 Measurement Tools of Profitability
(I) Profitability Ratio in Relation to
Sales
1. Gross Profit Ratio
2. Operating Profit Ratio
3. Net Profit Ratio:
(II) Profitability In Relation to Capital
Employed:
1. Earning Per Equity Share
2. Return on Capital Employed
(i) Return on Gross Capital
Employed
(ii) Return on Net Capital
Employed
3. Return on Owners Equity
References

CHAPTER – 5 ANALYSIS OF MATERIAL
PRODUCTIVITY
5.1 Concept of Productivity
5.2 Productivity and Production
5.3 Productivity and Profitability
5.4 Partial Productivity and Overall Productivity
5.5 Measurement of Output
5.6 Measurement of Input
5.7 Productivity Accounting
5.8 Material Productivity
5.9 Computation of Material Productivity
5.10 Steps for Computation of Material
Productivity
5.11 Material Productivity Analysis of Selected
Companies
5.12 Conclusion
References

CHAPTER – 6
ANALYSIS OF LABOUR PRODUCTIVITY
6.1 Labour Productivity
6.2 Steps in Calculation for Labour Productivity
6.3 Hypothesis Based on Chi-square
6.4 Labour Productivity in Selected Companies
6.5 Comparative Analysis of Labour Productivity
References

CHAPTER – 7
ANALYSIS OF OVERHEADS PRODUCTIVITY
7.1 Overheads Productivity
7.2 Steps in Calculation for Overheads Productivity
7.3 Hypothesis Based on Chi-square
7.4 Overheads Productivity in Selected Companies
7.5 Comparative Analysis of Overheads
Productivity
References

CHAPTER – 8
ANALYSIS OF OVERALL PRODUCTIVITY
8.1 Overall Productivity 8.2 Steps in Calculation for Total Productivity
8.3 Hypothesis Based on Chi-square
8.4 Overall Productivity in Selected Companies
8.5 Comparative Analysis of Overall Productivity
References

CHAPTER – 9 SUMMARY, CONCLUSION AND SUGGESTIONS
9.1 Profile of the Textile Industry in India
9.2 Conceptual Framework of Financial Efficiency
and
Productivity Management
9.3 Research Methodology
9.4 Analysis of Financial Efficiency
9.5 Analysis of Material Productivity
9.6 Analysis of Labour Productivity
9.7 Analysis of Overheads Productivity
9.8 Analysis of Overall Productivity
9.9 Suggestions

A Study of Productivity and Financial Efficiency of Textile Industry of India
1
CHAPTER-1
PROFILE OF TEXTILE INDUSTRY
1.1 Historical Background
The Indian textile industry has a great legacy, which is perhaps
unmatched in the history of India’s industrial development. India’s textile
industry evolved and developed at a very early stage and its
manufacturing technology was amongst the best. Prior to colonization,
India’s manually operated textile machines were among the best in the
world, and served as a model for production of the first textile machines
in newly industrialized Britain and Germany.
Indian textiles were sought after for their finesse, quality and
design. According to Chouta-Kuan, the Chinese observer preference was
given to the Indian weaving for its and delicacy’ Prestige trade textiles
such as Patola from Patan and Ahmedabad, coast were sought after by the
Malaysian royalty and wealthy traders of the Philippines.
Textiles have historically formed an important component of
India’s exports. Marco Polo’s records show that Indian textiles used to be
exported to China and South-East Asia. Textiles have also comprised a
significant portion of the Portuguese trade with India. These included
embroidered bedspreads, wall hangings and quits of embroidered wild
silk on a cotton or jute ground.

A Study of Productivity and Financial Efficiency of Textile Industry of India
2
The attractiveness of the fast dyed, multi-colored Indian prints on
cotton (chintz) in Europe led to the formation of the London East India
Company in 1600, followed by Dutch and French counterparts. By the
late 1600s there was overwhelming demand for their governments to ban
the import of these cottons from India.
The legacy of the Indian textile industry stemmed from its wealth
in natural resources silk, cotton and jute. The textile industry stemmed
from its wealth in natural resources silk, cotton and jute, the technology
used was superior and the skills of the weavers gave the finished product
a most beautiful and ethnic look. The Indian textile industry with such a
great pedigree could have gone only on way from here. But same did not
happen.
1.2 Colonization - An End of the Indian Textile Legacy
Colonization put an end to India’s glorious textiles legacy. The
British knew that they could not compete with Indian textile industry and
as a result resorted to complete destruction of the industry. By 1880 the
domestic market had grown to be serviced solely by the British
manufacturers: India, once the world’s leading exporters of textiles, was
forced to become a net importer. Tariffs were kept out of the British
market.
One of the aspects of India’s freedom struggle, ked by Mahatma
Gandhi, was to weaken the British textile industry by wearing homespun

A Study of Productivity and Financial Efficiency of Textile Industry of India
3
clothes. Gandhiji was convinced that the textile sector could a catalyst in
advancement of the Indian population by creating employment for the
excess labour pool.
Post-independence, till about the late 1980s, the Government of
India put numerous policies and regulations in place to ensure that
mechanization did not occur and that labour-intensive textiles were
produced, large-scale production was discouraged by restrictions on total
capacity and mechanization of mills. The labour regulations did not allow
capital investment and resulted in high production costs. Imposition of
price restrictions, along with decreased productivity, severely hampered
the competitiveness of the sector.
Till 1985, the main concerns of Government policies were centered
on import substitution, protection of existing employment in the
organized sector and support for decentralized sector. These concerns
were reflected in the government policies such as imposition of quotas on
yarn export, strong exit barriers even for unviable operations, general
discouragement of automation, stringent licensing for organized sector
and price regulations to handle the shortages resulting froms the licensing
restrictions.
Restrictions of such nature only resulted in increasing costs,
declining productivity and loss of competitive edge. The textile industry

A Study of Productivity and Financial Efficiency of Textile Industry of India
4
had to be set free from these regulatory burdens so that it could evolve,
grow and remain competitive in the global market.
1.3 MFA Quota Removal and Indian Textile exports
Exports of garments from South Asian countries have been
preponderantly dependent on quotas. The quota system was fashioned by
industrialized countries under the MFA (Multi-Fibre Agreement) in 1974
as a temporary arrangement to protect their domestic garment industries
from the onslaught of cheap imports from low wage countries.
As a result of the quota restrictions, those Asian countries, which
had used up their quota, started establishing manufacturing platforms in
other Asian countries, which were not in a position to fully utilize the
available quota. Quota arrangements under MFA terminated in a phased
manner by the end of the year 2004.
While vanishing of quota restrictions supposedly frees up the
market for exporting countries to export garments without any
restrictions, there is a great deal of apprehension that the jobs and
incomes of a very large number of people in the garment industry would
be in jeopardy when the exporting countries, particularly with resource
endowment, textile and clothing tradition and efficient manufacturing
base, jostle for market share. The world garment industry is on the
threshold of far reaching institutional changes in the near future. Hitherto,
despite being one of the most globalized industries in the world, it has

A Study of Productivity and Financial Efficiency of Textile Industry of India
5
also been an example of how trade practices in a ‘globalizing’ world are
still distorted in favour of advanced economies. Over the past three to
four decades, trade restrictions, price and quantitative, have come to play
a major role in conditioning patterns of the sector’s development.
The garment sector has been conventionally viewed as a major
source of employment generation. Of late, in addition to this dimension,
following the success of the East Asian economies low skill requirements
and large labor absorption potential have made it an important source of
non-agrarian employment for the rural populace of these regions.
To add, the garment sector is also seen to offer tremendous
prospects for employment of women, unlike other traditional
manufacturing sectors. Given these factors, it is of great importance to
understand the labor market implications of the changes in the
international trade regime
1.4 Overview of the Global Textile Market
“The end of the quota regime, which marks the phasing out of the
MFA from January 1, 2005, has ushered a new phase of l\global
opportunity for the Textile & Clothing Sector. The removal of quotas
could witness the World Trade in Textile, which is at present US $ 395
billion to surge to over US $ 650 billion by 2010. The expected future
CAGR is expected to be 8% with Textiles Accounting for 5.8% and
Clothing being the real driver of growth with an expected CAGR of

A Study of Productivity and Financial Efficiency of Textile Industry of India
6
9.6%. Hence, there lies a distinct opportunities for countries possessing
competitive advantages resulting from labour, technology, and raw
materials, rather than for those arising from favourable trade agreements.
Diagrma- 1.1
World Textile & Clothing Trade”1
1.5 Changing Shares in World Trade
World trade in textiles and clothing amounted to US $ 395 billion
in 2003, of which textiles accounted for 43% and clothing around 57%.
Developed countries accounted for little over one-third of world exports
in textile and clothing in 2002 with developing countries contributing to
the remaining two-thirds. The scene was completely opposite in 1990
with the share of developed countries amounting to 52% and that of
developing countries around 48%. In other words, in the period from

A Study of Productivity and Financial Efficiency of Textile Industry of India
7
1990 to 2002, there has been a shift in worked textiles and clothing trade
from developed to developing countries.
Table-1.1
Percentage share in total world exports of Textile & clothing
% share in 1990 % share in 2002
World Exports 100.0 100.0
Developed Countries 52.2 37.8
Developing Countries 47.8 62.2
Source: Computed from data available with International Textiles and
clothing Bureau (ITCB), Geneva 2
1.6 Share in World Trade by Region
The transition period, starting from 1995, has seen an increase in
the share of Asia’s exports to the world in textiles rather than clothing.
The share of Asia in textile exports rose from 42.6% in 1995 to 44.3% in
2003, while its share in clothing exports has remained stagnant at around
44%. Western Europe has seen a decline in share in both textile and
clothing exports in the transition period. On the other hand North
American textile exports have risen from 5.7% in 1995 to 7.8% in 2003
and fallen slightly I clothing exports, from 4.8% to 3.3% in 2003.

A Study of Productivity and Financial Efficiency of Textile Industry of India
8
Table-1.2
Textile and Clothing Exports by Select Region (%)
Regions Textiles Clothing
Asia
Western Europe
North America
1995
42.6
44.5
5.7
2003
44.3
39.3
7.8
1995
44.4
36.0
4.8
2003
44.7
32.1
3.3
Source: International Trade Statistics, 2004, WTO3
Trade in textile and clothing was dominated by the developed
countries in the MFA period with the European Union (15) accounting
for about 49% of total textile exports and 42% of clothing exports in
1980. EU, USA, Canada, Japan and Switzerland accounted for 69% of
total textile exports in 1980. Developed countries dominance in clothing
exports was relatively less with USA and EU together accounting for
around 45% of total exports in 1980. However, developed countries share
in both textiles and clothing exports declined in the 90s and stood at
around 47% and 28% respectively, in 2002.
The decline in the share of developed countries was driven by a
sharp decline in the share of EU, in both textile and clothing exports.
Leading exports amongst the developing countries, as per WTO

A Study of Productivity and Financial Efficiency of Textile Industry of India
9
categorization, on the other hand have increased their individual shares
during the MFA period, with China in the lead. Developing countries’
share in textile exports has increased from 17.3% in 1980 to 41.9% in
2003, while in clothing it has increased from 16.4% to almost 46.1%
during the same period. China has increased its share in textile exports
from 4.6% in 1980 to 15.9% in 2003 and an increase from 4% to 23% in
clothing exports during the same period. However, while in textiles there
has undoubtedly been a shift away from developing countries, with gains
accruing to MFA constrained countries, in clothing the gains have mainly
accrued to ‘preferred’ developing countries. The countries that have
gained share in clothing exports are the ones who are a party to some kind
of policy-induced preferential arrangement with the restricted markets,
viz., USA EU and Canada. Countries like Tunisia, Turkey, Mexico,
Romania and Dominican Republic are cases in point, since not only do
these countries form a part of the ‘preferred’ group of exporters but also
feature amongst the leading exporters of clothing.
1.7 Indian Textile Industry – Present Scenario
The Indian Textile Industry is a vertically integrated industry
which covers a large gamut of activities ranging from production of its
own raw material namely, cotton, jute, silk and wool to providing to the
consumers high value added products such as fabrics and garments. India
also produces large varieties of synthetic and man made fibres such as

A Study of Productivity and Financial Efficiency of Textile Industry of India
10
filament and spun yarns from polyester, viscose, nylon and acrylic which
are used to manufacture fabric and garments.
“The textile sector plays a significant role in Indian economy by
contributing to the Gross Domestic product, generating employment and
earning foreign exchange. An estimated 35 million people are directly
employed in the Indian Textile Industry, which contributes to 4% of GDP
and 21% of total export earnings.”4
India is globally a significant player in the textile sector and is
globally the
• Third largest producer of cotton and cellulose fibre/yarn.
• Second largest producer of cotton yarn.
• Largest producer of jute, second largest producer of silk.
• Fifth largest producer of synthetic fibre/yarn.
“Cotton is one of the major corps cultivated in India. India has the
largest cotton acreage in the world and cotton is the dominant fibre in
Indian Textile Industry. About 75% of the total yarn and about 56% of
the total fabric produced in India was cotton in 2004-05. Almost all
cotton used in India is grown locally and a tiny amount is imported.
Cotton textiles account for 2/3rd of India’s textile exports”5
“During the last five decades, the production of cotton in India
increased from 30 lakh bales of 170 kgs each in 1950-51 to an estimated

A Study of Productivity and Financial Efficiency of Textile Industry of India
11
213 lakh bales (170 kg each) in 2004-05. There has also been a rise in
area under cultivation from 58.9 lakh hectres in 1950-51 to an estimated
89.7 lakh hectres in 2004-2004.”6
1.8 Process of Globalization
The characteristics of garment production like low sunk costs and
relative absence of advanced technology and skills, have always induced
apparel firms in the advanced capitalist countries to shift labour intensive
operations to peripheral economies. Studies supportive of the ‘New
International Division of Labour’ hypothesis, in fact, view the process of
globalization as a movement from high wage cost region to low wage
cost ones.
This process has its origins in the 1950s when manufacturers began
to shift production to Japan to take advantage of the lower wages
prevailing there. This sourcing of garments from Japan with still lower
wage levels followed the earlier movement of US garment production
from the northern part of the country to the less unionized and lower
waged southern regions.
Subsequent to the economic boom in Japan during this period
accompanied by rise in wage rates, manufacturers began to shift
production to Hong Kong. From Hong Kong, capital migrated to South
Korea and Taiwan to tap the benefit from the lower wages prevalent in
those economies.

A Study of Productivity and Financial Efficiency of Textile Industry of India
12
The period thus witnessed a trend towards movement of Japanese
apparel capital to offshore locations like neighboring South Korea. The
1980s witnessed the incorporation of other Asian countries with relatively
low wage levels like China, Thailand, Indonesia, Sri Lanka, Pakistan,
India and Bangladesh into the world garment trade. Between 1975 and
1990, the share of ‘third world’ in the total output of global textiles has
increased from 18.6 percent to 26.1 percent, and that of clothing from
11.7 percent to 20.4 percent.
On the other hand, garment sector has become a growth pole for
economies at lower levels of development like Bangladesh, China, Sri
Lanka, Indonesia, India and Thailand.
As the leading sector of globalization, the garment industry
continues to increase its share in world trade fro manufactured
commodities. World garment trade has in fact grown faster than trade in
manufactured good as a whole. Accompanying this global expansion,
there have also been changes in the organization of production with
important implications for garment production in peripheral ecomomies.
1.9 Reforms Era: Re- Emergence of the Indian Textile Industry
The last decade has seen a progressive relaxation of regulatory
policies with a view to increase the efficiency and competitiveness of the
industry. The textile policy of 1985 heralded a new beginning in the
history of the Indian textile industry. It accepted that the crisis in the

A Study of Productivity and Financial Efficiency of Textile Industry of India
13
industry were neither cyclical nor temporary but were rooted in deeper
structural weaknesses. It identified the main task of the textile industry as
industry as increase in production of cloth of acceptable quality at
reasonable prices to meet the clothing requirements of a growing
population. It identified the main task of the textile industry as increase in
production weaknesses. It identified the main task of the textile industry
as increase in production of cloth of acceptable quality at reasonable
prices to meet the clothing requirements of a growing population. It was
envisaged that this basic objectives would be met through cost
efficiencies and a freer play of market forces rather than through controls
and restrictions. Among other things, the Textile Policy of 1985
addressed the issues of raw material supply at reasonable and stable
prices, progressive reduction of duties on synthetic raw material, removal
of entry and exit barriers along with emphasis on technology
modernization and increasing the competitiveness of Indian textiles in the
international market.
The 1985 Textile Policy illustrated the government’s attempt to
relax the regulatory burden on the composite mill sector by elimination of
compartmentalization in the industry, lifting of restrictions on composite
mill loom capacity expansion and equalization of taxation among
composite mills, power loom and independent processing units.

A Study of Productivity and Financial Efficiency of Textile Industry of India
14
The ushering in of reforms in the 1990s provided a further boost to
the Indian textile industry. In line with the general policy of
liberalization, several measures were undertaken to reduce controls and
bring about greater transparency in the textile sector. The textile industry
was de-licensed as per the Statement of Industrial Policy 1991 and the
Textile Development and Regulation Order of 1992. Reforms on the
fiscal and external fronts were also pursued with renewed zeal.
Those measures liberated the Indian textile industries from the
shackles of regulation that were in place up to the late 80s.These steps
were only a beginning in ensuring that the different segments of the
textile industry become competitive in the wake of liberalization.
1.10 Present Situation in Indian Textile Industry
Fashions have always influenced creation of demand in this
industry, especially after the rise of retailers; control of the commodity
chain. Given their closeness and greater understanding of the market than
manufacturers, these traders sought to compete through market
innovations like new designs and fashion marketing rather than through
cost reductions by innovations in production techniques. Here again,
there are differences across various segments. Women and children’s ear
is subject to more fashion based design changes as compared to men’s
wear.

A Study of Productivity and Financial Efficiency of Textile Industry of India
15
Further, socio-economics and related cultural changes have created a
general trend in clothing towards more informal and casual wear since the
1970s. Consumption based identities have begun to play a bigger role in
market niches. All these factors have led to the rise of distinct segments
in the apparel market.
1. vibrant and growing up market fashion segment and
2. a relatively stagnant, low priced and standardized segment.
The former market is highly volatile and is characterized by short
production runs, fast changing fashions and designs, aggressive
marketing and higher mark-ups. In response to market instability, firms
target smaller, more rapidly changing market niches, which require quick
alteration of product designs. Here, cost advantages do not matter as
much as in the mass-market segment. More important is the ‘quick
response’ factor (QR), the ability to deliver in time and adjust production
to changing designs and quantities.
In other words, ‘flexibility’ becomes an essential characteristic of
production for this segment. Thus, the cost advantage gained in
dispersing production to low wage areas tends to be offset by slowness in
supply response. Production in distant locations is not further, the quality
requirements of the fabric meant for such up-market garment production
necessitates confinement of production to countries with better processing
technologies. Nevertheless, garments of certain segments that are

A Study of Productivity and Financial Efficiency of Textile Industry of India
16
relatively less intensely driven by fashion and requiring lesser quality
may continue to be sourced from distant regions.
Textiles and Clothing Industry, contributing 35% of India’s total
export earnings and one of its largest sectors in terms of output and
employment generation, is aggressively modernizing and expanding its
capacities. India’s share of the $560-billion world textile and apparel
market is likely to double and reach a target of $50 billion a year by 2010.
India’s edge of its low cost & skilled labor, raw materials and excellent
designing skills are offset by factors like intense competition from china,
higher power generating cost, relative interest cost, structural anomalies
and low productivity levels. India]s multiple resource based advantages in
cotton, silk, wool and manmade fibers in addition to capacity based
advantages in the textile spinning and weaving is counteracted by the
deficiencies of erratic supply of power and water, inadequacies in road
connectivity, port facilities and other export infrastructure added to highly
fragmented supply chain beset with bottlenecks. Garments Industry in
India, concentrated in the small-scale sector till few years back, is now
having large-scale units such as Reliance, Arvind Mills, Raymond’s, etc.
the Industry is concentrated in a few clusters viz. Tiruppur, Delhi,
Mumbai, Bangalore, Ludhiyana, etc. It has a unique advantage of being a
vertically integrated one from Fiber to Garment. Easy availability of raw
materials, natural or synthetic fibers, world-class facilities in producing

A Study of Productivity and Financial Efficiency of Textile Industry of India
17
synthetics filament yarn is the strengths. Indian Garment Industry has a
significant presence in low value added items but is yet to make a mark in
the high value added segments. The industry is not fully automated and
the products are of low quality. The industry being concentrated in the
small-scale sector, they are not equipped to produce on a mass scale and
meet the changing fashion trends the world over. The industry has to
reduce the lead time required to bring its merchandise to the final
consumer. Adopting latest techniques such as effective supply chain
management, e-commerce, etc. and diversifying and expanding its
product range to include high value added items can make it competitive.
The garment industry is increasingly being governed by ecological
concerns. India’s growing, sophisticated and increasingly fashion
conscious middle class forms a base for huge domestic demand
presenting an opportunity to the garment producers to tap this market.
However, there are many international brands that are waiting to have a
share in the garment pie. The Indian units have to compete with these
international brands on domestic turf. With the advent of Business
Process Outsourcing, there is an outsourcing wave in the textiles and
garment industry. The big retailers in the US and elsewhere are looking at
ever possible opportunity to cut their costs and are out sourcing their
activities to India. World’s leading garment retailers such as Wal-Mart,
JC Penny and Gap are sourcing their garment requirements from India.

A Study of Productivity and Financial Efficiency of Textile Industry of India
18
The retailers do not want to source from China alone. In the Post-MFA
era, India needs to increase to the scale of production, improve the skill
level, improve transportation and communications infrastructure, and
adapt technology to improve the efficiency and productivity of the
companies. India’s ministry of textiles is planning to help build 25
integrated textile parks within two years to support domestic
manufacturers’ bid to take full advantage of post-quota trading. This and
other institutional support could give a big fillip to this sector.
Indian companies were planning to invest INR300bn ($6.8bn) over
the next two years to upgrade their facilities, to close the gap with China.
A new Kurt Salmon Associates Technopak study estimates that the Indian
textiles sector needs at least $15bn of investment throughout the textile
chain. Indian Ministry of Textiles said that labour laws are restricting the
sector and that changes could increase the scale of the industry and allows
it to take on the large orders that make up 60% of global trade. The
ministry wants to allow contract employment, to help producers cater for
seasonal demand, as well as an increase in the working hours from 48 to
60 week, with overtime benefits. The whole industry is technologically
backward, as a major share of the market is controlled SSI industries,
which in turn affects the quality and productivity of the sector. The
Government of India (GOI) encourages the Indian textile industry to
upgrade its manufacturing technologies to remain globally competitive.
A Study of Productivity and Financial Efficiency of Textile Industry of India
19
In an effort to encourage textile and apparel manufacturers to invest in
modernizing their plants, the GOI realized the need to establish a focused
and time-bound Rs 250bn Technology Up-gradation Fund (TUF) under
the National Textile Policy 2000. Through TUF, the government offers an
interest subsidy of up to 5 percent. In addition, the GOL offers incentives
such as import duty waivers for the import of production machinery
under its Export Promotion Capital Goods (EPCG).
Another important but a delicate problem India hasto tackle is to
restructure the industry without affecting seriously the majority players,
the majority players, the handloom sector, who has contributed to the
industry in a very big way. The informal sector, covering a wide spectrum
of home-based production and cottage and small industries in India, has
emerged as a dynamic and vibrant sector of the Indian economy. The
sector contributes around 40 percent of the gross industrial value added to
the Indian economy. It has made a commendable contribution of 40
percent in industrial production, 35 percent in direct exports, 45 percent
in overall exports and 80 percent in industrial employment. Through over
32 lakh units, the sector provides employment to about 18 million people.
In a labour-abundant and capital-scarce country like India, with mounting
problem of unemployment, the growth and development of the small and
informal sector deserves utmost importance. Besides emerging as the
engine of growth for Indian economy, the sector helps to achieve

A Study of Productivity and Financial Efficiency of Textile Industry of India
20
important objectives like employment generation, more equitable
distribution of income, industrial dispersal, optimum utilization and
exploitation of local resources and capital and fostering entrepreneurship.
These sectors and associated entrepreneurs need institutional support for
technology up-gradation, infrastructure support for market penetration,
and adequate working capital finance from the banking sector. There is
also a need for small entrepreneurs to keep pace with the structural and
technological changes taking place in large industries. They should be in
a position to adjust so as to act as service providers as many larger
companies are keen on outsourcing, sub-contracting and ancillarisation of
a number of job works/products manufactured by corporate. For the
development of this sector there needs to be a major thrust on technology
intervention in clusters which offers the small units an opportunity and
easier access to get acquainted with new technologies.
Since 1990, while India’s exports have grown from about US$5
billion to US$17 billion, China’s exports have grown from US$ 18 billion
to about US$ 60 billion. China’s exports also consist of more value added
products (80 percent is apparel and made-ups as compared to about 50
per cent for India) and are less quota dependent in comparison to India.
India should increase value addition and creating brands that would
increase the value of our exports and create a unique positioning for
India’s products rather than competing only on a cost basis. The price

A Study of Productivity and Financial Efficiency of Textile Industry of India
21
points for Calvin Klein collection is about ten times the regular brands.
And compare this to the cost of production of a shirt in India(less than
half of the price of regular brands in the $10-20 range) and it is clear that
the value of creating brands overshadows everything else in this industry.
If the rising crude oil prices continue to upsurge to over $80 a
barrel, these will add to the already rising input costs to make its global
export trade virtually uncompetitive. Transaction costs in case of textile
exports which at present ranges over 10% will further go up with rising
crude oil prices. The textile sector has not even received 1.5% of total
FDI that India attracted in the last 10 years due to the inefficient
operational costs incurred by Indian industry as compared to China and
other similar competitors.
An inflexible labor policy and low application of Information
technology are other issues ailing the industry. In textile industry
information technology helps impart better quality, improved
productivity, and savings in spare parts ordering and even in tackling
absenteeism effectively. In items of mass customization, resource
optimization, data warehousing, trade methodology and communication
infrastructure to maintain its competitiveness textile industry is no
exception to the general trend. The Indian textile industry today is faced
with an urgent need to modernize its designing and manufacturing
technique and make it viable and globally competitive. Application of IT

A Study of Productivity and Financial Efficiency of Textile Industry of India
22
in textile spinning is by its use in the ring frame department, the most
important departments in a spinning mill as it consumes about 60% of the
overall conversion cost associated with the production. In weaving,
computer Aided Design is very crucial. Computer Aided Mgt. and role of
IT in garment manufacturing in the areas of pattern making and grading
are crucial too. The importance of IT in documentation and
standardization of MIS in running an organization is as crucial to textile
industry as for any other industry today.
According to DK Nair, Secretary General of the Confederation of
Indian Textile Federation, with the removal of quotas by the WTO the
entire textile industry is going to become an Asian industry by 2010
because the west cannot sustain such a labour intensive industry.
Infrastructure and other regulatory support apart, the Indian Garment
Industry at the crossroads now, with the only option for survival being-
scaling up and re-inventing it to take on the world competition and make
the label ”Made in India” sell.
1.10 Vision for the Future
Given the opportunities arising out of the removal of quotas for
expansion of trade, India with advantages of a large fibre base, spinning
and weaving capacity, low cost skilled/semi skilled workforce, pool of

A Study of Productivity and Financial Efficiency of Textile Industry of India
23
technical and management manpower is ideally placed to reap the
advantages of free trade.
The Government and Industry have recently evolved a vision for
the year 2010 for her textile sector aimed at:
• increasing growth of the textile economy from the current US$ 36
billion to US$ 85 billion
• Creation of 12 million new jobs
• Increase India’s share in world trade from the current 4% to 8%
• Achieve export value of US$ 50 billion
• Modernization and consolidation for creating a globally
competitive industry
The above targets by all accounts are highly ambitious and many
analysts and consultants have opined that given the massive scale of
investments required to achieve an export target of US$ 50 billion
(135000 crores). This in itself means that textiles and clothing exports are
expected to more than double (from the current levels of US$ 17 billion)
by the year 2010.
While the extent of growth in textile/clothing exports likely to be
achieved can be debated endlessly, it is important to note that many
textile companies are at present bullish and markets have also reacted
positively to this sentiment as reflected in the rising value of the textile
stocks.

A Study of Productivity and Financial Efficiency of Textile Industry of India
24
Given the multiplicity of factors determining the outcomes of
global integration, the outcomes cannot be, however, predicted with a
great degree of certainty. Irrespective of the possible trajectories that the
sector may assume, the immediate impact of quota removal on labour is
likely to be negative.
It is generally recognized that the removal of quota restrictions
would lead to an expansion of export markets for Indian garment
producers. On the other hand, the lower labour productivity of Indian
labour, as compared to some of its competing nations like China,
Indonesia and Bangladesh, may threaten India’s competitiveness and
hence lead to a decline in exports.
Since India seemingly has an edge in the semi-fashion segment
where economies of scope rather than scale matter, it is possible that they
may continue to retain or expand their shares in such markets. However,
respondents from the industry and other secondary sources do indicate an
anticipated threat from China even in this segment.
One require a spread to the mass market, through improved
productivity, ensuring of scale economies by movement to large-scale
production, installation of productivity enhancing techniques, etc.
Given the presence of a domestic base in cotton, a movement to the
large-scale sector would definitely (Except for the knitwear sector, which

A Study of Productivity and Financial Efficiency of Textile Industry of India
25
continues to operate in small-scale sector) benefit producers to compete
in this segment.
India has a greater comparative advantage vis-à-vis some of its
main competing economies in specific product categories. Targeting
these specific niches and seeking to build competitiveness in these
segments and to move up the value chain may therefore be a better
competitive strategy.
The strategy involves higher marketing and selling efforts apart
from considerations of quality and timeliness of delivery. This would
involve creation of new institutions by the state that would enable
producers to compete ‘actively’ as opposed to ‘passive’ competition
based on lowering of wage costs.
Improvements in process and manufacturing techniques require
installation of new machinery that warrants access to institutional credit,
which is at present difficult to access for most firms in the apparel sector
given their confinement to the ‘unorganized’ sector, in the global
commodity chain, given the lack of access to high-fashion markets,
producers may continue to face disadvantages.
However, as borne out by the experience of East Asian economies
like Hong Kong, Korea and Taiwan, movement along the value chain and
backward integration is feasible to an extent. A closer understanding of

A Study of Productivity and Financial Efficiency of Textile Industry of India
26
the experiences of these economies may offer valuable lessons for South
Asian garment exporters.
Diversification of output markets into new geographical regions
would be another key component of strategy. Another complementary
strategy to overcome this hurdle to enable the labour to retain or improve
their incomes would involve expansion of the domestic market and
competition in the domestic market through design and fashion.
Expertise built in the domestic market may serve to built
competitiveness in the global premium segments.
Introduction to Selected Units
Siyaram Silk Mills (SSML)
Incorporated in June'78 as a private limited company, Siyaram Silk
Mills (SSML) was converted into a public limited company in 1980. The
company belongs to the Siyaram-Poddar group. Other group companies
are Balkrishna Industries and Govind Rubber. Siyaram Finance is
SSML's subsidiary. The company manufactures and markets textiles,
cotton, woollen synthetics and synthetic blends, etc. The main product of
SSML is polyester blended worsted fabrics. In Jul.'93, SSML came out
with a Rs 15.37-cr rights issue of 18% PCDs to part-finance the Rs 16.56
cr expansion-cum-modernization project. In 1998-99, the company
installed 4 Sulzer Looms at Silvassa and 8 Dornier Looms at Tarapur
Plants at a total cost of Rs 232 Lacs. During 2000-01 the company has

A Study of Productivity and Financial Efficiency of Textile Industry of India
27
installed 16 Air Jet Looms along with the other preparatory machines at
its silvassa plant. The total cost of the project is Rs.35 crores and this has
been partly financed by bank and balance through internal accruals of the
company. The balance 24 looms has commenced its commercial
production in 2002-03.
DIGJAM LTD.(DGL)
Digjam incorporated in 1948, is one of the leading players in
clothing and fashion industry. Being part of S K Birla Group Company, it
was earlier known as Birla VXL (BVL). Later in May, 2008 the name
was changed to present one.It is a leading textile company in India,
manufacturer of fabrics for suiting and ready-to-wear clothing under its
own brands.The company has received ISO 9001 certification for its
quality management. Company has workforce of 1050 employees. The
company has corporate clientele namely Aditya Birla Nuvo, Castrol
India, ICICI, ITC, Mysore Cement, SAIL, Shopper Stop, HPCL are
among others.
Manufacturing Facility
Company plant is located at Jamnagar is spread across on an area
of 47 acres. It is well-equipped with state-of-the-art machinery imported
from France, Germany, Switzerland and Italy. It is fully integrated plant
that converts wool tops to finished fabrics through different processes of

A Study of Productivity and Financial Efficiency of Textile Industry of India
28
Dyeing, Spinning, Weaving and Finishing.It has production capacity of
over 5 million meters. Out of this, only 35%-40% (approximately) is
exported to major countries across the globe.Annually, the company
manufactures over 3000 design-shade combinations each year in Light
Wool, Polyester Wool and Woolen fabrics and markets its under the
brand name “DIGJAM”.
Awards
Digjam has received status 'ACCREDITED MILL by LYCRA
ASSURED Network.
The company has also received export house certification for
excellence in its export performance. For four consecutive years,
DIGJAM Limited has received the highest Exporter Award, in the
woolen worsted category, from the export Promotion Council, a Govt. of
India Undertaking.
Outlook
Digjam has a tie up with Holland & Sherry, a Scotland based fabric
maker for retailing its exclusive range in the Indian market. The company
is planning to expand its ready-to-wear (RTW) range that would be
available across India through a chain of select showrooms
Oswal Spinning & Wvg. Mills LTd. (OS&WML)
In 1955, the company was originally incorporated under the name
of Oswal Cotton Spinning and Weaving Mills Ltd. on 19th September,

A Study of Productivity and Financial Efficiency of Textile Industry of India
29
under Indian Companies Act, 1913 and obtained certificate for
Commencement of business on 19th September, 1955 from Registrar of
Companies Punjab at Jalandhar. The name of the company changed to
Oswal Spinning & Weaving Mills Ltd. and a fresh certificate of
incorporation was obtained on 26th February 1965.The main objective of
the company is to manufacture of textile, Vanaspati, Ghee and Alloy
Steel Casting. Originally the company commenced its business with the
manufacture of woolen and worsted yarn. The company was promoted by
Mr. Dharam Paul Oswal and M. RajPaul Oswal under the able guidance
of late Mr. Lachman Dass Oswal. 1972 - With a view to diversification
set up a vanaspati ghee unit with a capacity of 25 tpd. The Company
further diversified its activities by setting up steel casting unit in 1986
with a licensed capacity of 8000 tpa.1990 - The Company undertook to
expand and modernize its vanaspati ghee unit by increasing its capacity to
50tpd. As a measure of backward integration to its vanaspati unit, the
company also undertook to set up a solvent extraction unit at its existing
site Jugiana, Dist. Ludhiana. The company retained services of M/s.
Deepak Glycerides (I) Pvt. Ltd., Ghaziabad for carrying out detailed
study of the additions and alterations required for increasing the capacity
of Vanaspati as well as carry out modernization. Orders were placed with
Desmet Chemfood Engineers (P) Ltd. for supply of solvent Extraction
plant on turnkey basis. The company issued 1, 37,500-14% FCD of Rs.

A Study of Productivity and Financial Efficiency of Textile Industry of India
30
200 each on rights basis in proportion 1 deb: 10 equity shares held.
Additional 20625 debentures were allotted to retain oversubscription.
Another 2, 46,880 debentures were issued through the Prospectus of
which the following were reserved for allotment on a preferential basis:
(1) 19219 debts to employees;
(2) 25000 debts to SBI capital markets Ltd.
(3) 25000 debts to LIC Mutual fund;
(4) 25000 debts to Canara Bank Mutual fund;
(5) 25000 debs to UTI.
Balance 1, 27,661 debs. issued to the Public. Additional 37,030
debentures were allotted to retain subscription. Rs. 100 of the face value
of each debenture was converted into 5 equity shares of Rs. 10 each at a
premium of Rs. 10 each after 6 months from the date of allotment of
debentures. 13,75,000 No. of equity shares issued, subscribed and paid-
up.The company issued through a prospectus 44,20350 No. of equity
shares allotted on conversion of debentures. During 1993/94, 8693,025
rights equity shares were issued Prop. 3:2, Pre. Rs. 8) per share. 1993 -
The company undertook to set up a 100% EOU cotton spinning unit with
a capacity of 18144 spindles at Doraha, Dist. Ludhiana. The company
also undertook forward integration to its alloy steel unit for manufacture
of ERW GI tubes with a capacity of 50tpd at village Jugiana. 1997 - The
turnover and profits of the 100% EOU cotton spinning unit were also

A Study of Productivity and Financial Efficiency of Textile Industry of India
31
affected due to abnormal hike in cotton prices and lower price
realisation for cotton yarn.
Shri Dinesh Mills Ltd.(SDML)
Shri Dinesh Mills Ltd. was incorporated on July1, 1935 at Baroda
as Maharani Woolen Mills and received the certificate of commencement
of business on February 17, 1936.Shri Dinesh Mills is a composite textile
mill with a very strong presence in the textile industry for more than 60
years; manufacturing worsted fabrics menswear), paper makers felts and
industrial textiles. They have scouring and combing plants, top dyeing,
worsted and woolen spinning, shuttle less weaving and complete fabric
inishing range for woolen, poly wool worsted and poly viscose fabrics.
Shri Dinesh Mills markets different products and its marketing set up is
divided for different product segments. At Shri Dinesh Mills Limited, it
has products for:- general consumers, menswear, industrial consumers --
paper maker's felt --industrial textiles Their definition for quality is 'As
perceived by customer'. They believe in up gradation of manufacturing
facilities, quality development and management process besides
development of human resources. The company fabrics go through a
series of hot and cold processes with the use of special detergents,
softeners and other specialty chemicals. These impart a permanent feel
and form to the fabric which will endure years of exposure to the
atmosphere and other factors like washing, abrasion, stretch, body sweat

A Study of Productivity and Financial Efficiency of Textile Industry of India
32
etc. Suiting Fabrics manufactured by it find their way to the consumers'
wardrobe via a network of multi brand outlets spread across the country
and also in form of ready made apparels from the fabrics supplied by it to
all major garmenters throughout the country and even abroad.
Product Range of the Company Includes:
• 100% Wool Worsted Fabrics
• 55% Polyester/45% Wool Worsted Fabrics
• 5% Polyester/35% Wool Worsted Fabrics
• Wool+lycra/55% Polyester/43% Wool/2% Lycra, other blends can
be offered on specific request
• Suiting Fabrics -Suiting Fabrics are an integral part of the fashion
industry To satisfy the demands of every discerning consumer, we
have a vast range of weaves like plains, twills, gabardines,
hopsack, barrathea, satins, herringbones and other fancy fabrics,
woven in vibrant colors which are inspired by every facet of the
universe from the sky to the seas, the forests, the mountains and
every awe-inspiring facet of mother earth.
For International market it has been manufacturing and exporting
worsted fabrics to various overseas markets since last 30 Years. It
maintains the highest standards of quality to meet the requirements of its

A Study of Productivity and Financial Efficiency of Textile Industry of India
33
discerning customers. It is exporting its products to various countries /
continents i.e USA, Canada, Australia, Europe, Middle East & Far East
countries.
Welspun India Ltd.(WIL)
Welspun India Ltd. (WIL) a Welspun Group company, started its
activities in 1985 as Welspun Winilon Silk Mills Pvt. Ltd, a synthetic
yarn business which went on to become Welspun Polyesters (India) Ltd.
and finally, Welspun India Limited emerged in the year 1995. The
company offers a variety of products like towels in different sizes and
qualities, bed linen using state of the art technology and the best quality
of Egyptian cotton. Launched organic products utilizing the benefits of
Soya, seaweed, milk and bamboo. WIL is Asia’s largest and amongst the
top 4 Terry Towel producers in the World. Its business is spread across
continents and a distribution network in 32 countries, like USA, UK,
Canada, Australia, Italy, Sweden and France. 94% of the total products
are Exported.The Company is the preferred supplier to 14 out of top 20
retailers in the world. It endeavors to reach the leadership position in each
segment / sector of its product / service. The company is committed to
satisfy its customers by providing such quality product / service, which
gives highest value for money. Welspun believes that employees are its
most important asset through which it can reach the top in each category

A Study of Productivity and Financial Efficiency of Textile Industry of India
34
of its product / service. Therefore, the company will emphasize on their
continuous improvement through up gradation of relevant knowledge and
training.Welspun Terry Towels with the inexhaustible range and the
claim to produce the softest towels, are engineered to the requirements of
the consumer. Highly absorbent and long lasting towels are produced in a
range of colors, which state to defy imagination. Today WIL is a $400
million company with manufacturing facilities in the US, UK, India,
Mexico and Portugal, which is expected to become a $1 billion company
by the year 2010.
Product Range of the Company Includes:
• Bath -Embroidered Towels -Sublistatic -Stripes -Bathrobe
• Bed -Bed Linen
• Rug -Embroidered Towels -Sublistatic -Stripes
• Top of Bed -Embroidered Towels -Sublistatic
Achievements/ recognition:
• 2008 Supplier of the Year
• 2008 Indian Exporters Excellence Awards
• 2008 Earth Care Awards – (1st Runner Up - Greenhouse Gas
Mitigation)
• 2007 Sustainability Award

A Study of Productivity and Financial Efficiency of Textile Industry of India
35
• 2007 4 Gold Trophies for Outstanding Textile Exports
• 2007 International Trade Awards - Outstanding Textile Exporter
• 2006 Gold & Silver Trophies for the year 2005- 06
• 2005 Gold Trophy for Outstanding export Performance in Made-
ups
• 2004 Leaders in Innovation And many more
Certifications:
• ISO 9001
• ISO 14001
• OEKOTEX, SWISS
• SUPIMA
• EGYPT LOGO
• EGYPT CERTIFICATE
Future Plans:
Welspun India envisions to become a fully integrated home textile
company (Bed and Bath) – from cotton farming to retailing by the year
2010 with the largest market capital in India and to be among the top
three Home textile companies in the world.

A Study of Productivity and Financial Efficiency of Textile Industry of India
36
S. Kumar Nationwide Ltd.(SKNL)
S. Kumar Nationwide (SKNL) is one of the leading textile and
Apparel Company in India. The company is focused on three business
namely textile, apparels and home textiles. When Mr. Nitin Kasliwal took
over his family textile business, he brought his vision in reality through
setting up SKNL.Currently the company owns 4 state of the art
manufacturing units located at Mysore (Karnataka) and dewas (Madhya
Pradesh). Collectively, it has a production capacity of 2, 00,000 meters of
high-quality fabrics each day. Two new plants at Bharuch, Gujarat for
Cotton have been recently established. SKNL plans to introduce yet
another facility, of the Ready-to-Wear SBU, near Bangalore to cater to
the international market. It has a distribution network of 30,000 outlets
and 300 dealers. Today the company has SKNL owns millionaire brands
like Reid & Taylor, Belmonte, S.Kumars, Carmichael house and
Stephens’s brothers. Reid & Taylor (India) is a subsidiary of SKNL.
Business Division
Fabrics- the Company manufactures range of textiles such as
school fabrics, industrial work wear fabrics, military uniform fabrics,
hospitality uniform fabrics and medical work fabrics. The company is
known for manufacturing of premium suiting clothes. Apparels- Under

A Study of Productivity and Financial Efficiency of Textile Industry of India
37
this the company manufactures a range of ready made garment
exclusively for men. Home Textiles- The company manufactures bed
linens, table linen, towels and furnishings.
Outlook
The company has acquired Leggiuno S.p.A, an Italian shirting
fabrics company.
Mafatlal Industries Ltd.(MFTL)
Mafatlal Industries Ltd., a flagship company of the Arvind Mafatlal
Group that has vertically integrated composite textile mills, was
incorporated in 1913 at Ahmadabad. The company is engaged in
manufacture of textiles and textile chemicals. The total capacity of the
two mills, located at Navsari (near Surat) and Nadiad (near Ahmadabad)
is 30 million meters per annum (85,000 meters per day). The mills are
equipped to do bleaching, dyeing, calico printing, mercerising,
calendaring, sanforising, anti-creasing and text rising. Mafatlal Industries
has been a leader in textiles for nearly 100 years. It has an installed
capacity of 100,000 spindles, 816 rotors and 492 looms and a capability
to process 60,000 meters of fabrics per day.Mafatlal Industries produces
some of the finest fabrics, in a count range of 12's to 105's, which are
exported to the most demanding buyers of Europe, UK, USA and Middle

A Study of Productivity and Financial Efficiency of Textile Industry of India
38
East.MIL produces a complete range of products in 100% cotton and in
polyester/ cotton blends, consisting of yarn dyed and piece dyed
shirting’s, poplins, bottom wear fabrics, cambric’s, fine lawns and voiles.
In addition to these, the mills also have the capacity to produce printed
voiles and dress materials.
Product Range of the Company Includes:
• Shirtings- It offers shirtings in multifarious designs and colours
with unique patterns of textures and weaves, which suit casual as
well as formal occasions.
• Prints.
• Voiles- the Company specialize in premium voiles. These voiles
are available in floral prints, solids, lenos and dobbies.
• Sleepwear- the Company caters to sleepwear products which hold
immense value for its superior quality and comfortable clothing,
namely, lawn, voiles, satins and flannels.
• Beachwear
• Bottom wear- the Company offers a range of chinos and twills in
100% cotton & blend with surface, elegantly styled and available
in two/ three folds and soft finish for you to enjoy a comfortable
and an eye-catching wear.

A Study of Productivity and Financial Efficiency of Textile Industry of India
39
• Kid swear- Mafatlals has always had great endeavors to delight
kids with bright colour schemes for woven’s and character prints
along with soft and smooth flannels, which are eco-friendly,
keeping in mind the comfort of the wearer.
• Specialty Products
Other Group Companies:
• Navin Flourine International Limited- the Largest integrated
Fluor chemicals complex in India, since 1967.
• Mafatlal Denim Limited- Mafatlal Industries Limited, India and
Burlington Industries, USA joined hands to form Mafatlal
Burlington Industries Limited. This joint venture company was
established for the manufacture and marketing of denim fabrics. In
April 2006, the Arvind Mafatlal Group - India acquired Burlington
Industries' equity in the joint venture and the company is now
called 'Mafatlal Denim Limited'.
• NOCIL Limited- NOCIL commenced its rubber chemicals
manufacturing operations in the year 1976; it offers a wide range of
rubber chemicals.
Milestones:
• 1905 First Textile mill set-up in Ahmadabad.

A Study of Productivity and Financial Efficiency of Textile Industry of India
40
• 1912 Old unit bought at Nadiad
• 1916 Bought Jaffer Ali Mill & renamed it as Surat Cotton Spinning
& Weaving Mills.
• 1919 Took over China Mill at Mumbai.
• 1958 Franchise retail shops opened for market Growth.
• 1962 New unit constructed at Nadiad.
• 1970 1980 - Consolidation of existing business.
• 1981 Set up direct distribution system.
• 1982 Set up 2 tier system (Wholesalers to semi-wholesalers).
• 1984 Tie-up with 'Total' for Technological up gradation
• Post 1990 focus on export of high-value products to European
markets and on HR initiatives for People
Development. Collaboration with Burlington; set- up state-of-the-
art denim manufacturing. Joint Venture with Grupo la Perla &
Silvia.
Achievements/ Recognition:
• Obtained ISO-9002 Certification in 1994.
• ISO 9000 and Oekotex certified.

A Study of Productivity and Financial Efficiency of Textile Industry of India
41
References:
1. Apparel expert promotion council,2004 “Industry Statistics”
2. International Textiles and clothing Bureau (ITCB), Geneva
3. International Trade Statistics, 2004, WTO
4. Ministry of Textiles Annual Report 2004-2005
5. Ministry of Textiles Website and Annual Report 2004-2005
6. Ministry of Textiles Annual Report 2004-2005
A Study of Productivity and Financial Efficiency of Textile Industry of India
42
Chapter 2 Conceptual Framework of Financial Efficiency and
Productivity Management 2.1 Concept of Efficiency and Performance
The word efficiency as defined by the Oxford dictionary states that:
"Efficiency is the accomplishment of or the ability to
accomplish a job with minimum expenditure of time and effort".1
It refers to the internal process that leads to output. It focuses on
the means to achieve the desired end. As expressed by Peter Drucker
"Doing the things the right way is Efficiency." This denotes the
fulfillment of the objective with minimum sacrifice of the available scarce
resource.
Fatless and speedy compliance to the process or system procedure is
a measure of efficiency. Providing a specified volume and quality of
service with the lowest level of resources capable of meeting that
specification, performance measures and or indicators are required. These
include measures of productivity, unit volume of service etc. These
measures help in minimizing of the resources in achieving the
organizational objectives i.e., things rightly.
Performance is the execution or accomplishment of work feats etc.
or a particular, action, deed or proceeding is refers as performance.2
However, the manner in which or the efficiency with which something
reacts or fulfils its intended purpose is defined as performance.
Performance may thus, mean different things to different businesses.
Success or failure in the economic sense is judged in relation to
expectations, return on invested capital and the objective of the
business concern.

A Study of Productivity and Financial Efficiency of Textile Industry of India
43
“In understanding the term performance, a clear distinction needs
to be drawn between Performance Measures and Performance Indicators.
Performance measures need to be based on cat evaluation of the causes
and effects of policy intervention whereas a performance indicator is less
precise and usually provides only intermediate measure of achievement”3
2.2 Financial Performance
Financial Performance is the blue print of the financial affairs
of a concern and reveals how a business has prospered under the
leadership of its management personnel performance of any
organization can always be judged in the lights of light of its
objectives and the main objective of a bank is to earn profit and to
enlarge profit by making the most efficient use of the resources
available to them. The Indian Public Sector did run with the object
of maximizing profits. They were making due contribution towards
the fulfillment of socio-economic objectives lay down by the
government and SEBI.
The financial performance of companies could be analyzed by a
composite index of not only quantifiable selected trends and ratios, an
analysis of the financial statements, a study of the cash flow and the
fund flow statements etc. but also qualitative factors like operational
efficiency and effectiveness and socio-economic development of the
country.
2.3 Concept of Efficiency
‘Efficiency’ is closely related to security of the working system of
a company as whole according to Sudha Nigam” Appraisal is a technique
to evaluate past, current and Projected Performance of a Concern.” 4 It is a
powerful applied tool to examine, to measure, to interpret to weigh
critically and draw outputs. Different specialist who examines the specific
problem with their company does appraisal. Appraisal can be divided into

A Study of Productivity and Financial Efficiency of Textile Industry of India
44
two Parts (I) internal (ii) external. According to Pitt Francis “Internal
efficiency of the company not only means making some of having
adequate human, Physical and Financial resources but seeing that they are
optimally employed.”5 Thus, the concept of efficiency means the
evaluation and performance of a concern included in the appraisal.
2.4 Operational Efficiency
Operational Efficiency of an organization is the ability utilizes its
available resources to the maximum extent Operational Efficiency
can be judged in the light of financial efficiency. It can be said that
neither profitability ratios turnover ratios by themselves provide
good indicators measure operational efficiency.
Operational Efficiency of a bank is associated with diverse
aspects such as operational cost effectiveness profitability,
customer services, priority sector lending, and deployment of
credit in rural and backward regions and mobilization of deposits.6
In short, it is said that it is the ability to utilize the available
resources in order to carry out operational activities of the aluminums
industry, which reveal its success failure in providing aluminum
products to its custom
2.5 Measurement of Performance
“Measurement is a process of mapping aspects of a domain into
other aspects of a range according to some rule of correspondence” While
according to Tripathi “Measurement is the assignment of numerals to
characteristics of objects, persons, states or events, accounting to rules.
What is measured is not the object, person, state or event itself but some
characteristics of it. When objects are counted for example we do not
measure the object itself but also its characteristics of being present. We
never measure people only by their age, height, weight or some other
characteristics.” 7 But we measure through their overall performance.

A Study of Productivity and Financial Efficiency of Textile Industry of India
45
While measuring the performance of the company the first
requirement is the thoughts and goals of human beings are mostly
realized through the establishment of diverse kinds of relevant
associations. The functions of all associations were established for
fulfillment of some goals and objectives. As an output point of view
Association needs measurement of performance to find out as to how
much the organization has achieved by its course of action towards its
goals or targets.
Financial Appraisal:
"Financial Appraisal is a scientific evaluation of profitability and
Financial Strength of any Business Concern". According to Kennedy and
Macmillan financial statement analysis attempt to unveil the meaning and
significance of the items composed in Profit and Loss account and
balance sheet So as to assist the Management in the formation of sound
operating Financial Policies".8
According to Accounting Point of view financial statements are
prepared by a business enterprise at the end of every financial year
"Financial Statements are end products of financial accounting". They are
capsulated periodical reports of financial and operating data accumulated
by a firm in its books of accounts - the General Ledger.
For proper interpretation of financial statement, users must have a
basic understanding of the conceptual framework and principles
underlying their preparation. Otherwise users will not recognize the limits
of financial statements. The financial statement analysis facilitates a
sufficient guideline about the behaviour of financial variables of
measuring the performance of different units in the Industry it also
facilitates to indicate the current scenario of improvement in the
organization.

A Study of Productivity and Financial Efficiency of Textile Industry of India
46
2.6 Concept of Performance Appraisal
"Performance Appraisal as a concept is purely a developmental tool
for a company. As a developmental tool, it is not merely the end product
or the final assessment. It is important as the whole process of appraisal.
The learning opportunity for the appraiser and the apprise starts with
setting of the tasks and targets. It manifests in the whole gamut of
appraisal procedure such as self appraisal, appraisal interviews final
appraisal, grading and developmental planning etc." 9
Performance appraisal is composed of two words “performance and
appraisal. Performance indicates how the management of an enterprise
has been accomplishing the goals, which they had set for the enterprise.
Performance is a measure of the degree to which an organization fulfills
its purpose. And the purpose is to achieve its objectives. To quote E.A.
Helfert, “The measurement of business performance is more complex and
difficult, since it must deal with the effectiveness with which capital is
employed, the efficiency and profitability of operations, and the value and
safety of the various claims against the business.” Appraisal refers to
critical review with a view to improving performance. It includes the act
to examine, to measure, to interpret and to draw conclusions.
Achievement involves an integrated use of human, financial and natural
resources. Erich L. Kohler refers to performance as “a general term
applied to a part or all of the conduct or activities of an organization over
a period of time- often with reference to past or projected costs,
efficiency, management responsibility, or the like.” However, appraisal
can be defined as a systemic procedure of drawing conclusions. Every
enterprise is assessed on the basis of its activities in the various areas.

A Study of Productivity and Financial Efficiency of Textile Industry of India
47
2.7 Meaning of Performance Appraisal
Performance appraisal may be defined as a critical assessment of
the various activities, in the different areas of operations, of an enterprise.
A periodical appraisal of the operations of an organization is essential for
financial strength and good profitability just like a regular checkup for
physical fitness. In the case of bad or deteriorating situation it indicates
the areas of improvements whereas in a good situation the way to
improvement in the performance of an organization to the maximum
extent. Thus performance appraisal is a process of evaluating the
efficiency and effectiveness of an organization.
2.8 Basis of Performance Appraisal
Performance appraisal involves a broad area of coverage. The
perspective throughout is on the effective management of company
resources. Performance appraisal can be done through a careful and
critical analysis of the financial statement of an enterprise. Usually the
financial statement of a business concern comprises two statements:
balance sheet or position statement and profit and loss account or income
statement. However, in big concerns two more statements are prepared.
They are profit and loss appropriation account and fund flow statement.
The overall performance of a business cannot be judge without a systemic
analysis and interpretation of its financial statements. The advantages of
such an analysis are as follows.
(i) The results based on a proper financial analysis are more scientific
and logical; hence there is less possibility of their being wrong.
(ii) Such decisions are not subjective. The complexities, depth,
interdependence and multi decision attitude of various modern
business activities are not easy to understand without a rational
approach or criticism.

A Study of Productivity and Financial Efficiency of Textile Industry of India
48
(iii) No doubt, experience is a good teacher, but the facts and decisions
taken on the basis of observation and experience can be rectified
only if they are supported with a proper financial analysis.
(iv) Such an analysis makes the information more understandable even
to a layman. Decisions based on it are more practical.
The following parties are deeply interested in a systemic and sound
financial analysis and interpretation:
1. Debenture holders in the company
2. Creditors, suppliers of raw materials and other parties who deal
with the company
3. Employee and trade unions
4. Economist and investment analysts
5. Existing and prospective investors
6. Customers who wish to enter into a long term agreement with the
company
7. Taxation authorities
8. Member of parliament, legislatures, the Public Accounts
Committee and various governmental committees and
commissions
9. Company Law Boards etc.
2.9 Objective of Performance Appraisal
(i) To find out the financial stability of a business concern
(ii) To assess its earning capacity
(iii) To estimate and evaluate its stock and fixed assets
(iv) To assess its capacity and ability to repay short and long term
loans
(v) To estimate and examine the possibilities of its future growth
(vi) To estimate the administrative efficiency of its management

A Study of Productivity and Financial Efficiency of Textile Industry of India
49
Performance appraisal is a close and a critical study of various
measures observed in the operation of Business Organization. The
concept of human body is similar to the concept and case of business
organization.
Human body requires medical check up and examination for maintaining
fitness of bodies, similarly the performance of a business organization has
got to be assessed periodically. Erich A. Helfert organization has got to
be assessed periodically. Erich A. Helfert started "The person analyzing
business performance has clearly in mind which tests should be applied
and for what specific reasons. One must define the view points to be
taken, the objectives of the analysis and possible Standard Comparison".
Business Organization have the "Balance Sheet" and the "Profit and Loss
Account" by the statements of change in financial position value added
statements are also prepared for annual reports. They may be considered
as additional financial statements. The data embodied in financial
statements are rearranged in order to facilitate the appraisal of
performance. The financial figures are approximated to the nearest rupee
to simplify the process of appraisal.
However no single attempt can give firm results of appraising the
performance of business organization. Business conditions differ
according to location, type of facilities, products and services, plant
capacity, capital structure, accounting policies, caliber of management
and levels of efficiency. Such conditions of business organizations have
become more complicated in the event of multi-product and multi
business organizations. All these differences are part and parcel at the
time of appraising the performance of a business organization.

A Study of Productivity and Financial Efficiency of Textile Industry of India
50
2.10 Concept of Profitability
Profitability is the ability to earn profit from all the activities of an
enterprise. It indicates how well management of an enterprise generates
earnings by using the resources at its disposal. In the other words the
ability to earn profit e.g. profitability, it is composed of two words profit
and ability. The word profit represents the absolute figure of profit but an
absolute figure alone does not give an exact ideas of the adequacy or
otherwise of increase or change in performance as shown in the financial
statement of the enterprise. The word ‘ability’ reflects the power of an
enterprise to earn profits, it is called earning performance. Earnings are
an essential requirement to continue the business. So we can say that a
healthy enterprise is that which has good profitability. According to
hermenson Edward and salmonson ‘profitability is the relationship of
income to some balance sheet measure which indicates the relative ability
to earn income on assets employed. 10
2.11 Profit and Profitability
Profits are the cream of the business without it may not serve the
purpose .it is true that “profits are the useful intermediate beam towards
which capital should be directed” 11 Weston and Brigham mentioned that
“ to the financial management profit is the test of efficiency and a
measure of control to the owners a measure of the worth of their
investment, to the creditors the margin of safety, to the government a
measure of taxable capacity and a basis of legislative action and the

A Study of Productivity and Financial Efficiency of Textile Industry of India
51
country profit is an index of economic progress national income
generated and the rise in the standard of living.” 12 While profitability is
an outcome of profit. In the other words no profit derived towards
profitability. “It may be remarked that the profit making ability might
denote a constant or improved or deteriorated stare of affairs during a
given period, thus, profit is an absolute connotation were as profitability
is a relative concepts.” 13 Profit and profitability are two different
concepts, although they are closely related and mutually independent,
playing distinct role in business. R.S.Kulshrestha mentioned that “profit
in two separate business concerns might be the same and yet more often
they note their profitability could differ when measured in terms of the
size of investment” 14 as outcome of above statement it can be said that
profitability is broader concept comparing to the concept of profit levels
of profitability helps in establishing quantitative relationship between
profit and level of investment or sales.
2.12 Concept of Financial Efficiency.
Financial efficiency is a measure of the organizations ability to
translate to its financial resources into mission related activities. Financial
efficacy is desirable in all organization of individual mission. It measures
the intensity with which a business uses it assets to generate gross
revenue and the effectiveness of producing, purchasing, pricing,
financing, and marketing decisions. At the micro level financial
efficiency refers to the efficiency with which resources are correctly
allocated among competing uses at a point of time. Financial efficiency is
a measure of how well an organization has managed certain trade of (risk
and return, liquidity and profitability) in the use of its financial efficiency.
Financial efficiency is regarded as a measure of total efficiency and a
management guide to greater efficiency and the extent of the profitability,

A Study of Productivity and Financial Efficiency of Textile Industry of India
52
liquidity, productivity and capital strength can be taken as a final proof of
a financial efficiency. Financial efficiency directed towards evaluating
the liquidity, stability, and profitability of a concern which put together of
a concern. The word efficiency as defined by the oxford dictionary states
that; efficiency is the accomplishment of or the ability to accomplish a
job with minimum expenditure of time and effort. As expressed by peter
ducker “doing the things the right way is efficiency”. This denotes the
fulfillment of the objective with minimum sacrifice of the available
scarce resource. Fatless and speedy compliance of the process or system
procedure is a measure of efficiency providing a specified volume and
quality of services with the lowest level of resources capable meeting that
specification, performance measures and or indicators are required. These
are including measures, productivity, unit of volume of service etc.
2.13 Measurement Tools of Profitability
For making policy decision under different situations,
measurement of profitability is essential. According to Murthy V.S. “The
most important measurement of profitability of a company is ratio. E.g.
profitability of assets, variously referred to as earning power of the
company, return on total investment or total resources committed to
operations. 15 Profitability ratios are calculated to measure the operating
efficiency of the firm. According to Block and Hirt “The income
statement is the major device for measuring the profitability of a firm
over a period of time.” 16Measurement of profitability is as essential as
the earning of itself for the business concern. Some managerial decision
like rising of additional finance, further expansion, problems of bonus
and dividend payments rest upon this measurement. It can be measured
for a short term and as well as for a ling term. The relation to sales is the
good short-term indication of successful growth while profitability in
relation to investment is the healthier for long growth of the business.

A Study of Productivity and Financial Efficiency of Textile Industry of India
53
Profitability provides overall performance of a company and useful tool
for forecast measurement of a company’s performance. “The overall
objective of a business is to earn a satisfactory return/profit on the funds
invested in it, while maintaining a sound financial position profitability
measures financial success and efficiency of management. 17
2.14 Types of Performance
There are such areas where the performance should be modified of
improved by effective assessment of various types of activities performed
by the business organization in different areas of operations. Those areas
of operations may be termed as the areas of performance. The important
areas described under the following heads:
2.15 Concept of Productivity
"Productivity means different things to different things to different
people. To workers, productivity means a speed up in their work pattern.
To union leaders it means the productivity for opportunity to negotiate for
higher wages. To management it means increased profitability to
consumers and it means better goods at lower costs. To marketing
directors productivity improvement increased the firm’s competitiveness
abroad by reducing the cost of good sold in foreign market and to
economists; it means an increase in country's standard of living field to
gain in output per man hour". According to Dr. Chauhan P. L.
"Productivity is at the heart of economic growth and development. It is
focal point in business and economic matters all over the world. All
working people, farmer, a carpenter, a black smith, a technician,
businessmen, an engineer, a nurse or doctor, any one is interested in
productivity. When any person strives to make a better living for himself
and his family, he realizes more on productivity than on hard work".
Productivity is the ratio of output to input. Productivity denotes the

A Study of Productivity and Financial Efficiency of Textile Industry of India
54
efficiency with which the various inputs are transformed into the goods
and services. Productivity is said to be high when more output is derived
from the same input. “Productivity denotes and trend of productiveness of
the factors of production, labor, materials, and capital. It is usual today
identify this trend as a measure, a ratio or a rate of return, a relationship
between output and input over a period of time". According to Maital and
Meltz "Productivity has been termed as myster" because the studies on
productivity growth hide more than they reveal" Productivity is measured
as the ratio between the output of a given commodity or service and the
inputs used for that product, which are in the process. And therefore the
concept of productivity term that" It should classify and bring order to an
intricate array of variable relating to inputs and outputs. But to think of
Productivity today is too often unproductive because the term lacks
specific definition and general acceptance" Commonly, Productivity, as a
source or cause of comparatively high levels of output and improvements
in productivity as the major contributors to growth of particular business
unit. Thus "Productivity is a rough measure of the effectiveness with
which we use the most important productive resources". Productivity
therefore, refers to the measurable relationship between well defined
outputs and inputs.
Productivity is usually defined as a ratio of output produced per
unit of resource consumed by the process. "Productivity is a measure of
performance in producing and distributing goods and services, value
added or sales minus purchases divided by workers employed".18
Productivity has become a household word as almost everyone talks
about it. Yet, the term ‘productivity’ means different things to different
persons. As a Phenomenon, it ranges from efficiency to effectiveness, to
rates of turnover and Absenteeism, to output measures, to measure of
client or consumer satisfaction, to intangibles such as disruption in

A Study of Productivity and Financial Efficiency of Textile Industry of India
55
workflow and to further intangibles such as morale, loyalty and job
satisfaction.To put it bluntly, the definition of productivity is complex
and this is because it is both a technical and managerial concept.
Productivity is a matter of concern to government bodies, trade unions
and other social institutions not minding the disagreements over its
conceptualization by different groups and individuals. Hence, discussing
productivity at all levels is common because of the direct relationship
between productivity and the standard of living of a people. It is
perceived that the more different are the goals of the different individuals,
institutions and bodies that have a stake in productivity as a problem, the
more different their definitions of productivity will be. To date, at least
three perspectives have dominated the field of productivity namely
economics, industrial engineering, and administration. These perspectives
have complicated a search for any precise definition of the concept
‘productivity’. One additional problem to the conceptualization of the
term ‘productivity’ is the fact that productivity is not only to be defined
and managed; it is also to be measured. Its measurement poses no fewer
problems than its definition. Perhaps, Krugman (1990) intended to assert
that defining or measuring productivity is a herculean task when he
asserted that “productivity isn’t everything, but in the long run it is almost
everything”1.The primary objective of this paper is to attempt to
demystify productivity conceptually by examining in detail what
productivity is and what it is not. Enhanced understanding of the meaning
of productivity is likely to be guaranteed if its measurement is equally
examined to attempt a balance between theory of productivity and
practice of productivity. This paper will delve into issues of productivity
measurement whereby conscious effort will be made to define what is
definable, measure what is measurable and count what is countable. In
sum, the aim of the paper is to expand the depth of our understanding of

A Study of Productivity and Financial Efficiency of Textile Industry of India
56
the concept and measurement of productivity. The paper is organized as
follows after this introduction. Section two is devoted to the examination
of productivity as a concept where issues revolving around the definition
of productivity are discussed. Section three examines the significance of
productivity with a view to deepening our understanding of productivity
as a concept. Section four examines the measurement of productivity in
all its ramifications. Section five concludes the paper by attempting a
response to the question of how productivity can be improved.
The least controversial definition of productivity is that it is a
quantitative Relationship between output and input (Iyaniwura and
Osoba, 1983, Antle andCapalbo, 1988). This definition enjoys general
acceptability because of two Related considerations. One, the definition
suggests what productivity is thought of to be in the context of an
enterprise, an industry or an economy as a whole.Krugman, P. (1990)
“The Age of Diminished Expectations” MIT Press, Cambridge,
Mass.Two, regardless of the type of production, economic or political
system, this definition of productivity remains the same as long as the
basic concept is the relationship between the quantity and quality of
goods and services produced and the quantity of resources used to
produce them (Prokopenko, 1987).Eatwell and Newman (1991) defined
productivity as a ratio of some measure of output to some index of input
use. Put differently, productivity is nothing more than the arithmetic ratio
between the amount produced and the amount of any resources used in
the course of production. This conception of productivity goes to imply
that it can indeed be perceived as the output per unit input or the
efficiency with which resources are utilized (Samuelson and Nordhaus,
1995).By way of analogy, Amadi (1991) explained that an example of
productivity ratio is kilometres driven per gallon of petrol where petrol is

A Study of Productivity and Financial Efficiency of Textile Industry of India
57
the input and kilometers covered constitute the output. However, input
measure of petrol is not used to determine the efficiency of the car’s
performance. Other related factors such as speed, traffic flow, the
engine’s efficiency and the fuel’s efficiency are equally involved in the
computation of the input index. The output measure of kilometers driven
therefore becomes a gauge of the magnitude or effectiveness of the
results achieved. Expressed simply: Productivity = total output/total input
which is identical to total results achieved/total resources consumed or
effectiveness/efficiency. In effect, productivity becomes the attainment of
the highest level of performance with the lowest possible expenditure of
resources. It represents the ratio of the quality and quantity of products to
the resources utilized. It is evident in the literature on productivity that
almost all the definitions of productivity centre on ‘outputs’ and ‘inputs’.
Unfortunately, definition of either output or input or both may sometimes
pose more difficulty to the understanding of what productivity is. For
output, it is in the form of goods if visible and services if invisible. Input
on the other hand is less easily defined. Since production (creation of
goods and services) is a team effort thereby making the demand for inputs
to be interdependent, various elements (inputs) are involved in the
production of output. This makes the definition of input more complex
than that of output. To ease this problem of defining inputs, it is common
a practice to classify inputs into labour (human resources), capital
(physical and financial assets), and material. Again, in an attempt to
circumvent the difficulty of defining inputs, productivity is sometimes
defined as goods and services produced by an individual in a given time.
In this sense, time becomes the denominator of output with the
assumption that capital, energy and other factors are regarded as aids,
which make individuals more productive.Olaoye (1985) observed that
productivity as a concept can assume two dimensions: namely total factor

A Study of Productivity and Financial Efficiency of Textile Industry of India
58
productivity (TFP) and partial productivity. The former relates to
productivity that is defined as the relationship between output produced
and an index of composite inputs; meaning the sum of all the inputs of
basic resources notably labour, capital goods and natural resources.
Eatwell and Newman (1991) captioned total factor productivity as ‘multi-
factor productivity’. For the latter, output is related to any factor input
implying that there will be as many definitions of productivity as inputs
involved in the production process whereby each definition fits a given
input. For example, when output is associated to per man-hour or per unit
of labour, this definition of productivity is a partial one and it relates to
labour productivity. Partial factor productivity is equally known as
average product. Symbolically, if Y stands for output, and Fi for any
individual factor, we have APF = Y/Fi where APF is the average product.
It only measures how the output per unit has changed over time, ignoring
the contributions from other factors to the detriment of production
process reality.NECA2 (1991) observes that it is more common in
productivity studies to see Emphasis placed on labour productivity. By
coincidence, at the national level,labour productivity translates to what is
known as human productivity. It is thetype of productivity that affects
directly the purchasing power of the population since: National
productivity = Gross National product Working Population Theoretically,
it goes without saying that there is a link between per capita income of an
economy and such economy’s marginal labour productivity.One
justification for the special emphasis on labour productivity is perhaps
because labour is a universal key resource. The term labour productivity
implies the ratio of physical amount of output achieved in a given period
to the corresponding amount of labour expended. By implication,
productivity here means the physical volume of output attained per
worker or per man-hour. However, apprehension exists on the definition

A Study of Productivity and Financial Efficiency of Textile Industry of India
59
of labour that is suggestive of the fact that labour productivity is an
expression of the intrinsic efficiency of labour alone. Indeed, productivity
is more of the end result of a complex social process involving science,
research, analysis, training, technology, management, production plant,
trade union, and labour among other inter-related influences. NECA
means The Nigerian Employers Consultative Association. At the level of
industry or workshop, other kinds of productivity exist. Notable ones
include direct labour cost productivity, capital productivity, direct cost
productivity, total cost productivity, foreign exchange
Productivity, and energy productivity and raw materials
productivity among others.To this end, it must be appreciated that the
definition of productivity partially is purely to satisfy the demand of
theoretical curiosity. Practically, the interdependence nature of the
demands for factors implies that it is impossible to say precisely and
clearly how much output has been created by any one of the different
inputs taken by it. The phenomenon is like attempting to answer the
question: which is more essential in producing a baby, a mother or a
father? Some common misunderstandings exist about productivity. First,
productivity is not only labour efficiency or labour productivity even
though; labour productivity statistics are essentially useful policy-making
data. Productivity is much more than just labour productivity and needs to
take into account other inputs involved in the production process. Two,
productivity is not the same as increase in output or performance.
Sumanth (l984) described this misconception as the confusion between
productivity and production. Output may be increasing without an
increase in productivity if, for example, input costs have risen
disproportionately. One useful way to combat this misconception is to be
conscious of the trend of input costs particularly by relating output
increases to price increases and inflation. This approach is often the result

A Study of Productivity and Financial Efficiency of Textile Industry of India
60
of being process oriented at the expense of paying attention to final
results. Bureaucratic settings are more prone to this misconception of
productivity. In an attempt to draw the line between productivity and
output increase, the term ‘productivity growth’ is sometimes introduced
whereby it denotes the rate of growth of the level of productivity. For
example, if output per worker is l000 units in 1998, and it grows to l250
units in l999, then it is said that productivity growth was 25% per year on
the assumption that prices and input costs are constant. The third
misconception about productivity is the confusion between productivity
and profitability. Profitability is a function of the extent of price recovery,
even when productivity has gone down. Again, high productivity may not
always go with high profit if goods and services produced efficiently and
effectively are not in demand. Confusing productivity with efficiency or
effectiveness can equally cloud the meaning of productivity. Efficiency
means producing high-quality goods in the shortest possible time. It is
important to ask if goods produced efficiently are actually needed. Also,
effectiveness refers more to the production of results. In the private sector
for instance, effectiveness could mean making profit and preserving
future market share. According to Scott (l983), efficiency and
effectiveness are actually measures5 of performance just as productivity
is equally a measure of performance. Another misconception is a mistake
of believing that cost cutting always improves productivity. Whenever
this is done indiscriminately, it can even bring about productivity decline
in the long run. It is equally not to be believed that productivity can only
be applied to production. In reality, productivity is relevant to any kind of
organization or system including services, particularly information. For
example, improved information technology alone can give new
dimensions to productivity concepts and measurement. Recent
advancement in information technology seems to be suggesting that

A Study of Productivity and Financial Efficiency of Textile Industry of India
61
labour productivity may actually be subordinate to the productivity of
capital and other scarce resources such as energy or raw materials. The
concept of productivity is also being linked with quality of output; input
and the interacting process between the two. An important element is the
quality of the work force, its management and its working conditions as it
has come to be In the definition of productivity, efficiency goes with the
denominator (input) and effectiveness the numerator (output) noticed that
rising productivity and improved quality of working life go hand in
hand.In a nutshell, productivity is concerned with efficiency and
effectiveness simultaneously. Lawlor (l985) sums up productivity as
comprehensive measures of how efficient and effective an organization or
economy satisfies five aims: objectives, efficiency, effectiveness,
comparability and progressive trends. No matter how it is perceived,
productivity implies that there is an incremental gain in what is produced
as compared with the expenditure on measures utilized.
2.16 Production and Productivity:
“Production and productivity are often not distinguished at all. Just
as the Army is not the Navy and the Navy is not the Army. Production
and productivity is not the same thing. Production is the amount of the
absolute flow of product during a given period. Productivity is the
measure of the efficiency in production of factors inputs and / or factor /
input services" the term 'productivity is used with reference to "The
relationship between actual inputs and actual outputs. It is primarily
measure overtime, comparing the performance this year with previous
years and shows the improvements achieved by the organization.
Productivity may also be used to compared production faculties or against
bench marks". According to international labor organization (ILO)
productivity refers to "the effective and efficient utilization of all

A Study of Productivity and Financial Efficiency of Textile Industry of India
62
resources, capital, land, materials, energy, information, and time in
addition to labor” There are few confusions about productivity.
Firstly productivity is not only labor efficiency or labor
productivity. Secondly misconception is that it is possible to judge
performance simply by input. Third with efficiency means producing
high quality goods in the shortest possible time but there are requirement
of consideration is those goods are needed. Fourthly cost cutting does not
always improvement productivity. "It is the Pivot of all the productive
economic activities affecting the cost of production and determining all
the variables like the prices, wages, salaries and cost of capital and
services” thus, increasing productivity means the increasing efficiency of
different resources of production with shortest efforts. In other wards,
along with increase in quantities of factors and inputs, productivity
improvements will also be contributing is additional source of output
increase. For any given increase in output, improvement of a higher rate
of productivity applied for connotes a saving or economy in the
requirements of additional supplies of inputs and factors. Generally it can
be said that production is an absolute term and refers to the total value of
manufactured goods and provision of services produced during a period.
Which aim is to satisfy people's wants where as productivity on other
hand denotes as relative terms in relation to the input or resources used in
turning out a given amount of output. As well as productivity does not
depend upon the increase in production.
2.17 Significant of Productivity
Importance of productivity in contest of the present day
competitive world economic environment is the adoption and use of the
latest technology and therefore "Productivity is the change in results
obtained for the resources expended or productivity change is any
alteration in output - input relationships including those resulting from

A Study of Productivity and Financial Efficiency of Textile Industry of India
63
changes in the production process, changes in the methods of using
existing processes, changes in the input proportions or input mix and
changes in the rate or scale at which existing processes are utilized" It
may be true that " in every country developed or developing with a
market economy or a centrally planned economy, the main source of
economic grow this an increase in productivity. Inversely slackening of
growth stagnation and decline entail or are accompanied by a slow down
productivity improvement".Suppose industry is to be the engine of
economic growth and modernization as well as competition the chosen
paths for improving industrial efficiency, productivity improvements will
be the indicators of success. "The National importance of extending
economic incentives from standard factory production to services and less
standard productive operations is, in the main three fold, there is first the
fact that services and underside processes have advanced less in
productivity.
Secondly if some operations are paid by piece, others by time, the
piece workers are likely to take home much higher earnings than the time
workers. Thirdly extending incentive schemes beyond standard factory
production lies in the saving of man power". While at the micro level
"Productivity finds a prominent place in the business mission of the
organization. Discussions revealed that the top Management considers
improvements in productivity as vital to the process of developing a
competitive edge and generation of adequate internal resources to finance
the company's growth"
According to Raman M.V.V. "The importance of Productivity lies
into understanding effectiveness and efficiency by providing a basis for
doing right things, setting objectives, measurement and control, the
significance of technology and management in productivity
improvements and role of individual managers, get clarified, leading to

A Study of Productivity and Financial Efficiency of Textile Industry of India
64
managerial effectiveness. In this sense management gets a dimension
encompassing activities in the total economic system & managerial
effectiveness its content” Thus, the significance of productivity is
increasing each unit to national welfare is now universally recognized
fact.
2.18 Relationships of Productivity with Efficiency:
Productivity itself is a sign of efficiency in production. It may be
improved when production is carried out with a view to economical
manner. Lower productivity shows the waste and inefficiency in the use
of resources. High-level productivity results in high level of profits. The
sharing level of productivity looks to it that maximum output should take
place from whatever minimum input one is engages in the best of a
concern depends upon the maximum profit it can draws. According to
Gordon K.C. et al., “with due allowances for temporary current value in
fluctuations or changes in commodity of product prices there is strong
positive correlation among time series data measuring productivity,
profitability or efficiency”.
It means that all these measures indicates a rate of growth in
capabilities of organization to fulfill their missions namely to produce and
distribute more and better products or services by managing the
development and application of technology as well as human resources.
According to Alan Lawler “efficiency is comprehensive measure of how
organization satisfy the effectively resources are used to generate useful
output”. Generally efficiency can be measured by taking into account the
inputs and outputs and therefore productivity is the efficiency and
capacity of producing different articles by the raising the rate of
productivity or efficiency of the company one can from an idea about its

A Study of Productivity and Financial Efficiency of Textile Industry of India
65
production performance. To sum up production performance measures
the level of efficiency.
2.19 Concept of Profitability Performance
Simply, profitability is Profit making ability of a business
organization, According to Gibson and Boyer “Profitability is the ability
of the firm to generate earnings” the word Profitability is modulation of
two words ‘Profit’ and ‘ability’ Profit is the bottom line of the financial
statement of meaning of Profit derives according to the purposes and
usages of figures, While term ‘ability’ indicates the power of the business
organization to generate Profits. “Ability” is also referred to as” Earning
power or “Operating performance of the concerned investment” .
According to Franks and Broyles “The expected return from the
Capital Markets represents an opportunity cost. Since incrementally,
companies can employ their funds in the capital market that market
provides the appropriate reference point against which to measure
profitability. Put another way a profitable investment project is one which
provides a return sufficient to attract capital from the Capital Market”
while how and up to believes that “The ability of a given investment to
earn a return from its use” It may remarked that the ability of Profit
making could denote a improved or constant during a specific period In
accountancy Profitability may be described as a yard stick of firm
performance. It is a relative concept, which regulates and controls over
management policy and decisions.
(1) Profitability
The word "Profitability" is modulation of two words "Profit" and
"Ability". In another words it referees to "Earning Power" or "Operating
Performance" of the concerned Investment. The concept of profitability

A Study of Productivity and Financial Efficiency of Textile Industry of India
66
may be defined as "The ability of a given Investment to earn a return
from its use" 19
Measurement of profitability is the overall measure of performance.
Profits known as bottom lines are also important for financial institutions.
Analyzing and interpreting various types of profitability ratios can obtain
creditor’s performance of profitability.
(2) Fixed Assets
"Generally fixed assets known as non liquid and long term
property element” The fixed assets concern with that part of capital
include al the tangible as well as intangible property. The tangible assets
refer to productive assets like plant, machinery, tools and other facilities.
"Which are used in carrying on productive activities of a business
enterprise".20
The amount invested in fixed assets is realized gradually from each
unit of sales made during the life span of the assets. The performance of
fixed assets is shown through interpretation of fixed assets structure,
impact of gross block on sales and operating profit margin, average
annual growth and efficiency in the use of fixed assets.
Fixed assets by the nature, are long term tangible assets, therefore
they should be financed through the long term sources of funds in the
case of ratio of fixed assets to net worth it can be analyzed to study
financing of fixed assets and this ratio is very important as it shows that
owners have granted enough funds to finance fixed assets.
2.20 Measurement Tools of Financial Efficiency :
For taking policy decision under different situations, measurement
of Profitability is essential. According to Murthy V. S. “The most
important measurement of Profitability of a company is ratio i.e.
profitability of assets, variously referred to as earning power of the
company, return on total investment or total resources committed to

A Study of Productivity and Financial Efficiency of Textile Industry of India
67
operations”. Profitability ratios are calculated to measure the operating
efficiency of the firm. According to Block and Hirt “The income
statement is the major device for measuring the Profitability of a firm
over a period of time.” Measurement of profitability is as essential as the
earning of profit itself for the business concern. Some managerial
decisions like rising of additional finance, further expansion, and
problems of bonus and dividend payments rest upon this measurement. It
can be measured for a short term and as well as for a long term. The
relation to sales is the good short-term indication of successful growth
while profitability in relation to investment is the successful growth while
profitability in relation to investment is the healthier for long turn growth
of the business. Profitability provides overall performance of a company
and useful tool for forecast measurement of a company’s performance.
“The overall objective of a business is to earn a satisfactory return / Profit
on the funds invested in it, while maintaining a sound financial position.
Profitability measures financial success and efficiency of Management”
The importance of analysis of profitability performance can see from the
reality that besides the management and owners of the company, financial
institutions, creditors, and bankers also looks at its Profitability. Appraisal
of performance as regards to profitability can be drawn from interpreting
various ratios.
However there are few factors affecting to the firm’s Profitability.
Each factor in turn will affect the Profitability ratios. In present study
profitability ratios can be measured through two groups’ i.e. Profitability
ratios in relation to capital employed. The examples of sales based
profitability ratio are Net Profit ratio, operation ratio and gross profit ratio
and in relation to Capital employed profitability ratio are Earning per
share, Return on Capital employed and Return on owners equity of the
company will be discussed below:

A Study of Productivity and Financial Efficiency of Textile Industry of India
68
Profitability Ratios in Relation to Sales:
(I) Gross Profit Ratio:
“The excess of the net revenue from sales over the cost of
merchandise sold is called gross profit, gross profit on sales or gross
margin”
This ratio is calculated by dividing the gross profit by net sales and
is usually expressed as a percentage. The formula of gross profit ratio is
given below:
Gross Profit Ratio = Sales - Cost of Goods Sold x 100 ---------------------------------------- Sales
= Gross Profit x 100 ---------------------- Sales
The gross profit ratio highlights the efficiency with which
management produces each unit of product as well as it indicates the
average spread between the cost of goods sold and the sales revenue. Any
fluctuation in the gross ratio is the result of a change in cost of goods sold
or sales or both. A high gross profit ratio is a mark of effectiveness of
management. The gross profit ratio may increase due to any of the below
factors:
(1) Lower cost of goods sold where sales prices remaining constant
(2) Higher sales prices where cost of goods sold remaining constant
(3) An increase in the proportionate volume of higher margin items.
(4) A combination of variations in sales prices and costs. While in the
case of low gross profit ratio it may reflect higher cost of goods sold
due to firm’s inability to purchase at favorable terms, over investment

A Study of Productivity and Financial Efficiency of Textile Industry of India
69
in plant and machinery etc. secondly this ratio will also be low due to
a decrease in prices in the market.
(ii) Net Profit Ratio:
Net Profit is obtained when operating expenses; interest and taxes
are subtracted from the gross profit. It indicates that the portion of sales is
left to the proprietors after all costs; charges and expenses have been
deducted.
Net Profit ratio is differ from the operating Profit to Sales Ratio in
as much as it is computed after adding non-operating surplus / deficit.
(Difference of non-operating incomes and non-operating expenses). The
net profit ratio is measured by dividing profit after tax by Net Sales:
Net Profit Ratio = Profit after tax x 100 ------------------------ Net Sales
Net profit margin ratio establishes a relationship between net profit
and sales and it indicates management efficiency in Administering,
manufacturing and selling the products. This ratio is the overall measure
of the firm’s ability to turn each rupee sales into net profit. While the net
profit is inadequate, the Firm will fail to achieve satisfactory return on
owner’s equity due to various reasons. Such as (I) Falling price (ii) rising
costs and declining sales Thus, this ratio is very useful to the proprietors
and widely used as a measure of overall profitability.
Profitability in Relation to Capital Employed:
Earning Per Share (EPS)
Earning per share is widely method of measuring profitability of
the common shareholders investment it measures the profit available to

A Study of Productivity and Financial Efficiency of Textile Industry of India
70
the equity shareholders on per share basis. The earning per share is
calculated by dividing the profit after taxes by the total number of
common shares outstanding.
Profit after Tax
Earning Per Share = ------------------------------------------- × 100
Number of Equity share outstanding
The earnings per share calculations made over years shows whether
or not the firms earning power on per share basis has changed over that
period. “The earnings per share simply show the profitability of the firm
on a per share basis. It does not reflect how much is paid as dividend and
how much is retained in business but as a profitability index. It is a
valuable and widely used ratio” Thus, the profitability of common
shareholder’s investment can be measured easily by earning per share.
Return on Capital Employed:
Return on capital employed often called as ‘Return on investment’
“Return on capital employed may be approximated by a fraction. The
bottom-line should represent the average amount of capital employed and
the top line would represent an average of accounting earnings from the
projects.” Generally, it is known about the rate of return on investment
(ROI) or equivalently rate of return on assets. This ratio is computed by
dividing net earnings net earnings by total assets.” This ratio is computed
by dividing net earnings by total assets.” This ratio is calculated as
follows:
Profit after tax Return Capital Employed = -------------------- × 100 Capital Employed

A Study of Productivity and Financial Efficiency of Textile Industry of India
71
Above formula gives the conventional approach of calculating.
Return on investments where investment represents pool of funds
supplied by the shareholders and lenders. While profit after tax represents
residue income of shareholders, therefore it is conceptually unsound to
use profit after tax in the calculation of return on investments (ROI)
Return on Owners Equity:
Return on owner’s equity is also known as return on shareholder’s
equity. This ratio shows how the firm will have used the resources of
owners. It may true that this ratio is one of the most relationships in
financial analysis. The return on owner’s equity is calculated by
following formula.
Profit after Tax Return on Owners Equity = ----------------- × 100 Owner’s equity
Where, owners equity = share capital + reserve & surplus.
This ratio indicated the extent to which this objective has been
fulfilled. This, ratio reflects great interest to present as well as prospective
shareholders and also important for management, because management
has responsibility of maximizing the owners wealth in the market place.
This ratio would be compared with the ratios for other similar companies
as well as the industry average. Thus, it shows the relative performance
and strength of the company.
2.21 Evaluation Methods :
A study of Performance efficiency through productivity, financial
efficiency and operational efficiency is made by using the followings
tools and techniques.

A Study of Productivity and Financial Efficiency of Textile Industry of India
72
1. Ratio Analysis
Ratios analysis is the process of determining and presenting in
arithmetical terms the relationships figures and groups of figures drawn
from these statements. A ratio expresses the results on the basis of
comparison of two figures in numerical terms.
A ratio is a statistical yardstick that provides a measure of
relationship between two accounting figures. According to batty “
Accounting ratios describe the significant relationship which exists
between figures shows on a balance sheet in a profit and loss account in a
budgetary control system or in any of the part of accounting
organization.”21 The ratio is customarily expressed in following ways:
1. It may be obtained by dividing one value by other. This expression
is known as “Times”.
2. If hundred then the unit of multiply the above expression becomes
percentage.
3. It may be expressed in the form of “proportion” between the two
figures or known as pure ratio.
4. It may also be depicted in the form of graphs like ratio graph.
Importance:
A ratio is known as symptom like blood pressure. The pulse rate of
the temperature of an individual often ratio analysis is used as a devices
to diagnose the financial position of an enterprise. It shall point out if the
financial condition is very strong, good, partly good, poor. As such the
ratio analysis is a powerful tool of financial analysis through it economic
and financial position of a business unit can be fully x-rayed.
Ratio analysis becomes meaningful to judge the financial condition
and profitability. Performance of a firm only when there is comparison of
present in fact analysis involves two types of comparison. First a

A Study of Productivity and Financial Efficiency of Textile Industry of India
73
comparison of present ratio with past and expected future ratios for the
same firm, the second method of comparison involves comparing the
ratio of the firm with those of similar firms of with industry average at the
same point of time.
Further “Ratio analysis” presents the figures in which the net result
of the financial position and problems is concentrated. They provide a co-
ordinate frame of reference for the financial manage. They tell the entire
story of the ‘Financial adventures of the enterprise as heap of financial
date are buried them. They simplify the comprehensive of financial
statistics.
On the basis of above it may be concluded that ratios are very
important for interpretation as they give valuable and very useful
information about business.
Limitations:
Every flower of rose has its own beauty in spite of numberless
thorns in the same way ratio analysis has a variety of advantages, though
it is not free from limitations, some of which are as below:
1. The formula for calculating each ratio is not well standardized.
2. No standard ratios are available for evaluating the significance of
each ratio.
3. Ratio ignores non-monetary factors like general economic climate,
government and management policies, which vitally affect the
financial health of the enterprises.
4. If too many ratios are calculated, they are likely to confuse, Instead
of revealing meaningful conclusions.
5. The ratios are generally calculated from the past financial
statement and thus, are no indicators of future.

A Study of Productivity and Financial Efficiency of Textile Industry of India
74
6. Ratios are not exact measure of financial situation as the balance
sheet and profit and loss account are based on accounting
conventions, personal judgments and recorded facts.
As Ratios are simple to calculate, there is a tendency to over employ
them, which lead to accumulation of mass data. However significant the
ratio may they cannot replace business efficiency and decision - marking.
They do not provide mechanical solution to business problems.
Classification of Ratio:
Some writers have described that there are as many 42- business
ratios. First of all it is necessary to ascertain the ratios for a particular
study. The financial ratios may be classified in the various ways. If the
nature and objective of calculating each ratio is given then the customary
and convenient classification from the point of view of management and
investors will be:
(A) Liquidity Ratio
These ratios throw the light upon the liquidity position of a concern
the main ratios are:
1. Current ratio
2. Liquid ratio or quick ratio or acid ratio
3. inventory to working capital ratio
4. Working capital turnover ratio
5. Debtor turnover ratio
6. Average debt collection period
(B) Productivity Ratio
1. Output to input ratio
2. Input to output ratio

A Study of Productivity and Financial Efficiency of Textile Industry of India
75
(C) Profitability Ratio
These ratios X ray the profit making ability of the enterprise. They
may calculate either on the basis of operating profit or net profit. These
ratios are of two types first related to sales and second profitability. The
main efficiency ratios are
1. Gross profit ratio
2. Operating ratio
3. Net profit ratio
4. Return on gross capital employed
5. Return on net capital employed
6. Return on net worth
(D) Activity Ratio
Activity ratio expressed how efficient the firm is managing its
resources. These ratios express relationship between the level of sales and
the investment in various assets. The import and commonly used activity
ratios are as under:
1. Total assets turnover ratio
2. Fixed assets turnover ratio
3. Current assets turnover ratio
4. Capital turnover ratio
(E) Financial Structure Ratio
These ratio highlight the management policies regarding trading on
equity. These more important ratios concerning capital structure is given
below.
1. Long term debt equity ratio
2. Total debt equity ratio
3. Interest coverage ratio
4. Fixed assets to capital employed
5. Capital gearing ratio

A Study of Productivity and Financial Efficiency of Textile Industry of India
76
6. Proprietary ratio
7. Net fixed assets to net worth ratio
[2] TREND ANALYSIS
Trend analysis technique is useful to analyze the firm financial
position and to put the absolute figures of financial statement in more
understandable form over a period of years. This indicates the trend of
such variable as sales cost of production, profit assets and liabilities.
The different approaches of trend analysis are as follows.
1. Common size vertical analysis
2. Common size horizontal analysis
3. Trend analysis helps the analyst and management to evaluate
the performance, efficiency and financial condition of an
enterprise.
(i) Common Size Vertical Analysis
All the statement may be subject to common size vertical analysis a
figure from the same year’s statement is compared with the basic figure
selected from the statement should be converted into percentage to some
common base. The common size vertical income statement and balance
sheets of selected companies of fertilizer industry covered by this study
are given in the study.
(ii) Common Size Horizontal Analysis
When asking horizontal analysis, a figure from the account is
expressed in terms of same account figures from selected base years. It is
calculation of percentage relation that each statement then bears to the
same item in the bas4e year. Horizontal analysis can help the analysis to
determine how an enterprise has arrived at its current position.
The technique of common size statement is very useful when we
wish to compare the performance of the industry for presentation of the

A Study of Productivity and Financial Efficiency of Textile Industry of India
77
data in percentage from since it eliminates problems relating to
differences in organization size.
[3] Comparative Statement Analysis:
Statement prepared in a form reflecting financial data for two or
more periods are known as comparative statement. The data must first be
properly set before comparison in the preparation of comparative
financial statement uniformity is essential otherwise comparison will be
vitiated. Comparative financial statement is very useful to the analyst
because they contain not only the data appearing in a single statement but
also information necessary for the study of financial and operating trends
over a period of a year. They indicate the direction of the movement in
respect of financial position and operating results. Comparison of
absolute figure has no significance if the scale of operation of one
company is much different from that of others.
(i) Comparative Balance Sheet
Increase and decrease in various assets and liabilities as well as in
proprietor’s equity or capital brought about by the conduct of a business
can be observed by a comparison of balance sheets at the beginning and
end of the period. Such observation often yield considerable information,
which is of value informing an opinion regarding the progress of the
enterprise and in order to facilitate comparison a simple device known as
the “comparative balance sheet” may be used.
(ii) Comparative Income Statement
As income statement shows the net profit or net loss resulting from
the operations of a business for designated period of time. A comparative
income statement shows the operating result for a number of accounting
periods so that changes in absolute data from one period to another may
be started in terms of money and percentage. The comparative income

A Study of Productivity and Financial Efficiency of Textile Industry of India
78
statement contains the same columns as the comparative balance sheet
and provides the same type of information.
As the income statement presents the review of the operating
activities of the business and the comparative balance sheet shows the
effect of operation of its assets and liabilities. The latter contains a
connecting link between the balance sheet and income statement. Income
statement and balance sheet are contemporary documents and they
highlight certain important facts.
[4] Fund Flow Analysis
The balance sheet is in the nature of a showing the position of a
firm at a particular moment of time. The business process is very
dynamic with transactions occurring regularly, each of which affects in
some way, the immediately preceding financial position. A balance sheet
therefore, merely provides the picture of a fleeting condition at a point of
time and if balance sheets drawn at different time are compared any
different pound between the closing and beginning figures would be the
result of various transaction taking place during the interim period. The
business process involves a continuous inflow and outflow of funds. This
funds flow analysis helps the analysis to appraise the impact of the
management’s decision on the business during a given period of time.
[5] Other Techniques of Analysis
Several other techniques like cash flow analysis and break even
analysis are also some time useful for analysis. The use of various
statistical techniques is also used frequently for financial analysis,
providing a more scientific analysis. The tools generally applied are
moving average, index number, range, standard deviation, correlations,
regression and analysis of time series.
Diagrammatic and graph orientations are often used in financial
analysis. Graphs provides a simplified way of presenting the data and

A Study of Productivity and Financial Efficiency of Textile Industry of India
79
often give much more vivid understandable of trends and relationships.
Pie graphs bar diagrams and other simple graphs are often used for
financial analysis.
2.22 Significance of a Study:
The above study is made for the point of all live participants who
are interested in the routine of the business organization. Those are as
under.
(1) Management Point of View:
The above study plays vital role in providing such information to
the management, which needs for planning decision-making and control
e.g. operational efficiency analysis provides gross profit, operating
expenses analysis and profit margin. Asset management outlines asset
turnover, working capital under inventory turnover, accounts receivable
and payable profitability position shows return on assets, earning before
interest and taxes (EBIT), and return on assets. Gesternberg stated that
“management can measure the effectiveness of its own policies and
decisions, determine the advisability of adopting new policies and
procedures and documents to owners as result of their management
efforts” 22
(2) Important to Investor:
According to Erich A.Helfert “Importance of performance lies for
owners/potential investors should know easily. The financial position of
the company by return on net worth, return on common equity, Earnings
per share, Cash flow per share, Dividend yield, dividend coverage, Price
earning ratio, market to book value, Pay out/retention”23. The potential
investors of the business organization in turn are interested in the current
features.

A Study of Productivity and Financial Efficiency of Textile Industry of India
80
(3) Creditors Point of View:
Creditors doing business with company simply study its
performance by current ratio, acid test ratio, and debt to assets, equity and
capitalization, interest coverage and principal coverage before lending the
finance. The study of these describes real features of business
organization to the creditors.
(4) Government Point of View:
Government has significance to study liquidity productivity and
financial efficiency of an individual organization or industry as a
wholvarious. Taxes, revenues, financial assistance, sanctioning, subsidy,
to a business organization or industry as well as price fixing policies,
frame outlines the key role of study for the Government lies in planning,
decision making and control process.
(5) Employees and Trade Unions Point of View:
Employees are resources of the company and are interested to
know the financial position and profit of the company. Generally they
analyze by the comparison between past and present performnace, profit
margin and cash flow of the company. Trade unions are interested to
know the data of financial performance pertaining to their demands for
increase in wages, salaries, facilities, and social welfare.
(6) Society and Others:
Society and others are including in external environment of the
company and every business organization has a greater responsibility
towards society.
In this context performance should be studied through various
types of social elements such as customers investors, media, credit
institutions, labour bureaus, taxation authorities, economists are
interested for the study of a business organization while society as whole

A Study of Productivity and Financial Efficiency of Textile Industry of India
81
also looks forward to know about the social contribution, i.e.,
environmental obligations, social welfare etc.

A Study of Productivity and Financial Efficiency of Textile Industry of India
82
References:
1. Author's Article, "Financial Appraisal of State Ware-housing
Corporations: A Case Study of Rajasthan State Ware housing
Corporation, “Lok Udyog, XVI (September 1982,) 5-6.
2. R.D. Kennedy and S.Y. Mc Muller, Financial Statements
(Illinois, 1952), p. 17.
3. Ibid. p. 25.
4. Carl L. Moore, et al., Managerial Accounting (London, E. Anold
Publishers Ltd.), P. 119.
5. Robert H. Wessel; Principles of Financial Analysis (N. Y.,
Macmillan, 1961), p. 29.
6. ROGER, H. HERMAN SON. Accounting principles, (Plano: taxes,
business publications inc.1983), P.734.
7. BRADLEY J. F. “Administrative financial Management” Braves
and noble, New York, 1964, p.104.
8. WESTON J.F. AND BRIGHAM E.F “Managerial Finance” cited in
Sharma akhileshwar “profitability analysis of Drugs and
pharmaceutical companies in India” A thesis submitted for the
degree of PH.D, in the faculty of commerce, saurashtra university
Rajkot 1992,p.1
9. CHAYAL B. R “Financial mgt. of state enterprise” print well
publisher, Jaipur, 1986,p.172
10. R.S. KULSHRESTHA “Profitability in India’s steel industry during
the decade 1960-70”A thesis submitted for the degree of PH.D
depts. E.A.F.M., university of Rajasthan, Jaipur, 1973, p.83.
11. MURTHY V.S. “Management finance” Vakils Feller and Simons
ltd., Bombay, 1978 p.79.
12. BLOCK AND HIRT “Foundations of financial management”
Richard D Irwin inc., Homewood, Illinois, 1978,p.24
A Study of Productivity and Financial Efficiency of Textile Industry of India
83
13. DAVE N. V. “Industrial sickness and some key areas of
management (A study of textile Industry: Gujarat) A thesis of
PH.D. In faculty of commerce, saurashtra university, Rajkot, 1984,
p. 260-261
14. Mohanty R.P. in his article “managing technology for strategic
advantages” The economic times, 9Thursday 9th Jan., 19920, p.14
15. Gordon k. C. Chen and Robert E. Mcgarah “productivity
management text and cases”. International editions Holt Saunders
CBS college publication, New York 1982 p. 3
16. Souvenir published at IV conference of Asia and pacific
accountants, New Delhi, 1965, I P 143
17. Weston I Fred, “The profit concept and theory: A restatement
journal of political economy, LXII (April-1954) p. 152-170
18. Eric L Kohler, A dictionary for accountants (Indian reprint prentice
hall of India pvt. 1978)
19. R.K. Gupta “Profitability financial structure and liquidity”, print
well publisher-Jaipur-1990 p.31
20. Harold W. Stevwnsion & J. russel Nelson, “Profit in the modern
economy” Vora & co. publisher pvt. Ltd. 3 round building,
Bombay-21969, p.74
21. Howard and upton “introduction to business finance” international
student edition Mc Grawhill book Co. ltd. New York, p.147
22. John n. Mayur, Financial statement analysis, prentice hall of India,
New Delhi, 1974, p.178
23. CHOWDHARY S.B. “ Analysis of company financial statement” Asia publishing house, a964. p-71

A Study of Productivity and Financial Efficiency of Textile Industry of India
84
CHAPTER-3
RESEARCH METHODOLOGY
3.1 Problem Identification
The Indian textile industry is the second largest in the world-
second only to china. Indian textiles also account for 38 percent of the
country’s total exports and are therefore, a very important industry. The
forecast is that textiles exports will reach USD 35 billion by the years
2012. To sustain this growth, it is imperative that the textiles industry
produces goods of high quality at reasonable prices. This means that the
industry must continuously moderate its machinery. Therefore, the
textiles machinery industry sector has an integral role to play in the
growth of India’s export industry. Analysts note that textile prices are
increasingly competitive worldwide as more and more developing
countries enter the global textile trade. To maintain if not increase, its
global market share, the Indian textile industry must procure modern,
low-cost, textile machinery so that it can produce high quality textiles
and garments for export at competitive prices. It is in this context that the
market for used textile machinery is viewed as very promising used
textiles machinery permits India to incorporate new technology at low
cost. Here are a few important facts about India’s textile:

A Study of Productivity and Financial Efficiency of Textile Industry of India
85
1. There are approximately 1200 medium to large scale textile mills
in India. Twenty percent of these mills are located in Coimbatore.
(Tamilnadu).
2. India has 34 million cotton textile spindles for manufacturing
cotton yarn. Cotton yarn account for 70 percent of India’s textile
exports (China has 40 million cotton spindles.)
3. Of the Indian textile yarn exports, almost 80 percent come from
coarser yarns (counts below 40s). Consequently, there is a need to
upgrade the technology.
4. For the past two years, there has been a significant slow-down in
the cotton spinning segment, mainly due to the spiraling price of
cotton.
5. The domestic knitting industry is characterized by small scale units
which lack adequate facilities for dyeing processing and finishing
the industry is concentrated in Tirupur (Tamilnadu) Ludhiana
(Punjab). Tirupur produces 60 percent of the country’s total
knitwear exports. Knitted garments account for almost 32 percent
of all exported garments. The major players include Nahar
spinning, Arun processor and Jersey India.
Financial soundness of a business enterprise largely depends upon
the liquidity, productivity and profitability of the business enterprise. The
liquidity can be achieved by managing the different parts of working

A Study of Productivity and Financial Efficiency of Textile Industry of India
86
capital such as receivable management, cash mgt.and proper debt
collection policy. An output is obtained by the combined input of a
number of factors like labour, material, capital, land and organization.
The ratio between output and one of these factors of input is generally
known as the productivity of the factors considered, the ratio between
output and all these factors is known as total productivity. It is considered
as a measure performance of the economy as a whole. In the broadest
concept, productivity may be taken to constitute the ratio of all available
goods and services to the potential resources of the group of the country.
The problem of increasing productivity implies the full proper and
efficient utilization of the available resources of men – machines- money
– power – land- capital etc. Productivity cannot have a mask attack on
wastage of every type and in every sphere. It constantly urges to find
better, cheaper, quicker, easier and safer ways of doing job,
manufacturing a product and providing a service. It aims at the maximum
utilization of resources for yielding as many goods and services as
possible, of the kinds most wanted by consumers, at the lowest possible
cost. The profitability can be achieved after control over the cost of
production. In recent years, cost of almost all elements of production like
cost of raw material consumed, wages cost, excise duty, power and fuel
cost, interest burden, administrative expenses, selling and distribution
expenses etc. have increased heavily. On the other hand, selling price of

A Study of Productivity and Financial Efficiency of Textile Industry of India
87
cement, textiles, automobiles, woolen, engineering, tea, paper, and
chemical products has decreased. In these circumstances, to keep the
progress of business enterprise is very essential for management in
present environment, to achieve the profit it tends to introduce various
control techniques over expenditure and get maximum output.
A study of productivity and financial efficiency classified on the
basis of persons interested in the analysis. Generally external and internal
parties are interested in such analysis of study. Objectives of both these
analysis are different. An external analyst has to depend upon the
published information of financial statement, which is not enlightening
them. While internal analysis knows every thing regarding the
information provided in the financial statements.
Different analysts always make analysis or study of financial
performance knowingly, generally, external analyst’s analysis of the
information as per their requirements. Financier is interested in the
financial and liquidity position. A shareholder is interested in the
profitability. Management is interested in the productivity and
operational efficiency. Thus various stakeholders of business enterprise
like management, investors, bankers, financial institutions, creditors,
employees, government, economists, prospective investors etc. look at
liquidity, profitability and productivity of the business concern.

A Study of Productivity and Financial Efficiency of Textile Industry of India
88
3.2 Survey of the Existing Literature:
There is wide range of literature available on financial performance
analysis of different companies in conforming to its dynamic value and
significance of intuitive nature. A good dealing in analytical part of
literature exists at broad levels like size and technology, problem
associated with productivity, financial performance, and capacity
utilization. Relevant existing literature and studies have been clipped
below. A researcher has studied this literature for gaining insight into the
problem.
In the year 2002, Dr. Sugan C. Jain has written a book on
“Performance Appraisal Automobile Industry” In his study, he has
analyzed the performance of the Automobile Industry and presented
comparative study of some national and international units. The
operational efficiency and profitability had been analyzed using the
composite index approach. He made several suggestions fro the
strengthening the financial soundness improving profitability, working
capital the performance of fixed assets.
Ahindra Chakrabati published an articles “Performance of Public
Sector Enterprises - a Case study on Fertilizers” in “The Indian Journal of
Public Enterprise” in the year 1988-89. He made analysis of consumption
and production of fertilizer by public sector; he also made analysis of

A Study of Productivity and Financial Efficiency of Textile Industry of India
89
profit and loss statement. He gave suggestions to improve the overall
performance of public enterprise.
Miss Nandini Jaimini published an article “Evaluation of Cash
Management Performance of the Selected Textiles Mills in Rajasthan” in
“Indian Journal of Public Enterprise” in 1988-89. She made analysis of
selected textiles units by using various liquidity ratios and concluded that
the inadequate cash balance to meet their currently maturing obligations.
She suggested various measures to overcome this deficit of working
capital.
Recently in the year December 2002, a study was made by Prof.
Manish M. Chudasama on “ Analysis of Cost Structure of Indian Textiles
Industry” He had made an attempt to analyze cost structure, direct
expenses and profit, indirect expenses and profit, and how these factors
affect the cost structure of textile industry by using various ratios
analysis, common size analysis. He made several suggestions for the
improvement of profitability of industry to lower the cost used in cost
structure.
R.S Tiwari published an article “Cost Reduction in Cement
Industry” in the “Management Accountant” in Nov 1998. The article
includes suggestions for reduction and control of cost factors.

A Study of Productivity and Financial Efficiency of Textile Industry of India
90
In the year 1988, one book was published on “Working Capital
Structure of Private Enterprises” by J.Panda and A.K. Satapathy. It
covers a study of 10 private sectors company engaged in production of
cement. The study covers the various aspects of working capital period
from 1965 to 1985. He had analyzed working capital position of selected
units as a whole and as well as individual analysis. Finally He had made
suggestions for the better utilization of various components of working
capital.
In the year 1998, a study was made by Dr. S.J. Parmar on
“Profitability Analysis of Cement Industry in Gujarat state” for the period
from 1998-89 to 1994-95. He had made an attempt to analyze financial
strength, liquidity, profitability, cost and sales trend and social welfare
trend by using various ratios analysis, common size analysis and value
added analysis. He made several suggestions for the improvement of
profitability of industry. In his analysis, he indicates various reasons for
higher cost, low profitability, and inefficient use of internal resources.
Dr.Pramod Kumar published a book in 1991, “Analysis of
Financial Statements of Indian Industries.” The study covered the 17
private, 5 state owned and 1 central public sector companies. He studied
analysis of activities, assessment of profitability, return on capital
investment, Analysis of financial structure, analysis of fixed assets and
A Study of Productivity and Financial Efficiency of Textile Industry of India
91
working capital. In this research he revealed various problems of cement
industries and suggested remedies for the problems. He also suggested
for the improvement of profitability and techniques of cost control.
Dr Sanjay Bhayani published a book in 2003; “Practical Financial
Statement Analysis”. The study covered 16 public limited cement
companies in private sector. He made study of analysis of profitability,
working capital, capital structure and activity of Indian cement industry.
In his research he revealed various problems of cement industries and
suggested remedies for the problems. He also suggested for the
improvement of profitability and techniques of cost control.
Dr. Kumar Bar Das published a comprehensive book in 1987
which covered period from 1970 to 1980. He concluded various aspects
like factor productivity, location degree of competition capacity
utilization, size efficiency financial performance, distribution pattern and
government policies with respect to pricing and distribution. He indicated
that all profitability ratios decrease gradually and became negative for
1973-74 and 1974-75 but improved gradually thereafter.
Chakravarty and Reddy made study on ratio analysis as major tool
for financial performance by studying 22 ratios of productivity,

A Study of Productivity and Financial Efficiency of Textile Industry of India
92
profitability proprietary, liquidity and turnover groups of the industries
for the period from 1961 to 1971.
Some institutes like DGCI&S, IEEMA, and Commerce Research
Bureau ELCINA. The Economic Times, CETMA etc have attempted to
study the general problem related to industry.
Prof. Amit Mallick and Debasish Sur presented an article on Tea
Industry “Working Capital and Profitability - a case study in interrelation
which was published in the Management Accountant, November 1998. It
explores the correlation between ROI and several ratios to working
capital management. They made analysis of the impact of working
capital on profitability by using simple correlation between ROI and each
of some important ratios of working capital.
The study was made by Kar A.P who had written an article in
December 1995 On “Need for Cost and Management Control in Indian
Tea Industry” in Management accountant. It gives different cost control
techniques to control the cost in tea industry.
Dutts S.K has written an article on “Indian Tea industry - an
Appraisal” which was published in Management Accountant in the year
of 1992. He analyzed the profitability, liquidity and financial efficiency
by using various ratios.

A Study of Productivity and Financial Efficiency of Textile Industry of India
93
Article expressing a study of Agro-Industry, chemical, Drugs &
Pharmaceuticals Industry “Risk and Return Analysis” (Case study of
selected industries) was published in” Journal of Accountant & Finance”
in April1994. It revealed complete scenario of various aspects of
Chemical, Drugs Pharmaceuticals and electronics Industry. It found out
different ratios such as return on investment, debt/equity and risk
classification that how risk, return related, and how it influences on the
selected industry.
Erich A.Helfert explained “The Importance of Performance Policy
for Owners/Potential Investors because they can know easily the financial
position of the company by return on net worth, return on common
equity, earnings per share, cash flow per share, dividend yield, dividend
coverage, price earning ratio, market to book value, pay out/retention.
Khan and Jain (2005) expressed uses of the financial statements,
profit planning and cost control, corporate decision-making whether they
were strategic, analytical or simple routine decision managers.
Kulshreshtha (1972) applied the concept accounting ratio to
analysis the statement analysis of Indian Paper Industry.
In their survey among 57 small firms in Canada, 105 largest firms
in the US and 39 largest firms in Australia, Khoury et al,(1999) attempted
to compare the working capital practice among three nations. The major

A Study of Productivity and Financial Efficiency of Textile Industry of India
94
aspects of the study were working capital policy, cash and equivalents,
account recoverable, inventory, accounts and note payable and managing
working capital itself. The study revealed that 7 % of the Canadian firms
had formal working capital polices and 28.5 % had a cautions working
capital policy. Further Canadian firms were learning more on the effect
on sales whereas the Australian and the US companies were found to
focus more on the impact on the firm’s profit while evaluating the credit
worthiness of the customers.
While many studies have noted that receivable management was a
neglected area, Oppedahl and Richard (1990) examined the causes for
such neglect. They found that managements were pre-occupied with
capital budgeting projects, which affected the quality of working capital
decision. The essay revealed that receivable constituted the most
important element of working capital and hence, recommended that the
managers need to be very cautious in the management of the same, in
order to minimize default risk. It is thus possible to note that management
of receivable is found inefficient not only in the Indian context but also in
other parts of the world. Considering the fact that the refinery industry is
poised for unprecedented growth, it is pertinent to examine the trends in
various measures of receivable management in the light of various
developments taking place in the place in the economy.

A Study of Productivity and Financial Efficiency of Textile Industry of India
95
3.3 Title of the Problem:
The title of the problem is “A Study of Productivity and
Financial Efficiency of Textile Industry of India” Financial
Performance of a business organization is largely depending upon the
relationship among five major parts’ performance analysis. Those are
given as below:
1. Relationship between cost of production and the selling price
affect them. In the age of globalization, this is a very vital question
to any industry.
2. Profit and profitability are also other considerable things. Due to
high degree of competition, the profit margin is decreased.
3. There are certain uncontrollable and controllable factors affecting
profits of the companies. It is hypothesized and by controlling the
controllable factors, the companies can improve their profit and
profitability.
4. There are rapid changes in Liquidity position (working capital)
determining factors i.e. manufacturing process and business
fluctuation.
5. Ability of the company to perform activity to utilize resources.
6. The companies faced multifarious problems during the study
period and still it is facing many problems which are if tackled
properly; the performance of the company will improve.

A Study of Productivity and Financial Efficiency of Textile Industry of India
96
This study is based on the secondary data drawn from published
annual reports of textiles companies under study. Various studies have
been conducted by the researcher but no significant research work seems
to have been under taken on the interpretation and analysis of
productivity and financial efficiency of the industry. Present attempt will
be an original contribution in this field as the problem of the study is
unique in every aspect.
3.4 OBJECTIVES OF THE STUDY:
The objective of the study is to analyze and interpret the
Productivity and Financial Efficiency of Textile Industry of India. “The
basic objectives are as under:
1. To examine the position of textiles industry
2. To measure the financial efficiency
3. To assess and comment on determinants of the production,
and productivity.
4. To suggest ways and means to improve performance
3.5 Hypothesis:
“A hypothesis is a special proposition, formulated to be tested in a
certain given situation as a part of research which states what the
researcher is looking for.”1 In the research study, two hypotheses have
been tested, these are as under:

A Study of Productivity and Financial Efficiency of Textile Industry of India
97
One-way Analysis of Variance Test (ANOVA)
It is useful for inter-unit comparisons.
Null Hypothesis for Financial Efficiency Analysis
1. There is no any significant difference between the gross profit
ratios of textiles companies.
2. There is no any significant difference between the operating ratios
of textiles companies.
3. There is no any significant difference between net profit ratios of
textiles companies.
4. There is no any significant difference between the Return on gross
capital employed ratio of textiles companies.
5. There is no any significant difference between the Return on net
capital employed ratios of textiles companies.
6. There is no any significant difference between the earning per
share ratios of textiles companies.
Hypothesis Based on Chi-square Test:
Chi-square test is useful for inter comparison. For establishing
casual relationship regression line of variable “Y” on variable “x” has
been calculated and with the help of regression equation of “Y” on “X”
calculated value of ‘YC’ has been computed for appropriate variables as
per the statement of Null Hypothesis (Ho) “There is no Significant

A Study of Productivity and Financial Efficiency of Textile Industry of India
98
difference between actual and computed variables on the regression line
in selected textiles companies of India.” If the calculated value of Chi-
square (X2) is higher than the table value of Chi-square, The arising
differences are significant and hence Null Hypothesis is rejected
otherwise accepted.
Alternative hypothesis (Ha): The statement of alternative
hypothesis describe, as “there is significant difference in actual and
computed variables if the null hypothesis is accepted, the alternative
hypothesis will be rejected or vice –versa.
Null Hypothesis (Ho):
The acceptance of the null hypothesis would suggest that there is
no significant difference between the productivity of the selected units,
which means that the productivity ratios of the units came from identical
populations, in such textiles companies of India as the comparison of the
productivity will have little significance. In contrast, the rejection of the
null hypothesis will reveal that there is significant difference between the
productivity ratios of the units, suggesting the usefulness of comparisons
the level of significance used in this case was at 5 percent, while degree
of freedom was (total no. of units –1) or (7-1=6) in the present study.
As per empirical study the self-existent assumptions are as under:
1. The data of industry by the postulate. However it is possible to
sketch conclusions of the individual company.

A Study of Productivity and Financial Efficiency of Textile Industry of India
99
2. There are such areas where the performance can be improved by
the effective management of resources. These areas include
production, productivity, financial efficiency and liquidity
position.
3. There are certain controllable and uncontrollable factors which are
effective to the profit of the companies. It is hypothesized and by
controlling the controllable factors, the company can justify their
profit performance
4. The selected units faced problems during the study period and
presently also. If the problems are tackled properly the
performance of liquidity, productivity, and financial efficiency
stand and will be improved as per determined.
3.6 Scope of the Study:
There are approximately 1200 medium to large scale textile mills
in India. Twenty percent of these mills are located in Coimbatore.
(Tamilnadu).India has 34 million cotton textile spindles for
manufacturing cotton yarn. Cotton yarn account for 70 percent of India’s
textile exports (China has 40 million cotton spindles.) Of the Indian
textile yarn exports, almost 80 percent come from coarser yarns (counts
below 40s). Consequently, there is a need to upgrade the technology.
Indian Textile Industry is one of the largest textile industries in the world.
Today, Indian economy is largely dependent on textile manufacturing and
A Study of Productivity and Financial Efficiency of Textile Industry of India
100
exports. India earns around 27% of the foreign exchange from exports of
textiles. Further, Indian Textile Industry contributes about 14% of the
total industrial production of India. Furthermore, its contribution to the
gross domestic product of India is around 3% and the numbers are
steadily increasing. Indian Textile Industry involves around 35 million
workers directly and it accounts for 21% of the total employment
generated in the economy. Researcher has selected 7 (seven) companies
as the sample for this study. The sample has been selected considering
following factors:-
1.The data which are available for the period of study i.e. from 2002-
03 to 2007-08.
2.The companies, which are engaged only in production of textiles
products
3.The company should be organized by private sector in India.
4.The company should be listed in Stock Exchanges of India.
The following seven companies have been chosen for the study:
1. Siyaram Silk Mills Ltd.
2. Digjam Ltd.
3. Oswal Spinning & Wvg. Mills Ltd.
4. Shri Dinesh Mills Ltd.
5. Welspun India Ltd.
6. S Kumars Nationwide Ltd.

A Study of Productivity and Financial Efficiency of Textile Industry of India
101
7. Mafatlal Industries Ltd.
Analysis of productivity and financial efficiency of textile Industry
in India of the above companies covered in the present study is fully
examined. The conclusion drown and suggestions attempted will provide
practical guidance to the management of the companies to promote for
improvement of Financial Performance of their companies, as well as
Financial manager and workers for talking decision related to their own
regards of interest.
3.7 Period of the Study:
The study of Analysis of productivity and financial efficiency of
Textiles Industry of India is made for the period of six years from
accounting year 2002-03 to 2007-08. Researcher has selected the base
year 2002-03.This year is normal for the purpose of analysis and
evaluation.
3.8 Data collection and data analysis
“Research is a process of a systematic and in-depth study or search
of any particular topic, subject or area of investigation, backed by the
collection, compilation, presentation and interpretation of relevant details
or data. It is a careful search or inquiry into any subject or subject matter,
which is an endeavour to discover or find out valuable facts, which
would be useful for further application or utilization”2 researchers and

A Study of Productivity and Financial Efficiency of Textile Industry of India
102
analysis of management problems would result in certain conclusions by
means of logical analysis.
For the purpose of study of Productivity and Financial Efficiency
of Textiles Industry of India, the secondary data are used. As definition
point of view “the term secondary data refers to the stastical material
which is not originated by investigator him self but which he obtains
from some one’s records”3 Secondary data, which were not gathered
specially to meet the needs of the problem at hand. For the study, data
have been collected for the period six years from 2002-03 to 2007-08
from published annual Reports from their registered offices or stock
exchanges by visiting personally or by post. Other publications have also
been used such as stock exchange official directory, Economics times,
Financial Express, R.B.I. Bulletin, Other periodicals Journals.
Personal interviewing of the additional director, Chairmen,
Directors, Joint president, Company secretary, chief accountant, General
Manager Finance, Executives Joint technical advisory (planning), and
assistant Director Technical) have been consulted to collect some
keynote information of the Companies of Textiles of Industry.
The figure contained in the annual reports and accounts have been
rounded off to crores up to two decimal points. All the collected data
have been presented and formulating in the form of condensed balance

A Study of Productivity and Financial Efficiency of Textile Industry of India
103
sheet and income statement. All the ratios and mentioned statement have
been analyzed and interpreted.
As conclusion point of view interfirm comparision has been made
for analysis of performance of selected companies. Various techniques of
analysis e.g. Ratio analysis, Trend analysis, Regression, Graphs, Means,
Diagrams. Percentage and simple average Methods have been used for
the presentation and interpretation of the data and at the end on basis of
the conclusion, some suggestions have been made for development of
performance.
3.9 (I) Tools for Analysis
For the present study, following tools have been used for analysis
of performance of Textiles Industry.
(1) Concept of Variable:
The variable used in the present study is (i) out put (ii) input both
are as under:
(i) OUTPUT:
It is an important variable. It may be presented in physical units or
in monetary values. Generally output is measured with the help of an
index of physical production. Under certain circumstances, the use of
sales in property weighted physical units in lieu of production is also
found. In addition, sometimes, Physical capacity is taken to measure
output. According to Prasad N.K. “the output consists; it may be

A Study of Productivity and Financial Efficiency of Textile Industry of India
104
measured in term of sales values of quantity or both. Monitory sales
value is however, not true measure of output because due to the varying
profit margins and marketing costs, it fluctuates from period to period
and hence is not comparable. Quantitative data volume or number of
units are better measures of output but where varieties of products are
manufactured and the product mix and types, specifications and qualities
of the products are liable to change from time, data are rendered un
comparable. The commonly adopted method is to take both sales values
and quantity adopted method is to take both sales values and quantity into
account for measuring output” in the present study both sales revenue and
quantity have been taken in to account for measuring the output and units
of outputs.
(ii) Input:
Input comprises of a number of diverse factors. It is not possible to
have a common physical unit for measurement of all these factors labour,
material, overheads, fuel, and power. These factors constitute the main
inputs of an industry.
(2) Ratio Analysis:
Ratio is well known and most widely tool of financial analysis can
be defined as “the indicated quotient of two mathematical expression.” as
operation definition or ratio is the relationship between one item to
another in a simple mathematical form.” a ratio is simply one number

A Study of Productivity and Financial Efficiency of Textile Industry of India
105
expressed interims of another. It is found by dividing one number the
base into the other”4
“Generally there are two methods of expressing relationship in
ratios”5 (i) The percentage method like 100 percent etc. “Analysis use
ratio to connecting different parts of the financial statements in a to find
clues about the status of particular aspects of the business”6 (ii) The
Phrase method such as one and half to one and two for one. Ratio is
useful analysis for financial statement. It is conveniently and clearly
capsulize the data in a form that is easily understood interpreted as “ratio
are simply a means of highlighting in arithmetical terms, the relationship
between figures drawn from financial statements”7 The technique of ratio
analysis is the process of determining and interpreting numerical
relationship based on the financial statements
According to Batty “accounting ratio describe the significant
relationship which exist between figures shown in a Balance sheet, in a
profit and loss account, in a budgetary control system or another part of
accounting organization”8
It concludes whether the financial condition of a business
enterprise is good or bad it is universally used for appraising the
performance of a business firm.

A Study of Productivity and Financial Efficiency of Textile Industry of India
106
(3) TREND ANALYSIS:
The ratio analysis gives a reasonable good picture but it is
incomplete in on important respect- it ignores the time dimension. The
radios are snapshots of the picture at one point in time but there may be
trends in motion that are in the process of rapidly eroding a relatively
good present position”9Trend analysis is tool of analysis the financial
statement in more simplified form over a period of years, “Trend analysis
is horizontal analysis of financial statements often called as ‘pyramid
method’ of ratio analysis-a guide to yearly changes.”10
In the wards “one of the most useful forms of horizontal analysis is
trend analysis. It is especially helpful in revealing proportionate change
over time in selected financial data.”11 Trend analysis makes it easy to
understand the changes in an item over a period of time and to draw
conclusions regarding the changes in data. For analyzing the trend of data
depicts in the financial statements it is necessary to have statements for a
number of years. This method involves the interpretation of the
percentage relationship that each statement item, bears to the same item
in the ‘base year.’
(II) Statistical Tools
Statistical tools are utilized for data analysis and interpretation of
the firm. A brief outline of the various statistical techniques being used
for present study:

A Study of Productivity and Financial Efficiency of Textile Industry of India
107
(1) CHI-SQUARE TEST:
The Chi-square test (x2) is one of the widely used non-parametric
tests among the several tests of significant developed by statisticians.
Chi-square pronounced as Ki-Square.According to Ullman Neil R”Chi-
square as a non parametric test it can be used to determine if categorical
data shows dependency or the two classifications is independent. It can
be also be used to make comparisons between theoretical populations and
actual data when categories are used”12 the formula used for calculation
of chi-square is as following 13
(O-E) 2
CHI-SQUARE (X2) = E
Where ‘O’ denotes the observed values and ‘E’ refers to the
expected values. The expected value will be calculated with the help of
Regression analysis and time series analysis. Chi-square distribution and
critical values of Chi-square are obtained from the tables of Chi-Square
disribution. The expected values will be determined with the help of
assumption where the data come from the hypothesized distribution. The
Chi-Square distribution is a continuous probably distribution which has
the value zero at its lower limit and extraction.
(3) INDEX NUMBERS
“Index number as a number which is used to measure the level of a
given phenomenon as compared to the level of the same phenomenon at

A Study of Productivity and Financial Efficiency of Textile Industry of India
108
same standard date”17 Index numbers nothing more than a relative
number, or a relative which expresses the relationship between two
figures, where one of the figures is used as a base present study indices of
sales, production and capacity utilization of selected Textiles of
companies have been found out by taking 1997-98 as the base year and
indices of the rest years have been calculated.
(4) ARITHMETIC MEAN
It is called as the average of difference of the values of items from
some average of the series. According to Gulerian “the most commonly
used average is the arithmetic mean, briefly referred to as the mean”18 the
mean has been found by adding all the variables and dividing it by the
total number of years taken.
(5) STANDARD DEVIATION
Standard deviation may be defined as positive square root of the
variance. While the variance of a sample is the average square deviation
of values from the mean 19
(6) CO-EFFICIENT OF VARIATION:
Co-efficient of variation has been defined as the percentage of the
standard deviation to the mean. It should be noted that higher the
variability the greater would be the co-efficient of variation. Therefore, it
may be pointed out that for the stability of results, Co-efficient of

A Study of Productivity and Financial Efficiency of Textile Industry of India
109
variation must be low. Co-efficient of variation (C.V.) may be calculated
with the help of standard deviation and mean 20
Standard Deviation Co-efficient of variation= ___________________________________x 100 Arithmetic Mean
3.10 CHAPTER PLAN
The present study is divided into nine chapters, which are as under:
CHAPTER–1
PROFILE OF TEXTILE INDUSTRY IN INDIA
This chapter deals with the historical background –Colonization –
An end of the Indian textile legacy-MFA Quota Removal and Indian
textile exports-Overview of the global textile market-Share in world trade
by region-Indian textile Indian present scenario-Process of globalization-
Re-emergence of the India Textile Industry-Current undercurrent in
Indian textile industry -Vision for future- Conclusion- introduction of
selected companies.
CHAPTER–2
CONCEPTUAL FRAMEWORK OF FINANCIAL EFFIEICNCY
AND PRODUCTIVITY MANAGEMENT
This chapter deals with introduction and concept of financial
performance and financial analysis – Legal provisions of financial

A Study of Productivity and Financial Efficiency of Textile Industry of India
110
statements – Types of financial statements – Importance and Usefulness
of financial statements – Need and Aims of financial performance
CHAPETR – 3
RESEARCH DESIGN
Details of this chapter is - Problem Identification – Survey of
Existing Literature- Statement of Problem – Objectives of the study-
Hypothesis – scope of Study – Sampling Design –- Period of Study- Data
collection and data analysis - Tools and techniques for analysis of
productivity and financial efficiency of textile industry– chapter plan and
Limitations of the study.
CHAPTER- 4
ANALYSIS OF FINANCIAL EFFICIENCY
This chapter describes the concept of financial efficiency,
profitability, difference between profit and profitability, measurement
tools such as gross profit ratio, operating profit ratio, net profit ratio,
return on gross capital employed, Return on net capital employed, Return
on net worth and earning per share. ANOVA test has been used with
conclusion of the chapter.

A Study of Productivity and Financial Efficiency of Textile Industry of India
111
CHAPTER – 5
ANALYSIS OF MATERIAL PRODUCTIVITY
This chapter covers concept of Material productivity – Significance
of Material productivity – Calculation of material productivity-Index and
Trend analysis –Chi-square test – Co-variance and co-efficiency of Index.
CHAPTER – 6
ANALYSIS OF LABOUR PRODUCTIVITY
This chapter deals with concept of labour productivity-Methods
and measurement of labour productivity-factor affecting the productivity-
Significance and limitation of labour productivity -unit wise calculation
and interpretation and combative analysis. Index and trend analysis –
Chi-square test – Co-variance and co-efficiency of Index.
CHAPTER – 7
ANALYSIS OF OVERHEADS PRODUCTIVITY
This chapter deals with concept of overheads productivity-Methods
and measurement of overheads productivity-Overheads productivity
ratio-Indices-Co-efficiencies, co relationship-input output ratio as well as
chi-square test.

A Study of Productivity and Financial Efficiency of Textile Industry of India
112
CHAPTER – 8
ANALYSIS OF OVERALL PRODUCTIVITY
This chapter deals with concept of overall productivity-Methods
and measurement of overall productivity-overall productivity ratio-
Indices-Co-efficiencies co relationship-input output ratio as well as chi-
square test.
CHAPTER – 9
SUMMARY, FINDINGS AND SUGGESTIONS
This chapter gives its emerging conclusion based on the analysis
carried out and points out the variations if any from the literature.
Besides, it also gives concrete suggestions for enhancing profitability, for
financial soundness, for cost reduction and control and liquidity position.
3.10 Limitations of Study
This study is based on secondary data taken from published annual
reports of selected textile companies.
1. There are different approaches to measure the profitability, financial
efficiency and operational efficiency with regard to productivity in
this regard expert views differ from one another.
2. The different views have been applied in the calculation of different
ratios.

A Study of Productivity and Financial Efficiency of Textile Industry of India
113
3. The present study is largely based on ratio analysis. It has its own
limitations.
References:
1. MICHAEL V.P. “Research methodology in management” Himalayan
Publishing house, Bombay, 1985,p.No.107
2. BRADLEY J.V. “Distribution free statistical tests. “Prentice Hall Inc.
New Jersey, p.129
3. Ibidem, P.No. 2
4. ANTHONY ROBERT R. “Management accounting-Tex and
cases”Richrd D.Irwin inc.illinois, 1964.p.297
5. SHARMA R.P. “Corporate financial structure”printwell publishers,
Jaipur-302004, p.6
6. PERSON HUNT, WILLIAMS M. CHARLES AND DONALDSON
GORDON “Basic Business Finance-Tex and cases, Richad D.Irwin
inc.illonois, 1966, p.141.
7. POWAL L.S. AND KUMAR VINOD “Financial statements analysis
and prediction of future of return: A case study of engineering
industry”, Charted accountant, 11th May 198,P.988
8. BATTYJ.“MANAGEMENT CCOUNTACY”Orient longmens, New
Delhi, 1966, P.394.

A Study of Productivity and Financial Efficiency of Textile Industry of India
114
9. WESTON J. FRED AND BRIGHAM EUGENE F. “Essentials of
managerial finance”Holt, Rinehart and Winston Inc. New York,
1968,p.No.49
10. VERMA B.H.“Analysis of financiastetement”Arihantpublishers,
Jaipur, 1988,p.No.54
11. WALGENBACH PAUL H., DITTRICH, NORMAN E AND
HANSON, EARNEST I, “Accounting and introduction, Harcourt
brace Jovanovich Inc, New York, 1973,p.455
12. ULLMAN NEIL R “Elementary statistics-an applied approach”p.234,
cited in Kothari C.R.“Research Methodology-Methods and
Techniques”Wishwa prakashan, New Delhi, 1997, p.277.
13. STEVENSON W.J. “Business statistics” Harper and Row, New York,
1978.p.299
14. STEVENSON W.J.Op.Cit.P.No.229
15. STEVENSON W.J.Op.Cit.P.No.335
16. BRADLEY J.V Op.Cit.P.No.335-36
17. KOTHARI C.R. “Research Methodology –“Methods and techniques”
Wishwa Prakashan, New Delhi, 1997,p.18
18. GULERIAN R.C “stastistic for decision making” W.B. Saunders
Company, Philadelphia, P.29-30.
19. STEVENSON W.J.Op.Cit.P.p. -30-30.
20. GULERIAN R.C op.cit.P.P 29. -30.

A Study of Productivity and Financial Efficiency of Textile Industry of India
115
CHAPTER-4
ANALYSIS OF FINANCIAL EFFICIENCY
4.1 Concept of Efficiency and Performance
The word efficiency as defined by the Oxford dictionary states that:
"Efficiency is the accomplishment of or the ability to
accomplish a job with minimum expenditure of time and effort".1
It refers to the internal process that leads to output. It focuses on
the means to achieve the desired end. As expressed by Peter Drucker
"Doing the things the right way is Efficiency." This denotes the
fulfillment of the objective with minimum sacrifice of the available scarce
resource.
Fatless and speedy compliance to the process or system procedure is
a measure of efficiency. Providing a specified volume and quality of
service with the lowest level of resources capable of meeting that
specification, performance measures and or indicators are required. These
include measures of productivity, unit o volume of service etc. These
measures help in minimizing of the resources in achieving the
organizational objectives i.e., things rightly.
Performance is the execution or accomplishment of work feats etc.
or a particular, action, deed or proceeding is refers as performance.2
However, the manner in which or the efficiency with which something

A Study of Productivity and Financial Efficiency of Textile Industry of India
116
reacts or fulfils its intended purpose is defined as performance.
Performance may thus, mean different things to different businesses.
Success or failure in the economic sense is judged in relation to
expectations, return on invested capital and the objective of the
business concern.
In understanding the term performance, a clear distinction needs to
be drawn between Performance Measures and Performance Indicators.
Performance measures need to be based on cat evaluation of the causes
and effects of policy intervention whereas a performance indicator is less
precise and usually provides only intermediate measure of achievement.
4.2 Financial Performance
Financial Performance is the blue print of the financial affairs
of a concern and reveals how a business has prospered under the
leadership of its management personnel performance of any
organization can always be judged in the lights of light of its
objectives and the main objective of a bank is to earn profit and to
enlarge profit by making the most efficient use of the resources
available to them. The Indian Public Sector did run with the object
of maximizing profits. They were making due contribution towards
the fulfillment of socio-economic objectives lay down by the
government and SEBI.

A Study of Productivity and Financial Efficiency of Textile Industry of India
117
The financial performance of companies could be analyzed by a
composite index of not only quantifiable selected trends and ratios, an
analysis of the financial statements, a study of the cash flow and the
fund flow statements etc. but also qualitative factors like operational
efficiency and effectiveness and socio-economic development of the
country.
4.3 Financial Efficiency
Financial Efficiency is a measure of the organization’s ability to
translate its financial resources into mission related activities. Financial
Efficiency is desirable in all organizations regardless of individual
mission or structure.2 It measures the intensity with which a business
uses its assets to generate gross revenues and the effectiveness of
producing, purchasing, pricing, financing and marketing decisions.
At the micro level, Financial Efficiency refers to the efficiency
with which resources are correctly allocated among competing uses at a
point of time.3
Financial Efficiency is a measure of how well an
organization has managed certain trade offs (risk and return, liquidity and
profitability) in the use of its financial resources.4
Financial Efficiency is regarded efficiency and is a management
guide to greater efficiency the extent of profitability, productivity,
A Study of Productivity and Financial Efficiency of Textile Industry of India
118
liquidity and capital strength can be taken as a final proof of financial
efficiency.
It is interesting to note that sometimes, even sufficient profits can
mask inefficiency and conversely, a good degree financial efficiency
could be dressed with the absence & profit.
4.4 Operational Efficiency
Operational Efficiency of an organization is the ability utilizes its
available resources to the maximum extent Operational Efficiency
can be judged in the light of financial efficiency. It can be said that
neither profitability ratios turnover ratios by themselves provide
good indicators measure operational efficiency.
Operational Efficiency of a bank is associated with diverse
aspects such as operational cost effectiveness profitability,
customer services, priority sector lending, and deployment of
credit in rural and backward regions and mobilization of deposits.5
In short, it is said that it is the ability to utilize the available
resources in order to carry out operational activities of the aluminums
industry, which reveal its success failure in providing textile
products to its customers.

A Study of Productivity and Financial Efficiency of Textile Industry of India
119
4.5 Concept of Profitability
Profitability is the ability to earn profit from all the activities of an
enterprise. It indicates how well management of an enterprise generates
earnings by using the resources at its disposal. In the other words the
ability to earn profit e.g. profitability, it is composed of two words profit
and ability. The word profit represents the absolute figure of profit but an
absolute figure alone does not give an exact ideas of the adequacy or
otherwise of increase or change in performance as shown in the financial
statement of the enterprise. The word ‘ability’ reflects the power of an
enterprise to earn profits, it is called earning performance. Earnings are
an essential requirement to continue the business. So it can be said that a
healthy enterprise is that which has good profitability. According to
hermenson Edward and salmonson ‘profitability is the relationship of
income to some balance sheet measure which indicates the relative ability
to earn income on assets employed. 6
4.6 Profit and Profitability
Profits are the cream of the business without it may not serve the
purpose .it is true that “profits are the useful intermediate beam towards
which capital should be directed” 2 Weston and Brigham mentioned that “
to the financial management profit is the test of efficiency and a measure
of control to the owners a measure of the worth of their investment, to the
creditors the margin of safety, to the government a measure of taxable

A Study of Productivity and Financial Efficiency of Textile Industry of India
120
capacity and a basis of legislative action and the country profit is an index
of economic progress national income generated and the rise in the
standard of living.” 8 While profitability is an outcome of profit. In the
other words no profit derived towards profitability. “It may be remarked
that the profit making ability might denote a constant or improved or
deteriorated stare of affairs during a given period, thus, profit is an
absolute connotation were as profitability is a relative concepts.” 9 Profit
and profitability are two different concepts, although they are closely
related and mutually independent, playing distinct role in business.
R.S.Kulshrestha mentioned that “profit in two separate business concerns
might be the same and yet more often they note their profitability could
differ when measured in terms of the size of investment” 10 as outcome of
above statement it can be said that profitability is broader concept
comparing to the concept of profit levels of profitability helps in
establishing quantitative relationship between profit and level of
investment or sales.
4.7 Measurement Tool of Profitability:
For making policy decision under different situations,
measurement of profitability is essential. According to Murthy V.S. “The
most important measurement of profitability of a company is ratio. E.g.
profitability of assets, variously referred to as earning power of the
company, return on total investment or total resources committed to

A Study of Productivity and Financial Efficiency of Textile Industry of India
121
operations. 11 Profitability ratios are calculated to measure the operating
efficiency of the firm. According to Block and Hirt “The income
statement is the major device for measuring the profitability of a firm
over a period of time.” 12 Measurement of profitability is as essential as
the earning of itself for the business concern. Some managerial decision
like rising of additional finance, further expansion, problems of bonus
and dividend payments rest upon this measurement. It can be measured
for a short term and as well as for a ling term. The relation to sales is the
good short-term indication of successful growth while profitability in
relation to investment is the healthier for long growth of the business.
Profitability provides overall performance of a company and useful tool
for forecast measurement of a company’s performance. “The overall
objective of a business is to earn a satisfactory return/profit on the funds
invested in it, while maintaining a sound financial position profitability
measures financial success and efficiency of management. 13
The importance of profitability performance can be seen from the
reality that besides the management and owners of the company, financial
institutions, creditors, bankers also look at its profitability. Appraisal of
performance as regards to profitability can be drawn from interpreting
various ratios. However there are few factors affected to the firm’s
profitability. Each factor in turn will affect the profitability ratio. Diagram
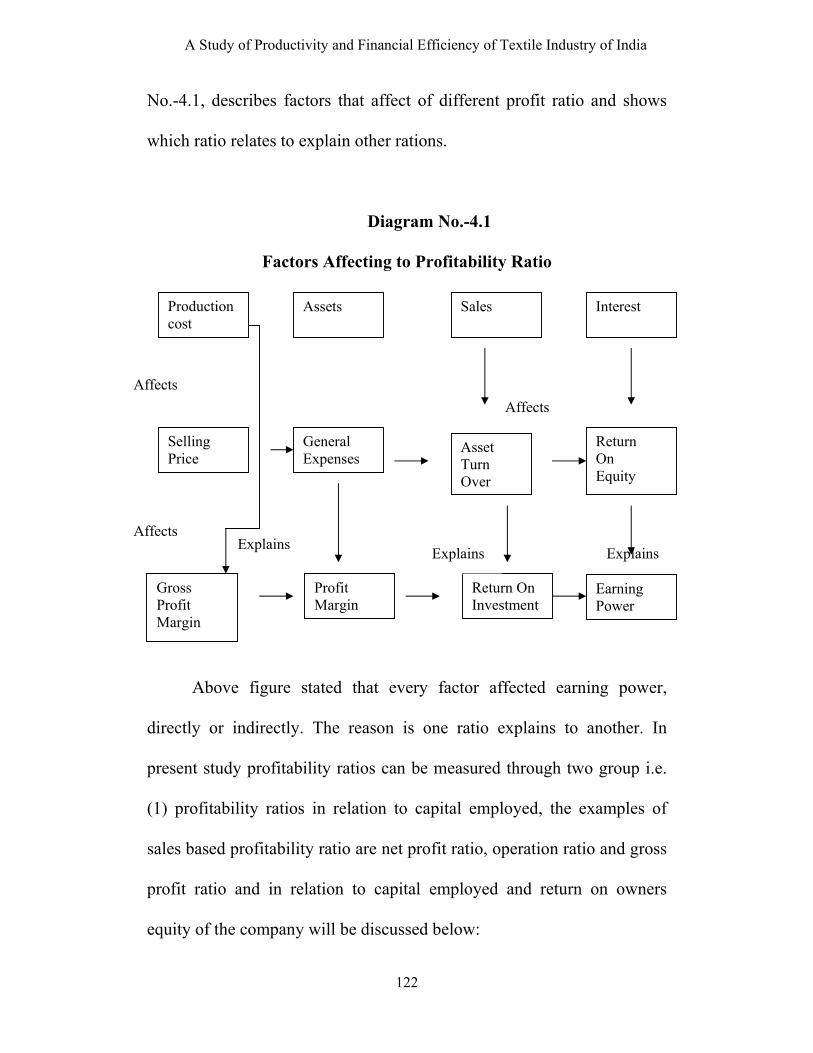
A Study of Productivity and Financial Efficiency of Textile Industry of India
122
No.-4.1, describes factors that affect of different profit ratio and shows
which ratio relates to explain other rations.
Diagram No.-4.1
Factors Affecting to Profitability Ratio
Above figure stated that every factor affected earning power,
directly or indirectly. The reason is one ratio explains to another. In
present study profitability ratios can be measured through two group i.e.
(1) profitability ratios in relation to capital employed, the examples of
sales based profitability ratio are net profit ratio, operation ratio and gross
profit ratio and in relation to capital employed and return on owners
equity of the company will be discussed below:
Production cost
Assets Sales Interest
Asset Turn Over
General Expenses
Selling Price
Return On Equity
Gross Profit Margin
Profit Margin
Return On Investment
Earning Power
Explains Explains
Affects
Affects Explains
Affects

A Study of Productivity and Financial Efficiency of Textile Industry of India
123
(I) Profitability ratios in relation to sales
(1) Gross Profit Ratio:
“The excess of the net revenue from sales over the cost of
Merchandise sold is called gross profit, gross profit on sales or gross
margin” 14 this ratio calculated by dividing gross profit by net sales and is
usually expressed as a percentage. The formula of gross profit ratio is
given below:
Gross Profit Ratio = Sales – Cost Of Goods Sold X 100 Sales
The gross profit ratio highlights the efficiency with which
management produces each unit of products as well as it indicates the
average spread between the cost of goods sold and the sales revenue. Any
fluctuation in the gross profit ratio is the result of a change in cost of
goods sold or sales or both. A high gross profit ratio is a mark of
effectiveness of management. The gross profit ratio may increase due to
any of the below factors.
1. Lower cost of goods sold where sales prices remaining constant.
2. Higher sales prices where cost of goods sold remaining constant.
3. An increase in the proportionate volume of higher margin items
4. A combination of variations in sales prices and costs. While in the
case of low profit ratio it may be reflected higher cost of goods sold due
to firm’s inability to purchase at favorable terms, over investment in plant

A Study of Productivity and Financial Efficiency of Textile Industry of India
124
and machinery etc. secondly this ratio will also be low due to a decrease
in price in the market. Table No.5.1 Shows the gross profit ratio of some
selected companies of textile industry in India with the average value.
The gross profit ratio of selected companies of textile industry in
India is given in the Table No.4.1. The table shows the gross profit ratio
of the selected companies of textiles industry.
Table No.:- 4.1
Gross Profit Ratio of selected textiles companies in India
(2002-03to 2007-08) (In percent)
COMPANY
2002-
03 2003-04 2004-05
2005-
06
2006-
07
2007-
08 AVE. S.D. C.V. Min Max
SS M L 4.89 4.51 5.17 6.30 5.70 4.22 5.13 0.77 15.01 4.22 6.30
DGL -1.25 -14.95 -6.88 5.43 -12.03 0.25 -4.91 7.78 -158.53 -14.95 5.43
O S & W ML -2.56 -2.88 -0.49 8.41 3.27 28.07 5.64 11.78 208.98 -2.88 28.07
SDML 8.94 9.00 11.36 20.40 20.91 14.62 14.21 5.41 38.09 8.94 20.91
WIL. 14.75 16.64 16.89 17.31 18.22 14.21 16.34 1.54 9.46 14.21 18.22
S K N L -3.49 -2.77 -57.42 16.35 15.75 18.65 -2.16 28.82 -1337.24 -57.42 18.65
MFTL. 8.91 -26.36 -7.11 9.59 -15.75 14.25 -2.75 16.26 -592.51 -26.36 14.25
AVE. 4.31 -2.40 -5.50 11.97 5.15 13.47 4.50 10.34 -259.53 -10.61 15.98
S.D 6.96 14.56 24.58 5.94 14.53 9.15 8.38 9.82 538.26 24.95 8.07
C.V. 161.44 -606.36 -447.12 49.66 282.05 67.97 186.16 94.98 -207.39 -235.28 50.51
Sources: computed from annual reports of respective companies.

A Study of Productivity and Financial Efficiency of Textile Industry of India
125
Table No.4.1 shows the gross profit ratio in relative terms as
percent of net sales. As regards the, SS M L the gross profit ratio varies
from 4.22 percent to 6.30 percent. It shows the overall fluctuation in the
ratio within the study period. The gross profit ratio of SS M L was
highest in the year 2005-05 the value of the ratio in this year was 6.30.
The lowest value of the ratio was in the year 2007-08. From the year
2002-03 the trend of the ratio is declining. In the year 2004-05 the value
of the above said ratio was 5.17. The average value of the gross profit
ratio of SS M L is 5.13 percent. The standard deviation is 0.77 percent
and co-efficient of variation 15.01 percent which showed high fluctuation
in gross profit ratio during the study period. If so the ratio of the company
is fluctuating during the research study.
The given Table No.4.1 shows the gross profit ratio of the DGL
from 2002-03 to 2007-08. The trend of the ratio is upward and fluctuated
during the study period. The gross profit ratio of the DGL was 4.53
percent in the year 2007-08 which is highest in the year 2006-07. The
average value of the ratio is -4.91 with standard deviation of 7.78 and co-
efficient of variation of 208.98 percent. In the year 2005-06, and 2006-07
the value of the ratio was more than the average value of the ratio which
is good indication for the better development of the company. The
company has not maintained its good gross profit ratio during the study
period.

A Study of Productivity and Financial Efficiency of Textile Industry of India
126
Table No.4.1 expressed the gross profit ratio or the O S & W ML
from 2002-03to 2007-08. The gross profit ratio of the above said
company is very poor and sometimes it shows the near to one percent and
negative only which is the sign of poor management of the company. The
highest ratio of the company was in the year 2007-08 and the value was
28.07. The lowest value of the ratio is minus 2.88 in the year 2003-04. So
this year shows the very critical for the company.

A Study of Productivity and Financial Efficiency of Textile Industry of India
127
Graph No. 4.1Gross profit ratio
-70.00
-60.00
-50.00
-40.00
-30.00
-20.00
-10.00
0.00
10.00
20.00
30.00
40.00
2002-03 2003-04 2004-05 2005-06 2006-07 2007-08 AVE.
years
Rat
io
SS M L DGL O S & W ML SDML WIL. S K N L MFTL.

A Study of Productivity and Financial Efficiency of Textile Industry of India
128
The trend of the ratio is upward from the year 2005-06 but not
satisfactory. The average value of gross profit ratio of above said
company during the study period is 5.64 percent which are once again
poor. The standard deviation has been 11.78 percent and co-efficient of
variation has been 208.98 percent which has shown high fluctuation in
gross profit ratio the O S & W ML.
The above Table No.4.1shows the gross profit ratio of SDML from
the year 2002-03 to 2007-08. The trend of the above ratio is up-ward.
The gross profit ratio of the company is ranged between 8.94 percent in
2002-03 and 20.91 percent in 2007-08 with an average of 14.21. The
standard deviation is 5.41 and co-efficient of variation is 38.09 which
shows high fluctuation in gross profit ratio of SDML. The gross profit
ratio of the company is up to the mark. The company could generate
sufficient sales to earn gross profit and by keeping a very low cost of
goods sold.
The Table No.4.1 indicates that gross profit ratio of WIL. The trend
of the gross profit ratio is fluctuating with an average of 16.34 percent.
The gross ratio is 14.75 percent in 2002-03 which then inclined to 16.64
percent in 2003-04 and rose to 16.89 percent in 2004-05. The ratio is
17.31 percent in 2005-60 and again it went up to 18.22 percent and in
2006-07 in the last to years of the study period the ratio has been 14.21
percent. The standard deviation is 1.54 percent and co-efficient of

A Study of Productivity and Financial Efficiency of Textile Industry of India
129
variation is 9.46.The performance of the company is poor because
company could minimize the cost of goods sales.
Table No.4.1 expressed the gross profit ratio or the S K N L from
2002-03 to 2007-08. The gross profit ratio of the above said company is
very poor and sometimes it shows the near to one percent and negative
only which is the sign of poor management of the company. The highest
ratio of the company was in the year 2007-08 and the value was 18.65.
The lowest value of the ratio is minus 57.42 in the year 2004-05. So this
year shows the very critical for the company. The trend of the ratio is
upward from the year 2005-06 but not satisfactory. The average value of
gross profit ratio of above said company during the study period is minus
2.16 percent which are once again poor. The standard deviation has been
28.82 percent and co-efficient of variation has been 1337.24 percent
which has shown high fluctuation in gross profit ratio the S K N L.
The Table No.4.1 indicates that gross profit ratio of MFTL. The
trend of the gross profit ratio is fluctuating with an average of minus 2.75
percent. The gross ratio is 8.91 percent in 2002-03 which then declined to
minus 26.36 percent in 2003-04 and rose to minus 7.11 percent in 2004-
05. The ratio is 9.59 percent in 2005-06 and again it went down to
minus15.75 percent and in 2006-07 in the last to years of the study period
the ratio has been 14.25 percent. The standard deviation is 16.26 percent
and co-efficient of variation is minus 592.51.The performance of the

A Study of Productivity and Financial Efficiency of Textile Industry of India
130
company is poor because company could minimize the cost of goods
sales.
On the basis of above analysis it can be said that the gross profit
ratio of WIL was the highest followed by SDML, O S & W ML, SS M L,
S K N L and MFTL. The MFTL DGL MFTL and S K N L Company
needs to increase sales turnover and try to control cost of goods sold. The
gross profit ratio of DGL was not up to the mark.
Gross Profit Ratio (ANOVA Test)
• Null Hypothesis: There is no any significant difference in Gross
Profit Ratio of textiles units under study.
• Alternative hypothesis: There is significant difference in Gross
Profit Ratio of textiles units under study.
• Level of Significance: 5 percent
• Critical value: 2.48
• Degree of freedom: 41

A Study of Productivity and Financial Efficiency of Textile Industry of India
131
Table No.4.2
Gross Profit Ratio one way ANOVA test
Source of
Variation SS df MS F P-value F crit
Between
Groups 1989.71 5.00 397.94 2.00 0.10 2.48
Within Groups 7169.95 36.00 199.17
Total 9159.66 41.00
Since F critical > F cal (at 5% significance level), the alternative
hypothesis is accepted and null hypothesis is rejected and hence it is
concluded that the Gross Profit ratio does differ significantly.
2 Operating Profit Ratio
This ratio indicates the relationship between operating profit and
net sales in the form of percentage. Operating profit arrived at by
adjusting all non-operating expenses and incomes in net profit in the
other words it can be said profit before depreciation and taxes. A
consistently high ratio tells us the effective and efficient operation of the
business. This ratio helps find out the profit arising out of pure production
process i.e. the main business of production and sales. Thereby reflecting
the effect of other incomes and expenses included in net profit.

A Study of Productivity and Financial Efficiency of Textile Industry of India
132
Operation Profit Operating Profit Ratio = -----------------------x 100
Net Sales
Operation profit = Sales- (Cost of goods sold + operational expenditure)
Table No.:4.3
Operating profit Ratio of Selected textiles companies in India
(2002-03 to 2007-08). (In percent)
COMPANY 2002-03 2003-4 2004-05 2005-06 2006-07 2007-08 AVE. S.D. C.V. Min Max
SS M L 7.87 7.62 8.61 9.39 8.61 6.98 8.18 0.86 10.49 6.98 9.39
DGL 11.23 0.39 4.19 10.45 -5.78 5.38 4.31 6.39 148.17 -5.78 11.23
O S & W ML 4.76 4.30 5.98 14.45 9.22 32.07 11.80 10.62 90.05 4.30 32.07
SDML 14.89 14.24 14.43 25.15 25.61 20.03 19.06 5.35 28.06 14.24 25.61
WIL. 19.40 20.54 22.29 24.20 24.28 20.52 21.87 2.05 9.39 19.40 24.28
S K N L 6.85 7.23 -50.89 20.65 20.14 21.47 4.24 27.84 656.24 -50.89 21.47
MFTL. 15.66 -14.32 3.34 21.65 -11.07 16.21 5.25 15.17 289.20 -14.32 21.65
AVE. 11.52 5.71 1.14 17.99 10.14 17.52 10.67 9.75 175.94 -3.72 20.81
S.D 5.35 11.03 23.89 6.50 14.41 9.15 7.24 9.36 234.04 23.73 8.01
C.V. 46.40 193.05 2103.54 36.14 142.04 52.24 67.84 96.01 133.02 -637.06 38.50
Sources: Annual Reports and Accounts of respective companies.
The above Table No.4.3 shows the operating profit ratio of selected
companies of textiles companies in India the above table shows the
operating profit ratio of SS M L from the year 2002-03 to 2007-08.The
trend of the operating profit ratio of the above said company is fluctuating
during the study. The highest value of the operating profit ratio of above
company was 9.39 in the year 2005-06 and the lowest value of the ratio
was 6.98 in the year 2007-08. The average value of the ratio is 8.18

A Study of Productivity and Financial Efficiency of Textile Industry of India
133
percent with a fluctuating trend. The standard deviation was 0.86 and co-
efficient of variation was 10.49 percent which showed slightly fluctuation
in the gross profit ratio. The ratio of the company is satisfactory.
The above Table No.4.3 shows the operating profit ratio of DGL
from the year 2002-03 to 2007-08. The trend of the operating profit ratio
of the above said company is slow fluctuating and negative in some years
during the study. The highest value of the operating profit ratio of above
company was 11.23 percent in the year 2002-03 and the lowest value of
the ratio was minus 5.78 percent in the year 2006-07. The standard
deviation was 6.39 percent with the average value of the ratio is 4.31
percent. The ratio of the company is not satisfactory.
The above Table No.4.3 shows the operating profit ratio of O S &
W ML from the year 2002-03 to 2007-08. The trend of the operating
profit ratio of the above said company is increasing with an average of
11.80 percent during the study. Operating profit ratio of O S & W ML has
been ranged between 4.30 percent in 2003-04 and 32.07 percent in 2007-
08.The standard deviation of the ratio was 10.62 percent and Co-efficient
of variation was 90.05 percent.
The above Table No.4.3 showed the operating profit ratio of
SDML with highly fluctuated trend. The ratio ranged between 25.61
percent in 2006-07 and 14.24 percent in 2003-04 with an average of
19.06 percent. The operating profit ratio in the 2005-06 and 2006-07 and

A Study of Productivity and Financial Efficiency of Textile Industry of India
134
2007-08 was so good. However, overall operating profit ratio was
satisfactory due to low cost of goods sold. The standard deviation was
5.35 percent and co-efficient of variation was 28.06 percent. The
company should still try to control production expenses to earning better.
The above Table No.4.3 shows the operating profit ratio of
WIl.from the year 2002-03 to 2007-08. The trend of the operating profit
ratio of the above said company is fluctuating during the study. The
highest value of the operating profit ratio of above company was 24.28 in
the year 2006-07 and the lowest value of the ratio was 19.40 in the year
2002-03. The average value of the ratio is 21.87. The standard deviation
was 2.05 percent and 9.39 percent. The ratio of the company is
satisfactory.

A Study of Productivity and Financial Efficiency of Textile Industry of India
135
CgartNo.4.2 operating profit ratio
-50.00
0.00
50.00
100.00
150.00
200.00
SS M L DGL O S & W ML SDML WIL. S K N L MFTL. AVE.
year
Rat
io
2002-03 2003-04 2004-05 2005-06 2006-07 2007-08 AVE.

A Study of Productivity and Financial Efficiency of Textile Industry of India
136
The above Table No.4.3 shows the operating profit ratio of S K N
L from the year 2002-03 to 2007-08. The trend of the operating profit
ratio of the above said company is slow fluctuating and negative in some
years during the study. The highest value of the operating profit ratio of
above company was 21.47 percent in the year 2007-08 and the lowest
value of the ratio was minus -50.89 percent in the year 2004-05. The
standard deviation was 27.84 percent with the average value of the ratio
is 4.24 percent. The ratio of the company is satisfactory except in the year
of 2004-05.
The above Table No.4.3 shows the operating profit ratio of
MFTL.from the year 2002-03 to 2007-08. The trend of the operating
profit ratio of the above said company is fluctuating during the study. The
highest value of the operating profit ratio of above company was 21.65 in
the year 2005-06 and the lowest value of the ratio was minus 14.32 in the
year 2003-04. The average value of the ratio is 5.25. The standard
deviation was 15.17 percent and 289.20 percent. The ratio of the
company is not satisfactory.
On the basis of above analysis a researcher can conclude that the
operating was very good in WIL. Followed by SDML, SS M L, O S & W
ML DGL and S K N L. Companies like DGL and S K N L have below
average ratio than the group average. These companies need to curb the
operating cost.

A Study of Productivity and Financial Efficiency of Textile Industry of India
137
Operating Profit Ratio (ANOVA Test)
Null Hypothesis:
There is no any significant difference in Operating Profit Ratio
textiles units under study.
Alternative hypothesis:
There is significant difference in Operating Profit Ratio of textiles
units under study.
Level of Significance: 5 percent
• Critical value: 2.48
• Degree of freedom: 41
Table no. 4.4
Operating Profit Ratio (ANOVA Test)
Source of
Variation SS df MS F P-value F crit
Between Groups 1519.213 5 303.84 1.73 0.15 2.48
Within Groups 6328.274 36 175.79
Total 7847.487 41
From the above Table no. 4.4, it is clear that difference in between
groups and within groups was not significant because the calculated value
of ‘F’ (0.144) was lower than the table value of ‘F’ (2.48). Analysis

A Study of Productivity and Financial Efficiency of Textile Industry of India
138
indicates that there were no similarities in operating profit ratio of textiles
units under study.
3. Net Profit Ratio
Net Profit Ratio is obtained when operating expenses, interest and
taxes are deducted from the gross profit. It indicates that the proportions
of sales are left to the proprietors after all costs; charges and expenses
have been deducted.
Net profit Ratio is differing from the operating profit ratio to sales
ratio in as much as it computed after adding non operating surplus/deficit.
(Difference of non operating income and none operating expenses) The
net profit ratio is measured by dividing profit after tax by net sales.
Net Profit Ratio= Profit after tax ------------------ * 100
Net Sales
Net Profit Margin Ratio establishing relationship between net profit
and sales and it indicates management efficiency in administrating,
manufacturing and selling the products. This ratio is the overall measure
of the firm’s ability to turn each rupees sale into net profit. While the net
profit is inadequate, the firm will fail to achieve satisfactory return on
owner’s equity, due to various reasons. Such as (a) falling price (b)
Rising costs and declining sales. 10 Thus, this ratio is very useful to the
proprietors and widely used as a measure of overall profitability.

A Study of Productivity and Financial Efficiency of Textile Industry of India
139
A high net profit ratio would ensure adequate return to the owners as
well as enable a firm to withstand adverse economic conditions when the
selling price declining, the cost of production is rising and demand for the
products is falling. 11
Table No:-4.5
Net Profit Ratio of Selected Textiles Companies in India
(2002-03to 2007-08) (In Percent)
COMPANY
2002-
03
2003-
04
2004-
05
2005-
06
2006-
07
2007-
08 AVE. S.D. C.V. Min Max
SS M L 2.37 2.27 2.45 3.52 3.76 1.56 2.66 0.83 31.24 1.56 3.76
DGL -18.56 -41.18 -12.66 0.54 -19.62 -6.53 -16.34 14.33 -87.75 -41.18 0.54
O S & W
ML -14.17 -12.41 -8.52 1.09 -4.74 21.96 -2.80 13.31 -475.78 -14.17 21.96
SDML 4.31 4.72 6.65 12.16 12.24 8.38 8.08 3.51 43.45 4.31 12.24
WIL. 6.16 7.98 7.84 5.89 4.86 1.96 5.78 2.22 38.43 1.96 7.98
S K N L -21.63 -3.07 -58.00 10.49 9.96 11.03 -8.54 27.33 -320.16 -58.00 11.03
MFTL. 2.03 -41.67 -21.70 -6.27 -39.05 7.10 -16.59 20.85 -125.66 -41.67 7.10
AVE. -5.64 -11.91 -11.99 3.92 -4.66 6.49 -3.965 10.34 -260.8 -11.99 6.49
S.D 11.95 21.19 23.00 6.30 18.56 8.93 10.15 10.11 200.81 25.58 6.90
C.V. -211.80 -177.94
-
191.77 160.91
-
398.70 137.47
-
256.13 85.85 -156.84
-
121.66 74.79
Sources: Annual Reports and Accounts from 2002-03to 2007-08.
The above Table No.4.5 shows the Net Profit Ratio of the SS M L
from the year 2002-03 to 2007-08. During the 6 years study period
researcher found many things. The trend of the ratio of above said

A Study of Productivity and Financial Efficiency of Textile Industry of India
140
company was fluctuating in downward direction during the study period.
The highest value of the ratio was 3.76 percent in the year 2006-07 and
the lowest value of the ratio was 1.56 in the year 2007-08. The average
value of the Net Profit ratio of above said company was 2.66 during the
study period.
The net profit ratio of DGL was depicted in the Table No.4.5. The
net profit ratio was showing negative trend with an average of
minus16.34 percent. The net profit ratio was minus 18.56 percent in
2002-03 which went down to minus 41.18 percent 2003-04. The ratio was
minus 12.66 percent in 2004-05 which again slightly rose to 0.54 percent
in 2005-06. The ratio was minus 19.62 percent in 2006-07 and minus
6.53 percent in 2007-08.The average ratio has been of minus 16.34
percent with a range of minus 41.18 percent to 0.54 percent the average
ratio was below the industry average which was not considered to be
good ratio. Company should try to minimize production cost. The
standard deviation and coefficient was 14.33 percent and 87.75 Percent
which showed high changes in net profit ratio.
The above Table No.4.5 shows the Net Profit Ratio of the O S &
W ML from the year 2002-03 to 2007-08. During the 6 years study period
researcher founds many things. The trend of the ratio of above said
company was fluctuating during the study period. Up to the year
2002006-07 the trend was fluctuating and negative from the year of 2007-

A Study of Productivity and Financial Efficiency of Textile Industry of India
141
08 year the trend was up ward. The highest value of the ratio was 21.96 in
the year 2007-08 and the lowest value of the ratio was minus 14.17 in the
year 2002-03. The standard deviation and co-efficient were 13.31 percent
and 475.78 percent which showed high changes. The average value of the
Net Profit Ratio of above said company was minus 2.80 during the study
period. The company shows the good performance during the study
period.
The above Table No.4.5 shows the Net Profit Ratio of the SDML
from the year 2002-03 to 2007-08. The ratio showed fluctuating trend
during the study period. The ratio was 4.31 percent which went up to 4.72
percent in 2003-04. The ratio was 6.65 percent in 2004-05 and 12.16
percent in 2005-06. The ratio was 12.24 percent in 2006-07 and than it
went down to 8.38 percent in 2007-08. The ratio was 12.24 percent in
2005-06 which was the ever highest ratio of the company. During the 6
years study period researcher found that standard deviation was 3.51
percent along with co-efficient of variation of 43.45 percent. The net
profit ratio was satisfactory in the company due to minimum
administrative expenses.
The Table No.4.5 showed the net profit ratio of WIL with the
fluctuated trend during the research period. The highest net profit ratio
found 7.98 percent in 2004-05 and the lowest net profit ratio found of
1.96 percent with average of 5.78 percent. The standard deviation and co-

A Study of Productivity and Financial Efficiency of Textile Industry of India
142
efficient were 2.22 percent and 38.43 percent. The company shows the
average performance during the study period.
The net profit ratio of S K N L was depicted in the Table No.4.5.
The net profit ratio was showing negative trend with an average of minus-
8.54 percent. The net profit ratio was minus 21.63 percent in 2002-03
which went up to minus -3.07 percent 2003-04. The ratio was minus -
58.00 percent in 2004-05 which again slightly rose to 10.49 percent in
2005-06. The ratio was 9.96 percent in 2006-07 and minus 6.53 percent
in 2007-08.The average ratio has been of minus -8.54 percent with a
range of minus -58.00 percent to 11.03 percent the average ratio was
below the industry average which was not considered to be good ratio.
Company should try to minimize production cost. The standard deviation
and coefficient was 27.33 percent and -320.16 Percent which showed
high changes in net profit ratio.
The above Table No.4.5 shows the Net Profit Ratio of the MFTL
from the years 2002-03 to 2007-08. During the 6 years study period
researcher found many things. The trend of the ratio of above said
company was fluctuating and negative trend during the study period. The
highest value of the ratio was 7.10 percent in the year 2007-08 and the
lowest value of the ratio was -41.67 in the year 2003-04. The average
value of the Net Profit ratio of above said company was -16.59 during the
study period.

A Study of Productivity and Financial Efficiency of Textile Industry of India
143
Above analysis explains that the SDML has the highest net profit
ratio followed by WIL and SS M L. Other units like DCL, OS & WML
SKNL AND MFTL have witnessed very low net profit ratio therefore
company needs to have control over the expenses

A Study of Productivity and Financial Efficiency of Textile Industry of India
144
rapg No.4.3 Net profit ratio
-100.00
-80.00
-60.00
-40.00
-20.00
0.00
20.00
40.00
60.00
2002-03 2003-04 2004-05 2005-06 2006-07 2007-08 AVE.
year
Ratio
SS M L DGL O S & W ML SDML WIL. S K N L MFTL.

A Study of Productivity and Financial Efficiency of Textile Industry of India
145
Net Profit Ratio (ANOVA Test)
Null Hypothesis: There is no any significant difference in Net Profit
Ratio of textiles units under study.
Alternative hypothesis: There is significant difference in Net Profit
Ratio of textiles units under study.
Level of Significance: 5 percent
Critical value: 2.48
Degree of freedom: 41
Table No.4.6
Net Profit Ratio (ANOVA Test)
ANOVA
Source of
Variation SS df MS F
P-
value
F
crit
Between Groups 2116.353 5 423.27 1.6 0.18 2.48
Within Groups 9507.469 36 264.1
Total 11623.82 41
Table No.4.6 Indicates there is no significant difference in Net
Profit ratio of textiles units under study because the calculated value of
‘F’ is lower than table value so, null hypothesis is accepted and
alternative hypothesis rejected. It can be concluded that there is no high
deviation in the Net Profit ratio of textiles units under study.

A Study of Productivity and Financial Efficiency of Textile Industry of India
146
(II) Profitability in relation to Capital Employed:
(1) Earning Per Share (EPS)
Earning per share is widely used method of measuring profitability of
the common shareholders investment it measures the profit available to
the equity shareholders on per share basis. The earning per share is
calculated by dividing the profit after taxes by total numbers of common
shares outstanding.
Earning Per Share = Profit after Tax -------------------- × 100 Number of Equity Share
The earning per share calculations made over years shows whether
or not the firms earning power on per share basis have changed over that
period. “The earning per share simply shows the profitability of the firm
on a per share basis. It does not reflect how much is paid as dividend and
how much is retained in business but as a profitability index. It is a
valuable and widely used ratio. Thus, the profitability of common
shareholders investment can be measured easily by per share. The given
table shows the Earning per share of selected companies of the textiles
companies
An investor can take a decision on the basis of the trend of Earning
per share for number years. Earning per share has been calculated here in
Rs. Per share basis as the denomination of the face value of shares varies

A Study of Productivity and Financial Efficiency of Textile Industry of India
147
in different companies. Following table shows the analysis of the Earning
per Share. 17
Table No.:4.7
Earning Per Share of selected companies in India from 2002-03 to
2007-08 (In rupees)
COMPANY 2002-03 2003-04 2004-05 2005-06 2006-07 2007-08 AVE. S.D. C.V. Min Max
SS M L 11.77 13.51 25.90 24.97 21.41 9.93 17.9 7.0 39.2 9.9 25.9
DGL -17.50 -18.99 -6.53 0.14 -3.30 -1.18 -7.9 8.3 -105.7 -19.0 0.1
O S & W ML 0.00 0.00 0.10 0.00 0.00 0.17 0.0 0.1 162.5 0.0 0.2
SDML 34.92 54.24 67.02 163.06 181.62 131.14 105.3 61.4 58.3 34.9 181.6
WIL. 5.9 6.52 6.83 5.68 7.13 3.59 5.9 1.3 21.5 3.6 7.1
S K N L -8.75 -1.24 -13.08 6.45 6.41 8.48 -0.3 9.0 -3114.8 -13.1 8.5
MFTL. -145.66 -151.70 -87.31 -20.60 -130.44 58.61 -79.5 83.4 0.0 -151.7 58.6
AVE. -17.1 -14 -1 25.7 11.8 30.1 5.92 10.34 174.8 -17.1 30.1
S.D 59.1 64.8 46.6 62.0 90.9 49.1 62.1 33.6 1191.0 60.9 65.6
C.V. -346.6 -464.3 -4615.5 241.7 768.2 163.1 -708.9 138.0 -283.7 -315.1 162.9
Source: Annual Reports and Accounts from 2002-03 to 2007-08.
The above Table No.:4.7 showed the Earning per Share of the
selected companies of the textiles companies in India from the year 2002-
03 to 2007-08. Tables No.:4.7 showed EPS of SS M L. The Earning per
share of the SS M L showed highly fluctuated trend during the study
period. The EPS was Rs. 11.77. In 2002-03 which then inclined to Rs.
13.51 in 2003-04.The EPS then went up to 25.90 due to increase in net
profit. The EPS was Rs. 24.97 in 2005-06 and Rs 21.41 In 2006-07 and
the EPS was 9.93 in the last year of study period. The EPS has gone

A Study of Productivity and Financial Efficiency of Textile Industry of India
148
down to Rs. 9.93 due to decrease in net profit. The average EPS was Rs
73.29 which was good enough compare to industry average of Rs 17.90.
The standard deviation was 7.00 percent and Co-efficient was 39.20
percent.
The above Table No.4.7 showed the Earning per share of the DGL
from the year 2002-03 to 2007-08. The EPS trend of the above said
company was fluctuating during the study period. From the year 2002-03
the trend of the EPS is downward. The highest value of EPS was 0.2 in
the year 2007-08 and the lowest value of the EPS was 0.00 in the year
2002-03. The average value of the EPS was -7.9. The overall trend was
not considered satisfactory. The standard deviation was 8.3 percent and
Co-efficient was -105.7 percent.

A Study of Productivity and Financial Efficiency of Textile Industry of India
149
Graph No.4.4 EPS
-150.00
-100.00
-50.00
0.00
50.00
100.00
150.00
200.00
250.00
2002-03 2003-04 2004-05 2005-06 2006-07 2007-08 AVE.
year
ratio
SS M L DGL O S & W ML SDML WIL. S K N L MFTL.

A Study of Productivity and Financial Efficiency of Textile Industry of India
150
The above Table No.:4.7 showed the Earning per share of the O S
& W ML from the year 2002-03 to 2007-08.The EPS trend of the above
said company was fluctuating during the study period. From the year
2003-04 the trend of the EPS is upward. The highest value of EPS was
0.2 in the year 2007-08 and the lowest value of the EPS was 0.0 in the
year2002-03, 2003-04, 2004-05, 2005-06 and 2006-07. The average value
of the EPS was 0.0 with the standard deviation was 0.1 percent and Co-
efficient was 162.5 percent. The overall trend was considered
satisfactory.
The above Table No.:4.7 showed the Earning per share of the
SDML from the year 2002-03 to 2007-08. The EPS trend of the above
said company was fluctuating during the study period with an average of
Rs. 105.3. The highest value of EPS was 181.6 in the year 2006-07 and
the lowest value of the EPS was 34.9 in 2002-03. The average value of
the EPS was 105.3.The standard deviation was 61.4 and coefficient of
variance was 58.3 percent.
The above Table No.:4.7 showed the Earning per share of the
WIL from the year 2002-03 to 2007-08.The EPS trend of the above said
company was fluctuating during the study period. From the year 2003-04
the trend of the EPS is downward. The highest value of EPS was 7.1 in
the year 2007-08 and the lowest value of the EPS was 3.6 in the 2007-08.
The average value of the EPS was 5.9 with the standard deviation was 1.3

A Study of Productivity and Financial Efficiency of Textile Industry of India
151
percent and Co-efficient was 21.5 percent. The overall trend was
considered satisfactory.
The above Table No.:4.7 showed the Earning per share of the S K
N L from the year 2002-03 to 2007-08. The EPS trend of the above said
company was fluctuating and negative during the study period with an
average of Rs. -0.3. The highest value of EPS was 8.5 in the year 2007-08
and the lowest value of the EPS was -13.1 in 2004-05. The average value
of the EPS was -0.3.The standard deviation was 9.0 and coefficient of
variance was 3114.8 percent.
The above Table No.:4.7 showed the Earning per share of the
MFTL .from the year 2002-03 to 2007-08.The EPS trend of the above
said company was fluctuating during the study period. From the year
2002-05 the trend of the EPS is downward. The highest value of EPS was
58.6 in the year 2007-08 and the lowest value of the EPS was -151.7 in
the 2003-04. The average value of the EPS was -79.5 with the standard
deviation were 83.4 percent and Co-efficient was 0.0 percent. The overall
trend was not considered satisfactory.
On the basis of EPS analysis of industry, a researcher has concluded
that the performance of EPS was the best of SDML (105.3) followed by
SS M L. and WIL. But companies like O S & W ML, and S K N L need
to increase ESP. These companies could not have better control over
administrative expenses.

A Study of Productivity and Financial Efficiency of Textile Industry of India
152
Earning per share (ANOVA Test)
Null Hypothesis:
There is no any significant difference in earning per share of textiles units
under study.
Alternative hypothesis:
There is significant difference in earning per share of textiles units under
study.
Level of Significance: 5 percent
Critical value: 248
Degree of freedom: 41
Table No.4.8
Earning per share (ANOVA Test)
Source of
Variation SS df MS F
P-
value
F
crit
Between
Groups 13864.76 5 2773 0.68 0.64 2.48
Within Groups 146326.4 36 4064.6
Total 160191.1 41
Table No.4.8 Indicates there insignificant difference in earning per
share of textile units under study because the calculated value of ‘F’ is

A Study of Productivity and Financial Efficiency of Textile Industry of India
153
lower than table value so, null hypothesis is accepted and alternative
hypothesis rejected. It can be concluded that there is no high deviation in
the Earning per share of textiles units under study.
2. Return on Capital Employed.
In day to day use the term “capital employed’ is used to indicate the
total investment in the firm whether owners or borrowed. 18 But the
capital employed in a firm may be defined in a number of ways and the
two most widely accepted definitions are Gross Capital Employed and
Net Capital Employed. Gross Capital Employed usually comprises the
total assets used in the business while net capital employed consists of the
total assets of the business less its current liabilities.
(II) Return on Gross Capital Employed
On the ground that the current liabilities are also a form of capital
and all funds must be effectively employed. The Gross Capital Employed
concept may be favoured by the analyses. Thus;
Gross Capital Employed = Fixed Assets+ Current Assets
It may be noted that the total of fixed assets and current assets does
not necessarily represents total assets or total liabilities of a company.
(III) Net Capital Employed
On the ground that further either only short term creditors or only
short term debtors should be included in the capital employed. The net
capital employed concept may be favored.
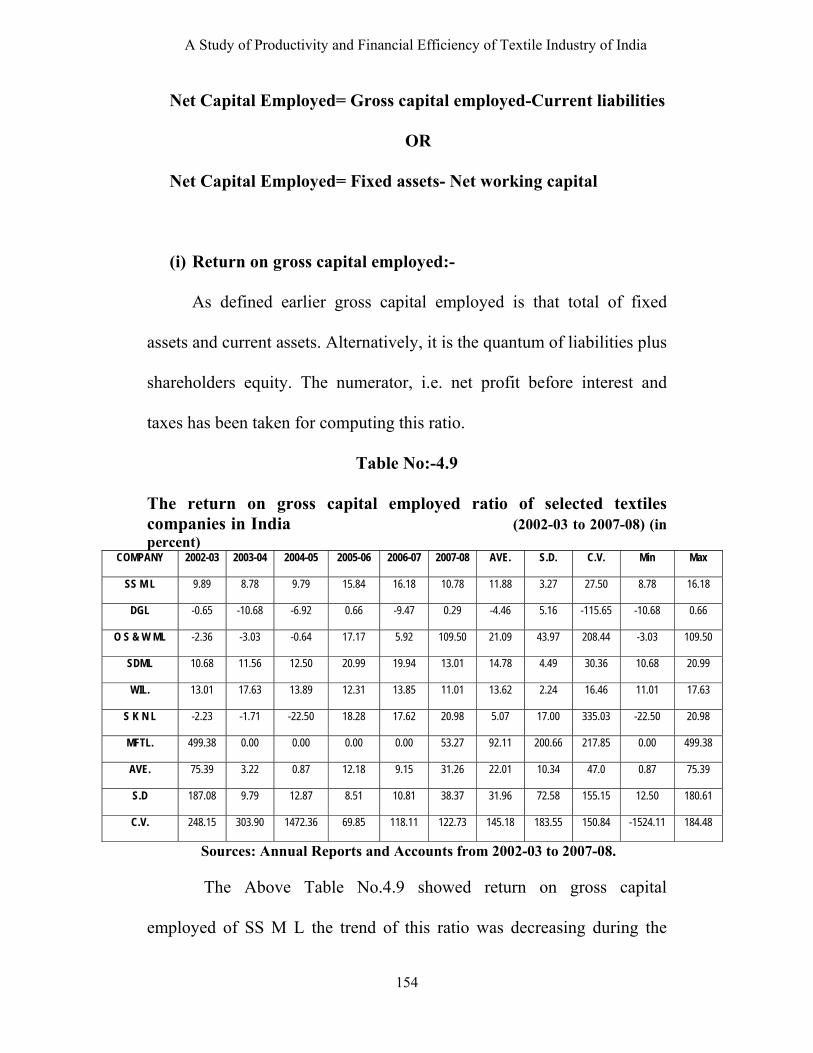
A Study of Productivity and Financial Efficiency of Textile Industry of India
154
Net Capital Employed= Gross capital employed-Current liabilities
OR
Net Capital Employed= Fixed assets- Net working capital
(i) Return on gross capital employed:-
As defined earlier gross capital employed is that total of fixed
assets and current assets. Alternatively, it is the quantum of liabilities plus
shareholders equity. The numerator, i.e. net profit before interest and
taxes has been taken for computing this ratio.
Table No:-4.9
The return on gross capital employed ratio of selected textiles companies in India (2002-03 to 2007-08) (in percent)
COMPANY 2002-03 2003-04 2004-05 2005-06 2006-07 2007-08 AVE. S.D. C.V. Min Max
SS M L 9.89 8.78 9.79 15.84 16.18 10.78 11.88 3.27 27.50 8.78 16.18
DGL -0.65 -10.68 -6.92 0.66 -9.47 0.29 -4.46 5.16 -115.65 -10.68 0.66
O S & W ML -2.36 -3.03 -0.64 17.17 5.92 109.50 21.09 43.97 208.44 -3.03 109.50
SDML 10.68 11.56 12.50 20.99 19.94 13.01 14.78 4.49 30.36 10.68 20.99
WIL. 13.01 17.63 13.89 12.31 13.85 11.01 13.62 2.24 16.46 11.01 17.63
S K N L -2.23 -1.71 -22.50 18.28 17.62 20.98 5.07 17.00 335.03 -22.50 20.98
MFTL. 499.38 0.00 0.00 0.00 0.00 53.27 92.11 200.66 217.85 0.00 499.38
AVE. 75.39 3.22 0.87 12.18 9.15 31.26 22.01 10.34 47.0 0.87 75.39
S.D 187.08 9.79 12.87 8.51 10.81 38.37 31.96 72.58 155.15 12.50 180.61
C.V. 248.15 303.90 1472.36 69.85 118.11 122.73 145.18 183.55 150.84 -1524.11 184.48
Sources: Annual Reports and Accounts from 2002-03 to 2007-08.
The Above Table No.4.9 showed return on gross capital
employed of SS M L the trend of this ratio was decreasing during the

A Study of Productivity and Financial Efficiency of Textile Industry of India
155
research period. The standard deviation was 3.27 percent with an average
of 11.88 percent. The return on gross capital employed was 9.89 percent
in 2002-03 and 9.79 percent in 2004-05. The ratio rose to 15.84 percent in
2005-06 and reached at the level of 10.78 percent in 2007-08. The ratio
ranged between 8.78 percent in 2003-04 and 16.18 percent in 2006-07.
The return on capital employed is good in this unit.
The return on gross capital employed of DGL was shown in the
above Table No.4.9.The ratio ranged between minus 10.68 percent in
2003-04 and 0.66 percent in 2005-06.The average ratio was minus 4.46
percent with a standard deviation of 5.16 percent. The ratio was minus
0.65 in 2002-03 and minus 10.68 in 2003-04. Then it rose to -6.92 in
2004-05 and 0.66 in 2005-06. The ratio of company was not satisfactory.
The company needed to increase to earning potentiality.
The above Table No.4.9 showed return on gross capital employed
of O S & W ML. The ratio showed very fluctuating trend with an average
of 21.09 percent during the study period. The ratio was -2.36 percent in
2002-03 and slipped to -3.03 percent in 2003-04. The ratio was -0.64
percent in 2004-05 and 17.17 percent in 2005-06 .The after it rose and
reached to the highest level of 109.50 percent in 2007-08. The ratio was
very good in the last two years of study period. The standard deviation
was 43.97 percent and co-efficient of variation was 208.44 percent.

A Study of Productivity and Financial Efficiency of Textile Industry of India
156
The above Table No.4.9 shows the gross capital employed ratio of
SDML from 2002-03 to 2007-08. The trend of the above said ratio was
mixed during the study period. The ratio showed fluctuating trend during
the research period. The ratio was 10.68 percent in 2002-03 and 11.56
percent in 2003-04. The ratio was 12.50 percent in 2004-05 and 20.99
percent in 2005-06. The ratio was again went down to 19.94 percent The
highest value of the ratio was 20.99 percent in the year 2005-06 and the
lowest value of the ratio was 10.68 percent the year 2002-03 . The
average value of the ratio was 14.78 with a standard deviation of 4.49
percent co-efficient of variation of 30.36. The overall position was good.
The above Table No.4.9 shows the gross capital employed ratio of
WIL from 2002-03 to 2007-08. The trend of the above said ratio was
mixed and fluctuating during the study period. The trend was upward up
to the year 2003-04 than it declines up to the year 2004-05 further it
increases till the2006-07. The highest value of the ratio was 20.98 in the
year 2007-08 and the lowest value of the ratio was -22.50 in the year
2004-05. The average value of the ratio was 13.62 which were higher
than the industry average. The standard deviation was 17.00 percent and
co-efficient of variation of 16.46 percent. The ratio was as good as it
should be for these types of industry.
The above Table No.4.9 showed return on gross capital employed
of S K N L. The ratio showed very fluctuating trend with an average of

A Study of Productivity and Financial Efficiency of Textile Industry of India
157
5.07 percent during the study period. The ratio was --2.23 percent in
2002-03 and slipped to -1.71 percent in 2003-04. The ratio was -22.50
percent in 2004-05 and 18.28 percent in 2005-06 .The after it rose and
reached to the highest level of 20.98 percent in 2007-08. The ratio was
very good in the last three years of study period. The standard deviation
was 17.00 percent and co-efficient of variation was 335.03percent.
The above Table No.4.9 shows the gross capital employed ratio of
MFTL from 2002-03 to 2007-08. The trend of the above said ratio was
mixed during the study period. The ratio showed fluctuating trend during
the research period. The ratio was 499.38 percent in 2002-03 and 0.00
percent in 2003-04. The ratio was 0.00 percent in 2004-05 and 0.00
percent in 2005-06. The ratio was again went down to 0.00 percent The
highest value of the ratio was 53.27 percent in the year 2007-08 and the
lowest value of the ratio was 0.00 percent the year 2002-03,2003-
04,2004-05 and 2006-07.The average value of the ratio was 92.11 with a
standard deviation of 200.66 percent co-efficient of variation of 217.85.
The overall position was good.
On the basis of above analysis it van be said that the MFTL could
earn highest return on gross capital employed followed by O S & W ML,
SDML, WIL and S K N L. .The performance of DGL and S K N L was
below average than industry average.
Return on Gross Capital Employed Ratio (ANOVA Test)
A Study of Productivity and Financial Efficiency of Textile Industry of India
158
Null Hypothesis:
There is no any significant difference in Return on Gross Capital
Employed Ratio of textiles units under study.
Alternative hypothesis:
There is significant difference in Return on Gross Capital
Employed Ratio of textiles units under study.
Level of Significance: 5 percent
Critical value: 2.48
Degree of freedom: 41

A Study of Productivity and Financial Efficiency of Textile Industry of India
159
GRAPH NO.4.5 RETURN ON GROSS CAPITAL EMPLOYED
-100.00
0.00
100.00
200.00
300.00
400.00
500.00
600.00
2002-03 2003-04 2004-05 2005-06 2006-07 2007-08 AVE.
year
ratio
SS M L DGL O S & W ML SDML WIL. S K N L MFTL.
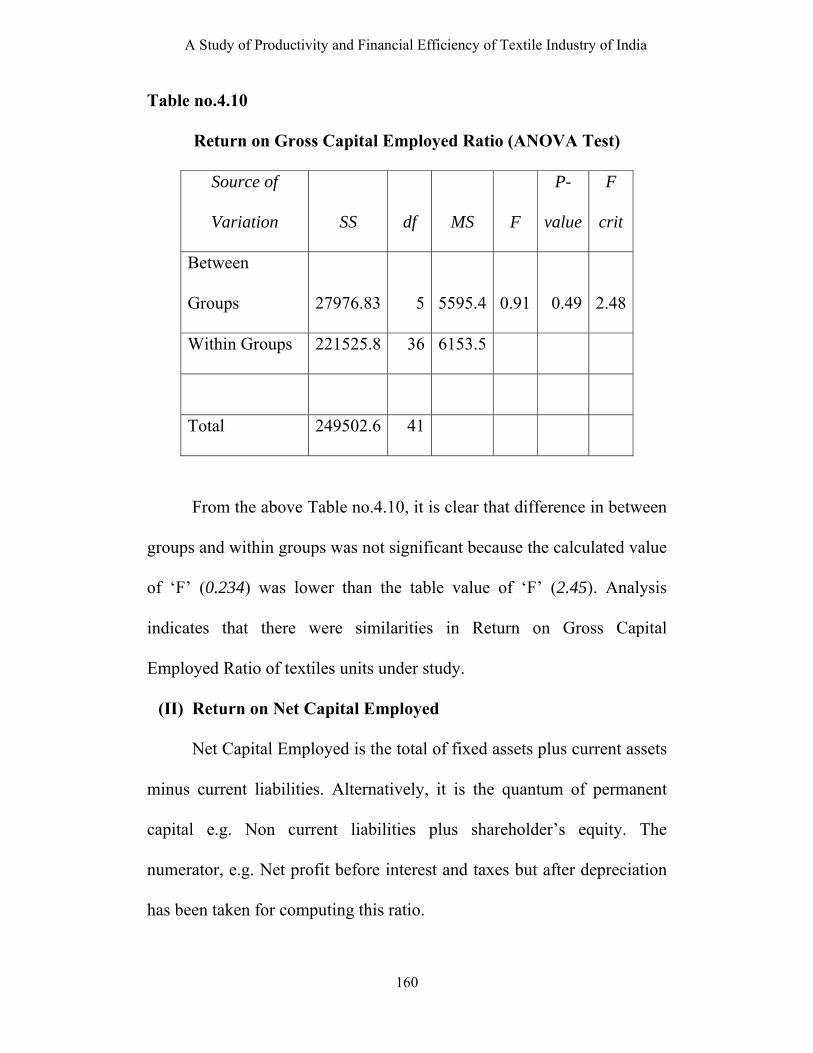
A Study of Productivity and Financial Efficiency of Textile Industry of India
160
Table no.4.10
Return on Gross Capital Employed Ratio (ANOVA Test)
Source of
Variation SS df MS F
P-
value
F
crit
Between
Groups 27976.83 5 5595.4 0.91 0.49 2.48
Within Groups 221525.8 36 6153.5
Total 249502.6 41
From the above Table no.4.10, it is clear that difference in between
groups and within groups was not significant because the calculated value
of ‘F’ (0.234) was lower than the table value of ‘F’ (2.45). Analysis
indicates that there were similarities in Return on Gross Capital
Employed Ratio of textiles units under study.
(II) Return on Net Capital Employed
Net Capital Employed is the total of fixed assets plus current assets
minus current liabilities. Alternatively, it is the quantum of permanent
capital e.g. Non current liabilities plus shareholder’s equity. The
numerator, e.g. Net profit before interest and taxes but after depreciation
has been taken for computing this ratio.

A Study of Productivity and Financial Efficiency of Textile Industry of India
161
Return on Net Capital Employed = Net Profit before interest and taxes ----------------------------------------- × 100 Net Capital Employed
This ratio is the best of overall profitability and efficiency of the
business firm. A company with high rate of return on capital employed
will be in a position to capitalise; e.g. it can take advantage of all
favourable market opportunities.
Table no.4.11
The Return on net capital employed ratio of selected textiles companies in India from 2002-03 to 2007-08. (in percent)
COMPANY
2002-
03 2003-04 2004-05
2005-
06 2006-07
2007-
08 AVE. S.D. C.V. Min Max
SS M L 4.79 4.42 4.65 8.84 10.69 3.98 6.23 2.81 45.19 3.98 10.69
DGL -9.57 -29.42 -12.73 0.07 -15.44 -7.53 -12.44 9.86 -79.29 -29.42 0.07
O S & W ML -13.06 -13.03 -11.20 2.23 -8.58 85.68 7.01 38.96 556.10 -13.06 85.68
SDML 5.15 6.06 7.32 12.51 11.67 7.46 8.36 3.02 36.14 5.15 12.51
WIL. 5.43 8.45 6.44 4.19 3.69 1.52 4.95 2.39 48.31 1.52 8.45
S K N L -13.78 -1.90 -22.73 11.73 11.15 12.41 -0.52 15.00 -2883.91 -22.73 12.41
MFTL. 113.85 0.00 0.00 0.00 0.00 26.54 23.40 45.57 194.74 0.00 113.85
AVE. 13.26 -3.63 -4.04 5.65 1.88 18.58 5.28 10.34 195.7 -4.04 18.58
S.D 45.21 13.38 11.60 5.34 10.61 31.39 10.72 18.09 1158.76 13.98 45.31
C.V. 340.97 -368.47 -287.34 94.46 563.57 168.97 202.82 107.65 -389.46 -179.33 130.17
Source: Annual Reports and Accounts from 2002-03 to 2007-08.

A Study of Productivity and Financial Efficiency of Textile Industry of India
162
GRAPH NO.4.6 RETURN ON NET CAPITAL EMPLOYED
-50.00
0.00
50.00
100.00
150.00
2002-03 2003-04 2004-05 2005-06 2006-07 2007-08 AVE.
year
Rat
io
SS M L DGL O S & W ML SDML WIL. S K N L MFTL.

A Study of Productivity and Financial Efficiency of Textile Industry of India
163
Table No. 4.11 showed return on net capital employed of SS M L.
The ratio showed fluctuating and upward trend during the study period.
The ratio was 4.79 percent in 2002-03 and 8.84 percent in 2005-06. The
ratio gain rose to 10.69 percent in 2006-07 and it was reached at the
bottom level of 3.98 percent in 2007-08 with an average of 6.23 percent.
The standard deviation was 2.81 percent and co-efficient of variation was
45.19 percent
Table No. 4.11 depicted the return on net capital employed of
DGL.The ratio showed decreasing trend from 2002-03 to 2007-08. The
ratio was -9.57 percent in 2002-03 and then it went down to -29.42
percent in 2003-04. The ratio again increased to -12.73 percent in 2004-
05 which very low and 0.07 percent in 2005-06. The ratio then after
marginally declined and reached at bottom level to minus -15.44 percent
in 2006-07. The ratio ranged between minus 0.07 percent in -29.42
percent in 2003-04 with an average of -12.44 percent. The standard
deviation was 9.86percent and co-efficient of variation was -79.29
percent.
Table No. 4.11 showed return on net capital employed of O S & W
ML with an average of 7.01 percent. The ratio was 13.06 percent in 2002-
03 and then it declined to -13.03 percent in 2003-04. The ratio was -11.20
percent in 2004-05 and it went up to 2.23 percent in 2005-06. The ratio
was showing increasing trend from 2006-07 to 2007-08.The ratio was not

A Study of Productivity and Financial Efficiency of Textile Industry of India
164
showing progressive trend during the study period. The ratio was not very
good and company’s earning capacity was not good.
Return on net capital employed of SDML was manifested in Table
No. 4.11. The average ratio was 8.36 percent with fluctuating trend
during the study period. The ratio was 5.15 percent in 2002-03 which rose
to 6.06 percent in 2003-04 and then it went up to 7.32 percent in 2004-05.
The ratio has been slightly fluctuated and went up to 12.51 percent and
11.67 percent in 2005-06 and 2007-08 respectively. The standard
deviation was 3.02 percent and co-efficient of variation was 36.14
percent. The ratio ranged between 12.51 percent in 2005-06 and 5.15
percent in 2002-03.
Table No. 4.11 expressed the return on net capital employed of
WIL. Was 5.43 percent in 2002-03 which was 8.45 percent in 2003-
04.The ratio slipped to 6.44 percent in 2004-05 the ratio was decreased to
3.69 percent in 2006-07. The ratio was 1.52 percent in 2007-08 and then
due to control over expenses. The ratio was very in the last year of study
period. The return on net capital employed was very good in this
company. The standard deviation was 2.39 percent and co-efficient of
variation was 48.31 percent.
Table No. 4.11 showed return on net capital employed of S K N L
The ratio showed fluctuating and upward trend during the study period.
The ratio was -13.78 percent in 2002-03 and 11.73 percent in 2005-06.

A Study of Productivity and Financial Efficiency of Textile Industry of India
165
The ratio gain rose to 11.15 percent in 2006-07 and it was reached at the
level of 12.41 percent in 2007-08 with an average of -0.52 percent. The
standard deviation was 15.00 percent and co-efficient of variation was -
2883.91 percent.
Return on net capital employed of MFTL was manifested in Table
No. 4.11. The average ratio was 23.40 percent with fluctuating trend
during the study period. The ratio was 113.85 percent in 2002-03 which
rose to 0.00 percent in 2003-04 and then it went up to 0.00 percent in
2004-05. The ratio has been slightly fluctuated and went up to 0.00
percent and 0.00 percent in 2005-06 and 2007-08 respectively. The
standard deviation was 45.57 percent and co-efficient of variation was
194.74 percent. The ratio ranged between 0.00 percent in 2003-04 and
113.85 percent in 2002-03.
On the basis of analysis the return on net capital was found highest
of 8.36 percent in SDML and the lowest return on net capital employed
was found of -12.44 percent in DGL. The Return on net capital employed
was below industry average of WIL, DGL and S K N L
Return on Net Capital Employed Ratio (ANOVA Test)
Null Hypothesis:
There is no any significant difference in Return on Net Capital
Employed Ratio of textiles units under study.

A Study of Productivity and Financial Efficiency of Textile Industry of India
166
Alternative hypothesis:
There is significant difference in Return on Net Capital Employed
Ratio of textiles units under study.
Level of Significance: 5 percent
Critical value: 2.48
Degree of freedom: 41
Table no.4.12
Return on Net Capital Employed Ratio (ANOVA Test)
Source of
Variation SS df MS F
P-
value
F
crit
Between
Groups 2928.962 5 585.79 1.01 0.43 2.48
Within Groups 20903.49 36 580.65
Total 23832.46 41
Table No.4.12 showed the F calculated value > F critical (at 5%
significance level), the null hypothesis is accepted and alternative
hypothesis is rejected and hence it is concluded that the Return on Net
Capital Employed ratio of textiles companies does not differ significantly.
(3) Return on Net Worth:-
Return on net worth is also known as return on shareholders equity.
This ratio shows how the firm will have used the resources of owners. It

A Study of Productivity and Financial Efficiency of Textile Industry of India
167
may true that this ratio is one of the most relationship in financial
analysis. This retun on owner’s equity is calculated by following formula:
Net Profit after Taxes and Interest Return on Net Worth = -------------------------------------------- x 100 Net Worth
Where, owner’s equity = share capital + reserve & surplus.
This ratio indicated the extent to which this objective has been
fulfilled. This, ratio reflects great interest to present as well as prospective
shareholders and also important for management, because management
has responsibility of maximizing the owners wealth the market place.
This ratio would be compared with the ratios for other similar
companies as well as the industry average. Thus, it shows the relative
performance and strength of the company.

A Study of Productivity and Financial Efficiency of Textile Industry of India
168
Table no.4.13
The Return on net worth ratio of textiles companies in India
(2002-03 to 2007-08) (in percent)
COMPANY
2002-
03
2003-
04
2004-
05
2005-
06
2006-
07
2007-
08 AVE. S.D. C.V. Min Max
SS M L 8.4 7.5 8.2 14.5 16.0 6.9 10.3 3.9 38.2 6.9 16.0
DGL -46.0 -935.1 0.0 0.0 0.0 0.0 -163.5 378.4 -231.4 -935.1 0.0
O S & W ML 0.0 0.0 0.0 0.0 0.0 930.2 155.0 379.7 244.9 0.0 930.2
SDML 6.1 7.0 9.3 17.2 15.8 10.0 10.9 4.6 42.4 6.1 17.2
WIL. 9.5 13.7 12.9 9.1 9.6 4.8 9.9 3.2 32.0 4.8 13.7
S K N L -40.9 -6.0 -105.9 45.3 26.7 23.9 -9.5 56.1 -591.3 -105.9 45.3
MFTL. 0.0 0.0 0.0 0.0 0.0 0.0 0.0 0.0 0.0 0.0 0.0
AVE. -9 -130.4 -10.8 12.3 9.7 139.4 1.87 10.34 553.9 -130.4 139.4
S.D 23.9 354.9 42.3 16.2 10.4 348.8 92.3 179.4 269.7 350.3 346.1
C.V. -265.5 -272.1 -391.5 132.0 106.8 250.2 4944.8 152.1 -406.0 -239.6 237.0
Sources: Annual Reports and Accounts from 2002-03 to 2007-08.
The above Table No. 4.13 showed the ratio of rerun on net worth
of SS M L which also indicated fluctuated trend with an average of 10.3
percent. The highest ratio had been found of 16.0 percent in 2006-07and
the lowest ratio had also been found of 6.9 percent in 2007-08. The
standard deviation was 3.9 percent with co-efficient of 38.2 percent. The
ratio was quite satisfactory.
The ratio of return on net worth of DGL was seen in above Table
No. 4.13. The ratio explained the negative trend with an average of -
163.5. The ratio was -46.0 percent in 2002-03 and rose to -935.1 percent

A Study of Productivity and Financial Efficiency of Textile Industry of India
169
in 2003-04. The ratio slipped to 0.0 percent from 2003-04 to 2007-08.
The ratio was highly fluctuated and went down to minus to -935.1 percent
in 2003-04 and minus 0.00 percent in 2003-04, 2004-05, 2005-06and
2006-07. The ratio was ranged between 0.00 percent and -935.10 percent
during the study period. The ratio showed standard deviation of 378.4
percent and co-efficient of variation of -231.4. The company had shown
bad performance in the last four years.
The above Table No. 4.13 showed Return on net worth of O S &
W ML. The ratio showed fluctuated and progressive trend with an
average of 155.00 percent. The return on net worth ratio ranged between
0.00 percent and 930.2. The standard deviation was 379.7 percent and co-
efficient of variation was 244.9 percent. The average ratio was above
average of industry.
The above Table No. 4.13 showed return on net worth of NAC
with increased trend. The average ratio was 23.53 percent which was the
best. The ratio was 19.37 percent in 2000-01 but it was lightly declined to
14.79 percent in 2001-02. The ratio again indicated growth and reached
to 20.87 percent in 2003-04. The ratio was 29.21 percent in 2004-05 and
29.50 percent in 2005-06. The ratio again increased to previous year to
35.05 percent in 2005-06.The standard deviation was 7.74 percent and
co-efficient of variation was 32.87 percent. The average ratio was above
average of industry.

A Study of Productivity and Financial Efficiency of Textile Industry of India
170
The above Table No. 4.13 indicated the return on net worth of
BAC with an average of 11.25 percent. The ratio showed positive trend
during the study period. The ratio was 0.00 percent in 2000-01 and the
after it showed high of 2.99 percent in 2001-02 and 9.87 percent in 2002-
03 the ratio again found increased to 16.91 percent in 2003-04. The ratio
was 14.23 percent in 2005-06. The was the highest of 18.24 percent in
2006-07. The ratio had been on an average of 11.25 percent with standard
deviation of 7.24 percent. The coefficient variation was 64.32 percent
which showed business risk involved in the company.
An analysis indicates that the highest ratio of return on net worth
was found in MAC followed by NAC, BAC, and IIC. The companies like
IIC, BAC, and NAC need to increase net profit in order to increase return
on net worth.

A Study of Productivity and Financial Efficiency of Textile Industry of India
171
-1000.0
-800.0
-600.0
-400.0
-200.0
0.0
200.0
400.0
600.0
800.0
1000.0
ratio
2002-03 2003-04 2004-05 2005-06 2006-07 2007-08 AVE.year
GRAPH NO. 4.7 RETURN ON NET-WORTH
SS M L DGL O S & W ML SDML WIL. S K N L MFTL.

A Study of Productivity and Financial Efficiency of Textile Industry of India
172
Return on Net worth Ratio (ANOVA Test)
Null Hypothesis: There is no any significant difference in Return on Net
worth Ratio of textiles units under study.
Alternative hypothesis: There is significant difference in Return on Net
worth Ratio of textiles units under study.
Level of Significance: 5 percent
Critical value: 2.48
Degree of freedom: 41
Table no.4.14
Return on Net worth Ratio (ANOVA Test)
Source of
Variation SS df MS F
P-
value
F
crit
Between
Groups 258025.9 5 51605 1.24 0.31 2.48
Within Groups 1501906 36 41720
Total 1759932 41
Table no.4.14 indicates there was significant difference in Return on
Net worth Ratio of textiles units under study because the calculated value
of ‘F’ was lower than table value so, null hypothesis is accepted and
alternative hypothesis rejected. It can be concluded that in Return on Net
worth Ratio of textiles units under study are not deviated.

A Study of Productivity and Financial Efficiency of Textile Industry of India
173
REFERENCES
1. Author's Article, "Financial Appraisal of State Ware-
housing Corporations: A Case Study of Rajasthan State
Ware housing Corporation, “Lok Udyog, XVI (September
1982,) 5-6.
2. R.D. Kennedy and S.Y. Mc Muller, Financial Statements
(Illinois, 1952), p. 17.
3. Ibid. p. 25.
4. Carl L. Moore, et al., Managerial Accounting (London, E.
Anold Publishers Ltd.), P. 119.
5. Robert H. Wessel; Principles of Financial Analysis (N.
Y., Macmillan, 1961), p. 29.
6. ROGER, H. HERMAN SON. Accounting principles,
(Plano: taxes, business publications inc.1983), P.734.
7. BRADLEY J. F. “Administrative financial Management”
Braves and noble, New York, 1964, p.104.
8. WESTON J.F. AND BRIGHAM E.F “Managerial Finance”
cited in Sharma akhileshwar “profitability analysis of Drugs
and pharmaceutical companies in India” A thesis submitted
for the degree of PH.D, in the faculty of commerce,
saurashtra university Rajkot 1992,p.1

A Study of Productivity and Financial Efficiency of Textile Industry of India
174
9. CHAYAL B. R “Financial mgt. of state enterprise” print
well publisher, Jaipur, 1986,p.172
10. R.S. KULSHRESTHA “Profitability in India’s steel
industry during the decade 1960-70”A thesis submitted for
the degree of PH.D depts. E.A.F.M., university of
Rajasthan, Jaipur, 1973, p.83.
11. MURTHY V.S. “Management finance” Vakils Feller and
Simons ltd., Bombay, 1978 p.79.
12. BLOCK AND HIRT “Foundations of financial
management” Richard D Irwin inc., Homewood, Illinois,
1978,p.24
13. DAVE N. V. “Industrial sickness and some key areas of
management (A study of textile Industry: Gujarat) A thesis
of PH.D. In faculty of commerce, saurashtra university,
Rajkot, 1984, p. 260-261
14. PHILIP E.FESS AND CARL S. WARREN “Financial
accounting” Southwestern publishing co, cicinnati, 1982,
P.No.159.
15. PANDEY I.M. “Concept of earning power” accounting
Journal, vol. IV, April, 1998

A Study of Productivity and Financial Efficiency of Textile Industry of India
175
16. KHAN, M.Y. AND JAIN P.K., “Financial management”,
(New Delhi: tata McGraw hill publishing co. ltd. 1982),
p.139.
17. PANDAY I.M. “Financial management” Vikas Publishing
House Pvt.Ltd., New Delhi, 1994, No.123.
18. GUPTA R.L.& M.RADHASWAMI, Financial statement
analysis (Delhi: Sultan chand&sons.1980), p.40

A Study of Productivity and Financial Efficiency of Textile Industry of India
176
CHAPTER-5
Material Productivity Analysis
5.1 Concept of Productivity
“Productivity is the basic mission of any organization to provide
the maximum welfare for the maximum number. Productivity as a
measure of efficiency and effectiveness and as a means of improving the
quality of life is generic from achieving the highest output from the
limited resources. Productivity implies the certainty of being able to do
better than yesterday and keeping the tempo continuously to improve
upon. Such continuous improvements are to be generated through the
research for new technique, methods, process, materials, software, and
expertise coupled with vision and dedicated leader - ship having the
ultimate faith in the welfare in the welfare of human system. ”1
“Productivity means different things to different stake holders. To
workers productivity means a speed up in their work pattern. To union
leaders it means the opportunities to negotiate for higher wages. To
management, it means increased profitability. To customer, it betters
goods after costs. To marketing directors productivity improvement
increases the firm’s competitiveness abroad by reducing the coat of good
sold in foreign market and to economists; it means an increase in
country’s standard of living field to gain in output per man-hour. ” 2

A Study of Productivity and Financial Efficiency of Textile Industry of India
177
Productivity is simply the ratio of output to input. When this ratio
is calculated in based price it indicates the change in productivity
efficiency over the base year. As the input consist of a number of
production factors and elements. Productivity can also be determined
separately for each of these factors. Both the output and the input may be
expressed in terms of physical units or interims of money.
Productivity is measured as the ratio between the output of a given
commodity or service and the inputs used for that product. Productivity
ratio is the ratio of output of wealthy produced to the input of resources
used in the process.
5.2 Productivity and Production:
Productivity and production are often not distinguished at all.
Productivity is” The measure of the efficiency in production factors,
inputs, and / or factor / input Services.3 But production is the amount of
absolute flow of product during given period without talking the input
factors into consideration.
The term “Productivity” is used with reference to performance in
production and measuring efficiency of organization which refers of
improvements in productivity.
“A rise in productivity may con note an increase in output with
same resources or the same output by utilizing a smaller quantum of

A Study of Productivity and Financial Efficiency of Textile Industry of India
178
resources. If productivity increases in an economy it means that its
factors of production and commodity inputs are manifesting increase in
their output efficiency” 4 Thus increasing productivity means the
increasing efficiency of various resources of production or better results
with lesser efforts. Therefore, measurement of productivity indicates
results of performance and efficiency of any enterprise or organization.
“It is the pivot of all the productive economic activities affecting the cost
of production and determining all the variables like the prices, wages,
salaries and cost of capital and services.”5 The key to efficiency and
higher productivity lies in working better, ensuring quality rather than
faster, ensuring only quantity. ”One of the best proper uses of team work
and competition is to increase productivity.”6
On the whole it can be said that production is an absolute term and
refers to the total value or quality of goods or services produced during a
period. Productivity, on the other hand, is such a relative terms as shows
not only the value or quantity of output or production but also its relation
to the input or resources used in turning out a given amount of output.
Increase in production does not necessarily result in increase in
productivity.
5.3 Productivity and Profitability:
Productivity is a sign of efficiency in production. It can be raised
only when production is carried out in a more economical manner. Lower

A Study of Productivity and Financial Efficiency of Textile Industry of India
179
productivity is of Wastage and inefficiency in the use of resources.
Higher productivity results in higher Profits. The level of productivity
sees to it that maximum outcome should take place from whatever
minimum input one engages in the best of a concern depends upon
profits. The level of productivity sees to it that maximum outcome should
take place from whatever minimum input one engages in the best of a
concern depends upon the maximum profit it draws. The profit earned
thus brings in the term ‘profitability’. If selling prices are increased. The
profitability of an enterprise will also increase but it will have a zero
effect on the productivity level. In this context J. P. Srivastava remarks,
“In between cost and profitability there are actually so many other factors
besides productivity. For example, Profitability may have its origin in
current scarcity.”7
Thus profitability does not necessarily increase the real wealth of
an enterprise as it may increase whenever either the selling prices are
increased or by overlooking the effect of inflation etc. He further points
out that “the stresses of development and the market mechanism may be
playing their due role in inflating the profitability of a product unit. While
rationalization of effort in every direction is the true basis of
productivity”8
However, Chen and Garrah observe: “with due allowances for
temporary current value fluctuations or changes in commodity of product

A Study of Productivity and Financial Efficiency of Textile Industry of India
180
prices there is a strong positive correlation among time series data
measuring productivity, profitability, or efficiency. They are of the view;
" All these measures indicate a rate of growth in capabilities of
organization to fulfill their mission, mainly, to produce and distribute
more and better products or services by managing the development and
application of technology and human resources.” 9 Higher productivity
results in higher profit and brings prosperity not only for the concern but
also for the workers, the consumers and the nation as a whole lower cost
and higher profit, greater stability and incentive for expansion,
widespread market, overall prosperity and growth of industry.
5.4 Partial Productivity and Overall Productivity
Partial of factorial is the productivity of individual factors, which
contributes to the overall productivity. In order to obviate the difficulty to
the overall arising out of diversity of methods of measurement of units of
input of different factors (Material, Labour, Overheads) it is convenient
to adopt cost as a convenient measure of productivity. In other words,
various input and output factors are measured in terms of money and
overall productivity, which measured as follows.
Cost of output Overall productivity = ---------------------
Cost of input

A Study of Productivity and Financial Efficiency of Textile Industry of India
181
Overall productivity e.g. the productivity of the business as a
whole at king all input factors together may be determined provided the
different inputs are expressed in the same quantitative units.10 so it is
necessary to measure the output and input as a whole and every input
separately to determine the productivity ratios.
5.5 Measurement of Output
Output is sometimes difficult to measure because it consists of a
products or a group of products. It may be measured in terms of sales
value or quantity. “Accounting always measures revenues for those goods
and services of the responsibility center that are sold to outside
customers.”11
In the present study, both sales value and quantity have been taken
into account for measuring the output and the units of output which are
weighed by a standard selling price selected for the base period.
5.6 Measurement of Input
In the accounting measurement inputs called as interims of cost.
Although resources which are physical things e.g. a pound of material
and an hour of labors. It is compulsory to measure these physical
constraints with sources common denominator e.g. money for the purpose
of management control system.”

A Study of Productivity and Financial Efficiency of Textile Industry of India
182
We need to be extremely cautious of interpreting any productivity
gains in any one of the inputs as a gain in labour productivity may reflect.
Change in the technological composition of the product.
The interrelationship between the production inputs it is the
relative productivity of all the firms inputs that is the dominant sources of
its competitive position”12
The quantity output of each year has been calculated for each
product with adjustment of closing and opening quantity stock. The
prices of the year 1997-98 have been taken as the base year prices.
5.7 Productivity Accounting:
Production of goods involves three types of cost material, Labour
and other costs, Present study of productivity accounting divided in to
four types of productivity
i.e.
01) Materials,
02) Labor,
03) Overhead and
04) Overall.
5.8 Material Productivity:
The cost of materials used in production of ten surpasses, in this
view materials are treated as the first factor in production or
manufacturing. “Raw materials are the major inputs in an organization

A Study of Productivity and Financial Efficiency of Textile Industry of India
183
and form the bulk which gets converted in to output.”13 Materials is one
of the basic inputs which constitute 50 to 70 percentage of the total value
of the output of selected companies. Therefore, to improve the
performance of the selected companies, material productivity will have to
be improved. Computation of material productivity ratios involves the
following steps.
5.9 Computation of Material Productivity:
For calculating the material productivity ratio, material output
(Net sales) is divided by the material input the ratio reveals the output
received in constant prices per rupees of material input. Suppose, the base
year material productivity ratio as 100, Material productivity indices have
also been calculated. Material index below 100 will mean low
productivity and above 100 will mean improvement in productivity in
comparison with the productivity of the base year.
5.10 Steps for Computation of Material Productivity
HYPOTHESIS
For the analysis purpose of material productivity, there are two
hypothesis based on statistical methods are tested. Hypothesis is based
on Chi-square test. The hypothesis has been tested to overcome the
difficulty of understanding and analysis the results. Infect productivity
ratios and indices are based on material inputs and total output, which
shows to vary over a period of time, the resulting picture of productivity

A Study of Productivity and Financial Efficiency of Textile Industry of India
184
ratios and indices, also describes fluctuations. Acceptance of the
following Null hypothesis will resolve both these difficulties.
[1] Hypothesis Based On Chi-Square:
Null Hypothesis:- Indices of material productivity can be represented by
the straight-line trend based on the least square method.
Alternative hypothesis: - Material productivity indices can’t be
described by the line of the best fit.
Level of significance: - 5 percent
Statistical test used: - chi-square
(O-E) 2
CHI-SQUARE (χ2) = E
Critical value: - 11.07
Acceptance of Null Hypothesis would reveal that the calculated
value of Chi-square is less then table value; it means that the null
hypothesis is accepted and alternative hypothesis if rejected and
assumption of researcher is true. Table No. 5.1 to 5.14 describes the
material productivity ratio and index of material productivity average of
material indices, co-efficient of variation and value of Chi-square for
selected unit of textiles industry in India under study.

A Study of Productivity and Financial Efficiency of Textile Industry of India
185
5.11 Material productivity analysis of selected companies
(1) Siyaram Silk Mills Ltd.
Table No. 5.1 describes the material productivity ratio and index of
material productivity average of material indices, co-efficient of variation
and value of chi-square of Siyaram Silk Mills Ltd
Table No.-5.1
Analysis of Material Productivity Ratio In Siyaram Silk Mills Ltd. (Rs. In crores)
YEAR OUTPUT INPUT O/I COEF. PROD. TREND I/O
IN
CRORES
IN
CRORES FACTOR INDEX VALUE
2002-03 325.59 130.01 2.50 0.080 100.00 98.09 0.40
2003-04 317.98 127.14 2.50 0.081 99.87 99.82 0.40
2004-05 339.96 139.84 2.43 0.085 97.07 101.56 0.41
2005-06 450.00 169.91 2.65 0.100 105.75 105.03 0.38
2006-07 525.16 188.03 2.79 0.125 111.52 106.76 0.36
2007-08 590.85 223.58 2.64 0.119 105.52 108.49 0.38
TOTAL 2549.54 978.51 15.52 0.59 619.74 619.74 2.32
AVE. 728.44 279.57 4.43 0.17 103.29 103.29 0.66
STANDARD DEVIATION = 5.2925 A=103.29 Chi-square = 0.534
Co-Efficient of Variance = 5.124 B=1.73
Source: Compiled From Annual Reports And Accounts Of Ssml

A Study of Productivity and Financial Efficiency of Textile Industry of India
186
Table No.5.2
Calculation of Chi-square value of SSML
Observe Expected (O-E) (O-E)2 (O-E)2/E
100 98.09 1.91 3.6481 0.037
99.87 99.82 0.05 0.0025 0.000
97.07 101.56 -4.49 20.1601 0.199
105.75 105.03 0.72 0.5184 0.005
111.52 106.76 4.76 22.6576 0.212
105.52 108.49 -2.97 8.8209 0.081
(Chi-square value) Χ2 0.534
Table No.-5.1 showed that the ratio of material productivity of
SSML was fluctuated during the study period. In 2002-03 it was 2.50
while in 2005-06 it highlighted 2.65 with an average of 4.43. The trend
was mix and fluctuating. The impact of productivity ratio describes the
fluctuation trends in productivity index mainly the study period.
Above table reveals materials productivity of Siyaram Silk Mills
Ltd. was slightly fluctuating during the period of study as shown by the
value of co-efficient of variation 5.124. Further in order to test the Null
Hypothesis whether the distribution of material productivity indices of
Siyaram Silk Mills Lt ltd. confirms to the straight line based on least
square method. It was found that the calculated value of chi-square

A Study of Productivity and Financial Efficiency of Textile Industry of India
187
figured at 0.534 is less than the table value. Hence Null Hypothesis is
accepted. It showed that material productivity indices follow the trend
value. The computed productivity indices index showed a 1.73 growth
rate per year.
(2) Digjam Ltd.
Table No. 5.3 describes the material productivity ratio and index of
material productivity average of material indices, co-efficient of variation
and value of chi-square of Digjam Ltd
The table No.-5.3 shows material productivity ratio of Digjam Ltd.
had a rising trend e.g. in 2002-03 it was 2.7769 while in 2007-08 it
showed 2.317. It ranged between 2.7769 in 2002-03 to 2.2113 in 2003-04
with an average of 4.2163. It is fact that the overall trend of material
productivity showed slight fluctuated trend.
Above table reveals that material productivity of Digjam Ltd. was
less marginal fluctuating during the study period as shown by value of
co-efficient of variation 8.204. This is further confirmed by X2 test. The
computed value of Chi-square 2.520 has been very less than the critical
value 11.07.

A Study of Productivity and Financial Efficiency of Textile Industry of India
188
Table No. - 5.3
Analysis of Material Productivity Ratio in Digjam Ltd.
YEAR OUTPUT INPUT O/I COEF. PROD. TREND I/O
IN
CRORES
IN
CRORES FACTOR INDEX VALUE
2002-03 220.01 79.23 2.7769 0.25138 100.00 91.97 0.36012
2003-04 270.09 122.14 2.2113 0.18921 79.63 90.84 0.45222
2004-05 295.34 119.84 2.4645 0.21546 88.75 89.71 0.40577
2005-06 30.59 11.81 2.5902 0.21624 93.28 87.44 0.38607
2006-07 109.2 45.55 2.3974 0.21319 86.33 86.3 0.41712
2007-08 112.05 48.36 2.317 0.19968 83.44 85.17 0.43159
TOTAL 1037.28 426.93 14.757 1.28516 531.43 531.4 2.4529
AVE. 296.366 121.98 4.2163 0.36719 88.57 88.57 0.70083
STANDARD DEVIATION = 7.2665 A=88.57 Chi-square = 2.520
Co-Efficient of Variance 8.204 B=-1.13
Source: Compiled From Annual Reports And Accounts Of Dgl
Table No.5.4
Calculation of Chi-square value of DGL
Observe Expected (O-E) (O-E)2 (O-E)2/E
100 91.97 8.03 64.4809 0.701
79.63 90.84 -11.21 125.6641 1.383
88.75 89.71 -0.96 0.9216 0.010
93.28 87.44 5.84 34.1056 0.390
86.33 86.3 0.03 0.0009 0.000
83.44 85.17 -1.73 2.9929 0.035
(Chi-square value) Χ2 2.520

A Study of Productivity and Financial Efficiency of Textile Industry of India
189
Hence, the Null hypothesis is accepted and Alternative Hypothesis
is rejected. It showed that the material productivity indices follow the
trend value. The computed value of productivity index showed a negative
growth of -1.13 rates per year. It had also been showed that average
material requirement per rupee of output for Digjam Ltd. amounted to
rupee 0.70.
(3) Oswal Spinning & Wvg. Mills Ltd..:-
Table No.5.5
Analysis of Material Productivity Ratio
In Oswal Spinning & Wvg. Mills Ltd. (Rs. In crores)
YEAR OUTPUT INPUT O/I COEF. PROD. TREND I/O
IN
CRORES
IN
CRORES FACTOR INDEX VALUE
2002-03 55.19 31.75 1.7383 0.07685 100.00 94.13 0.57529
2003-04 54.97 36.13 1.5215 0.06323 87.53 94.43 0.65727
2004-05 60.78 37.69 1.6126 0.06746 92.77 94.74 0.62011
2005-06 79.07 45.69 1.7306 0.08355 99.56 95.34 0.57784
2006-07 67.23 40.99 1.6402 0.07833 94.36 95.65 0.6097
2007-08 77.4 46.37 1.6692 0.07889 96.03 95.95 0.5991
TOTAL 394.64 238.62 9.9123 0.44832 570.24 570.24 3.63929
AVE. 112.754 68.177 2.8321 0.12809 95.04 95.04 1.0398
STANDARD DEVIATION = 4.6484 A=95.04 Chi-square = 1.115
Co-Efficient of Variance 4.891 B=0.304
Source: compiled from annual reports and accounts of os&wml.

A Study of Productivity and Financial Efficiency of Textile Industry of India
190
Table No.5.6
Calculation of Chi-square value of OS &WML
Observe Expected (O-E) (O-E)2 (O-E)2/E
100 94.13 5.87 34.4569 0.366
87.53 94.43 -6.9 47.61 0.504
92.77 94.74 -1.97 3.8809 0.041
99.56 95.34 4.22 17.8084 0.187
94.36 95.65 -1.29 1.6641 0.017
96.03 95.95 0.08 0.0064 0.000
(Chi-square value) Χ2 1.115
Table No. 5.5 describes the material productivity ratio and index of
material productivity average of material indices, co-efficient of variation
and value of chi-square of Oswal Spinning & Wvg. Mills Ltd
Table No.-5.5 describes that the ratio of material productivity of
Oswal Spinning & Wvg. Mills Ltd which showed decreasing trend i.e.
1.7383 in 2002-03 in 1.6692 in 2007-08 with mix trend during the study
period. It varied from 1.7383 in 2002-03 to 1.5215 in 2003-04 with an
average of 2.8321
Above table showed that material productivity of Shree Oswal
Spinning & Wvg. Mills Ltd was fluctuating during study period as shown
by the value of co-efficient of variation 4.891. Further in order to test
Null Hypothesis whether the distribution of material productivity indices
confirms to the strait line based. On least square method it was found that

A Study of Productivity and Financial Efficiency of Textile Industry of India
191
the value of chi-square figured at 1.115 1it is less than the table
value11.07 hence the null hypothesis is accepted.
(4) Shri Dinesh Mills Ltd.:-
Table No. 5.7 describes the material productivity ratio and index of
material productivity average of material indices, co-efficient of variation
and value of chi-square of Shri Dinesh Mills Ltd
Table No.-5.7
Analysis of Material Productivity Ratio In Shri Dinesh Mills Ltd. (Rs. In crores)
YEAR OUTPUT INPUT O/I COEF. PROD. TREND I/O
IN
CRORES
IN
CRORES FACTOR INDEX VALUE
2002-03 53.46 15.04 3.5545 0.33051 100.00 94.76 0.28133
2003-04 59.31 17.7 3.3508 0.31448 94.27 95.23 0.29843
2004-05 59.76 18.56 3.2198 0.30599 90.58 95.71 0.31058
2005-06 69.14 22.08 3.1313 0.30114 88.09 96.65 0.31935
2006-07 75.77 19.72 3.8423 0.37762 108.10 97.12 0.26026
2007-08 79.36 23.25 3.4133 0.32546 96.03 97.60 0.29297
TOTAL 396.8 116.35 20.512 1.9552 577.07 577.07 1.76292
AVE. 113.371 33.243 5.8606 0.55863 96.18 96.18 0.50369
STANDARD DEVIATION = 7.1686 A=96.18 Chi-square = 2.599
Co-Efficient of Variance 7.453 B=0.473
Source: Compiled From Annual Reports And Accounts Of Sdml

A Study of Productivity and Financial Efficiency of Textile Industry of India
192
Table No.5.8 Calculation of Chi-square value of SDML
Observe Expected (O-E) (O-E)2 (O-E)2/E
100 94.76 5.24 27.4576 0.290
94.27 95.23 -0.96 0.9216 0.010
90.58 95.71 -5.13 26.3169 0.275
88.09 96.65 -8.56 73.2736 0.758
108.1 97.12 10.98 120.5604 1.241
96.03 97.6 -1.57 2.4649 0.025
(Chi-square value) Χ2 2.599
It was reveals from Table No.-5.7 that the material productivity
ratio of Shri Dinesh Mills Ltd. had shown mix and raising trend. The ratio
varied from 3.8423 in 2006-07 to 3.1313 in 2005-06 with an average of
5.8606. However it was 3.5545 in 2002-03 than after it decreased by
3.3508 in 2003-04. After this year the ratio again declined to 3.2198 in
2004-05 and 3.1313 in 2005-06, which is lowest among all the years of
the study period
The compound value of productivity index showed a positive
growth of 0.473 per year. It may also be seen from the table no. 5.7 that
the average material requirement per rupee of output for Shri Dinesh
Mills Ltd. counted to Rs. 0.50369
The computed value of Chi-square 2.599 has been less than the
table value of 11.07 therefore null hypotheses is accepted and alternative

A Study of Productivity and Financial Efficiency of Textile Industry of India
193
hypothesis is rejected. It describe that the material productivity indices
follows the trend values. It describes that computed value of Productivity
index shows a margin of 0.50369.Input-out ratio was lowest in 2006-07
by 0.26026.It indicates that unit achieved its maximum efficiency in that
year. The company also showed fluctuating trend as shown the value of
co-efficient of variation 7.453and the standards deviation was 7.1686.
(5) Welspun India Ltd..:-
Table No. 5.9 describes the material productivity ratio and index of
material productivity average of material indices, co-efficient of variation
and value of chi-square of Shri Dinesh Mills Ltd
It was apparent from Table No.-5.5 that the material productivity
ratio of Welspun India Ltd. has an overall rising trend e.g. 2002-03 to
2007-08. In the last year it declined to 2.805. The average material
productivity ratio showed by figured 1.934. The improvement in
efficiency may also been observed from average of material productivity
indices which workout as high as 112.81over the year of 2004-05.
{Table No. -5.9 is given on the next page}

A Study of Productivity and Financial Efficiency of Textile Industry of India
194
Table No. -5.9
Analysis of Material Productivity Ratio In Welspun India Ltd.(Rs. In crores)
YEAR OUTPUT INPUT O/I COEF. PROD. TREND I/O
IN
CRORES
IN
CRORES FACTOR INDEX VALUE
2002-03 302.15 142.89 2.1146 0.09722 100.00 102.31 0.47291
2003-04 368.04 193.88 1.8983 0.08669 89.77 102.2 0.52679
2004-05 483.18 202.56 2.3854 0.14215 112.81 102.1 0.41922
2005-06 685.61 268.72 2.5514 0.17974 120.66 101.8 0.39194
2006-07 1045.06 510.33 2.0478 0.12536 96.84 101.7 0.48833
2007-08 1311.76 678.27 1.934 0.11202 91.46 101.5 0.51707
TOTAL 4195.8 1996.7 12.931 0.74319 611.54 611.54 2.81626
AVG. 1198.8 570.47 3.6947 0.21234 101.92 101.92 0.80465
STANDARD DEVIATION = 12.297 A=101.92 Chi-square = 7.407
Co-Efficient of Variance 12.06 B=-0.129
Source: Compiled From Annual Reports And Accounts Of Wil
Table No.5.10
Calculation of Chi-square value of WIL
Observe Expected (O-E) (O-E)2 (O-E)2/E
100 102.31 -2.31 5.3361 0.052
89.77 102.2 -12.43 154.5049 1.512
112.81 102.1 10.71 114.7041 1.123
120.66 101.8 18.86 355.6996 3.494
96.84 101.7 -4.86 23.6196 0.232
91.46 101.5 -10.04 100.8016 0.993
(Chi-square value) Χ2 7.407

A Study of Productivity and Financial Efficiency of Textile Industry of India
195
In “Welspun India Ltd.” the computed value of chi-square showed
by 7.407 has been less than the critical value of 11.07. Hence null
hypothesis is accepted and Alternative hypothesis is rejected. It showed
that the material productivity indices follow trend value which was
hypotheses. The calculated value of productivity index showed negative -
0.129 per year base. It observes Rs. 0.80465 from the table that material
requirement per rupees of output average for the unit.
(6) S Kumars Nationwide Ltd..:-
The Table No.-5.11 showed material productivity ratio, Co-
efficiency of co-relationship, material productivity index, trend values,
input output ratio and calculated value of x2 of S Kumar’s Nationwide
Ltd.

A Study of Productivity and Financial Efficiency of Textile Industry of India
196
Table No.-5.11
Analysis of Material Productivity Ratio In S Kumars Nationwide Ltd. (Rs. in crores)
YEAR OUTPUT INPUT O/I COEF. PROD. TREND I/O
IN
CRORES
IN
CRORES FACTOR INDEX VALUE
2002-03 624.65 525.82 1.188 0.02802 100.00 100.90 0.84178
2003-04 618.55 492.08 1.257 0.03336 105.81 105.28 0.79554
2004-05 346.21 257.13 1.3464 0.02893 113.34 109.66 0.7427
2005-06 890.87 646.63 1.3777 0.03121 115.97 118.42 0.72584
2006-07 1230.38 895.35 1.3742 0.03164 115.68 122.80 0.7277
2007-08 1606.56 1013.5 1.5851 0.03822 133.43 127.18 0.63088
TOTAL 5317.22 3830.6 8.1284 0.19137 684.24 684.24 4.46444
AVE. 1519.21 1094.4 2.3224 0.05468 114.04 114.04 1.27555
STANDARD DEVIATION = 11.382 A=114.04 Chi-square = 0.905
Co-Efficient of Variance 9.981 B=4.38
Source: Compiled From Annual Reports And Accounts Of Sknl
Table No.5.12
Calculation of Chi-square value of SKNL
Observe Expected (O-E) (O-E)2 (O-E)2/E
100 100.9 -0.9 0.81 0.008
105.81 105.28 0.53 0.2809 0.003
113.34 109.66 3.68 13.5424 0.123
115.97 118.42 -2.45 6.0025 0.051
115.68 122.8 -7.12 50.6944 0.413
133.43 127.18 6.25 39.0625 0.307
(Chi-square value) Χ2 0.905

A Study of Productivity and Financial Efficiency of Textile Industry of India
197
The productivity ratio of the S.Kumar Nationwide Ltd showed
increasing trend e.g. it was 3.248 in 2002-03 and 3.920 in 2007-08 with
an average of 2.32. The out-put was Rs. 624.65 crores in 2002-03 and
then in 2003-04 it decreased to 618.55 crores but then after it went down
marginally Rs. 345.21 crores. In 2005-06 it was Rs. 890.87 crores. In the
last years of the study period it was highly increased to 1606.56 crores.
Thus the out put showed mix trend during the study period.
In this unit the calculated value of chi-square is 00.905, which is
less than the critical value of 11.07. Hence the null hypothesis is rejected
and alternative hypothesis is accepted. It indicates that the material
productivity indices followed trend value. The computed values of
productivity index showed growth of 4.38per annum resulting with dawn
ward trend.
The strait line based on trend values showed a down ward trend
with positive growth of 4.38 per annum. Thus, Material productivity of
the unit under was found to be gradually down-ward trend during the
period of the study with an overall decreasing trend during the period of
study.

A Study of Productivity and Financial Efficiency of Textile Industry of India
198
(7) Mafatlal Industries Ltd.
Table No.-5.13 shows the material productivity ratio, co-efficiency
of co- relationship, productivity index of material indices, value of Chi-
square, co-efficient of variation for Mafatlal Industries Ltd.
Table No.-5.13
Analysis of Material Productivity Ratios In Mafatlal Industries Ltd. (In crores)
YEAR OUTPUT INPUT O/I COEF. PROD. TREND I/O
IN
CRORES
IN
CRORES FACTOR INDEX VALUE
2002-03 430.91 188.47 2.2864 0.14036 100.00 86.62 0.43738
2003-04 172.91 74.83 2.3107 0.13992 101.06 98.88 0.43277
2004-05 176.52 77.37 2.2815 0.12539 99.79 111.14 0.43831
2005-06 146.34 49.54 2.954 0.15416 129.20 135.66 0.33853
2006-07 156.16 59.39 2.6294 0.1469 115.00 147.92 0.38032
2007-08 401.57 89.92 4.4659 0.27135 195.33 160.18 0.22392
TOTAL 1484.41 539.52 16.928 0.97808 740.38 740.38 2.25122
AVE. 424.117 154.15 4.8365 0.27945 123.40 123.40 0.6432
STANDARD DEVIATION = 37.098 A=123.40 Chi-square = 18.621
Co-Efficient of Variance 30.06 B=12.26
Source: Compiled From Annual Reports And Accounts Of Mftl

A Study of Productivity and Financial Efficiency of Textile Industry of India
199
Table No.5.14
Calculation of Chi-square value of MFTL
Observe Expected (O-E) (O-E)2
(O-
E)2/E
100 86.62 13.38 179.0244 2.067
101.06 98.88 2.18 4.7524 0.048
99.79 111.14 -11.35 128.8225 1.159
129.2 135.66 -6.46 41.7316 0.308
115 147.92 -32.92 1083.726 7.326
195.33 160.18 35.15 1235.523 7.713
(Chi-square value) Χ2 18.621
The above table explained that material productivity of Mafatlal
Industries Ltd showed fluctuated trend from 2002-03 to 2007-08. The
out-put was Rs. 430.91 crores in 2002-03 and it was Rs. 146.34 crores in
2005-06. But it was highly increased to Rs. 401.57 crores in 2007-08.
The input was Rs. 188.47 crores in 2002-03 and it was Rs. 49.54 crores in
205-06 but then in 2007-08 it increased to 89.92 crores. The out-put to
input ratio had showed fluctuated trend with an average of 4.83. The ratio
was 2.2864 in 2002-03 and it was 2.3107 in 2003-04. It was 2.2815 in
2004-05. The ratio was 2.95 in 2006-07. In the last year of the study
period it was 4.46.

A Study of Productivity and Financial Efficiency of Textile Industry of India
200
The co-efficient of variation showed 30.06 percent and the value of
chi-square remained at 18.621 which higher than the critical value of
11.07 therefore the null hypothesis is rejected and alternative hypothesis
accepted. It showed the material productivity index does not follow than
trend values. The computed value of productivity index showed a
negative growth of 12.26 per year resulting in a down-ward trend. All
these factors showed the declining conditions of the company. These are
not regarded as a good sign and this downward trend in material
efficiency should be required to control.
TABLE NO.-5.15
Comparative Analysis Of Materialroductivity
OUTPUT
PROD.
CO-
IFF.
CHI-
SQUARE
INPUT-
OUTPUT Growth Rate
OVER
-INPUT INDEX ALL
AVE. AVE. AVE. AVE.
COMPANY VAL RNK VAL. RNK VAL. RNK VAL. RNK VAL RNK VAL. RNK VAL. RNK
SS M L 4.43 5 103.29 5 5.124 1 0.534 7 0.66 5 1.73 4 27 3
DGL 4.22 4 88.57 1 8.204 2 2.52 4 0.7 4 -1.13 1 16 7
O S & W
ML 2.83 2 95.04 2 4.891 3 1.115 5 1.04 2 0.304 5 19 6
SDML 5.86 7 96.18 3 7.453 7 2.599 3 0.5 7 0.473 3 30 2
WIL. 3.69 3 101.92 5 12.065 5 7.407 2 0.8 3 -0.13 2 20 5
S K N L 2.32 1 114.04 6 9.981 6 0.905 6 1.28 1 4.38 6 26 4
MFTL. 4.84 6 123.4 7 30.064 7 18.621 1 0.64 6 12.26 7 35 1
group 4.03 4 103.21 4.14 11.11 4.43 0.66 4 0.8 4 2.56 4 25 4
Source: compiled from annual reports and accounts.

A Study of Productivity and Financial Efficiency of Textile Industry of India
201
The Table No.-5.15 showed the overall analysis of material
productivity of textiles group of companies. It also showed material
productivity ratio, Co-efficient of co-relationship, productivity index,
trend value, input-output ratio, value of chi-square, co-efficient of
variation, and standard deviation.
The table No. 5.15 shows that the material productivity ratio was
the highest in S K N L followed by O S & W ML, WIL, DGL, SS M L,
SDML and SDML. The productivity index was the highest in MFTL
followed S K N L, WIL, SS M L, SDML and DGL. The co-efficient was
the in MFTL followed by S K N L, WIL, O S & W ML and SS M L. The
Chi-square was significant in MFTL and it was insignificant in all other
selected units. The input output ratio was the highest in S K N L followed
by S K N L, O S & W ML, DGL, SDML, WIL and SS M L. the growth
rate was the highest in MFTL. And the lowest growth was found in DGL.
The material productivity ratio is the best in MFTL .therefore this
Company ranked first for utilizing material
5.12 CONCLUSION
As conclusion point of view chapter titled “Analysis of
productivity” described the concept, importance and measurement of
productivity. The term productivity is using for interchangeably behavior
and achievement, refers to ratio of output divided by input it is noted that

A Study of Productivity and Financial Efficiency of Textile Industry of India
202
productivity improvement concerns itself with the goals and objective of
the organization as well as with the manner in which they are to be
achieved, It involves both ‘doing the right things’ which is effectiveness
but also ‘doing them right’ (efficiency) according to above Para, it can be
said that productivity concerned with to effectiveness and efficiency, and,
it is a semi healthy parameter for measuring the performance of business
organization.
REFERENCES
1. MOHANTY R.P. in his articles “ managing technology for
strategic advantages ”, The Economics Times, (Thursday 9th
jan.1992), p.14
2. THOMAS.K. CONNELL, How to Improve Human Performance
(new York: Harper and row, 1978), p.3
3. BRAHMANANDA, P.R, productivity in the Indian Economy.
(Bombay: Himalaya publishing House, 1982).
4. VADES FABRICANT’S introduction to J.W Kendrick’s
Productivity Trends In The United States, (New York:
N.B.E.R.1961), P.26
5. AGRAWAL, M.D. Efficiency Of Public Enterprise in India,
(Jaipur: Prateekha Publication.1987), P.206
6. The Economics Times, (Thursday 9th jan.1992), p.13

A Study of Productivity and Financial Efficiency of Textile Industry of India
203
7. SRIVASTAVA, J.P. Labour productivity, (new Delhi: oxford and
I.H.B Publishing co.1982), p.35
8. Ibid.p.35
9. GORDAN, K.C.CHENAND ROBERT E. MCGARRAH,
productivity management, (Chicago: The Dryden press, 1982),
p.3
10. PRASAD, N.K., Cost accounting. (Calcutta: Book syndicate
private ltd, 1979), pp, 20-25.
11. ROBERT. ANTHONY AND GLENN. A WEISCH, Management
accounting, (House wood Illinois: Richard D.Irwin, 1977), pp.402-
403
12. IVISON STEWART “Productivity measurement and the
accountant” management accounting, London, vol.60 no.9,
October 1982,p. No 20-23
13. JAIN A AND JAIN N. “An integrated approach to inventory
management” Journal of accounting and Finance.Jaipur, Vol.12,
No.2, Sep.1998, P.No.166

A Study of Productivity and Financial Efficiency of Textile Industry of India
204
CHAPTER-6
ANALYSIS OF LABOUR PRODUCTIVITY
6.1 Labour Productivity
The term ‘Labour Productivity’ is generally defined as “the ratio of
physical amount of output achieved in a given period to the
corresponding amount of labour expended”1. It may be true that any
business organization all wage payments are directly or indirectly based
on the skill and productivity of the workers, therefore labour productivity
is considered as the most important factors in productivity computations.
There are various types of methods for calculating the labour
productivity. Very simple method describe in the above definition.
‘Output divided by input’ another method the output per man-years of
man-hour and the input per man-years or per man-hour. In the present
research study labour input calculated by cost/expenses labour
productivity and capacity of utilization could be general indices, which
are easily understandable and could be the basis for measurement of the
employees.
6.2 Steps in Calculation for Labour Productivity
HYPOTHESIS:
For the purpose of measuring the labour productivity, null
hypotheses have been tested with alternative hypotheses for the purpose
of analysis labour productivity indices. The firth hypothesis shows
A Study of Productivity and Financial Efficiency of Textile Industry of India
205
whether the labour productivity indices can be approximately as a
straight-line trend. The second hypothesis is whether there is any
significant difference the labour productivity of the selected unit of textile
industry in India.
6.3 Hypothesis Based on Chi-square
Null Hypothesis: - The labour productivity indices may be represented
by the straight line based on least square method.
Alternative Hypothesis: the line of the fit can’t describe -Labour
productivity indices.
Level of significant: - 5 percent
Statistical tool used: -chi-square test
(O-E) 2
CHI-SQUARE (χ2) = E
Critical value: - 11.07
If the calculated value of chi-square remains less than the critical
value the null hypothesis would mean that the computed value of the
indices is based on the least square straight line trend. It may represent
the pattern and growth of the labour productivity.
6.4 Labour Productivity in Selected Companies :
Table No. 6.1 to 6.14 describes the labour productivity ratio and
index of labour productivity average of labour indices, co-efficient of

A Study of Productivity and Financial Efficiency of Textile Industry of India
206
variation and value of chi-square for selected units of textiles industry in
India under study.
(1) Siyaram Silk Mills Ltd..:-
Table No.-6.1 described that the labour productivity in selected
units. It reveals that the output of Siyaram Silk Mills Ltd. counted to Rs.
325.59 crores during the year of 2002-03, which decreased to Rs. 317.98
crores in 2003-04. The trend of labour productivity fluctuated during the
study period. Labour input expanded from Rs.10.26crores to Rs.29.95
crores in during the study period. The productivity ratio was 31.73 in
2002-03 which decreased to 29.17 in 2003-04. The ratio was 28.05 in
2004-05. The ratio was the lowest in 2007-08. The average ratio was
26.55 which were greater than the years of 2006-07, and 2007-08. Thus
the ratio decreased in the last two years. The co-efficient of variance
shows 17.601 percent and standard deviation also indicated 14.562
percent, so the trend was fluctuated during the study period.
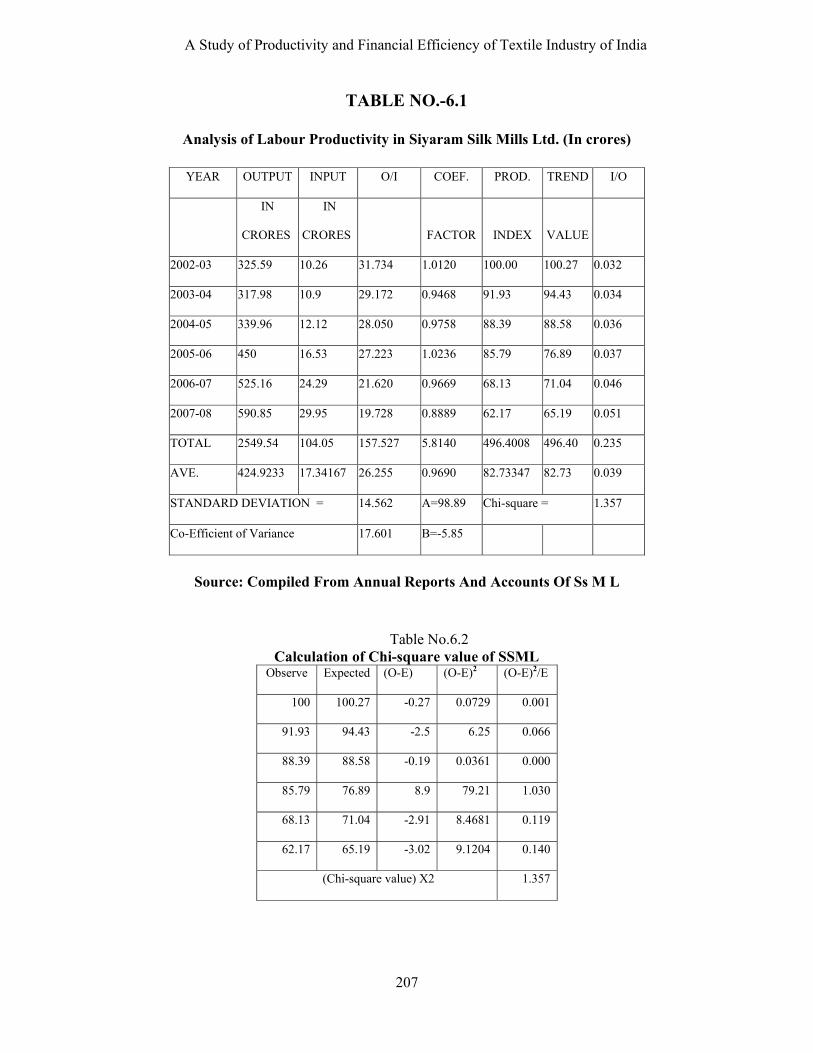
A Study of Productivity and Financial Efficiency of Textile Industry of India
207
TABLE NO.-6.1
Analysis of Labour Productivity in Siyaram Silk Mills Ltd. (In crores)
YEAR OUTPUT INPUT O/I COEF. PROD. TREND I/O
IN
CRORES
IN
CRORES FACTOR INDEX VALUE
2002-03 325.59 10.26 31.734 1.0120 100.00 100.27 0.032
2003-04 317.98 10.9 29.172 0.9468 91.93 94.43 0.034
2004-05 339.96 12.12 28.050 0.9758 88.39 88.58 0.036
2005-06 450 16.53 27.223 1.0236 85.79 76.89 0.037
2006-07 525.16 24.29 21.620 0.9669 68.13 71.04 0.046
2007-08 590.85 29.95 19.728 0.8889 62.17 65.19 0.051
TOTAL 2549.54 104.05 157.527 5.8140 496.4008 496.40 0.235
AVE. 424.9233 17.34167 26.255 0.9690 82.73347 82.73 0.039
STANDARD DEVIATION = 14.562 A=98.89 Chi-square = 1.357
Co-Efficient of Variance 17.601 B=-5.85
Source: Compiled From Annual Reports And Accounts Of Ss M L
Table No.6.2 Calculation of Chi-square value of SSML
Observe Expected (O-E) (O-E)2 (O-E)2/E
100 100.27 -0.27 0.0729 0.001
91.93 94.43 -2.5 6.25 0.066
88.39 88.58 -0.19 0.0361 0.000
85.79 76.89 8.9 79.21 1.030
68.13 71.04 -2.91 8.4681 0.119
62.17 65.19 -3.02 9.1204 0.140
(Chi-square value) Χ2 1.357

A Study of Productivity and Financial Efficiency of Textile Industry of India
208
Computed value of chi-square describes 1.357 which less than the
critical value of 11.07 therefore null hypotheses is accepted and
alternative hypothesis is rejected. It means that labour productivity
indices follow the trend value.
The straight-line trend showed a negative annual growth of -5.85,
which indicates a good growth of labout productivity. Further above table
showed the input required per Rupees of output was lowest in 0.032 in
2002-03 and the highest of 0.051 in 2007-08.
(2) Digjam Ltd.:
Table No.-6.3 describes that the labour productivity in Digjam Ltd.
It reveals that the output of Digjam Ltd amounted to Rs.220.01 crores in
2002-03 which increased to 270.09 crores in 2003-04. It was Rs. 295.034
crores in 2004-05 which was the ever highest output during the study
period. The output was Rs.30.59 crores in 2005-06 and it increased to Rs.
109.20 crores in 2006-07. The output was Rs. 112.05 crores in 2007-08
with an average output of Rs. 172.88 which was greater than the years of
2005-06, 2006-07 and 2007-08. Then from 2002-03 to 2007-08 it
showed decreased trend. Labour input was 36.26 crores in 2002-03 and
Rs. 44.53 crores in 2003-04. The labour input increased to Rs. 47.31
crores in 2004-05. The input was very lower of Rs. 4.48 crores in 2005-
06 and then increased to 20.45 crores in 2006-07. In last years of study
period it was 19.34 crores with an average input of Rs. 28.73 crores

A Study of Productivity and Financial Efficiency of Textile Industry of India
209
which was more than the years of 2005-06, 2006-07 and 2007-08. The
output input ratio was 6.07 in 2002-03 and the it was 6.07 in the years of
2003-04. The ratio rose to 6.24 and 6.83 respectively during the years of
2004-05 and 2005-06. The ratio went down to 5.34 during the years of
2006-07.But during the last year of study period the ratio rose to to 5.79
than previous year of 2006-07 with an average ratio of 6.06. The average
ratio was less than the ratio the years of 2002-03, 2003-04, 2004-05 and
2005-06.It showed decreasing trend.

A Study of Productivity and Financial Efficiency of Textile Industry of India
210
TABLE No.-6.3
Analysis of Labour Productivity in Digjam Ltd. (In crores)
YEAR OUTPUT INPUT O/I COEF. PROD. TREND I/O
IN
CRORES
IN
CRORES FACTOR INDEX VALUE
2002-03 220.01 36.26 6.07 0.55 100.00 102.79 0.16
2003-04 270.09 44.53 6.07 0.52 99.96 101.80 0.16
2004-05 295.34 47.31 6.24 0.55 102.89 100.81 0.16
2005-06 30.59 4.48 6.83 0.57 112.53 98.82 0.15
2006-07 109.20 20.45 5.34 0.47 88.01 97.83 0.19
2007-08 112.05 19.34 5.79 0.50 95.49 96.83 0.17
TOTAL 1037.28 172.37 36.34 3.16 598.88 598.88 1.00
AVE. 172.88 28.73 6.06 0.53 99.81 99.81 0.17
Standard Deviation = 8.117356 A=98.89 Chi-square = 3.058
Co-Efficient of Variance 8.13258 B=-0.99
SOURCE: COMPILED FROM ANNUAL REPORTS AND ACCOUNTS OF DGL
Table No.6.4
Calculation of Chi-square value of DGL
Observe Expected (O-E) (O-E)2 (O-E)2/E
100 102.79 -2.79 7.7841 0.076
99.96 101.8 -1.84 3.3856 0.033
102.89 100.81 2.08 4.3264 0.043
112.53 98.82 13.71 187.9641 1.902
88.01 97.83 -9.82 96.4324 0.986
95.49 96.83 -1.34 1.7956 0.019
(Chi-square value) Χ2 3.058

A Study of Productivity and Financial Efficiency of Textile Industry of India
211
Thus the labour productivity ratio showed fluctuated trend, which
ranged 6.07 to 5.34 during the years of 2002-03 to 2007-08 showed good
labour productivity. The productivity index showed fluctuated trend
during the study period. The co-efficient of variance shows 8.13 percent
and standard deviation also indicated 8.11 percent. So the trend was
fluctuated picture during the study period.
To test null hypothesis the chi-square is computed which showed
the value of 3.058, which is less than the table value of 11.07. So the null
hypothesis is accepted and alternative hypothesis is rejected. It means that
the indices follow the trend value. The straight-line trend showed a
negative growth of -0.99. Further above table showed the input
requirement per rupees of output were lowest in 2005-06 Rs. 0.15
(3) Oswal Spinning & Wvg. Mills Ltd..:-
Table No.6.5 shows labour productivity ratio, co-efficient of co-
relationship, productivity index, trend value, input-output ratio, value of
chi-square, co-efficient of variation and standard deviation.

A Study of Productivity and Financial Efficiency of Textile Industry of India
212
TABLE NO.-6.5
Analysis of Labour Productivity in Oswal Spinning & Wvg. Mills Ltd. (IN CRORES)
YEAR OUTPUT INPUT O/I COEF. PROD. TREND I/O
IN
CRORES
IN
CRORES FACTOR INDEX VALUE
2002-03 55.19 2.95 18.71 0.83 100.00 101.96 0.05
2003-04 54.97 2.98 18.45 0.77 98.60 98.99 0.05
2004-05 60.78 3.17 19.17 0.80 102.49 96.01 0.05
2005-06 79.07 4.93 16.04 0.77 85.73 90.06 0.06
2006-07 67.23 4.30 15.63 0.75 83.57 87.09 0.06
2007-08 77.40 4.71 16.43 0.78 87.84 84.11 0.06
TOTAL 394.64 23.04 104.43 4.69 558.22 558.22 0.35
AVE. 65.77 3.84 17.41 0.78 93.04 93.04 0.06
STANDARD DEVIATION = 8.230883 A=98.89 Chi-square = 0.992
Co-Efficient of Variance 8.84689 B=-2.974
SOURCES: COMPILED FROM ANNUAL REPORTS AND ACCOUNTS OF O S & W ML
Table No.6.6
Calculation of Chi-square value of O S & W ML
Observe Expected (O-E) (O-E)2 (O-E)2/E
100 101.96 -1.96 3.8416 0.038
98.6 98.99 -0.39 0.1521 0.002
102.49 96.01 6.48 41.9904 0.437
85.73 90.06 -4.33 18.7489 0.208
83.57 87.09 -3.52 12.3904 0.142
87.84 84.11 3.73 13.9129 0.165
(Chi-square value) Χ2 0.992
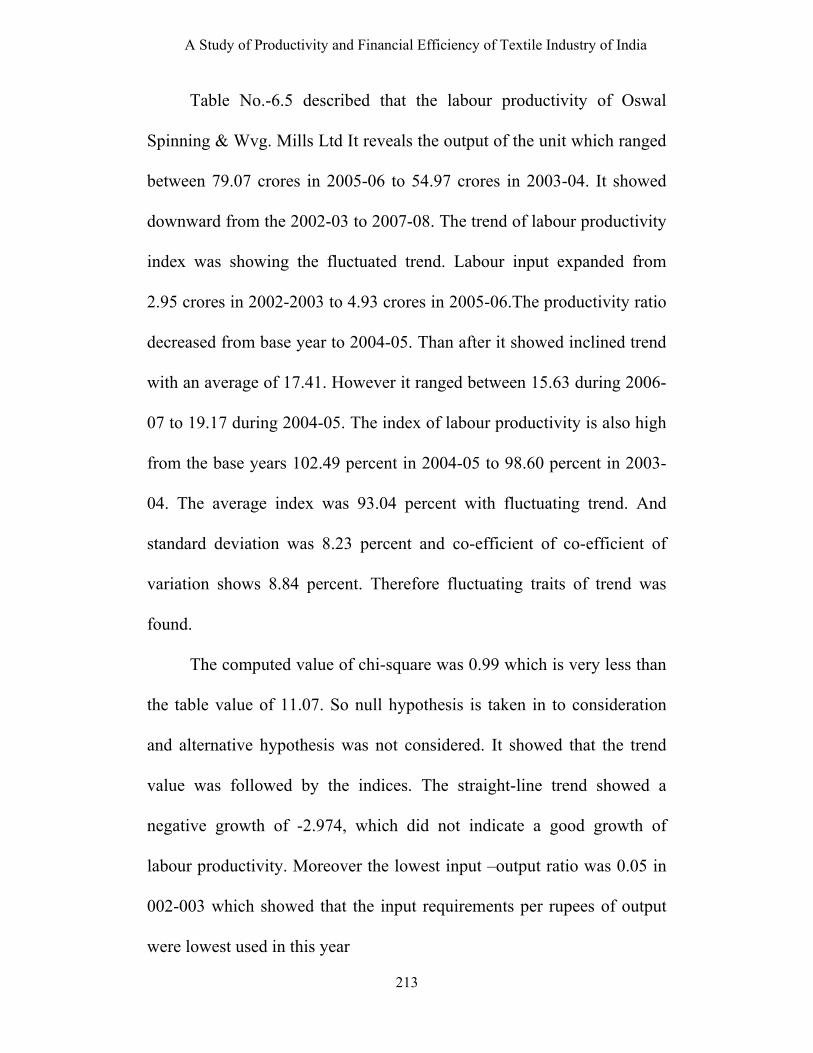
A Study of Productivity and Financial Efficiency of Textile Industry of India
213
Table No.-6.5 described that the labour productivity of Oswal
Spinning & Wvg. Mills Ltd It reveals the output of the unit which ranged
between 79.07 crores in 2005-06 to 54.97 crores in 2003-04. It showed
downward from the 2002-03 to 2007-08. The trend of labour productivity
index was showing the fluctuated trend. Labour input expanded from
2.95 crores in 2002-2003 to 4.93 crores in 2005-06.The productivity ratio
decreased from base year to 2004-05. Than after it showed inclined trend
with an average of 17.41. However it ranged between 15.63 during 2006-
07 to 19.17 during 2004-05. The index of labour productivity is also high
from the base years 102.49 percent in 2004-05 to 98.60 percent in 2003-
04. The average index was 93.04 percent with fluctuating trend. And
standard deviation was 8.23 percent and co-efficient of co-efficient of
variation shows 8.84 percent. Therefore fluctuating traits of trend was
found.
The computed value of chi-square was 0.99 which is very less than
the table value of 11.07. So null hypothesis is taken in to consideration
and alternative hypothesis was not considered. It showed that the trend
value was followed by the indices. The straight-line trend showed a
negative growth of -2.974, which did not indicate a good growth of
labour productivity. Moreover the lowest input –output ratio was 0.05 in
002-003 which showed that the input requirements per rupees of output
were lowest used in this year

A Study of Productivity and Financial Efficiency of Textile Industry of India
214
(4) Shri Dinesh Mills Ltd.:-
Table No.6.7 showed labour productivity ratio, co-efficient of co-
relationship, productivity index, trend value, input-output ratio, value of
chi-square, co-efficient of variation and standard deviation. From above
Table No.-6.4 it describe that the output value of Shri Dinesh Mills Ltd
amounted to 53.46 crores in the base years which was after showing
constant upward trend finally increased to Rs. 79.36 crores in 2007-08
with an average of 66.13 crores. On the labour input recorded showed
fluctuated trend and expanded from 10.45 crores in 2002-03 to 16.49
crores in 2007-2008. The labour productivity ratio was 5.12 in 2002-03
which was increased and reached at 4.98 during the year of 2003-04. The
ratio was 4.87 in the year of 2004-05 and 4.95 in 2005-06. The ratio was
4.86 during the year of 2005-06 and in the last year of study period the
ratio was 4.81.Thus the labour productivity ratio has been fluctuating and
decreasing trend during the period of study ranging from a low of 4.81 in
2007-08 to a high 5.12 in 2002-03 with an average of 4.93.

A Study of Productivity and Financial Efficiency of Textile Industry of India
215
TABLE NO.-6.7
Analysis of Labour Productivity in Shri Dinesh Mills Ltd. (IN CRORES)
YEAR OUTPUT INPUT O/I COEF. PROD. TREND I/O
IN
CRORES
IN
CRORES FACTOR INDEX VALUE
2002-03 53.46 10.45 5.12 0.475677 100.00 98.66 0.20
2003-04 59.31 11.91 4.98 0.467363 97.34 97.92 0.20
2004-05 59.76 12.26 4.87 0.463224 95.28 97.17 0.21
2005-06 69.14 13.96 4.95 0.476302 96.81 95.69 0.20
2006-07 75.77 15.58 4.86 0.477967 95.06 94.94 0.21
2007-08 79.36 16.49 4.81 0.458885 94.07 94.20 0.21
TOTAL 396.8 80.65 29.60 2.82 578.57 578.57 1.22
AVE. 66.13333 13.44167 4.93 0.47 96.42907 96.43 0.20
STANDARD DEVIATION = 2.12 A=98.89 Chi-square = 0.072
Co-Efficient of Variance 2.20 B=-0.74
SOURCE: COMPILED FROM ANNUAL REPORTS AND ACCOUNTS OF SDML
Table No.6.8
Calculation of Chi-square value of SDML
Observe Expected (O-E) (O-E)2 (O-E)2/E
100 98.66 1.34 1.7956 0.018
97.34 97.92 -0.58 0.3364 0.003
95.28 97.17 -1.89 3.5721 0.037
96.81 95.69 1.12 1.2544 0.013
95.06 94.94 0.12 0.0144 0.000
94.07 94.2 -0.13 0.0169 0.000
(Chi-square value) Χ2 0.072

A Study of Productivity and Financial Efficiency of Textile Industry of India
216
After zigzag movement of labour productivity ratio it may also be
observed from the indices, which showed average of 96.42. The overall
performance of Shri Dinesh Mills Ltd with regard to labour productivity
satisfactory as it observed from the average of labour productivity
indices. Co-efficient of variation showed 2.20 while standard deviation
figured by 2.12. The input requirement during the period ranged between
Rs. 0.20 in the base year to 0.21 in 2007-08. In order to test hypothesis
based on chi-square, the calculated value was found 0.072 where as its
table value was 11.07. It means that null hypothesis is accepted and
alternative hypothesis is rejected. It means that the L.P indices follow the
trend value. The straight-line trend showed a negative growth of -0.74,
which did not indicate a good growth of labour productivity.
(5) Welspun India Ltd.:
Table No.6.9 showed labour productivity ratio, co-efficient of co-
relationship, productivity index, trend value, input-output ratio, value of
chi-square, co-efficient of variation and standard deviation.

A Study of Productivity and Financial Efficiency of Textile Industry of India
217
TABLE NO.-6.9
Analysis of Labour Productivity in Welspun India Ltd. (In Crores)
YEAR OUTPUT INPUT O/I
COEF.
FACTOR
PROD.
INDEX
TREND
VALUE
I/O
IN
CRORES
IN
CRORES
2002-03 302.15 13.76 21.96 1.0096 100.00 93.76 0.046
2003-04 368.04 18.41 19.99 0.9130 91.04 86.77 0.050
2004-05 483.18 30.88 15.65 0.9324 71.26 79.79 0.064
2005-06 685.61 58.56 11.71 0.8248 53.32 65.82 0.085
2006-07 1045.06 80.42 13.00 0.7955 59.18 58.83 0.077
2007-08 1311.76 96.33 13.62 0.7888 62.01 51.84 0.073
TOTAL 4195.8 298.36 95.92 5.2641 436.81 436.81 0.395
AVE. 1198.8 85.24571 27.40 1.5040 72.80 72.80 0.113
standard deviation = 18.74 A=98.89 Chi-square = 5.908
Co-Efficient of Variance 25.74 B=-6.987
Source: Compiled from Annual Reports and Accounts Of Wil
Table No.6.10
Calculation of Chi-square value of WIL
Observe Expected (O-E) (O-E)2 (O-E)2/E
100 93.76 6.24 38.9376 0.415
91.04 86.77 4.27 18.2329 0.210
71.26 79.79 -8.53 72.7609 0.912
53.32 65.82 -12.5 156.25 2.374
59.18 58.83 0.35 0.1225 0.002
62.01 51.84 10.17 103.4289 1.995
(Chi-square value) Χ2 5.908

A Study of Productivity and Financial Efficiency of Textile Industry of India
218
Table No.-6.9 describe that labour productivity, co-efficiency of
relationship, productivity index, trend value input-output ratio, standard
deviation, co-efficient of variation and value of chi-square.
It was apparent from the table that the labour productivity of
Welspun India Ltd fluctuated through out the period of the study. The
output of Welspun India Ltd amounted to 302.15 crores in 202-03 which
is increased Rs. 368.04 crores in 2003-04.But the output went down to
Rs. 483.18 crores in 2004-05 and then it rose to 685.61 crores in 2005-06.
The output was again up to Rs. 1045.06 corers. In the last year of study
period it was 1311.76 crores with an average of Rs. 1198.8 crores. On the
other hand the labour input was 13.76 crores in 2002-03 and 18.41 crores
in 2003-04. The input again went up to 30.88 crores in 2004-05 and 58.56
crores in 2005-06. In the last two years of study period it was 80.42
crores in 2006-07 and 96.33 crores in 2007-08.Therefore it expanded
from Rs. 13.76 crores in 2002-03 to Rs.96.33 crores in 2007-2008. The
productivity ratio was 21.96 in 2002-03 and 19.99 in 2003-04. The ratio
was 15.65 in 2004-05 which had been declined again to 11.71 in 2005-06.
In the last year of study period it was 13.62. Thus the productivity ratio
ranged between 11.71in 2005-06 to 21.96 in 2002-03. Similarly the
productivity index also fluctuate the average of the indices 72.80percent
shows declining trend in labour productivity.

A Study of Productivity and Financial Efficiency of Textile Industry of India
219
The straight line based on trend value showed a negative growth
rate of 0.315 per annum which indices a poor pattern of labour
productivity. It may also be seen from the table that the average labour
input per rupees of output for textiles amounted to Rs. 0.046. Input-
output ratio was the lowest in 0.046 in 2002-03. It showed that the
company achieved its maximum efficiency in that year.
The value of chi-square showed 5.908, which is less than the table
value 11.07. Therefore the null hypothesis is accepted and alternative
hypothesis is rejected.
(6) S Kumar’s Nationwide Ltd..:-
Table No.-6.11 describe that labour productivity ratio, co-
efficiency of co-relationship, productivity index, Trend value, Input-
output ratio, standard deviation, co-efficient of variation and value of chi-
square.
It is apparent from the table that the labour productivity of S
Kumar’s Nationwide Ltd. fluctuated throughout the period of study. The
output of S Kumar’s Nationwide Ltd. amounted to Rs.624.65 crores in
2002-03 which is decreased to Rs.618.55 crores in 2003-04.then it
increased to Rs 346.21 crores in 2004-05 and Rs 890.87 crores in 2005-
06. The output was the second highest of Rs 1230.38 cores in 2006-07
and the highest of Rs1606.56 cores in 2007-08. On the other hand the
labour input was Rs.19.16 crores in 2002-03 and it increased to Rs.21.03

A Study of Productivity and Financial Efficiency of Textile Industry of India
220
crores in 2003-04. The input was Rs.8.33 crores in 2004-05 and then it
rose to Rs.22.77 crores in 2005-06. The input again went up to Rs.31.8
crores in 2006-07 and Rs.38.91 in 2007-08. The average input was
Rs.40.57 crores. Thus it expanded from Rs. 8.33 crores in 2004-05 to Rs
38.91 crores in 2007-08. In S Kumar’s Nationwide Ltd.the labour
productivity ratio showed fluctuated trend after during the study period.
TABLE NO.-6.11
Analysis of Labour Productivity in S Kumar’s Nationwide Ltd. (In Crores)
YEAR OUTPUT INPUT O/I COEF. PROD. TREND I/O
IN
CRORES
IN
CRORES FACTOR INDEX VALUE
2002-03 624.65 19.16 32.60 0.7690 100.00 99.98 0.031
2003-04 618.55 21.03 29.41 0.7805 90.22 104.60 0.034
2004-05 346.21 8.33 41.56 0.8930 127.48 109.22 0.024
2005-06 890.87 22.77 39.12 0.8862 120.01 118.46 0.026
2006-07 1230.38 31.8 38.69 0.8907 118.68 123.08 0.026
2007-08 1606.56 38.91 41.29 0.9957 126.65 127.70 0.024
TOTAL 5317.22 142 222.68 5.2150 683.03 683.03 0.164
AVE. 886.20 23.67 37.11 0.87 113.84 113.84 0.03
STANDARD DEVIATION = 15.24 A=98.89 Chi-square = 5.216
Co-Efficient of Variance 13.39 B=4.62
SOURCE: COMPILED FROM ANNUAL REPORTS AND ACCOUNTS OF S K N L

A Study of Productivity and Financial Efficiency of Textile Industry of India
221
Table No.6.12
Calculation of Chi-square value of S K N L
Observe Expected (O-E) (O-E)2 (O-E)2/E
100 99.98 0.02 0.0004 0.000
90.22 104.6 -14.38 206.7844 1.977
127.48 109.22 18.26 333.4276 3.053
120.01 118.46 1.55 2.4025 0.020
118.68 123.08 -4.4 19.36 0.157
126.65 127.7 -1.05 1.1025 0.009
(Chi-square value) Χ2 5.216
The ratio was 32.60 times in 2002-03, and then it declined to 29.41
times in 2003-04 and 41.56 times in 2004-05. After this year the ratio
decreased 39.12 times in 2005-06 it further declined to 38.69 times in
2006-07 and reached at second level of 41.29 times in 2007-08. The
average ratio was 37.11 times. The labour productivity ratio was
satisfactory in S Kumar’s Nationwide Ltd. The productivity ratio ranged
between 41.56 in 2004-05 to 29.41 in 2003-04. Similarly the productivity
index also fluctuated. The index was 90.22 percent in 2003-04 and then it
rose to 127.48 percent. The indices was 120.01 in 2005-06 and 118.68
percent in 2006-07 and 126.65 percent in 2007-08 with average of the
indices 113.84

A Study of Productivity and Financial Efficiency of Textile Industry of India
222
It may also be seen from the table that the average labour input per
rupees of output for S Kumar’s Nationwide Ltd. amounted to Rs. 0.034.
Input-output ratio was the lowest in 0.024 in 2007-08. It showed that the
company achieved its maximum efficiency on that year.
The value of chi-square showed 5.216, which is less than the table
value of 11.07. Hence the null hypothesis is accepted and alternative
hypothesis is rejected.
(7) Mafatlal Industries Ltd.:
Table No.-6.13 describe that labour productivity ratio, co-
efficiency of co-relationship, productivity index, Trend value, Input-
output ratio, standard deviation, co-efficient of variation and value of chi-
square

A Study of Productivity and Financial Efficiency of Textile Industry of India
223
TABLE NO.-6.13
Analysis of Labour Productivity Ratio in Mafatlal Industries td. (IN CRORES)
YEAR OUTPUT INPUT O/I COEF. PROD. TREND I/O
FACTOR INDEX VALUE
2002-03 430.91 84.11 5.1232 0.3145 100.00 89.957 0.1952
2003-04 172.91 47.53 3.6379 0.2203 71.01 90.279 0.2749
2004-05 176.52 33.48 5.2724 0.2898 102.91 90.600 0.1897
2005-06 146.34 29.57 4.9489 0.2583 96.60 91.242 0.2021
2006-07 156.16 45.03 3.4679 0.1937 67.69 91.564 0.2884
2007-08 401.57 73.04 5.4979 0.3341 107.32 91.885 0.1819
TOTAL 1484.41 312.76 27.9483 1.6106 545.53 545.527 1.3320
AVE. 247.4017 52.12667 4.6580 0.2684 90.92 90.921 0.2220
STANDARD DEVIATION = 17.1078 A=98.89 Chi-square = 16.039
Co-Efficient of Variance 18.8161 B=0.32
Sources: Compiled From Annual Reports And Accounts Of MFTL
Table No.6.14
Calculation of Chi-square value of MFTL Observe Expected (O-E) (O-E)2 (O-E)2/E
100 89.957 10.043 100.8618 1.121
71.01 90.279 -19.269 371.2944 4.113
102.91 90.6 12.31 151.5361 1.673
96.6 91.242 5.358 28.70816 0.315
67.69 91.564 -23.874 569.9679 6.225
107.32 91.885 15.435 238.2392 2.593
(Chi-square value) Χ2 16.039
A Study of Productivity and Financial Efficiency of Textile Industry of India
224
It is apparent from the table that the labour productivity of Mafatlal
Industries Ltd. fluctuated throughout the period of study. The output of
Mafatlal Industries Ltd. amounted to Rs. 430.91crores in 2002-03 which
is decreased to Rs. 172.91 crores in 2003-04.then it increased to Rs
176.52 crores in 2004-05 and Rs 146.34 crores in 2005-06. The output
was Rs 156.16 cores in 2006-07 and the second highest of Rs 401.57
cores in 2007-08. On the other hand the labour input was Rs. 84.11crores
in 2002-03 and it increased to Rs. 47.53 crores in 2003-04. The input was
Rs. 33.48 crores in 2004-05 and then it declined to Rs. 29.57crores in
2005-06. The input again went up to Rs. 45.03 crores in 2006-07 and Rs.
73.04 in 2007-08. The average input was Rs. 52.13 crores. Thus it
expanded from Rs. 84.11 crores in 2002-03 to Rs 29.57 crores in 2005-
06.
It may also be seen from the table that the average labour input per
rupees of output for Mafatlal Industries Ltd. amounted to Rs. 0.2884.
Input-output ratio was the lowest in 0.1819 in 2007-08. It showed that the
company achieved its maximum efficiency on that year.
In Mafatlal Industries Ltd the labour productivity ratio showed
fluctuated trend after during the study period. The ratio was 5.1232 times
in 2002-03, and then it declined to 3.6379 times in 2003-04 and 5.2724
times in 2004-05. After this year the ratio decreased 4.9489 times in
2005-06 it further declined to 3.4679 times in 2006-07 and reached at

A Study of Productivity and Financial Efficiency of Textile Industry of India
225
second level of 5.4979 times in 2007-08. The average ratio was 4.6580
times. The labour productivity ratio was satisfactory in Mafatlal
Industries Ltd. The productivity ratio ranged between 5.4979 in 2007-08
to 3.4679 in 2006-07. Similarly the productivity index also fluctuated.
The index was 71.01 percent in 2003-04 and then it rose to 102.91
percent. The index was 96.60 in 2005-06 and 67.69 percent in 2006-07
and 107.32 percent in 2007-08 with average of the indices 90.92.
The value of chi-square showed 16.039, which is more than the
table value of 11.07. Hence the null hypothesis is rejected and alternative
hypothesis is accepted.
6.5 Comparative Analysis of Labour Productivity :
The Table No.-6.15 showed the overall analysis of Labour
productivity of textiles group of companies. It also Showed labour
productivity ratio, Co-efficient of co-relationship, productivity index,
trend value, input-output ratio, value of chi-square, co-efficient of
variation, and standard deviation.
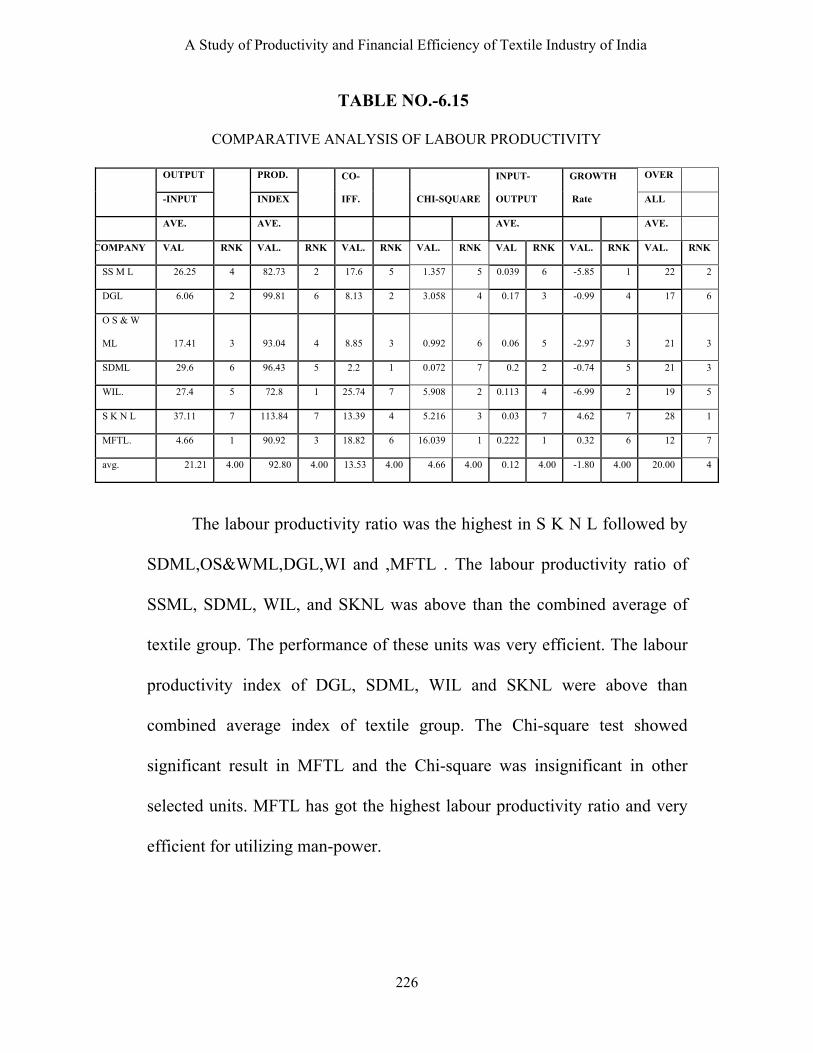
A Study of Productivity and Financial Efficiency of Textile Industry of India
226
TABLE NO.-6.15
COMPARATIVE ANALYSIS OF LABOUR PRODUCTIVITY
OUTPUT
PROD.
CO-
IFF. CHI-SQUARE
INPUT-
OUTPUT
GROWTH
Rate
OVER
-INPUT INDEX ALL
AVE. AVE. AVE. AVE.
COMPANY VAL RNK VAL. RNK VAL. RNK VAL. RNK VAL RNK VAL. RNK VAL. RNK
SS M L 26.25 4 82.73 2 17.6 5 1.357 5 0.039 6 -5.85 1 22 2
DGL 6.06 2 99.81 6 8.13 2 3.058 4 0.17 3 -0.99 4 17 6
O S & W
ML 17.41 3 93.04 4 8.85 3 0.992 6 0.06 5 -2.97 3 21 3
SDML 29.6 6 96.43 5 2.2 1 0.072 7 0.2 2 -0.74 5 21 3
WIL. 27.4 5 72.8 1 25.74 7 5.908 2 0.113 4 -6.99 2 19 5
S K N L 37.11 7 113.84 7 13.39 4 5.216 3 0.03 7 4.62 7 28 1
MFTL. 4.66 1 90.92 3 18.82 6 16.039 1 0.222 1 0.32 6 12 7
avg. 21.21 4.00 92.80 4.00 13.53 4.00 4.66 4.00 0.12 4.00 -1.80 4.00 20.00 4
The labour productivity ratio was the highest in S K N L followed by
SDML,OS&WML,DGL,WI and ,MFTL . The labour productivity ratio of
SSML, SDML, WIL, and SKNL was above than the combined average of
textile group. The performance of these units was very efficient. The labour
productivity index of DGL, SDML, WIL and SKNL were above than
combined average index of textile group. The Chi-square test showed
significant result in MFTL and the Chi-square was insignificant in other
selected units. MFTL has got the highest labour productivity ratio and very
efficient for utilizing man-power.

A Study of Productivity and Financial Efficiency of Textile Industry of India
227
References
1. BROWN DAVID S. “ Productivity of the professionals”
productivity, New Delhi, Vol.XXIV, No.3, oct-dec.1983, p.241-
249
A Study of Productivity and Financial Efficiency of Textile Industry of India
228
Chapter-7
ANALYSIS OF OVERHEADS PRODUCTIVITY 7.1 Overheads Productivity:
“Overheads costs are the operating costs of a business enterprise,
which can be traced directly to a particular unit of output. The term
‘Overheads’ is used interchangeably with such terms as burden,
supplementary costs, manufacturing expenses, and indirect expenses”1
The major part of total cost including total overheads, office
overheads, selling and distribution overheads, thus primary aim of
accounting for overhead is to controlling. Present study outlined output in
constant prices divided by total overheads input it gives overheads
productivity ratio. The productivity ratio indices, Co-efficiency of co-
relationship, input output ratio etc.
7.2 Steps in calculation for overheads Productivity:
HYPOTHESIS:
For the computation of overhead productivity following two
hypothesis have been tested with two corresponding alternative
hypothesis. The first hypothesis is shown whether the overhead
productivity indices can be approximately as straight-line trend while the
second hypothesis is whether there is any significant difference between

A Study of Productivity and Financial Efficiency of Textile Industry of India
229
the overheads productivity of the selected units of textiles industry in
India.
The hypothesis has been framed as under:
7.3 Hypothesis Based on Chi-square :
Null hypothesis: - The overhead productivity indices can be represented
by the line of the best fit.
Alternative hypothesis: -The indices can’t be represented by the line of
the best fit.
Level of significant: - 5 percent
Statistical tool used: - chi-square
(O-E) 2
CHI-SQUARE (χ2) = E
Critical value: - 11.07
If the found of chi-square is less than the critical value, the null
hypothesis will be accepted. While value of chi-square is shown greater
than the table value null hypothesis will be rejected and its alternative
hypothesis is accepted. The acceptance of null hypothesis would mean
that the calculated value of the indices is based on least square straight-
line trend. It may represent the pattern and growth of the overhead
productivity. Since no logical conclusions can be drawn from the original

A Study of Productivity and Financial Efficiency of Textile Industry of India
230
indices which are generally fluctuating with its negative or positive
growth rate per year expressing the direction of productivity growth.
7.4 Overheads Productivity in Selected Companies :
Table 7.1 to 7.14 describes the overhead productivity ratio and
index of overheads productivity, average of overheads indices, co-
efficiency of variation, and value of chi-square for selected companies
under study.
(1) Siyaram Silk Mills Ltd.:
Table No.-7.1 describe that overheads productivity ratio, co-
efficiency of co-relationship, productivity index, Trend value, Input-
output ratio, standard deviation, co-efficient of variation and value of chi-
square
It is apparent from the table that the overheads productivity of
Siyaram Silk Mills Ltd. fluctuated throughout the period of study. The
output of Siyaram Silk Mills Ltd amounted to Rs. 325.59 crores in 2002-
03 which is decreased to Rs. 317.98crores in 2003-04.then it increased to
Rs 339.96 crores in 2004-05 and Rs 450.00crores in 2005-06. The output
was Rs 525.16cores in 2006-07 and the second highest of Rs 590.85 cores
in 2007-08. On the other hand the overheads input was Rs. 128.53 crores
in 2002-03 and it increased to Rs141.42 crores in 2003-04. The input was

A Study of Productivity and Financial Efficiency of Textile Industry of India
231
Rs. 133.66 crores in 2004-05 and then it inclined to Rs. 167.27 crores in
2005-06. The input again went up to Rs. 203.19 crores in 2006-07 and
Rs. 253.40 in 2007-08. The average input was Rs. 171.25 crores. Thus it
expanded from Rs. 128.53 crores in 2002-03 to Rs 253.40crores in 2007-
08.It may also be seen from the table that the average overheads input per
rupees of output for Siyaram Silk Mills Ltd amounted to Rs. 0.44. Input-
output ratio was the lowest in 0.37 in 2005-06. It showed that the
company achieved its maximum efficiency on that year.
TABLE NO.-7.1
Analysis of Overhead Productivity Ratio in Siyaram Silk Mills Ltd.
YEAR OUTPUT INPUT O/I COEF. PROD. TREND I/O
IN CRORES IN CRORES FACTOR INDEX VALUE
2002-03 325.59 128.53 2.53 0.08 100.00 97.33 0.39
2003-04 317.98 141.42 2.25 0.07 88.76 97.64 0.44
2004-05 339.96 133.66 2.54 0.09 100.41 97.94 0.39
2005-06 450.00 167.27 2.69 0.10 106.20 98.54 0.37
2006-07 525.16 203.19 2.58 0.12 102.03 98.85 0.39
2007-08 590.85 253.40 2.33 0.11 92.05 99.15 0.43
TOTAL 2549.5 1027.47 14.932 589.443 589.44 2.4202
AVE. 424.92 171.25 2.49 0.09 98.24 98.24 0.40
STANDARD DEVIATION = 6.5382 A=98.89 Chi-square = 2.149
Co-Efficient of Variance 6.655 B=0.30
SOURCE: COMPILED FROM ANNUAL REPORTS AND ACCOUNTS OF SSML

A Study of Productivity and Financial Efficiency of Textile Industry of India
232
Table No.7.2
Calculation of Chi-square value of SSML
Observe Expected (O-E) (O-E)2 (O-E)2/E
100 97.33 2.67 7.1289 0.073
88.76 97.64 -8.88 78.8544 0.808
100.41 97.94 2.47 6.1009 0.062
106.2 98.54 7.66 58.6756 0.595
102.03 98.85 3.18 10.1124 0.102
92.05 99.15 -7.1 50.41 0.508
(Chi-square value) Χ2 2.149
The calculated value of chi-square comes to 2.149 which is less
than the table value of 11.07 therefore null hypothesis of straight-line
assumption for the productivity an index is accepted & alternative
hypothesis is rejected.
The overheads input requirement per rupee of output for the
Siyaram Silk Mills Ltd. rose from Rs. 0.39 in 2002-03 it 0.44 in 2003-04.
However, if the unit had utilized its overheads resources as done in 2005-
06.
(2) Digjam Ltd.:
Table No.-7.3 showed overhead ratio, co-efficiency of co-
relationship, productivity index, average indices, trend value of indices,
standard deviation, co-efficient of variation, chi-square and input output
ratio for Mysore Cement Ltd.

A Study of Productivity and Financial Efficiency of Textile Industry of India
233
TABLE NO.-7.3
Analysis of Overhead Productivity Ratio in Digjam Ltd.
YEAR OUTPUT INPUT O/I COEF. PROD. TREND I/O
IN CRORES IN CRORES FACTOR INDEX VALUE
2002-03 220.01 66.05 3.33 0.30 100.00 100.50 0.30
2003-04 270.09 86.76 3.11 0.27 93.46 96.22 0.32
2004-05 295.34 89.95 3.28 0.29 98.57 91.94 0.30
2005-06 30.59 11.53 2.65 0.22 79.65 83.39 0.38
2006-07 109.20 42.63 2.56 0.23 76.90 79.11 0.39
2007-08 112.05 43.45 2.58 0.22 77.42 74.83 0.39
TOTAL 1037.3 340.37 17.52 1.53 526.00 526.00 2.08
AVE. 172.88 56.73 2.92 0.25 87.67 87.67 0.35
standard deviation = 10.86 A=98.89 Chi-square = 0.879
Co-Efficient of Variance 12.39 B=-4.28
Sources: Compiled From Annual Reports And Accounts Of DGL
Table No.7.4
Calculation of Chi-square value of DGL
Observe Expected (O-E) (O-E)2 (O-E)2/E
100 100.5 -0.5 0.25 0.002
93.46 96.22 -2.76 7.6176 0.079
98.57 91.94 6.63 43.9569 0.478
79.65 83.39 -3.74 13.9876 0.168
76.9 79.11 -2.21 4.8841 0.062
77.42 74.83 2.59 6.7081 0.090
(Chi-square value) Χ2 0.879

A Study of Productivity and Financial Efficiency of Textile Industry of India
234
The above table reveals that output of Digjam Ltd. During the
period of study decreased from Rs. 220.01 crores to Rs. 30.59 crores in
2005-06. Then after it showed upward trend and in the last year it was
112.05. While the input during the period of study showed a decreased
from 66.05 crores in 2002-03 to 43.45 crores in 2007-08 however it was
very low 11.53 crores in 2005-06. The output input ratio showed mix
trend with an average of 2.92 the trend of productivity indices showed
towards upward i.e. in 2002-03 it showed 100 and in 2002-03 and it
showed 93.46 in 2003-04 but in the last year it was declined to 77.42 with
an average of 87.67 percent The value of co-efficient of variation showed
12.39 percent and standard deviation was 10.86 percent during the period
study.
In order to test null hypothesis based on chi-square statistics the
value of X2 has also been calculated, which workout to be 0.879 and is
less than the critical value of 11.07 hence null hypotheses is accepted and
alternative hypothesis is rejected.
The straight-line trend showed a negative pattern of overhead
productivity of Digjam Ltd with a negative of change per year -4.28
percent. Overhead input requirement per rupees of output was fluctuated
from 0.30 in the base year to 0.39 in the last year.

A Study of Productivity and Financial Efficiency of Textile Industry of India
235
(3) Oswal Spinning & Wvg. Mills Ltd.:
Table 7.5 showed overhead ratio, co-efficiency of co-relationship,
productivity index, average indices, trend value of indices, standard
deviation, co-efficient of variation, chi-square and input output ratio for
Oswal Spinning & Wvg. Mills Ltd
TABLE NO.-7.5
Analysis of Overhead Productivity Ratio in Oswal Spinning & Wvg. Mills Ltd.
YEAR OUTPUT INPUT O/I COEF. PROD. TREND I/O
IN CRORES IN CRORES FACTOR INDEX VALUE
2002-03 55.19 14.49 3.81 0.1684 100.00 101.92 0.26
2003-04 54.97 13.86 3.97 0.1648 104.13 100.89 0.25
2004-05 60.78 15.46 3.93 0.1645 103.22 99.85 0.25
2005-06 79.07 22.75 3.48 0.1678 91.25 97.78 0.29
2006-07 67.23 19.26 3.49 0.1667 91.65 96.74 0.29
2007-08 77.40 19.80 3.91 0.1848 102.63 95.70 0.26
TOTAL 394.64 105.62 22.58 1.0170 592.88 592.88 1.60
AVE. 65.77 17.60 3.76 0.1695 98.81 98.81 0.27
Standard deviation = 5.8687 A=98.89 Chi-square = 1.460
Co-Efficient of Variance 5.939 B=-1.037
Sources: Compiled From Annual Reports And Accounts Of OS&WML

A Study of Productivity and Financial Efficiency of Textile Industry of India
236
Table No.7.6
Calculation of Chi-square value of OS&WML
Observe Expected (O-E) (O-E)2 (O-E)2/E
100 101.92 -1.92 3.6864 0.036
104.13 100.89 3.24 10.4976 0.104
103.22 99.85 3.37 11.3569 0.114
91.25 97.78 -6.53 42.6409 0.436
91.65 96.74 -5.09 25.9081 0.268
102.63 95.7 6.93 48.0249 0.502
(Chi-square value) Χ2 1.460
The above table described that the output of Oswal Spinning &
Wvg. Mills Ltd was increased from Rs.55.19 crores in 2002-03 to
54.97crores in 2003-04. Then after it shows decreased trend to the last
year of study period. While the overhead input also increased from 60.78
crores in 2004-05 to 79.07 crores in 2005-06. Owing to speedy rises in
the output in comparison to the input the overheads productivity ratio of
Oswal Spinning & Wvg. Mills Ltd went up from 3.81in 2002-03 to 3.97
in 2003-04 and was 3.93 in 2004-05. The ratio was 3.48, which was
lower than previous year. The ratio was 3.48 in 2005-06 which was
greater than the year of 2005-06.the ratio showed mix trend with an
average of 3.76 during the study period. Similarly the productivity index
also influenced as according to the productivity ratio the average index

A Study of Productivity and Financial Efficiency of Textile Industry of India
237
worked out to 98.81 with a moderate co-efficient of variation being 5.94
percent and standard deviation of 5.87 percent.
Further more in order to test the null hypothesis whether the
distribution of overhead productivity indices of Oswal Spinning & Wvg.
Mills Ltd confirms to the norms of straight line based on least square
method it was found that the value of chi-square figured at 1.460 it is
above than the table value hence the null hypothesis is rejected and
alternative hypothesis is accepted. The computed value of productivity
indices shows a negative growth rate of -1.04 per year resulting in
upward trend. It also calculated from table that overheads required per
rupees of output ranged from 0.25 to 0.29.
(4) Shri Dinesh Mills Ltd..:
Table No.-7.7 showed overhead ratio, co-efficiency of co-
relationship, productivity index, average indices, trend value of indices,
standard deviation, co-efficient of variation, chi-square and input output
ratio for Shri Dinesh Mills Ltd Table also reveals that the output of Shri
Dinesh Mills Ltd during the period of study increased from 53.46 crores
in 2002-03 to 59.31 crores in 2003-04. Then it showed increased trend
Rs. 75.77 crores to Rs 79.36 crores in the last years of the study period,
while input of overhead during the study period should be shown
adequately, increased from Rs. 21.01 in 2002-03 to Rs. 28.86 in 2007-08.
The overhead productivity indices also showed similar results. The

A Study of Productivity and Financial Efficiency of Textile Industry of India
238
productivity ratio of Dinesh Mills Ltd showed fluctuated trend the
productivity index also showed fluctuated trend with an average 114.04.
The productivity ratio ranged between 2.54 in 2002-03 to 3.49 in 2006-
07.The value of co-efficient of variation showed 13.10 and standard
deviation was of 14.90 percent.
TABLE NO.-7.7
Analysis of Overhead Productivity Ratio in Shri Dinesh Mills Ltd.
YEAR OUTPUT INPUT O/I COEF. PROD. TREND I/O
IN
CRORES
IN
CRORES FACTOR INDEX VALUE
2002-03 53.46 21.01 2.54 0.24 100.00 102.02 0.39
2003-04 59.31 22.74 2.61 0.24 102.50 106.03 0.38
2004-05 59.76 21.54 2.77 0.26 109.03 110.03 0.36
2005-06 69.14 21.35 3.24 0.31 127.27 118.04 0.31
2006-07 75.77 21.68 3.49 0.34 137.35 122.05 0.29
2007-08 79.36 28.86 2.75 0.26 108.07 126.05 0.36
TOTAL 396.80 137.18 17.41 1.66 684.23 684.23 2.10
AVE. 66.13 22.86 2.90 0.28 114.04 114.04 0.35
STANDARD DEVIATION = 14.90 A=98.89 Chi-square = 5.371
Co-Efficient of Variance 13.1 B=4.005
Sources: Compiled From Annual Reports And Accounts Of SDML

A Study of Productivity and Financial Efficiency of Textile Industry of India
239
Table No.7.8
Calculation of Chi-square value OF SDML
Observe Expected (O-E) (O-E)2 (O-E)2/E
100 102.02 -2.02 4.0804 0.040
102.5 106.03 -3.53 12.4609 0.118
109.03 110.03 -1 1 0.009
127.27 118.04 9.23 85.1929 0.722
137.35 122.05 15.3 234.09 1.918
108.07 126.05 -17.98 323.2804 2.565
(Chi-square value) Χ2 5.371
In order to measure the null hypothesis based on chi-square method,
the value of chi-square has also been calculated. Which is work out to be
5.371 and is less than the critical value of 11.07 hence the null hypothesis
is accepted and alternative hypothesis is rejected.
The straight line trend showed a negative pattern of overhead
productivity of Dinesh Mills Ltd. of change 4.005 the overhead
requirement per rupees of output for the Dinesh Mills Ltd. ranged from
0.39 in 2002-03 to 0.29 in 2006-07.
(5) Welspun India Ltd.:
Table No.-7.9 describe that overheads productivity ratio, co-
efficiency of co-relationship, productivity index, Trend value, Input-
output ratio, standard deviation, co-efficient of variation and value of chi-
square

A Study of Productivity and Financial Efficiency of Textile Industry of India
240
TABLE NO.-7.9
Analysis of Overhead Productivity Ratio in Welspun India Ltd
YEAR OUTPUT INPUT O/I COEF. PROD. TREND I/O
IN CRORES IN CRORES FACTOR INDEX VALUE
2002-03 302.150 56.340 5.363 0.247 100.000 95.276 0.186
2003-04 368.040 74.040 4.971 0.227 92.688 93.786 0.201
2004-05 483.180 100.160 4.824 0.287 89.952 92.296 0.207
2005-06 685.610 161.810 4.237 0.299 79.007 89.316 0.236
2006-07 1045.060 205.190 5.093 0.312 94.968 87.826 0.196
2007-08 1311.760 277.250 4.731 0.274 88.222 86.336 0.211
TOTAL 4195.800 874.790 29.219 1.645 544.837 544.837 1.239
AVE. 699.300 145.798 4.870 0.274 90.806 90.806 0.206
STANDARD DEVIATION = 7.0996 A=98.89 Chi-square = 2.118
Co-Efficient of Variance 7.818 B=-1.489
Sources: Compiled From Annual Reports and Accounts OF WIL
Table No.7.10 Calculation of Chi-square value OF WIL
Observe Expected (O-E) (O-E)2 (O-E)2/E
100 95.276 4.724 22.31618 0.234
92.688 93.786 -1.098 1.205604 0.013
89.952 92.296 -2.344 5.494336 0.060
79.007 89.316 -10.309 106.2755 1.190
94.968 87.826 7.142 51.00816 0.581
88.222 86.336 1.886 3.556996 0.041
(Chi-square value) Χ2 2.118

A Study of Productivity and Financial Efficiency of Textile Industry of India
241
It is apparent from the table that the overheads productivity of
Welspun India Ltd fluctuated throughout the period of study. The output
of Welspun India Ltd amounted to Rs. 302.15 crores in 2002-03 which is
increased to Rs. 368.04 crores in 2003-04.then it decreased to Rs 483.18
crores in 2004-05 and Rs 685.61 crores in 2005-06. The output was Rs
1045 cores in 2006-07 and the highest of Rs 1311.76 cores in 2007-08.
On the other hand the overheads input were Rs. 56.34 crores in 2002-03
and it creased to Rs 74.04 crores in 2003-04. The input was Rs. 100.16
crores in 2004-05 and then it inclined to Rs. 161.81 crores in 2005-06.
The input again went up to Rs. 205.19 crores in 2006-07 and Rs. 277.25
in 2007-08. The average input was Rs. 145.80 crores. Thus it expanded
from Rs. 56.34 crores in 2002-03 to Rs 277.25 crores in 2007-08. It may
also be seen from the table that the average overheads input per rupees of
output for Welspun India Ltd amounted to Rs. 0.21.Input-output ratio
was the lowest 0.186 n 2002-03. It showed that the company achieved its
maximum efficiency on that year.
The calculated value of chi-square comes to 2.118 which is less
than the table value of 11.07 therefore null hypothesis of straight-line
assumption for the productivity indices are accepted & alternative
hypothesis is rejected.
The overheads input requirement per rupee of output for the
Welspun India Ltd rose from Rs. 0.186 in 2002-03 it 0.236 in 2005-06.

A Study of Productivity and Financial Efficiency of Textile Industry of India
242
However, if the unit had utilized its overheads resources as done in 2005-
06.
(6) S Kumars Nationwide Ltd..:
TABLE NO.-7.11
Analysis of Overhead Productivity Ratio in S Kumars Nationwide Ltd
YEAR OUTPUT INPUT O/I COEF. PROD. TREND I/O
IN
CRORES
IN
CRORES FACTOR INDEX VALUE
2002-03 624.65 90.62 6.89 0.16 100.00 100.28 0.15
2003-04 618.55 85.43 7.24 0.19 105.04 110.65 0.14
2004-05 346.21 38.93 8.89 0.19 129.02 121.03 0.11
2005-06 890.87 85.53 10.42 0.24 151.11 141.78 0.10
2006-07 1230.38 135.93 9.05 0.21 131.31 152.16 0.11
2007-08 1606.56 135.54 11.85 0.29 171.96 162.53 0.08
TOTAL 5317.22 571.98 54.35 1.28 788.43 788.43 0.69
AVE. 886.20 95.33 9.06 0.21 131.41 131.41 0.11
Standard Deviation = 27.275 A=98.89 Chi-square = 4.831
Co-Efficient of Variance 20.76 B=10.38
Sources: Compiled From Annual Reports And Accounts Of SKNL

A Study of Productivity and Financial Efficiency of Textile Industry of India
243
Table No.7.12
Calculation of Chi-square value of SKNL
Observe Expected (O-E) (O-E)2 (O-E)2/E
100 100.28 -0.28 0.0784 0.001
105.04 110.65 -5.61 31.4721 0.284
129.02 121.03 7.99 63.8401 0.527
151.11 141.78 9.33 87.0489 0.614
131.31 152.16 -20.85 434.7225 2.857
171.96 162.53 9.43 88.9249 0.547
(Chi-square value) Χ2 4.831
Table No.-7.11 describe that overheads productivity ratio, co-
efficiency of co-relationship, productivity index, Trend value, Input-
output ratio, standard deviation, co-efficient of variation and value of chi-
square
It is apparent from the table that the overheads productivity of S
Kumars Nationwide Ltd fluctuated throughout the period of study. The
output of S Kumars Nationwide Ltd amounted to Rs. 624.65 crores in
2002-03 which is decreased to Rs. 618.55crores in 2003-04.then it
increased to Rs 346.21 crores in 2004-05 and Rs 890.87 crores in 2005-
06. The output was Rs 1230 cores in 2006-07 and the second highest of
Rs 1606.56 cores in 2007-08. On the other hand the overheads input were
Rs. 90.62 crores in 2002-03 and it creased to Rs 85.43 crores in 2003-04.
The input was Rs. 38.93 crores in 2004-05 and then it inclined to Rs.

A Study of Productivity and Financial Efficiency of Textile Industry of India
244
85.53 crores in 2005-06. The input again went up to Rs. 135.93 crores in
2006-07 and Rs. 135.54 in 2007-08. The average input was Rs. 95.33
crores. Thus it expanded from Rs. 38.93 crores in 2004-05 to Rs 135.54
crores in 2007-08. It may also be seen from the table that the average
overheads input per rupees of output for S Kumars Nationwide Ltd
amounted to Rs. 0.11.Input-output ratio was the lowest 0.08 in 2005-06.
It showed that the company achieved its maximum efficiency on that
year.
The calculated value of chi-square comes to 4.831 which is less
than the table value of 11.07 therefore null hypothesis of straight-line
assumption for the productivity indices is accepted & alternative
hypothesis is rejected.
The overheads input requirement per rupee of output for the S
Kumars Nationwide Ltd rose from Rs. 0.08 in 2007-08 it 0.15 in 2002-
03. However, if the unit had utilized its overheads resources as done in
2007-08.
(7) Mafatlal Industries Ltd.:-
Table No.-7.13 showed overhead ratio, co-efficiency of co-
relationship, productivity index, average indices, trend value of indices,
standard deviation, co-efficient of variation, chi-square and input output
ratio for Mafatlal Industries Ltd.
A Study of Productivity and Financial Efficiency of Textile Industry of India
245
The above table reveals that the output of Mafatlal Industries Ltd.
During the study period was Rs.430.91 in 2002-03 and it reached to
bottom level Rs. 146.34 crores in 2005-06. The output was Rs. 401.57
crores in 007-09 with an average of Rs.247.40 crores.While the overhead
input showed a dramatic decreased from Rs. 188.05 crores to Rs. 65.98
crores in 2005-06. In the last year of study period the input rose to
Rs.121.57 crores. The average input was Rs.100.01 crores. The output
input ratio was 2.29 times in 2002-03 and it was 2.13 times in 2003-04.
The ratio then slight increased to 2.39 in 2004-05. But it was showing
downward trend in 2005-06. The ratio was 2.23 in 2006-07 and 3.30 in
2007-08 with an average of 2.42. The output input ratio had been found
satisfactory by showing mix trend during the study period.
The productivity index was 100 in the base year of 2002-03.
During the year of 2003-04 the index has gone down and reached to
93.12 percent. The index was again went up to 104.52 percent and then
slipped down to 97.66 percent. In the last year of the study period the
index was the highest of 144.15 percent compared to the base of 2007-
08.The average index was 106.04 percent with a fluctuating and down
ward trend.

A Study of Productivity and Financial Efficiency of Textile Industry of India
246
TABLE NO.—7.13
Analysis of Overhead Productivity Ratio in Mafatlal Industries Ltd
YEAR OUTPUT INPUT O/I COEF. PROD. TREND I/O
IN
CRORES
IN
CRORES FACTOR INDEX VALUE
2002-03 430.91 188.05 2.2915 0.4232 100 91.706 0.4364
2003-04 172.91 81.03 2.1339 0.4384 93.1239 96.485 0.4686
2004-05 176.52 73.7 2.3951 0.4888 104.523 101.26 0.4175
2005-06 146.34 65.98 2.2179 0.5436 96.7916 110.82 0.4509
2006-07 156.16 69.78 2.2379 0.5057 97.662 115.6 0.4468
2007-08 401.57 121.57 3.3032 0.7202 144.152 120.38 0.3027
TOTAL 1484.41 600.11 14.58 3.1198 636.253 636.25 2.523
AVE. 247.4017 100.018 2.4299 0.52 106.042 106.04 0.4205
STANDARD DEVIATION = 19.047 A=98.89 Chi-square = 10.226
Co-Efficient of Variance 17.96 B=4.79
SOURCES: COMPILED FROM ANNUAL REPORTS AND ACCOUNTS OF MFTL
Table No.7.14
Calculation of Chi-square value of MFTL
Observe Expected (O-E) (O-E)2 (O-E)2/E
100 91.706 8.294 68.79044 0.750
93.1239 96.485 -3.3611 11.29699 0.117
104.523 101.26 3.263 10.64717 0.105
96.7916 110.82 -14.0284 196.796 1.776
97.662 115.6 -17.938 321.7718 2.783
144.152 120.38 23.772 565.108 4.694
(Chi-square value) Χ2 10.226

A Study of Productivity and Financial Efficiency of Textile Industry of India
247
In order to test the null hypothesis based on chi-square statistics
the value of chi-square has been measured which worked out to be 10.226
and is less than the table value of 11.07 hence null hypotheses is accepted
and the alternative hypothesis is rejected.
The straight-line trend showed a positive pattern of overhead
productivity of Mafatlal Industries Ltd with a positive change of 4.79 per
year. Overhead input requirement per rupees of output ranged between
0.3027 in 2007-08 to 0.4686 in 2003-04.
7.5 Comparative analysis of Overheads Productivity
The Table No.-7.15 showed the overall analysis of overheads
productivity of textile group of companies. It also showed overheads
productivity ratio, Co-efficient of co-relationship, productivity index,
trend value, input-output ratio, value of chi-square, co-efficient of
variation, and standard deviation.

A Study of Productivity and Financial Efficiency of Textile Industry of India
248
TABLE NO.-7.15
COMPARATIVE ANALYSIS OF OVERHEADS PRODUCTIVITY
OUTPUT
PROD.
CO-
IFF.
CHI-
SQUARE
INPUT-
OUTPUT
Growth
Rate
OVER
-INPUT INDEX ALL
AVE. AVE. AVE. AVE.
COMPANY VAL RNK VAL. RNK VAL. RNK VAL. RNK VAL RNK VAL. VAL. RNK
SS M L 2.49 2 98.24 3 0.3 4 2.149 4 0.4 2 0.3 15 6
DGL 2.92 4 87.67 1 -4.28 1 0.879 7 0.35 3 -4.28 16 5
O S & W
ML 3.76 5 98.81 4 -1.04 3 1.46 6 0.27 5 -1.04 23 2
SDML 2.9 3 114.04 6 4.01 5 5.371 2 0.35 3 4.005 19 4
WIL. 4.87 6 90.81 2 -1.49 2 2.118 5 0.206 6 -1.49 21 3
S K N L 9.06 7 131.41 7 10.38 7 4.831 3 0.11 7 10.38 31 1
MFTL. 2.43 1 106.04 5 4.79 6 10.226 1 0.4205 1 4.79 14 7
avg. 4.06 4 103.86 4 1.81 4 0.63 4 0.3 3.86 1.81 24.57 3.43
Overheads productivity ratio of SKNL ranked first followed by
WIL, OS & WML, DGL, SS M L and MFTL. The overheads
productivity index was the highest in S K N L followed by SDML,
MFTL and SS M L. The co-efficient was the highest in S K N L followed
by MFTL, O S & W ML, SS M L and WIL. The chi-square test was
insignificant in all selected units. The input out ratio was the best in S K
N L followed WIL, O S & W ML, DGL and MFTL.T he growth rate was
the best in S K N L. The overheads productivity was the best in MFTL
and this unit was ranked first.
References:
1. BRAHMANANDA, P.R, productivity in the Indian Economy.
(Bombay: Himalaya publishing House, 1982).
A Study of Productivity and Financial Efficiency of Textile Industry of India
249
Chapter-8
ANALYSIS OF OVERALL PRODUCTIVITY 8.1 Overall Productivity:
It has already been mentioned the productivity is a ratio of output
to input. Productivity ratio is said to be a measure of efficiency. The
various inputs are material, manpower, capital goods and expense of
manufacturing, selling and distribution etc. When all the input is added
together and the productivity ratio is calculated it is termed as overall
productivity ratio. In order to revolve the problem of calculation of the
overall productivity ratio the data needed are: output and total input.
Total input includes the elements of costs such as material, manpower
and overhead. “When a number of factors are not valued in the
production process but the output is related to any single factor unit.
Productivity thus measured is called factor or partial productivity”1
According to Shrivastava J. P. “There is a general agreement
among different writes that the over all productivity ratio measure the
total productivity efficiency of the combined resources input used by an
enterprise.’’2
The present research study outlined total input includes labour,
material, and overhead calculated with base year 1997-98 prices to
indicate the change in productivity efficiency over the base year.

A Study of Productivity and Financial Efficiency of Textile Industry of India
250
TOTAL OUTPUT OVERALL PRODUCTIVITY RATIO = ------------------------- TOTAL INPUT
Total Inputs = Total Material Input + Total Labour Input
+ Total Overhead Input
8.2 Steps in calculation for total Productivity:
HYPOTHESIS:
For the calculation in present study two hypotheses (null and
alternative) have been framed and tested. The first hypothesis is shown
whether the total productivity indices can be approximately as a straight-
line trend. While second hypothesis describe whether there is any
significant difference between the overall productivity of the textiles
industry in India under of companies.
8.3 Hypothesis based on Chi-square :
Null hypothesis: The total productivity indices can be represented by the
line of the best-fit based on least square methods.
Alternative hypothesis:-The productivity induces can’t be represented
by the straight line
Level of significant: 5 percent
Statistical tool used: chi-square

A Study of Productivity and Financial Efficiency of Textile Industry of India
251
(O-E) 2
CHI-SQUARE χ2) = E
Critical value: 11.07
When the calculated value of chi-square remains less than the table
or critical value the null hypothesis is accepted otherwise it is rejected.
The acceptance of null hypothesis would mean that the indices could be
represented by straight line. It may represent the pattern and growth of
the total productivity.
8.4 Overall Productivity in selected companies
Table 8.1 to 8.14 describes the overall productivity ratio and index
of overall productivity, average of overall indices, co-efficient of
variation, and the value of chi-square for selected units of textiles
industry in India under study.
(1) Siyaram Silk Mills Ltd:
Table No.-8.1 showed overhead ratio, co-efficiency of co-
relationship, productivity index, average indices, trend value of
indices, standard deviation, co-efficient of variation, chi-square and
input output ratio for Digjam Ltd.

A Study of Productivity and Financial Efficiency of Textile Industry of India
252
TABLE NO.-8.1
Analysis of Overall Productivity Ratio in Siyaram Silk Mills Ltd
YEAR OUTPUT INPUT O/I PROD. TREND I/O
IN
CRORES IN CRORES
INDEX VALUE
2002-03 325.59 268.80 1.21 100.00 97.89 0.83
2003-04 317.98 279.46 1.14 93.94 98.47 0.88
2004-05 339.96 285.62 1.19 98.26 99.05 0.84
2005-06 450.00 353.71 1.27 105.03 100.21 0.79
2006-07 525.16 415.51 1.26 104.34 100.80 0.79
2007-08 590.85 506.93 1.17 96.22 101.38 0.86
TOTAL 2549.54 2110.03 7.24 597.80 597.80 4.98
AVE. 424.92 351.67 1.21 99.63 99.63 0.83
STANDARD DEVIATION = 4.41388 Chi-square = 0.879
Co-Efficient of Variance 4.4301 A=98.89 B=0.58
SOURCE: COMPILED FROM ANNUAL REPORTS AND ACCOUNTS OF SSML
Table No.8.2
Calculation of Chi-square value of SSML
Observe Expected (O-E) (O-E)2 (O-E)2/E
100 97.89 2.11 4.4521 0.045
93.94 98.47 -4.53 20.5209 0.208
98.26 99.05 -0.79 0.6241 0.006
105.03 100.21 4.82 23.2324 0.232
104.34 100.8 3.54 12.5316 0.124
96.22 101.38 -5.16 26.6256 0.263
(Chi-square value) Χ2 0.879

A Study of Productivity and Financial Efficiency of Textile Industry of India
253
Table No. - 8.1 described that the overall productivity in selected
units. It reveals that the output of Siyaram Silk Mills Ltd. counted to Rs.
325.59 crores in the base years, which decreased to Rs. 317.98 crores in
2003-04. The output was Rs 339.96 crores in 2004-05 and Rs 450.00
crores in 2005-06. The output had gone up to Rs 525.16 crores in 2006-
07 and Rs 590.85 crores in 2007-08.
The input was Rs.267.80 crores in 2002-03 and then it increased to
Rs.279.46 crores in 2003-04. The input was Rs.285.62 crores in 2004-05
and then it went down to Rs.353.71 crores in 2005-06. But in 2006-07 it
went up to Rs.415.51 crores. In the last year of study period it was 506.93
with an average of Rs.424.92 crores. The index was 100.00 in base year
of 2002-03 and then it went down to 93.94 percent in 2003-04and 98.26
percent in 2004-05.The index was increased to 105.03 percent in 2005-06
and 104.34 percent in 2006-07. In the last year the index was 96.22
percent with an average of 99.63. The above Table no.7.1 showed total
assets turn over ratio of the Siyaram Silk Mills Ltd. The average ratio has
been 1.21 with fluctuating trend during the study period. The ratio was
1.21 times in 2002-03, which decreased to 1.14 times in 2003-04.The
further stepped up to 1.19 times in 2004-05 and to 1.27 times in 2005-06
then it slightly went down to 1.26 times in 2006-07. The ratio rose and
reached to 1.17 in 2007-08. The operational efficiency of the total assets
to utilize the overall resources during the study was very good.

A Study of Productivity and Financial Efficiency of Textile Industry of India
254
However the value of null hypothesis based on chi-square statistics
(0.879) was less than the table value of 11.07. The null hypothesis
assumes straight-line approximation to the productivity index with
fluctuated trend and average annual positive change of 0.58 percent. It is
apparent that the total input requirement per rupees of output Rs. 0.79 in
2004-05 to Rs.0.88 in 2003-04.
(2) Digjam Ltd..:
Table No.-8.3 showed overhead ratio, co-efficiency of co-
relationship, productivity index, average indices, trend value of indices,
standard deviation, co-efficient of variation, chi-square and input output
ratio for Digjam Ltd.
Table no.8.2 revealed that the output of Digjam Ltd was 220.01
in 2002-03 then it increased to Rs. 270.0 Crores in 2003-04 and Rs
295.34 Crores in 2004-05. The output was then marginally gone down to
Rs 30.59 Crores in 2005-06. The output again rose to Rs 109.20 Crores
in 2006-07 and Rs 112.05 Crores in the last year of study period. The
average out put was Rs 1056.61 Crores.

A Study of Productivity and Financial Efficiency of Textile Industry of India
255
TABLE NO.-8.3
Analysis Overall Productivity Ratio in Digjam Ltd.
YEAR OUTPUT INPUT O/I PROD. TREND I/O
IN
CRORES
IN
CRORES INDEX VALUE
2002-03 220.010 181.540 1.212 100.000 96.841 0.825
2003-04 270.090 253.430 1.066 87.939 94.538 0.938
2004-05 295.340 257.100 1.149 94.787 92.234 0.871
2005-06 30.590 27.820 1.100 90.730 87.628 0.909
2006-07 109.200 108.630 1.005 82.947 85.324 0.995
2007-08 112.050 111.150 1.008 83.183 83.021 0.992
TOTAL 1037.280 939.670 6.539 539.586 539.586 5.530
AVE. 172.880 156.612 1.090 89.931 89.931 0.922
STANDARD DEVIATION = 6.69161 Chi-square = 0.811
Co-Efficient of Variance 7.4408 A=98.89 B=-2.30
Source: Compiled From Annual Reports And Accounts Of DGL
Table No.8.4
Calculation of Chi-square value of DGL
Observe Expected (O-E) (O-E)2 (O-E)2/E
100 96.841 3.159 9.979281 0.103
87.939 94.538 -6.599 43.5468 0.461
94.787 92.234 2.553 6.517809 0.071
90.73 87.628 3.102 9.622404 0.110
82.947 85.324 -2.377 5.650129 0.066
83.183 83.021 0.162 0.026244 0.000
(Chi-square value) Χ2 0.811

A Study of Productivity and Financial Efficiency of Textile Industry of India
256
The input used for productivity was Rs.181.54 Crores in 2002-03.
Then the Consumption of input was increased to Rs.253.43 Crores in
2003-04 and Rs.257.10 Crores in 2004-05. In the year of 2005-06 it was
Rs.27.82 Crores. The input was Rs.10.863 Crores in 2006-07 and in the
last year it was Rs.111.15 Crores with an average of Rs.156.67 Crores.
The above table No.8.2 showed the Overall Productivity Ratio of Digjam
Ltd The ratio was showing the fluctuating trend during the study period
with an average of 1.090 times. The ratio varied from 1.212 times in
2002-03 to 1.066 times in 2003-04. In 2004-05 the ratio was 1.149 times
then after it went downed to 1.100 times in 2005-06. It further declined to
1.005 in 2006-07. It was in 1.008 times in 2007-08.Through the analysis
it can be said that in the last three years of study period the Overall
Productivity Ratio was showing satisfactory utilization of the total
resources.
It is also observed that the productivity index showed mix and
down ward trend. The average index showed 89.93 percent. The value of
chi-square calculated at 0.811, which was much less than the table value
of 11.07. Therefore the null hypothesis is accepted which is assuming
straight line approximately for the productivity indices.
The straight line in the case of Digjam Ltd showed an upward
trend of productivity efficiency with an average annual negative rate of
change - 2.30. The overall input requirement per rupees of output

A Study of Productivity and Financial Efficiency of Textile Industry of India
257
increased from Rs. 0.825 in 2002-03 to Rs. 0.995 in 2006-07. The total
input requirement per rupees of output worked out as high as 0.995 in
2006-07. Co-Efficient of Variance was 7.44 percent and standard
deviation was of 6.69.
(3) Oswal Spinning & Wvg. Mills Ltd.:-
Table No.-8.5 showed the total productivity and its analysis for
Oswal Spinning & Wvg. Mills Ltd. for the covered by this study from
2002-03 to 2007-08. The table showed that the output of this shows down
ward trend.
TABLE NO.-8.5
Analysis of Overall Productivity Ratio in Oswal Spinning & Wvg. Mills Ltd. YEAR OUTPUT INPUT O/I PROD. TREND I/O
IN CRORES IN CRORES INDEX VALUE
2002-03 55.19 49.19 1.12 100.00 96.62 0.89
2003-04 54.97 52.97 1.04 92.49 96.35 0.96
2004-05 60.78 56.32 1.08 96.19 96.08 0.93
2005-06 79.07 73.37 1.08 96.05 95.55 0.93
2006-07 67.23 64.55 1.04 92.83 95.28 0.96
2007-08 77.40 70.88 1.09 97.33 95.01 0.92
TOTAL 394.64 367.28 6.45 574.89 574.89 5.59
AVE. 65.77 61.21 1.08 95.81 95.81 0.93
STANDARD DEVIATION = 2.82641 Chi-square = 0.395
Co-Efficient of Variance 2.9499 A=98.89 B=-0.267
Source: Compiled From Annual Reports And Accounts Of OS&WML

A Study of Productivity and Financial Efficiency of Textile Industry of India
258
Table No.8.6
Calculation of Chi-square value of OS&WML
Observe Expected (O-E) (O-E)2 (O-E)2/E
100 96.62 3.38 11.4244 0.118
92.49 96.35 -3.86 14.8996 0.155
96.19 96.08 0.11 0.0121 0.000
96.05 95.55 0.5 0.25 0.003
92.83 95.28 -2.45 6.0025 0.063
97.33 95.01 2.32 5.3824 0.057
(Chi-square value) Χ2 0.395
The table no.8.3 showed the output of Oswal Spinning & Wvg.
Mills Ltd from 2002-03 and 2007-08. The output was Rs.55.19 crores in
2002-03 and it was Rs 54.94 crores in 2003-04. The output was Rs 60.78
crores in 2004-05 and Rs 79.07 crores in 2005-06. in the last years of
research period the output were of Rs 67.23 crores and Rs 77.40 crores
consecutively during the years of 2006-07 and 2007-08.The average
output was Rs 65.77 crores. The overall inputs were Rs. 49.19 Crores in
002-03 and Rs 52.94 Crores in 2003-04. The overall input was found up
of Rs. 56.32 Crores in 2004-05 and Rs 73.37 Crores in 2005-06. The
input was lower of Rs. 64.55 Crores in 2006-07 and Rs 70.88 Crores in
2007-08. The above table No.8.3 showed the Overall Productivity
Ratio of Oswal Spinning & Wvg. Mills Ltd. The ratio was showing the
constant trend during the study period with an average of 1.080 times.

A Study of Productivity and Financial Efficiency of Textile Industry of India
259
The ratio varied from 1.12 times in 2002-03 to 1.04 times in 2003-04. In
2004-05 the ratio was 1.08 times then after it remained 1.100 times in
2005-06. It further declined to 1.004 in 2006-07. It was in 1.009 times in
2007-08.Through the analysis it can be said that in the last three years of
study period the Overall Productivity ratio was showing satisfactory
utilization of the total resources. The index was 100 in base year the after
it decreased to 92.49 percent in 2003-04 and 96.19 percent in 2004-050.
The index was 96.05 percent in 2005-06 and 92.83 percent in 2006-07.
The index was 97.33 percent in the last year with an average of 95.81
percent. The standard deviation was 2.83 percent and co-efficiency
variance was 2.94 percent which showed fluctuation during the study
period.
The value of chi-square figured at 0.395 is less than the table value
11.07 hence the null hypothesis is accepted and alternative hypothesis is
rejected, which represented by straight line. The straight line showed
negative annual growth of -0.267, which shows the pattern of total
productivity of this unit.
The table showed it clear that the input requirement per rupees of
0.89 outputs was the lowest in 2002-03. It’s good sigh of this company
for that year in the case of total productivity.

A Study of Productivity and Financial Efficiency of Textile Industry of India
260
(4) Shri Dinesh Mills Ltd..:
Table No.-8.7 showed the total productivity and its analysis for
Shri Dinesh Mills Ltd for the covered by this study from 2002-03 to
2007-08. The table showed that the output of this shows down ward
trend.
TABLE NO. - 8.7
Analysis of Overall Productivity Ratio in Shri Dinesh Mills Ltd.
YEAR OUTPUT INPUT O/I PROD. TREND I/O
IN
CRORES
IN
CRORES INDEX VALUE
2002-03 53.46 46.50 1.15 100.00 98.69 0.87
2003-04 59.31 52.35 1.13 98.55 100.18 0.88
2004-05 59.76 52.36 1.14 99.27 101.66 0.88
2005-06 69.14 57.39 1.20 104.79 104.64 0.83
2006-07 75.77 56.98 1.33 115.66 106.12 0.75
2007-08 79.36 68.60 1.16 100.62 107.61 0.86
TOTAL 396.80 334.18 7.12 618.90 618.90 5.08
AVE. 66.13 55.70 1.19 103.15 103.15 0.85
STANDARD DEVIATION = 6.50883 Chi-square = 1.412
Co-Efficient of Variance 6.3101 A=98.89 B=1.487
Sources: Compiled From Annual Reports And Accounts Of SDML

A Study of Productivity and Financial Efficiency of Textile Industry of India
261
Table No.8.8
Calculation of Chi-square value of SDML
Observe Expected (O-E) (O-E)2 (O-E)2/E
100 98.69 1.31 1.7161 0.017
98.55 100.18 -1.63 2.6569 0.027
99.27 101.66 -2.39 5.7121 0.056
104.79 104.64 0.15 0.0225 0.000
115.66 106.12 9.54 91.0116 0.858
100.62 107.61 -6.99 48.8601 0.454
(Chi-square value) Χ2 1.412
The table no.8.7 showed the output of Shri Dinesh Mills Ltd from
2002-03 and 2007-08. The output was Rs.53.46 crores in 2002-03 and it
was Rs 59.31 crores in 2003-04. The output was Rs 59.76 crores in 2004-
05 and Rs 69.14 crores in 2005-06. In the last years of research period the
output were of Rs 75.77 crores and Rs 79.36 crores consecutively during
the years of 2006-07 and 2007-08.The average output was Rs 66.13
crores. The overall inputs were Rs. 46.50 Crores in 002-03 and Rs 52.35
Crores in 2003-04. The overall input was found up of Rs. 52.36 Crores in
2004-05 and Rs 57.39 Crores in 2005-06. The input was lower of Rs.
56.98 Crores in 2006-07 and Rs 68.80 Crores in 2007-08. The above
table No.8.4 showed the Overall Productivity Ratio of Shri Dinesh Mills
Ltd The ratio was showing the progressive trend during the study period
with an average of 1.19 times. The ratio varied from 1.15 times in 2002-

A Study of Productivity and Financial Efficiency of Textile Industry of India
262
03 to 1.13 times in 2003-04. In 2004-05 the ratio was 1.14 times then
after it remained 1.20 times in 2005-06. It further inclined to 1.33 in
2006-07. It was 1.16 times in 2007-08.Through the analysis it can be said
that in the last three years of study period the Overall Productivity ratio
was showing satisfactory utilization of the total resources. The index was
100 in base year the after it decreased to 98.55 percent in 2003-04 and
99.27 percent in 2004-05. The index was 104.79 percent in 2005-06 and
115.66 percent in 2006-07. The index was 100.62 percent in the last year
with an average of 103.15 percent. The standard deviation was 6.50
percent and co-efficiency variance was 6.31 percent which showed
fluctuation and progressive trend during the study period.
The calculation value of chi-square was 1.412, which is very less
than the table value of 11.07 hence the null hypothesis is accepted, and
alternative hypothesis is rejected. It means that the index does not follow
the trend value. The straight line in case of this company showed upward
pattern of productivity efficiency with an average annual positive rate of
change 1.49
The total input requirement per rupees of output range between Rs
0.75 and Rs.2006-07 during the period of study. The total input required
per rupee of output average in the company was below the combined
average by 0.85 percent. Thus it can be said that resources have been
efficiently utilized and the overall productivity was good in the company.

A Study of Productivity and Financial Efficiency of Textile Industry of India
263
(5) Welspun India Ltd.:
Table No.-8.9 showed the total productivity and its analysis for
Welspun India Ltd for the covered by this study from 2002-03 to 2007-
08. The table showed that the output of this shows upward trend.
TABLE NO.-8.9
Analysis of Overall Productivity Ratio in Welspun India Ltd.
YEAR OUTPUT INPUT O/I PROD. TREND I/O
IN CRORES IN CRORES INDEX VALUE
2002-03 302.15 212.99 1.42 100.00 99.15 0.70
2003-04 368.04 286.33 1.29 90.61 97.88 0.78
2004-05 483.18 333.60 1.45 102.10 96.60 0.69
2005-06 685.61 489.09 1.40 98.82 94.06 0.71
2006-07 1045.06 795.94 1.31 92.55 92.78 0.76
2007-08 1311.76 1051.85 1.25 87.91 91.51 0.80
TOTAL 4195.8 3169.8 8.11426 571.99 571.98592 4.45017
AVE. 699.30 528.30 1.35 95.33 95.33 0.74
STANDARD DEVIATION = 5.74168 Chi-square = 1.243
Co-Efficient of Variance 6.0229 A=98.89 B=-1.27
Source: Compiled From Annual Reports And Accounts

A Study of Productivity and Financial Efficiency of Textile Industry of India
264
Table No.8.10
Calculation of Chi-square value of WIL
Observe Expected (O-E) (O-E)2 (O-E)2/E
100 99.15 0.85 0.7225 0.007
90.61 97.88 -7.27 52.8529 0.540
102.1 96.6 5.5 30.25 0.313
98.82 94.06 4.76 22.6576 0.241
92.55 92.78 -0.23 0.0529 0.001
87.91 91.51 -3.6 12.96 0.142
(Chi-square value) Χ2 1.243
The table no.8.9 showed the output of Welspun India Ltd from
2002-03 and 2007-08. The output was Rs.302.15 crores in 2002-03 and it
was Rs 368.04 crores in 2003-04. The output was Rs 483.18 crores in
2004-05 and Rs 685.61 crores in 2005-06. In the last years of research
period the output were of Rs 1045.06 crores and Rs 1311.76 crores
consecutively during the years of 2006-07 and 2007-08.The average
output was Rs 699.30 crores. The overall inputs were Rs. 212.99 Crores
in 2002-03 and Rs 286.33 Crores in 2003-04. The overall input was found
up of Rs. 333.60 Crores in 2004-05 and Rs 489.09 Crores in 2005-06.
The input was lower of Rs. 795.94 Crores in 2006-07 and Rs 1051.85
Crores in 2007-08. The above table No.8.4 showed the Overall
Productivity Ratio of Welspun India Ltd The ratio was showing the
progressive trend during the study period with an average of 1.35 times.

A Study of Productivity and Financial Efficiency of Textile Industry of India
265
The ratio varied from 1.42 times in 2002-03 to 1.29 times in 2003-04. In
2004-05 the ratio was 1.45 times then after it remained 1.40 times in
2005-06. It further inclined to 1.31 in 2006-07. It was 1.25 times in 2007-
08.Through the analysis it can be said that in the last three years of study
period the Overall Productivity ratio was showing satisfactory utilization
of the total resources. The index was 100 in base year the after it
decreased to 90.61 percent in 2003-04 and 102.10 percent in 2004-05.
The index was 98.82 percent in 2005-06 and 92.55 percent in 2006-07.
The index was 87.91 percent in the last year with an average of 95.33
percent. The standard deviation was 5.74 percent and co-efficiency
variance was 6.02 percent which showed fluctuation and progressive
trend during the study period.
The calculation value of chi-square was 1.243, which is very less
than the table value of 11.07 hence the null hypothesis is accepted, and
alternative hypothesis is rejected. It means that the index does not follow
the trend value. The straight line in case of this company showed upward
pattern of productivity efficiency with an average annual negative rate of
change -1.27
The total input requirement per rupees of output range between Rs
0.69 and Rs.2005-06 during the period of study. The total input required
per rupee of output average in the company was below the combined

A Study of Productivity and Financial Efficiency of Textile Industry of India
266
average by 0.0.74 percent. Thus it can be said that resources have been
efficiently utilized and the overall productivity was good in the company.
(6) S Kumars Nationwide Ltd..:
Table No. - 8.11 showed the total productivity and its analysis for
S Kumars Nationwide Ltd for the covered by this study from 2002-03 to
2007-08. The table showed that the output of this shows upward trend.
TABLE NO.8.11
Analysis of Overall Productivity Ratio in S Kumars Nationwide Ltd.
YEAR OUTPUT INPUT O/I PROD. TREND I/O
IN
CRORES
IN
CRORES INDEX VALUE
2002-03 624.65 635.60 0.98 100.00 100.80 1.02
2003-04 618.55 598.54 1.03 105.15 105.89 0.97
2004-05 346.21 304.39 1.14 115.73 110.97 0.88
2005-06 890.87 754.93 1.18 120.08 121.14 0.85
2006-07 1230.38 1063.08 1.16 117.77 126.23 0.86
2007-08 1606.56 1187.99 1.35 137.60 131.31 0.74
TOTAL 5317.22 4544.53 6.84 696.33 696.33 5.32
AVE. 886.20 757.42 1.14 116.06 116.06 0.89
STANDARD DEVIATION = 13.1159 Chi-square = 1.093
Co-Efficient of Variance 11.3014 A=98.89 B=5.08
Source: Compiled From Annual Reports & Accounts

A Study of Productivity and Financial Efficiency of Textile Industry of India
267
Table No.8.12
Calculation of Chi-square value of SKNL
Observe Expected (O-E) (O-E)2 (O-E)2/E
100 100.8 -0.8 0.64 0.006
105.15 105.89 -0.74 0.5476 0.005
115.73 110.97 4.76 22.6576 0.204
120.08 121.14 -1.06 1.1236 0.009
117.77 126.23 -8.46 71.5716 0.567
137.6 131.31 6.29 39.5641 0.301
(Chi-square value) Χ2 1.093
The table No.8.11 showed that the output was Rs.624.65 Crores in
2002-03 and then it increased to Rs. 890.87 Crores in 2005-06. In the last
year of study it was Rs .1606.56 Crores with an average of Rs .886.20
Crores. The input was Rs .635.60 Crores in 2002-03 and then it rose to Rs
.754.93 Crores in 2005-06. In the last year it was Rs .1187.99 Crores with
an average of Rs .757.42 Crores. The input ranged between Rs .635.60
Crores in 2002-03 and Rs .1197.99 Crores in 2007-09. The overall
productivity ratio was 0.98 times in 2002-03 which increased to 1.03
times in 2003-04 and 1.14 times in 2004-05. The ratio was 1.18 times in
2005-06 and 1.16 times n 2006-07. During the last year of the study
period it was the higher of 1.35 times. Thus ratio ranged between 0.98
times in 2002-03 and 1.35 times in 2007-08 with an average of 1.14
times. . The rapid growth in total output in comparison with rise in input

A Study of Productivity and Financial Efficiency of Textile Industry of India
268
to 100.37 percent since the total input expanded slowly as computed to
the rise in output. The total productivity index varied from 100 in base
year to 137.60 percent in 2007-08. The average index came out at 116.06
percent with a co-efficient of variation as high as 11.30 percent.
The value of chi-square figured at 1.093 is less than the table value
11.07 hence null hypothesis is accepted and the alternative hypothesis is
rejected, which represented by straight line. The straight line showed a
high positive growth of 5.08, which shows the pattern of total
productivity of this unit.
The table No.8.11 showed it clear that the input requirement per
rupees of output was the lowest in 2007-08 figured at 0.74. It is a god
sighs of this company for that year in the case of total productivity.
(7) Mafatlal Industries Ltd..:-
Table No. - 8.13 showed the total productivity and its analysis for
S Kumars Nationwide Ltd for the covered by this study from 2002-03 to
2007-08. The table showed that the output of this shows upward trend.

A Study of Productivity and Financial Efficiency of Textile Industry of India
269
TABLE NO.-8.13
Analysis of Overall Productivity Ratio in Mafatlal Industries Ltd.
YEAR OUTPUT INPUT O/I PROD. TREND I/O
IN CRORES IN CRORES INDEX VALUE
2002-03 430.91 460.63 0.94 100.00 89.93 1.07
2003-04 172.91 203.39 0.85 90.88 95.93 1.18
2004-05 176.52 184.55 0.96 102.25 101.94 1.05
2005-06 146.34 145.09 1.01 107.82 113.94 0.99
2006-07 156.16 174.20 0.90 95.83 119.94 1.12
2007-08 401.57 284.53 1.41 150.87 125.95 0.71
TOTAL 1484.41 1452.39 6.06 647.64 647.64 6.11
AVE. 247.40 242.07 1.01 107.94 107.94 1.02
STANDARD DEVIATION = 21.8 Chi-square = 11.500
Co-Efficient of Variance 20.197 A=98.89 B=6.00
Source: Compiled From Annual Reports & Accounts of MFTL
Table No.8.14
Calculation of Chi-square value of MFTL
Observe Expected (O-E) (O-E)2 (O-E)2/E
100 89.93 10.07 101.4049 1.128
90.88 95.93 -5.05 25.5025 0.266
102.25 101.94 0.31 0.0961 0.001
107.82 113.94 -6.12 37.4544 0.329
95.83 119.94 -24.11 581.2921 4.847
150.87 125.95 24.92 621.0064 4.931
(Chi-square value) Χ2 11.500

A Study of Productivity and Financial Efficiency of Textile Industry of India
270
Table No.-8.13 described that the overall productivity in Mafatlal
Industries Ltd It reveals that the output of Mafatlal Industries Ltd
amounted to Rs.430.91 crores in 2002-03 which decreased 172.91 crores
in 2003-04. It was Rs. 176.52 crores in 2004-05 and Rs.156 crores in
2005-06. The output was Rs. 156.16 crores in 2006-07.The output was
Rs. 401.57 crores in 2007-08 with an average output of Rs. 247.40 which
was greater than the years of 2003-04, 2004-05 and 2006-07. Then from
2002-03 to 2006-07 it showed decreased trend.
Overall input whereas. Rs.460.63 crores in 2002-03 and Rs. 203.39
crores in 2003-04. The overall input decreased to Rs. 184.55 crores in
2004-05. The input was very lower of Rs.145.09 crores in 2005-06 and
then increased to 174.20 crores in 2006-07. In last years of study period it
was Rs.284.53 crores with an average input of Rs. 242.07 crores which
was more than the years of 2003-04, 2004-05 and 2006-07.The output
input ratio was 0.94 in 2002-03 and the it was 0.85 in the years of 2003-
04. The ratio rose to 0.96 and 1.01 respectively during the years of 2004-
05 and 2005-06. The ratio went down to 0.90 during the years of 2006-
07.But during the last year of study period the ratio rose to 1.41 than
previous year of 2006-07 with an average ratio of 1.01. The average ratio
was less than the ratio the years of 2007-08. It was showing the
decreasing trend. Thus the overall productivity ratio showed fluctuated
trend, which ranged 0.85 to 1.41 during the years of 2003-04 to 2007-08

A Study of Productivity and Financial Efficiency of Textile Industry of India
271
showed good overall productivity. The productivity index showed
fluctuated trend during the study period. The co-efficient of variance
shows 20.20 percent and standard deviation also indicated 21.8 percent.
So the trend was fluctuated picture during the study period.
The value of chi-square figured at 11.500 is more than the table
value 11.07 hence null hypotheses is rejected and the alternative
hypothesis is accepted, which do not represent by straight line. The
straight line showed a high positive growth of 6.00, which shows the
pattern of total productivity of this unit.
The table No.8.13 showed it clear that the input requirement per
rupees of output was the lowest in 2007-08 figured at 0.71. It is a god
sighs of this company for that year in the case of total productivity.
8.5 Comparative Analysis of Overall Productivity
COMPARATIVE ANALYSIS OF OVERALL PRODUCTIVITY:-
Table No.-8.15 showed the overall analysis of overall productivity
of textile group of companies. It also showed overall productivity ratio,
Co-efficient of co-relationship, productivity index, trend value, input-
output ratio, value of chi-square, co-efficient of variation, and standard
deviation.

A Study of Productivity and Financial Efficiency of Textile Industry of India
272
TABLE NO.-8.15
COMPARATIVE ANALYSIS OF OVERALL PRODUCTIVITY
OUTPUT
PROD.
CO-
IFF.
CHI-
SQUARE
INPUT-
OUTPUT GROWTH
OVER
-INPUT INDEX ALL
AVE. AVE. AVE. Rate AVE.
COMPANY VAL RNK VAL. RNK VAL. RNK VAL. RNK VAL RNK VAL. RNK VAL. RNK
SS M L 1.21 6 99.63 4 4.43 2 0.879 5 0.83 6 0.58 4 27 2
DGL 1.09 3 89.931 1 7.44 5 0.811 6 0.922 3 -2.3 7 25 4
O S & W
ML 1.08 2 95.81 3 2.95 1 0.395 7 0.93 2 -0.27 5 20 6
SDML 1.19 5 103.15 5 6.31 4 1.412 2 0.85 5 1.487 3 24 5
WIL. 1.35 7 95.33 2 6.02 3 1.243 3 0.74 7 -1.27 6 28 1
S K N L 1.14 4 116.06 7 11.3 6 1.093 4 0.89 4 5.08 2 27 2
MFTL. 1.01 1 107.94 6 20.2 7 11.5 1 1.02 1 6 1 17 7
avg. 1.15 4.00 101.12 4.00 8.38 4.00 2.48 4.00 0.88 4.00 1.33 20.00 3.86
Overall productivity ratio of WIL ranked first followed by SSML,
SDML, SKN L, DGL and MFTL. The Overall productivity index was the
highest in S K N L followed by MFTL, SDML and SS M L. The co-
efficient was the highest in MFTL followed by SKN L, DGL, WIL and
SSML. The chi-square test was insignificant in all selected units except in
MFTL. The input out ratio was the best in WIL followed SS M L, O S &
W ML, S K N L and DGL.T he growth rate was the best in MFTL The
overall productivity was the best in WIL and therefore unit was ranked
first.

A Study of Productivity and Financial Efficiency of Textile Industry of India
273
REFERENCES:
1. BROWN DAVID S. “Productivity of the professionals”
productivity, New Delhi, Vol.XXIV, No.3, oct-dec.1983, p.241-
249.
2. SRIVASTAVA, J.P. Labour productivity, (new Delhi: oxford and
I.H.B Publishing co.1982), p.35

A Study of Productivity and Financial Efficiency of Textile Industry of India
274
CHAPTER- 9
SUMMARY, CONCLUSION AND SUGGESTIONS:
CHAPTER–1:
9.1 Profile of the Textile Industry of India
The Indian textile industry has a great legacy, which is perhaps
unmatched in the history of India’s industrial development. India’s textile
industry evolved and developed at a very early stage and its
manufacturing technology was amongst the best. Prior to colonization,
India’s manually operated textile machines were among the best in the
world, and served as a model for production of the first textile machines
in newly industrialized Britain and Germany. Indian textiles were sought
after for their finesse, quality and design. According to Chouta-Kuan, the
Chinese observer preference was given to the Indian weaving for its and
delicacy’ Prestige trade textiles such as Patola from Patan and
Ahmadabad, coast were sought after by the Malaysian royalty and
wealthy traders of the Philippines. Textiles have historically formed an
important component of India’s exports. Marco Polo’s records show that
Indian textiles used to be exported to China and South-East Asia. Textiles
have also comprised a significant portion of the Portuguese trade with
India. These included embroidered bedspreads, wall hangings and quits
of embroidered wild silk on a cotton or jute ground. The textile Group of
Companies in India plays an important role to develop the Indian

A Study of Productivity and Financial Efficiency of Textile Industry of India
275
economy. Which are mainly engaged in manufacturing the textile, So the
brief profile of textile industry is also given in this chapter, which
includes the Introduction, Historical Background, Colonization-An end of
the Indian textile legacy, MFA Quota Removal and Indian Textile
Exports, Overview of the global textile market, Changing Shares in
World Trade, Share in World trade by region, Indian Textile Industry –
Present Scenario, Process of Globalization , Reforms Era: Re- emergence
of the Indian Textile Industry, Influences of Fashion, under current in
Indian textile Industry and Vision for the future
CHAPTER-2:
9.2 Conceptual Framework of Financial Efficiency and
Productivity Management:
Present research deals with the study of “A study of productivity
and financial efficiency textile industry of India” which is mainly
engaged in the production of different types of textile.
The study is made to analyze financial efficiency and productivity
management effectiveness of various activities in different areas of
operation of an organization. In the interest of getting good working
results, every enterprise should have a periodical analysis of its
performance of efficiency. The areas of the analysis are, financial
efficiency, and productivity. For that the conceptual framework of

A Study of Productivity and Financial Efficiency of Textile Industry of India
276
Performance, Efficiency, Financial Efficiency, Performance Efficiency,
Performance Appraisal, and productivity is given. The objective of this
study is detailed cause and effect study of the efficiency and effectiveness
in the use of resources available in the business enterprise. The
importance and usefulness of operational efficiency financial efficiency
analysis and productivity of business are different for various users of the
information such as for Financial managers, investor, and shareholders,
creditors, employees, Big Business Houses, Government, Society etc. For
Financial managers this study is devised to measure the over all
effectiveness of their own plans and policies. Investors and Shareholders
are interested in the current and long term profitability of their
investment. The employees, Shareholders, and Government are interested
in the profits of a company. The society also expects to know about the
social performance such as environmental obligations, employment,
avenues, Social welfare etc.
The techniques, which are commonly used for the study, are such
as ratio analysis, trend analysis, comparative statement analysis etc.
Statistical techniques are also used for the purpose and they generally
include the average, index, ANOAV test, Chi-square test, Standard
deviation, variance etc. Diagrams, Graphs and Charts are also prepared
and made use of.

A Study of Productivity and Financial Efficiency of Textile Industry of India
277
CHAPTER-3:
9.3 Research Methodology:
The subject of the present study is “A study of productivity and
financial efficiency textile industry of India”, which covers the period of
the last six years from 2002-2003 to 2007-08. The study covers the large
plants of textile group of companies. The study is based on secondary
data published by the textile group of companies in their annual reports
and accounts. The main objective of the study is to know the financial
efficiency, analysis of productivity of the 7 (seven) selected units of
textile group of companies. The chapter covers the Problems related to
public sector enterprise, Relevance of the study, Review of the literature,
Statement of problem, Objectives of study, Hypothesis of the study,
Universe of the study, Period of the study, Sampling design, Data
collection method, Tools and Techniques which included Various
statistical measures like mean, standard deviation, regression, index
number, have been used and least-square trend, qui-square of productivity
have been fitted, -ANOVA test have been applied to test the validity of
two hypotheses namely (1) Null hypothesis (2) Alternative hypothesis.,
Outline of Study, Finally the limitations of present study have been
shown.

A Study of Productivity and Financial Efficiency of Textile Industry of India
278
CHAPTER-4:
9.4 Analysis of Financial Efficiency:
Financial efficiency is a measure of the organizations ability to
translate to its financial resources into mission related activities. Financial
efficacy is desirable in all organization of individual mission. It measures
the intensity with which a business uses it assets to generate gross
revenue and the effectiveness of producing, purchasing, pricing,
financing, and marketing decisions. At the micro level financial
efficiency refers to the efficiency with which resources are correctly
allocated among competing uses at a point of time. Financial efficiency is
a measure of how well an organization has managed certain trade of (risk
and return, liquidity and profitability) in the use of its financial efficiency.
The present study has been made in order to analysis the efficiency
through the profitability ratio of the textile group of companies in India
and also of the individual textile Group of companies. The profitability
ratios which have been discussed in this chapter are: (1) Gross profit
ratio: (2) Operating profit ratio: (3) Net profit ratio: (4) Return on gross
capital employed (5) Return on net capital employed (6) Return on net
worth (7) A study of earning per equity share of the company under study
has been also made.
A Study of Productivity and Financial Efficiency of Textile Industry of India
279
1. The gross profit in terms relative terms as percent of net sales. As
regard the textile group, the gross profit ratio ranged from --5.5 percent
in 2004-05 to 13.47 percent in 2007-08. After first year of study period
the ratio showed an increasing trend from 2005-06 to 2007-08 with an
average of 4.5 percent. In this ratio, the management was very much
interested. As regards this ratio the WIL, SDML, SSML and OS&WML
textiles group showed good profitability. It suggests that the DGL and
SKNL should reduce the cost of goods sold.
2. The calculated value of ANOVA test is less than the critical value. So it
is concluded that there has not been significant difference between gross
profit ratios of the selected units.
3. The operating profit ratio of textile Companies of India showed
fluctuated trend during the study period. The average ratio is 10.67
percent, which was satisfactory. The ratio varied from 1.14 percent in
2004-05 to 17.99 percent in 2005-06. The ratio was not good except in
2004-. The trend in textile Companies of India fluctuated during the
study period.
4. The operating profit ratio was the highest in WIL. Among all the
companies, the lowest ratio is seen in the SKNL. A higher operating
profit ratio is favorable for the company. Further it can be said that WIL
has achieved good remarks in the case of operating profit ratio.

A Study of Productivity and Financial Efficiency of Textile Industry of India
280
5. ANOVA test for operating profit ratio showed that the difference is
insignificant between the groups and within the group.
6. The net profit ratio in textile industry was not satisfactory. The average
ratio of SDML was highest among all the textile companies. The
average ratio of WIL (5.78 percent) followed by SSML (2.66).The
average ratio of DGL, O S & W ML, and MFTL showed negative profit
margin. The average ratio of SS M L and WIL indicated a very low
profitability.
7. ANOVA (F) test indicates that there is insignificant difference in net
profit ratio of textile units under study.
8. The earning per share registered a fluctuated trend during the period
under study. The highest earning per share was in SS M L and SDML.
The combined average earning per share of DGL, MFTL, and O S & W,
and S K N L indicated a worst profitability position of unit.
9. ANOVA Test indicates the calculated value was lower than the table
value. Hence null hypothesis is accepted and alternative hypothesis is
rejected. Hence the difference in EPS of textile companies was
insignificant.
10. The study shows that return on the capital employed in the textile
companies India has marked fluctuating trend during the whole year of
the study period. The average was 22.02 percent. In the group this ratio
was satisfactory.

A Study of Productivity and Financial Efficiency of Textile Industry of India
281
11. The analysis of the return on gross capital employed in individual textile
Companies of the study period reveals that it was the highest return on
gross capital employed in MFTL followed by O S & W ML, SDML, SS
M L and S K N L. In DGL, return on Gross Capital Employed Ratio of
the company was not satisfactory during the study period.
12. As compared to the textile companies the performance of MFTL was
better while the performance of S & W ML, SDML, SSM L and SKN L
was lower. ANOVA test for return on gross capital employed ratio
showed the difference is insignificant.
13. Return on Net Capital Employed is the best test of overall profitability
and efficiency of the business firm. A company with high rate of return
on capital employed would be in a position to capitalize; e.g. it can take
advantage of all favorable market opportunities.
14. The study shows that returns on capital employed in the textile
companies in India had marked a fluctuated trend. The average was 5.28
percent in textile companies in India. This ratio was not satisfactory.
On the whole MFTL. had the highest return net on capital employed of
23.40 percent on an average in a span of six years followed by SDML,
SS M L, O S & W ML, SDML and S K N L followed by other selected
units. As compared to the textile companies in India, the performance of
SS M L, O S & W ML and SDML were better. While the performance
of DGL, S K N L, and WIL.was lower. In the light of the above

A Study of Productivity and Financial Efficiency of Textile Industry of India
282
discussion, it is suggested that DGL, S K N L, and WIL should
undertake cost control measure so that increase net profit before interest
and taxes of the company might enhance the return on net capital
employed
15. Since F calculated value is lower than F critical (at 5% significance
level), the null hypothesis is accepted and alternative hypothesis is
rejected and hence it is concluded that the Return on Net Capital
Employed ratio does not differ significantly.
16. Return on net worth indicates how well the company has used the
resources of the owners. On making an analysis of the performance of
the textile Group, the return had been on average 1.87. It showed highly
fluctuated trend during the whole years of study period. The return on
net worth in the covered period ranged between -130.4 in 2003-04 and
139.4 in 2007-08 the textile group of companies under study. MFTL,
SKNL and DGL had to make a struggle for achieving the standard.
Other companies under study had however, come up to the standard. On
the whole OS & WML had the highest return on net worth of 155.0
percent on an average in span of seven years followed by SS M L,
SDML and WIL.
17. The calculated value of H is less than the critical value. Therefore, the
null hypothesis based on ANOVA test at 5 percent level of significant is
accepted. The acceptance of null hypothesis would mean that there is

A Study of Productivity and Financial Efficiency of Textile Industry of India
283
not significant difference between the return on net- worth of textile
group of companies.
Chapter-5
9.5 Analysis of Material Productivity
Productivity:
Productivity may be defined as the ratio of output to input. Higher
the productivity also stands for proper utilization of available resources to
achieve the best result with the minimum cost of expenditure.
Measurement of productivity is pre-requisite of improvement of
productivity in the present study.
MATERIAL PRODUCTIVITY:
Productivity accounting in the case of material involves the
following:
1. Material output (net sale)
2. Material input
Computation of material productivity ratio, material productivity
indices, co- efficient factor, and material input required per rupees of
output. Productivity ratio reveals output per rupees of any specific or
total whatever the case may be as such the ratio indicates the present
productivity of textile Group of Companies. However it does not tell us

A Study of Productivity and Financial Efficiency of Textile Industry of India
284
about the efficiency achieved during the period, which is the main point
of concern in this study. So the productivity indices are worked out as
percent of base year productivity ratio. The percentage index comes to
more than 100; it means the efficient utilization of resources as compared
to the base year or vice-versa. It may, however be noted that the changes
in productivity data have been worked out with reference to the base year
of 2002-03
1. The average of material productivity in textile group was 4.03.
Material productivity average index was 103.21 in the group. The
combined average of material input required per rupee of out-put was
0.80.The material productivity index ranged between 88.57 percent
and 123.4 percent.
2. In SSML average material productivity was 4.43. The material
productivity average in SSML was above the combined group and
productivity index average was higher than the group average. The
company’s average of material input required per rupee of output was
below the combined average of group. So the company was able to
use its material efficiently.
3. The average of material productivity in DGL was 4.22. The average of
material productivity in DGL was more than average of group. The
average material productivity index was below than the group average.
The company’s average of material input required per rupee of output

A Study of Productivity and Financial Efficiency of Textile Industry of India
285
was below the combined average by 12.5 %.So the company was
efficient in utilizing its material.
4. In OS&WML the material productivity was 2.83 which low compared
to average of group. The average index was 95.04 percent which was
also less than the combined average of the group. The coefficient was
4.89 and the combined average of material input required per rupee of
output was above than the average of group. So the company was not
efficient in utilizing its material.
5. The material productivity ratio on an average was 5.86 in SDML and
the average ratio was less than group’s average by 31.23 percent. The
average of material productivity index in the SDML was also below
by the textile group by 7.03 percent. The combined average of
material input required per rupee of output was below 37.5 percent of
the combined group average. So efforts should be made by the
management to improve material productivity.
6. In WIL, the average material productivity ratio was 3.69 which were
below the combined average of textile group. The average index was
101.92 percent which lower than the combined average of textile
group. The χ2 was 0.191which showed the difference was
insignificant. The input required per rupee was 0.80 which was equal
to the combined average of textile group. The growth rate was
negative of -0.13 percent and total rank for productivity is 5th in group.

A Study of Productivity and Financial Efficiency of Textile Industry of India
286
7. The average material productivity ratio was 2.32 in SKNL which
varies from the combined average of textile group. The average
productivity index was 114.04 which were lower than the combined
average of textile group. The χ2 was 0.97 which showed that the
difference is insignificant. The per unit consumption of raw material
was1.28 which was lower than the combined average of textile group.
The growth rate was very positive in the company. The company has
not utilized its material properly.
8. The material productivity ratio on an average was 4.84 in MFTL and
the average ratio was less than group’s average by 16.74 percent. The
average of material productivity index in the MFTL was above 20.19
by the textile group. The combined average of material input required
per rupee of output was below 20 percent of the combined group
average. So the company was efficient in utilizing its material.
9. The Material productivity ratio of textile group of companies was on
an average 1.01. The productivity ratio was found highest in WIL.
(1.35) followed by SS M L, SDML, SKNL, DGL, OS & WML and
MFTL all these companies were efficient in utilizing its material.
10. As pointed out earlier the indices are the true indicators of the progress
made during the period. For material productivity, the highest average
index (116.06) was recorded for MFTL. This means the MFTL
substantially improved its material productivity during the period over

A Study of Productivity and Financial Efficiency of Textile Industry of India
287
the index of base year 100. On the other hand, SDML, and S K N L
showed the index more than the 100.SSML (99.63), DGL (89.93), OS
& WML (95.81), WIL (95.33), performed below the combined
average (107.94). It is suggested that the all three companies should
take necessary steps to improve their material productivity by
aggressive and economical material management.
Chapter-6
9.6 Analysis of Labour Productivity :
Labour productivity is considered to be the most important factor
in productivity accounting. Labour productivity is calculated by convert
input and output to the monetary terms. The ratio between the output and
input expressed in terms of money output per rupee of input is the
measure of labour productivity. Output per rupee of input shows the
efficiency in utilizing the manpower resources input in the
production.labour productivity and capacity utilization could be general
indices, which are easily understandable and could be the basis for
measurement by mass of the employee. Apparently there is some
substance in the contention that labour productivity may be regarded as
one of the basic indicators of economic development. It is rightly
considered to be one of the major determinants of national income.
1. The average of labour productivity in textile group was 21.21. labour
productivity average index was 92.80 in the group. The combined

A Study of Productivity and Financial Efficiency of Textile Industry of India
288
average of labour input required per rupee of output was 0.12.The
labour productivity index ranged between 72.8 percent to 113.84
percent.
2. Average of labour productivity in SS M L was 26.25. The company’s
average index was 82.73. It was below the combined group average by
10.07 percent. The output increase during the study period but input
decreased. It shows efficiency in utilizing the manpower resources in
the years 2002-03 to 2007-08. The labour input required per rupees of
output in later years showed efficiency and improvement in labour
productivity in SS M L
3. In DGL the average of labour productivity was 6.0. The company’s
average index was 99.8. It was above the combined group average by
7.01.The output decreased by 49.07 percent but the labour input
decreased by 46.67 percent during the study period. It showed the
inefficiency in utilizing the man power resources in the year 2002-03
to 2007-08. The company’s average labour input required per rupee
of output was below the combined group average by 0.29 percent. So
the company was not that much efficient in utilizing the manpower.
4. In O S & W ML the average of labour productivity was 17.41. The
company’s average index was 93.04. It was above the combined group
average by 0.24 percent. The output increased by 28.70 percent but the
labour input decreased by 12.19 percent during the study period. It

A Study of Productivity and Financial Efficiency of Textile Industry of India
289
showed the efficiency in utilizing the man power resources in the year
2002-03 to 2007-08. The company’s average labour input required
per rupee of output was below the combined group average by 50
percent. So the company was efficient in utilizing the manpower.
5. Average of labour productivity in SDML was 29.6. The company’s
average index was 96.43. It was above the combined group average by
3.63 percent. The output increase by 32.64 percent during the study
period but input decreased by 36.63 percent. It shows efficiency in
utilizing the manpower resources in the years 2002-03 to 2007-08.
The labour input required per rupees of output in later years showed
efficiency and improvement in labour productivity in SDML.
6. The labour productivity on an average has been of 27.4 in WIL
Company. The average index of the WIL was 72.8 percent which was
very lower than the average of group. The χ2 was 0.32 which the
difference is insignificant. The growth rate was minus -6.99 and the
output was showing increasing trend and input was also showing the
same trend during the study period. The input per rupee was 0.113
which showed efficiency in utilization of man power.
7. Average labour productivity was 37.11 in SKNL and average index
was 113.84 percent in SKNL. The co-efficient was 13.39 percent and
χ2 was less than the table value hence the null hypothesis is accepted
and alternative hypothesis is rejected. The growth rate was positive

A Study of Productivity and Financial Efficiency of Textile Industry of India
290
4.62 percent and the labour input required per rupees of output in later
years showed efficiency and improvement in labour productivity in SS
M L
8. The MFTL showed average labour productivity 4.66.The average
labour productivity was very lower than the combined average of
textile group. The χ2 resulted in insignificant difference. The co-
efficient was 18.82 percent and growth rate was 0.32 which was very
lower than the average growth rate of textile group.
9. On the basis of labour productivity analysis. It is found that the
average of labour productivity ratio was the highest among the
selected units in S K N L (37.11) followed by SDML (29.6) WIL.
(27.4), SS M L (26.25), O S & W ML (17.41), DGL. (6.06), and
MFTL. (4.66), while other units such as MFTL and DGL have very
low labour productivity ratio. So these companies have not been
utilizing its manpower efficiency.
10. The co-efficient of variation was seen very lowest in SDML (2.2
percent), whereas input out ratio was the lowest in SS M L, WIL.
DGL, WIL and SKNL. The chi-square test support the assumption of
the labour productivity indices follows trend value in SS M L, DGL, O
S & W ML, and WIL.

A Study of Productivity and Financial Efficiency of Textile Industry of India
291
Chapter-7
9.7 Analysis of Overheads Productivity :
Accounting for overhead costs should be done in such a manner
that would help management in controlling cost and decision-making.
Thus efficiency in overhead is one of the basic objectives of accounting
for overheads. It should be noted that net sales divided by total overhead
input gives overhead productivity ratio indices, input-output ratio etc. For
the textile Group of Companies in India for the seven periods covered
under this study.
1. The average of overheads productivity in SS M L was 2.49. The
average of overheads productivity index during the period under study
was 98.24 above the combined average of the group by 7.8. The
company’s average of overheads input required per rupee of output
was below the average of the group by 2.05 percent.
2. In DGL, the average of overheads productivity was 2.92. The average
of the index during the period under study was 87.67 percent. It was
below the combined Group’s average by 18.37 percent. The total
output increased by 49.07 percent during the period under study but
the overheads input decreased by 34.22 percent. Thereafter, the
overheads productivity ratio decreased during the study period due to
inefficiency in utilizing overheads in production, the overheads input

A Study of Productivity and Financial Efficiency of Textile Industry of India
292
required per rupee of output increased in six years of the study period
to due to decrease in productivity and efficiency.
3. The average of overheads productivity in O S & W ML 3.76. The
average of overheads productivity index during the period under study
was 98.81. It was lower than the combined average of group by 7.23
percent. The output increased by 28.79 percent during the period
under study but the overheads input 26.83 percent and therefore the
overheads productivity increased by 1.31 percent. It shows efficiently
in utilizing the overheads. The highest productivity ratio was achieved
in 3.9. The overheads input requirement per rupee of output decreased
in the year 2004-05 and 2003-04 showing efficiency and improvement
in overheads productivity in O S & W ML.
4. In SDML, the average of overheads productivity was 2.9. The
average of the index during the period under study was 114.04
percent. It was below the combined Group’s average by 8 percent. The
total output increased by 32.64 percent during the period under study
but the overheads input decreased by 27.20 percent. Thereafter, the
overheads productivity ratio decreased during the study period due to
inefficiency in utilizing overheads in production, the overheads input
required per rupee of output increased in six years of the study period
due to decrease in productivity and inefficiency.

A Study of Productivity and Financial Efficiency of Textile Industry of India
293
5. The average of overheads productivity in WIL was 4.87. The average
of overheads productivity index during the period under study was
90.81 above the combined average of the group by 13.03. The
company’s average of overheads input required per rupee of output
was below the average of the group by 80 percent.
6. The average of overheads productivity in S K N L was 9.06. The
average of overheads productivity index during the period under study
was 131.4 above the combined average of the group by 27.55. The
company’s average of overheads input required per rupee of output
was below the average of the group by 63.33 percent.
7. The average of overheads productivity in MFTL was 2.43. The
average of overheads productivity index during the period under study
was 106.04 above the combined average of the group by 2.18. The
company’s average of overheads input required per rupee of output
was below the average of the group by 28.66 percent.
Chapter-8
9.8 Analysis of Overall Productivity:
Overall productivity ratio measures the total productivity of the
combined resources input used by an enterprise. In order to resolve the
problems of calculation of the overall productivity ratio the data needed
are: output (net sales) and total input Total input includes the elements of
costs such as material, manpower and overhead. Total input calculated

A Study of Productivity and Financial Efficiency of Textile Industry of India
294
with the base year 2002-03 prices to indicate the change in productivity
efficiency over the base year.
1. The average of overall productivity in SSML was 1.21.The overall
productivity index in SSML indicated fluctuated trend during the
period under study. The overall average ratio of SSML was above the
combined average by 4.96 percent and the average overall
productivity index was below the combined average by 1.49 percent.
The total input required per rupee of output had shown a fluctuated
trend throughout the period under study. As the overall productivity
was improving, so the material, labour and overheads had been
utilized efficiently by the company during the period under study.
2. The average of overall productivity in DGL was 1.09.The average
overall productivity ratio in DGL was below the combined average of
the textile group by 5.21 percent. The overall productivity index
average of the company was below the combined average of the
textile group by 11.19 percent.
3. The average of overall productivity in OS &WML was 1.08.The
overall productivity index in O S & W ML indicated rising trend
during the period under study. The overall average ratio of OS
&WML was above the combined average by 8.08 percent and the
average overall productivity index was below the combined average
by 5.20 percent. The total input required per rupee of output had

A Study of Productivity and Financial Efficiency of Textile Industry of India
295
shown a fluctuated and decreasing trend throughout the period under
study. As the overall productivity had improved in the last year of the
study period. so the material, labour and overheads had been utilized
efficiently by the company during the last year the study period under
study.
4. In the SDML the average overall productivity ratio was 1.19 which
was higher than the group average. The average index was 103.15
percent which also higher than the average of group. The χ2 value is
lower than the table hence the null hypothesis is accepted and
concluded that the trend followed the total productivity indices can be
represented by the line of the best-fit based on least square methods.
The growth rate was 1.48 and co-efficient was 6.31 percent.
5. In WIL the overall average productivity ratio was 1.35 and average
overall productivity index was 95.33 which were lower than the
average of group. The input output ratio was 0.74 which was also
lower than the average of group. The co-efficient was 6.02 percent and
growth rate was minus.
6. The overall average productivity ratio was 1.14 in SKNL and overall
average index was 116.06 percent. The co-efficient was 11.3 percent
and Chi-square was lower than the table value which showed that the
difference was insignificant. The growth rate was 0.89 which was very
lower than the average of group.

A Study of Productivity and Financial Efficiency of Textile Industry of India
296
7. In MFTL the overall average productivity ratio was 1.01 and average
index was 107.94 which were very lower than the average of textile
group. The co-efficient was 20.2 percent and input out ratio was 1.02
which higher than the average of group. The growth rate was positive
during the study period.
8. The average of overall productivity in the textile group of companies
was 1.15 and overall productivity index was 101.12 percent. The WIL
was the best in utilizing the overall productivity resources followed by
SS M L, SDML, S K N L, DGL, O S & W ML and MFTL.
9. The overall productivity was the highest in WIL (1.35) and it was
found very lowest in MFTL. (1.01), Thus textile Group of Companies
SS M L and SDML was efficient and effective to utilize the overall
components of men machine and material. In this connection it may be
suggested that in order to increase productive efficiency, the cost
reduction programme currently in operation should be intensified. It
should be ensured that the level of efficiency once achieved does not
go out of hand. There should be continuous measurement of efficiency
for each and every aspect. The productivity data should be supplied in
periodic reports with standard, actual and variance together with
causes responsible for such variance.

A Study of Productivity and Financial Efficiency of Textile Industry of India
297
9.9 Suggestions: (company specific)
As a researcher on the basis of analysis, the researcher has found
the following suggestions for the betterment of the selected textile group
of companies.
1. Gross profit margin was the highest in WIL throughout the study
period in comparison to other companies under study. It was the
highest(18.22%) in WIL during 2006-07.The ratio was negative in
SKNL,DGL and MFTL during the first two years of the study
period in input costs which were largely administered prices. The
gross profit margin increased continuously in all the companies
under study except DGL, OS&WML, SKNL and MFTL during the
last two years of study period. Thus, on the basis of gross profit
margin profitability of almost all the companies has gone up over
the year during the period under review especially during the last
two years.
2. The company like DCL, SKNL and MFTL did not have good gross
profit margin. Therefore these companies should lower down their
labour cost, and other manufacturing cost. The companies should
use raw material properly to increase material productivity.
3. SKNL, MFTL and DGL should try to operate over and above their
rated capacity so as to reduce the percentage of factory overheads
and administrative over heads.

A Study of Productivity and Financial Efficiency of Textile Industry of India
298
4. The proportion of administrative overheads in SKNL and DGL
should be reduced by decreasing its travel and conveyance
expenses as it had increased considerably during the study period.
5. The textile companies like DGL, OS & WML, SKML and MFTL
should reduce power and fuel consumption by using low ash
content coal, lignite and agro waste product especially ground nut
husk and beggass should be used as coal substitute.
6. The operation break downs due to mechanical problems and labour
problems should be avoided.
7. The net profit of DGL, SKNL and MFTL were very poor and
showed downward trend due to rising price of raw material, labour
cost and power and fuel cost.
8. Earning per share indicated highly fluctuated trend the EPS was
negative in DGL, SKNL and MFTL. These companies should use
debt in affordable proportion to have the benefit of trade on equity.
9. The return on gross capital employed is very low because of the
low operating profit. Therefore DGL is advised to accelerate the
sales and lower the cost of production.
10. The return on net capital employed was negative in DGL, and
SKNL. The policy of borrowed financing in textile companies
under study was not proper, particularly in DGL, SKNL and WIL.
So, these companies should widely use the borrowed funds and

A Study of Productivity and Financial Efficiency of Textile Industry of India
299
should try to reduce the fixed charges burden gradually by
decreasing borrowed funds and by enhancing the owner’s fund. For
this purpose these companies should enlarge their equity capital by
issuing new equity shares, whereby a low capital –gearing ratio
could be maintained.
11. The return on net worth was negative in DGL and SKNL. The
return on net worth was nil in MFTL. The ratio was negative in
DGL and SKNL due to net loss and negative net worth. This shows
defective leverage policy, ineffective and inefficient production
and sales. Moreover, these companies largely depend on borrowed
funds. These companies could not earn on borrowed funds sum
even to repay the interest thereon.
12. The material productivity ratio is the lowest and below group
average of OS & WML, WIL and SKNL. Therefore, these
companies are advised to increase the efficiency level of material
consumption. These companies should use latest technology to
increase material productivity and to decrease the production cost.
These companies should purchase bulk raw material in season.
13. The labour productivity was very low in DGL and MFTL. So these
companies should increase labour productivity by adopting modern
manufacturing process—dry process and a productivity based wage
policy should be implemented by the textile companies. Moreover,

A Study of Productivity and Financial Efficiency of Textile Industry of India
300
the use of computer should be increased in such a way that it does
not prevent employment opportunities. The concept of “Work
organization should be adopted by the selected textile companies.
14. The overheads productivity ratio was very lower in SSML, DGL,
SDML, and MFTL. So these companies should increase output in
proportion to increase in overheads expenses. The overheads
expenses should be reduced by these companies.
15. The overall productivity ratio is very low in MFTL, DGL and
SKNL. These companies should try to increase the overall
productivity. Moreover to increase overall productivity, company
should increase financial efficiency and operational efficiency.
Suggestions: (Overall)
As a researcher on the basis of analysis, the researcher has found
the following suggestions for the betterment of the selected textile group
of companies:
1. The company should try to increase the production so as to get
economies of large-scale production. It will assist in raising the rate
of return on capital employed.
2. In order to increase the financial efficiency of the companies, it is
suggested to control the cost of goods sold and operating expenses.

A Study of Productivity and Financial Efficiency of Textile Industry of India
301
3. The management should try to adopt cost reduction techniques in
their companies to get over this critical situation.
4. The quantum of sales generated should be improved impressively in
order to enjoy better operational efficiency of the assets and capital
employed.
5. The selected textile Group of Companies is the capital intensive in
nature but the policy of purchase of fixed assets should be carefully
planned and reviewed so that the funds may be properly utilized.
6. To reduce power and fuel cost, Company should find out other
alternatives for this.
7. The selected textile companies should try to match the amount of
working with the sales trends. Where there is a deficit of working
capital, they should try to build on adequate amount of working
capital. Where, there is an excessive working capital, it should be
invested either in trade securities or should be used to repay
borrowings.
8. The management should try to utilize their production capacity fully
in order to reduce factory overheads and to utilize their fixed assets
properly.
9. The burden of interest has produced a deteriorating effect and
reduced the percentage of net profit. It is suggested that the

A Study of Productivity and Financial Efficiency of Textile Industry of India
302
companies should try to reduce the interest burden gradually by
increasing the owner’s fund.
10. The few companies, which did not follow a definite policy of
financing fixed assets, should follow such policy.
11. To strengthen the financial efficiency, long-term funds have to be
used to finance core current assets and a part of temporary current
assets. It is better if the companies can reduce the over sized short-
term loans and advances and eliminate the risk by arranging finance
regularly.
12. The policy of borrowed financing in selected textile group of
companies under study was not proper. So the companies should use
widely the borrowed funds and should try to reduce the fixed charges
burden gradually by decreasing borrowed funds and by enhancing
the owner’s fund. For this purpose, companies should enlarge their
equity share capital by issuing new equity shares.
13. For regular supply of raw materials and the final product
infrastructure facilities require further improvement.
14. Cost accounting and cost audit should be made mandatory for these
units and cost sheet along with annual financing statement should be
prepared.

A Study of Productivity and Financial Efficiency of Textile Industry of India
303
15. The public sector enterprises set up in backward areas were not
guided by commercial considerations. They were set up to fulfill the
aim of balanced regional development.
16. There has been too much of government interference in policy and
day-to-day working and decisions. This leads to delays in decision-
making. This should be abolished.
17. There is no incentive to the employees to perform better. Also there
is no accountability because no one is held responsible for a failure
in achieving targets. For this kind of problem, responsibility centre
should be created.
18. Improper planning and delays in implementation of projects lead to
rise in their cost. So proper planning should be made.
19. Public sector enterprises have long enjoyed a monopolistic position.
Private sector was not allowed entry. This, in the absence of any
competition, means that any performance was good performance.
Due to absence of competitor there was no incentive to cut down
costs or improve the quality of the product.
20. There is overstaffing in public enterprises. The number of persons
employed is more than what is required to run the public enterprises
efficiently. This increases the cost and reduces profitability of these
enterprises.

A Study of Productivity and Financial Efficiency of Textile Industry of India
304
21. The labour productivity should be increased by adopting modern
manufacturing process and productivity based wages policy should
be implemented by textile companies.
22. The textile companies should reduce power and fuel consumption by
using low as content coal (imported coal), lignite and agro waste
product especially ground nut husk and beggass should be used as
coal substitute.
23. To regularize and optimize the use of cash balance, proper
techniques may be adopted for planning and control of cash. The
investments in inventories should be reduced and need to introduce a
system of prompt collection of debts.
24. Selected textile companies should try to use properly their operating
assets and should try to minimize their non-operating expenses.
25. The government should minimize the subsidy and encourage the
capital market for the textile companies.

A Study of Productivity and Financial Efficiency of Textile Industry of India
305
SELECTED BIBLIOGRAPHY
1. ANTHONY RABERT R.P.: Management Accounting Text and Cases,
Richard D.Irwininc, Illinois, 1964
2. ROBERTN. ANTHONY: Management Accounting, House Wood Illinois: Richard & GlENN.AWEISCH D.Irwin, 1977
3. AGRAWAL M.D.: Efficiency of Public Enterprise India (Jaipur: Prateekha
Publication.1987), P.206
4. BACKERC.JOHN:Introduction to Corporate Finance, McGraw Hill Book co. New MALATT D.V. York, 1936.
5. BRADLEYJ.F: Administrative Financial management, Branves and Noble,
New York, 1967.
6. BATTY J.: Management Accountancy, Orient Longmans, New Delhi, 1966
7. BOOT JOHN C.G. & COX EDWIN B.: Statistical Analysis for Managerial
Decisions, 2thedition,TataMcgrew Hill Publishing Co. New Delhi, 197
8. BRADLEY J.V: Distribution Free Statistical Tests, Prentice Hall Inc. New Jersey, 1968
9. BRADLEY J.V: Distribution free Statistical Tests, Prentice Hall Inc. New
Jersey, 1968
10. BATTY J.: Management Accountancy, Macdonald and Evans ltd., London, 1975
11. BATTY J.: Management Accountancy, Macdonald and Evans ltd., London,
1975
12. CHARLES W.GRESTERNBERG: “Financial Organization and management of Business” 4th Edition. Asian publication House, New Delhi, 1960
13. CHYAL B.R.: Financial management of state enterprise well publisherJaipur, 1986.
14. CHOWDHARY S.B.: Analysis of Company Financial Statement. Asia
publication House, 1964.
15. FOULK A. ROY: Practical Financial Statement analysis, Tata McGraw Hill ed.vi 1972.

A Study of Productivity and Financial Efficiency of Textile Industry of India
306
16. GUTHMANN H.G.: Analysis of Financial statement, Prentice Hall Inc. New
Delhi, 1935.
17. GULERIANR.C. Statistics for Decision-making, W.B.Saunders Company,
Philadelphian, 1977.
18. HUSBANDS AND DOCKERY. Modern corporation Finance, Richard D.
Irwin Inc. Illinois, 1957.
19. HELFERT A. ERICH:” Techniques of financial analysis” 6th,Universal Bolo
Stall, New Delhi, 1989.
20. JAMES C. VAN HORNE. : Financial Management and policy, prentice hall
of India (p) Ltd. New Delhi, 1997.
21. KHAN AND JAIN: Management Accounting, tata McGraw Hills, New Delhi,
1987.
22. KENNEDY R.D. & MCMULLER: Financial statements-Forms Analysis and
interpretation Richard D.Irwin inc.illinois, 1985.
23. KULSHRESTHRA R.S.: Profitability in India’s steel industry during the
decade 1960-70, a thesis submitted for the degree of Ph.D Deptt. Of E.A.F.M,
university of Rajasthan. Jaipur, 1973.
24. KOTHARI C.R.: Research Methodology –methods and techniques, Wishwa
prakashan, in New Delhi, 1997.
25. KHANDEL N. M.: Working capital management in small scale industries,”
Ashish Publishing House, Punjabi Baug, New Delhi, 1985
26. LAWRENCE J.GITAMAN: principle of managerial finance” Harper and Row
Publishers, New York, 1976
27. MOHANTY R.P.:IN his article” Managing technology for strategic
advantages” The economic times, (Thursday 9 the Jan. 1992)
28. MICHAELV.P: Research Methodology in management. Himalayan
Publication House, Bombay, 1958.
29. MURTHY V.S.: Management finance, vakils Feller and Simons ltd., Bombay,
1978 & BLOCK AND HIRT: Foundations of Financial management, Richard
D. Irwin inc, Homewood, illinois, 1978
30. MAHESHWARI S.N.: Management accounting and financial controls, Sultan
chand & sons, Delhi, 1994.
31. MAYOR J.N.: Financial statement analysis, Prentice Hall of India (p)
Ltd.New Delhi, 1972.

A Study of Productivity and Financial Efficiency of Textile Industry of India
307
32. NORMANE. &HANSON, EARN: Accounting and introduction, Harcourt B
Jovanovich inc., New Delhi, 1973.
33. PRASAD N.K.: Cost accounting, Calcutta: Book syndicate private ltd, 1979,
34. PARK COLIN &JOHN E.GLADSON: Working capital, Macmillan
Company, New York, 1963.
35. PANDAY I.M.: Financial management, Vikas publishing House pvt. New
Delhi.1994
36. PHILIP E.FRESS & CARLS WAREN: Financial accounting, Southwestern
Publishing Cincinnati, 1982
37. PORWAl L.S. & KUMAR VINOD. : Financial statement analysis and
Prediction of future of Return, A case study of engineering industry, Chartered
accountant, 11th may 1980.
38. PRASAD N.K: Cost accounting, Book syndicate pvt. Ltd.Calcutta, 1981.
39. PANDEY I.M.: Financial management, vikas publishing House, New Delhi,
1991.
40. RAJESHWAR K. RAO: Working capital planning and control in public
enterprises in India. Ajanta Publication (India), Jawaharlal Nagar, Delhi-
110007, 1985
41. SRIVASTAVE J.P: Labour productivity, (new Delhi: oxford and I.H.B
Publishing co.1982).
42. STEWNSON W.J.: Business statistics, Harper and Row, New York, 1978.
43. SINGH K.P & SINHA A.K.: Management of working capital In India, janki
Prakashan, SINGH S.C.ashok Rajpath, Patana, 1986.
44. SINAGAL AND BANSAL: Statistical methods for research workers, central
publishers, Ludhiana, 1986.
45. SINHA D.K.: Economics of industrialization in India–productivity
industrialization and economic development” Deep and Deep Publications,
New Delhi, 1988,
46. VIJAYASARADHI S.P& RAJESHWAR K. RAO. : Working capital
investment and financing in public enterprises, the management accountant,
Calcutta, May 1998.
47. WESTON AND BRIGHAN: Management finance, Holt, Rinehart, Winston,
New York, 1969.

A Study of Productivity and Financial Efficiency of Textile Industry of India
308
48. WALKER E.W: Essential of Financial management” Eastern economy edit.
Prentice Hall of India Pvt. Ltd, New Delhi, 1976
ARTICLES
1. Agrawal N.P. & Gupta S.l. Indian cement industries problems and
prospects, Indian journal of Marketing, September 1984.
2. Dutta S.K. Indian Tea Industry an appraisal’, “The management
accountant” Calcutta March 1992.
3. Kar A.P.Need for cost and Management control in Indian Tea
Industry’ the management accountant: Calcutta December 1995.
4. The journal of Indian Tea Association, Indian Tea Scenario,
2002,Kolkata.
5. Mallick Amit and Debasish sur “Working capital and profitability:
A case study in interrelation” November 1998.
6. Nautiyal R.R and K.S Negi “Cotton textile industry: A case study
of the public sector companies in utter pradesh”
7. Sabajit Paul “An overview of the Indian Tea Industry”
management accountant, june, 2004
8. Swami N. Bonu “Risk and Return analysis “Case study of selected
industries. April 1994.
9. Tiwari R.S., Cost reduction in cement industry, the management
accountant, Nov.1998.
A Study of Productivity and Financial Efficiency of Textile Industry of India
309
PERIODICALS
1. Annual reports of selected companies from 1997-98 to
2002-2003.
2. Business India
3. Bombay Stock exchange Official directory
4. R.B.I.Bulleting
5. Capital market
6. Chartered accountant
7. Chartered Financial analyst
8. Commerce
9. Cement review
10. Financial express Mumbai and Delhi (India)
11. Fact for you
12. Indian Journal of commerce
13. Indian journal of accounting
14. Indian Journal of public enterprise
15. Investment week
16. Cement Manufacturer’s association publication
17. Management accountant
18. Manorama year book
19. Research In third word accounting US.
A Study of Productivity and Financial Efficiency of Textile Industry of India
310
DATABASE
1. CAPITAL LENE 2000
2. CMIE PROWESS
WEBSITES
1. www.indiainfoline.com.
2. www.capitalmarket. com
3. www.bisnet .com
4. www.indiatea.org.
5. www.valuenotes.biz/research teatoc.asp
6. www.economywatch.com
NEWSPAPERS
1. The Economic Times
2. The Financial Express
3. The Indian Express
4. The Times of India