Embed Size (px)
Citation preview
Title Numerical Classification of the Climate of South and SoutheastAsia
Author(s) Kyuma, Kazutake
Citation 東南アジア研究 (1972), 9(4): 502-521
Issue Date 1972-03
URL http://hdl.handle.net/2433/55673
Right
Type Departmental Bulletin Paper
Textversion publisher
Kyoto University
Tonan Ajia Kenkyu (The Southeast Asian Studies) Vol. 9, No.4 March, 1972
Numerical Classification of the Climateof South and Southeast Asia
by
Kazutake KYUMA*
Introduction
In a preceding paperD the climate of South and Southeast Asia was dealt with using
Thornthwaite's classification method. The result indicated that the number of climatic
types classified on the basis of thermal efficiency, humidity, and seasonal distribution
of water surplus or deficiency amounted to 42 for the regions concerned, so that a
delineation of climatic regions corresponding to each type was highly difficult. Only
a small-scale map with many inclusions could be produced with respect to humidity
climatic types, taking seasonal distribution of water surplus or deficiency somewhat into
consideration. Besides the difficulty in mapping, problems inherent to the method
were also discussed; use of a parameter, i. e., potential evapotranspiration, is the
essential feature of Thornthwaite's method, but there is no guarantee for the validity
of the parameter when calculated for the tropical climate, as Thornthwaite himself
admitted.
Recently we examined the applicability of a numerical taxonomic method to the
climatic classification of ]apan,2) with an intention to establish climatic regions of the
country as a basis of classification of alluvial soils. As noted in this study the
numerical method gave readily mappable climatic regions with a fairly good internal
coherence, while Thornthwaite's method adopted for the purpose of comparison presented
the same difficulty as stated above.
In the present paper applicability of the numerical taxonomic method to a classi
fication of the climate of South and Southeast Asia is tested. Here our intention is
again to set up climatic regions as a basis for considering classification of alluvial
soils in the rice-growing South and Southeast Asia.
I Materials and Methods
Based on the previous study with Thornthwaite's method and on preliminary trials
* 7..,~-W>JIj, The Center for Southeast Asian Studies, Kyoto University, Japan
502
K. Kyuma : Numerical Classification of the Climate of South and Southeast Asia
with the numerical method, the stations were selected so that the major variations of
the climate of South and Southeast Asia may be represented. In practice, one hundred
and twenty-five stations out of some 300 stations, for which mean monthly temperature
and rainfall data are available (d., Kyumal)), were chosen taking density of distribution
of stations as well as variability of climate in an area into consideration. The funda
mental limitation to this selection of sample stations is that there are many areas for
which meteorological data are very scarce, e. g., Laos, Burma, and the Indonesian
Islands other than Java.
Another consideration in selecting the stations is to exclude the stations on high
lands; those stations having thermal efficiency types other than A' in Thornthwaite's
classification are deliberately excluded. This is because the major alluvial lands extend
on the lowlands. One exception to this rule is a station at Handung (134'), which was
taken as a representative of highland plains in Java.
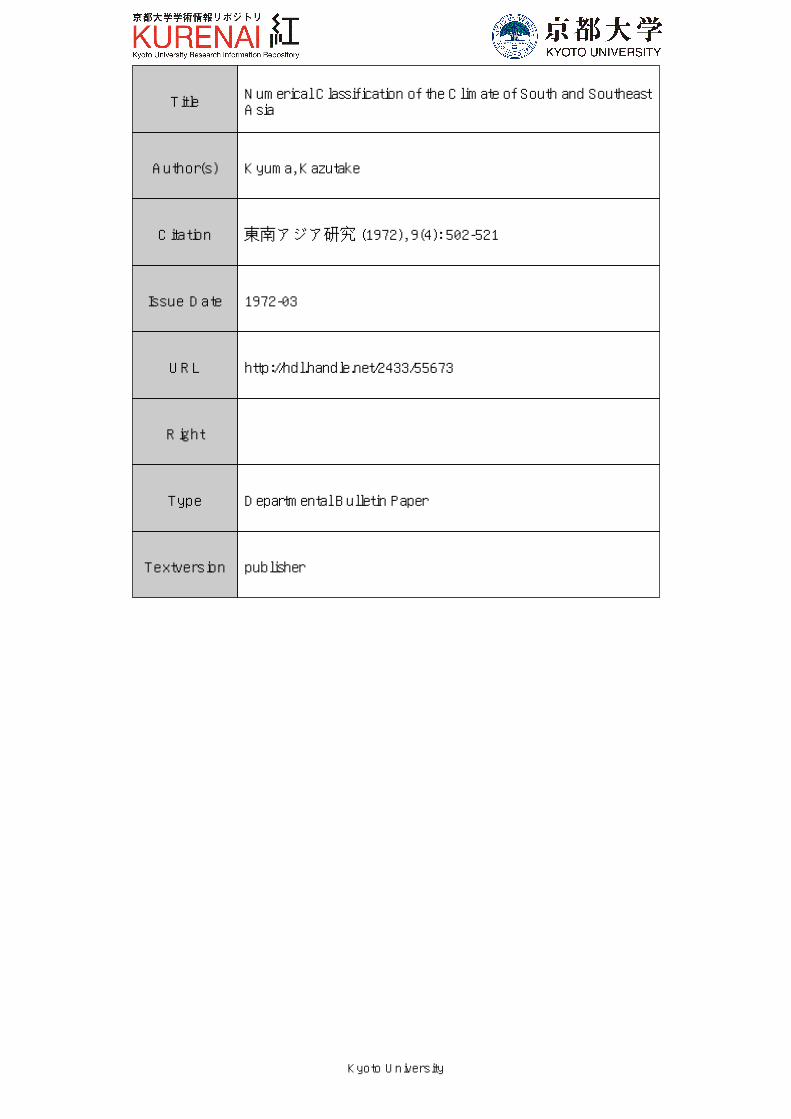
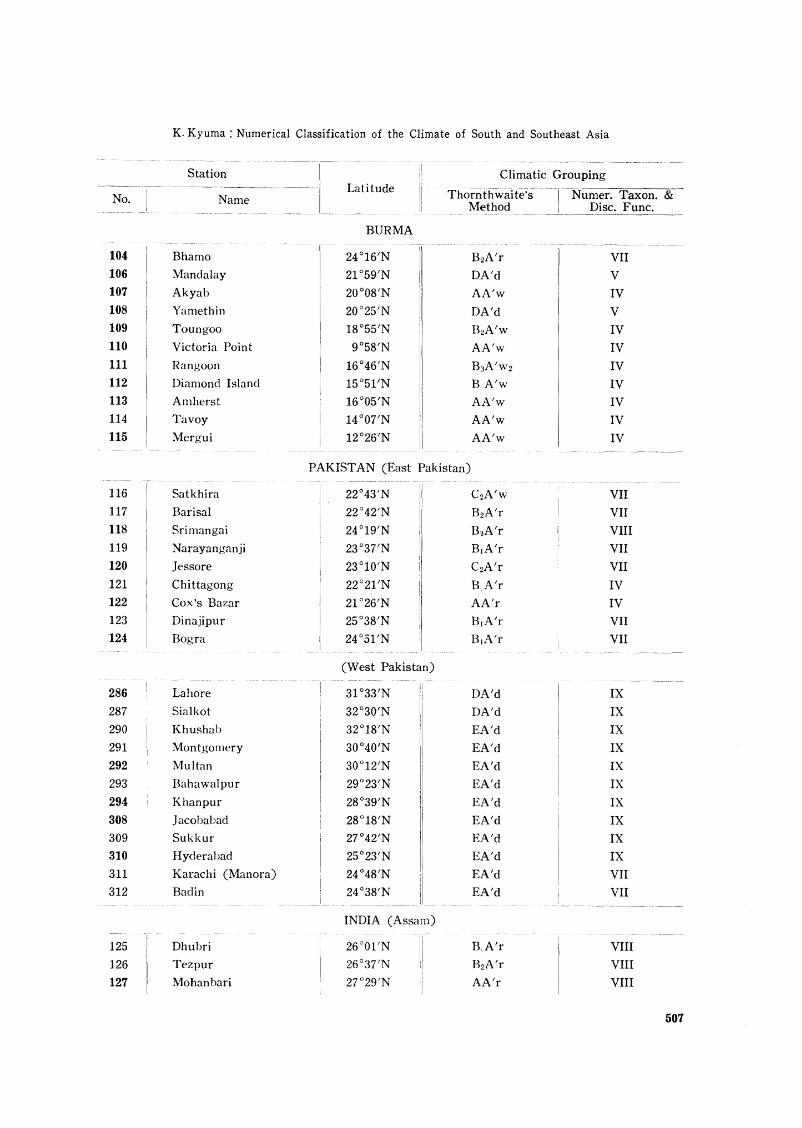
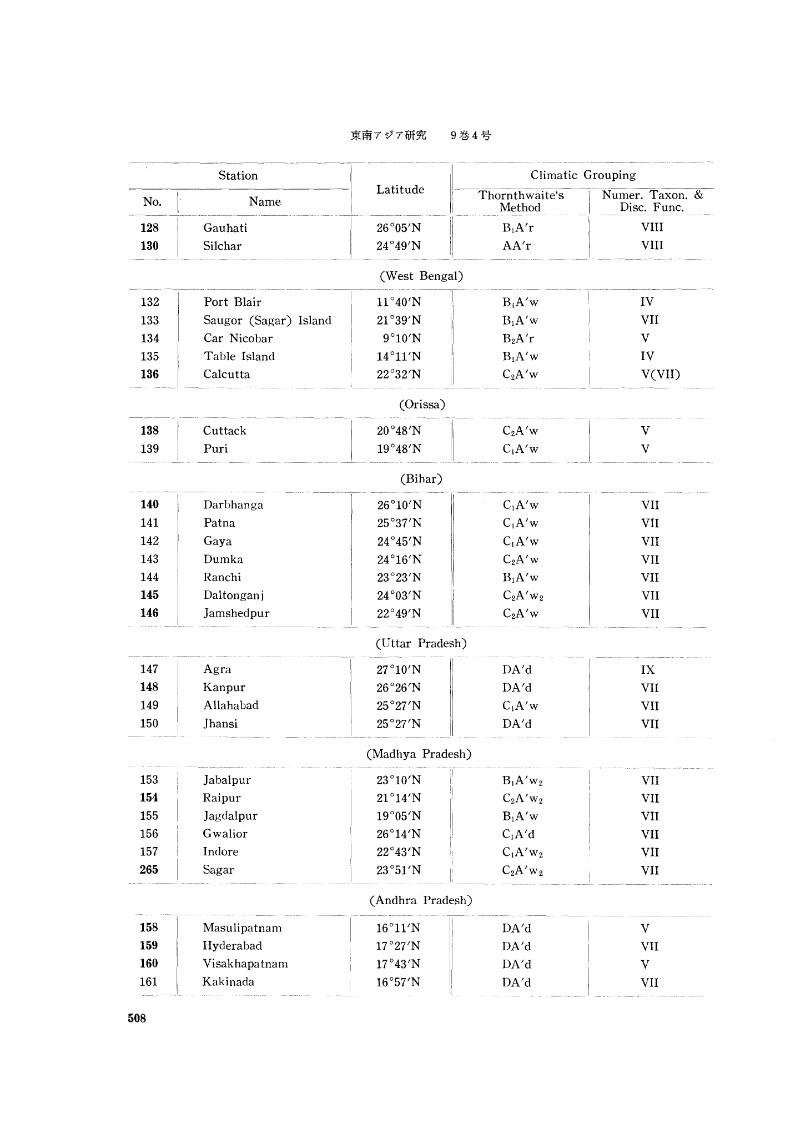
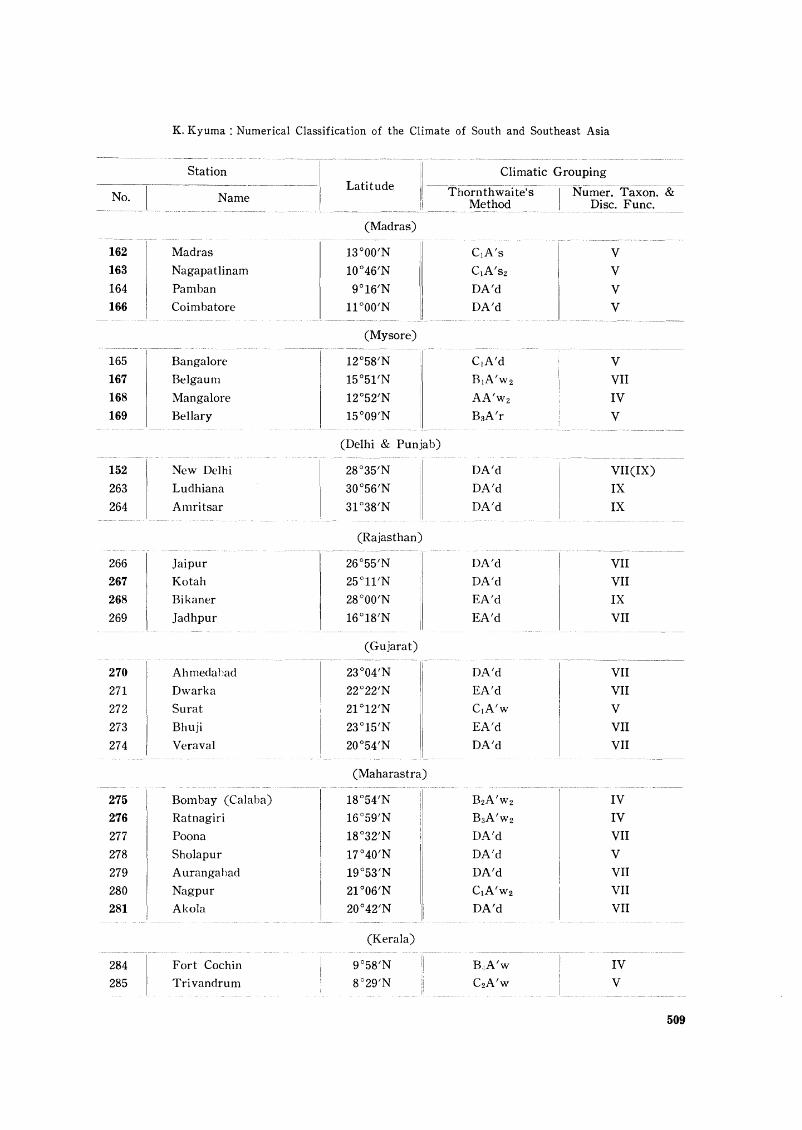
A map showing distribution of the sample stations is given in Fig. 1. Thornth
waite's climatic types and other data for the sample stations are given in Table 1
together with those for other stations.
q l(~)()krn
•
Fig. 1 A Map showing Distribution of the Sample Stations
As in the previous paper2), the numerical taxonomic procedures used here are after
Sokal and Sneath.3) Taxonomic distances were calculated after standardization of the
original climatic data (mean monthly temperatures and mean monthly rainfalls from
503
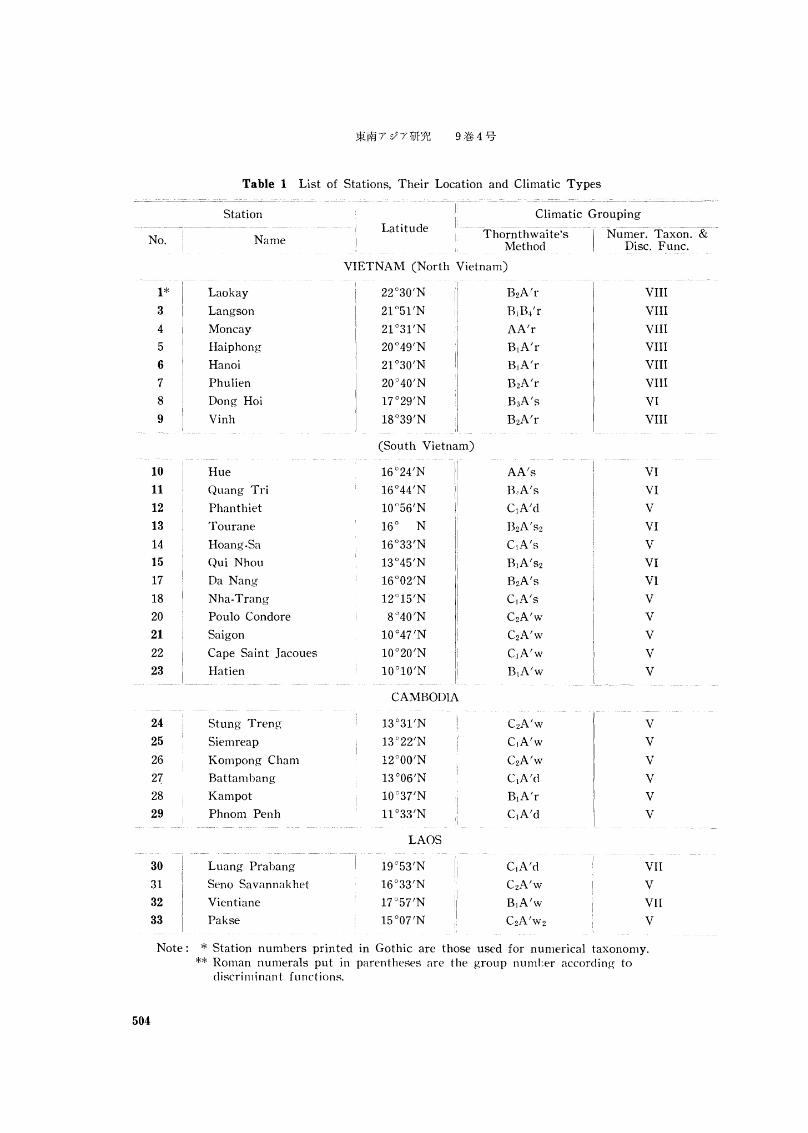
Table 1 List of Stations, Their Location and Climatic Types
LatitudeNo.
Station
Name
Climatic Grouping
-Thoff:~~~ite;s ·1- NU~ft~.V~;··&
VIETNAM (North Vietnam)
1*3
4
5
6
7
8
9
Laokay
Langson
Moncay
Haiphong
Hanoi
Phulien
Dong Hoi
Vinh
22°30 'N
21°51 'N
21°31'N
20 0 49'N
21°30'N
20 0 40'N
17°29'N
18°39'N
BzA'r
BjB/r
AA'r
BlA'r
BjA'r
BzA'r
BaA's
BzA'r
VIII
VIII
VIII
VIII
VIII
VIII
VI
VIII
(South Vietnam)
10 Hue 16°24'N AA's VI
11 Quang Tri 16°44'N B!A's VI
12 Phanthiet 10()56'N ClA'e! V
13 Tourane 16° N BzA'sz VI
14 Hoang·Sa 16°33'N CIA's V
15 Qui Nhou 13°45'N BjA'sz VI
17 Da Nang 16°02'N BzA's VI
18 Nha-Trang 12°15'N CIA's V
20 Poulo Condore 8°40'N CzA'w V
21 Saigon 10 0 47'N CzA'w V
22 Cape Saint Jacoues 10 0 20'N CIA'w V
23 Hatien 10 0 10'N BIA'w V
CAMBODIA
24 Stung Treng 13°31'N CzA'w V
25 Siemreap 13°22'N C1A'w V
26 Kompong Cham 12°00'N CzA'w V
27 Battambang 13°06'N CIA'e! V
28 Kampot 10 0 37'N BIA'r V
29 Phnom Penh 11 °33'N CIA'd V
LAOS
30 Luang Prabang 19°53'N CINe! VII
31 Seno Savannakhet 16°33'N CzA'w V
32 Vientiane 17°57'N B1A'w VII
33 Pakse 15°07'N CzA'wz V
Note: * Station numbers printed in Gothic are those used for numerical taxonomy.** Roman numerals put in parentheses are the group numLer according to
discriminant functions.
504

K. Kyuma : Numerical Classification of the Climate of South and Southeast Asia
Station Climatic GroupingLatitude
Numer. Taxon.-&:No. NameMethod Disc. Func.
MALAYSIA (West Malaysia)
34 Alor Star Aerodrome 6°12'N B1A'r V35 Penang 5°25'N B2A'r II36 Kuala Trengganu 5°20'N B3A'r II37 Kota Bharu 6°08'N B3A'r II38 Ipoh 4°34'N BlA'r II40 Kuala Lumpur 3°07'N B2A'r II(O**41 Malacca 2°12'N BIA'r I42 Singapore 1°18'N BIA'r I
246 P. Langkawi 6°19'N BzA'r II247 Kulim 5°23'N B4A'r II248 Kualakangsar 4°46'N CzA'r I249 Sitiawan 4°13'N CzA'r I250 Kampar 4°18'N AA'r III251 Kuantan 3°46'N BIA'r II252 Bentong 3°31'N BlA'r II253 Kepong 3°14'N B3A'r II254 .Telebu 2°57'N CzA'r I255 Segamat 2°30'N CzA'r I256 Mersing 2°27'N B4A'r II257 Johore Bahru 1°28'N B3A'r II
(East Malaysia)
44 Sandakan 5°50'N B3A'r II45 Jesselton 5°51'N B3A'r V46 Labuan 5°17'N AA'r II48 Miri 4°23'N B3A'r II49 Bintula 3°11'N AA'r II50 Kuching 1°29'N AA'r III
INDONESIA
51 Tarakan 3°19'N AA'r III (II)52 Balikpapan 1°17'N BzA'r I53 Pontianak OOOl'N B,A'r II54 Mapanget 1°32'N AA'r III55 Menaclo 1°30'N B3A'r III56 Makassar 5°08'S BIA's III57 Dili 8°35'S DA'd I58 Amboina 3°42'N AA'r IV60 Koepang 10 0 10'S CzA'sz I62 Medan 3°35'N BIA'r I64 Padang OO56'S AA'r III
505

JRm7 V'7Tvt9l: 9Y&4~-
Station Climatic GroupingLatitude
No. Name Method Disc. Func.
65 Tandjueng Panclan 20 45'S B3A'r II
66 Terempa 3°12'N BzA'r II
67 Soerabaya 7°16'S CzA's I
69 Pasuruan 7°38'S CIA's I
71 D;eml:er 8°09'S BIA'r I
74: Semarang 7"00'S B1A'r I
75 Klaten 7°42'S CzA's I
76 Pekalongan 6"53'S ThA'r I
77 Wedi-Birit 7°45'S BIA's I
79 Tjitajam 6'27'S AA'r III
80 Kuyper 6°02'S CIA's I
81 Djakarta 6°11'N CzA'r I
87 Buitenzorg (Bogor) 6°35'S AA'r III
231 Bandjarmasin 3"19'S B3A'r I
232 Tjirebon 6°42'S BIA's I
233 Tjilatjap 7°44'S AA'r III
234 Subang 6'35'S AA'r III
235 Serang 6'07'S CzA'r I
237 Modjopanggung 8°03'S BIA'r I
238 Malang 7"58'S R;A'r III
239 Magelang 7°29'S AA'r III
240 Kemajoran 6°08'S CzA'r I
242 Kadhipaten 6°46'S B4A'r III
243 D~okjakarta 7°49'S BIA'r I
244 Dadapajam 7'17'S B3A'r III
245 Bandung 6°55'S (B,B'4r ) III
THE PHILIPPINES
88 Aparri 18°22'N BzA'r VI
89 Basco 20 0 27'N B4A'r II
90 Echague 16°42'N CzA's V
92 Tacloban 11 °15'N BIA'r I
93 Cebu City 10 0 20'N CzA'r V
94 Manila Airport 14°31'N CzA'w IV(V)
95 Legaspi City 13°08'N AA'r II
96 Cuyo 10 0 51'N B1A'w IV
97 Iloilo City 10 0 42'N B1A'w V
98 Iwahig 9°44'N BIA'r I(V)
99 Surigao 9°48'N AA'r III
100 Dagupan City 16°03'N B1A'w IV
101 Zamboanga City 6°58'N CIA'd V
102 Jolo 6°03'N CzA'r I
103 Davao 7°04'N CzA'r I
506
JfCi¥i7 V7m~ 9~4%
Station Climatic GroupingLatitude
No. Name Method Disc. Func.
128 Gauhati 26°05'N BIA'r VIII
130 Silchar 24°49'N AA'r VIII
(West Bengal)
132 Port Blair 11 °40'N B4A'w IV
133 Saugor (Sagar) Island 21°39'N BjA'w VII
134 Car Nicobar 9°10'N BzA'r V
135 Table Island 14°11'N B1A'w IV
136 Calcutta 22°32'N CzA'w V(VII)
(Orissa)
138 Cuttack 20 0 48'N CzA'w V
139 Puri 19°48'N C1A'w V
(Bihar)
140 Darbhanga 26°10'N CjA'w VII
141 Patna 25°37'N CjA'w VII
142 Gaya 24°45'N CjA'w VII143 Dumka 24°16'N CzA'w VII144 Ranchi 23°23'N B1A'w VII145 Daltonganj 24°03'N CzA'wz VII146 Jamshedpur 22°49'N CzA'w VII
(Uttar Pradesh)
147 Agra 27°10'N DA'd IX148 Kanpur 26°26'N DA'd VII149 Allahabad 25°27'N CIA'w VII150 Jhansi 25°27'N DA'd VII
(Madhya Pradesh)
153 Jabalpur 23°10'N B1A'wz VII154 Raipur 21°l4'N CzA'wz VII155 Jagdalpur 19°05'N BjA'w VII
156 Gwalior 26°14'N CjA'd VII157 Indore 22°43'N C1A'wz VII265 Sagar 23°51'N CzA'wz VII
(Andhra Pradesh)
158 Masulipatnam 16°11'N DA'd V159 Hyderabad 17°27'N DA'd VII160 Visakhapatnam 17°43'N DA'd V161 Kakinada 16°57'N DA'd VII
508
K. Kyuma : Numerical Classification of the Climate of South and Southeast Asia
Station Climatic GroupingLatitude
No. Name
(Madras)
162 Madras 13°00'N C1A's V
163 Nagapatlinam lO o 46'N Cl A'S2 V164 Pamban 9°16'N DA'd V166 Coimbatore 11 °OO'N DA'd V
(Mysore)
165 Bangalore 12°58'N CIA'd V
167 Belgaum 15°51'N B[A'W2 VII
168 Mangalore 12°52'N AA'W2 IV
169 Bellary 15°09'N B3A'r V
(Delhi & Punjab)
152 New Delhi 28°35'N DA'd VII (IX)
263 Ludhiana 30 0 56'N DA'd IX
264 Amritsar 31°38'N DA'd IX
(Rajasthan)
266 Jaipur 26°55'N DA'd VII
267 Kotah 25°11'N DA'd VII
268 Bikaner 28°00'N EA'd IX
269 Jadhpur 16°18'N EA'd VII
(Gujarat)
270 Ahmedabad 23°04'N DA'd VII
271 Dwarka 22°22'N EA'd VII
272 Surat 21°12'N C[A'w V
273 Bhuji 23°15'N EA'd VII
274 Veraval 20 0 54'N DA'd VII
(Maharastra)
275 Bombay (Calaba) 18°54'N B2A'W2 IV
276 Ratnagiri 16°59'N B3A'W2 IV
277 Poona 18°32'N DA'd VII
278 Sholapur 17°40'N DA'd V
279 Aurangabad 19°53'N DA'd VII
280 Nagpur 21°06'N Cl A'W2 VII
281 Akola 20 0 42'N DA'd VII
(Kerala)
284 Fort Cochin 9°58'N B,A'w IV
285 Trivandrum 8°29'N C2A'w V
509
*~7Y7Wf~ 9~4%
Station Climatic GroupingLatitude
No. Name
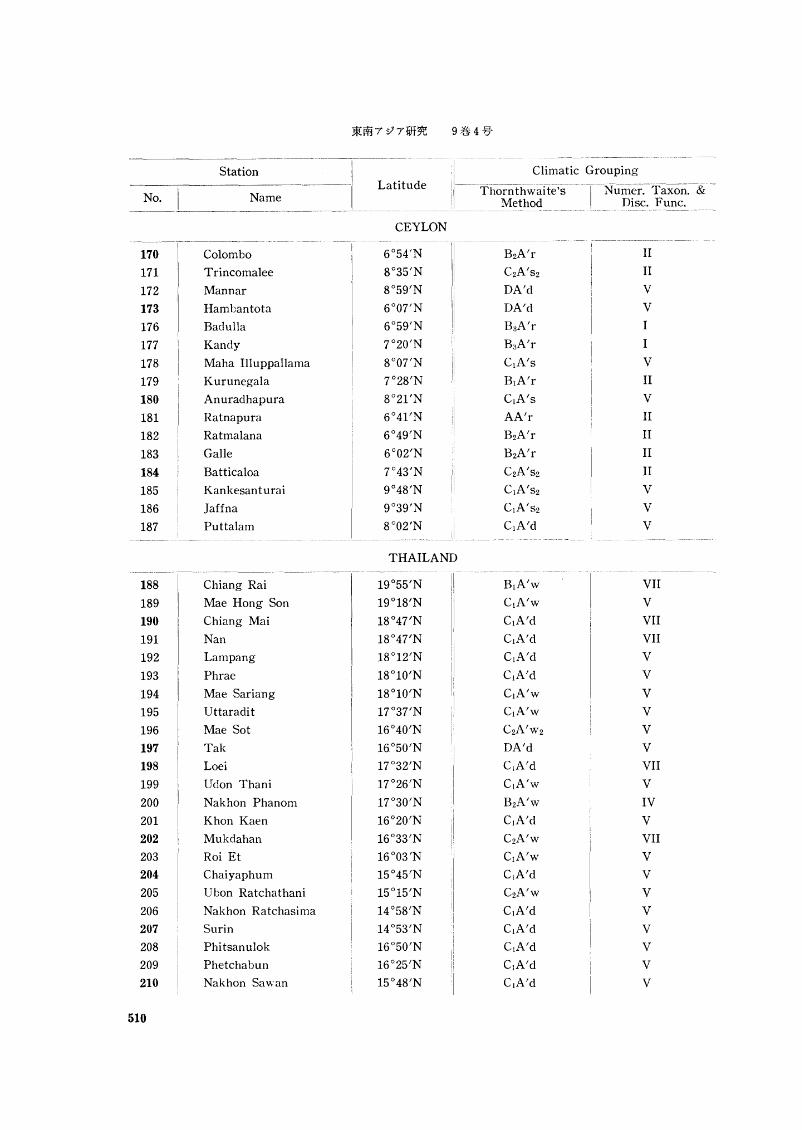
CEYLON
170 Colombo 6°54 /N B2A/r II
171 Trincomalee 8°35 /N C2A/S2 II
172 Mannar 8°59 /N DA'd V
173 Hambantota 6°07 /N DA'd V
176 Badulla 6°59 /N B;JA'r I
177 Kandy 7°20'N B3A'r I
178 Maha Illuppallama 8°07'N CIA's V
179 Kurunegala 7°28'N BlA'r II
180 Anuradhapura 8°21'N CIA's V
181 Ratnapura 6°41'N AA/r II
182 Ratmalana 6°49'N B2A/r II
183 Galle 6°02'N B2A'r II
184 Batticaloa 7°43 /N C2A'S2 II
185 Kankesanturai 9°48'N CIA'S2 V
186 Jaffna 9°39'N CIA'S2 V
187 Puttalam 8°02'N CIA'd V
THAILAND
188 Chiang Rai 19°55'N B1A'w VII
189 Mae Hong Son 19°18'N CIA'w V
190 Chiang Mai 18°47 /N CIA'd VII
191 Nan 18°47 /N CIA'd VII
192 Lampang 18°12'N CIA/d V
193 Phrae 18°10'N CjA'd V
194 Mae Sariang 18°10 /N CIA'w V
195 Uttaradit 17°37'N CIA'w V
196 Mae Sot 16°40/N C2A /W 2 V
197 Tak 16°50'N DA'd V
198 Loei 17°32'N C1A'd VII
199 Udon Thani 17°26'N C1A/w V
200 Nakhon Phanom 17°30'N B2A'w IV
201 Khon Kaen 16°20'N C1A'd V
202 Mukdahan 16°33'N C2A'w VII
203 Roi Et 16°03'N CIA'w V
204 Chaiyaphum 15°45'N C1A'd V
205 Ubon Ratchathani 15°15'N C2A'w V
206 Nakhon Ratchasima 14°58'N CIA'd V
207 Surin 14°53'N CIA'd V
208 Phitsanulok 16°50'N CIA'd V
209 Phetchabun 16°25'N CIA'd V
210 Nakhon Sawan 15°48'N CIA'd V
510
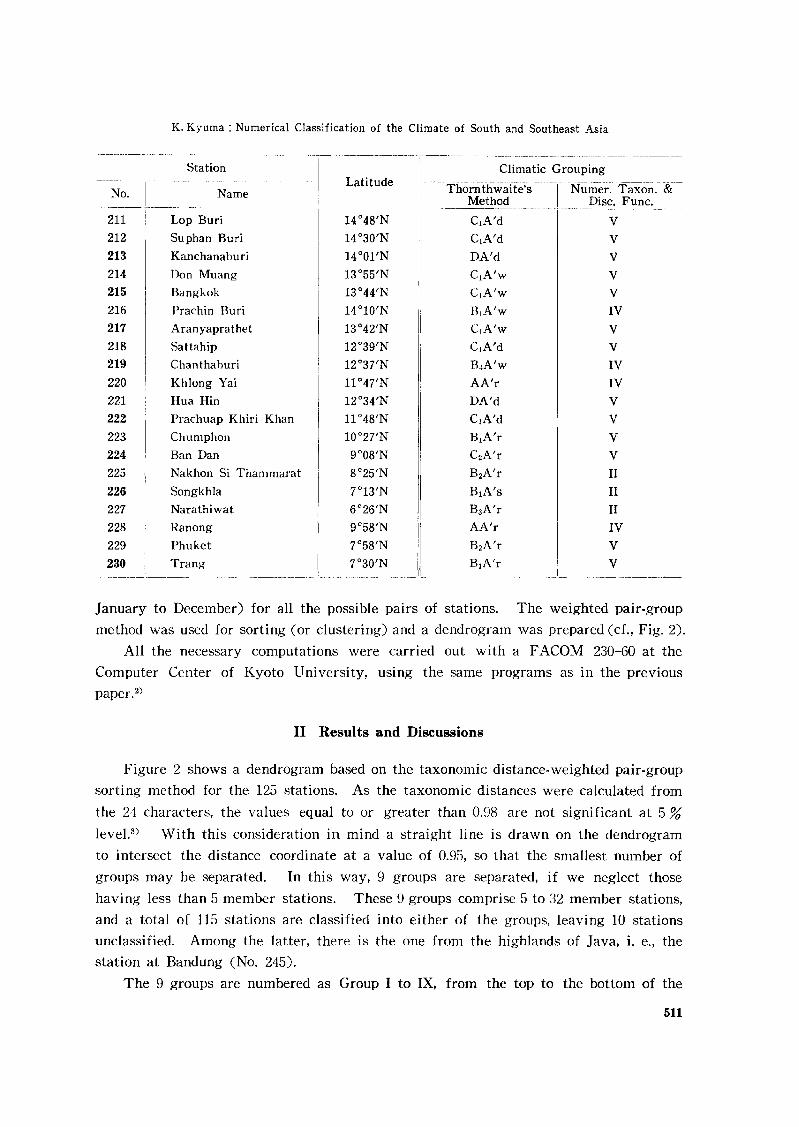
K. Kyuma : Numerical Classification of the Climate of South and Southeast Asia
Station Climatic GroupingLatitude Numer. Taxon. &.No. Name
Method Disc. Func.
211 Lop Buri 14°48'N ClA'd V212 Suphan Buri 14°30'N ClA'd V213 Kanchanaburi 14°01'N DA'd V214 Don Muang 13°55'N ClA'w V215 Bangkok 13°44'N CjA'w V216 l'rachin Buri 14°10'N IhA'w IV217 Aranyaprathet 13°42'N CIA'w V218 Sattahip 12°39'N CjA'd V219 Chanthaburi 12°37'N B.A'w IV220 Khlong Yai 11 °47'N AA'r IV221 Hua Hin 12°34'N DA'd V222 Prachuap Khiri Khan 11 °48'N CjA'd V223 Chumphon 10 027'N BIA'r V224 Ban Dan 9°08'N C2A'r V225 Nakhon Si Thammarat 8°25'N B2A'r II
226 Songkhla 7°13'N BlA's II
227 Narathiwat 6°26'N BsA'r II
228 Ranong g058'N AA'r IV
229 Phuket 7°58'N B2A'r V230 Trang 7°30'N BjA'r V
January to December) for all the possible pairs of stations. The weighted pair-group
method was used for sorting (or clustering) and a dendrogram was prepared (d., Fig. 2).
All the necessary computations were carried out with a FACOM 230-60 at the
Computer Center of Kyoto University, using the same programs as in the previous
paper.2)
II Results and Discussions
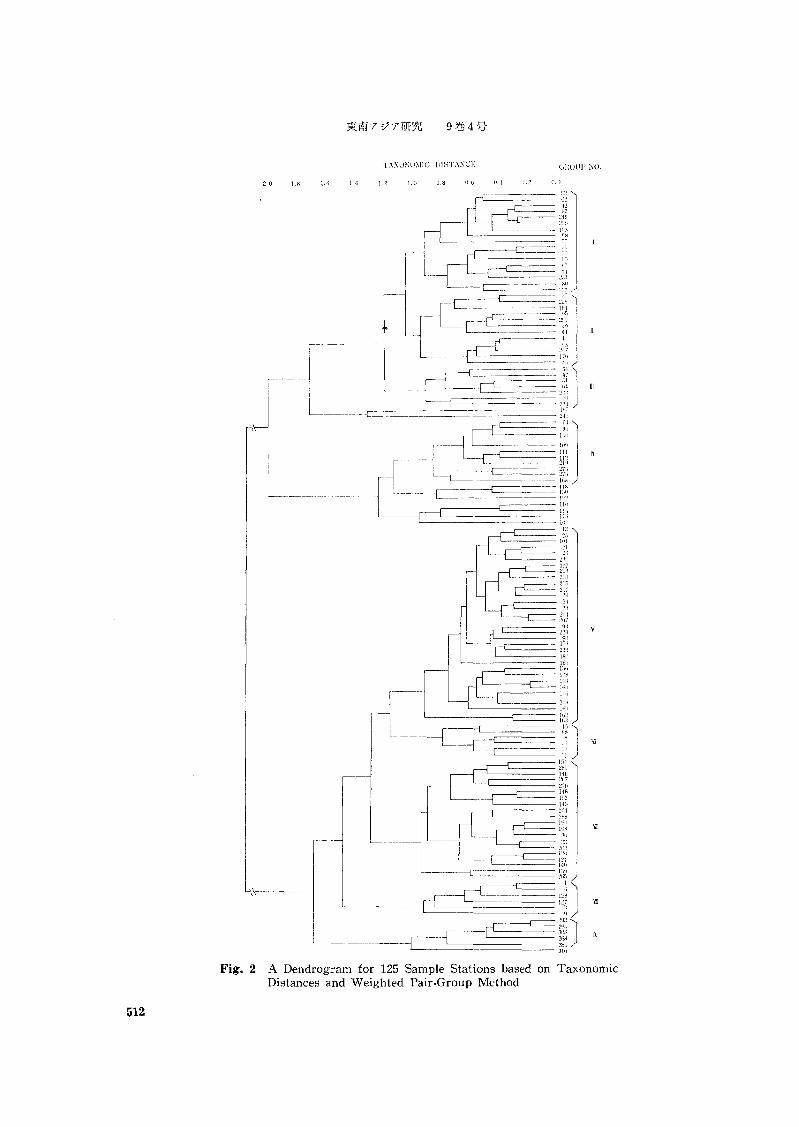
Figure 2 shows a dendrogram based on the taxonomic distance-weighted pair-group
sorting method for the 125 stations. As the taxonomic distances were calculated from
the 24 characters, the values equal to or greater than 0.98 are not significant at 5 %
level.S) With this consideration in mind a straight line is drawn on the dendrogram
to intersect the distance coordinate at a value of 0.95, so that the smallest number of
groups may be separated. In this way, 9 groups are separated, if we neglect those
having less than 5 member stations. These 9 groups comprise 5 to 32 member stations,
and a total of 115 stations are classified into either of the groups, leaving 10 stations
unclassified. Among the latter, there is the one from the highlands of Java, i. e., the
station at Bandung (No. 245).
The 9 groups are numbered as Group I to IX, from the top to the bottom of the
511
(jltuUP {\O.
r-------c= __
2.0 loB 1.6 1.·1 lUi Il.fj 0.\ (1,0
512
Fig. 2 A Dendrogram for 125 Sample Stations based on TaxonomicDistances and Weighted Pair-Group Method
K. Kyuma : Numerical Classification of the Climate of South and Southeast Asia
21i
to
40
30
1 "\ I
'.',I
ill
200
~~~-.-~()
1 2 34 5 6 7 89 lO1112
lIIO -
500
100," ""1/ -'\,
300 \30
/'\. 40,,
I
:'
j2lJ
~10
-~~~~~,~t12,3456789101112
h~~~-~~~--~~,.---j01 2 :-3 4 5 6 7 8 9 10 II 12
Month
Rainfall in mm Temperature in"C
500I
500II
400 10 400 -
,10() ;)0 3110
I,, / !,21Xl --. ,
20 200 --........ \, I , , ,, -, l , -- ,- I J-.
11)0 ... .... ~ ...... - ~~I II) lOO
Vi
SOO-,, ,, ,, :,
1I I, ,
I ,400 - , ,
40I,
, ,1
,, ,, :1
, :-30,JOO ,,I, ,,,,
200I
20111,,
/
lIIO '., ,, -10, ".--.-,'- ---.
1~~~~~~~--r-1 012,-3456789101112
v
10
e--~~~~~~~~-.-j01 2 3 4 5 6 7 8 9 10 1112
liJO
5(10
400
200
;)00
20
10
,II,\I
I
i,f'
I \, \
f \I ,, I, I, ,I II II ,I I
: ",,I
I,I
,II,
IIII,
//
/,e--.-,--.--~'~~~~~~rl 0123456789101112
200
400
300
100
(iOO[ IV
500
SOO 500VID
500 -IXvn
400 40 ·1liO 40 400 40
300 30 :-300 30 300
200 200 20
,,II
lOO I lUO lIIl1 lLJ,,, ,1-"-
--' "I .-, ·00 ()
123456 7 8 9101112 1 2 34 S 6 7 8 ~11() 1112 1 2 :J 1 5 Ii 7 S 9 101112
Temperature ~------ Rainfall
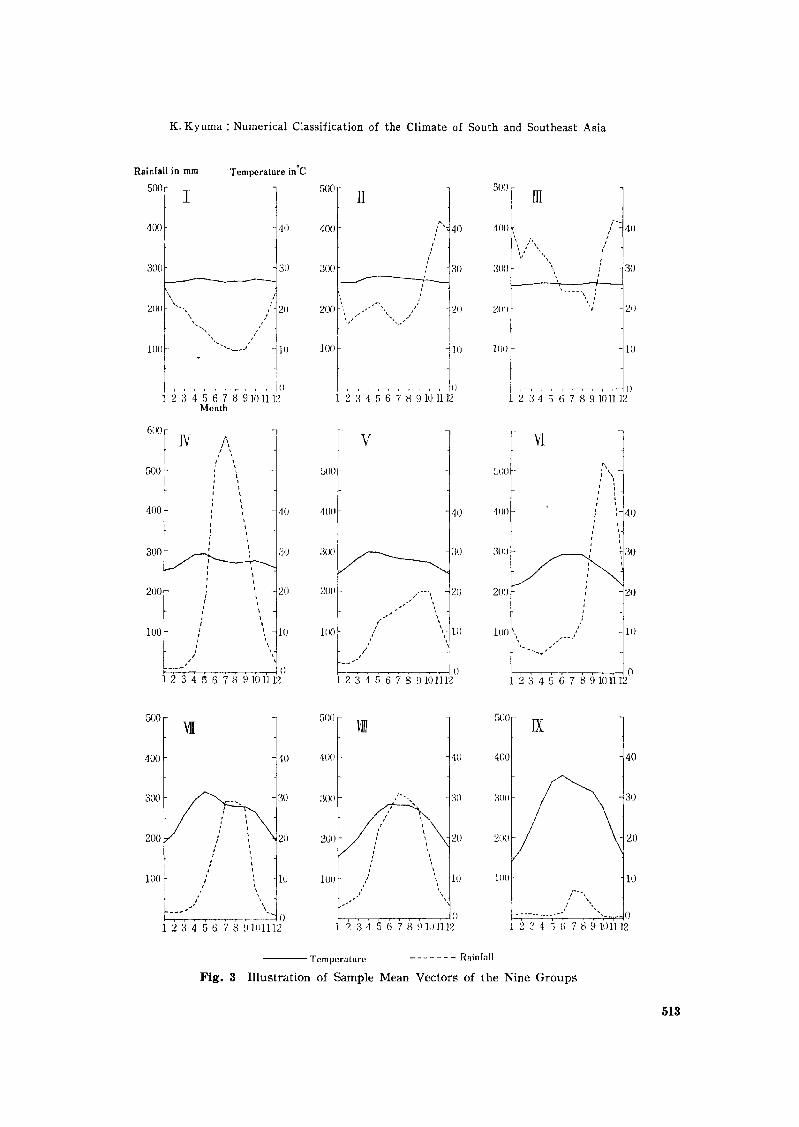
Fig. 3 Illustration of Sample Mean Vectors of the Nine Groups
513
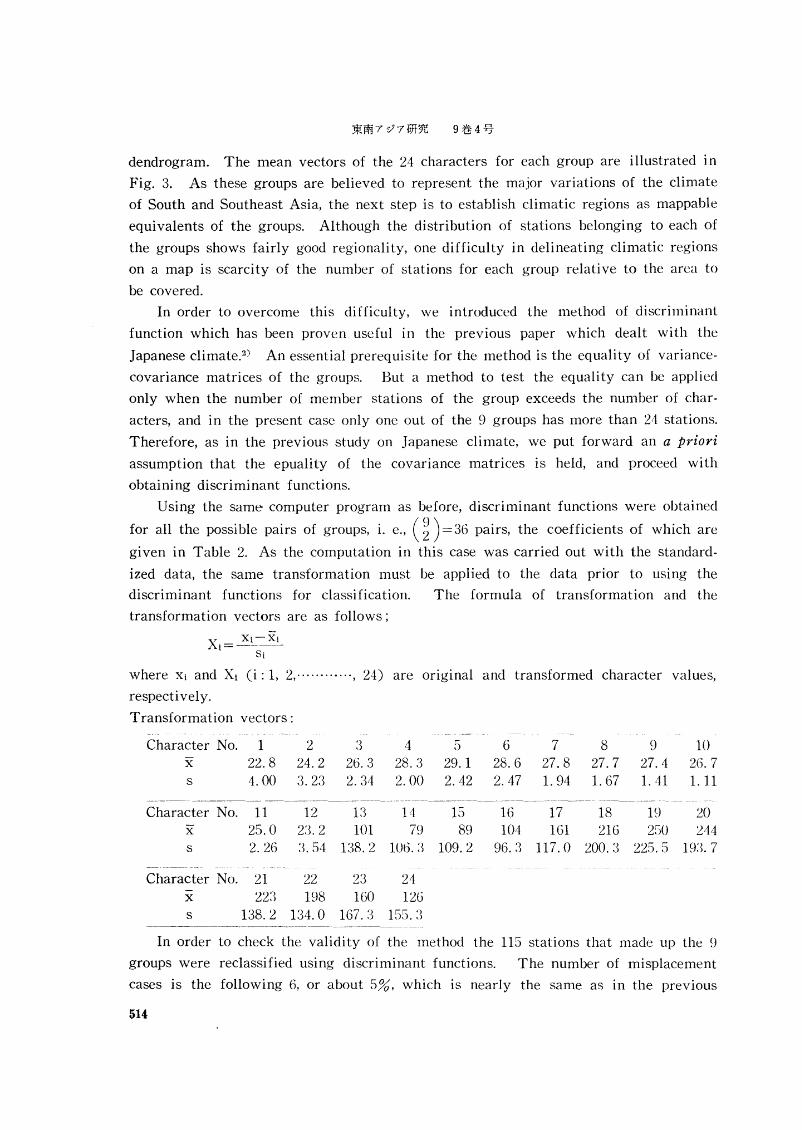
dendrogram. The mean vectors of the 24 characters for each group are illustrated in
Fig. 3. As these groups are believed to represent the major variations of the climate
of South and Southeast Asia, the next step is to establish climatic regions as mappable
equivalents of the groups. Although the distribution of stations belonging to each of
the groups shows fairly good regionality, one difficulty in delineating climatic regions
on a map is scarcity of the number of stations for each group relative to the area to
be covered.
In order to overcome this difficulty, we introduced the method of discriminant
function which has been proven useful in the previous paper which dealt with the
Japanese climate.2) An essential prerequisite for the method is the equality of variance
covariance matrices of the groups. But a method to test the equality can be applied
only when the number of member stations of the group exceeds the number of char
acters, and in the present case only one out of the 9 groups has more than 24 stations.
Therefore, as in the previous study on Japanese climate, we put forward an a priori
assumption that the epuality of the covariance matrices is held, and proceed with
obtaining discriminant functions.
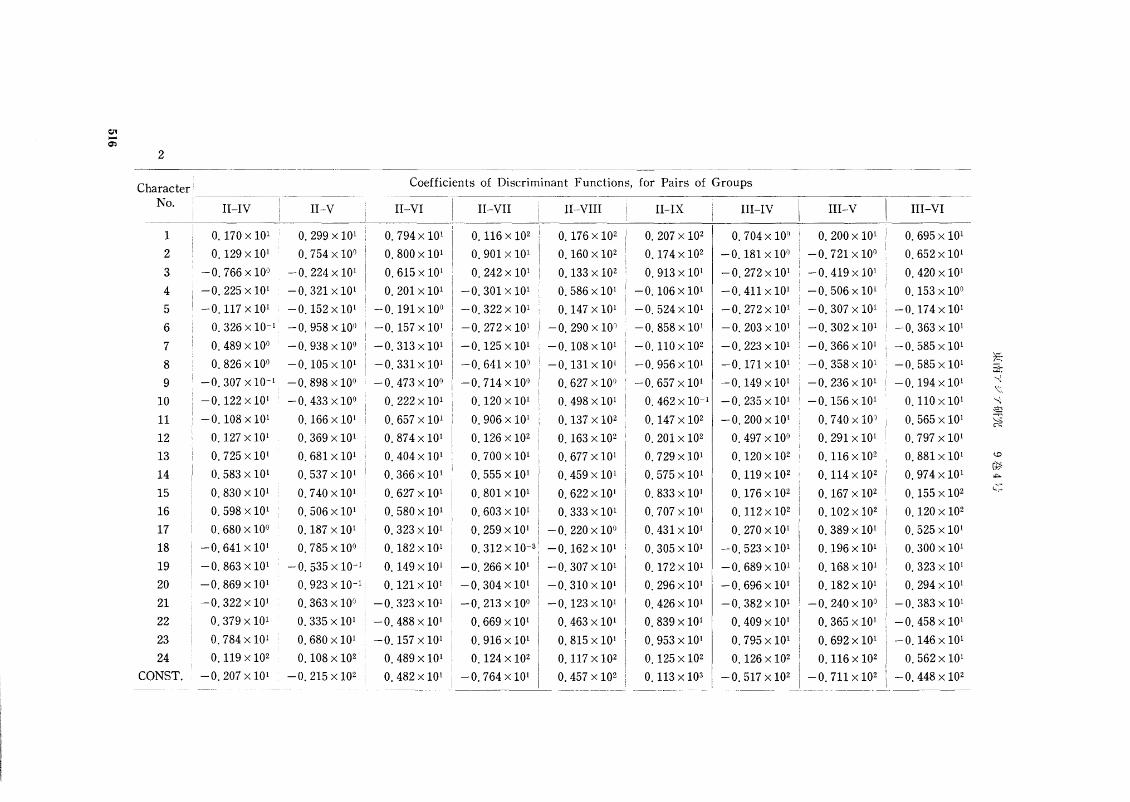
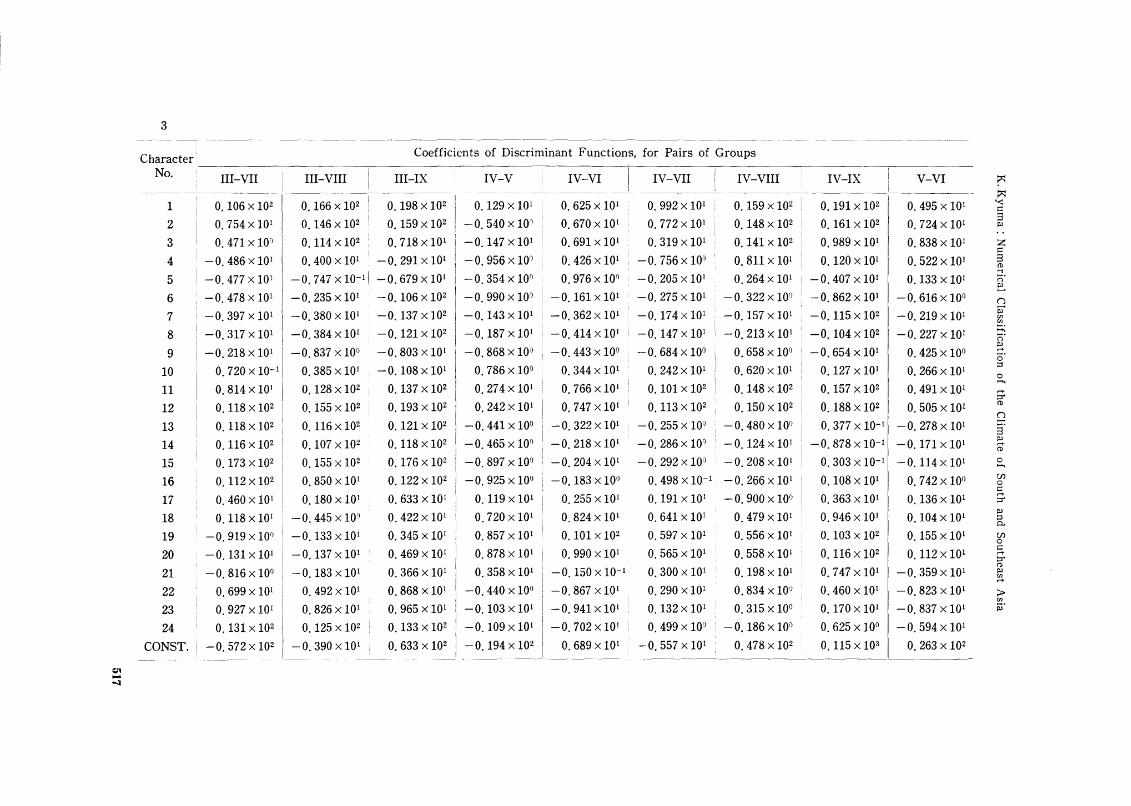
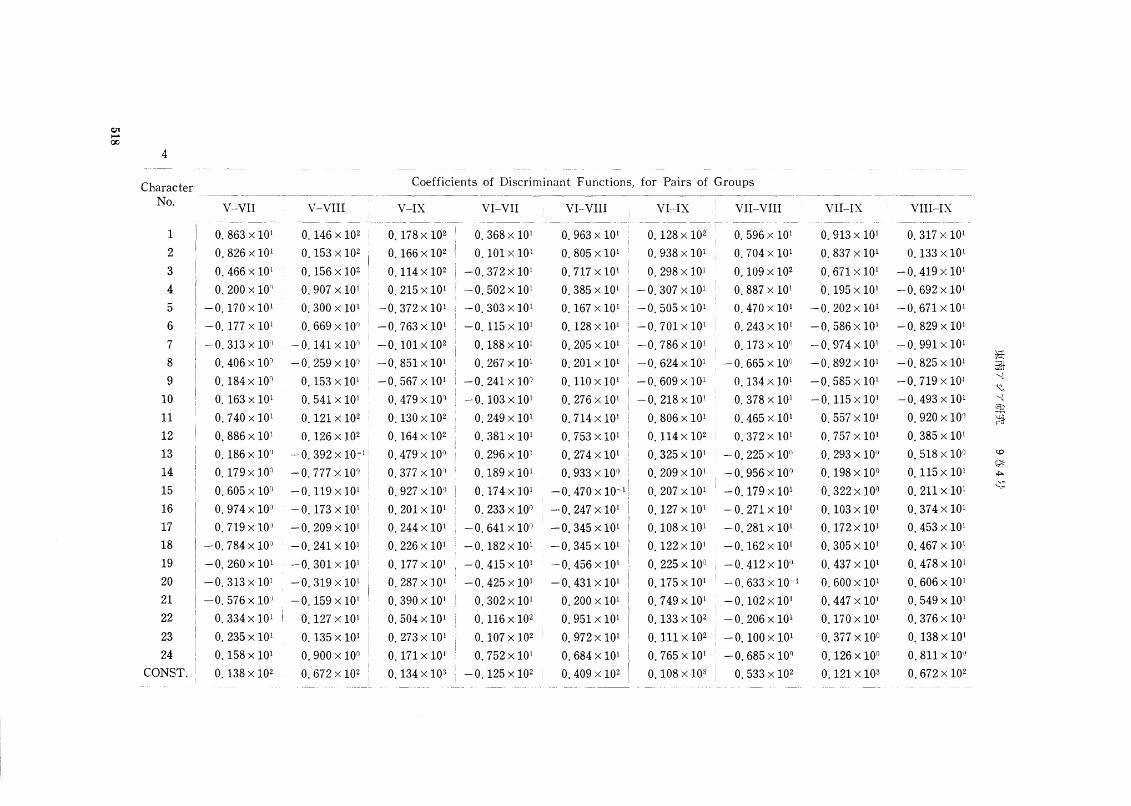
Using the same computer program as before, discriminant functions were obtained
for all the possible pairs of groups, i. e., (~) = 36 pairs, the coefficients of which are
given in Table 2. As the computation in this case was carried out with the standard
ized data, the same transformation must be applied to the data prior to using the
discriminant functions for classification. The formula of transformation and the
transformation vectors are as follows;
T Xi-XiXi =------Si
where Xi and Xi (i: 1, 2,'" ...... "', 24) are original and transformed character values,
respectively.
Transformation vectors:
Character No. 1 2 3 4 5 6 7 8 9 10X 22.8 24.2 26.3 28.3 29. 1 28.6 27.8 27.7 27.4 26. 7s 4.00 3.23 2.34 2.00 2.42 2.47 1. 94 1. 67 1. 41 1.11
_.._-,.,-,---_..,--_.~- -_.~-_._- -~_.,.-
Character No. 11 12 13 14 15 16 17 18 19 20x 25.0 23.2 101 79 89 104 161 216 250 244s 2. 26 3.54 138.2 106.3 109.2 96.3 117.0 200.3 225.5 193.7
Character No. 21 22 23 24x 223 198 160 126s 138.2 134.0 167.3 155. :3
------,-,-.'------- --"------~-----_.._._".,.- -----_._..,--
In order to check the validity of the method the 115 stations that made up the 9
groups were reclassified using discriminant functions. The number of misplacement
cases is the following 6, or about 5%, which is nearly the same as in the previous
514
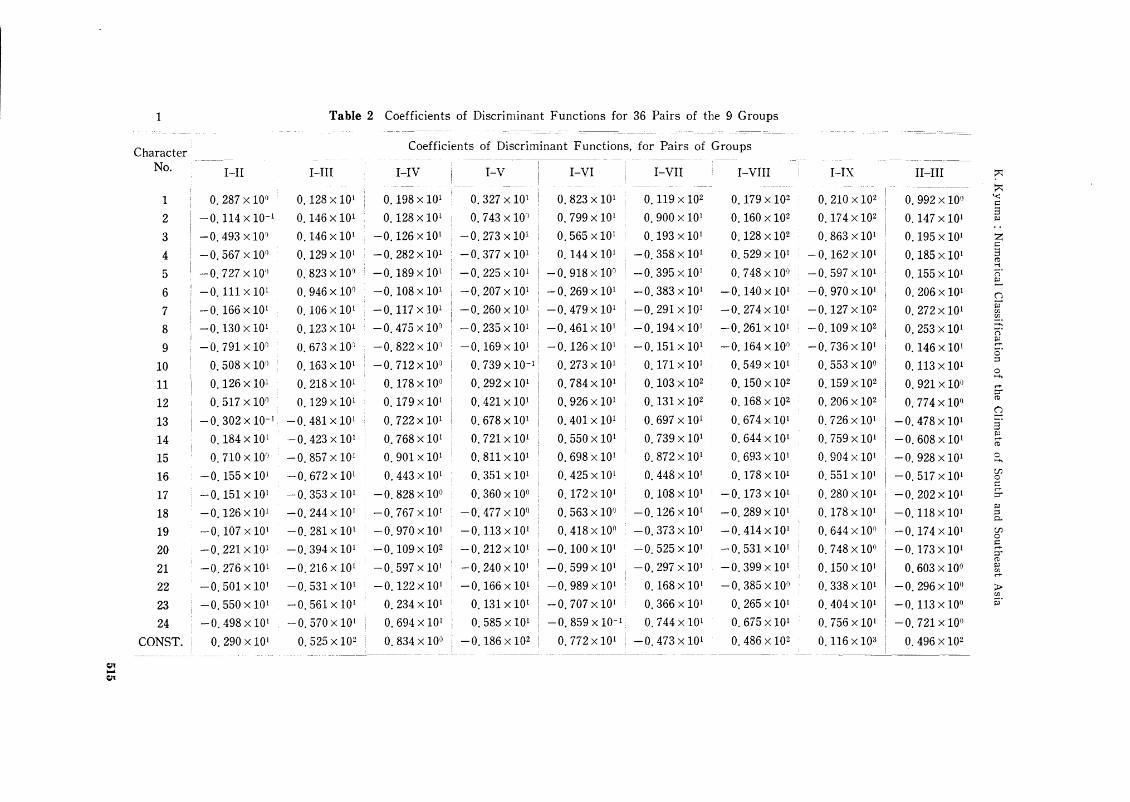
1 Table 2 Coefficients of Discriminant Functions for 36 Pairs of the 9 Groups
Character Coefficients of Discriminant Functions, for Pairs of Groups
No. I-II I-III I-IV I-V I-VI I-VII I-VIII I-IX II-III ~
---------- ::<1 0.287 x 10° 0.128 X 101 0.198 X 101 0.327 X 101 0.823 X 101 0.119 X 10² 0.179 X 10² 0.210 X 10² 0.992 x 10° '<c
2 -0.114 X 10⁻¹ 0.146 X 101 0.128 X 101 0.743 x 10° 0.799 X 101 0.900 X 101 0.160 X 10² 0.174 X 10² 0.147 X 101 3""..
3 -0.493 X 10' 0.146 X 101 -0.126 X 101 -0.273 X 101 0.565 X 101 0.193 X 101 0.128 X 10² 0.863 X 101 0.195 X 101 ZC
4 -0.567 x 10° 0.129 X 101 -0.282 X 101 -0.377 X 101 0.144 X 101 -0.358 X 101 0.529 X 101 -0.162 X 101 0.185 X 101 3(l)....
5 -0.727 X 101) 0.823 X 10" -0.189 X 101 -0.225 X 101 -0.918 x 10° -0.395 X 101 0.748 X 10" -0.597 X 101 0.155 X 101 n'
e:.6 -0.111 x 101 0.946 x 10° -0.108 X 101 -0.207 X 101 -0.269 X 101 -0.383 X 101 -0.140 X 101 -0.970 X 101 0.206 X 101 n
7 -0.166 X 101 0.106 X 101 -0.117 X 101 -0.260 X 101 -0.479 X 101 -0.291 X 101 -0.274 X 101 -0.127 X 10² 0.272 X 101 r;lUl
~.
8 -0.130 X 101 0.123 X 101 -0.475 x 10° -0.235 X 101 -0.461 X 101 -0.194 X 101 -0.261 X 101 -0.109 X 10² 0.253 X 101 >-+,
(i'
""9 -0.791 x 10° 0.673 X 10; -0.822 X 10') -0.169 X 101 -0.126 X 101 -0.151 X 101 -0.164 x 10° -0.736 X 101 0.146 X 101 .....o'
10 0.508 x 10° 0.163 X 101 -0.712 x 10° 0.739 X 10⁻¹ 0.273 X 101 0.171 X 101 0.549 X 101 0.553 x 10° 0.113 X 101 ::l
0
0.126 X 101 0.178 x 10° 0.292 X 101 0.784 X 101 0.103 X 10² 0.150 X 10² 0.159 X 10²>-+,
11 0.218 X 101 0.921 x 10° .....::r-
12 0.517 x 10° 0.129 X 101 0.179 X 101 0.421 X 101 0.926 X 101 O. 131 X 102 0.168 X 10² 0.206 X 10² 0.774 x 10°(l)
-0.302 X 10⁻¹ -0.481 X 101 0.722 X 101 0.678 X 101 0.401 X 101 0.697 X 101 0.674 X 101 0.726 X 101 -0.478 X 101Q
13 S·14 0.184 x lOt -0.423 X 101 0.768 X 101 0.721 X 101 0.550 X 101 0.739 X 101 0.644 x lOt 0.759 X 101 -0.608 X 101 ~
(l)
15 0.710 x 10° -0.857 X 101 0.901 X 101 0.811 X 101 0.698 x lOt 0.872 X 101 0.693 X 101 0.904 X 101 -0.928 X 101 0>-+,
16 -0.155 x 101 -0.672 X 101 0.443 X 101 0.351 X 101 0.425 x lOt 0.448 X 101 0.178 X 101 0.551 X 101 -0.517 X 101 UJ0c
17 -0.151 x 101 -0.353 X 101 -0.828 x 10° 0.360 x 10° 0.172 X 101 0.108 X 101 -0.173 X 101 0.280 X 101 -0.202 X 101 ;.
-0.126 X 101 -0.244 X 101 -0.767 X 101 -0.477 x 10° 0.563 x 10° -0.126 X 101 -0.289 X 101 0.178 X 101 -0.118 X 101 ""18 [19 -0.107 x 101 -0.281 X 101 -0.970 X 101 -0.113 X 101 0.418 x 10° -0.373 X 101 -0.414 X 101 0.644 x 10° -0.174 X 101 UJ
0
-0.221 X 101 -0.394 X 101 -0.109 X 10² -0.212 X 101 -0.100 X 101 -0.525 X 101 -0.531 X 101 0.748 x 10° -0.173 X 101C
20 ;.(1)
21 -0.276 x 101 -0.216 X 101 -0.597 X 101 -0.240 X 101 -0.599 X 101 -0.297 X 101 -0.399 X 101 0.150 X 101 0.603 x 10° ""~22 -0.501 x 101 -0.531 x lOt -0.122 X 101 -0.166 X 101 -0.989 X 101 0.168 X 101 -0.385 x 10° 0.338 X 101 -0.296 x 10° ;>;>
Ul
23 -0.550 x 101 -0.561 X 101 0.234 x lOt 0.131 X 101 -0.707 X 101 0.366 x lOt 0.265 X 101 0.404 X 101 -0.113 x 10° iii'
24 -0.498 x 101 -0.570 x lOt 0.694 x lOt 0.585 X 101 -0.859 X 10⁻¹ 0.744 X 101 0.675 X 101 0.756 X 101 -0.721 x 10°
CONST. 0.290 x 101 0.525 X 10² 0.834 x 10° -0.186 X 10² O. 772 x 101 -0.473 X 101 0.486 X 10² 0.116 X 10³ 0.496 X 10²
~....~
c:l1....Q)
2~. __._--..
Character Coefficients of Discriminant Functions, for Pairs of Groups
No. II-IV II-V II-VI II-VII II-VIII II-IX III-IV III-V III-VI
1 O. 170 X 101 0.299 X 101 0.794 X 101 0.116 X 10² 0.176 X 10² 0.207 X 10² 0.704 x 10° 0.200 X 101 0.695 X 101
2 0.129 X 101 0.754 x 10° 0.800 X 101 0.901 X 101 0.160 X 10² 0.174x10² -0.181 x 10° -0.721 x 10° 0.652 X 101
3 -0.766 x 10° -0.224 X 101 0.615 X 101 0.242 X 101 0.133 X 10² 0.913 X 101 -0.272 X 101 -0.419 X 101 0.420 X 101
4 -0.225 X 101 -0.321 X 101 0.201 X 101 -0.301 X 101 0.586 X 101 -0.106 X 101 -0.411 X 101 -0.506 X 101 0.153 x 10°
5 -0.117 X 101 -0.152 X 101 -0.191 x 10° -0.322 X 101 0.147 X 101 -0.524 X 101 -0.272 X 101 -0.307 X 101 -0.174 X 101
6 0.326 X 10⁻¹ -0.958 x 10° -0.157 X 101 -0.272 X 101 -0.290 x 10° -0.858 X 101 -0.203 X 101 -0.302 X 101 -0.363 X 101
7 0.489 x 10° -0.938 x 10° -0.313 X 101 -0.125 X 101 -0.108 X 101 -0.110 X 10² -0.223 X 101 -0.366 X 101 -0.585 X 101
*8 0.826 x 10° -0.105 X 101 -0.331 X 101 -0.641 x 10° -0.131 X 101 -0.956 X 101 -0.171 X 101 -0.358 X 101 -0.585 X 101 ~.
3:9 -0.307 X 10⁻¹ -0.898 x 10° -0.473 x 10° -0.714 x 10° 0.627 x 10° -0.657 X 101 -0.149 X 101 -0.236 X 101 -0.194 X 101 ~
\:.
10 -0.122 X 101 -0.433 x 10° 0.222 X 101 0.120 X 101 0.498 X 101 0.462 X 10⁻¹ -0.235 X 101 -0.156 X 101 0.110 X 101 '-i~
11 -0.108 X 101 0.166 X 101 0.657 X 101 0.906 X 101 0.137 X 10² 0.147 X 10² -0.200 X 101 0.740 x 10° 0.565 X 101~
12 0.127 x 101 0.369 X 101 0.874 X 101 0.126 X 10² 0.163 X 10² 0.201 X 10² 0.497 x 10° 0.291 X 101 0.797 X 101
13 0.725 x 101 0.681 X 101 0.404 X 101 0.700 X 101 0.677 X 101 0.729 X 101 0.120 X 10² 0.116 X 10² 0.881 X 101 <D
rf.*14 0.583 x 101 0.537 X 101 0.366 X 101 0.555 X 101 0.459 X 101 0.575 X 101 0.119 X 10² 0.114 X 10² 0.974 X 101
"'"'15 0.830 x 101 0.740 X 101 0.627 X 101 0.801 X 101 0.622 X 101 0.833 X 101 0.176 X 10² 0.167 X 10² 0.155 X 10² lo~:
16 0.598 x 101 0.506 X 101 0.580 X 101 0.603 X 101 0.333 X 101 0.707 X 101 0.112 X 10² 0.102 X 10² 0.120 X 10²
17 0.680 x 10° 0.187 X 101 0.323 X 101 0.259 X 101 -0.220 x 10° 0.431 X 101 0.270 X 101 0.389 X 101 0.525 X 101
18 -0.641 x 101 0.785 x 10° 0.182 X 101 0.312 X 10⁻³ -0.162 X 101 0.305 X 101 -0.523 X 101 0.196 X 101 0.300 X 101
19 -0.863 x 101 - O. 535 X 10-1 0.149 X 101 -0.266 X 101 -0.307 X 101 0.172 X 101 -0.689 X 101 0.168 X 101 0.323 X 101
20 -0.869 X 101 0.923 X 10⁻¹ 0.121 X 101 -0.304 X 101 -0.310 X 101 0.296 X 101 -0.696 X 101 0.182 X 101 0.294 X 101
21 -0.322 x 101 0.363 x 10° -0.323 X 101 -0.213 x 10° -0.123 X 101 0.426 X 101 -0.382 X 101 -0.240 x 10° -0.383 X 101
22 0.379 x 101 0.335 X 101 -0.488 X 101 0.669 X 101 0.463 X 101 0.839 X 101 0.409 X 101 0.365 X 101 -0.458 X 101
23 0.784 x 101 0.680 X 101 -0.157 X 101 0.916 X 101 0.815 X 101 0.953 X 101 0.795 X 101 0.692 X 101 -0.146 X 101
24 0.119 x 10² 0.108 X 10² 0.489 X 101 0.124 X 10² 0.117 X 10² 0.125 X 10² 0.126 X 10² 0.116 X 10² 0.562 X 101
CONST. -0.207 x 101 -0.215 X 10² 0.482 X 101 -0.764 X 101 0.457 X 10² 0.113 X 10³ -0.517 X 10² -0.711 X 10² -0.448 X 10²
3----_._-.--"-_.-_.. ,---_.•.--- ..--,,--------
a.~a\...l,.\,.....1.
Coefficients of Discriminant Functions, for Pairs of Groups
No. III-VII III-IX IV-V IV-VI IV-VII IV-VIII IV-IX V-VI ~
--_.. " ..... ,_., .....---. --_..- .._--~
1 0.106 X 10² 0.166 X 10² 0.198 X 10² 0.129 X 101 0.625 X 101 0.992 X 101 0.159 X 10² 0.191 X 10² 0.495 X 101 '<:.::
2 0.754 X 101 0.146 X 10² 0.159 X 10² -0.540 x 10° 0.670 X 101 0.772 X 101 0.148 X 10² 0.161 X 10² 0.724 X 101 S$I>..
3 0.471 x 100 0.114 X 10² 0.718 X 101 -0.147 X 101 0.691 X 101 0.319 X 101 0.141 X 10² 0.989 X 101 0.838 X 101 Z~
4 -0.486 X 101 0.400 X 101 -0.291 X 101 -0.956 x 100 0.426 X 101 -0.756 x 10° 0.811 X 101 0.120 X 101 0.522 X 101 Sro
-0.747xlO-11 -0.679x101
...5 -0.477 X 101 -0.354 x 100 0.976 x 100 -0.205 X 101 0.264 X 101 -0.407 X 101 0.133 X 101 n'
E..6 -0.478 X 101 -0.235 X 101 -0.106 X 10² -0.990 x 100 -0.161 X 101 -0.275 X 101 -0.322 x 100 -0.862 X 101 -0.616 x 100 n
7 -0.397 X 101 -0.380 X 101 -0.137 X 10² -0.143 X 101 -0.362 X 101 -0.174 X 101 -0.157 X 101 -0.115 X 10² -0.219 X 101 Pi"en~ .
8 -0.317 X 101 -0.384 X 101 -0.121 X 10² -0.187 X 101 -0.414 X 101 -0.147 X 101 -0.213 X 101 -0.104 X 10² -0.227 X 101 ......n'$I>
9 -0.218 X 101 -0.837 x 100 -0.803 X 101 -0.868 X 10) -0.443 x 100 -0.684 x 100 0.658 x 100 -0.654 X 101 0.425 x 100 M-
o'10 0.720 X 10⁻¹ 0.385 X 101 -0.108 X 101 0.786 x 100 0.344 X 101 O. 242x 101 0.620 X 101 0.127 X 101 0.266 X 101 ::s
0
0.137 X 10² 0.274 X 101 0.766 X 101 0.101 X 10² 0.148 X 10²......
11 0.814 X 101 0.128 X 10² 0.157 X 10² 0.491 X 101 ;.12 0.118 x 10² 0.155 X 10² 0.193 X 10² 0.242 X 101 0.747 X 101 0.113 X 10² 0.150 X 10² 0.188 X 10² 0.505 X 101 ro
013 0.118 x 10² 0.116 X 10² 0.121 X 10² -0.441 x 100 -0.322 X 101 -0.255 x 10° -0.480 x 100 0.377 X 10⁻¹ -0.278 X 101 S·14 0.116 x 10² 0.107 X 10² 0.118 X 10² -0.465 x 100 -0.218 X 101 -0.286 x 100 -0.124 X 101 -0.878 X 10⁻¹ -0.171 X 101 ~
ro
15 0.173 x 10² 0.155 X 10² 0.176 X 10² -0.897 x 100 -0.204 X 101 -0.292 x 100 -0.208 X 101 0.303 X 10- 1 -0.114 X 101 0......
16 0.112 x 10² 0.850 X 101 0.122 X 10² -0.925 x 100 -0.183 x 100 0.498 X 10⁻¹ -0.266 X 101 0.108 X 101 0.742 x 10° UJ0~
17 0.460 x 101 0.180 X 101 0.633 X 101 0.119 X 101 0.255 X 101 0.191 X 101 -0.900 x 100 0.363 X 101 0.136 X 101 ;.
18 0.118 x 101 -0.445 x 10° 0.422 X 101 0.720 X 101 0.824 X 101 0.641 X 101 0.479 X 101 0.946 X 101 0.104 X 101$I>::sp..
19 -0.919 x 10° -0.133 X 101 0.345 X 101 0.857 X 101 0.101 X 10² 0.597 X 101 0.556 X 101 0.103 X 10² 0.155 X 101 UJ0
-0.131 X 101 -0.137 X 101 0.469 X 101 0.878 X 101 0.990 X 101 0.565 X 101 0.558 X 101 0.116 X 10² 0.112x 101~
20 M-
::r'
0.358 X 101 -0.150 X 10⁻¹ 0.300 X 101 0.198 X 101 0.747 X 101ro
21 -0.816 x 10° -0.183 X 101 0.366 X 101 -0.359 X 101 $I>
~
22 0.699 x 101 0.492 X 101 0.868 X 101 -0.440 x 10° -0.867 X 101 0.290 X 101 0.834 X 10') 0.460 X 101 -0.823 X 101 ;J;>(fJ
23 0.927 x 101 0.826 X 101 0.965 X 101 -0.103 X 101 -0.941 X 101 0.132 X 101 0.315 x 10° 0.170 X 101 -0.837 X 101 iii'
24 0.131 x 10² 0.125 X 10² 0.133 X 10² -0.109 X 101 -0.702 X 101 0.499 x 100 -0.186 x 10° 0.625 x 100 -0.594 X 101
CONST. -0.572 x 10² -0.390 X 101 0.633 X 10² -0.194 X 10² 0.689 X 101 -0.557 X 101 0.478 X 10² 0.115 X 10³ 0.263 X 10²
01......:l
CoIl....00
4
Character Coefficients of Discriminant Functions, for Pairs of Groups
No.-----"--_.~--- ----._--.---------_.------ .. _- ----~~-_._-_._._--
V-VII V-VIII V-IX VI-VII VI-VIII VI-IX VII-VIII VII-IX VIII-IX------ ------- ---- ---_.-.- -
1 0.863 X 101 0.146 X 10² 0.178 X 10² 0.368 X 101 0.963 X 101 0.128 X 10² 0.596 X 101 0.913 X 101 0.317 X 101
2 0.826 X 101 0.153 X 10² 0.166 X 10² 0.101 X lOt 0.805 X 101 0.938 X 101 0.704 X 101 0.837 X 101 0.133 X 101
3 0.466 X 101 0.156 X 10² 0.114 X 10² -0.372 X 101 0.717 X 101 0.298 X 101 0.109 X 10² 0.671 X 101 -0.419 X 101
4 0.200 x 10~ 0.907 X 101 0.215 X 101 -0.502 X 101 0.385 X 101 -0.307 X 101 0.887 X 101 0.195 X 101 -0.692 X 101
5 -0.170 X 10 1 0.300 X 10 1 -0.372 X 10 1 -0.303 X 101 0.167 X 10 1 -0.505 X 101 0.470 X 10 1 -0.202 X 10 1 -0.671 X 10 1
6 -0.177 X lOt 0.669 x 10° -0.763 X 101 -0.115 X 101 0.128 X lOt -0.701 X 101 0.243 X 101 -0.586 X 101 -0.829 X 101
7 -0.313 x 10° -0.141 X 10" -0.101 X 10² 0.188 X lOt 0.205 X 101 -0.786 X 101 0.173x100 -0.974x101 -0.991 X 101
1:.8 0.406 x 10° -0.259 X 10° -0.851 X 101 0.267 X 101 0.201 X 101 -0.624 X 101 -0.665 x 10° -0.892 X 101 -0.825 X 101
~.
3ili9 0.184 x 10° 0.153 X 101 -0.567 X 101 -0.241 X 10° 0.110 X 101 -0.609 X 101 0.134 X 101 -0.585 X 101 -0.719 X lOt "\
'("
10 0.163 X lOt 0.541 X 101 0.479 X 10° -0.103 X 101 0.276 X 101 -0.218 X 101 0.378 X 101 -0.115 X 101 -0.493 X 101 "l
~11 0.740 X 101 O. 121 X 102 0.130 X 10² 0.249 X 101 0.714 X 101 0.806 X 101 0.465 X 101 0.557 X 101 0.920 X 10') ~~
12 0.886 x lOt 0.126 X 10² 0.164 X 10² 0.381 X 101 0.753 X 101 0.114 X 10² 0.372 X 101 0.757 X 101 0.385 X 101
13 0.186 X 10n -0.392 X 10⁻¹ 0.479 x 10° 0.296 X 101 0.274 X 101 0.325 X 101 -0.225 x 10° 0.293 x 10° 0.518 x 10° <.0
[~14 0.179 x 10n -0.777 x 10° 0.377 X 10' 0.189 X 101 0.933 x 10° 0.209 X 101 -0.956 x 10° 0.198 x 10° 0.115 X 101
~
15 0.605 x 10° -0.119 X 101 0.927 X 10" 0.174 X 101 -0.470 X 10⁻¹ 0.207 X 101 -0.179 X 101 0.322 x 10° 0.211 X 101 c,:
16 0.974x10o -0.173 x 101 0.201 X lOt 0.233 x 10° -0.247 X 101 0.127 X 101 -0.271 X 101 0.103 X 101 0.374 X 101
17 0.719 x 10° -0.209 X 101 0.244 X 101 -0.641 x 10° -0.345 X lOt 0.108 X 101 -0.281 X 101 0.172 X lOt 0.453 X 101
18 -0.784 x 10° -0.241 X 101 0.226 X 101 -0.182 X 101 -0.345 X 101 0.122 X 101 -0.162 X 101 0.305 X 101 0.467 X 101
19 -0.260 x lOt -0.301 X 101 0.177 X 101 -0.415 X 101 -0.456 X 101 0.225 x 100 -0.412 x 10° 0.437 X 101 0.478 X 101
20 -0.313 X 101 -0.319 X lOt 0.287 X 101 -0.425 X 101 -0.431 X 101 0.175 X 101 -0.633 X 10- t 0.600 X 101 0.606 X 101
21 -0.576 x 101] -0.159 X 101 0.390 X 101 0.302 X 101 0.200 X 101 0.749 X 101 -0.102 X 101 0.447 X 101 0.549 X 101
22 0.334 x 101 0.127 X 101 0.504 X 101 0.116 X 10² 0.951 X lOt 0.133 X 10² -0.206 X 101 0.170 X 101 0.376 X 101
23 0.235 x 101 0.135 X 101 0.273 X 101 0.107 X 10² 0.972 X 101 0.111 X 10² -0.100 X 101 0.377 x 100 0.138 X 101
24 0.158 x 101 0.900 x 100 0.171 X 101 0.752 X 101 0.684 X 101 0.765 X 101 -0.685 x 10° 0.126 X 101] 0.811 X 10'1
CONST. O. 138 x 102 0.672 X 10² 0.134 X 10³ -0.125 X 10² 0.409 X 10² 0.108 X 10³ 0.533 X 10² 0.121 X 10³ 0.672 X 10²

K. Kyuma : Numerical Classification of the Climate of South and Southeast Asia
study with the Japanese climate;
Grouping by
Station No. N. T. D. F.
40 II I
51 III II
~ll IV V
98 I V
1:l() V VII
152 VII IX
As can be seen from the result of computation, these are on the border between the
two groups concerned; thus, classification by means of discriminant functions appears
to work satisfactorily. Accordingly, the method was applied to the rest of the stations,
including the 10 stations that remain unclassified in the numerical taxonomy, and the
result as shown in the last column of Table 1, was plotted on a map. Except for the
Philippines, stations belonging to one group are so well clustered geographically that
delineation of a climatic region as the mappable equivalent of the group is quite easy.
Thus, the following 9 climatic regions, which correspond to the 9 groups, were deline
ated on a map, as shown in Fig. 4;
Group I Strait-Sunda Region
Group II Malay-Northern Borneo Region
[) HXlOkrnI ,
4oo
Fig. 4 A Map showing the Climatic Regional Division
519
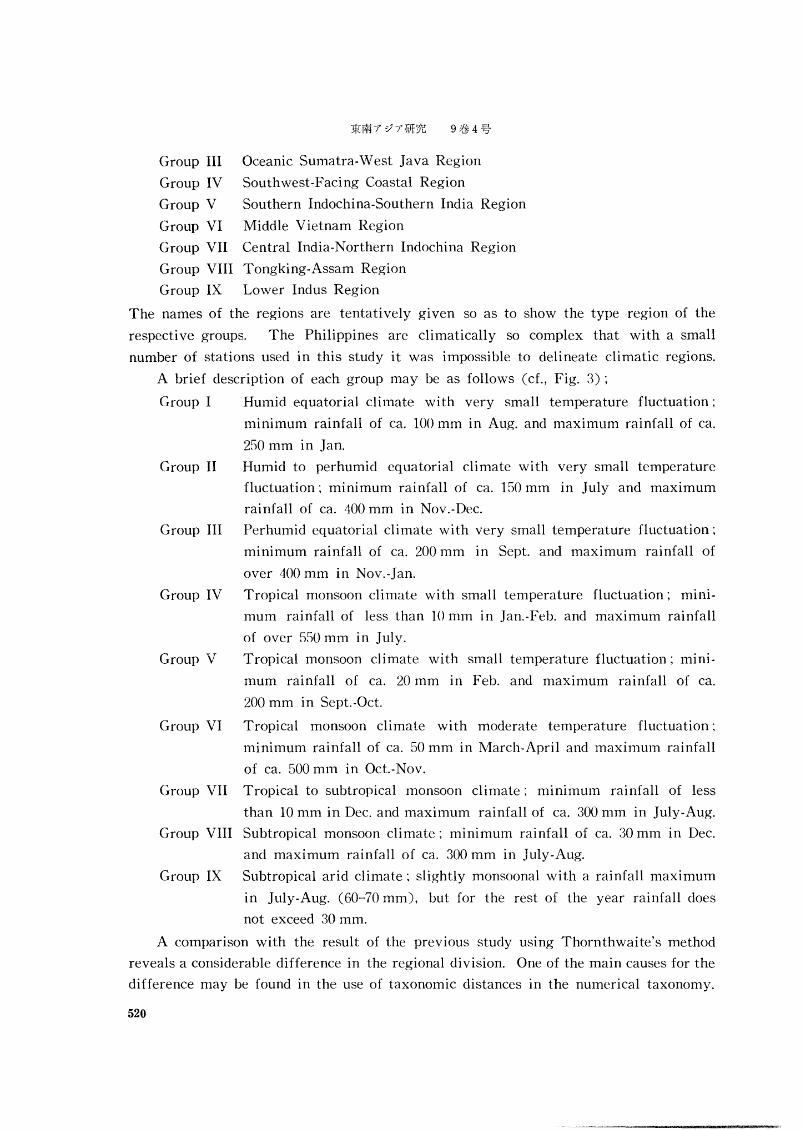
Group III Oceanic Sumatra-West Java Region
Group IV Southwest-Facing Coastal Region
Group V Southern Indochina-Southern India Region
Group VI Middle Vietnam Region
Group VII Central India-Northern Indochina Region
Group VIII Tongking-Assam Region
Group IX Lower Indus Region
The names of the regions are tentatively given so as to show the type region of the
respective groups. The Philippines are climatically so complex that with a small
number of stations used in this study it was impossible to delineate climatic regions.
A brief description of each group may be as follows (d., Fig. 3);
Group I Humid equatorial climate with very small temperature fluctuation;
minimum rainfall of ca. 100 mm in Aug. and maximum rainfall of ca.
2S0 mm in Jan.
Group II Humid to perhumid equatorial climate with very small temperature
fluctuation; minimum rainfall of ca. 150 mm in July and maximum
rainfall of ca. 400 mm in Nov.-Dec.
Group III Perhumid equatorial climate with very small temperature fluctuation;
minimum rainfall of ca. 200 mm in Sept. and maximum rainfall of
over 400 mm in Nov.-Jan.
Group IV Tropical monsoon climate with small temperature fluctuation; mini
mum rainfall of less than 10 mm in Jan.-Feb. and maximum rainfall
of over SSO mm in July.
Group V Tropical monsoon climate with small temperature fluctuation; mini
mum rainfall of ca. 20 mm in Feb. and maximum rainfall of ca.
200 mm in Sept. -Oct.
Group VI Tropical monsoon climate with moderate temperature fluctuation;
minimum rainfall of ca. 50 mm in March-April and maximum rainfall
of ca. 500 mm in Oct.-Nov.
Group VII Tropical to subtropical monsoon climate; minimum rainfall of less
than 10 mm in Dec. and maximum rainfall of ca. 300 mm in July-Aug.
Group VIII Subtropical monsoon climate; minimum rainfall of ca. 30 mm in Dec.
and maximum rainfall of ca. 300 mm in July-Aug.
Group IX Subtropical arid climate; slightly monsoonal with a rainfall maximum
in July-Aug. (60-70 mm), but for the rest of the year rainfall does
not exceed 30 mm.
A comparison with the result of the previous study using Thornthwaite's method
reveals a considerable difference in the regional division. One of the main causes for the
difference may be found in the use of taxonomic distances in the numerical taxonomy.
520

K. Kyuma : Numerical Classification of the Climate of South and Southeast Asia
A slight difference in the pattern of rainfall in a year is neglected in the present result.
The so-called summer rain and winter rain regions are not adequately expressed unless
the difference in rainfall by seasons is prominent. Another cause may be found in
insensitivity of Thornthwaite's method to temperature differences. As the lower
threshold for the thermal efficiency class A' has been set too low, all the lowland of
the wide region is classified into one thermal efficiency class. The differences such as
found between group V and VII and VII and VIII in the present study has been
overlooked in Thornthwaite's method.
In order to utilize the climatic regions as the basis of classifying alluvial soils,
they have to be characterized in relation to the soil processes, and the type and
performance of vegetations. This task has not been undertaken in this present work
and is left to a later study. The method of canonical analysis seems to be a useful
tool for such a study.
Summary
The method of numerical taxonomy in combination with discriminant function has
been proven useful in setting up readily mappable climatic regions. Nine regions have
thus been established for the rice-growing South and Southeast Asia, as shown in
Fig. 4. The mean monthly temperatures and rainfalls are illustrated in Fig. 3 for the
sample stations belonging to each region. Climatic features of each region have been
briefly descri bed.
Acknowledgement
The author wishes to express gratitude to Misses F. Imanaka and E. Shimizu for
their help in the course of data processing and manuscript writing.
References
1) Kyuma, K. 1971. "Climate of South and Southeast Asia according to Thornthwaite's Classification
Scheme," Tonan Ajia Kenkyu, Vol. 9, No. 1, pp. 136-158.
2) . "Numerical Classification of Climate, I. The Method and Its Application to the
Climate of Japan," Soil Sci. & Plant Nutr. (in preparation).
3) Sokal, R. R. & Sneath, P. H. A. 1963. Principles of Numerical Taxonomy, Freeman & Co., San
Francisco, pp. 359.
521


![v? 3 ix • -r ^f ^E- >- • t> >f s/ ^ :* T — K (John Ajia kenkyu: Watakushi …c1180008.ferozo.com/pdf/207.pdf · 2018-03-06 · lieux,] la fille 1'apercevait souvent, mais lui,](https://img.dokumen.tips/doc/110x75/5fb48b7afaedfe62415b1d04/v-3-ix-a-r-f-e-a-t-f-s-t-a-k-john-ajia-kenkyu-watakushi.jpg)
![Bibliography - link.springer.com978-0-230-60992-1/1.pdf · Bibliography A. Primary Sources 1. Archives Ajia Rekishi Shiryo- Sent-a- [Japan Center for Asian Historical Records], Tokyo,](https://img.dokumen.tips/doc/110x75/5e1322ff5d00cd0f791fd404/bibliography-link-978-0-230-60992-11pdf-bibliography-a-primary-sources-1.jpg)