Embed Size (px)
Citation preview

Title Estimation of gas and liquid slug lengths for T-shapedmicroreactors
Author(s) Miyabayashi, K.; Tonomura, O.; Hasebe, S.
Citation Chemical Engineering Journal (2015), 262: 1137-1143
Issue Date 2015-02-15
URL http://hdl.handle.net/2433/192768
Right © 2014 Elsevier B.V.
Type Journal Article
Textversion author
Kyoto University

1
Estimation of Gas and Liquid Slug Lengths for T-shaped Microreactors
K. Miyabayashi, O. Tonomura*, S. Hasebe
Process Control & Process Systems Engineering Laboratory
Department of Chemical Engineering
Kyoto University
A4- 120, Katsura Campus, Nishikyo, Kyoto, 615-8510, Japan
Tel: +81-(0)75-383-2637
Fax: +81-(0)75-383-2657
http://www-pse.cheme.kyoto-u.ac.jp/index-e.htm
*Email: [email protected]
Abstract
Microreactors with gas-liquid slug flow have an advantage over the conventional batch reactors
in mass transfer between mutually immiscible fluids because of the internal circulation flow

2
within the liquid slug. To realize stable long-term operation of microreactors with gas-liquid
slug flow, the slug lengths in the microreactors have to be monitored and controlled, because
they influence mass transfer performance. In this study, an experimental investigation is carried
out to analyze the formation of gas-liquid slug flow in a T-shaped microreactor. The
experimental result shows that the pressures in gas and liquid feeding tubes connected to the
microreactor oscillate periodically along the formation of a pair of gas and liquid slugs. Based
on this result, a method for estimating slug lengths from feed pressure measurements is
developed. The method is non-invasive and does not affect slug formation or the manner of
gas-liquid slug flow. Its effectiveness was assessed through experimental case studies using
T-shaped microreactors having different gas-liquid confluence angles and different gas and
liquid flow rates. The relative root mean square errors of estimated slug lengths were within 2%
for one minute operation. The results clearly show that the proposed method can be applied to
the real time monitoring of slug lengths.
Keywords: Microreactor; Gas-liquid slug flow; Slug length estimation; Process monitoring
3
1. Introduction
Microreactors with micro/millimeter wide tubes or channels can realize short residence time as
well as high mass and heat transfer rates. Recently, microreactors with multi-phase flow have
attracted researchers’ and engineers’ attention by their unique flow characteristics. For example,
when two mutually immiscible fluids, such as gas and liquid, are simultaneously fed into a
microchannel, various flow patterns such as annular, dispersed and slug flows are generated as
to the design and operating conditions [1]. Among these, slug flow, also called Taylor flow or
segmented flow, is especially attractive for its small residence time distribution and large
interface area per fluid volume [2]. In addition, rapid mass transfer between two phases is
achieved because the liquid interface is constantly renewed by the circulation flow inside the
liquid slug [3]. As the examples of applications of T-shaped microreactors with gas-liquid slug
flow, Yasukawa et al. [4] reported that a space-time yield of the oxidation of ethyl lactate for
producing ethyl pyruvate in microreactors was ten-times larger than that in conventional
reactors. Takebayashi et al. [5] reported that the direct carbonylation of nitrobenzene to
phenylisocynate was conducted by using T-shaped microreactors with gas-liquid slug flow, and
the isocyanate yield in microreactor was three to six times higher than that in the batch reactor.

4
In addition to the extensive basic research on microreactors with gas-liquid slug flow has been
conducted, researches on the systematic design methods are important. For example, it is
necessary to develop design and operation methods of mixers that can generate slug flows with
desired slug lengths, because the slug length is one of the important state variables that affect
mass transfer between two different phases [6]. Garstecki et al. [7] presented a quasi-static
model for slug formation in a T-shaped micromixer, composed of rectangular microchannels and
derived the scaling law for the estimation of slug length. According to Garstecki's law, the gas
and liquid slug lengths formed in T-shaped micromixer are estimated by the following
equations:
LG/D = + QG/QL (1)
where LG is the gas slug length, D is the equivalent inner diameter of the microchannel, and QG
and QL are flow rates of gas and liquid fed into the T-shaped micromixer. and are
parameters that depend on the fluid properties, surface properties of the channels and the
channel sizes. To predict the formed slug sizes, many researchers have presented models based
on Garstecki's law and have determined and by using computational fluid dynamics
simulations or experiments for various mixing geometries and fluid properties [8, 9, 10, 11, 12].
By using the models based on Garstecki's law, the channel sizes are designed to generate slug
flows with desirable slug lengths.

5
The design of flow distributors that can achieve a uniform flow distribution among the
parallelized microchannels is also important for large scale production, because non-uniformity
in the flow distribution causes variation from the prescribed reaction time and results in a
decrease in the product yield. Al-Rawashdeh et al. [13, 14] developed a gas-liquid reactor with
modular flow distributors and parallelized channels. The reactor is made of steel and has an
inspection window to visualize the slug flows. Matsuoka et al. [15] developed a stacked
multi-channel reactor (SMCR®), which is composed of stacked stainless steel plates with
parallelized microchannels and flow distributors. SMCR® realizes the 3-dimentional
parallelization of microchannels and can be applied to industrial-scale production. Both
above-mentioned distributors have manifold structure. Yue et al. [16] developed a parallel
microchannel contactor integrated with two constructal flow distributors. As a distributor, they
adopted not the manifold structure but the dichotomous branching structure. To observe the flow
condition, the contactor is made of transparent photosensitive epoxy resin.
In addition to the design methods for micromixers and flow distributors, a process monitoring
method needs to be developed to realize stable long-term operation of microreactors, because
abnormal conditions such as the deposition of solid on the surface of microchannels are likely to

6
occur. Such disturbances affect the physical condition of the microchannels, and change the slug
lengths to undesired values. Thus, for a long period operation, process monitoring systems that
can detect such unacceptable condition are necessary. Optical methods [17, 18] and electrical
methods [19] have been proposed as the measuring methods of void fraction in microchannels.
Though these methods are applicable to the monitoring of slug lengths, there are some
drawbacks. As the optical method requires the placement of the windows on the microchannels
to visualize the slug flow, it is not applicable to microreactors made of opaque materials. The
electrical method uses the electrical resistance and capacitance of fluid in the microchannels to
estimate the condition in the channel. If the device is made of electrically-conductive materials
such as stainless steel, complicated electrically-insulated placement of electrodes is required.
Hence, the objective of this research is to develop alternatives to the conventional measuring
methods of slug lengths in microchannels.
The outline of this paper is as follows: In Section 2, the relationship between the flow behavior
and pressure changes of gas and liquid feeds is discussed through experimental observation on
the gas-liquid slug flow generation in a T-MR. In Section 3, a new estimation method for slug
lengths is proposed on the basis of the experimental results shown in Section 2, and the
effectiveness of the developed estimation method is verified through several case studies.

7
2. Gas-liquid Slug Flow in T-shaped Microreactors
In several numerical and experimental studies [20, 21, 22], it is reported that the feed pressure
fluctuates according to the formation of slug flow. By considering this fact, in this research, the
feed pressure measurements are used for slug length estimation. In this section, the
characteristic points of feed pressure profiles that correspond to the formation of gas and liquid
slugs in T-junction are made clear by using experimental data.
2.1 Experimental Setup
Figure 1 shows an experimental system used in this study. Pure nitrogen (gas) and distillated
water (liquid) are fed into a T-shaped microreactor (T-MR) from a gas cylinder and a pressure
tank, respectively. In this experiment, three types of micromixers shown in Figure 2 are used.
The gas flow rate is controlled by a mass flow controller (FCST-1005LC, Fujikin). The liquid
flow rate is controlled by a mass flow controller (LV-F50PO, HORIBA STEC). The control
accuracy of both controllers is ±1 % of full scale (10.0 mL/min). After gas and liquid are
contacted in the micromixer, slug flow is formed and goes through a succeeding tube. The end
of the tube is immersed in a beaker filled with water. The beaker is open to the atmosphere, and
the water level of the beaker is kept constant. The sizes and materials of tubes and micromixers

8
are summarized in Table 1. The length between the pressure sensor and the micromixer is
defined as the length of feeding tube. The micromixers are made of polymethyl methacrylate
(PMMA). The tubes (JR-T-6806-M10, VICI AG International) are made of fluorinated ethylene
propylene (FEP). All of the channels and tubes have circular cross-sections. The temperature
and pressure limits of the T-MR are 353 K, 7 kPaG.
The slug formation behavior in the micromixer is observed by high-speed video camera
(VW-6000, KEYENCE) as shown in Figure 3, and the feed pressures of gas and liquid are
measured by pressure sensors (PA-830-101G-10, NIDEC COPAL ELECTRONICS). The
linearity of pressure sensor is ±0.5 % of rated pressure (9.81 kPa). The minimum response time
of the pressure sensor is 2 milliseconds. The pressure sensors are installed to gas and liquid
feeding tubes through T-shaped adapter as shown in Figure 4. The digital fiber-optic sensor unit
(FU-L51Z, KEYENCE) is installed at near the inlet of FEP tube. In the digital fiber-optic sensor
unit, two neighboring optical probes are set along the flow direction at 4 mm interval. Using the
signals from two optical probes placed a certain interval, the two signals can be cross-correlated
to determine the time lag and then yield instantaneous superficial velocity of slug flow and slug
lengths of gas and liquid [18]. According to the obtained superficial velocity, time-varying QG
and QL are calculated. The threshold signal level for the digital fiber-optic sensor unit to

9
distinguish gas or liquid phase is determined so that the average value of QL for a minute is
equal to the set value of liquid mass flow controller. The measurements acquired from pressure
sensors and digital fiber-optic sensor unit are collected in a computer through a data logger
(NR-600, KEYENCE) at time intervals of 2 milliseconds, which is equal to the minimum
response time of the pressure sensor. For each of three types of T-MRs, data are collected at
almost steady state condition.
Figure 1. Experimental system of a single T-shaped microreactor
(i) Gas feeding tube
FCGasslug Liquid
slug
Slug length
PI
PI
Pressuredtank
(Water)(ii)
T-shapedmicromixer
Observed by camera
(iii) FEP tube
(i) Liquidfeeding tube
FC
Gas cylinder(Nitrogen)
Beaker
Digital fiber-optic sensor unit

10
Figure 2. Schematic diagrams of three types of micromixers
Figure 3. T-shaped micromixer observed by high-speed video camera
Figure 4. Pressure sensor installed to gas/liquid feeding tube
Gas
Liquid
Gas
Liquid
Liquid
Gas
(Type-A) (Type-B) (Type-C)

11
Table 1. Sizes and materials of tubes and T-shaped microreactor
Location in Fig. 1 I.D. [mm] Length [mm] Material
(i) Feeding tube 1.00 100 FEP
(ii) Micromixer 1.30 40 for all branches PMMA
(iii) Reactor tube 1.00 500 FEP
2.2 Slug Formation and Pressure Oscillation
The experimental results of T-MRs with three types of micromixers are explained in this
subsection. Figure 5 shows a photo of gas-liquid slug flow in the Type-A mixer made of PMMA,
and Figure 6 shows a photo of gas-liquid slug flow in the succedent tube made of FEP, where
QG and QL are 1.0 mL/min. As shown in Figure 5, all of gas slugs in the PMMA mixer have
hemispherical caps and cylindrical bodies. However, as shown in Figure 6, all of gas slugs in
FEP tube have no liquid film [23], and the shapes are almost cylindrical. This is because FEP
has hydrophobic property. Figure 6 shows that the pressures at gas and liquid feed flows of the
T-MR with Type-A mixer. Both pressures oscillate periodically and the oscillation phases of gas
and liquid pressures have a half cycle difference. For clearly observing the profile of gas and
liquid pressure measurements, smoothed lines obtained by the Savitzky-Golay filter [24] are
shown in black lines.

12
Figure 8 shows the gas-liquid slug formation behavior in Type-A mixer. Photos in Figure 8 are
taken at time A to time E in Figure 7. The gas and liquid discharge alternately from the
confluence part of the mixer into the succeeding tube. The relationship between the periodic
pressure fluctuation and the formation of gas and liquid slugs is explained as follows: During
the period between Figure 8A and just before Figure 8C, the gas penetrates to the confluence
part of the mixer, but it is still blocked by liquid flow. Thus, the gas pressure continuously
increases because gas is constantly supplied to the confluence part. At the time shown in Figure
8C, the gas occupies the confluence part, and the gas starts flowing from the confluence part to
the succeeding tube. By the flow, the pressure of the gas feeding section gradually decreases.
The flow behavior of liquid during the periods from Figure 8C to 8E is explained in a similar
manner as that of gas during the periods from Figure 8A to 8C. These phenomena are repeated
as far as gas-liquid slugs are formed.

13
Figure 5. Photo of gas-liquid slug flow in the PMMA mixer
Figure 6. Photo of gas-liquid slug flow in the FEP tube
Figure 7. Profiles of gas and liquid pressure changes: QG = QL = 1.0 mL/min, Type-A mixer
4.0
4.1
4.2
4.0
4.1
4.2
0 1 2
C D EA B
Liquid
Gas
t [s]
Liqu
id p
ress
ure
[kPa
G]
Gas
pre
ssur
e [k
PaG
]

14
Figure 8. Photos of flow behavior in Type-A mixer
A, E: Liquid blocks gas flow and starts flowing to the succeeding tube.
B: Liquid flows to the succeeding tube, and gas is penetrating to the confluence part.
C: Gas blocks liquid flow and starts flowing to the succeeding tube.
D: Gas flows to the succeeding tube, and liquid is penetrating to the confluence part.
Figures 9 and 11 show the pressure profiles of gas and liquid feed flows for Type-B and Type-C
mixers, respectively, and Figures 10 and 12 show the gas-liquid slug formation behavior in
Type-B and Type-C mixers, respectively. As shown in Figures 9 to 12, the gas and liquid
pressures oscillate periodically, and gas and liquid slugs are generated in the same manner as the
experimental results of Type-A mixer. The measured pressure profiles in three type mixers are
almost same as the profiles reported in previous studies [20, 21, 22]. In all experiments, the

15
magnitude of liquid pressure oscillation is larger than that of gas pressure oscillation, and the
profile of liquid pressure change is clearer than that of gas pressure change. This is due to the
difference of the fluid properties between gas and liquid, such as viscosity, compressibility and
wettability. Thus, the liquid pressure profile is used in the slug length estimation explained in
the next section.
Figure 9. Profiles of gas and liquid pressure changes: QG = QL = 1.0 mL/min, Type-B mixer
C D EA B
3.7
3.8
3.93.6
3.7
3.8
3.9
0 1 2
Liquid
Gas
t [s]
Liqu
id p
ress
ure
[kPa
G]
Gas
pre
ssur
e [k
PaG
]

16
Figure 10. Photos of flow behavior in Type-B mixer
Figure 11 Profiles of gas and liquid pressure changes: QG = QL = 1.0 mL/min, Type-C mixer
4.3
4.44.1
4.2
4.3
4.4
0 1 2
C D EA B
Liquid
Gas
t [s]
Liqu
id p
ress
ure
[kPa
G]
Gas
pre
ssur
e [k
PaG
]

17
Figure 12. Photos of flow behavior in Type-C mixer
3. Slug Length Estimation
An estimation method of slug lengths is proposed in this section, and the effectiveness of the
proposed method is verified through several case studies for the T-MR. Because the
experimental results of T-MRs with Type-B and C are very similar to those of T-MR with
Type-A, the experimental results of T-MR with Type-A are only shown in this section.
3.1 Estimation Method of Slug Lengths
In Section 2, it was explained that the pressure of liquid feed flow increases during the period
when the gas flows from the confluence part to the succeeding tube, and it decreases during the

18
period when the liquid flows from the confluence part to the succeeding tube. Thus, the time
from the peak of the periodic liquid pressure oscillation to the bottom of it is defined as the gas
flow period, and is expressed by tG. Similarly, the time from the bottom of the periodic liquid
pressure oscillation to the next peak is defined as the liquid flow period, and is expressed by tL.
In this research, it is assumed that the cross section area of the succeeding tube to the mixer is
constant and no liquid films exist in the tube. Under such condition, slug lengths can be
estimated by following equations:
*LG = (QG + QL) tG /A (2)
*LL = (QG + QL) tL /A (3)
where A is cross sectional area of the succeeding tube to the mixer, * *LG and L L are estimated
values of gas slug length LG and liquid slug length LL, respectively. From Eqs. (2) and (3), the
gas and liquid slug lengths can be estimated by using the feed pressure of gas or liquid and the
flow rates of gas and liquid.
3.2 Verification of Developed Estimation Method
For three cases explained in Table 2, accuracy of the proposed estimation method is evaluated.
The pressure measurements of gas and liquid feed flows for Cases 2 and 3 are shown in Figures
13 and 14, respectively. For clearly observing the profile of gas and liquid pressure

19
measurements, smoothed lines obtained by the Savitzky-Golay filter [24] are shown in black
lines. For Case 1, the pressure measurements are same as those in Figure 7 of Section 2.2.
For each case, one minute data of LG and LL are collected by digital fiber-optic sensor unit.
Because the pressure at the installed point of the digital fiber-optic sensor unit is higher than the
atmospheric pressure due to the pressure drop of slug flow in FEP tube, the gas slugs are
compressed and their lengths are shorter than those at the atmospheric pressure. Therefore, the
LG are adjusted to the values at the standard condition (273 K. 101.3 kPa) according to the gas
state equation. At the same time, one minute data of tG and tL are extracted from the feed
pressure data, and they are used to calculate * *G Land L L by Eqs. (2) and (3). The results are
summarized in Figure 15. The average values of measured and estimated gas slug lengths,
GG*and L L , and those of measured and estimated liquid slug lengths, LL
*and L L are shown in
Table 3. In addition, the relative root mean square error for * *G Land L L (RRMSEG, RRMSEL)
calculated according to Eq. (4) and (5) are also shown in Table 3:
*G, G,
GG
( )RRMSE (%)
1
100i ii L L
L N (4)
20
*L, L,
LL
( )RRMSE (%)
1
100i ii L L
L N (5)
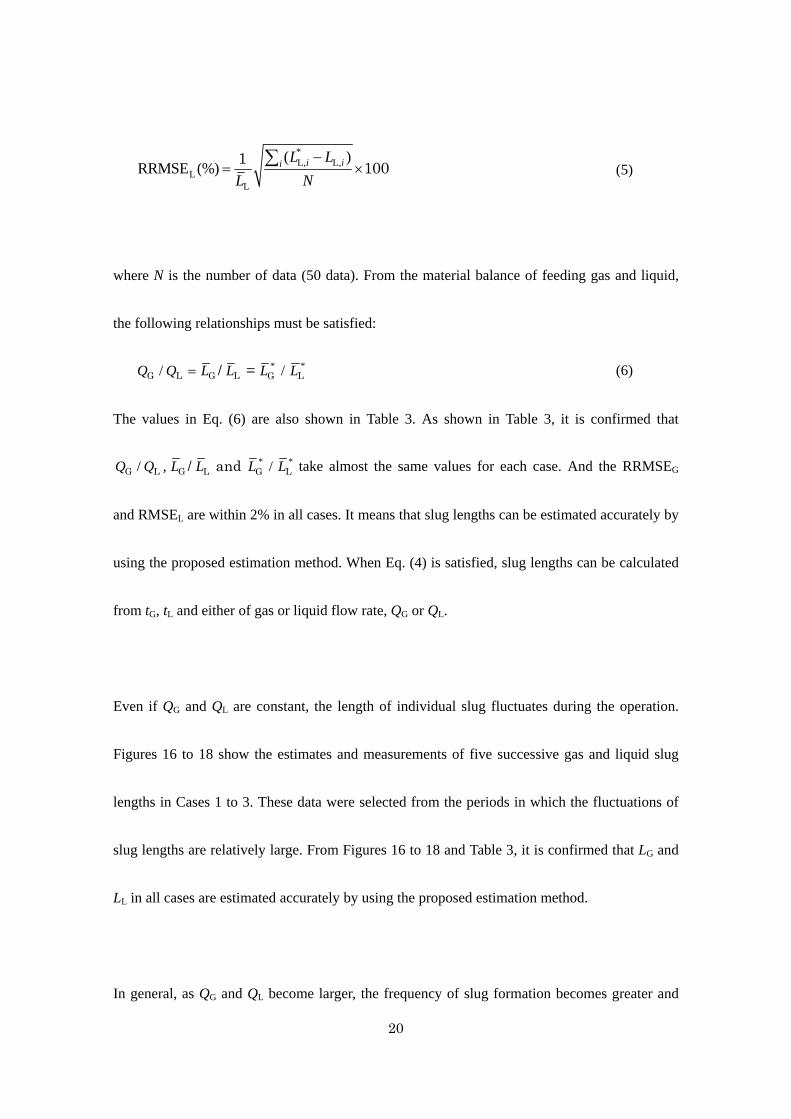
where N is the number of data (50 data). From the material balance of feeding gas and liquid,
the following relationships must be satisfied:
* */ /G L L GG L/ =Q Q L L L L (6)
The values in Eq. (6) are also shown in Table 3. As shown in Table 3, it is confirmed that
* */ , /G L LL GG / and Q Q L L L L take almost the same values for each case. And the RRMSEG
and RMSEL are within 2% in all cases. It means that slug lengths can be estimated accurately by
using the proposed estimation method. When Eq. (4) is satisfied, slug lengths can be calculated
from tG, tL and either of gas or liquid flow rate, QG or QL.
Even if QG and QL are constant, the length of individual slug fluctuates during the operation.
Figures 16 to 18 show the estimates and measurements of five successive gas and liquid slug
lengths in Cases 1 to 3. These data were selected from the periods in which the fluctuations of
slug lengths are relatively large. From Figures 16 to 18 and Table 3, it is confirmed that LG and
LL in all cases are estimated accurately by using the proposed estimation method.
In general, as QG and QL become larger, the frequency of slug formation becomes greater and

21
the tG and tL become shorter. Therefore, if the minimum response time of pressure sensor (tR) is
not sufficiently-shorter than the tG and tL, the developed estimation method is not applicable.
Considering that *LG in Eq. (2) is equal to LG, and by substituting the Eq. (2) into Eq. (1), the
following equation is obtained:
G LG
G L
/
Q QDt
A Q Q (7)
By comparing tR and tG derived by Eq. (7), the applicable upper limits of QG and QL for the
developed estimation method are determined. Assuming that QG/QL = 1, tR is 2 milliseconds and
the tenth part of tR is necessary to obtain tG from pressure data, the applicable upper limit of QG
(= QL ) is determined as 12.3 mL/min according to Eq. (7), where and are considered to be
constant with flow rates and calculated as 3.79 and 4.27 based on the experimental results in
Cases 1 to 3.

22
Figure 13. Profiles of gas and liquid pressure changes:
Case 2: QG = 1.0 mL/min, QL = 0.5 mL/min Type-A mixer
Figure 14. Profiles of gas and liquid pressure changes:
Case 3: QG = 0.5 mL/min, QL = 1.0 mL/min Type-A mixer
3.0
3.12.82.93.03.1
0 1 2
Liquid
Gas
t [s]
Liqu
id p
ress
ure
[kPa
G]
Gas
pre
ssur
e [k
PaG
]
3.3
3.4
3.53.3
3.4
3.5
0 1 2
Liquid
Gas
t [s]
Liqu
id p
ress
ure
[kPa
G]
Gas
pre
ssur
e [k
PaG
]

23
Figure 15. Estimates and measurements of gas and liquid slug lengths
Table 3. Estimates and measurements of gas and liquid slug lengths
QG/QL
* :G GL L
[mm]
RRMSEG
[%]
* :L LL L
[mm]
RRMSEL
[%] G L/ L L * */ LGL L
Case 1 1.0 11.1 : 11.0 1.8 11.1 : 11.1 1.8 1.00 0.99
Case 2 2.0 15.2 : 15.3 1.4 7.6 : 7.6 1.5 2.00 2.01
Case 3 0.5 7.6 : 7.5 1.9 15.1 : 15.2 2.0 0.50 0.49
Figure 16. Successive estimation of gas and liquid slug lengths for Case 1
Case 2Case 1
Case 3
Estimates of liquid slug length[mm]
Mea
sure
men
ts o
f liq
uid
slug
leng
th[m
m]
Estimates of gas slug length[mm]
Mea
sure
men
ts o
f gas
slu
g le
ngth
[mm
]
4
6
8
10
12
14
16
18
4 6 8 10 12 14 16 18
Case 2Case 1
Case 3
4
6
8
10
12
14
16
18
4 6 8 10 12 14 16 18
10.5
11.0
11.5
12.0
1 2 3 4 5Liquid slug number
Liqu
id s
lug
leng
th [m
m]
MeasurementsEstimates
10.5
11.0
11.5
12.0
1 2 3 4 5Gas slug number
Gas
slu
g le
ngth
[mm
]
MeasurementsEstimates
10.0 10.0

24
Figure 17. Successive estimation of gas and liquid slug lengths for Case 2
Figure 18. Successive estimation of gas and liquid slug lengths for Case 3
4. Conclusion
In microreactors with gas-liquid slug flow, the slug lengths are important design variables,
14.5
15.0
15.5
Gas
slu
g le
ngth
[mm
]
1 2 3 4 5Gas slug number
MeasurementsEstimates
Liqu
id s
lug
leng
th [m
m]
1 2 3 4 5Liquid slug number
6.5
7.0
7.5
8.0
14.0
16.0
MeasurementsEstimates
6.0
14.5
15.0
15.5
16.0
Liqu
id s
lug
leng
th [m
m]
1 2 3 4 5Liquid slug number
MeasurementsEstimates
6.5
7.0
7.5
8.5
Gas
slu
g le
ngth
[mm
]
1 2 3 4 5Gas slug number
MeasurementsEstimates
8.0
14.0

25
because they influence the mass transfer performance. In this study, from the precise
experimental investigation of T-shaped microreactor, it was made clear that the pressures in gas
and liquid feeding tubes oscillate periodically along the formation of a pair of gas and liquid
slugs. By using this fact, an estimation method of slug lengths from the measurements of feed
pressure of gas or liquid was developed, whose effectiveness was verified through several case
studies of T-shaped microreactors. By this method, the slug lengths can be monitored without
complicated processing, such as the placement of the windows and electrodes on microchannels.
In this study, a monitoring method of slug length in single channel microreactor was discussed.
The next target is to expand the proposed method to multi-channel microreactors with slug flow.
References
[1] N. Shao, A. Gavriilidis, P. Angeli, Flow regimes for adiabatic gas-liquid flow in
microchannels, Chemical Engineering Science 64 (2009) 2749-2761
[2] M. T. Kreutzer, A. Gunther, K. F. Jensen, Sample dispersion for segmented flow in
microchannels with rectangular cross section, Analytical Chemistry 80 5 (2008) 1558-1567
[3] M. N. Kashid, I. Gerlach, S. Goetz, J. Franzke, J. F. Acker, F. Platte, D. W. Agar, S. Turek,
Internal circulation within the liquid slugs of a liquid-liquid slug-flows capillary microreactor,
Industrial & Engineering Chemistry Research 44 (2005) 5003-5010.

26
[4] T. Yasukawa, W. Ninomiya, K. Ooyachi, N. Aoki, K. Mae, Enhanced production of ethyl
pyruvate using gas-liquid slug flow in microchannel, Chemical Engineering Journal 167 (2011)
527-530
[5] Y. Takebayashi, K. Sue, S. Yoda, T. Furuya, K. Mae, Direct carbonylation of nitrobenzene to
phenylisocyanate using gas–liquid slug flow in microchannel, Chemical Engineering Journal
180 (2012) 250-254
[6] N. Aoki, S. Tanigawa, K. Mae, A new index for precise design and advanced operation of
mass transfer in slug flow, Chemical Engineering Journal 167 (2011) 651-656
[7] P. Garstecki, M. J. Fuerstman, H. A. Stone, G. M. Whitesides, Formation of droplets and
bubbles in a microfluidic T-junction - scaling and mechanism of break-up, Lab on a Chip 6
(2006) 437-446
[8] V. van Steijn, M. T. Kreutzer, C. R. Kleijn, -PIV study of the formation of segmented flow
in microfluidic T-junctions, Chemical Engineering Science 62 (2007) 7505-7514
[9] J. Tan, S.W. Li, K. Wang, G.S. Luo, Gas-liquid flow in T-junction microfluidic devices with
a new perpendicular rupturing flow route, Chemical Engineering Journal 146 (2009) 428-433
[10] A. Leclerc, R. Philippe, V. Houzelot, D. Schweich, C. Bellefon, Gas-liquid Taylor flow in
square micro-channels: New inlet geometries and interfacial area tuning, Chemical Engineering
Journal 165 (2010) 290-300

27
[11] V. van Steijn, C. R. Kleijn, M. T. Kreutzer, Predictive model for the size of bubbles and
droplets created in microfluidic T-junctions, Lab on a Chip 10 (2010) 2513-2518
[12] T. Abadie, J. Aubin, D. Legendre, C. Xuereb, Hydrodynamics of gas–liquid Taylor flow in
rectangular microchannels, Microfluid Nanofluid 12 (2012) 355-369
[13] M. Al-Rawashdeh., X. Nijhuis, E. V. Rebrov, V. Hessel, J. C. Schouten, Design
methodology for barrier-based two phase flow distributor, AIChE Journal 58 (2012) 11
3482-3493
[14] M. Al-Rawashdeh., F. Yu, T. A. Nijhuis, E. V. Rebrov, V. Hessel, J. C. Schouten,
Numbered-up gas–liquid micro/milli channels reactor with modular flow distributor, Chemical
Engineering Journal 207-208 (2012) 645-655
[15] A. Matsuoka, D. Nishikawa, T. Yamashita, K. Noishiki, Effect of immiscible fluid injection
to liquid flow on mixing performance in microchannel reactor, 12th International Conference on
Microreaction Technology (2012) T3-P-15
[16] J. Yue, R. Boichot, L. Luo, Y. Gonthier, G. Chen, Q. Yuan, Flow distribution and mass
transfer in a parallel microchannel contactor integrated with constructal distributors, AIChE
Journal 56 2 (2010) 298-317
[17] N. Nguyen, S. Lassemono, F. A. Chollet, Optical detection for droplet size control in
microfluidic droplet-based analysis systems, Sensors and Actuators B: Chemical 117 2 12
28
(2006) 431-436
[18] H. Ide, R. Kimura, M. Kawaji, Optical measurement of void fraction and bubble size
distributions in a microchannel, Heat Transfer Engineering 28 (2009) 713-719.
[19] J. Ye, L. Peng, W. Wang, W. Zhou, Optimization of helical capacitance sensor for void
fraction measurement of gas-liquid two-phase flow in a small diameter tube, IEEE Sensors
Journal 11 10 (2011) 2189-2196
[20] M. De Menech, P. Garstecki, F. Jousse, H. A. Stone, Transition from squeezing to dripping
in a microfluidic T-shaped junction, Journal of Fluid Mechanics 595 (2008) 141-161
[21] A. R. Abate, P. Mary, V. van Steijn, D. A. Weitz, Experimental validation of plugging
during drop formation in a T-junction, Lab on a Chip 12 (2012) 1516-1521
[22] A. Riaud, C. P. Tostado, K. Wang, G. Luo, A facile pressure drop measurement system and
its applications to gas–liquid microflows, Microfluid Nanofluid 15 (2013) 715–724
[23] G. I. Taylor, Deposition of a viscous fluid on the wall of a tube, Journal of Fluid Mechanics
10 (1961) 1161-1165
[24] A. Savitzky, M. J. E. Golay, Smoothing and differentiation of data by simplified least
squares procedures, Analytical Chemistry 36 8 (1964) 1627-1639